


Bahasa
Halaman
Hukum

Molecular size of asphaltene fractions obtained
from residuum hydrotreatmentq
Louise Bucha, Henning Groenzinb, Eduardo Buenrostro-Gonzalezc, Simon I. Andersena,Carlos Lira-Galeanac, Oliver C. Mullinsb,*
aDepartment of Chemical Engineering, Technical University of Denmark, DK-2800 Lyngby, DenmarkbSchlumberger-Doll Research, Ridgefield, CT 06877, USA
cMolecular Engineering Research Program, Instituto Mexicano del Petroleo, Eje Central Lazaro Cardenas 152, C.P. 07730 Mexico, DF, Mexico
Received 14 June 2002; revised 3 December 2002; accepted 12 December 2002; available online 29 January 2003
Abstract
Previously, fluorescence depolarization techniques (FD) have been shown to measure asphaltene molecular size, thereby establishing the
substantial difference between asphaltenes derived from crude oil vs from coal. Here, FD is used to track the changes of the asphaltenes from
a petroleum atmospheric resid feedstock that has been subjected to increasing thermal severity of catalytic hydrothermal cracking. Changes
in asphaltene properties with increasing cracking are readily observed and understood. In addition, asphaltene molecular size is measured for
various asphaltene solubility fractions in binary solvent mixtures of toluene with either n-heptane or acetone; a strong dependence is found of
asphaltene properties on the particular solvent mixtures in accord with recent publications.
q 2003 Elsevier Science Ltd. All rights reserved.
Keywords: Asphaltene fraction; Fluorescence depolarization; Asphaltene molecular size and weight; Asphaltene subfractions; Asphaltene solubility fractions;
Catalytic Hydrothermal treatment
1. Introduction
Understanding asphaltene molecular structure is critical
in several economically important arenas. Asphaltenes are a
solubility classification (e.g. soluble in toluene, insoluble in
n-heptane); this definition captures the most aromatic
component of crude oil and thus is a very useful definition
[1–4]. In the Deepwater production of oil, asphaltene
precipitation is a problem that must be addressed within the
Flow Assurance context. Understanding asphaltene phase
behavior is key, especially the pressure-induced destabiliza-
tion of the naturally occurring asphaltene colloidal suspen-
sion in crude oil. First principles development of phase
behavior necessitates knowledge of asphaltene molecular
structure as does development of chemical treatments to
retard asphaltene precipitation. Optimization of the refining
of crude oil requires an understanding both of asphaltene
molecular structure and the corresponding changes as
refining proceeds. There are other important applications
that make significant use asphaltenes such as paving and
coating materials.
In spite of the importance of asphaltenes, there has
persisted a long standing controversy in asphaltene science
over one of the most fundamental properties, a molecule (or
mixture of molecules) can have molecular weight [5]. For
more than 20 years, there has been an order of magnitude
disagreement over asphaltene mean molecular weight [5].
Field ionization mass spectroscopy (FIMS) gave a mean
value of 700 amu with a width in the mass distribution of
roughly a factor of 2 [6]. More recent mass spectroscopy
results on petroleum asphaltenes are in rough agreement
including laser desorption mass spectroscopy (LDMS) [7],
atmospheric pressure chemical ionization (APCI) mass
spectroscopy [8] and electrospray ionization mass spec-
troscopy (ESI) [9]. Other laser desorption mass spec-
troscopy studies have yielded comparable results [10], but
baseline issues can lead to uncertainty for measurements on
asphaltenes [11]. Advocates of much higher asphaltene
molecular weights raise concerns as to whether some
selection of light ends or fragmentation might be occurring
0016-2361/03/$ - see front matter q 2003 Elsevier Science Ltd. All rights reserved.
doi:10.1016/S0016-2361(03)00006-1
Fuel 82 (2003) 1075–1084
www.fuelfirst.com
q Published first on the web via Fuelfirst.com—http://www.fuelfirst.com
* Corresponding author. Tel.: þ1-203-431-5572; fax: þ1-203-438-3819.
E-mail address: [email protected] (O.C. Mullins).
in these mass spectrometry studies. Techniques that yield
much larger asphaltene molecular weights include gel
permeation chromatography (GPC) and colligative methods
such as vapor pressure osmometry. However these tech-
niques suffer from high requisite concentrations where
asphaltene aggregation is known to occur. GPC also suffers
from the lack of standards for comparison [12].
Recently, fluorescence depolarization (FD) has been
shown to measure asphaltene molecular size [5,13]. In FD,
one creates a polarized ensemble of excited state asphaltene
molecules utilizing a polarized beam of excitation photons.
The rate of decay of this molecular polarization is monitored
by measuring the polarization of the emitted fluorescence as
a function of time (in the nanosecond range). Time
dependent depolarization occurs via rotational diffusion,
smaller molecules diffuse faster. Then by comparison with
known compounds or by use of well-established equations,
the molecular size can be used to determine asphaltene
molecular weight. FD is used with very dilute solutions, thus
does not suffer from aggregation problems, and in addition,
FD is performed on solutions obviating concern about
volatility. FD precludes fragmentation concerns. FD has
shown that typical mean asphaltene molecular weights are
,750 amu with a factor of 2 in the width of the distribution
[5,13]. Interestingly, these results are in close agreement
with the FIMS measurement 20 years ago [6]. In addition,
the FD results showed that (most) asphaltene molecules
possess one chromophoric group, that is, one fused aromatic
ring system per molecule [5,13]. If the aromatic ring is
linked even to one other chromophoric group, two out of
three degrees of rotation become hindered, in part because
the rotational correlation time corresponds to rotation by
1 rad. The result ‘one ring per molecule’ derives from that
small fused ring systems are imbedded in small asphaltene
molecules whereas large fused ring systems are imbedded in
large asphaltene molecules. This follows provided there is
only one fused ring system per molecule. A simple way to
picture individual asphaltene molecules is that they are ‘like
your hand’ where the palm represents the fused aromatic
ring system and the fingers represent peripheral alkane chain
substituents. Recent studies of carbon Raman X-ray
spectroscopy applied to asphaltenes indicate that the fused
ring systems are pericondensed (circular arrangement of the
fused rings) [14].
In order to test the FD results, several studies have been
performed in part to check consistency. FD methods were
combined with 13C NMR and IR applied to a series of
asphaltenes [15]. The results show that asphaltenes that lack
long alkane side chains are composed of small molecules
with small fused ring systems. Remembering that asphalt-
enes are defined by a solubility classification, the idea is that
asphaltene molecular identity is determined by competition
between two competing effects: steric hindrance from
alkane chains vs intermolecular binding due to van der
Waals interaction of stacks of aromatic ring systems [15].
The balance between these competing effects determines
solubility. These concepts are rather simple making at least
one aspect of asphaltenes, molecular identity, very tractable.
If the binding is excessive (large ring systems coupled with
little alkane substitution), then the molecules stack effi-
ciently and will not dissolve in toluene, thus are not
asphaltene. High resolution transmission electron
microscopy (HRTEM) on asphaltenes and model com-
pounds supports this contention by imaging the disruption
of aromatic ring stacking due to alkane substituents [16].
Even melting point data of alkyl aromatics clearly shows
this same competition of steric hindrance of alkane
substituents vs stacking of fused ring systems via van der
Waals interaction [15]. It is important to note that these
conclusion from these diverse techniques all rely on the
accuracy of the FD results on the molecular weight of
asphaltenes. We believe that the congruence of FIMS
(some), LDMS, APCI and ESI mass spectroscopy results
along with FD results, especially when coupled with 13C
NMR, IR and HRTEM overwhelmingly point to the mean
asphaltene molecular weight being ,750 amu. Theoretical
modeling of the phase behavior of asphaltenes has
employed an asphaltene molecular weight of 1000 amu,
comparable to our results; albeit the models require
extensive data fitting [17]. We believe it is time to view
this controversy over asphaltene molecular weight as
resolved (while maintaining vigilance) and further develop
the field of asphaltene science. Without resolution of this
issue, the basic understanding of asphaltenes and their
properties is retarded.
It is instructive to examine asphaltene subfractions and
asphaltenes from different source materials. A recent FD
study was performed on solubility fractions of asphaltenes
obtained from different ratios of toluene and n-heptane [11].
One important conclusion in this study is that the different
asphaltene subfractions appear to consist of the same
molecules but in different distributions. A recent study
utilizing IR and 1H NMR (the EBG study after the first
author) also obtained the same conclusion on a different set
of n-heptane–toluene subfractions of asphaltenes [18]. A
similar fractionation study has also been reported [19]. Both
of these studies showed a smooth variation of molecular
properties in the different subfractions interpretable in terms
of the changing solvating power of the different solutions
employed. In a gross sense, these studies can be understood
within the context of the changing dielectric constant of the
solution, which has been shown to govern the onset of
asphaltene flocculation from this solvent system [20,21].
The flocculation studies conclude that the primary (attrac-
tive) intermolecular interaction of asphaltenes is van der
Waals forces, thus dipole–dipole interactions are not
significant here [20,21]. However, the EBG study also
employed a very different solvent system to obtain a
different set of asphaltene subfractions, acetone and toluene.
Very different behavior was obtained for this solvent system
[18]. The analysis of this set of asphaltene subfractions
showed nonmonotonic asphaltene molecular properties as
L. Buch et al. / Fuel 82 (2003) 1075–10841076

the solvent ratios were changed indicating a more complex
interaction than simply van der Waals. This is not surprising
as acetone is polar with strong hydrogen bonding. Recently,
it has been reported that trace water influences the
association of asphaltenes in toluene solution indicating
that aggregation either amongst asphaltene sheets or
particles (stacked or formed in another way) is greatly
enhanced by the presence of these very small amount of
water [22]. This implies that polar forces are (also)
important in the intermolecular binding of asphaltenes.
Another conclusion of the EBG study is that almost
all of the porphyrin ring systems contained in the
asphaltene end up in the asphaltene fraction that is most
soluble in acetone. This interesting result can only be
true if the porphyrins are not cross-linked to other
aromatic fused ring systems as also concluded in several
other studies [19,23–25]. This is precisely the result of
the FD studies, asphaltenes have a single fused ring
system per molecule. In addition, the FD studies show by
direct analysis that the smallest molecules in asphaltenes
are porphyrin sized [5,13].
In addition to analysis of solubility subfractions of
asphaltenes, it is desirable to explore the effects of high
temperature, catalytic hydrotreatment of hydrocarbon feed-
stocks. It has been shown that this process results in the
cleavage of alkane substituents off of asphaltenes [26]. It has
also been shown by FD that asphaltene molecules that lack
alkane side chains have very small molecular size while
asphaltene molecules with alkane side chains have larger
molecular size [15]. Thus, we can test whether we obtain
consistency, the hydrotreated asphaltene samples are
predicted to yield smaller asphaltene molecular sizes. This
prediction if obtained (and it is) provides further verification
that the FD results are correct corroborating the central FD
result, that the asphaltene mean molecular weight is
,750 amu. There is some uncertainty in this result; much
less than the previous order of magnitude; perhaps we have
an error bar of ^15%.
In this study, we perform FD and fluorescence spec-
troscopy studies on asphaltene samples obtained from
atmospheric residua (AR) that have been subjected to
varying degrees of high temperature, catalytic hydrotreat-
ment. Asphaltenes were isolated from the original AR
feedstock (from Arabian Heavy) and from three oil samples
resulting from increasing the temperature of the hydrotreat-
ing reactor successively higher, 359, 379 and 389 8C.
Substantial changes in asphaltene molecular size are
recorded in concert with expectations based on known
chemical changes in this process. NMR analysis reveals
subtleties of the process. In addition, we study solubility
subfractions of asphaltenes acquired with two different
solvent systems, n-heptane–toluene, and acetone–toluene.
The asphaltene subfractions from the two different solvent
systems are shown to exhibit quite different behavior
consistent with previous recent publications. Time resolved
fluorescence spectra of asphaltenes are also shown to obey
predictable results.
2. Experimental section
The FD system has been described in detail elsewhere
[13]. Briefly, time-dependent FD data were collected with
the PTI C-72 system that employs a PTI GL-3300 nitrogen
laser source along with a PTI GL-302 high-resolution dye
laser with a fiber optic coupling to the measurement cell to
excite the fluorescence. A right angle fluorescence detection
system was employed. To obtain the fluorescence decay
curve, the four possible combinations of vertical (V) and
horizontal (H) polarization for the excitation and emission
Fig. 1. The time dependent data for the FD measurement showing the four combinations of vertical and horizontal polarizations for the incident and
fluorescence photon. Also shown are the fluorescence polarization decay curve (the difference curve) and its fitted curve.
L. Buch et al. / Fuel 82 (2003) 1075–1084 1077

photons are collected thereby allowing for polarization data
to be collected while accounting for throughput effects [13].
Fig. 1 shows a typical decay curve (and the data used to get
the decay curve). The effect of depolarization is readily
apparent in the data. The HH and HV curves are seen to be
the same allowing quality control for the data. For both the
HH and VH curves, a 908 molecular rotation optimizes
throughput (for a given molecule). And for both curves, the
horizontal polarization transmission throughput is the
required (thus the same) for the emission monochromator.
The VV and HV curves differ in terms of molecular rotation
required but both these curves employ vertical polarization
transmission on the emission monochromator. Proper curve
fitting gives the polarization decay rate (not to be confused
with the fluorescence decay rate) [13]. For collection of
steady-state fluorescence spectra, we employed the (Photon
Technology International) PTI C-72 þ A-720 fluorescence
spectrometer using a 75 W Xe compact arc lamp source.
Subfractionation. The procedure is similar to the one
described EBG [18]. In short: a solid heptane precipitated
asphaltene sample was contacted with solvents of
increasing solvent power either in heptane–toluene or
acetone–toluene mixtures. The asphaltene subfraction
precipitates at the listed % in the figures. The A-Sol
and H-Sol samples (marked as the 100% points in the
figures) refer to the asphaltene subfraction that remained
soluble in the 90% solution. Samples were recovered by
centrifugation at 3000 rpm and a stronger solvent
solution was added to the solids left. All samples were
dried under nitrogen and stored in the dark. The initial
asphaltene sample was obtained using a modification of
the IP 143 based on 30 cm3 precipitant/g oil, precipi-
tation over night, filtration on sintered glass filters, and
followed by toluene dissolution of the solids on the filter.
The sample was concentrated using a rotoevaporator and
dried under nitrogen. The samples were washed with
heptane using sonication.
Hydrotreating was performed as described previously
[26] in a hydrodesulfurization pilot plant. The feedstock is
the resid of atmospheric distillation. Here, metals are first
removed followed by deep desulfurization. Product samples
were collected at different time intervals from the start of the
reactor. During the process the reactor temperature is
increased in order to compensate for catalyst deactivation
with an aim to keep the sulfur removal on a specified level.
Hence samples represent increasing reaction temperatures
or lifetime of the reactor bed. Cracking reactions starts to
dominate around 380 8C. The cracking leads to increased
product instability seen as asphaltenic sludge formation.
Asphaltenes from the feed and the product samples were
precipitated by addition of excess heptane (30 cm3/g oil)
following the IP 143 standard. The oil used was an Arabian
heavy atmospheric resid. The asphaltene samples were
obtained from the feedstock (TR453-00) and from three
process temperatures 359 8C (TR453-62), 379 8C (TR453-
181) and 389 8C (TR453-253).
The C13-NMR measurements were performed on a
JEOL Eclipse model 300 NMR apparatus operating at a 13C
frequency of 75 MHz. The asphaltene samples were
prepared as 100 mg/cm3 CDCl3 solutions. TMS was used
as a zero-shift reference. In order to use the 13C NMR
spectra in a quantitative manner, the spectra were subjected
to an inverse gated decoupling technique to suppress the
NOE effect, and chromium acetyl-acetonate (0.01 M in the
final solution) was added to assure complete nuclear
magnetic moment relaxation between pulses.
3. Results and discussion
Fig. 2 shows the steady-state fluorescence spectra of the
different asphaltenes. TR453 series refers to the feedstock
(-00) and successive heat treatments as described in Section
2. The TH coal asphaltene is shown for comparative
purposes. This coal sample has been previously analyzed
[15] and shown to consist primarily of aromatic carbon
(88%) with very little alkane substitution. The overall trend
for the hydrotreated asphaltenes is a blue shift in the
fluorescence emission spectrum which in general corre-
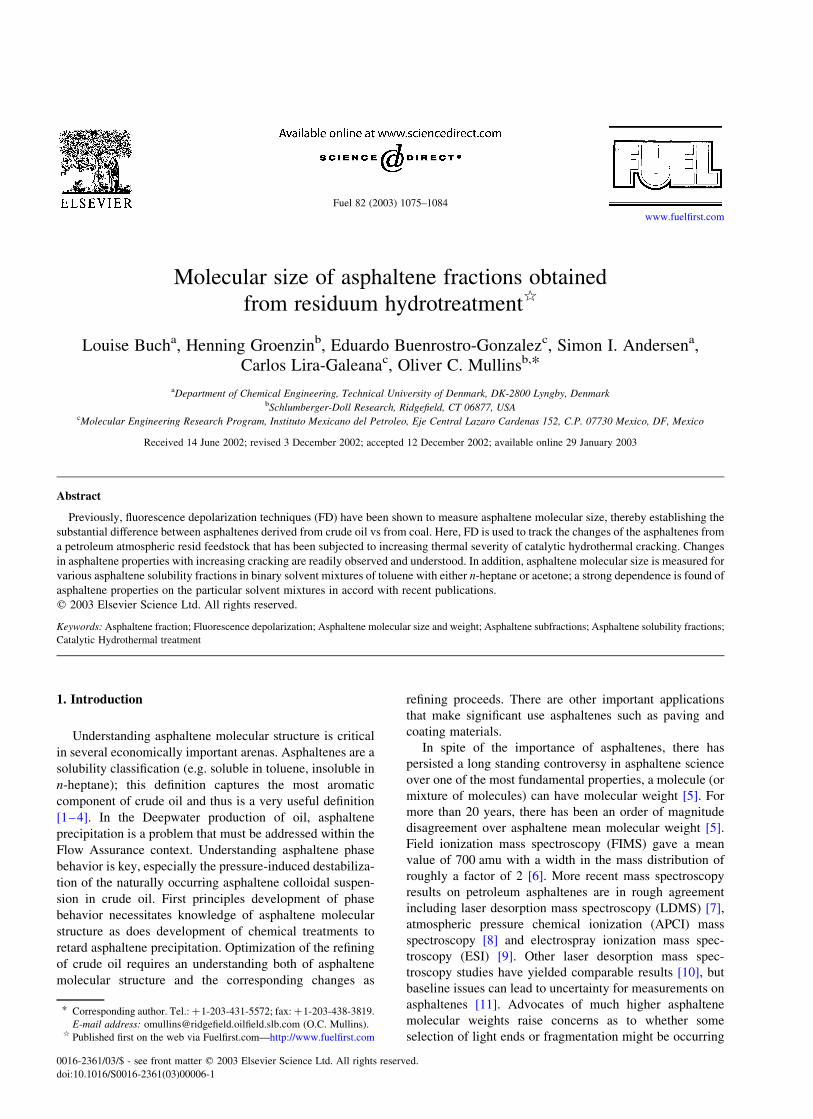
sponds to smaller fused ring systems [13,27]. Fig. 3 shows
the variation of the rotational correlation time, tr, for the
feedstock, the hydrotreated samples, and the coal asphalt-
ene. High temperature, hydrotreatment clearly results in a
decrease in the size of asphaltene molecules. Thus, the
fluorescence data shows that the hydrotreating of petroleum
source material causes the corresponding asphaltenes to
consist of smaller molecules with smaller ring systems. The
effect of hyrdrotreatment is seen to cause the asphaltenes to
become more similar to the coal asphaltene.
Fig. 2. The fluorescence emission spectra of a series of asphaltenes from
hydrotreated samples and a coal asphaltene sample. The -00 sample is from
the feedstock, the asphaltene samples -62, -181, and -253 were processed at
increasing temperatures and the coal asphaltene is shown for comparison.
Note the evolving blue shift of the progressively hydrotreated samples
indicating a reduction in the size of the fused ring systems.
L. Buch et al. / Fuel 82 (2003) 1075–10841078
The molecular size is related to the tr by Eq. (1) derived
form the Stokes–Einstein equation
tr ¼Vh
kTð1Þ
where V is the molecular volume; h; viscosity; T is the
temperature. This applies for spherical molecules but the
effect of molecular anisotropy is not large [5,11].
One of the chemical effects of hydrotreatment is the
cracking off of peripheral alkyl substituents [26]. The
temperatures associated with the hydrotreatment (,380 8C)
are sufficient to cause cleaving of chemical bonds in a
relatively short period of time. As alkyl chains are cleaved
off the fused ring systems, this corresponding source
material for the asphaltene preparation becomes more like
the TH coal sample with decreased alkyl substitution on the
aromatic ring systems. As has been described previously
[15], the reduction of alkyl substitution decreases solubility
of the fused ring systems due to decreased steric hindrance
in ring stacking. This stabilizes the solid, hence decreases
solubility. This is also explained by thermodynamics as an
increase in the heat of fusion. For a given solubility
classification, the reduction of steric hindrance due to loss of
alkane substitution (with cracking) is balanced by a
reduction in the size of the fused ring system; the smaller
ring systems exhibit smaller intermolecular binding. The
TH coal asphaltene is an extreme example of this balance in
that this sample contains almost no alkyl carbon and also
contains very small fused ring systems and very small
asphaltene molecules [15]. Thus, the trend in the hydro-
treated samples is expected: as cracking proceeds the
asphaltene fraction contains smaller fused ring systems as
evidenced by the blue shift in the fluorescence spectra, and
contains smaller molecules as shown by the reduction of the
rotational correlation times. The TH coal asphaltene
represents a limit for this trend in that it contains almost
no alkane. However, as can be seen in Table 1 the
hydrotreating also causes the actual asphaltene content to
decrease significantly. We point out that it is not clear in our
data how best to account for the reduction of the aromatic
ring size in asphaltenes; (1) the aromatic rings become
hydrogenated (with subsequent cleavage alkyl cleavage, (2)
smaller aromatics with alkane substitution lose peripheral
groups becoming asphaltenes.
The asphaltenes of the hydrotreated samples are seen to
behave according to very simple principles involving
known molecular changes in this process coupled with
established solubility principles. The fluorescence emission
and FD results are readily interpretable relying on these
simple principles. These conclusions rely on the accuracy of
the FD technique to give molecular size. If the asphaltene
molecular weights were really 10 times bigger than
determined by FD, then the line of reasoning above would
not follow for understanding FD results of the hydrotreated
samples. Consequently, the findings here corroborate the FD
results. The FD results have been used to generate
predictions for diverse asphaltenes for 13C NMR [15],
HRTEM [16], solubility fractionation [11] and now on
hydrotreated samples. In every case, the FD results have
been corroborated and/or confirmed; petroleum asphaltene
molecular weights are ,750 amu with a width to the
distribution of about a factor of 2 for the bulk of the sample
[5,13]. Moreover, the results also indicate that the main
source of product instability in hydrotreating is not
condensation of molecules into large fused ring systems as
pointed out in the past, but indeed the decrease in solubility
due to changes in molecular structure by removal of
peripheral chains.
In the steady-state emission spectra specific peaks at ca.
450, 470 and 490 nm are observed in the hydrotreated
samples while the feed is seen to be featureless. This is
believed to be due to the increased concentration of smaller
ring systems after cracking of peripheral alkanes; the larger
Fig. 3. The asphaltene rotational correlation times tr vs emission
wavelength for a series of asphaltenes from hydrotreated samples and for
a coal asphaltene. The tr is related to the molecular size. The red-emitting
(large) and blue-emitting (small) chromophores are not attached to each
other. If they were, they would have large, similar correlation times. The -
00 sample is from the feedstock, the asphaltene samples -62, -181, and -253
were processed at increasing temperatures and the coal asphaltene is shown
for comparison. Note significant reduction in asphaltene molecular size
with progressive hydrotreatment, presumably related to the increased
cracking of alkane chains off the ring systems. The feedstock asphaltene has
alkyl substituents and the coal asphaltene is known to lack alkyl
substituents [15].
Table 1
Data on hydrotreating of Arabian Heavy [22]
Asphaltene in oil %w/w H/C atomic
Feed (-00) 5.91 1.10
HR453-62 2.87 1.14
HR453-181 2.04 1.10
HR453-253 1.35 0.98
L. Buch et al. / Fuel 82 (2003) 1075–1084 1079
aromatic ring systems without peripheral alkanes would not
dissolve in toluene. In addition, partial hydrogenation of the
original aromatic core will also result in a smaller number of
(fused) aromatic rings. These smaller ring systems have
smaller numbers of permutations than do large ring systems,
so individual chromophoric moieties can represent a
significant fraction of the total chromophores, thus be
detected in the mixture. This is the probable explanation for
fluorescence spectral structure for coal asphaltenes. Further
work will be performed to resolve this issue.
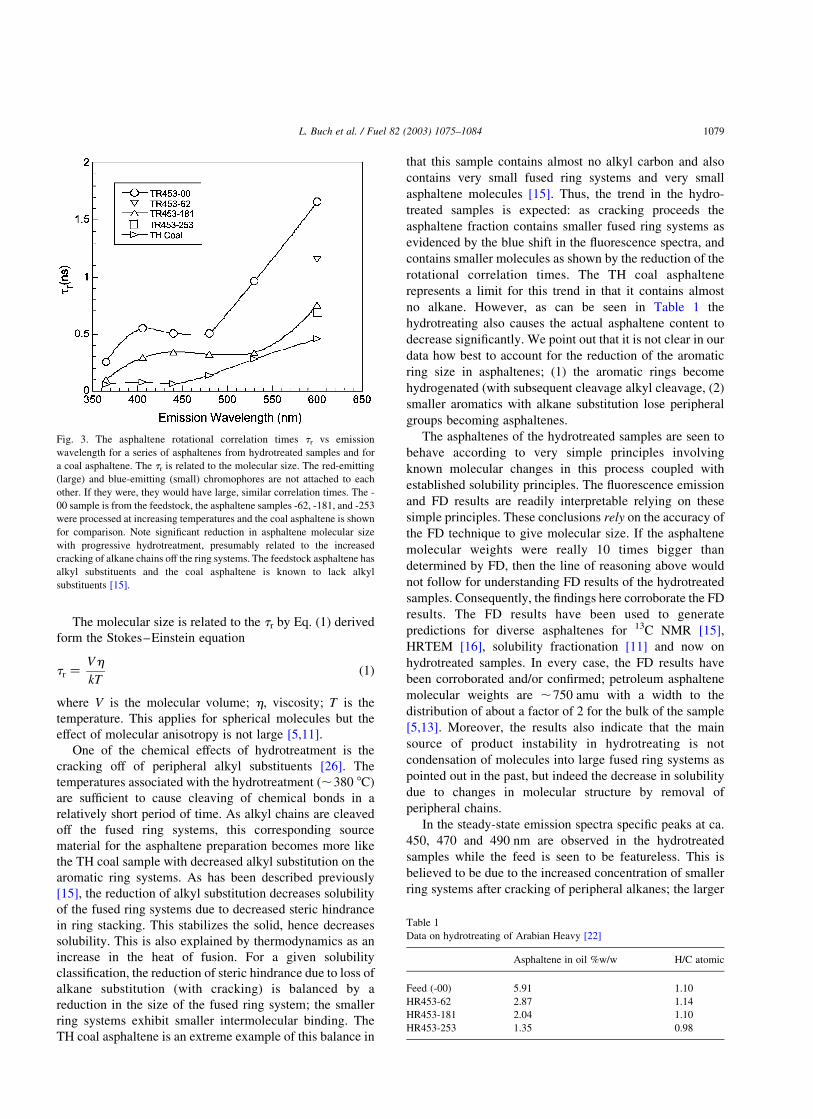
Fig. 4 shows the fluorescence emission spectra for a
series of asphaltene subfractions precipitated from acetone–
toluene mixed solvent solutions. The acetone fraction is
indicated on the figure. The A-Sol sample remained
dissolved in the 90% acetone–10% toluene solvent, so it
is different from the other samples here in that it never
precipitated from the mixed solvent system. The two
extreme samples, A-Sol and 40%, exhibit the bluest
fluoresce emission while the other samples are rather
similar in their emission spectra. FD provides a better
probe to differentiate these subfractions.
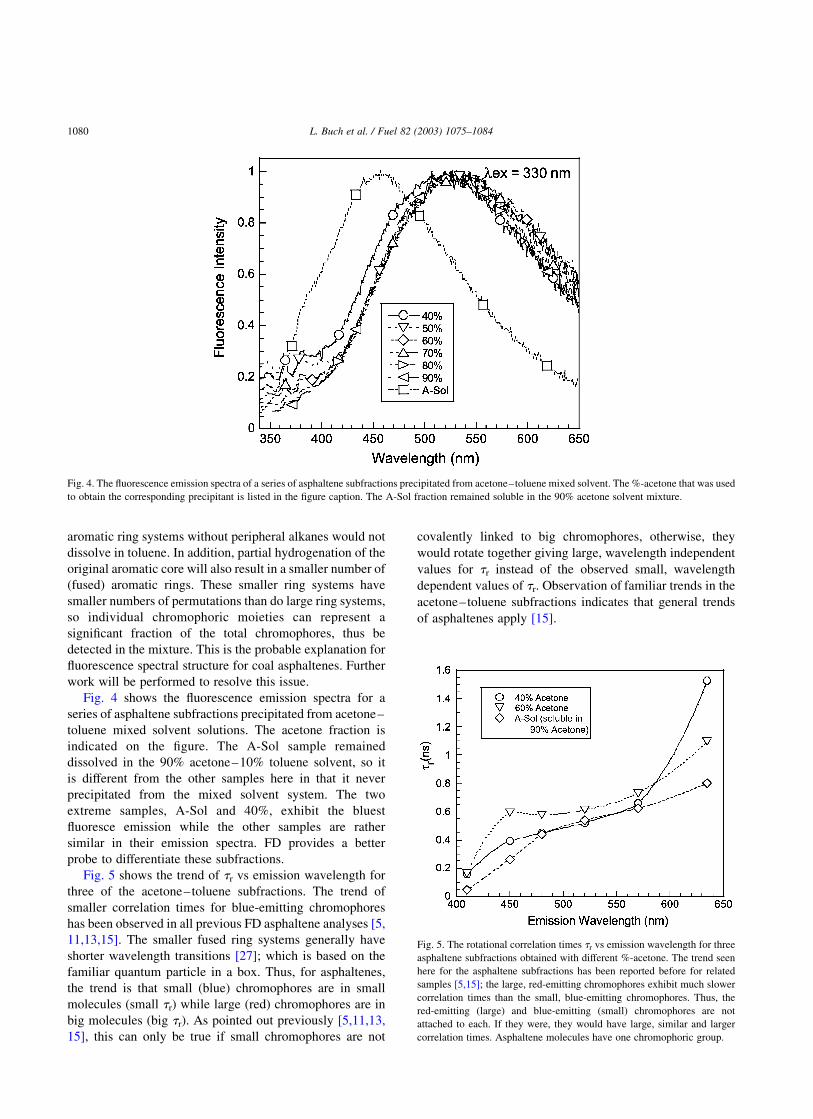
Fig. 5 shows the trend of tr vs emission wavelength for
three of the acetone–toluene subfractions. The trend of
smaller correlation times for blue-emitting chromophores
has been observed in all previous FD asphaltene analyses [5,
11,13,15]. The smaller fused ring systems generally have
shorter wavelength transitions [27]; which is based on the
familiar quantum particle in a box. Thus, for asphaltenes,
the trend is that small (blue) chromophores are in small
molecules (small tr) while large (red) chromophores are in
big molecules (big tr). As pointed out previously [5,11,13,
15], this can only be true if small chromophores are not
covalently linked to big chromophores, otherwise, they
would rotate together giving large, wavelength independent
values for tr instead of the observed small, wavelength
dependent values of tr. Observation of familiar trends in the
acetone–toluene subfractions indicates that general trends
of asphaltenes apply [15].
Fig. 4. The fluorescence emission spectra of a series of asphaltene subfractions precipitated from acetone–toluene mixed solvent. The %-acetone that was used
to obtain the corresponding precipitant is listed in the figure caption. The A-Sol fraction remained soluble in the 90% acetone solvent mixture.
Fig. 5. The rotational correlation times tr vs emission wavelength for three
asphaltene subfractions obtained with different %-acetone. The trend seen
here for the asphaltene subfractions has been reported before for related
samples [5,15]; the large, red-emitting chromophores exhibit much slower
correlation times than the small, blue-emitting chromophores. Thus, the
red-emitting (large) and blue-emitting (small) chromophores are not
attached to each. If they were, they would have large, similar and larger
correlation times. Asphaltene molecules have one chromophoric group.
L. Buch et al. / Fuel 82 (2003) 1075–10841080

Fig. 6 probes the molecular size of molecules containing
blue emitting chromophores (450 nm emission) and red
emitting chromophores (635 nm) for the different solubility
subfractions. The chromophore size is related to the
emission wavelength, but the ring geometries (e.g. degree
of katacondensed or pericondensed) also have an impact on
emission wavelength [27]. The molecular size does not
depend monotonically on the acetone fraction used to
precipitate the fractions. For the blue emitting chromohores,
very small molecules are found at the two solubility end
points (40% and A-Sol), while the intermediate subfractions
have much larger molecules for the blue emitting chromo-
phores. Ring geometry effects might account for this
different molecular size for the same optical properties
[27]. Differing alkane substitution can also explain some
differences in molecular size; the toluene–acetone samples
with largest molecular size have also been shown to
correspond to samples with the largest alkyl fraction by13C NMR on comparable samples [18].
The lack of monotonic behavior of acetone–toluene
subfractions of asphaltenes has been recorded previously
with regard to aromatic carbon content and alkyl chain
content [18]. For the acetone–toluene mixed solvent
system, the minimum in aromatic carbon occurs for the
asphaltene subfraction precipitated with 60% acetone/40%
toluene; the aromatic carbon fraction increases with
increasing and decreasing acetone in the precipitating
solvent. Correspondingly, the aliphatic carbon in the
asphaltene subfraction is maximized at this same inter-
mediate solvent system, 60% acetone/40% toluene. In other
words, a large asphaltene molecular size correlates with a
large alkane fraction in accordance with results obtained for
coal and petroleum asphaltenes [15]. The FD results shown
in Fig. 6 exhibit a very similar profile in support of the
previous findings [18]. The large deviation from monotonic
behavior of asphaltene subfractions on %-acetone indicates
Fig. 6. The rotational correlation times tr vs %-acetone for the different
asphaltene subfractions obtained from the acetone–toluene mixtures. Two
emission wavelengths were investigated probing the smallest and largest
chromophores for the solubility subfractions. Note the complex, non-
monotonic dependence of tr (thus molecular size) on acetone fraction.
Similar systematics have been reported for the fraction of aromatic carbon
in similar asphaltene subfractions [18]. (The A-Sol sample is listed as
100%.)
Fig. 7. The fluorescence emission spectra of a series of asphaltene
subfractions precipitated from the n-heptane–toluene mixed solvent. The
%-n-heptane that was used to obtain the corresponding precipitant is listed
in the figure caption. The H-Sol fraction remained soluble in the 90% n-
heptane solvent mixture. The fluorescence emission curves are quite
similar; FD is a better probe.
Fig. 8. The rotational correlation time tr for the different asphaltene
subfractions obtained from acetone–toluene mixtures and from n-heptane–
toluene mixtures. The acetone-derived subfractions exhibit complex
dependence on the %-acetone, the n-heptane fractions exhibit nearly
monotonic behavior. This is in accord with recent papers on asphaltene
subfractions from both mixed solvent systems [11,18]. (The A-Sol and H-
Sol samples remained soluble in the 90% solvent mixture; they are listed as
100%.)
L. Buch et al. / Fuel 82 (2003) 1075–1084 1081

that the precipitation dependence is complex. In particular,
acetone is polar and can hydrogen bond as a hydrogen
acceptor. In our view it is probable that the polar and
hydrogen bond interactions between the asphaltene mol-
ecules and acetone give rise to complex (nonmonotonic)
solubility behavior of the asphaltenes in the acetone–
toluene mixed solvent system. This behavior is in contrast to
the behavior previously reported for asphaltene subfractions
with n-heptane/toluene. In this solvent system, monotonic
behavior of the asphaltene subfractions on %-n-heptane
have been observed for molecular size by FD [11].
Fig. 7 shows the plot of the fluorescence spectra and
Fig. 8, tr for the different heptane fractions. Fig. 8 shows
that the asphaltene subfractions from the n-heptane/toluene
system exhibit nearly monotonic behavior while the
acetone–toluene asphaltene subfractions also shown in
Fig. 8 are not monotonic. In addition, precipitation onset of
asphaltenes in this mixed solvent system has been success-
fully interpreted in terms of molecular polarizability alone
[19,20]. It appears that the particular solvent system
determines whether effects from polarity are observed or
not.
Fig. 9 shows the time-resolved fluorescence emission
spectra for several delay times for the TR453-253 hydro-
treated asphaltene. Only for the zero time delay, a Rayleigh
scattering peak is observed at ,370 nm corresponding to
the solvent CH stretch mode. For longer delay times, the
fluorescence spectra undergo an increasing blue shift. This
effect is probably related to the Exponential Energy Gap
Law that has been shown to apply for crude oils [28].
Essentially, radiationless decay mechanisms for electro-
nically excited states compete more effectively against
fluorescence emission at smaller excitation energies
thereby producing faster decay and smaller lifetimes for
Fig. 9. Time-resolved fluorescence emission spectra of the TR453-253 asphaltene sample. At longer times, there is a blue shift in the fluorescence emission
spectrum corresponding to longer lifetime for shorter wavelength emission and may be related to the exponential energy gap law [28]; smaller bandgaps yield
larger decay rates. Growth of spectral structure at 440 nm shows the increasing importance of small chromophores emission at long times.
Table 2
NMR raw data normalized to total signal
1H NMR (ppm) 13C NMR (ppm) or intensity n 13C n 1H
Hgþb Ha Haro Cali Caro CH2 (long) CH3
HR453 0.5–2.0 2–4 6–9 10–60 110–160 I(14.1) I(29.7)
-00 75 13 11 45 55 0.22 1.16 5.3 6.8
-62 83 8 8 54 46 0.14 0.89 6.4 11.4
-181 78 12 10 44 56 0.17 0.99 5.8 7.5
-253 79 11 10 45 55 0.17 1.03 6.1 8.2
L. Buch et al. / Fuel 82 (2003) 1075–10841082
the red-emitting chromophores. Note too that at long delay
times, fluorescence spectral structure is seen to increase at
440 and 390 nm. This effect is due to the small number of
configurations of small ring systems (which are the blue
emitters) as discussed above.
3.1. NMR
Both 1H and 13C NMR were recorded on the four
samples related to hydrotreating. No real trend was
obtained in the spectra indicating the overall complex
chemistry of the hydrotreating process. As previously
noted, catalytic hydrotreating cleaves peripheral alkane
chains, producing a trend for increasing aromatic fraction
with increasing hydrotreatment. However, the process of
catalytic hydrogenation (of aromatic rings) produces a
trend towards decreasing the aromatic fraction. Those
molecules with aromatic cores devoid of alkane side
chains may have better access to the catalyst surface so
the two opposite trends may be coupled. The net result is
that no trend is observed in the aromatic fraction as seen
in Table 2 and is consistent with the lack of a trend in the
CH ratio in Table 1.
The last two columns give the 13C alkyl carbon chain
length (n 13C) while the same can be generated from H
spectra (n 1H); there is a qualitative agreement between the
two independent measurements. However, there is appar-
ently no trend that tells us that we get more aromatic
material. The increase in aliphatic H and C also confirmed
between the two techniques shows that the 360 8C product
mainly is changed due to hydrogenation. Apparently from
the asphaltene content about 50% of the original asphalt-
enes are converted into species soluble in heptane (non-
asphaltenes) if we assume that the laydown on the catalyst
is not significant (but this must be considered for a true
mass balance made over the reactor). There is no direct
indication of large changes between peri and kata-
condensed (110–160 ppm range), but there are more H-
Car bonds than substituted (C or other groups) aromatics
indicating a somewhat open structure of the katacondensed
type [29]. It is expected that the loss of heteroatomic
content such as sulfur would reduced the intermolecular
attraction of molecules, thereby increasing solubility in
toluene. Perhaps this accounts for some of the loss of the
asphaltene fraction.
4. Conclusions
Various asphaltenes and asphaltene subfractions have
been investigated by FD methods. The results reported here
present a test for the validity of the FD method and
consistency with many previously reported results is found.
Thus, we have corroboration that the primary FD result, that
mean petroleum asphaltene molecular weight is ,750 amu
is correct. Analysis of high temperature hydrotreated
samples shows that the loss (cracking off) of alkane chains
results in a reduction of size of the fused ring systems as
well as a reduction of molecular size for the asphaltene
fraction. Thus, the asphaltenes remaining after hydrotreat-
ing consist of more compact molecules. Also, it is observed
that a large part of the feed asphaltenes is converted to resin
type material soluble in heptane. This is assumed to be due
to hydrogenation of structures enhancing the solubility in
alkane solvents.
For acetone–toluene subfractions of asphaltenes, large
nonmonotonic variations of molecular size on %-acetone
are found in concert with previous findings and in contrast to
the nearly monotonic variation observed for the n-heptane–
toluene mixed solvent subfractions. The complex behavior
observed for the acetone–toluene subfractions is probably
related to dipolar interactions between the asphaltenes and
the solvent. Van der Waals interaction may dominate
asphaltene intermolecular interaction, but polarity affects
can be found as well.
Acknowledgements
We are indebted to Haldor-Topsøe for the preparation
of the hydrotreated petroleum samples. We are indebted to
Professor Iino of Tohoku University for the TH coal
sample. SIA thanks the Danish Technical Research
Council for financial support under the Talent Program.
We are pleased to thank J.A. Garcia-Martinez for
technical assistance in the 1H and 13C studies. EB-G
and CL-G acknowledge IMP for permission to publish
this work.
References
[1] Chilingarian GV, Yen TF, editors. Bitumens, asphalts, tar sands. New
York: Elsevier; 1978.
[2] Bunger JW, Li NC, editors. Chemistry of asphaltenes. Washington,
DC: American Chemical Society; 1984.
[3] Sheu EY, Mullins OC, editors. Asphaltenes: fundamentals and
applications. New York: Plenum Press; 1995.
[4] Mullins OC, Sheu EY, editors. Structures and dynamics of
asphaltenes. New York: Plenum Press; 1998.
[5] Groenzin H, Mullins OC. J Phys Chem, A 1999;103:11237.
[6] (a) Boduszynski MM. In: Bunger JW, Li NC, editors. Chemistry of
Asphaltenes. Washington, DC: American Chemical Society;
1984. chapter 2.
(b) Boduszynski MM. Energy Fuels 1988;2:597.
[7] Miller JT, Fisher RB, Thiyagarajan P, Winans RE, Hunt JE. Energy
Fuels 1998;12:1290.
[8] Sheu EY. Submitted for publication.
[9] Rodgers R. Presented at the Astsphys Conference, Cancun, Mexico;
2000.
[10] Gang M-Y, Eser S. ACS New Orleans Meeting. Div Fuel Chem 1999;
44:14.
[11] Groenzin H, Mullins OC, Eser S, Mathews J, Gang M-Y, Jones D.
Energy Fuels 2003; in press.
L. Buch et al. / Fuel 82 (2003) 1075–1084 1083

[12] Andersen SI. Fuel Sci Technol Int 1994;12:51.
[13] Groenzin H, Mullins OC. Energy Fuels 2000;14:677.
[14] Bergmann U, Groenzin H, Mullins OC, Glatzer P, Fetzer J, Cramer
SP. Chem Phys Lett 2003; in press.
[15] Buenrostro-Gonzalez E, Groenzin H, Lira-Galeana C, Mullins OC.
Energy Fuels 2001;15:972.
[16] Sharma A, Groenzin H, Tomita A, Mullins OC. Energy Fuels 2002;
16:490.
[17] Pan H, Firoozabadi A. AIChE J 2000;46:416.
[18] Buenrostro-Gonzalez E, Andersen SI, Garcia-Martinez JA, Lira-
Galeana C. Energy Fuels 2002;16:732.
[19] Andersen SI, Keul A, Stenby EH. Petrol Sci Technol 1997;15(7/8):611.
[20] Buckley J. Energy Fuels 1999;13:328.
[21] Buckley JS, Hirasaki GJ, Liu Y, Von Drasek S, Wang J-X, Gill BS.
Petrol Sci Technol 1998;16:251.
[22] Bartholdy J, Lauridsen R, Mejlholm M, Andersen SI. Energy Fuels
2001;15:1059.
[23] Andersen SI. Fuel Sci Technol Int 1994;12:51.
[24] Andersen SI. Fuel Sci Technol Int 1994;12:1551.
[25] Andersen SI. J Liq Chromatogr 1994;17(19):4065.
[26] Bartholdy J, Andersen SI. Energy Fuels 2000;14:52.
[27] Ruiz-Morales Y. J Phys Chem, A 2002;106:11283.
[28] Ralston CY, Wu X, Mullins OC. Appl Spectrosc 1996;50:1563.
[29] Andersen SI. Fuel Sci Technol Int 1995;13:579.
L. Buch et al. / Fuel 82 (2003) 1075–10841084
Top Related
Copyright © 2022 FDOKUMEN

