


Bahasa
Halaman
Hukum

asdfUNITED NATIONS
The Millennium Development Goals Report 2012
Cover Inside
This report is based on a master set of data that has been compiled by an Inter-Agency and Expert Group on MDG
Indicators led by the Department of Economic and Social Affairs of the United Nations Secretariat, in response to
the wishes of the General Assembly for periodic assessment of progress towards the MDGs. The Group comprises
representatives of the international organizations whose activities include the preparation of one or more of the
series of statistical indicators that were identified as appropriate for monitoring progress towards the MDGs, as
reflected in the list below. A number of national statisticians and outside expert advisers also contributed.
INTERNATIONAL LABOUR ORGANIZATION
FOOD AND AGRICULTURE ORGANIZATION OF THE UNITED NATIONS
UNITED NATIONS EDUCATIONAL, SCIENTIFIC AND CULTURAL ORGANIZATION
UNITED NATIONS INDUSTRIAL DEVELOPMENT ORGANIZATION
WORLD HEALTH ORGANIZATION
THE WORLD BANK
INTERNATIONAL MONETARY FUND
INTERNATIONAL TELECOMMUNICATION UNION
ECONOMIC COMMISSION FOR AFRICA
ECONOMIC COMMISSION FOR EUROPE
ECONOMIC COMMISSION FOR LATIN AMERICA AND THE CARIBBEAN
ECONOMIC AND SOCIAL COMMISSION FOR ASIA AND THE PACIFIC
ECONOMIC AND SOCIAL COMMISSION FOR WESTERN ASIA
JOINT UNITED NATIONS PROGRAMME ON HIV/AIDS
UNITED NATIONS CHILDREN’S FUND
UNITED NATIONS CONFERENCE ON TRADE AND DEVELOPMENT
UNITED NATIONS ENTITY FOR GENDER EqUALITY AND THE EMPOWERMENT OF WOMEN - UN WOMEN
UNITED NATIONS DEVELOPMENT PROGRAMME
UNITED NATIONS ENVIRONMENT PROGRAMME
UNITED NATIONS FRAMEWORK CONVENTION ON CLIMATE CHANGE
UNITED NATIONS HIGH COMMISSIONER FOR REFUGEES
UNITED NATIONS HUMAN SETTLEMENTS PROGRAMME
UNITED NATIONS POPULATION FUND
INTERNATIONAL TRADE CENTRE
INTER-PARLIAMENTARY UNION
ORGANISATION FOR ECONOMIC CO-OPERATION AND DEVELOPMENT
WORLD TRADE ORGANIZATION
The Millennium Development Goals Report 2012
asdfUnited nationsnew York, 2012


foreword | 3
Foreword
This year’s report on progress towards the Millennium Development Goals (MDGs) highlights several milestones. The target of reducing extreme poverty by half has been reached five years ahead of the 2015 deadline, as has the target of halving the proportion of people who lack dependable access to improved sources of drinking water. Conditions for more than 200 million people living in slums have been ameliorated—double the 2020 target. Primary school enrolment of girls equalled that of boys, and we have seen accelerating progress in reducing child and maternal mortality.
These results represent a tremendous reduction in human suffering and are a clear validation of the approach embodied in the MDGs. But, they are not a reason to relax. Projections indicate that in 2015 more than 600 million people worldwide will still be using unimproved water sources, almost one billion will be living on an income of less than $1.25 per day, mothers will continue to die needlessly in childbirth, and children will suffer and die from preventable diseases. Hunger remains a global challenge, and ensuring that all children are able to complete primary education remains a fundamental, but unfulfilled, target that has an impact on all the other Goals. Lack of safe sanitation is hampering progress in health and nutrition, biodiversity loss continues apace, and greenhouse gas emissions continue to pose a major threat to people and ecosystems.
The goal of gender equality also remains unfulfilled, again with broad negative consequences, given that achieving the MDGs depends so much on women’s empowerment and equal access by women to education, work, health care and decision-making. We must also recognize the unevenness of progress within countries and regions, and the severe inequalities that exist among populations, especially between rural and urban areas.
Achieving the MDGs by 2015 is challenging but possible. Much depends on the fulfilment of MDG-8—the global partnership for development. The current economic crises besetting much of the developed world must not be allowed to decelerate or reverse the progress that has been made. Let us build on the successes we have achieved so far, and let us not relent until all the MDGs have been attained.
Ban Ki-moon Secretary-General, United Nations

4 | the MillenniUM developMent Goals report 2012
Overview
Three years to the deadline, we can report broad progress on the MDGs
The Millennium Development Goals (MDGs) agreed to by world leaders over a decade ago have achieved important results. Working together, Governments, the United Nations family, the private sector and civil society have succeeded in saving many lives and improving conditions for many more. The world has met some important targets—ahead of the deadline.
• Extreme poverty is falling in every regionFor the first time since poverty trends began to be monitored, the number of people living in extreme poverty and poverty rates fell in every developing region—including in sub-Saharan Africa, where rates are highest. The proportion of people living on less than $1.25 a day fell from 47 per cent in 1990 to 24 per cent in 2008—a reduction from over 2 billion to less than 1.4 billion.
• The poverty reduction target was met Preliminary estimates indicate that the global poverty rate at $1.25 a day fell in 2010 to less than half the 1990 rate. If these results are confirmed, the first target of the MDGs—cutting the extreme poverty rate to half its 1990 level—will have been achieved at the global level well ahead of 2015.
• The world has met the target of halving the proportion of people without access to improved sources of water
The target of halving the proportion of people without sustainable access to safe drinking water was also met by 2010, with the proportion of people using an improved water source rising from 76 per cent in 1990 to 89 per cent in 2010. Between 1990 and 2010, over two billion people gained access to improved drinking water sources, such as piped supplies and protected wells.
• Improvements in the lives of 200 million slum dwellers exceeded the slum target
The share of urban residents in the developing world living in slums declined from 39 per cent in 2000 to 33 per cent in 2012. More than 200 million gained access to either improved water sources, improved sanitation facilities, or durable or less crowded housing. This achievement exceeds the target of significantly improving the lives of at least 100 million slum dwellers, well ahead of the 2020 deadline.
• The world has achieved parity in primary education between girls and boys
Driven by national and international efforts and the MDG campaign, many more of the world’s children are enrolled in school at the primary level, especially since 2000. Girls
have benefited the most. The ratio between the enrolment rate of girls and that of boys grew from 91 in 1999 to 97 in 2010 for all developing regions. The gender parity index value of 97 falls within the plus-or-minus 3-point margin of 100 per cent, the accepted measure for parity.
• Many countries facing the greatest challenges have made significant progress towards universal primary education
Enrolment rates of children of primary school age increased markedly in sub-Saharan Africa, from 58 to 76 per cent between 1999 and 2010. Many countries in that region succeeded in reducing their relatively high out-of-school rates even as their primary school age populations were growing.
• Child survival progress is gaining momentum Despite population growth, the number of under-five deaths worldwide fell from more than 12.0 million in 1990 to 7.6 million in 2010. And progress in the developing world as a whole has accelerated. Sub-Saharan Africa—the region with the highest level of under-five mortality—has doubled its average rate of reduction, from 1.2 per cent a year over 1990-2000 to 2.4 per cent during 2000-2010.
• Access to treatment for people living with HIV increased in all regions
At the end of 2010, 6.5 million people were receiving antiretroviral therapy for HIV or AIDS in developing regions. This total constitutes an increase of over 1.4 million people from December 2009, and the largest one-year increase ever. The 2010 target of universal access, however, was not reached.
• The world is on track to achieve the target of halting and beginning to reverse the spread of tuberculosis
Globally, tuberculosis incidence rates have been falling since 2002, and current projections suggest that the 1990 death rate from the disease will be halved by 2015.
• Global malaria deaths have declinedThe estimated incidence of malaria has decreased globally, by 17 per cent since 2000. Over the same period, malaria-specific mortality rates have decreased by 25 per cent. Reported malaria cases fell by more than 50 per cent between 2000 and 2010 in 43 of the 99 countries with ongoing malaria transmission.

overview | 5
Inequality is detracting from these gains, and slowing advances in other key areas
Achievements were unequally distributed across and within regions and countries. Moreover, progress has slowed for some MDGs after the multiple crises of 2008-2009.
• Vulnerable employment has decreased only marginally over twenty years
Vulnerable employment—defined as the share of unpaid family workers and own-account workers in total employment—accounted for an estimated 58 per cent of all employment in developing regions in 2011, down only moderately from 67 per cent two decades earlier. Women and youth are more likely to find themselves in such insecure and poorly remunerated positions than the rest of the employed population.
• Decreases in maternal mortality are far from the 2015 target
There have been important improvements in maternal health and reduction in maternal deaths, but progress is still slow. Reductions in adolescent childbearing and expansion of contraceptive use have continued, but at a slower pace since 2000 than over the decade before.
• Use of improved sources of water remains lower in rural areas
While 19 per cent of the rural population used unimproved sources of water in 2010, the rate in urban areas was only 4 per cent. And since dimensions of safety, reliability and sustainability are not reflected in the proxy indicator used to track progress towards the MDG target, it is likely that these figures overestimate the actual number of people using safe water supplies. Worse, nearly half of the population in developing regions—2.5 billion—still lacks access to improved sanitation facilities. By 2015, the world will have reached only 67 per cent coverage, well short of the 75 per cent needed to achieve the MDG target.
• Hunger remains a global challenge The most recent FAO estimates of undernourishment set the mark at 850 million living in hunger in the world in the 2006/2008 period—15.5 per cent of the world population. This continuing high level reflects the lack of progress on hunger in several regions, even as income poverty has decreased. Progress has also been slow in reducing child undernutrition. Close to one third of children in Southern Asia were underweight in 2010.
• The number of people living in slums continues to growDespite a reduction in the share of urban populations living in slums, the absolute number has continued to grow from a 1990 baseline of 650 million. An estimated 863 million people now live in slum conditions.
In the years ahead, we have the opportunity to achieve more and to shape the agenda for our future
The 2015 deadline is fast approaching. The contributions of national Governments, the international community, civil society and the private sector will need to intensify as we take on the longstanding and long-term challenge of inequality, and press forward on food security, gender equality, maternal health, rural development, infrastructure and environmental sustainability, and responses to climate change.
A new agenda to continue our efforts beyond 2015 is taking shape. The MDG campaign, with its successes as well as setbacks, provides rich experience on which this discussion can draw, as well as confidence that further success is feasible.
• Gender equality and women’s empowerment are key
Gender inequality persists and women continue to face discrimination in access to education, work and economic assets, and participation in government. Violence against women continues to undermine efforts to reach all goals. Further progress to 2015 and beyond will largely depend on success on these interrelated challenges.
• MDG progress shows the power of global goals and a shared purpose
The MDGs have been a fundamental framework for global development. A clear agenda, with measurable goals and targets, and a common vision have been crucial for this success.
There is now an expectation around the world that sooner, rather than later, all these goals can and must be achieved. Leaders will be held to this high standard. Sectors such as government, business, academia and civil society, often known for working at cross-purposes, are learning how to collaborate on shared aspirations. The comprehensive statistics and clear analysis in this year’s MDG Report give us all a good idea of where our efforts should be directed.
Sha ZuKang Under-Secretary-General for Economic and Social Affairs
Goal 1 Eradicate extreme poverty and hunger
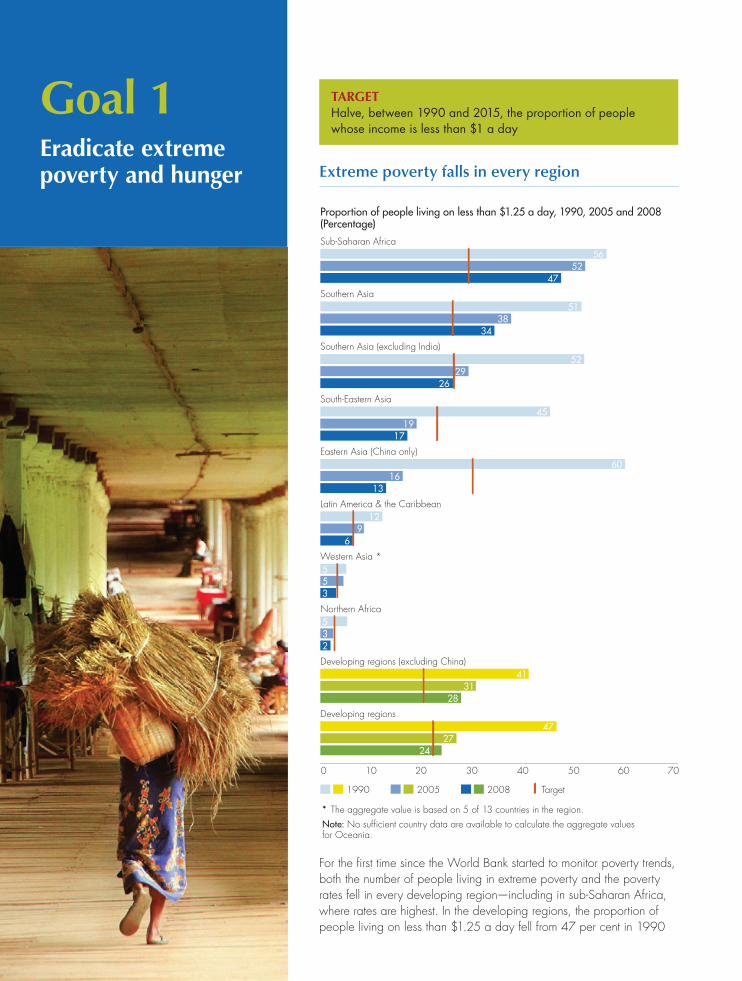
TarGETHalve, between 1990 and 2015, the proportion of people whose income is less than $1 a day
Extreme poverty falls in every region
0 10 20 30 40 50 60 70
Developing regions
Developing regions (excluding China)
Northern Africa
Western Asia *
Latin America & the Caribbean
Eastern Asia (China only)
South-Eastern Asia
Southern Asia (excluding India)
Southern Asia
Sub-Saharan Africa
4752
56
3438
51
2629
52
1719
45
1316
60
69
12
355
235
2831
41
2747
24
1990 2005 2008 Target
Proportion of people living on less than $1.25 a day, 1990, 2005 and 2008(Percentage)
* The aggregate value is based on 5 of 13 countries in the region. Note: No sufficient country data are available to calculate the aggregate valuesfor Oceania.
For the first time since the World Bank started to monitor poverty trends, both the number of people living in extreme poverty and the poverty rates fell in every developing region—including in sub-Saharan Africa, where rates are highest. In the developing regions, the proportion of people living on less than $1.25 a day fell from 47 per cent in 1990

Goal 1: Er adicatE ExtrEmE povErt y and hunGEr | 7
to 24 per cent in 2008. In 2008, about 110 million fewer people than in 2005 lived in conditions of extreme poverty. The number of extreme poor in the developing regions fell from over 2 billion in 1990 to less than 1.4 billion in 2008.
More recent post-2008 analysis reveals that while high food and fuel prices and deep economic recession over the course of the past four years have hurt vulnerable populations and slowed the rate of poverty reduction in some countries, global poverty rates have continued to fall. A preliminary World Bank estimate—based on a much smaller number of surveys than the global update—indicates that the global poverty rate at $1.25 a day fell in 2010 to less than half its 1990 value. If these results are confirmed by follow-up studies, the first target of the Millennium Development Goals—cutting the extreme poverty rate to half its 1990 level—will have been achieved on a global level well ahead of the 2015 deadline.
But even at the current rate of progress, estimates indicate that about 1 billion people will still be living on less than $1.25 a day in 2015—corresponding to a global extreme poverty rate of just below 16 per cent. Four out of every five people living in extreme poverty will live in sub-Saharan Africa and Southern Asia.
Some regions have seen greater progress than others. A remarkable rate of progress was sustained in China. After the extreme poverty rate had dropped from 60 per cent in 1990 to 16 per cent in 2005, the incidence fell further by 2008 to 13 per cent. In India and in the Southern Asian region excluding India, poverty rates fell from 51 to 37 per cent and from 52 to 26 per cent, respectively, between 1990 and 2008.
On the other hand, poverty remains widespread in sub-Saharan Africa and in Southern Asia, despite significant progress. The sub-Saharan African poverty rate fell by almost 5 percentage points, to less than 48 per cent, between 2005 and 2008—the largest drop in that region since international poverty rates began to be estimated. For the first time, the absolute number of people living in extreme poverty also fell in the region, from 395 million in 2005 to 386 million in 2008. This drop reversed the long-term trend of increase since 1981.
Further progress on the long-term goal of eradicating poverty is possible and likely over the coming years if developing countries maintain the robust growth rates achieved over a large part of the past decade; and also if the conditions in which extreme poverty thrives continue to be addressed: poor health and lack of education that deprive people of productive employment; environmental resources that have been depleted or spoiled; and corruption, conflict and bad governance that waste public resources and discourage private investment.
Simply being able to monitor how well anti-poverty efforts in specific localities are doing is an important tool in poverty eradication. But data of sufficient quality and quantity are hard to come by, especially in small States and in countries and territories in fragile situations. The need to improve the quality and reach of household surveys—an important data source for monitoring poverty—is urgent.

8 | thE millEnnium dEvElopmEnt Goals rEport 2012
TarGETAchieve full and productive employment and decent work for all, including women and young people
Eastern Asia sets the pace for worldwide progress on working poverty
0
200
400
600
800
2000 2001 2002 2003 2004 2005 2006 2007 2008 2009 2010 20110
5
10
15
20
25
30
35 Working poor,Eastern Asia
Working poor, worldexcluding Eastern Asia
Working poverty rate,Eastern Asia
Working poverty rate,world excludingEastern Asia
Working poverty rate,world
Proportion of employed people living below $1.25 a day (Percentage) and number of working poor (Millions), 2000-2011
Millions Percentage
Recent estimates, produced by the International Labour Organisation (ILO) and based on a new methodology, show that there were 456 million workers in the world living below the $1.25 a day poverty line in 2011—a reduction of 233 million since 2000 and of 38 million since 2007. The global decline is heavily influenced by the dramatic reduction in extreme poverty among workers in Eastern Asia. Due to rapid economic growth, and to poverty reduction especially in China, the number of poor workers fell by 158 million between 2000 and 2011, and by 24 million between 2007 and 2011.
Worldwide, the proportion of workers living below the $1.25 poverty line declined from 26.4 per cent to 14.8 per cent between 2000 and 2011. If Eastern Asia is excluded, the decline over the same period is less dramatic—from 25.0 per cent to 17.4 per cent.
Even though working poverty is decreasing, progress has slowed markedly since 2008. A projection of pre-crisis (2002-2007) trends in the incidence of working poverty shows a difference of 1.6 percentage points between what was expected and the actual 2011 figure. This corresponds to 50 million more working poor in 2011 than projected by pre-crisis trends.
Goal 1: Er adicatE ExtrEmE povErt y and hunGEr | 9
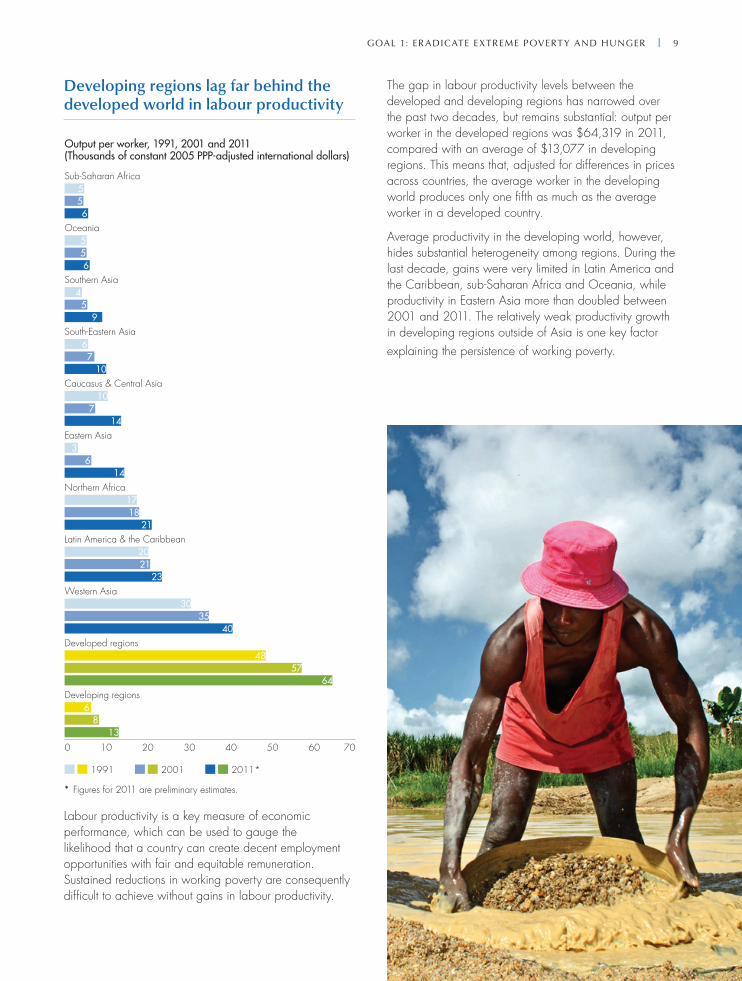
Developing regions lag far behind the developed world in labour productivity
1991 2001 2011*
* Figures for 2011 are preliminary estimates.
0 10 20 30 40 50 60 70
Developing regions
Developed regions
Western Asia
Latin America & the Caribbean
Northern Africa
Eastern Asia
Caucasus & Central Asia
South-Eastern Asia
Southern Asia
Oceania
Sub-Saharan Africa
13
64
40
23
21
14
14
10
9
6
6
8
57
35
21
18
6
7
7
5
5
5
6
48
30
20
17
3
10
6
4
5
5
Output per worker, 1991, 2001 and 2011(Thousands of constant 2005 PPP-adjusted international dollars)
Labour productivity is a key measure of economic performance, which can be used to gauge the likelihood that a country can create decent employment opportunities with fair and equitable remuneration. Sustained reductions in working poverty are consequently difficult to achieve without gains in labour productivity.
The gap in labour productivity levels between the developed and developing regions has narrowed over the past two decades, but remains substantial: output per worker in the developed regions was $64,319 in 2011, compared with an average of $13,077 in developing regions. This means that, adjusted for differences in prices across countries, the average worker in the developing world produces only one fifth as much as the average worker in a developed country.
Average productivity in the developing world, however, hides substantial heterogeneity among regions. During the last decade, gains were very limited in Latin America and the Caribbean, sub-Saharan Africa and Oceania, while productivity in Eastern Asia more than doubled between 2001 and 2011. The relatively weak productivity growth in developing regions outside of Asia is one key factor explaining the persistence of working poverty.

10 | thE millEnnium dEvElopmEnt Goals rEport 2012
Progress is slow in reducing vulnerable employment
1991 2011*
* Figures for 2011 are preliminary estimates.
Proportion of own-account and contributing family workers in total employment, 1991 and 2011 (Percentage)
0 20 40 60 80 100
Developing regions
Developed regions
Western Asia
Eastern Asia (excluding China)
Northern Africa
Latin America & the Caribbean
Caucasus & Central Asia
Eastern Asia
South-Eastern Asia
Southern Asia (excluding India)
Sub-Saharan Africa
Southern Asia
Oceania
58
10
26
30
30
32
42
49
61
68
76
76
77
67
11
43
37
37
35
46
66
68
73
82
81
74
Vulnerable employment—defined as the sum of the percentages of unpaid family workers and own-account workers in total employment—accounted for an estimated 58 per cent of all employment in the developing regions in 2011.
The proportion of workers in employment defined as vulnerable slowly decreased between 1991 and 2011. This moderate decline in proportion was not sufficient to prevent the absolute number of workers in vulnerable employment from increasing by 136 million since 2000, bringing the global number to 1.52 billion. Continuous expansion of the labour force in countries where
vulnerable employment is most prevalent contributed strongly to this trend.
A high share of workers in vulnerable employment indicates the widespread prevalence of informal work arrangements. Under these conditions, workers typically lack adequate social protection and suffer from low pay and from difficult working conditions in which their fundamental rights may be violated or undermined.
Women are far more likely than men to be engaged in vulnerable employment
Women Men
Proportion of own-account and contributing family workersin total employment, women, men, 2011 (Percentage)
0 10 20 30 40 50 60 70 80 90
Developing regions
Developed regions
Latin America & the Caribbean
Western Asia
Caucasus & Central Asia
Northern Africa
Eastern Asia
South-Eastern Asia
Southern Asia
Oceania
Sub-Saharan Africa
56
11
32
22
41
26
46
58
74
71
69
62
9
32
41
43
44
53
66
83
84
85
The gap between women’s and men’s vulnerable employment is widest in Northern Africa—where in 2011, 44 per cent of women were in jobs classified as vulnerable, compared with 26 per cent of men—and in Western Asia, where the rates were 41 and 22 per cent, respectively. The share of vulnerable employment across genders was highest in sub-Saharan Africa, reaching 85 per cent for women and 69 per cent for men.

Goal 1: Er adicatE ExtrEmE povErt y and hunGEr | 11
Youth tend to find themselves in low-opportunity family based work situations
Youth Adults
Share of contributing family workers in total employment,youth and adults, selected countries, 2003/2006 (Percentage)
1
1
3
4
2
3
7
9
6
16
15
18
26
28
28
13
21
61
44
79
2
9
11
12
13
14
22
25
30
35
39
45
60
61
62
64
65
78
86
98
0 20 40 60 80 100
Armenia
Niger
Gabon
Mexico
Congo
Colombia
Philippines
Guatemala
Nicaragua
India
Pakistan
Peru
Cambodia
Mozambique
Mali
Togo
Uganda
Bhutan
Burkina Faso
Madagascar
Many young people start their working life by supporting informal family businesses or farms. Data for a sample of 20 developing economies for which breakdowns by age and status in employment are available show that the share of contributing family workers among all employed young people exceeded the corresponding share for adult workers in all countries.
The school-to-work transition may also include spells of unemployment or periods of temporary or casual employment, before reaching a final station that is likely to be own-account work.
TarGETHalve, between 1990 and 2015, the proportion of people who suffer from hunger
The numbers of malnourished have stabilized since 1990
Number and proportion of people in the developing regions whoare undernourished 1990-92, 1995-97, 2000-02 and 2006-08
848791
836 850
19.8
16.8 16.515.5
0
200
400
600
800
1,000
1,200
1,400
1990-92 1995-97 2000-02 2006-08
Millions
0
5
10
15
20
25
Percentage
Number of undernourished people
Percentage of undernourished people
The most recent estimates of undernourishment by the Food and Agriculture Organisation of the United Nations (FAO) were published in 2011 for the 2006-2008 period. They set the mark at 850 million, which corresponds to 15.5 per cent of the world population. This was the first assessment based on hard data on food production and consumption referring to 2008, and capturing the actual impact of the food price crisis of 2007-2008 and of the financial crisis of 2008.
12 | thE millEnnium dEvElopmEnt Goals rEport 2012
The situation at the global level was not as stark as might have been expected, and was originally projected, thanks to economic growth rates that remained high in many developing countries at least through 2008.
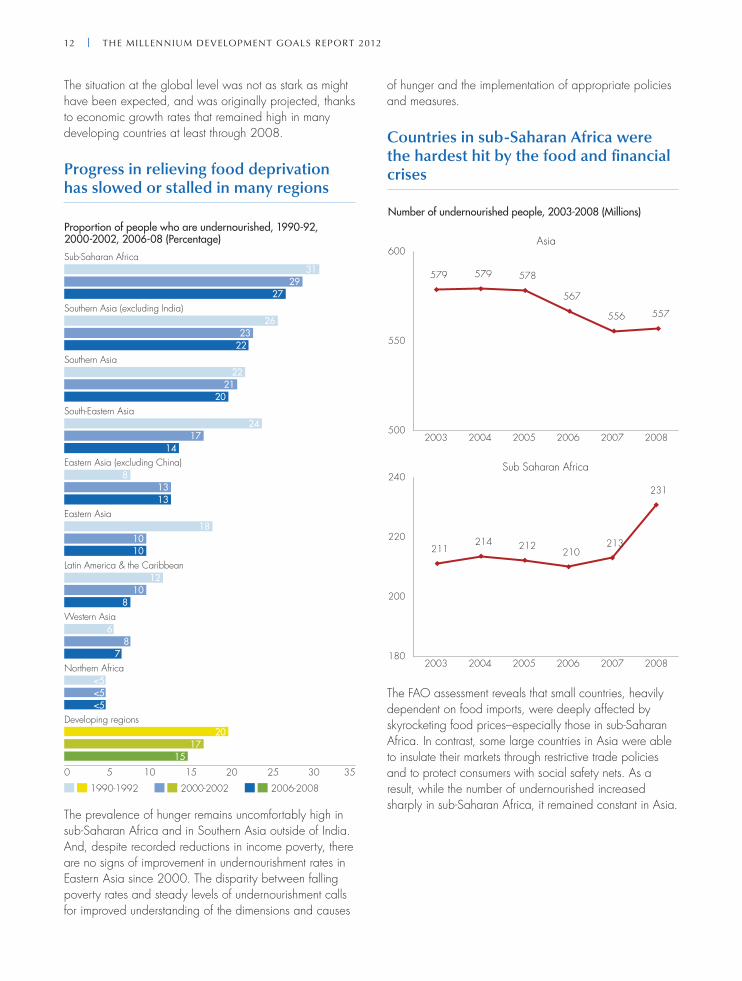
Progress in relieving food deprivation has slowed or stalled in many regions
1990-1992 2000-2002 2006-2008
Proportion of people who are undernourished, 1990-92,2000-2002, 2006-08 (Percentage)
15
<5
8
10
13
14
20
22
27
17
<5
10
10
13
17
21
23
29
20
<5
12
18
8
24
22
26
31
7 8
6
50 10 15 20 25 30 35
Developing regions
Northern Africa
Western Asia
Latin America & the Caribbean
Eastern Asia
Eastern Asia (excluding China)
South-Eastern Asia
Southern Asia
Southern Asia (excluding India)
Sub-Saharan Africa
The prevalence of hunger remains uncomfortably high in sub-Saharan Africa and in Southern Asia outside of India. And, despite recorded reductions in income poverty, there are no signs of improvement in undernourishment rates in Eastern Asia since 2000. The disparity between falling poverty rates and steady levels of undernourishment calls for improved understanding of the dimensions and causes
of hunger and the implementation of appropriate policies and measures.
Countries in sub-Saharan Africa were the hardest hit by the food and financial crises
Number of undernourished people, 2003-2008 (Millions)
500
550
600
2003 2004 2005 2006 2007 2008
Asia
579 579 578
567
556 557
180
200
220
240
2003 2004 2005 2006 2007 2008
Sub Saharan Africa
211214 212
210213
231
The FAO assessment reveals that small countries, heavily dependent on food imports, were deeply affected by skyrocketing food prices–especially those in sub-Saharan Africa. In contrast, some large countries in Asia were able to insulate their markets through restrictive trade policies and to protect consumers with social safety nets. As a result, while the number of undernourished increased sharply in sub-Saharan Africa, it remained constant in Asia.
Goal 1: Er adicatE ExtrEmE povErt y and hunGEr | 13
Improved methodology will help to better understand the state of food insecurity in the world
New estimates of hunger prevalence are being produced based on a larger number of household expenditure surveys and a new methodology developed by FAO. The new figures will provide an assessment for the years 2009-2011 and preliminary estimates for 2012. The improved methodology should better capture changes in the degree of inequality in food access, as well as provide more accurate estimates of food stocks, non-food uses and waste.
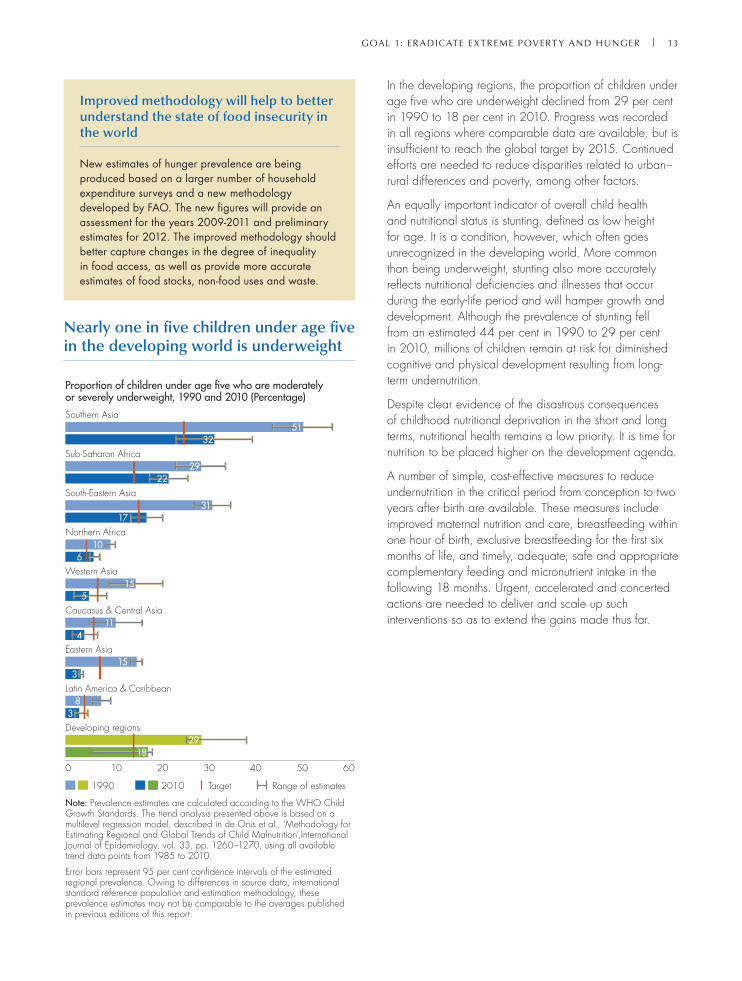
Nearly one in five children under age five in the developing world is underweight
Note: Prevalence estimates are calculated according to the WHO ChildGrowth Standards. The trend analysis presented above is based on amultilevel regression model, described in de Onis et al., ‘Methodology for Estimating Regional and Global Trends of Child Malnutrition’,International Journal of Epidemiology, vol. 33, pp. 1260–1270, using all available trend data points from 1985 to 2010.
Error bars represent 95 per cent confidence intervals of the estimatedregional prevalence. Owing to differences in source data, internationalstandard reference population and estimation methodology, theseprevalence estimates may not be comparable to the averages publishedin previous editions of this report.
1990 2010 Target
Proportion of children under age five who are moderatelyor severely underweight, 1990 and 2010 (Percentage)
0 10 20 30 40 50 60
Developing regions
Latin America & Caribbean
Eastern Asia
Caucasus & Central Asia
Western Asia
Northern Africa
South-Eastern Asia
Sub-Saharan Africa
Southern Asia
18
3
3
4
5
6
17
22
32
29
8
15
11
15
10
31
29
51
Range of estimates
In the developing regions, the proportion of children under age five who are underweight declined from 29 per cent in 1990 to 18 per cent in 2010. Progress was recorded in all regions where comparable data are available, but is insufficient to reach the global target by 2015. Continued efforts are needed to reduce disparities related to urban–rural differences and poverty, among other factors.
An equally important indicator of overall child health and nutritional status is stunting, defined as low height for age. It is a condition, however, which often goes unrecognized in the developing world. More common than being underweight, stunting also more accurately reflects nutritional deficiencies and illnesses that occur during the early-life period and will hamper growth and development. Although the prevalence of stunting fell from an estimated 44 per cent in 1990 to 29 per cent in 2010, millions of children remain at risk for diminished cognitive and physical development resulting from long-term undernutrition.
Despite clear evidence of the disastrous consequences of childhood nutritional deprivation in the short and long terms, nutritional health remains a low priority. It is time for nutrition to be placed higher on the development agenda.
A number of simple, cost-effective measures to reduce undernutrition in the critical period from conception to two years after birth are available. These measures include improved maternal nutrition and care, breastfeeding within one hour of birth, exclusive breastfeeding for the first six months of life, and timely, adequate, safe and appropriate complementary feeding and micronutrient intake in the following 18 months. Urgent, accelerated and concerted actions are needed to deliver and scale up such interventions so as to extend the gains made thus far.
14 | thE millEnnium dEvElopmEnt Goals rEport 2012
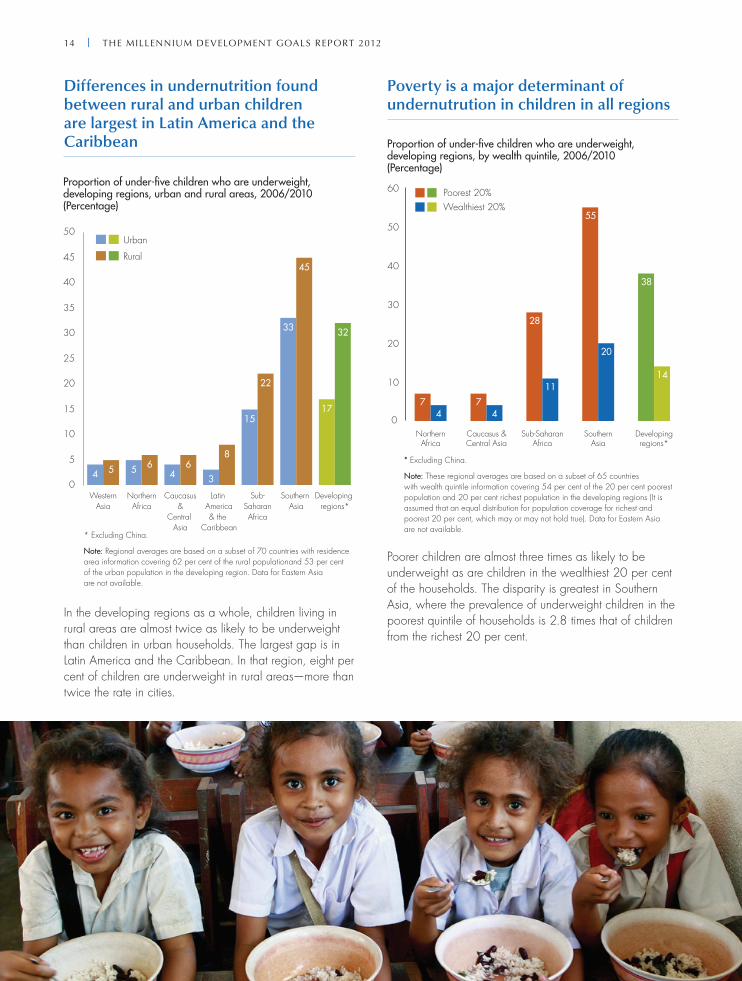
Differences in undernutrition found between rural and urban children are largest in Latin America and the Caribbean
4 5 5 64
63
8
15
22
33
45
17
32
Proportion of under-five children who are underweight, developing regions, urban and rural areas, 2006/2010 (Percentage)
0
5
10
15
20
25
30
35
40
45
50
WesternAsia
NorthernAfrica
Caucasus&
Central Asia
Latin America& the
Caribbean
Sub-SaharanAfrica
Southern Asia
Developing regions*
* Excluding China.
Note: Regional averages are based on a subset of 70 countries with residence area information covering 62 per cent of the rural populationand 53 per cent of the urban population in the developing region. Data for Eastern Asia are not available.
Urban
Rural
In the developing regions as a whole, children living in rural areas are almost twice as likely to be underweight than children in urban households. The largest gap is in Latin America and the Caribbean. In that region, eight per cent of children are underweight in rural areas—more than twice the rate in cities.
Poverty is a major determinant of undernutrution in children in all regions
Proportion of under-five children who are underweight,developing regions, by wealth quintile, 2006/2010(Percentage)
Poorest 20%Wealthiest 20%
* Excluding China.
Note: These regional averages are based on a subset of 65 countries with wealth quintile information covering 54 per cent of the 20 per cent poorest population and 20 per cent richest population in the developing regions (It is assumed that an equal distribution for population coverage for richest and poorest 20 per cent, which may or may not hold true). Data for Eastern Asiaare not available.
74
74
28
11
55
20
38
14
0
10
20
30
40
50
60
NorthernAfrica
Caucasus &Central Asia
Sub-SaharanAfrica
SouthernAsia
Developingregions*
Poorer children are almost three times as likely to be underweight as are children in the wealthiest 20 per cent of the households. The disparity is greatest in Southern Asia, where the prevalence of underweight children in the poorest quintile of households is 2.8 times that of children from the richest 20 per cent.

Goal 1: Er adicatE ExtrEmE povErt y and hunGEr | 15
The number of refugees and of the displaced remains high, even with an upturn in repatriation in 2011
0
10
20
40
30
50
60
2000 2001 2002 2003 2004 2005 2006 2007 2008 2009 2010 2011
Asylum seekers
Refugees
Internally displacedpersons
Number of refugees, asylum seekers and internally displaced persons, 2000-2011 (Millions)
21.2 25.0 25.0 24.6 25.3 23.7 24.4 26.0 26.0 27.5 26.4
15.9 16.0 14.6 13.7 13.8 13.0 14.3 16.0 15.2 15.2 15.4 15.2
27.1
0.90.81.00.80.7
0.80.91.01.1
1.11.1 0.7
Armed conflict and violence uprooted more than 4 million people in 2011, either inside or outside the borders of their countries. This is the highest number in many years. Post-election violence in Côte d’Ivoire, “Arab Spring” uprisings and a deteriorating situation in Somalia were all contributing factors, in particular during the first half of 2011.
The number of refugees returning home voluntarily had fallen steadily since 2004. With the situation improving in some countries, this trend was reversed in 2011, with more than half a million refugees repatriating during the year. This number is more than double the 2010 total of 197,600, and constitutes the highest repatriation flow since the return of 604,000 refugees in 2008.
But 2011 also produced the third lowest number of voluntarily repatriated refugees in a decade. Globally, more than 9.1 million refugees have returned home over the past 10 years, three quarters of them with the assistance of the United Nations High Commissioner for Refugees (UNHCR).
At the end of 2011, an estimated 42.5 million people worldwide were living in a place to which they had been forcibly displaced due to conflict or persecution. Of these, 15.2 million were refugees, including 10.4 million who fall under the responsibility of the UNHCR and 4.8 million Palestinian refugees registered with the United Nations Relief and Works Agency for Palestine Refugees in the Near East (UNRWA). Some 26.4 million people were uprooted by violence and persecution but remain within the borders of their own countries. Some 900,000 were asylum seekers.
On average, four out of five refugees are hosted by developing countries. The largest refugee populations covered under the mandate of the UNHCR at the end of 2011 continued to be Afghans (2.7 million) and Iraqis (1.4 million). Together, they account for four out of ten of all refugees under the UNHCR mandate.

Goal 2Achieve universal primary education
TArGeTEnsure that, by 2015, children everywhere, boys and girls alike, will be able to complete a full course of primary schooling
Progress on primary school enrolment has slowed since 2004, even as countries with the toughest challenges have made large strides
90
97
95
95
93
92
76
88
97
94
95
89
89
68
82
97
96
88
92
94
94
77
84
96.6
96
93.9
97.3
95
94.5
58
0 10 50 80 10030 70 904020 60
1999 2004 2010
Developing regions
Developed regions
Eastern Asia
Northern Africa
South-Eastern Asia
Latin America & the Caribbean
Caucasus & Central Asia
Southern Asia
Western Asia
Sub-Saharan Africa
Adjusted net enrolment rate in primary education,* 1999, 2004 and 2010(Percentage)
* Defined as the number of pupils of the official school age for primary educationenrolled either in primary or secondary school, expressed as a percentage of the totalpopulation in that age group. Note: Data for Oceania are not available.

Goal 2: achieve universal primary education | 17
In the developing regions, the net enrolment rate for children of primary school age rose from 82 to 90 per cent between 1999 and 2010. However, a closer look at the data reveals that nearly all of this growth occurred between 1999 and 2004, and that progress in reducing the number of out-of-school children slowed considerably after 2004.
At the same time, many of the countries facing the greatest challenges have recorded significant progress towards universal primary education. Enrolment rates of children of primary school age increased markedly in sub-Saharan Africa, from 58 to 76 per cent between 1999 and 2010. Total enrolment of children of primary school age in the region rose by more than two thirds, with 43 million more enrolled. Not only did countries succeed in reducing their relatively high out-of-school rates, they also improved their enrolment rates even as the primary school age population was growing by more than one quarter between 1999 and 2010 (28 per cent, or 31 million children).
Apart from in sub-Saharan Africa, more than 90 per cent of children of primary school age were enrolled either in primary or secondary schools in 2010. In four developing regions (Northern Africa, Eastern Asia, Latin America and the Caribbean and South-Eastern Asia), at least 95 per cent of primary-age children were in school.
More than half of all out-of-school children are in sub-Saharan Africa
0
20
40
60
80
100
120
1999 2000 2001 2002 2003 2004 2005 2006 2007 2008 2009 2010
Rest of the world Southern Asia Sub-Saharan Africa
Primary school age children out of school, 1999-2010(Millions)
In 2010, 61 million children of primary school age were out of school. More than half of them (33 million) were in sub-Saharan Africa and a further one fifth (13 million) in Southern Asia. In relative terms, 24 per cent of children of primary school age in sub-Saharan Africa and 7 per cent in Southern Asia were not in school.

18 | the millennium development Goals report 2012
Globally, there has been progress in reducing girls’ exclusion from primary education, with the female share of out-of-school children in developing countries dropping from 58 to 53 per cent between 1999 and 2010. But regional gender disparities continue to detract from efforts to achieve universal primary education. In Southern Asia, Western Asia and Northern Africa, girls accounted for 55, 65 and 79 per cent, respectively, of the total share of out-of-school children.
Universal primary education would be a hollow achievement if the focus were simply on enrolment rather than on the completion of primary education. In 2010, the global primary completion rate (measured by the gross intake ratio to the last grade of primary education) reached 90 per cent, compared with 81 per cent in 1999. Regional values ranged from 70 per cent in sub-Saharan Africa to almost 100 per cent in Latin America and the Caribbean and also in the Caucasus and Central Asia.
Girls and boys have similar chances of completing primary education in all regions except for sub-Saharan Africa and Western Asia. In sub-Saharan Africa, boys are more likely than girls to complete primary education in 25 out of 43 countries with available data. In only 10 of these countries do both groups have equal chances of finishing primary school. But notably, in 8 countries in sub-Saharan Africa more girls than boys are currently completing primary education, although these disparities tend to be less extreme than those tilted against girls.
Success at the primary level places increased demands on secondary schools
With more children completing primary education, the demand for secondary education is growing. This increased demand poses a serious challenge for countries with limited resources. In sub-Saharan Africa, about one quarter of the children who complete primary school do not continue on to secondary education. The regional average, however, hides substantial differences between countries. The transition rate from primary to secondary education ranges from around 40 per cent in Angola, Mauritania and the United Republic of Tanzania to 98 per cent in Seychelles and Swaziland.
Young people who do not pursue their education join the group of adolescents of lower-secondary age who are not enrolled in either primary or secondary school. In 2010, there were 71 million young adolescents (typically aged 12-15 years) out of school around the world. Of these, around 48 million lived in countries where lower-secondary schooling is officially recognized as part of the compulsory education system.
Young adolescents from poor and rural households are more likely to be out of school
36
3129
2423
2119
1614
10
18
14
27
23
0
5
10
15
20
25
30
35
40
Poorest20%
Second20%
Middle20%
Fourth20%
Richest20%
Urban Rural
Girls Boys
Percentage of lower secondary-age children out of schoolby sex, household wealth and location, 55 countries, 2005/2010
Analysis of household survey data collected between 2005 and 2010 in 55 developing countries reveals that exclusion from education occurs most often among children from disadvantaged groups. Poverty emerges as a strong determinant of school exclusion for lower secondary-age youth. Young adolescents from the poorest households are three times as likely to be out of school as those from the richest households. Girls of lower secondary-age are more likely to be out of school than boys, regardless of the wealth or location of the household. Nevertheless, the greatest disparities are found between the richest and poorest households, and between urban and rural areas.

Goal 2: achieve universal primary education | 19
Illiteracy still holds back more than 120 million young people
Out-of-school youth tend to have limited opportunities to develop or maintain literacy skills, restricting their options in life and compounding the disadvantages they face later on.
In 2010, there were still 122 million people between 15 and 24 years of age—74 million women and 48 million men—who were unable to read and write a short, simple statement about their everyday life.
The great majority of these young adults live in Southern Asia (62 million) and sub-Saharan Africa (45 million). In relative terms, literacy rates among the youth population are lowest in sub-Saharan Africa (72 per cent) and Oceania (76 per cent).
Globally, the youth literacy rate reached 90 per cent in 2010, an increase of 6 percentage points since 1990. Over the last two decades, the greatest progress has been achieved in Southern Asia, where youth literacy rose from 60 to 81 per cent, and in Northern Africa, where it increased from 68 to 88 per cent.
Gender gaps in youth literacy rates are also narrowing. Globally, there were 95 literate young women for every 100 young men in 2010, compared with 90 women in 1990. At the regional level, this gap is most notable in Southern Asia, where there were only 86 literate women for every 100 literate men in the age group 15-24 years in 2010.
Goal 3Promote gender equality and empower women
TarGeT:Eliminate gender disparity in primary and secondary education, preferably by 2005, and in all levels of education no later than 2015
Parity is achieved in developing world primary schools, even though some regions lag behind
0 10 20 30 40 50 60 70 80 90 100 110 120 130
85 93Western Asia
85 93Sub-Saharan Africa
90 95Northern Africa
97 97Latin America & the Caribbean
83 98Southern Asia
99 98Caucasus & Central Asia
96 99South-Eastern Asia
101 103Eastern Asia
90Oceania*
100 99Developed regions
91 97Developing regions
Primary education
75 91Southern Asia
74 91Western Asia
98 97Caucasus & Central Asia
92 98Northern Africa
93 104Eastern Asia
96 104South-Eastern Asia
107 108Latin America & the Caribbean
89Oceania*
101 99Developed regions
88 96Developing regions
83 82Sub-Saharan AfricaSecondary education
65 76Southern Asia
75 89Western Asia
67 105Eastern Asia
74 106Northern Africa
90 106Caucasus & Central Asia
100 107South-Eastern Asia
117 128Latin America & the Caribbean
83Oceania*
120 130Developed regions
83 98Developing regions
67 63Sub-Saharan AfricaTertiary education
1999 2010 Target = Gender parity index between 97 and 103
Gender parity index for gross enrolment ratios in primary, secondary and tertiary education (Girls’ school enrolement ratio in relation to boys’ enrolment ratio), 1999 and 2010 (Girls per 100 boys)
* Data for 2010 are not available.
Achieving parity in education is an important step toward equal opportunity for men and women in the social, political and economic domains. Driven by national and international efforts and the MDG

Goal 3: Promote Gender equalit y and emPower women | 21
campaign, many more of the world’s children have enrolled in school at the primary level, especially since 2000. Girls have benefited the most. Progress is reflected in the gender parity index (GPI), showing the ratio between the enrolment rate of girls and that of boys. The GPI grew from 91 in 1999 to 97 in 2010 for the developing regions as a whole—falling within the plus-or-minus 3-point margin of 100 per cent that is the accepted measure for parity.
However, while most of the developing world had reached a GPI of at least 95 at the primary level by 2010, the index was only 93 in Western Asia and sub-Saharan Africa. These two regions, however, have recorded the greatest progress. Between 1999 and 2010, girls’ participation in primary education, as measured by the gross enrolment ratio (ratio of girls enrolled regardless of age to all girls of primary school age), increased from 72 to 96 per cent in sub-Saharan Africa and from 87 to 97 per cent in Western Asia.
At the country level, 71 out of 131 countries in developing regions reporting data by sex had achieved gender parity in primary education by 2010. Boys’ participation rates were higher than those of girls in 53 countries, while the opposite was true in the remaining 7 countries.
Gender disparities emerge at different points through the education system
In many countries, gender gaps appear on the first day of school. Three quarters of the countries that have not achieved gender parity at the primary level enrol more boys than girls at the start of the school cycle. Unless this imbalance is corrected, the inevitable result is a permanent gender disparity in primary school. Once girls gain access to primary education, however, they tend to outperform boys. Data show that in most countries, girls are less likely to repeat grades or leave school early. In 102 out of 129 countries reporting data, girls progress more rapidly to the last grade of primary education than boys.
Girls face greater barriers at the secondary level of education than at the primary level. The gender parity index in secondary education in the developing world as a whole was 96 in 2010, compared with 97 for primary education. By 2010, sub-Saharan Africa had only 82 girls enrolled per 100 boys. But in Latin America and the Caribbean, enrolment rates in secondary school were actually higher for girls than for boys, with a GPI of 108. Western and Southern Asia emerge as the regions with the largest gains in this period, moving from a GPI of only 74 and 75, respectively, to 91 for both in 2010.
Gender disparities in secondary education emerge from gender-based discrimination in the family and in the society in general. Secondary schooling is more costly than primary education, and households are often forced to ration resources among children. Where girls’ education is less valued, or is perceived as generating lower returns, parents may favour sons over daughters. Early marriage can act as another barrier to secondary school progression. Parents may also worry more about the security of adolescent girls because secondary schools are often farther from home than primary schools.
In tertiary education, the GPI of 98, reached in 2010 for the developing world, constitutes achievement of parity. This attainment was led by very high parity values in Latin America and the Caribbean, South-Eastern Asia, the Caucasus and Central Asia, Northern Africa and Eastern Asia. But parity in tertiary education remains difficult to attain in sub-Saharan Africa (with a GPI of 63), Southern Asia (76) and Western Asia (89).
In general, countries with lower levels of national wealth tend to have more men enrolled in tertiary education than women, while the opposite occurs in countries with higher average income. Thus, in 45 countries with an average gross domestic product (GDP) per capita of $5,200 (purchasing power parity (PPP)), there were substantially more men in tertiary education than women, while women outnumbered men in the 94 countries where per capita GDP averaged $16,500.

22 | the millennium develoPment Goals rePort 2012
Girls from the poorest households face the highest barriers to education
0 20 40 60 80 100 120
9197
Poorest 20%
98105
Second 20%
104109
Middle 20%
107112
Fourth 20%
111115
Richest 20%
3540
Poorest 20%
4549
Second 20%
5357
Middle 20%
6469
Fourth 20%
8089
Richest 20%
Primary education
Secondary education
Girls Boys
Gross attendance ratio in primary and secondary school, by household wealth quintile, girls and boys, 55 countries, 2005/2010 (Percentage)
Household surveys conducted in 55 developing countries between 2005 and 2010 show that poverty is a significant obstacle to primary and secondary school attendance. Among the countries in the sample, the gross attendance ratio for primary education is 113 per cent in the richest household quintile, compared with 94 per cent in the poorest quintile. In secondary education, the gap between the richest and poorest quintile is even greater—84 per cent compared with 37 per cent. This means that children from the richest households are more than twice as likely to attend secondary school as children from the poorest households.
Gender also plays an important role as a determinant of school attendance, but the gap between boys and girls is not nearly as large as that between children from wealthy and poor households. Even so, gender disparity to the disadvantage of girls for attendance in secondary schools appears persistently in the sample of 55 countries, mirroring global findings from the analysis of administrative data.
Equal access to job opportunities remains a distant target for women in some regions
0 10 20 30 40 50
4037
35
4846
44
4644
44
4340
36
4240
38
3837
35
3636
33
3328
24
2017
13
191919
1917
15
World
Developed regions
Caucasus & Central Asia
Latin America & the Caribbean
Eastern Asia
South-Eastern Asia
Oceania
Sub-Saharan Africa
Southern Asia
Northern Africa
Western Asia
Employees in non-agricultural wage employment who are women, 1990, 2000 and 2010 (Percentage)
1990 2000 2010
Women’s share in paid jobs outside of the agricultural sector increased slowly on a global basis, from 35 per cent in 1990 to 40 per cent 20 years later. Significant differences, however, exist among regions. While men outnumber women in non-agricultural paid employment in all regions, women and men are actually approaching

Goal 3: Promote Gender equalit y and emPower women | 23
parity in the developed regions and in the Caucasus and Central Asia. In Western Asia, Northern Africa and Southern Asia, meanwhile, only 20 per cent or fewer of non-agricultural work forces in 2010 were women. Moreover, while some progress was made in Southern and Western Asia, women did not gain any ground in paid employment in Northern Africa.
Even where women represent a large share of wage workers, they are not on an equal footing with men. Although they may enter the labour market with the same educational and skill levels as men, they face more barriers in reaching top-level occupations. Globally, women occupy only 25 per cent of senior management positions. Women’s jobs tend to be concentrated at the lower end of the labour market (i.e., less remunerative, less productive, micro in scale) and in a narrower range of occupations and activities (e.g., food processing, garment making, services).
Women, more often than men, turn to the informal economy
Due to obstacles to employment in the formal economy and a need to supplement family income especially during a period of crisis, women more often than men work in the informal sector or in informal employment.
More than 80 per cent of women working outside of agriculture in Mali, Zambia, India and Madagascar, and nearly three quarters of women in Peru, Paraguay, Uganda, Honduras, Bolivia, El Salvador and Liberia, hold informal jobs. The percentages are also very high in many other developing countries.
Although men outnumber women in informal non-farm jobs in most countries, in relative terms the situation is quite different. In 27 out of 37 countries with data, women are more likely than men to have informal jobs in formal or informal sector enterprises, lacking social protection and/or entitlement to employment benefits such as paid annual or sick leave.
Women are also more likely than men to have informal jobs in formal sector enterprises. In 22 out of 31 countries with data on informal jobs in formal sector enterprises, the percentage of women holding such jobs is higher than for men, suggesting that women turn to these types of jobs because they lack other opportunities or face barriers in accessing formal employment.
On the other hand, men are more likely than women to hold jobs in informal sector enterprises. In 26 out of 39 countries with available data, the percentage of men employed in informal sector enterprises is higher than that of women.
24 | the millennium develoPment Goals rePort 2012
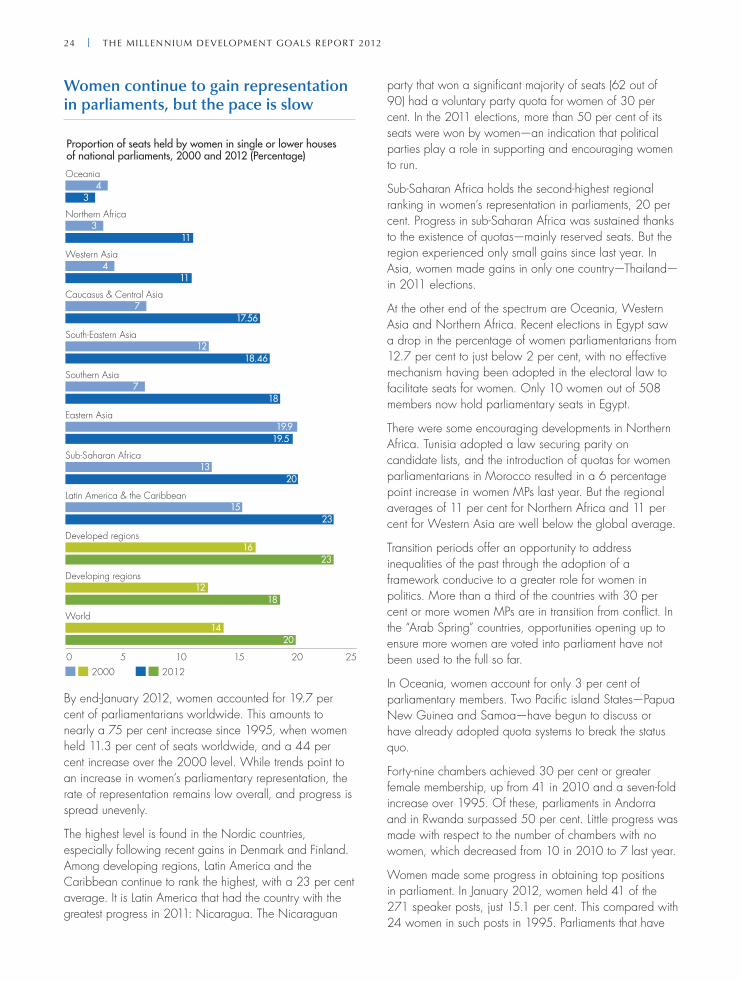
Women continue to gain representation in parliaments, but the pace is slow
Proportion of seats held by women in single or lower houses of national parliaments, 2000 and 2012 (Percentage)
2014
1812
2316
2315
2013
19.519.9
187
18.4612
17.567
114
113
34
0 5 10 15 20 25
World
Developing regions
Developed regions
Latin America & the Caribbean
Sub-Saharan Africa
Eastern Asia
Southern Asia
South-Eastern Asia
Caucasus & Central Asia
Western Asia
Northern Africa
Oceania
2000 2012
By end-January 2012, women accounted for 19.7 per cent of parliamentarians worldwide. This amounts to nearly a 75 per cent increase since 1995, when women held 11.3 per cent of seats worldwide, and a 44 per cent increase over the 2000 level. While trends point to an increase in women’s parliamentary representation, the rate of representation remains low overall, and progress is spread unevenly.
The highest level is found in the Nordic countries, especially following recent gains in Denmark and Finland. Among developing regions, Latin America and the Caribbean continue to rank the highest, with a 23 per cent average. It is Latin America that had the country with the greatest progress in 2011: Nicaragua. The Nicaraguan
party that won a significant majority of seats (62 out of 90) had a voluntary party quota for women of 30 per cent. In the 2011 elections, more than 50 per cent of its seats were won by women—an indication that political parties play a role in supporting and encouraging women to run.
Sub-Saharan Africa holds the second-highest regional ranking in women’s representation in parliaments, 20 per cent. Progress in sub-Saharan Africa was sustained thanks to the existence of quotas—mainly reserved seats. But the region experienced only small gains since last year. In Asia, women made gains in only one country—Thailand— in 2011 elections.
At the other end of the spectrum are Oceania, Western Asia and Northern Africa. Recent elections in Egypt saw a drop in the percentage of women parliamentarians from 12.7 per cent to just below 2 per cent, with no effective mechanism having been adopted in the electoral law to facilitate seats for women. Only 10 women out of 508 members now hold parliamentary seats in Egypt.
There were some encouraging developments in Northern Africa. Tunisia adopted a law securing parity on candidate lists, and the introduction of quotas for women parliamentarians in Morocco resulted in a 6 percentage point increase in women MPs last year. But the regional averages of 11 per cent for Northern Africa and 11 per cent for Western Asia are well below the global average.
Transition periods offer an opportunity to address inequalities of the past through the adoption of a framework conducive to a greater role for women in politics. More than a third of the countries with 30 per cent or more women MPs are in transition from conflict. In the “Arab Spring” countries, opportunities opening up to ensure more women are voted into parliament have not been used to the full so far.
In Oceania, women account for only 3 per cent of parliamentary members. Two Pacific island States—Papua New Guinea and Samoa—have begun to discuss or have already adopted quota systems to break the status quo.
Forty-nine chambers achieved 30 per cent or greater female membership, up from 41 in 2010 and a seven-fold increase over 1995. Of these, parliaments in Andorra and in Rwanda surpassed 50 per cent. Little progress was made with respect to the number of chambers with no women, which decreased from 10 in 2010 to 7 last year.
Women made some progress in obtaining top positions in parliament. In January 2012, women held 41 of the 271 speaker posts, just 15.1 per cent. This compared with 24 women in such posts in 1995. Parliaments that have

Goal 3: Promote Gender equalit y and emPower women | 25
a woman speaker for the first time ever include Portugal, Uganda, the Lao People’s Democratic Republic and the Russian Federation.
Women are elected in greater numbers in systems of proportional representation than they are in majority electoral systems. The use of special measures or quotas is also an important factor. Of the 59 countries that held elections in 2011 for lower or single houses, 26 had implemented special measures favouring women, and electoral quotas were used in 17. Where quotas were used, women took 27.4 per cent of seats, as opposed to 15.7 per cent of seats in countries without any form of quota.
The data collected on elections in 2011 indicates that women were not vying for seats in sufficient numbers to
make a large electoral impact. But notably, once they run for office, they are elected at about the same rate as men despite challenges that may be different or more difficult.
The situation in executive branches is little more encouraging than in parliaments. Although the number of countries with women as Head of Government, Head of State or both has more than doubled since 2005, the total number—17—remains modest. The percentage of women ministers worldwide also improved only slightly, from 14.2 per cent in 2005 to 16.7 per cent in 2012. Across the world, the most common ministerial portfolios held by women ministers have tended to be in social affairs, family and youth, women’s affairs or education. This remains largely the case, although in 2012 employment and labour emerged as the fourth most common ministerial portfolio held by women.

Goal 4Reduce child mortality
TaRGeTReduce by two thirds, between 1990 and 2015, the under-five mortality rate
Child mortality falls by more than one third, but progress is still too slow to reach the target
Sub-Saharan Africa
Southern Asia
Oceania
Caucasus & Central Asia
South-Eastern Asia
Western Asia
Northern Africa
Latin America & the Caribbean
Eastern Asia
Developed regions
Developing regions
Under-five mortality rate, 1990 and 2010 (Deaths per 1,000 live births)
1990 2010 2015 target
174121
100 150 200500
11766
7552
4577
6732
8227
5423
4818
157
9763
3271
Considerable progress has been made in reducing under-five mortality since 1990. In the developing regions, the mortality rate declined by 35 per cent, from 97 deaths per 1,000 live births in 1990 to 63 in 2010. Despite population growth, the number of under-five deaths worldwide fell from more than 12 million in 1990 to 7.6 million in 2010.
Five of nine developing regions show reductions in under-five mortality of more than 50 per cent from 1990 through 2010. Northern Africa already has achieved the MDG 4 target, bringing down the child mortality rate by 67 per cent, and Eastern Asia is close, with a 63 per cent decline.

Goal 4: Reduce child moRtalit y | 27
Sub-Saharan Africa and Oceania have achieved reductions of only around 30 per cent, less than half of what is required to reach the target. Southern Asia is also falling behind with a decline in the child mortality rate of 44 per cent between 1990 and 2010—insufficient to reach the two-third reduction by 2015.
Progress on child mortality is gaining momentum
Annual rates of reduction in under-five mortality, by region,1990-2000 and 2000-2010 (Percentage)
0 2 4 6 8
5.93.7
Eastern Asia
5.75.6
Northern Africa
4.13.9
South-Eastern Asia
3.94.5
Latin America & the Carribbean
3.43.9
Western Asia
3.22.2
Caucasus & Central Asia
2.93.0
Southern Asia
1.22.4
Sub-Saharan Africa
1.91.7
Oceania
4.13.7
Developed regions
2.41.9
Developing regions
1990-2000 2000-2010
Progress on under-five mortality in the developing world as a whole has accelerated. Sub-Saharan Africa—the region with the highest level of under-five mortality—has doubled its average rate of reduction, from 1.2 per cent a year over the 1990-2000 period to 2.4 per cent during 2000-2010. In Eastern Asia and in the Caucasus and Central Asia, the rate of reduction has accelerated by 59 and 45 per cent, respectively.
Despite determined progress, an increasing proportion of child deaths are in sub-Saharan Africa
As some of the developing regions forge ahead, under-five deaths in sub-Saharan Africa and Southern Asia form a larger share of the world total. The 6.2 million child deaths in these two regions in 2010 corresponded to 82 percent of such deaths on a global scale. On the positive side, 14 of 66 countries with at least 40 under-five deaths per 1,000 live births in 2010 had cut their under-five mortality rate in half or more since 1990. Timor-Leste, Bangladesh, Nepal, the Lao People’s Democratic Republic, Madagascar and Bhutan recorded declines of at least 60 percent, or more than 4.5 percent a year on average. In Niger, Malawi, Liberia, Timor-Leste and Sierra Leone deaths per 1,000 live births were brought down by more than 100 during this period. Nine of these high achievers are from sub-Saharan Africa and Southern Asia, indicating that substantial progress in these regions is possible.
Progress has not reached infants in the first month of life as surely as for under-five year olds in general
As the rate of under-five deaths overall declines, the proportion that occurs during the neonatal period—the first month after birth—is increasing.
Over the last two decades, almost all regions have seen slower declines in neonatal mortality than in under-five mortality. Globally, deaths within the first month of life fell from 32 per 1,000 live births in 1990 to 23 in 2010. This works out to an average annual decline of 1.7 percent a year—much slower than the 2.2 per cent per year reduction for under-five mortality, or than the 2.3 per cent drop in maternal mortality, over the same 20-year period.
Consequently, the share of neonatal deaths among under-five deaths worldwide has grown from about 37 percent in 1990 to slightly above 40 percent in 2010. This trend is expected to continue as under-five mortality declines. Eastern Asia, for instance, has moved so quickly in cutting under-five mortality rates overall, that neonatal deaths constituted a 57 percent share by 2010. In Southern Asia, neonatal deaths account for 50 percent of under-five deaths.
Sub-Saharan Africa suffers a higher neonatal mortality rate (35 deaths per 1,000 live births in 2010) than any other region, and has recorded the least improvement over the last two decades. Neonatal health will need to be addressed more effectively if progress in these two regions on overall child mortality is to continue at a rapid rate.

28 | the millennium development Goals RepoRt 2012
Mortality is more likely to strike children in rural areas
Ratio of rural to urban under-five mortality rates, 2000/2010
0 1 3
Latin America & the Caribbean
Southern Asia
Developing regions
Caucasus & Central Asia
Sub-Saharan Africa
Northern Africa & Western Asia
Eastern Asia (excluding China) & South-Eastern Asia
Higher mortalityin urban areas
Higher mortality in rural areasEqual
1.6
1.4
1.4
1.4
1.7
1.8
2.1
Note: Analysis is based on 82 developing countries with data on under-five mortality rate by residence, accounting for 75 percent of total births in developing countries in 2010.
According to household survey data from 82 countries, children from rural areas in developing regions are at a disadvantage in terms of living beyond their fifth year. Rural–urban disparities are the most pronounced in Northern Africa and Western Asia, Eastern and South-Eastern Asia (excluding China) and in Latin America and the Caribbean, where overall child mortality is quite low.
Children born into poverty are almost twice as likely to die before the age of five as those from wealthier families
Ratio of under-five mortality rate for children from the poorest 20 per cent of households to children from the richest 20 per cent, 2000/2010
0 1 3
Higher mortalityamong the richest20%
Higher mortality among the poorest 20%
Equal
1.8
1.7
1.7
2.1
2.3
2.7
2.8
Eastern Asia (excluding China) & South-Eastern Asia
Northern Africa & Western Asia
Developing regions
Caucasus & Central Asia
Sub-Saharan Africa
Latin America & the Caribbean
Southern Asia
Note: Analysis is based on 73 developing countries with data on under-five mortality rate by household’s wealth quintile, accounting for 71percent of total births in developing countries in 2010.
Children from the poorest 20 per cent of households also face steeper odds in surviving their first five years of life; in the developing regions as a whole, they are nearly twice as likely to die before their fifth birthday as children in the richest 20 per cent of households.
Mothers’ access to education is a survival factor for under-fives
1.52.7
1.42.0
1.32.1
1.52.3
1.63.3
1.93.3
Southern Asia
Eastern Asia (excluding China) & South-Eastern Asia
Developing regions
Sub-Saharan Africa
Northern Africa & Western Asia
Latin America & the Caribbean
Children of mothers with no education compared to children of mothers with secondary or higher education
Children of mothers with no education compared to children ofmothers with primary education
Note: Analysis is based on 78 developing countries with data on under-five mortality rates by mother's education, accounting for 75 percent of total births in developing countries in 2010.
Ratio of under-five mortality rate of children of mothers with no education to that of children of mothers with secondary or higher education, and of children of mothers with no education to children of mothers with primary education, 2000/2010
0 1 2 3 4
Higher mortalityamong childrenof educated mothers
Higher mortality among children of less educated mothersEqual
Mothers’ education remains a powerful determinant of inequity. Children of educated mothers—even mothers with only primary schooling—are more likely to survive than children of mothers with no education.
It is possible to speed up the decline in under-five mortality by expanding interventions that target the main factors. Along with ensuring education, empowering women, removing financial and social barriers to accessing basic services, making critical services more available to the
Goal 4: Reduce child moRtalit y | 29
poor and improving health system accountability are policy measures that improve equity. An equity-focused approach brings greatly improved returns on investment by averting far more child deaths and episodes of undernutrition, and by expanding key primary health and nutrition interventions.
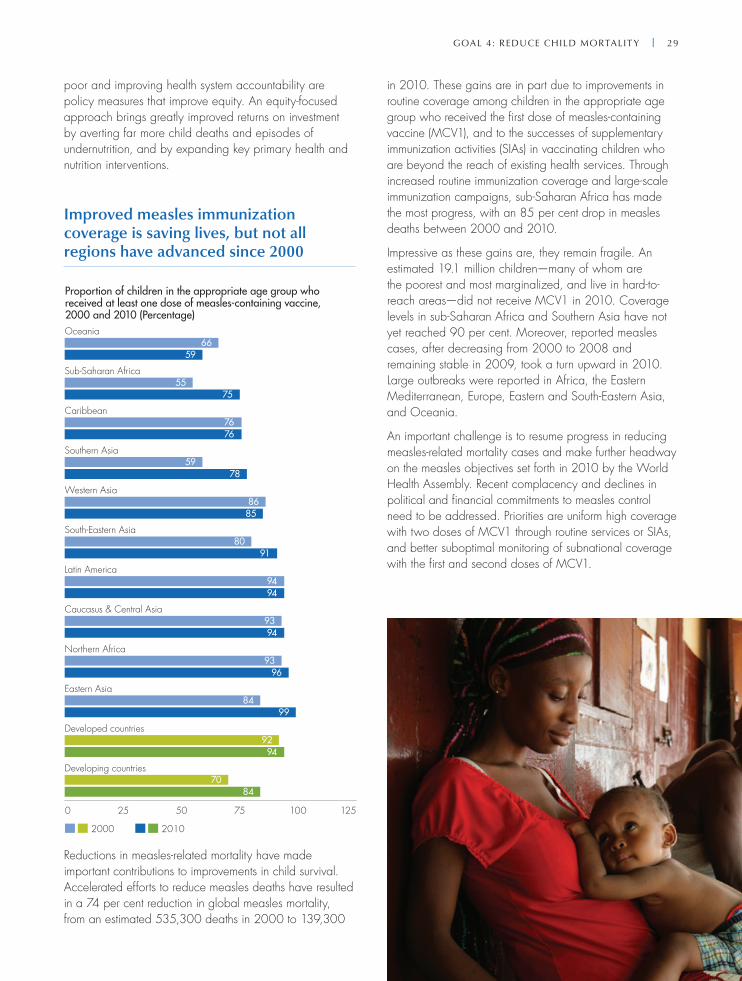
Improved measles immunization coverage is saving lives, but not all regions have advanced since 2000
Proportion of children in the appropriate age group who received at least one dose of measles-containing vaccine, 2000 and 2010 (Percentage)
8470
9492
9984
9693
9493
9494
9180
8586
7859
7676
7555
5966
0 25 50 75 100 125
Developing countries
Developed countries
Eastern Asia
Northern Africa
Caucasus & Central Asia
Latin America
South-Eastern Asia
Western Asia
Southern Asia
Caribbean
Sub-Saharan Africa
Oceania
2000 2010
Reductions in measles-related mortality have made important contributions to improvements in child survival. Accelerated efforts to reduce measles deaths have resulted in a 74 per cent reduction in global measles mortality, from an estimated 535,300 deaths in 2000 to 139,300
in 2010. These gains are in part due to improvements in routine coverage among children in the appropriate age group who received the first dose of measles-containing vaccine (MCV1), and to the successes of supplementary immunization activities (SIAs) in vaccinating children who are beyond the reach of existing health services. Through increased routine immunization coverage and large-scale immunization campaigns, sub-Saharan Africa has made the most progress, with an 85 per cent drop in measles deaths between 2000 and 2010.
Impressive as these gains are, they remain fragile. An estimated 19.1 million children—many of whom are the poorest and most marginalized, and live in hard-to-reach areas—did not receive MCV1 in 2010. Coverage levels in sub-Saharan Africa and Southern Asia have not yet reached 90 per cent. Moreover, reported measles cases, after decreasing from 2000 to 2008 and remaining stable in 2009, took a turn upward in 2010. Large outbreaks were reported in Africa, the Eastern Mediterranean, Europe, Eastern and South-Eastern Asia, and Oceania.
An important challenge is to resume progress in reducing measles-related mortality cases and make further headway on the measles objectives set forth in 2010 by the World Health Assembly. Recent complacency and declines in political and financial commitments to measles control need to be addressed. Priorities are uniform high coverage with two doses of MCV1 through routine services or SIAs, and better suboptimal monitoring of subnational coverage with the first and second doses of MCV1.

Goal 5Improve maternal health
TarGeTReduce by three quarters, between 1990 and 2015, the maternal mortality ratio
Maternal mortality has nearly halved since 1990, but levels are far removed from the 2015 target
Maternal mortality ratio, 1990, 2000 and 2010 (Maternal deaths per 100 000 live births, women aged 15-49)
161726
240350
440
3761
120
466271
71110
170
7296
130
78120
230
150240
410
190220
280
200260
320
220400
590
500740
850
0 100 200 300 400 500 600 700 800 900
Developed regions
Developing regions
Eastern Asia
Caucasus & Central Asia
Western Asia
Latin America
Northern Africa
South-Eastern Asia
Caribbean
Oceania
Southern Asia
Sub-Saharan Africa
1990 2000 2010 Target

Goal 5: Improve maternal health | 31
An estimated 287,000 maternal deaths occurred in 2010 worldwide, a decline of 47 per cent from 1990. Sub-Saharan Africa (with 56 per cent of these deaths) and Southern Asia (29 per cent) together accounted for 85 per cent of the global burden in 2010, with 245,000 maternal deaths between them. The number of maternal deaths per 100,000 live births—the maternal mortality ratio, or MMR—was also down, from 440 in 1990 to 240 in 2010, for the developing regions as a whole.
But the MMR in developing regions was still 15 times higher than in the developed regions. At the high end, sub-Saharan Africa had an MMR of 500. At the other end of the scale in developing regions, Eastern Asia had the lowest level, at 37 deaths per 100,000 live births. Sub-Saharan Africa also had the largest proportion of maternal deaths attributed to HIV, at 10 per cent, with the Caribbean subregion close behind at 6 per cent. Of the 19,000 worldwide deaths formally referred to as “AIDS-related indirect maternal deaths”, 17,000 (91 per cent) were in sub-Saharan Africa.
Nearly two thirds of deliveries in the developing world are attended by skilled health personnel
Proportion of deliveries attended by skilled health personnel, 1990, 2000 and 2010 (Percentage)
1990 2000 2010
6559
55
9997
94
9283
75
8471
51
7568
59
7465
48
707070
4936
30
4544
42
0 10 20 30 40 50 60 70 80 90 100
Developing regions
Eastern Asia
Latin America
Northern Africa
Western Asia
South-Eastern Asia
Caribbean
Southern Asia
Sub-Saharan Africa
A skilled health professional (doctor, nurse or midwife) can administer interventions to prevent and manage life-threatening complications such as heavy bleeding, or refer the patient to a higher level of care when needed. In developing regions overall, the proportion of deliveries attended by skilled health personnel rose from 55 per cent in 1990 to 65 per cent in 2010.
The regions with the highest maternal mortality, sub-Saharan Africa and Southern Asia, are also those with the lowest coverage of births attended by skilled health personnel—less than half. In some regions that are approaching high levels of coverage, such as South-Eastern Asia and Northern Africa, progress has slowed during 2000-2010, compared with the previous decade. Southern Asia stands out, on the other hand, for an acceleration of skilled birth attendant coverage since 2000.

32 | the mIllennIum Development Goals report 2012
Antenatal care for pregnant women is up across all developing regions
Proportion of women aged 15-49 attended at least once by skilled health personnel during pregnancy, 1990, 2000 and 2010 (Percentage)
1990 2000 2010
8071
63
9690
72
9390
79
9289
70
9288
85
7962
54
7763
53
7771
69
7154
53
0 10 20 30 40 50 60 70 80 90 100
Developing regions
Latin America
South-Eastern Asia
Eastern Asia
Caribbean
Northern Africa
Western Asia
Sub-Saharan Africa
Southern Asia
Antenatal care is also among the interventions that can reduce maternal mortality and morbidity. The antenatal period is critically important for reaching women with interventions and information that promote health, well-being and survival of mothers as well as their babies. Coverage—at least one visit with a doctor, nurse or midwife—has progressively increased in developing regions from 63 per cent in 1990 to 71 per cent in 2000, and then to 80 per cent in 2010.
Encouragingly, the rate of care accelerated in the recent decade in Southern Asia, Northern Africa and Western Asia. In South-Eastern Asia, Eastern Asia, and Latin America, where a high rate of coverage of about 90 per cent had already been achieved by 2000, progress slowed.
Southern Africa leads all other African sub-regions in maternal care
Proportion of women in Africa aged 15-49 attended at least once by skilled health personnel during pregnancy, 1990, 2000 and 2010 (Percentage)
1990 2000 2010
9491
90
8273
77
7161
58
6766
58
0 20 40 60 80 100
Southern Africa
Central Africa
North Africa
West Africa
Note: Regions are according to the ECA classification. Data were insufficient to calculate regional estimates for East Africa.
The African region presents large intra-regional disparities in terms of coverage of basic maternal health interventions like antenatal care. While Southern Africa reported almost universal coverage in 2010, in West Africa about one third of pregnant women did not receive antenatal care visits.

Goal 5: Improve maternal health | 33
More pregnant women are receiving care with the recommended frequency, but gaps still exist in regions most in need
Proportion of women aged 15-49 attended four or more times by any provider during pregnancy, 1990, 2000 and 2010 (Percentage)
5543
37
8982
71
8070
54
7266
59
6637
23
4827
24
4648
50
0 20 40 60 80 100
Developing regions
Latin America
South-Eastern Asia
Caribbean
Northern Africa
Southern Asia
Sub-Saharan Africa
1990 2000 2010
The World Health Organization (WHO) recommends a minimum of four visits for antenatal care, including, at a minimum, screening and treatment for infections and identification of warning signs during pregnancy. Across most developing regions, there has been steady progress in such coverage, with an acceleration in Northern Africa and Southern Asia since 2000.
Despite this progress, in 2010 almost half of pregnant women in the developing regions still did not have the recommended number of visits. And in sub-Saharan Africa, the proportion with enough visits has actually fallen since 1990. Data on numbers of visits do not reflect the critical factor of quality of care, which is difficult to measure.

34 | the mIllennIum Development Goals report 2012
Fewer teens are having children in most regions, but progress has slowed
Number of births per 1,000 women aged 15-19, 1990, 2000 and 2009
1990 2000 2009
6455
52
3426
23
1566
4333
29
442829
5440
45
8858
46
6350
48
8465
62
8078
69
9188
80
126122
120
0 20 40 60 80 100 120 140
Developing regions
Developed regions
Eastern Asia
Northern Africa
Caucasus & Central Asia
South-Eastern Asia
Southern Asia
Western Asia
Oceania
Caribbean
Latin America
Sub-Saharan Africa
Very early childbearing brings with it heightened health risks for mothers and their infants. Early childbearing is also linked to outcomes such as lower educational attainment and poverty. In all developing regions, the number of births per 1,000 women aged 15 to 19 years decreased between 1990 and 2000. Since that time, the rate of decline has slowed or even reversed in most regions.
Sub-Saharan Africa continues to have the highest birth rate among adolescents (120 births per 1,000 adolescent women), with little progress since 1990. In Latin America and the Caribbean, the adolescent birth rate remains high and only recently began to decline.
In countries where marriage at a young age is relatively common, developing and implementing culturally sensitive programmes to delay the age at marriage and enacting and enforcing laws concerning a minimum age for marriage could assist in further reducing adolescent childbearing.

Goal 5: Improve maternal health | 35
The large increase in contraceptive use in the 1990s was not matched in the 2000s
Proportion of women who are using any method of contraception among women aged 15-49, married or in union, 1990, 2000 and 2010 (Percentage)
1990 2000 2010
6260
52
7271
68
8486
78
6357
48
6258
44
6159
53
6059
49
5851
44
5648
39
3832
28
2518
12
0 10 20 30 40 50 60 70 80 90
Developing regions
Developed regions
Eastern Asia
Latin America
South-Eastern Asia
Northern Africa
Caribbean
Caucasus & Central Asia
Western Asia
Southern Asia
Oceania
Sub-Saharan Africa
74
6271
Increased access to safe, affordable and effective methods of contraception has provided individuals with greater choice and opportunities for responsible decision-making in reproductive matters. Contraceptive use has also contributed to improvements in maternal and infant health by serving to prevent unintended or closely spaced pregnancies. Use increased rapidly from 1990 to 2000 in many regions, but since then the pace of progress has tended to slow.
More than half of all women aged 15 to 49 who were married or in a union were using some form of contraception in 2010 in all regions except sub-Saharan Africa and Oceania. Women in sub-Saharan Africa had the lowest level of contraceptive prevalence, and their 2010 level of 25 per cent is even below that of other regions in 1990. However, there is wide variation in contraceptive use within the region, with a rapid increase in some countries and minimal change in others. The coming challenge to family planning programmes and health services is the growing number of women of reproductive age in this region.
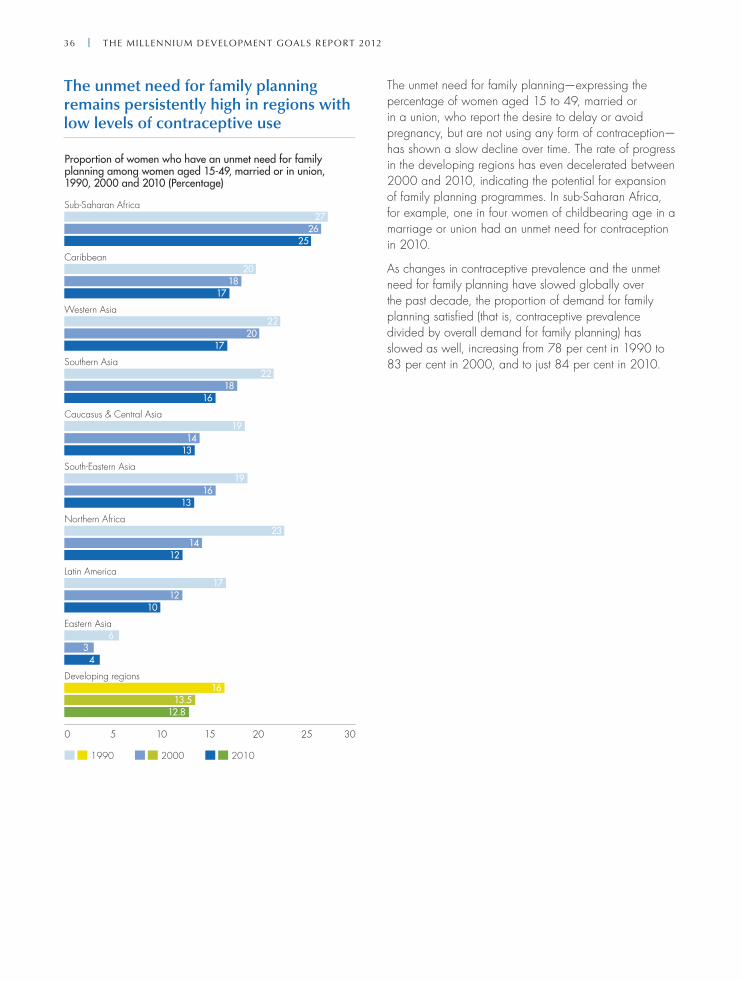
36 | the mIllennIum Development Goals report 2012
The unmet need for family planning remains persistently high in regions with low levels of contraceptive use
Proportion of women who have an unmet need for family planning among women aged 15-49, married or in union, 1990, 2000 and 2010 (Percentage)
1990 2000 2010
12.813.5
16
43
6
1012
17
1214
23
1316
19
1314
19
1618
22
1720
22
1718
20
2526
27
0 5 10 15 20 25 30
Developing regions
Eastern Asia
Latin America
Northern Africa
South-Eastern Asia
Caucasus & Central Asia
Southern Asia
Western Asia
Caribbean
Sub-Saharan Africa
The unmet need for family planning—expressing the percentage of women aged 15 to 49, married or in a union, who report the desire to delay or avoid pregnancy, but are not using any form of contraception—has shown a slow decline over time. The rate of progress in the developing regions has even decelerated between 2000 and 2010, indicating the potential for expansion of family planning programmes. In sub-Saharan Africa, for example, one in four women of childbearing age in a marriage or union had an unmet need for contraception in 2010.
As changes in contraceptive prevalence and the unmet need for family planning have slowed globally over the past decade, the proportion of demand for family planning satisfied (that is, contraceptive prevalence divided by overall demand for family planning) has slowed as well, increasing from 78 per cent in 1990 to 83 per cent in 2000, and to just 84 per cent in 2010.

Goal 5: Improve maternal health | 37
Aid to reproductive health care and family planning remains low
Official development assistance to health, total (constant 2010 US$ millions) and proportion going to reproductive health care and family planning, 2000-2010 (Percentage)
6,554 6,338
7,716
9,701 10,030
12,500
15,427
16,872
18,066
20,002
18,660
0
5,000
10,000
15,000
20,000
2000 2001 2002 2003 2004 2005 2006 2007 2008 2009 2010
Millions
0
10
20
30
40
50
PercentageTotal aid to health (constant 2010 USD millions)Aid to reproductive health care (percentage)
Aid to family planning (percentage)
8.4
5.7
10.7
6.1 6.5 5.1
8.57.0 7.6
5.7 6.2
11.5
5.6
3.21.0 1.8 1.3
3.2 3.3 2.5 3.2
9.3
Funding for family planning services and supplies is key to closing the gap in meeting the demand for contraception. Yet aid for family planning as a proportion of total aid for health declined over the past decade, with only a small resurgence between 2009 and 2010, from 2.5 to 3.2 per cent of total aid for health. Funding necessary to meet
the demand for contraceptives is especially relevant, given the growing number of reproductive age women and of those wishing to use contraceptives in the developing regions.

Goal 6Combat HIV/AIDS, malaria and other diseases
TArGeTHave halted by 2015 and begun to reverse the spread of HIV/AIDS
New HIV infections continue to decline in the hardest-hit regions
< 0.01
0.02
0.41
< 0.01
0.02
0.59
1.08
0.07
0.04
0.01
0.02
0.03
0.03
0.03
0.05
0.37
0.29
0.30
1.92
0.34
0.09
0.04
0.01
0.03
0.01
0.04
0.03
0.09
0.54
0.33
0 0.5 1.0 1.5 2.0 2.5
Developing regions
Developed regions
Western Asia
Eastern Asia
Southern Asia
Caucasus & Central Asia
Latin America
South-Eastern Asia & Oceania
Caribbean
Central Africa*
Eastern Africa*
North Africa*
Southern Africa*
West Africa*
Sub-Saharan Africa
HIV incidence rates (Estimated number of new HIV infections per year per 100 people aged 15-49), 2001 and 2010
2001 2010 Range of estimates
* The composition of the five subregions in Africa is shown on page 67 in the section on regional groupings.

Goal 6: Combat HIV/aIDS, malarIa anD otHer DISeaSeS | 39
Fewer people are becoming infected with HIV, with the decline in new infections happening faster in some countries than in others.
Of the 33 countries where new infections have fallen, 22 are in sub-Saharan Africa, the region most affected by the AIDS epidemic. Annual new infections in 2010—2.7 million people, 390,000 of whom were children—were 21 per cent lower than the 1997 peak and 15 per cent lower than in 2001.
Sub-Saharan Africa accounted for 70 per cent of new HIV infections in 2010, while it is home to just 12 per cent of the global population. However, the rate varies widely within the region, as the epidemic continues to be most
severe in Southern Africa. The main route of transmission in sub-Saharan Africa is heterosexual transmission.
The Caribbean has the second highest regional HIV incidence, although the growth of the epidemic has slowed considerably since the mid-1990s.
HIV incidence and prevalence is substantially lower in Asia than in some other regions. But the absolute size of the Asian population means it has the second largest number of people living with HIV.
In contrast to other regions, new HIV infections continue to grow in the Caucasus and Central Asia. Injecting drug use remains the leading cause.
More people than ever are living with HIV due to fewer AIDS-related deaths and the continued large number of new infections
910
12
14
16
19
21
2325
2627
2930
31 31 31 32 32 33 34
30
0.0
0.5
1.0
1.5
2.0
2.5
3.0
3.5
4.0
1990
People newly infected with HIV and number of deaths due to AIDS (Millions)
0
5
10
15
20
25
30
35
40
People living with HIV (Millions)
Number of people living with HIV Number of people newly infected with HIV Number of deaths due to AIDS
1991 1992 1993 1994 1995 1996 1997 1998 1999 2000 2001 2002 2003 2004 2005 2006 2007 2008 2009 2010
Number of people living with HIV, number of people newly infected with HIV and number of AIDS deaths in the world (Millions), 1990-2010
Range of estimates
At the end of 2010, an estimated 34 million were living with HIV, up 17 per cent from 2001. This persistent increase reflects the continued large number of new infections along with a significant expansion of access to life-saving antiretroviral therapy, especially in more recent years.
The proportion of women living with HIV has remained stable at 50 per cent globally, although women are disproportionally affected in sub-Saharan Africa (59 per
cent of all people living with HIV) and in the Caribbean (53 per cent).
The number of people dying of AIDS-related causes fell to 1.8 million in 2010, down from a peak of 2.2 million in the mid-2000s. A total of 2.5 million deaths have been averted in low- and middle-income countries since 1995 due to the introduction of antiretroviral therapy.

40 | tHe mIllennIum DeVelopment GoalS report 2012
Comprehensive knowledge of HIV transmission remains low among young people, along with condom use
22
2010 4030 50 7060 80
Zimbabwe
Kenya
Malawi
Lesotho
United Republic of Tanzania
Zambia
Mozambique
Cameroon
Uganda
Ghana
Nigeria
33
2834
3238
3234
3634
3841
3942
3929
4242
4855
5346
0
Percentage of women and men age 15-24 with comprehensive knowledge of HIV transmission, selected countries, 2005/2010
Women Men
Levels of access to HIV testing in the region also remain low, particularly among young men. For this group there is no entry point comparable to maternal health programmes for young women, which provide testing and services for the prevention of mother-to-child transmission. In nine of the 11 countries considered, fewer than 20 per cent of men were tested.
Several recent media campaigns have demonstrated the potential of reaching large numbers of adolescents with HIV prevention messages to increase knowledge and to change behaviour. Such campaigns are especially
Comprehensive, correct knowledge of HIV and AIDS is fundamental to the uptake of HIV services and to behavioural change. Yet such knowledge remains low in sub-Saharan Africa, at 26 per cent among young women and 35 per cent among young men (aged 15-24). In eight of 11 countries with the highest numbers of new infections in the region, there was a reported condom-use rate of 45 per cent or greater among men. This relatively widespread use contrasts with low knowledge levels among both young men and young women in the same countries. Condom use remains low among young women in most countries. The limited condom use may be linked with restrictions on availability. In sub-Saharan Africa, only eight condoms are available per adult male per year.
29
20 40 60
Cameroon
Malawi
Lesotho
Ghana
Zambia
Uganda
Zimbabwe
Kenya
Mozambique
United Republic of Tanzania
Nigeria
56
3236
3337
3767
3859
3945
4243
4361
4660
4846
6856
0
Condom use among women and men 15-24 reporting multiple sexual partners*, selected countries, 2005/2010 (Percentage)
10 30 50 8070
*Percentage of young women and men 15-24 who had more than one partner in the past 12 months and who reported the use of a condom during their last sexual intercourse.
Women Men

Goal 6: Combat HIV/aIDS, malarIa anD otHer DISeaSeS | 41
effective if the messages are complemented with sexuality education and other communication content used with adolescents.
In Kenya and Zambia, a television drama told the stories of several friends as they navigated the turbulent waters of life, love and HIV in a Nairobi university setting. An evaluation found that 60 per cent of young people in Nairobi watched the drama, and 90 per cent of viewers reported changes in their thinking on HIV testing, concurrent relationships and stigma. The airing of a TV drama in Trinidad and Tobago also produced positive effects. In Ukraine, 1 million people tuned in to the December 2009 television debut of a film focusing on young people and their futures in a context of risky behaviour and drug use. An evaluation showed that 42 per cent of viewers intended to discuss the drama with friends, and that messages around unsafe sex were transmitted clearly.
Technological innovations designed to improve HIV services and to transmit information are particularly suited to young people, many of them connected through cell phones, the Internet and television.
Inequalities in access to education between orphans and non-orphans are narrowing
In 2009, about 17.1 million children around the world were estimated to have lost one or both parents to AIDS; 15.0 million of these children lived in sub-Saharan Africa.
Over the last three decades, there has been growing interest and investment in protection, care and support for children affected by HIV/AIDS. National monitoring data show that these investments are paying off. Most countries in sub-Saharan Africa have made significant progress towards near parity in school attendance for orphans and non-orphans 10-14 years of age.
TArGeTAchieve, by 2010, universal access to treatment for HIV/AIDS for all those who need it
Treatment for HIV grew at a record pace in 2010, but fell short of the MDG6 target
Number of people receiving antiretroviral therapy (Millions), 2002-2010, and number of deaths due to AIDS-related causes (Millions), 2000-2010
Number of people receiving antiretroviral therapyNumber of deaths from AIDS-related causes
0
1
2
3
4
5
6
7
2000 2001 2002 2003 2004 2005 2006 2007 2008 2009 2010
At the end of 2010, 6.5 million people were receiving antiretroviral therapy for HIV or AIDS in developing regions. Although this represents an increase of over 1.4 million people from December 2009, the largest one-year increase ever, the 2010 target of universal access was largely missed.
Between 2008 and 2010, about 1.3 million new people were enrolled and retained on antiretroviral therapy. At this rate, less than 14 million people will be receiving antiretroviral therapy at the end of 2015, over one million short of the target agreed at the United Nations High-level Meeting on HIV/AIDS, held in June 2011. In the current economic context, reaching the 15 million target is likely to depend on increasing the efficiency and efficacy of the global HIV response.

42 | tHe mIllennIum DeVelopment GoalS report 2012
Access to treatment for people living with HIV expands in all but one region
66.2
2024
2126
2332
2633
4049
4853
6063
65.8
40
0 70 80605040302010 90
48
Developing regions
Western Asia
Eastern Asia
Southern Asia
Caucasus & Central Asia
Latin America & the Caribbean
South-Eastern Asia & Oceania
Northern Africa
Sub-Saharan Africa
Proportion of people living with HIV who are receiving antiretroviral therapy*, 2009 and 2010 (Percentage)
* Antiretroviral therapy coverage is measured among people living with HIV with a CD4 cell count at or below 350 cells/mm3.
2009 2010 Range of estimates
The share of people living with HIV receiving antiretroviral therapy in developing regions continued to increase in 2010, rising to 48 per cent of the 13.7 million people estimated to need treatment, up from 40 per cent in 2009. The largest gain in coverage, by 38 per cent, came in Eastern Asia. In sub-Saharan Africa, by contrast, treatment expanded by only 20 per cent. More than 50 per cent of eligible people in sub-Saharan Africa still are not receiving antiretroviral therapy.
Ten countries, including three with generalized epidemics (Botswana, Namibia and Rwanda), have already attained universal access to antiretroviral therapy (defined as coverage of at least 80 per cent of the population in need).
Antiretroviral therapy coverage varies by sex and age. In 2010, coverage was higher among women (53 per cent) than among men (40 per cent). And coverage among children in developing regions was lower than among adults. About 450,000 children under age 15
were receiving antiretroviral therapy at the end of 2010, up from 350,000 at the end of 2009. These children represented an estimated 22 per cent of all children under 15 who needed treatment in developing regions, up from 21 per cent in 2009.
Without treatment, approximately one third of children born to women living with HIV will become infected in the womb, at birth or through breastfeeding. The risk can be greatly reduced by treating an expectant mother with antiretroviral medicine. In 2010, an estimated 48 per cent of pregnant women living with HIV in developing regions received the most effective antiretroviral regimens—which do not include single-dose nevirapine. Sub-Saharan Africa is home to about 92 per cent of the 1.5 million pregnant women who are in need of treatment each year.
TArGeTHave halted by 2015 and begun to reverse the incidence of malaria and other major diseases
Significant and durable progress against malaria is underway
Coverage of at-risk populations with malaria prevention and control measures continues to increase, bringing about a further decline in estimated numbers of malaria cases and deaths. The malaria map continues to shrink, and in 2011 one more country—Armenia—was certified to be free of malaria.
Reductions in reported malaria cases of more than 50 per cent have been recorded between 2000 and 2010 in 43 of the 99 countries with ongoing malaria transmission. Downward trends of 25 to 50 per cent were achieved in 8 more countries. There were an estimated 216 million episodes of malaria in 2010, of which approximately 81 per cent, or 174 million cases, were in Africa. An estimated 655,000 malaria deaths occurred in 2010, of which 91 per cent were in Africa and 86 per cent were children under 5 years of age. The estimated incidence of malaria globally has decreased by 17 per cent since 2000, and malaria-specific mortality rates by 25 per cent. Although these rates of decline were not sufficient to meet the internationally agreed targets for 2010 of a 50 per cent reduction, they nonetheless represent a major achievement.
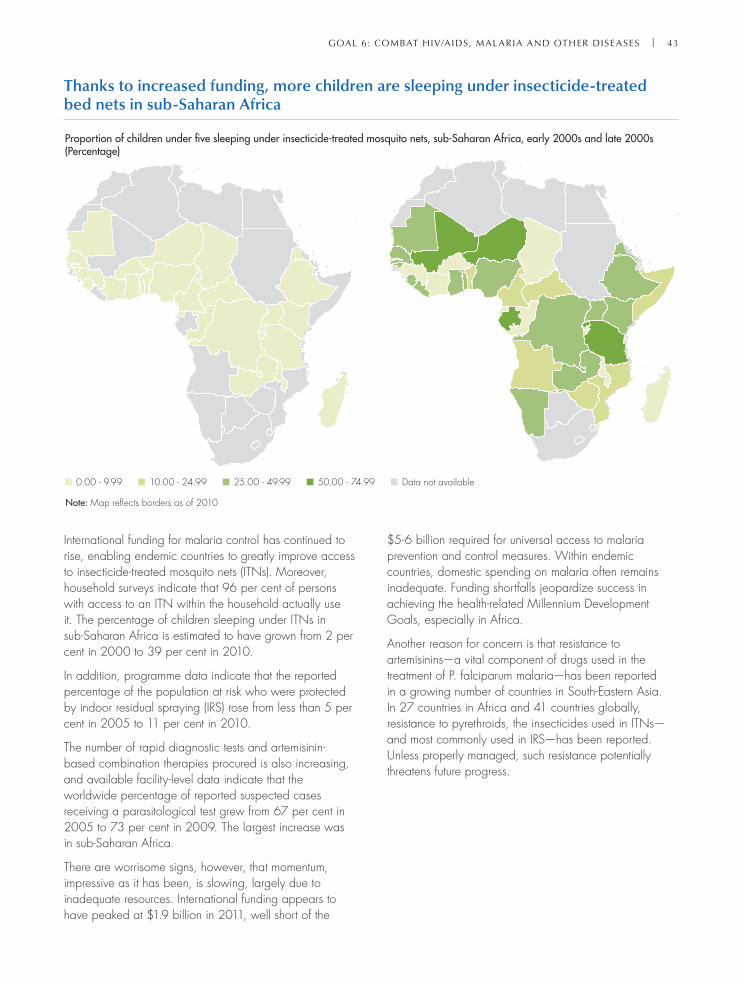
Goal 6: Combat HIV/aIDS, malarIa anD otHer DISeaSeS | 43
Thanks to increased funding, more children are sleeping under insecticide-treated bed nets in sub-Saharan Africa
Proportion of children under five sleeping under insecticide-treated mosquito nets, sub-Saharan Africa, early 2000s and late 2000s(Percentage)
0.00 - 9.99 10.00 - 24.99 25.00 - 49.99 50.00 - 74.99
Note: Map reflects borders as of 2010
Data not available
International funding for malaria control has continued to rise, enabling endemic countries to greatly improve access to insecticide-treated mosquito nets (ITNs). Moreover, household surveys indicate that 96 per cent of persons with access to an ITN within the household actually use it. The percentage of children sleeping under ITNs in sub-Saharan Africa is estimated to have grown from 2 per cent in 2000 to 39 per cent in 2010.
In addition, programme data indicate that the reported percentage of the population at risk who were protected by indoor residual spraying (IRS) rose from less than 5 per cent in 2005 to 11 per cent in 2010.
The number of rapid diagnostic tests and artemisinin-based combination therapies procured is also increasing, and available facility-level data indicate that the worldwide percentage of reported suspected cases receiving a parasitological test grew from 67 per cent in 2005 to 73 per cent in 2009. The largest increase was in sub-Saharan Africa.
There are worrisome signs, however, that momentum, impressive as it has been, is slowing, largely due to inadequate resources. International funding appears to have peaked at $1.9 billion in 2011, well short of the
$5-6 billion required for universal access to malaria prevention and control measures. Within endemic countries, domestic spending on malaria often remains inadequate. Funding shortfalls jeopardize success in achieving the health-related Millennium Development Goals, especially in Africa.
Another reason for concern is that resistance to artemisinins—a vital component of drugs used in the treatment of P. falciparum malaria—has been reported in a growing number of countries in South-Eastern Asia. In 27 countries in Africa and 41 countries globally, resistance to pyrethroids, the insecticides used in ITNs—and most commonly used in IRS—has been reported. Unless properly managed, such resistance potentially threatens future progress.

44 | tHe mIllennIum DeVelopment GoalS report 2012
The tide has been turning in the spread of tuberculosis
Number of new tuberculosis cases per 100,000 population (Incidence) (including people who are HIV-positive), 1990, 2002 and 2010
0 50 150 200 250 300 350 400100
Developing regions
Western Asia
Eastern Asia
Southern Asia
Caucasus & Central Asia
Latin America & the Caribbean
South-Eastern Asia
Northern Africa
Sub-Saharan Africa
299
Oceania
Developed regions
218
276
233229231
235224
213
207206
184
116143
132
157105
83
645449
8857
43
5743
3833
27
174167
151
32
1990 2002 2010 Range of estimates
In 2010, there were 8.8 million people worldwide newly diagnosed with tuberculosis, including 1.1 million cases among people with HIV. Globally, incidence rates peaked at 141 per 100,000 people in 2002 and have been falling since then.
The absolute number of new cases has also started to fall, although very slowly. Since 2006, the decline in the incidence rate has been exceeding the rate of growth in the world’s population. If this trend is sustained, the world will achieve the target of halting the spread and beginning to reverse the incidence of the disease.
The anti-TB drive is closing in on a 50 per cent cut in the 1990 death rate
1990 2010 Range of estimates
Number of tuberculosis deaths per 100,000 population (excluding people who are HIV-positive), 1990 and 2010
0 10 20 30 40 50 60 70 80 90
Developing regions
Developed regions
Western Asia
Northern Africa
Latin America & the Caribbean
Eastern Asia
Caucasus & Central Asia
Sub-Saharan Africa
Southern Asia
South-Eastern Asia
Oceania
1830
48
58
420
3037
2742
2851
5633
2026
123
84
Mortality and prevalence rates for tuberculosis are falling in most regions. It is estimated that there were 1.4 million deaths from tuberculosis in 2010, including 350,000 of people with HIV. Current projections suggest that the Stop TB Partnership target of halving 1990 death rates by 2015 can be achieved at the global level and in several regions.
Trends in prevalence rates are more uncertain, but it is estimated that 12 million people were living with the disease in 2010.
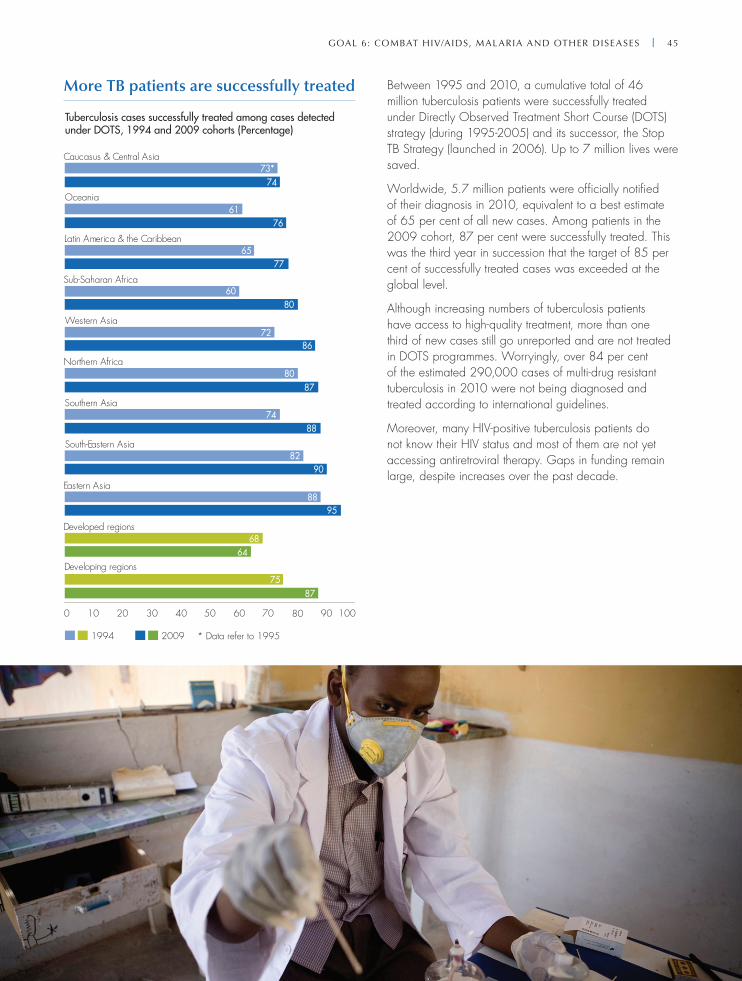
Goal 6: Combat HIV/aIDS, malarIa anD otHer DISeaSeS | 45
More TB patients are successfully treated
1994 2009
Western Asia
Northern Africa
Southern Asia
Sub-Saharan Africa
South-Eastern Asia
Latin America & the Caribbean
Eastern Asia
Oceania
Caucasus & Central Asia
Tuberculosis cases successfully treated among cases detected under DOTS, 1994 and 2009 cohorts (Percentage)
Developing regions
Developed regions
0 10 20 30 40 50 60 70 80 90
73*74
6176
6577
6080
7286
8087
7488
8290
8895
6864
7587
100
* Data refer to 1995
Between 1995 and 2010, a cumulative total of 46 million tuberculosis patients were successfully treated under Directly Observed Treatment Short Course (DOTS) strategy (during 1995-2005) and its successor, the Stop TB Strategy (launched in 2006). Up to 7 million lives were saved.
Worldwide, 5.7 million patients were officially notified of their diagnosis in 2010, equivalent to a best estimate of 65 per cent of all new cases. Among patients in the 2009 cohort, 87 per cent were successfully treated. This was the third year in succession that the target of 85 per cent of successfully treated cases was exceeded at the global level.
Although increasing numbers of tuberculosis patients have access to high-quality treatment, more than one third of new cases still go unreported and are not treated in DOTS programmes. Worryingly, over 84 per cent of the estimated 290,000 cases of multi-drug resistant tuberculosis in 2010 were not being diagnosed and treated according to international guidelines.
Moreover, many HIV-positive tuberculosis patients do not know their HIV status and most of them are not yet accessing antiretroviral therapy. Gaps in funding remain large, despite increases over the past decade.
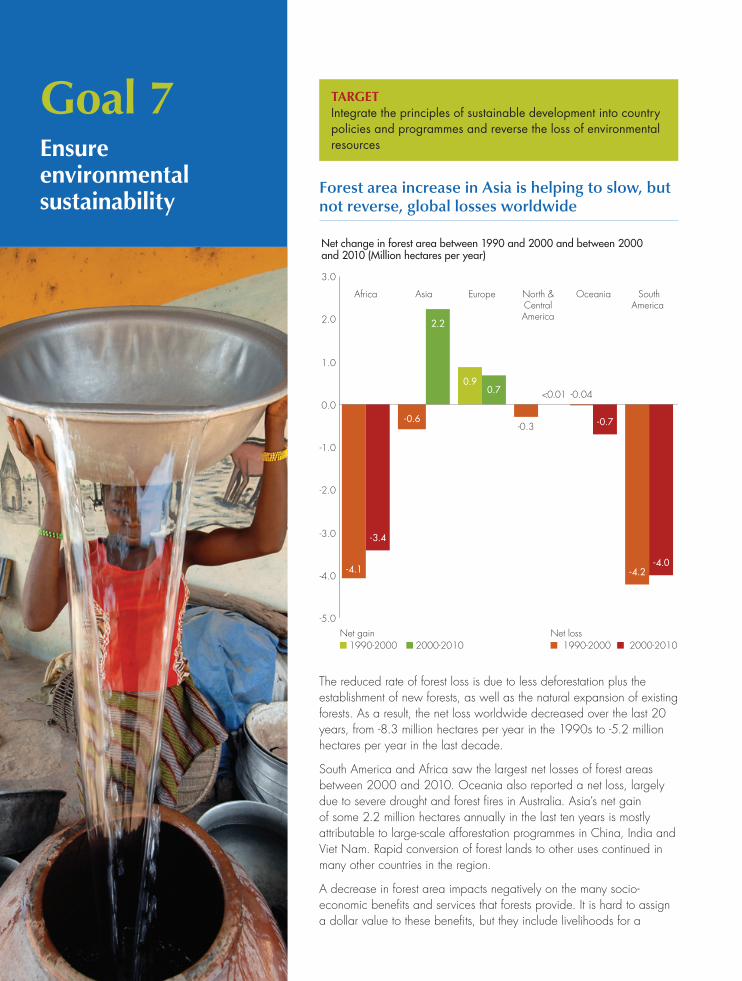
Goal 7 Ensure environmental sustainability
TarGETIntegrate the principles of sustainable development into country policies and programmes and reverse the loss of environmental resources
Forest area increase in Asia is helping to slow, but not reverse, global losses worldwide
Net change in forest area between 1990 and 2000 and between 2000and 2010 (Million hectares per year)
-4.1
-3.4
-4.1
-0.6
2.2
0.90.7 -0.04
-0.7
-4.2-4.0
<0.01
-0.3
-5.0
-4.0
-3.0
-2.0
-1.0
0.0
1.0
2.0
3.0
Africa Asia North &CentralAmerica
Oceania SouthAmerica
Europe
Net gain Net loss1990-2000 1990-20002000-2010 2000-2010
The reduced rate of forest loss is due to less deforestation plus the establishment of new forests, as well as the natural expansion of existing forests. As a result, the net loss worldwide decreased over the last 20 years, from -8.3 million hectares per year in the 1990s to -5.2 million hectares per year in the last decade.
South America and Africa saw the largest net losses of forest areas between 2000 and 2010. Oceania also reported a net loss, largely due to severe drought and forest fires in Australia. Asia’s net gain of some 2.2 million hectares annually in the last ten years is mostly attributable to large-scale afforestation programmes in China, India and Viet Nam. Rapid conversion of forest lands to other uses continued in many other countries in the region.
A decrease in forest area impacts negatively on the many socio-economic benefits and services that forests provide. It is hard to assign a dollar value to these benefits, but they include livelihoods for a

Goal 7: EnsurE EnvironmEntal sustainabilit y | 47
large proportion of the world’s population, especially in developing countries, and serve as economic safety nets in times of need. Globally, forest management and conservation provide employment for around 10 million people, and many more benefit directly or indirectly. Aside from timber, forests provide food, fodder, wild meat, medicinal plants and materials for utensils and construction. Research suggests that women in the developing world are integrally involved in the collection, processing, marketing and sale of these products.
The economic crisis pushes down global greenhouse gas emissions—slightly, and for the short-term
30.1
16.9
13.2
<0.01
0.5
0.5
0.7
1.2
1.3
1.6
2.8
8.3
30.2
16.1
14.1
<0.01
0.5
0.5
0.7
1.2
1.3
1.6
2.6
7.7
21.7
6.7
14.9
<0.01
0.5*
0.2
0.5
0.4
0.6
1.0
1.0
3.0
0.0 5.0 10.0 15.0 20.0 25.0 30.0 35.0
World
Developing regions
Developed regions
Oceania
Caucasus & Central Asia
Northern Africa
Sub-Saharan Africa
South-Eastern Asia
Western Asia
Latin America & the Caribbean
Southern Asia
Eastern Asia
1990 2008 2009
Emissions of carbon dioxide (CO2), 1990, 2008 and 2009 (Billions of metric tonnes)
*Data refer to 1992
Defying the long-term trend, carbon dioxide (CO2) emissions decreased globally—by 0.4 per cent, down from about 30.2 billion metric tons in 2008 to some

48 | thE millEnnium DEvElopmEnt Goals rEport 2012
30.1 billion metric tons in 2009. From 1990 through 2008, emissions had increased almost every year, with particularly high growth since 2002. But even with the unprecedented dip, 2009 emissions were still 39 per cent above the 1990 level.
The 2009 reduction is attributable to slowing economic activity during the global crisis. Emissions from developed regions were especially affected, falling by 7 per cent compared to 2008. In the developing regions as a whole, the emissions continued to increase, but at a lower rate than in previous years: by 5.4 per cent in 2009, compared with about 10 per cent in 2004 and in 2003. Overall, the decrease in the developed regions more than offset the increase in the developing regions.
Per capita emissions remained far higher in the developed regions, at 10 metric tons of CO2 per person in 2009 as against only 3 metric tons in the developing world and just 0.6 metric tons in sub-Saharan Africa. But, as in previous years, emissions per unit of economic output were higher in the developing regions—0.6 kilograms of CO2 per dollar of economic output, versus 0.37 kilograms in the developed regions.
In 2011, the international community made another step forward in enhancing the international climate change regime. At the United Nations Climate Change Conference in Durban, South Africa, it was agreed to take stronger action on controlling climate change–inducing greenhouse gas emissions. A process was launched to develop a protocol, another legal instrument or an agreed outcome with legal force under the Framework Convention and applicable to all Parties, which would come into effect and begin its implementation in 2020. The Conference also acknowledged the gap between the agreed reduction in emissions and the actual reduction needed for planetary well-being, underlying the need to further strengthen international action.
The small, crisis-driven decrease of global emissions in 2009 is clearly of a short-term nature and, once the global economy recovers, the emissions are likely to move upward again. Mitigating greenhouse gas emissions remains topical and urgent.
The successful implementation of the Montreal Protocol clears the way for extending control to more substances
Consumption of all ozone depleting substances (ODSs), 1986-2010 (Thousands of metric tons of ozone-depletingpotential)
0
200
400
600
800
1,000
1,200
1,400
1986 1990 1992 1994 1996 1998 2000 2002 2004 2006 2008 2010
Developing regions
Caucasus, Central Asia, Easternand South-Eastern Europe
Developed regions
The twenty-fifth anniversary of the Montreal Protocol on Substances that Deplete the Ozone Layer comes this year, 2012, with many achievements to celebrate. Most notably, there has been a reduction of over 98 per cent in the consumption of ozone-depleting substances. Further, because most of these substances are also potent greenhouse gases, the Montreal Protocol has contributed significantly to the protection of the global climate system.
The reductions achieved to date leave hydrochlorofluoro-carbons (HCFCs) as the largest group of substances remaining to be phased out. Given the Protocol’s successful track record, and status of universal ratification, Governments have been considering an amendment that would take on HFCs, a class of global warming chemicals that are often used as substitutes for certain ozone-depleting substances.
The parties to the Protocol are now hoping to achieve universal ratification of all of the Protocol’s amendments as well. Failure to ratify all of the amendments by the end of the year could lead to the imposition of trade sanctions on non-parties, which in turn would preclude them from procuring HCFCs needed for a measured, thoughtful phase-out.
For the other main categories of ozone-depleting substances, the phase-out period is winding down. Parties are now paying closer attention to several small classes of exempted uses, through better tracking or reporting, in order to identify and phase out uses that

Goal 7: EnsurE EnvironmEntal sustainabilit y | 49
have ozone-friendly alternatives. The Parties also continue to discuss environmentally safe management and the destruction of ozone-depleting substances, such as
those contained in obsolete stockpiles and in existing equipment.
TarGETReduce biodiversity loss, achieving, by 2010, a significant reduction in the rate of loss
Biodiversity is still being lost, even as more areas of the earth’s surface are protected
Growth in terrestrial areas protected, 1990-2010 (Percentage)
Under 1 1 - 10 10 - 100 Over 100 No data available
Growth in marine protected area (up to 12 nautical miles from land), 1990-2010 (Percentage)
Under 1 1 - 10 10 - 100 Over 100 No data availableNo marine area
By 2010, protected areas covered 12.7 per cent of the world’s land area, but such protection extended to only 1.6 per cent of the total ocean area.
Since 1990, protected areas have increased in number by 58 per cent, and in their extent by 48 per cent. But growth has varied widely across countries and territories. Terrestrial protection doubled between 1990 and 2010 in 59 of 228 countries with available data, and marine protection doubled in 86 of 172 countries with available
data. In contrast, growth of less than 1 per cent, or no growth at all, occurred in the terrestrial protected area system of 54 countries, and in the marine protected area system of 35 countries.
Despite their relatively small extent, marine protected areas have expanded at a faster pace than those on land. The extent of protection increased especially in costal waters out to 12 nautical miles—from 3.1 per cent in 1990 to 7.2 per cent in 2010.

50 | thE millEnnium DEvElopmEnt Goals rEport 2012
Conservation action is slowing the rate at which species are moving towards extinction
IUCN Red List Index of species survival (showing declines inpopulation and distribution as species move towards extinction),birds, observed and expected, 1988-2008
0.915
0.918
0.919
0.916
0.917
0.920
0.921
0.922
1988 1994 2000 2004 2008
Observed RLI for birdsExpected RLI for birds in the absence of conservation action
IUCN Red List Index of species survival (showing declinesin population and range as species move towards extinction),mammals, observed and expected, 1996-2008
0.850
0.854
0.856
0.852
0.858
0.860
0.862
1996 2008
Observed RLI for mammalsExpected RLI for mammals in the absence of conservation action
Note: A Red List Index value of 1.0 means that all species areclassified as ‘least concern’, and hence none are expected to goextinct in the near future. A value of zero indicates that all specieshave gone extinct.
The most important sites for species conservation remain unprotected
Proportion of key biodiversity areas completely coveredby protected areas, 1990-2007 (Percentage)
0
10
20
30
40
50
1990 1992 1994 1996 1998 2000 2002 2004 2007
Important Bird Areas Alliance for Zero Extinction sites
Note: Data refer to 10,993 Important Bird Areas and 588 Alliancefor Zero Extinction sites.
New research has confirmed that appropriately located protected areas can reduce declines in status of species. But despite an increase in these areas, half of the world’s most important terrestrial sites for species conservation remain unprotected. There are, for example, 588 Alliance for Zero Extinction sites (AZEs), supporting the only remaining population of one or more highly threatened species. Fifty-one per cent of these critical sites are wholly unprotected, as are 49 per cent of the 10,993 Important Bird Areas (IBAs). Only 22 per cent of AZEs and 28 per cent of IBAs are completely covered by protected areas.
Protected-area coverage of these important sites has increased over time. But in terms of proportion, the extent of protected area covering key biodiversity sites as a share of overall conservation land preserves has declined annually since 1950. Adequate protection and management of AZEs and IBAs, among other important sites, is called for to forestall extinctions, safeguard ecosystem services, preserve the benefits that people derive from these sites, and support international commitments under the Convention on Biological Diversity.
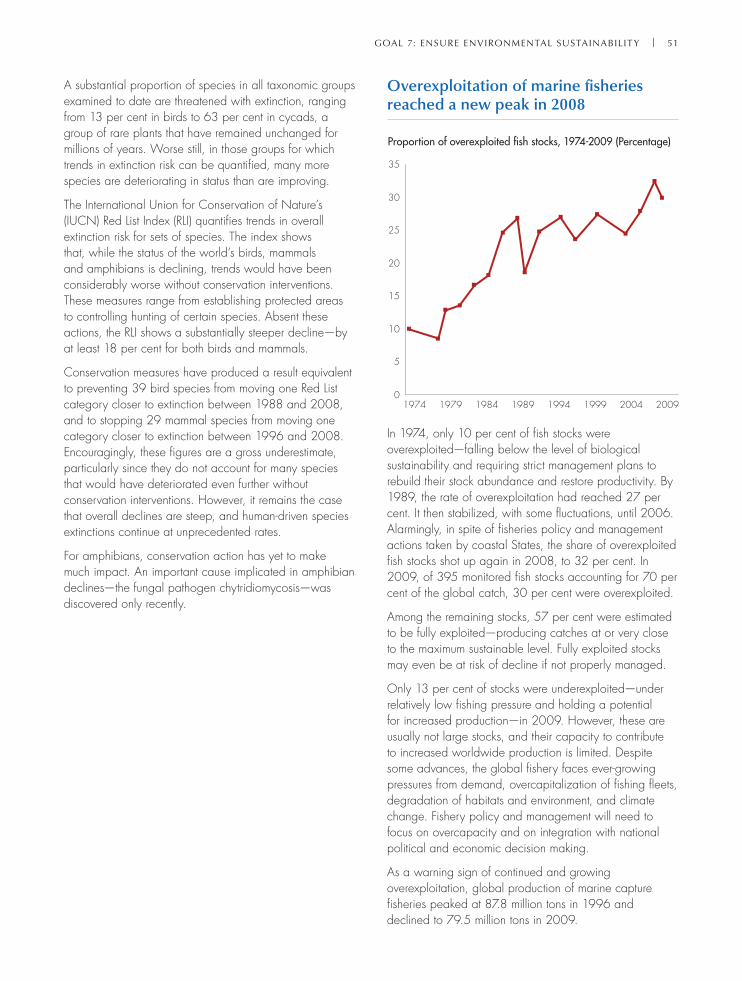
Goal 7: EnsurE EnvironmEntal sustainabilit y | 51
A substantial proportion of species in all taxonomic groups examined to date are threatened with extinction, ranging from 13 per cent in birds to 63 per cent in cycads, a group of rare plants that have remained unchanged for millions of years. Worse still, in those groups for which trends in extinction risk can be quantified, many more species are deteriorating in status than are improving.
The International Union for Conservation of Nature’s (IUCN) Red List Index (RLI) quantifies trends in overall extinction risk for sets of species. The index shows that, while the status of the world’s birds, mammals and amphibians is declining, trends would have been considerably worse without conservation interventions. These measures range from establishing protected areas to controlling hunting of certain species. Absent these actions, the RLI shows a substantially steeper decline—by at least 18 per cent for both birds and mammals.
Conservation measures have produced a result equivalent to preventing 39 bird species from moving one Red List category closer to extinction between 1988 and 2008, and to stopping 29 mammal species from moving one category closer to extinction between 1996 and 2008. Encouragingly, these figures are a gross underestimate, particularly since they do not account for many species that would have deteriorated even further without conservation interventions. However, it remains the case that overall declines are steep, and human-driven species extinctions continue at unprecedented rates.
For amphibians, conservation action has yet to make much impact. An important cause implicated in amphibian declines—the fungal pathogen chytridiomycosis—was discovered only recently.
Overexploitation of marine fisheries reached a new peak in 2008
0
5
10
15
20
25
30
35
1974 1979 1984 1989 1994 1999 2004 2009
Proportion of overexploited fish stocks, 1974-2009 (Percentage)
In 1974, only 10 per cent of fish stocks were overexploited—falling below the level of biological sustainability and requiring strict management plans to rebuild their stock abundance and restore productivity. By 1989, the rate of overexploitation had reached 27 per cent. It then stabilized, with some fluctuations, until 2006. Alarmingly, in spite of fisheries policy and management actions taken by coastal States, the share of overexploited fish stocks shot up again in 2008, to 32 per cent. In 2009, of 395 monitored fish stocks accounting for 70 per cent of the global catch, 30 per cent were overexploited.
Among the remaining stocks, 57 per cent were estimated to be fully exploited—producing catches at or very close to the maximum sustainable level. Fully exploited stocks may even be at risk of decline if not properly managed.
Only 13 per cent of stocks were underexploited—under relatively low fishing pressure and holding a potential for increased production—in 2009. However, these are usually not large stocks, and their capacity to contribute to increased worldwide production is limited. Despite some advances, the global fishery faces ever-growing pressures from demand, overcapitalization of fishing fleets, degradation of habitats and environment, and climate change. Fishery policy and management will need to focus on overcapacity and on integration with national political and economic decision making.
As a warning sign of continued and growing overexploitation, global production of marine capture fisheries peaked at 87.8 million tons in 1996 and declined to 79.5 million tons in 2009.
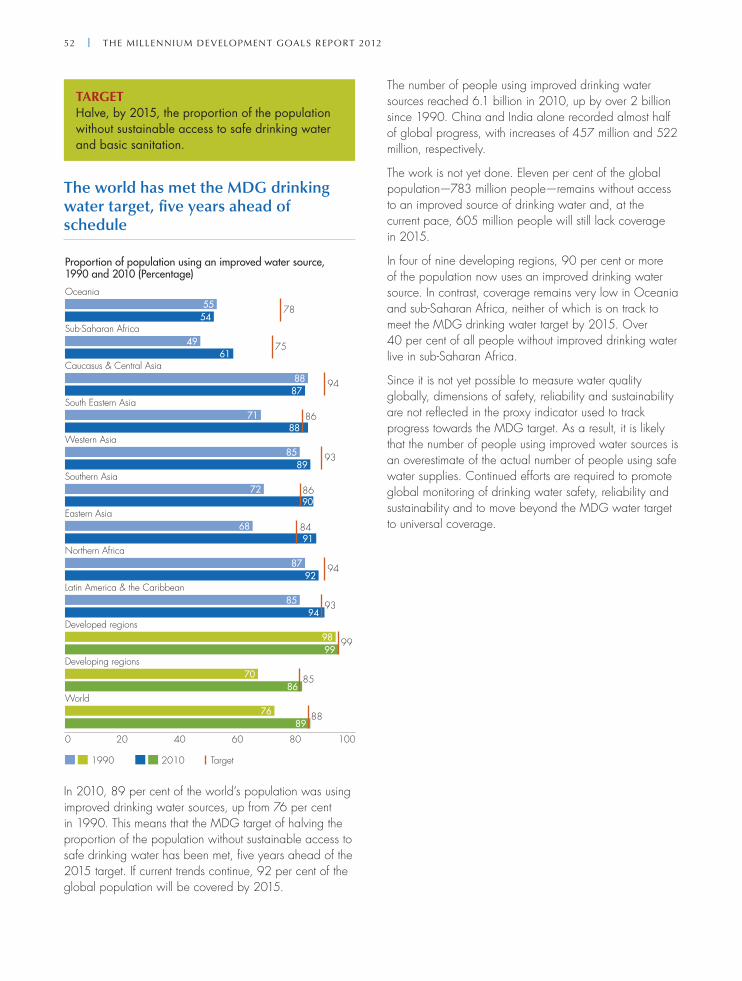
52 | thE millEnnium DEvElopmEnt Goals rEport 2012
TarGETHalve, by 2015, the proportion of the population without sustainable access to safe drinking water and basic sanitation.
The world has met the MDG drinking water target, five years ahead of schedule
Proportion of population using an improved water source,1990 and 2010 (Percentage)
1990 2010 Target
88
85
99
93
94
84
86
93
86
94
75
78
0 20 40 60 80 100
World
Developing regions
Developed regions
Latin America & the Caribbean
Northern Africa
Eastern Asia
Southern Asia
Western Asia
South Eastern Asia
Caucasus & Central Asia
Sub-Saharan Africa
Oceania
89
86
99
94
92
91
90
89
88
87
61
54
76
70
98
85
87
68
72
85
71
88
49
55
In 2010, 89 per cent of the world’s population was using improved drinking water sources, up from 76 per cent in 1990. This means that the MDG target of halving the proportion of the population without sustainable access to safe drinking water has been met, five years ahead of the 2015 target. If current trends continue, 92 per cent of the global population will be covered by 2015.
The number of people using improved drinking water sources reached 6.1 billion in 2010, up by over 2 billion since 1990. China and India alone recorded almost half of global progress, with increases of 457 million and 522 million, respectively.
The work is not yet done. Eleven per cent of the global population—783 million people—remains without access to an improved source of drinking water and, at the current pace, 605 million people will still lack coverage in 2015.
In four of nine developing regions, 90 per cent or more of the population now uses an improved drinking water source. In contrast, coverage remains very low in Oceania and sub-Saharan Africa, neither of which is on track to meet the MDG drinking water target by 2015. Over 40 per cent of all people without improved drinking water live in sub-Saharan Africa.
Since it is not yet possible to measure water quality globally, dimensions of safety, reliability and sustainability are not reflected in the proxy indicator used to track progress towards the MDG target. As a result, it is likely that the number of people using improved water sources is an overestimate of the actual number of people using safe water supplies. Continued efforts are required to promote global monitoring of drinking water safety, reliability and sustainability and to move beyond the MDG water target to universal coverage.

Goal 7: EnsurE EnvironmEntal sustainabilit y | 53
Rural areas are still far behind cities in water access
2,142
109
130
3,343
1,896
1,139
2,747
653
Population with and without an improved drinking water source,world, urban and rural residence, 1990 and 2010 (Millions)
0
1,000
2,000
3,000
4,000
1990 2010 1990 2010
Not using improved sourcesUsing improved sources
RuralUrban
Coverage with improved drinking water sources for rural populations is still lagging. In 2010, 96 per cent of the urban population used an improved drinking water source, compared with 81 per cent of the rural population.
In absolute terms, because of population growth, the number of people without an improved source in urban areas actually increased. In rural areas, on the other hand, the number of people without an improved source of water decreased, from 1.1 billion in 1990 to 653 million in 2010. However, the gap between urban and rural areas still remains wide, with the number of people in rural areas without an improved water source five times greater than in urban areas.
Poorer people in sub-Saharan Africa are at a disadvantage in access to drinking water
5
59
36
15
64
21
25
62
13
39
53
8
62
32
6
0
20
40
60
80
100
34
66
43
57
9
59
32
52
46
20
20
40
60
80
100
46
53
1
Poorest20%
Second20%
Middle20%
Fourth20%
Richest20%
Unimproved sourcesOther improved sourcesPiped on premises
Poorest20%
Second20%
Middle20%
Fourth20%
Richest20%
Drinking water coverage by wealth quintiles, urban and rural residence, sub-Saharan Africa, based on population-weighted averagesfrom 35 countries (Percentage)
Rural areasUrban areas
Inequality remains a concern. An analysis of data from 35 countries in sub-Saharan Africa (representing 84 per cent of the region’s population) shows significant differences between the poorest and richest fifths of the population in both rural and urban areas. Over 90 per cent of the
richest quintile in urban areas use improved water sources, and over 60 per cent have piped water on premises. In rural areas, piped-in water is non-existent in the poorest 40 per cent of households, and less than half of the population use any form of improved source of water.

54 | thE millEnnium DEvElopmEnt Goals rEport 2012
Women bear the main burden for collecting water in sub-Saharan Africa
6Boys
23Men
9Girls
62Women
Distribution of the water collection burden among women,children under age 15 and men, in households withoutpiped water on premises, sub-Saharan Africa, based onpopulation-weighted averages from 25 countries, 2006/2009(Percentage)
Where water supplies are not readily accessible, water must be carried from its source. According to an analysis of data from 25 countries in sub-Saharan Africa, representing 48 per cent of the region’s population, women and girls bear the primary responsibility for such water collection.
Only one quarter of the population in these countries had water on their premises in 2010. For the remaining 75 per cent, water had to be collected from some distance. The time and energy devoted to this manner of water collection is considerable, even under the most conservative assumption of only one trip per day. For the 25 countries combined, it is estimated that women spend at least 16 million hours each day per round trip; men spend 6 million hours; and children, 4 million hours.
Despite improvement in most of the developing regions, the MDG sanitation target is still out of reach
0
20
40
60
80
100
1990 2010 1990 2010 1990 2010 1990 2010 1990 2010 1990 2010 1990 20101990 2010 1990 2010Northern
AfricaWestern
AsiaEasternAsia
SouthernAsia
South-EasternAsia
Sub-SaharanAfrica
Oceania Latin America& the Caribbean
Developingregions
Improved Shared Unimproved Open defecation
Proportion of population by sanitation practices, 1990 and 2010 (Percentage)
36 25
26 30
1419
24
26
13 13
55 55
0 0
32 32
31 15
46 69
6
6
10
17
41
24 41
6
10
8
3
67 7 1
27 66
7
1959
14
18 4
68 80
7
9
9
8 3
80 85
25107
18 4
72 90
5
6
5
5
019
36 56
7
1325
12
32

Goal 7: EnsurE EnvironmEntal sustainabilit y | 55
Sanitation coverage increased from 36 per cent in 1990 to 56 per cent in 2010 in the developing regions as a whole. Despite progress, almost half of the population in those regions—2.5 billion—still lack access to improved sanitation facilities.
The greatest progress was achieved in Eastern and Southern Asia, where sanitation coverage in 2010 was, respectively, 2.4 and 1.7 times higher than in 1990.
In contrast, progress was slowest in Western Asia and sub-Saharan Africa, and no improvement was achieved in Oceania over the 20-year period.
At the current pace, and barring additional interventions, by 2015 the world will have reached only 67 per cent coverage, well short of the 75 per cent needed to achieve the MDG target.
The number of people forced to resort to open defecation remains a widespread health hazard and a global scandal
The number of people who do not use any facility and resort to open defecation has decreased by 271 million since 1990. But there remain 1.1 billion people—or 15 per cent of the global population—with no sanitation facilities at all. Daily, entire communities are exposed to the considerable health and environmental hazards of inadequate human waste disposal.
In 11 countries, a majority of the population still practices open defecation. Even in countries with rapidly growing economies, large numbers of people still must resort to this practice: 626 million in India, 14 million in China and 7 million in Brazil. Nearly 60 per cent of those practicing open defecation live in India.
In sub-Saharan Africa, access to sanitation is highly correlated with wealth and residence
1522 26
33
4924
34
39
40
3761
4435
27
14
42
5970
8091
37
32
21
94 1 9
19
26
0
20
40
60
80
100
0
20
40
60
80
100
Poorest20%
Second20%
Middle20%
Fourth20%
Richest20%
Open defecationUnimproved facilitiesImproved and shared facilites
Poorest20%
Second20%
Middle20%
Fourth20%
Richest20%
Proportion of population by sanitation practices and wealth quintile, urban and rural areas, sub-Saharan Africa,based on population-weighted averages from 35 countries (Percentage)
Rural areasUrban areas
An analysis of data from 35 countries in sub-Saharan Africa (representing 84 per cent of the region’s population) shows that over 90 per cent of the households in the richest urban quintile benefit from improved sanitation,
while access in rural areas falls below 50 per cent even among the wealthiest households. In the poorest rural quintile, over 60 per cent of households practice open defecation.

56 | thE millEnnium DEvElopmEnt Goals rEport 2012
Urban–rural differences in sanitation coverage are starting to even out, but remain stark
1990 2010
Urban/rural ratio for the proportion of the population usingan improved sanitation facility, 1990 and 2010
1.7
1.0
1.0
1.1
1.3
1.4
1.4
1.4
1.8
1.8
2.1
3.1
1.1
1.1
1.7
3.3
1.9
2.1
1.7
1.9
2.2
4.6
0 1 2 3 4 5
Developing regions
Developed regions
Caucasus & Central Asia
Northern Africa
Eastern Asia
South-Eastern Asia
Latin America & the Caribbean
Western Asia
Oceania
Sub-Saharan Africa
Southern Asia
Rural–urban disparities in access to sanitation are even more pronounced than for access to drinking water. Eight out of ten people use an improved sanitation facility in cities around the world, compared to only half of the rural population in the countrysides.
Fully 72 per cent of all those lacking access to improved sanitation live in rural areas, as do 90 per cent of those subject to the high-risk practice of open defecation (949 million people). This rural sanitation crisis persists even in regions with high coverage of improved drinking water: 17 per cent of rural dwellers in Latin America and the Caribbean and 9 per cent in Northern Africa still resort to open defecation.
TarGETBy 2020, to have achieved a significant improvement in the lives of at least 100 million slum dwellers
Improvements in the lives of 200 million slum dwellers bring achievement of the MDG target, even as rapid urbanization swells the ranks of the urban poor
2000 2012
Proportion of urban population living in slums, 2000 and 2012 (Percentage)
33
13
24
24
25
28
31
35
62
39
20
29
24
21
37
40
46
65
0 20 40 60 80
Developing Regions
Northern Africa
Latin America & the Caribbean
Oceania
Western Asia
Eastern Asia
South-Eastern Asia
Southern Asia
Sub-Saharan Africa
The share of urban slum residents in the developing world declined from 39 per cent in 2000 to 33 per cent in 2012. More than 200 million of these people gained access to improved water sources, improved sanitation facilities, or durable or less crowded housing, thereby exceeding the MDG target. This achievement comes well ahead of the 2020 deadline.
But despite a reduction in the percentage of urban population living in slums, the absolute number of slum dwellers continues to grow. Fed by an accelerating pace of urbanization, 863 million people are now estimated to be living in slums compared to 650 million in 1990 and 760 million in 2000. The achievement of the MDG target does not lessen the need to improve the lives of the urban poor and to curb the increase in numbers of slum dwellers.
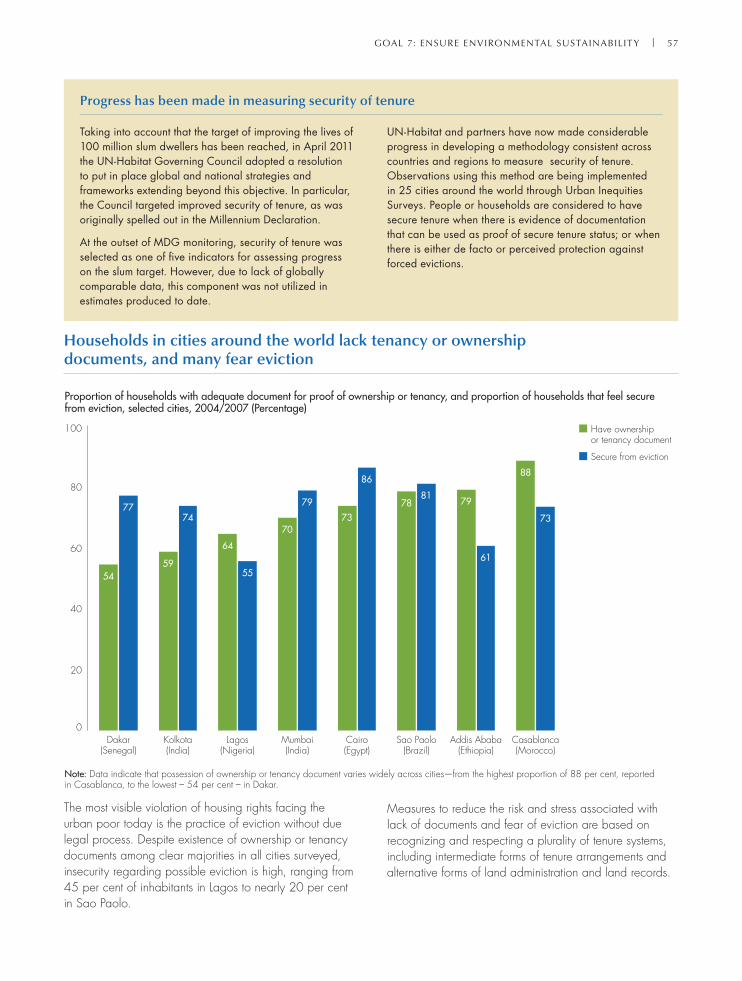
Goal 7: EnsurE EnvironmEntal sustainabilit y | 57
Progress has been made in measuring security of tenure
Taking into account that the target of improving the lives of 100 million slum dwellers has been reached, in April 2011 the UN-Habitat Governing Council adopted a resolution to put in place global and national strategies and frameworks extending beyond this objective. In particular, the Council targeted improved security of tenure, as was originally spelled out in the Millennium Declaration.
At the outset of MDG monitoring, security of tenure was selected as one of five indicators for assessing progress on the slum target. However, due to lack of globally comparable data, this component was not utilized in estimates produced to date.
UN-Habitat and partners have now made considerable progress in developing a methodology consistent across countries and regions to measure security of tenure. Observations using this method are being implemented in 25 cities around the world through Urban Inequities Surveys. People or households are considered to have secure tenure when there is evidence of documentation that can be used as proof of secure tenure status; or when there is either de facto or perceived protection against forced evictions.
Households in cities around the world lack tenancy or ownership documents, and many fear eviction
54
77
59
74
64
55
70
79
73
86
7881
79
61
88
73
0
20
40
60
80
100
Dakar(Senegal)
Kolkota(India)
Lagos(Nigeria)
Mumbai(India)
Cairo(Egypt)
Sao Paolo(Brazil)
Addis Ababa(Ethiopia)
Casablanca(Morocco)
Have ownershipor tenancy document
Secure from eviction
Proportion of households with adequate document for proof of ownership or tenancy, and proportion of households that feel securefrom eviction, selected cities, 2004/2007 (Percentage)
Note: Data indicate that possession of ownership or tenancy document varies widely across cities—from the highest proportion of 88 per cent, reportedin Casablanca, to the lowest – 54 per cent – in Dakar.
The most visible violation of housing rights facing the urban poor today is the practice of eviction without due legal process. Despite existence of ownership or tenancy documents among clear majorities in all cities surveyed, insecurity regarding possible eviction is high, ranging from 45 per cent of inhabitants in Lagos to nearly 20 per cent in Sao Paolo.
Measures to reduce the risk and stress associated with lack of documents and fear of eviction are based on recognizing and respecting a plurality of tenure systems, including intermediate forms of tenure arrangements and alternative forms of land administration and land records.

Goal 8Develop a global partnership for development
Core development aid falls in real terms for the first time in more than a decade, as donor countries face fiscal constraints
Official development assistance (ODA) from developed countries, 2000-2011 (Constant 2010 US$ billions and current US$ billions)
0
20
40
60
80
100
120
140
160
2000 2001 2002 2003 2004 2005 2006 2007 2008 2009 2010 2011(Preliminary)
Net debt forgiveness grants
Humanitarian aid
Multilateral ODA
Bilateral development projects, programmes and technical cooperation
Total net ODA in current US dollars
In 2011, net aid disbursements amounted to $133.5 billion, representing 0.31 per cent of developed countries’ combined national income. While constituting an increase in absolute dollars, this was a 2.7 per cent drop in real terms over 2010, the year official development assistance (ODA) reached its peak. Clearly, fiscal constraints in several countries belonging to the Development Assistance Committee (DAC) of the Organisation for Economic Cooperation and Development (OECD) have affected their budgets.
If debt relief and humanitarian aid are excluded, bilateral aid for development programmes and projects fell by 4.5 per cent in real terms.
In 2011, Denmark, Luxembourg, the Netherlands, Norway and Sweden continued to exceed the United Nations ODA target of 0.7 per cent of gross national income (GNI). The largest donors by volume were the United States, Germany, the United Kingdom, France and Japan. In real terms, the largest rises in ODA were registered by Italy, New Zealand, Sweden and Switzerland. By contrast, ODA fell in 16 of the 23 DAC countries, with the largest cuts recorded in Austria, Belgium, Greece,

Goal 8: Develop a Global partnership for Development | 59
Japan and Spain. G7 countries provided 69 per cent of DAC ODA; DAC-EU countries contributed 54 per cent.
Aid had been steadily increasing for more than a decade. Net ODA rose by 63 per cent between 2000 and the peak year, 2010. ODA has long been considered a stable source of development financing. It cushioned the immediate impact of previous financial crashes, such as the Mexican debt crisis in the early 1980s and the recession of the early 1990s.
Looking ahead, the OECD-DAC Survey on Donors’ Forward Spending Plans for 2012 to 2015 suggests that global country programmable aid (CPA) may rise by 6 per cent in real terms in 2012. However, this is mainly due to expected increases in soft loans from multilateral agencies funded from capital replenishments during 2009-2011. From 2013, global CPA is projected to stagnate. Such a development would confirm earlier findings that it takes several years from the onset of a recession for the full impact to be felt on aid flows.
Based on donors’ current projections, there may be a slowdown in incoming aid from 2013 that varies among developing regions. CPA in Latin America is likely to continue to fall, while it may rise somewhat for Southern and Central Asian countries, including Bangladesh, Myanmar and Nepal. The Survey projects few changes in CPA for Africa, although recent events in the Sahel and North African countries may result in some upward reprogramming. For countries defined as being in fragile situations (46 countries in 2011), the Survey projects little change in total CPA. The largest increases are expected in the Democratic Republic of the Congo and Kenya, and the largest declines in Haiti and Afghanistan.
In 2009-2010, out of an average annual total of $94.7 billion of sector-allocable aid, $24.9 billion—or 26 per cent—was directed to the achievement of the goals of gender equality and women’s empowerment.
TarGeTAddress the special needs of the least developed countries, landlocked countries and small island developing states
Aid dips as a share of total donor income, as well as for LDCs and sub-Saharan Africa
Net official development assistance from OECD-DAC countries as a proportion of donors’ gross national income, 1990-2011 (Percentage)
0
0.05
0.10
0.15
0.20
0.25
0.30
0.35
0.40
1990 1994 1998 2002 2006 2011(preliminary)
Total ODA
ODA to LDCs
ODA as a percentage of the combined GNI of donors belonging to OECD-DAC increased between 2000 and 2010, reaching 0.32, before declining to 0.31 per cent in 2011.
Aid continues to concentrate on the poorest countries, with the group of least developed countries (LDCs) receiving about one third of donors’ total aid flows. ODA to LDCs rose slowly from a low of 0.05 per cent in the late 1990s to 0.11 per cent of donors’ GNI in 2010—bringing it closer to the United Nations target of 0.15 per cent.
Bilateral aid to sub-Saharan Africa (where 31 of the 48 LDCs are located, as well as 14 of the 31 landlocked developing countries) was $28.0 billion in 2011, representing a fall of 0.9 per cent in real terms compared with the previous year. By contrast, aid to the African continent increased by 0.9 per cent, to $31.4 billion, as donors provided more aid to Northern African countries after the revolutions in the region. Between 2010 and 2011, the LDCs also experienced a reduction in incoming net bilateral ODA flows of 8.9 per cent in real terms, to $27.7 billion.
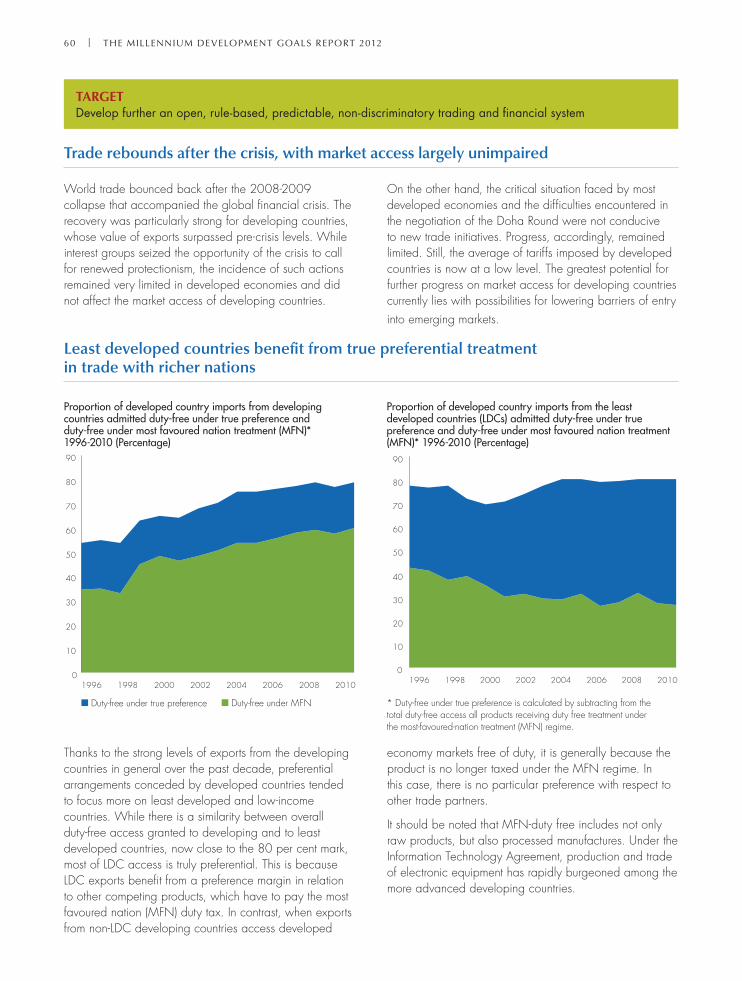
60 | the millennium Development Goals report 2012
TarGeTDevelop further an open, rule-based, predictable, non-discriminatory trading and financial system
Trade rebounds after the crisis, with market access largely unimpaired
Least developed countries benefit from true preferential treatment in trade with richer nations
Proportion of developed country imports from developing countries admitted duty-free under true preference and duty-free under most favoured nation treatment (MFN)* 1996-2010 (Percentage)
Proportion of developed country imports from the least developed countries (LDCs) admitted duty-free under true preference and duty-free under most favoured nation treatment (MFN)* 1996-2010 (Percentage)
* Duty-free under true preference is calculated by subtracting from the total duty-free access all products receiving duty free treatment under the most-favoured-nation treatment (MFN) regime.
0
10
20
30
40
50
60
70
80
90
1996 1998 2000 2002 2004 2006 2008 2010
Duty-free under true preference Duty-free under MFN
0
10
20
30
40
50
60
70
80
90
1996 1998 2000 2002 2004 2006 2008 2010
World trade bounced back after the 2008-2009 collapse that accompanied the global financial crisis. The recovery was particularly strong for developing countries, whose value of exports surpassed pre-crisis levels. While interest groups seized the opportunity of the crisis to call for renewed protectionism, the incidence of such actions remained very limited in developed economies and did not affect the market access of developing countries.
On the other hand, the critical situation faced by most developed economies and the difficulties encountered in the negotiation of the Doha Round were not conducive to new trade initiatives. Progress, accordingly, remained limited. Still, the average of tariffs imposed by developed countries is now at a low level. The greatest potential for further progress on market access for developing countries currently lies with possibilities for lowering barriers of entry into emerging markets.
Thanks to the strong levels of exports from the developing countries in general over the past decade, preferential arrangements conceded by developed countries tended to focus more on least developed and low-income countries. While there is a similarity between overall duty-free access granted to developing and to least developed countries, now close to the 80 per cent mark, most of LDC access is truly preferential. This is because LDC exports benefit from a preference margin in relation to other competing products, which have to pay the most favoured nation (MFN) duty tax. In contrast, when exports from non-LDC developing countries access developed
economy markets free of duty, it is generally because the product is no longer taxed under the MFN regime. In this case, there is no particular preference with respect to other trade partners.
It should be noted that MFN-duty free includes not only raw products, but also processed manufactures. Under the Information Technology Agreement, production and trade of electronic equipment has rapidly burgeoned among the more advanced developing countries.

Goal 8: Develop a Global partnership for Development | 61
Average tariffs decline for agricultural products only
Developed countries' average tariffs on imports of key products from developing countries and preferential margin received, 1996-2010 (Percentage)
Developed countries' average tariffs on imports of key products from the least developed countries (LDCs) and preferential margin received, 1996-2010 (Percentage)
-10
-5
0
5
10
15
1996 1998 2000 2002 2004 2006 2008 2010
-10
-5
0
5
10
15
1996 1998 2000 2002 2004 2006 2008 2010
Agricultrual goods Margin agricultural goodsClothing Margin clothingTextiles Margin textiles
Agricultrual goods Margin agricultural goodsClothing Margin clothingTextiles Margin textiles
The decrease in tariffs applied to products exported by developing and least developed countries in 2010 was significant only in the case of agricultural products. The result was an increase in the margin of preference over the MFN tariff, especially notable in the case of LDCs. On the other hand, average tariffs paid on clothing imports originating from LDCs recorded a small increase. This was due to larger purchases by the United States of products exported by those Asian LDCs (Bangladesh and Cambodia) that do not benefit from LDC preferences in the United States market for their clothing exports.
Except for agricultural products exported by LDCs, the margin of preference granted by developed countries on imports intensive in unskilled labour (from both developing countries and LDCs) has remained practically constant over the past decade.
The average across beneficiary countries, however, masks a wide heterogeneity. Small island States and African LDCs, as well as other low-income African countries, benefit from a virtually complete preferential-duty exemption on clothing, and a very low tariff on agricultural exports. But Asian LDCs still have to pay about 3 per cent duty on their agriculture and textile exports and 7 per cent on clothing.
In addition, the actual rate of utilization of these preferential schemes can vary, due to conditions that impede or limit their use—for example, rules of origin or high administrative costs. The rate of utilization of preference varies according to countries but has been improving over time. It is now estimated to be about 85 per cent of all eligible imports.

62 | the millennium Development Goals report 2012
TarGeTDeal comprehensively with developing countries’ debt
Interrupted in 2009, the downward trend of developing countries’ debt-service ratios resumes
External debt service payments as proportion of export revenues, all developing countries, 2000-2010 (Percentage)
12.6
11.6 11.7
11.3
7.97.4
6.8
4.13.4 3.6
3.0
0.0
2.0
4.0
6.0
8.0
10.0
12.0
14.0
2000 2001 2002 2003 2004 2005 2006 2007 2008 2009 2010
A country’s external debt burden affects its creditworthiness and vulnerability to economic shocks. Better debt management, the expansion of trade and, for the poorest countries, substantial debt relief have reduced the burden of debt service. Between 2000 and 2008, the ratio of public and publicly guaranteed debt service to exports for developing regions declined substantially, from 12.6 per cent to 3.4 per cent. The trend was interrupted by the sharp fall of export revenues due to the 2009 economic crisis, when export earnings of developing countries declined by 17.6 per cent and total public debt service remained at about the same level as in 2008. In 2010, export earnings of developing countries rebounded by 23.4 per cent and total public debt service remained steady. This reinstated the longer-term downward trend in the average ratio of public debt service to exports.
Debt service as a proportion of exports has improved from even pre-crises levels in the developing world, although not for LDCs and small island States
External debt service payments as proportion of exportrevenues, 2008, 2009 and 2010 (Percentage)
0.60.60.6
1.11.1
0.7
8.89.2
9.0
4.74.0
6.6
7.26.9
6.3
4.03.0
3.0
3.65.1
2.9
3.92.5
2.7
1.92.8
1.6
3.63.4
3.0
9.37.6
10.9
5.32.9
3.7
0 2 4 6 8 10 12
Least developed countries
Small island developing
Developing regions
Eastern Asia
Caucasus & Central Asia
Oceania
Sub-Saharan Africa
Southern Asia
South-Eastern Asia
Latin America & the Caribbean
Northern Africa
Western Asia
2008 2009 2010
In some regions, including Latin America and the Caribbean, Southern Asia and Oceania, ratios of external debt payments to export revenues have fallen below

Goal 8: Develop a Global partnership for Development | 63
their 2008 level. Debt-service burdens also declined in Western Asia, Northern Africa and the small island developing States, but as export earnings also continued to decline in 2010, the ratio continued to increase.
Forty countries are eligible for debt relief under the Heavily Indebted Poor Countries (HIPC) Initiative. Of
these, 36 countries have reached the “decision point” stage in the process and have had future debt payments reduced by $59 billion (in end-2010 net present value terms); and 32 that have reached their “completion point” have received additional assistance of $33 billion (in end-2010 net present value terms) under the Multilateral Debt Relief Initiative.
TarGeTIn cooperation with the private sector, make available the benefits of new technologies, especially information and communications
The extraordinary rise in mobile cellular subscriptions continues in the developing world
Number of fixed-telephone and mobile-cellular subscriptions per 100 inhabitants, 1995-2011
* Data for 2011 are preliminary estimates.
0
20
40
60
80
100
120
1995 1996 1997 1998 1999 2000 2001 2002 2003 2004 2005 2006 2007 2008 2009 2010 2011*
Mobile-cellular subscriptions, developed regionsFixed-telephone subscriptions, developed regionsMobile-cellular subscriptions, developing regionsFixed-telephone subscriptions, developing regions
By the end of 2011, the number of mobile cellular subscriptions had grown to an estimated six billion, including 1.2 billion active mobile broadband subscriptions. This increase brings mobile cellular penetration levels to 87 per cent worldwide and 79 per cent in the developing regions. At the same time, more than one third of the world’s population is using the Internet, increasingly through high-speed broadband Internet access.
Key factors driving consumer demand, and allowing more and more people to join the information society, are technological progress, user-oriented services, information
and communication technology (ICT) infrastructure investments and falling ICT service prices.
Mobile cellular subscriptions continue to rise yearly at double-digit growth rates in the developing world. In 2011, 75 per cent of the worldwide subscriptions were in the developing regions, up from 59 per cent in 2006. Mobile cellular penetration in sub-Saharan Africa now exceeds 50 per cent, compared to a fixed telephone penetration of only 1 per cent of the population.
By the end of 2011, moreover, over 160 countries in the world had launched 3G mobile broadband services and 45 per cent of the population worldwide was covered by a high-speed mobile broadband signal.
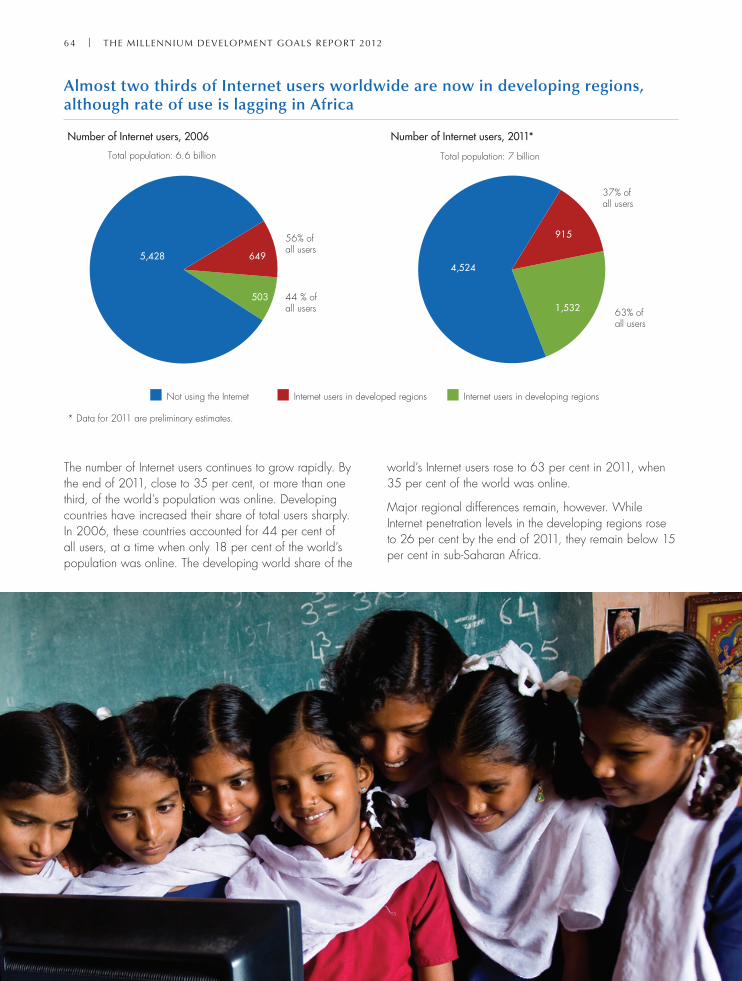
64 | the millennium Development Goals report 2012
Almost two thirds of Internet users worldwide are now in developing regions, although rate of use is lagging in Africa
Number of Internet users, 2006 Number of Internet users, 2011*
* Data for 2011 are preliminary estimates.
Not using the Internet Internet users in developed regions Internet users in developing regions
Total population: 6.6 billion
56% of all users
44 % of all users
Total population: 7 billion
37% of all users
63% of all users
5,428
503
6494,524
915
1,532
The number of Internet users continues to grow rapidly. By the end of 2011, close to 35 per cent, or more than one third, of the world’s population was online. Developing countries have increased their share of total users sharply. In 2006, these countries accounted for 44 per cent of all users, at a time when only 18 per cent of the world’s population was online. The developing world share of the
world’s Internet users rose to 63 per cent in 2011, when 35 per cent of the world was online.
Major regional differences remain, however. While Internet penetration levels in the developing regions rose to 26 per cent by the end of 2011, they remain below 15 per cent in sub-Saharan Africa.
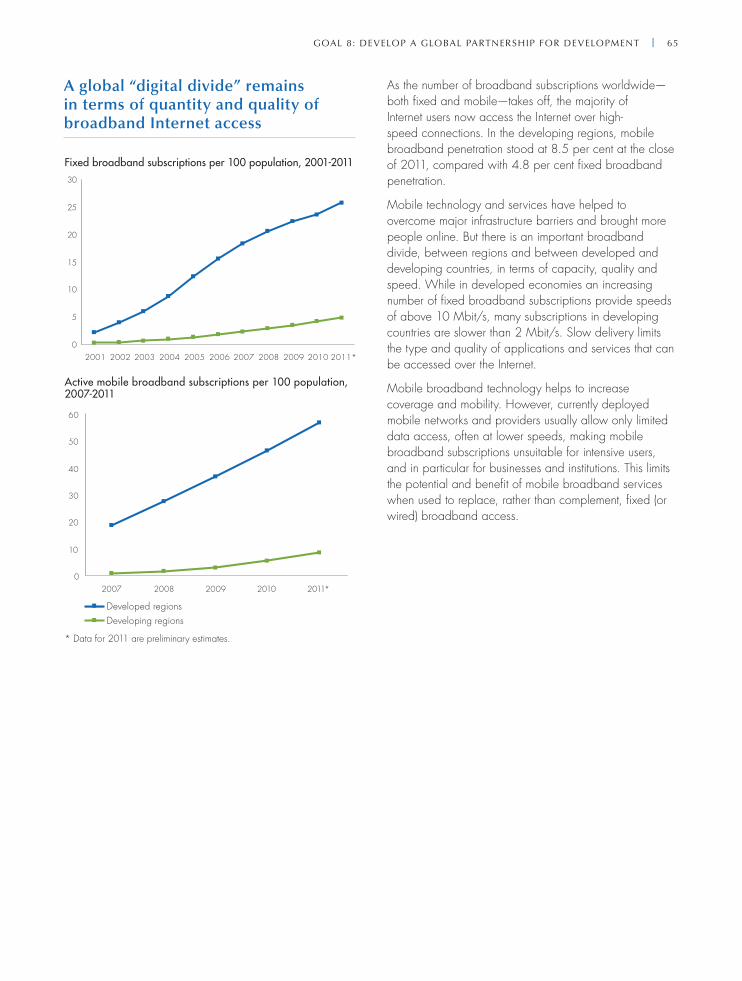
Goal 8: Develop a Global partnership for Development | 65
A global “digital divide” remains in terms of quantity and quality of broadband Internet access
Fixed broadband subscriptions per 100 population, 2001-2011
Active mobile broadband subscriptions per 100 population, 2007-2011
* Data for 2011 are preliminary estimates.
0
5
10
15
20
25
30
2001 2002 2003 2004 2005 2006 2007 2008 2009 2010 2011*
0
10
20
30
40
50
60
2007 2008 2009 2010 2011*
Developed regionsDeveloping regions
As the number of broadband subscriptions worldwide—both fixed and mobile—takes off, the majority of Internet users now access the Internet over high-speed connections. In the developing regions, mobile broadband penetration stood at 8.5 per cent at the close of 2011, compared with 4.8 per cent fixed broadband penetration.
Mobile technology and services have helped to overcome major infrastructure barriers and brought more people online. But there is an important broadband divide, between regions and between developed and developing countries, in terms of capacity, quality and speed. While in developed economies an increasing number of fixed broadband subscriptions provide speeds of above 10 Mbit/s, many subscriptions in developing countries are slower than 2 Mbit/s. Slow delivery limits the type and quality of applications and services that can be accessed over the Internet.
Mobile broadband technology helps to increase coverage and mobility. However, currently deployed mobile networks and providers usually allow only limited data access, often at lower speeds, making mobile broadband subscriptions unsuitable for intensive users, and in particular for businesses and institutions. This limits the potential and benefit of mobile broadband services when used to replace, rather than complement, fixed (or wired) broadband access.
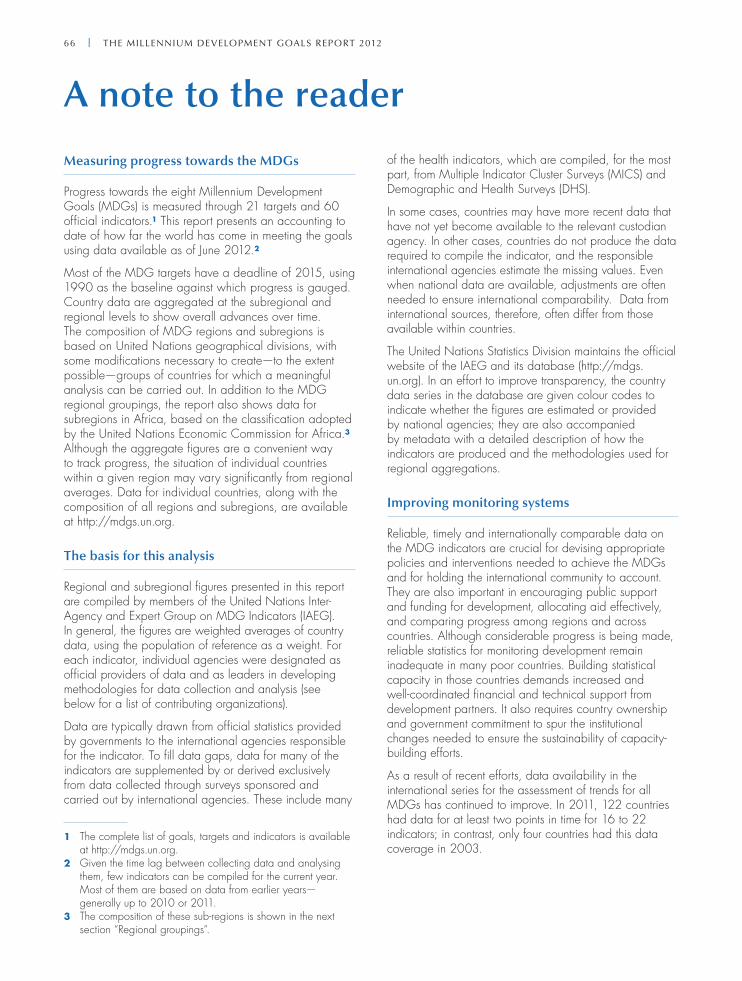
66 | The MillenniuM DevelopMenT Goals RepoRT 2012
A note to the reader
Measuring progress towards the MDGs
Progress towards the eight Millennium Development Goals (MDGs) is measured through 21 targets and 60 official indicators.1 This report presents an accounting to date of how far the world has come in meeting the goals using data available as of June 2012.2
Most of the MDG targets have a deadline of 2015, using 1990 as the baseline against which progress is gauged. Country data are aggregated at the subregional and regional levels to show overall advances over time. The composition of MDG regions and subregions is based on United Nations geographical divisions, with some modifications necessary to create—to the extent possible—groups of countries for which a meaningful analysis can be carried out. In addition to the MDG regional groupings, the report also shows data for subregions in Africa, based on the classification adopted by the United Nations Economic Commission for Africa.3 Although the aggregate figures are a convenient way to track progress, the situation of individual countries within a given region may vary significantly from regional averages. Data for individual countries, along with the composition of all regions and subregions, are available at http://mdgs.un.org.
The basis for this analysis
Regional and subregional figures presented in this report are compiled by members of the United Nations Inter-Agency and Expert Group on MDG Indicators (IAEG). In general, the figures are weighted averages of country data, using the population of reference as a weight. For each indicator, individual agencies were designated as official providers of data and as leaders in developing methodologies for data collection and analysis (see below for a list of contributing organizations).
Data are typically drawn from official statistics provided by governments to the international agencies responsible for the indicator. To fill data gaps, data for many of the indicators are supplemented by or derived exclusively from data collected through surveys sponsored and carried out by international agencies. These include many
1 The complete list of goals, targets and indicators is available at http://mdgs.un.org.
2 Given the time lag between collecting data and analysing them, few indicators can be compiled for the current year. Most of them are based on data from earlier years—generally up to 2010 or 2011.
3 The composition of these sub-regions is shown in the next section “Regional groupings”.
of the health indicators, which are compiled, for the most part, from Multiple Indicator Cluster Surveys (MICS) and Demographic and Health Surveys (DHS).
In some cases, countries may have more recent data that have not yet become available to the relevant custodian agency. In other cases, countries do not produce the data required to compile the indicator, and the responsible international agencies estimate the missing values. Even when national data are available, adjustments are often needed to ensure international comparability. Data from international sources, therefore, often differ from those available within countries.
The United Nations Statistics Division maintains the official website of the IAEG and its database (http://mdgs.un.org). In an effort to improve transparency, the country data series in the database are given colour codes to indicate whether the figures are estimated or provided by national agencies; they are also accompanied by metadata with a detailed description of how the indicators are produced and the methodologies used for regional aggregations.
Improving monitoring systems
Reliable, timely and internationally comparable data on the MDG indicators are crucial for devising appropriate policies and interventions needed to achieve the MDGs and for holding the international community to account. They are also important in encouraging public support and funding for development, allocating aid effectively, and comparing progress among regions and across countries. Although considerable progress is being made, reliable statistics for monitoring development remain inadequate in many poor countries. Building statistical capacity in those countries demands increased and well-coordinated financial and technical support from development partners. It also requires country ownership and government commitment to spur the institutional changes needed to ensure the sustainability of capacity-building efforts.
As a result of recent efforts, data availability in the international series for the assessment of trends for all MDGs has continued to improve. In 2011, 122 countries had data for at least two points in time for 16 to 22 indicators; in contrast, only four countries had this data coverage in 2003.

ReGional GRoupinGs | 67
This report presents data on progress towards the Millennium Development Goals for the world as a whole and for various country groupings. These are classified as “developing” regions and “developed” regions.* The developing regions are further broken down into the subregions shown on the map above. These regional groupings are based on United Nations geographical divisions, with some modifications necessary to create, to the extent possible, groups of countries for which a meaningful analysis can be carried out. A complete list of countries included in each region and subregion is available at mdgs.un.org.
The designations employed and the presentation of the material in the present publication do not imply the expression of any opinion whatsoever on the part of the Secretariat of the United Nations concerning the legal status of any country, territory, city or area of its authorities, or concerning the delimitation of its frontiers or boundaries.
* Since there is no established convention for the designation of “developed” and “developing” countries or areas in the United Nations system, this distinction is made for the purposes of statistical analysis only.
Regional groupings
Developed regionsNorthern AfricaSub-Saharan AfricaSouth-Eastern AsiaEastern AsiaSouthern AsiaWestern AsiaCaucasus & Central AsiaOceaniaLatin America & the Caribbean
North AfricaWest AfricaCentral AfricaEastern AfricaSouthern Africa
African subregions
For some MDG indicators, data are presented separately for smaller subregions in Africa, based on the classification adopted by the United Nations Economic Commission for Africa.
68 | The MillenniuM DevelopMenT Goals RepoRT 2012
Contributing agencies
Contributions on data and analysis for each indicator presented for the eight goals were provided by individual agencies as indicated below:
• Goal 1: Eradicate extreme poverty and hunger: FAO, ILO, UNHCR, UNICEF and World Bank
• Goal 2: Achieve universal primary education: UNESCO
• Goal 3: Promote gender equality and empower women: ILO, IPU and UNESCO
• Goal 4: Reduce child mortality: UNICEF and WHO
• Goal 5: Improve maternal health: OECD, UNFPA, UNICEF, United Nations Population Division and WHO
• Goal 6: Combat HIV/AIDS, malaria and other diseases: UNAIDS, UNICEF and WHO
• Goal 7: Ensure environmental sustainability: CIDIAC, FAO, IUCN, UNEP, UNEP-WCMC, UNICEF, UNFCCC and UN-Habitat
• Goal 8: Develop a global partnership for development: ITC, ITU, OECD, UNCTAD, World Bank and WTO
For more information visit the UN Statistics Division Millennium Development Goals website at http://mdgs.un.org
Visit the UN Millennium Development Goals website at www.un.org/millenniumgoals
Visit the UN Millennium Campaign Office website at www.endpoverty2015.org
Photo credits:
Cover: ©UNDP Picture This/Kaushik Majumder, India
Page 2: ©Mohammad Popal/IRIN
Page 6: © Tun Tun Aung/Mandalay
Page 7: © Manoocher Deghati/IRIN
Page 8: © UNDP Picture This/Victor Diaz Kintanar, Philippines
Page 9: © Tommy Trenchard/IRIN
Page 14: © UN Photo/Martine Perret
Page 16: © Tun Tun Aung/Mandalay
Page 17: © UNICEF/Marco Dormino
Page 19: © UN Photo/Kibae Park
Page 20: © FAO/Giulio Napolitano
Page 21: © UNDP Picture This/Trinh Te Ha, Viet Nam
Page 23: © UNDP Picture This/Rabin Chakrabarti, India
Page 25: © UN Photo/Rick Bajornas
Page 26: © Sara Duerto Valero/United Nations
Page 29: © Nancy Palus/IRIN
Page 30: © UN Photo/Martine Perre
Page 33: © IRIN Babe
Page 34: © David Longstreath/IRIN
Page 37: © UNDP Picture This/Chetan Soni, India
Page 38: © UN Photo/Eskinder Debebe
Page 45: © Siegfried Modola/MSF
Page 46: © UN Photo/Ky Chung
Page 47: © UN Photo/Eskinder Debebe
Page 58: © Sara Duerto Valero/United Nations
Page 61: © Siegfried Modola/IRIN
Page 64: © UNDP Picture This/Devendra Sharma, India
Editor: Timothy Wall
Copyright © United Nations, 2012 All rights reserved.

| 5

2 | The Millennium Development Goals: Report 2010
“We can report broad progress.
. . .
Working together, governments, the United
Nations family, the private sector and civil society
can succeed in tackling the greatest challenges.
As the 2015 deadline is fast approaching, we
must be united and steadfast in our resolve to
accelerate progress and achieve the MDGs.”
— UN Secretary-GeNeral BAN Ki-mooN
Printed at the United Nations, New York12-24532—June 2012—29 000Sales No. E.12.I.4
USD 15ISBN 978-92-1-101258-3
Top Related
Copyright © 2022 FDOKUMEN

