


Bahasa
Halaman
Hukum

McKinsey on Finance
High tech’s coming consolidation 1Economic pressures to restructure high tech will eventually become irresistible. More acquisitions loom.
When efficient capital and operations go hand in hand 7 Olli-Pekka Kallasvuo, Nokia’s head of mobile phones and a former CFO, discusses strategic organization, performance measurement, and the value of financial transparency.
All P/Es are not created equal 12High price-to-earnings ratios are about more than just growth. Understanding the ingredients that go into a strong multiple can help executives make the most of this strategic tool.
Putting value back in value-based management 16Value-based management programs focus too much on measurement and too little on the management activities that create shareholder value.
Perspectives on Corporate Finance and Strategy
Number 11, Spring 2004

McKinsey & Company is an international management-consulting firm serving corporate and governmentinstitutions from 85 offices in 47 countries.
Editorial Board: Richard Dobbs, Marc Goedhart, Keiko Honda, Bill Javetski, Timothy Koller, Robert McNish, Dennis Swinford
Editorial Contact: [email protected]: Dennis Swinford
External Relations Director: Joan HorrvichDesign and Layout: Kim Bartko
Circulation Manager: Kimberly Davenport
Copyright © 2004 McKinsey & Company. All rights reserved.
Cover images, left to right: © Paul Schulenburg/Stock Illustration Source/Images.com, Corbis, Bonnie Rieser/Photodisc Green/Getty Images, Timothy Cook/Stock Illustration Source/Images.com
This publication is not intended to be used as the basis for trading in the shares of any company or for undertakingany other complex or significant financial transaction without consulting appropriate professional advisers.
No part of this publication may be copied or redistributed in any form without the prior written consent ofMcKinsey & Company.
McKinsey on Finance is a quarterly publication written by experts and practitioners in McKinsey & Company’sCorporate Finance & Strategy Practice. It offers readers insights into value-creating strategies and the translation ofthose strategies into stock market performance. This and archive issues of McKinsey on Finance are available onlineat http://www.corporatefinance.mckinsey.com
For some time, the rules of economics
appeared not to apply to the high-technology sector. Growth slowed, profitsshrank, and investors eagerly awaited thebillions of dollars in value likely to flowfrom mergers, acquisitions, downsizings,and liquidations. All signs pointed to animminent restructuring, yet until recentlylittle occurred.
Today consolidation pressures are mountingfast, and some segments have alreadysuccumbed. Where operating systems forPCs, midrange computers, and mainframeswere once numerous, now only a fewremain. Ditto for database software. Nicheplayers in segments such as vertical-specificapplications may remain fragmented, thanksin part to the unique nature of the valuepropositions they offer.
To develop a sense of how imminentconsolidation really is, and to pinpoint thesegments within and outside high tech thatmight encounter challenges or opportunitiesin the trend, we investigated the extent towhich the economic forces drivingconsolidation were at play in 21 of the
sector’s leading industries. The indicatorswe looked at included each industry’sfragmentation levels, maturity (as measuredby growth rates), and profitability. We alsoconsidered incentives for consolidation, suchas the need for scale to justify larger capitalexpenditures and the importance of scopeto meet the customer’s changing needs.1
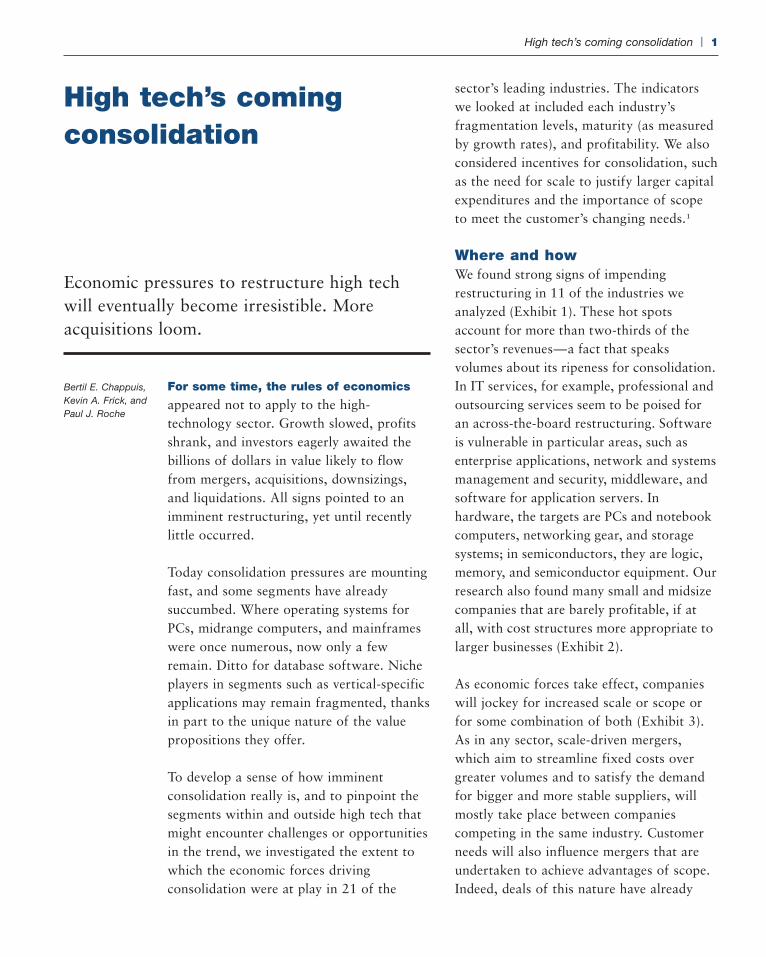
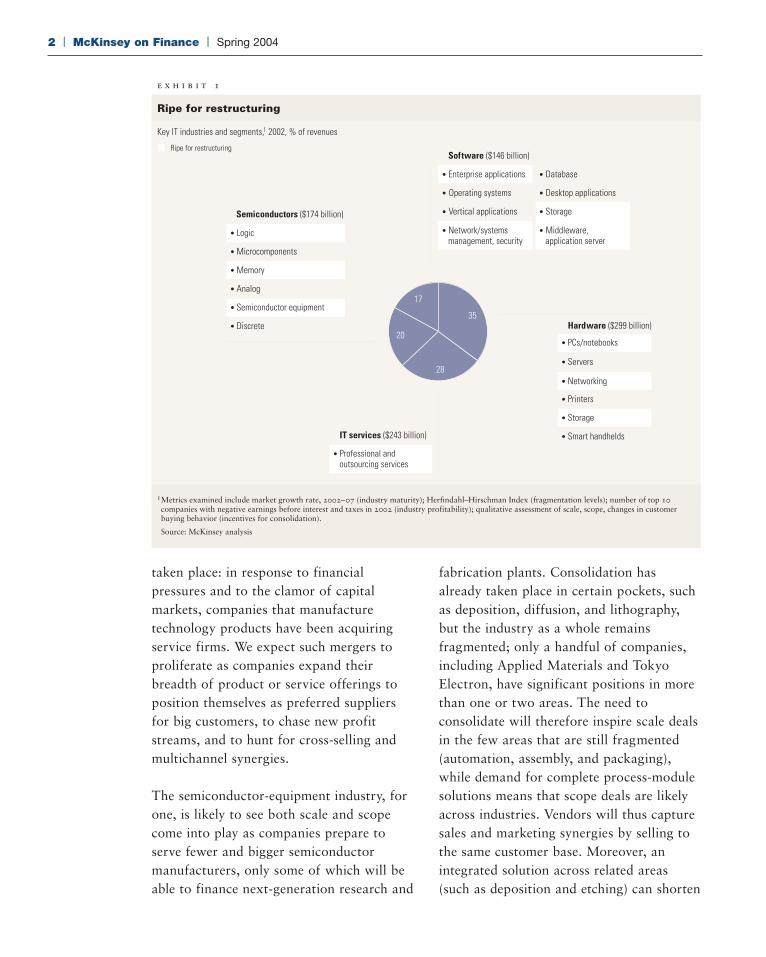
Where and howWe found strong signs of impendingrestructuring in 11 of the industries weanalyzed (Exhibit 1). These hot spotsaccount for more than two-thirds of thesector’s revenues—a fact that speaksvolumes about its ripeness for consolidation.In IT services, for example, professional andoutsourcing services seem to be poised foran across-the-board restructuring. Softwareis vulnerable in particular areas, such asenterprise applications, network and systemsmanagement and security, middleware, andsoftware for application servers. Inhardware, the targets are PCs and notebookcomputers, networking gear, and storagesystems; in semiconductors, they are logic,memory, and semiconductor equipment. Ourresearch also found many small and midsizecompanies that are barely profitable, if atall, with cost structures more appropriate tolarger businesses (Exhibit 2).
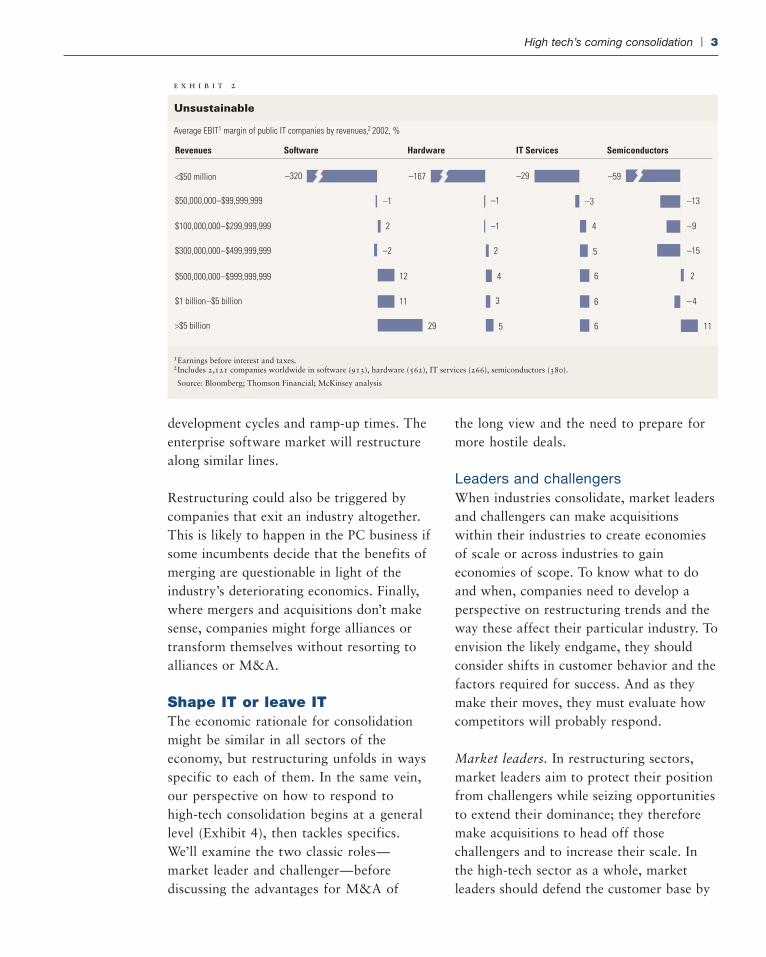
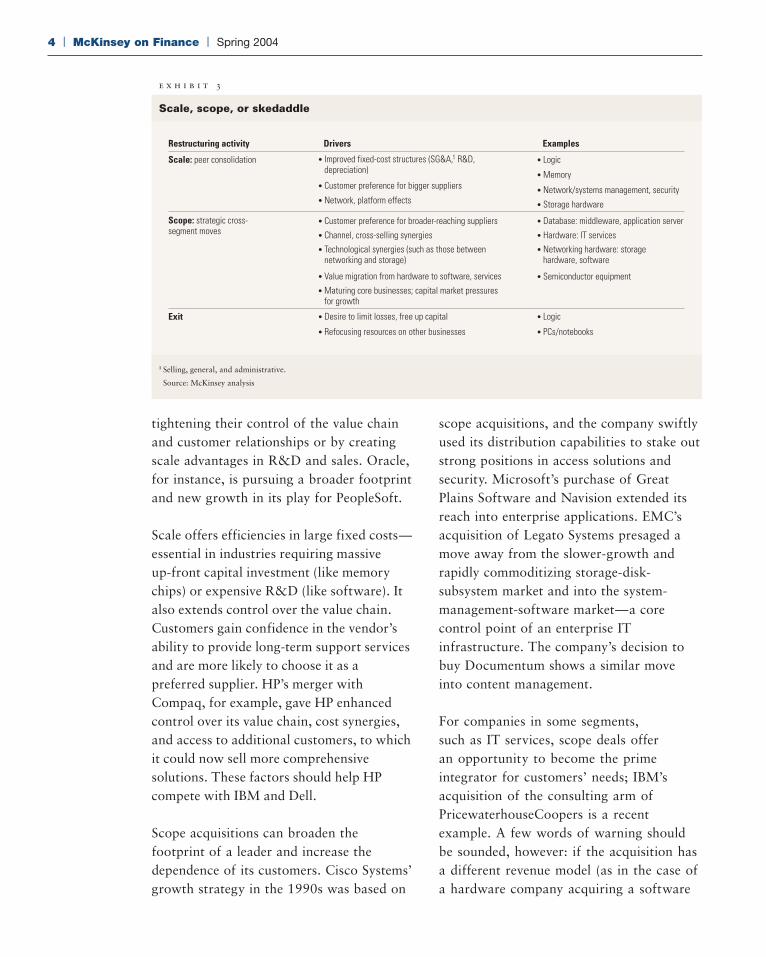
As economic forces take effect, companieswill jockey for increased scale or scope orfor some combination of both (Exhibit 3).As in any sector, scale-driven mergers,which aim to streamline fixed costs overgreater volumes and to satisfy the demandfor bigger and more stable suppliers, willmostly take place between companiescompeting in the same industry. Customerneeds will also influence mergers that areundertaken to achieve advantages of scope.Indeed, deals of this nature have already
High tech’s comingconsolidation
Economic pressures to restructure high techwill eventually become irresistible. Moreacquisitions loom.
High tech’s coming consolidation | 1
Bertil E. Chappuis,Kevin A. Frick, andPaul J. Roche
taken place: in response to financialpressures and to the clamor of capitalmarkets, companies that manufacturetechnology products have been acquiringservice firms. We expect such mergers toproliferate as companies expand theirbreadth of product or service offerings toposition themselves as preferred suppliersfor big customers, to chase new profitstreams, and to hunt for cross-selling andmultichannel synergies.
The semiconductor-equipment industry, forone, is likely to see both scale and scopecome into play as companies prepare toserve fewer and bigger semiconductormanufacturers, only some of which will beable to finance next-generation research and
fabrication plants. Consolidation hasalready taken place in certain pockets, suchas deposition, diffusion, and lithography,but the industry as a whole remainsfragmented; only a handful of companies,including Applied Materials and TokyoElectron, have significant positions in morethan one or two areas. The need toconsolidate will therefore inspire scale dealsin the few areas that are still fragmented(automation, assembly, and packaging),while demand for complete process-modulesolutions means that scope deals are likelyacross industries. Vendors will thus capturesales and marketing synergies by selling tothe same customer base. Moreover, anintegrated solution across related areas(such as deposition and etching) can shorten
2 | McKinsey on Finance | Spring 2004
1 Metrics examined include market growth rate, 2002–07 (industry maturity); Herfindahl–Hirschman Index (fragmentation levels); number of top 10 companies with negative earnings before interest and taxes in 2002 (industry profitability); qualitative assessment of scale, scope, changes in customer buying behavior (incentives for consolidation).
Source: McKinsey analysis
e x h i b i t 1
Ripe for restructuring
Key IT industries and segments,1 2002, % of revenues
Ripe for restructuring
• Network/systems management, security
• Middleware, application server
• Enterprise applications
• Operating systems
• Vertical applications
• Database
• Desktop applications
• Storage
Software ($146 billion)
• PCs/notebooks
• Networking
• Servers
• Smart handhelds
• Printers
• Storage
Hardware ($299 billion)
IT services ($243 billion)
• Professional and outsourcing services
17
35
28
20
• Semiconductor equipment
• Logic
• Microcomponents
• Memory
• Analog
• Discrete
Semiconductors ($174 billion)
development cycles and ramp-up times. Theenterprise software market will restructurealong similar lines.
Restructuring could also be triggered bycompanies that exit an industry altogether.This is likely to happen in the PC business ifsome incumbents decide that the benefits ofmerging are questionable in light of theindustry’s deteriorating economics. Finally,where mergers and acquisitions don’t makesense, companies might forge alliances ortransform themselves without resorting toalliances or M&A.
Shape IT or leave ITThe economic rationale for consolidationmight be similar in all sectors of theeconomy, but restructuring unfolds in waysspecific to each of them. In the same vein,our perspective on how to respond to high-tech consolidation begins at a generallevel (Exhibit 4), then tackles specifics.We’ll examine the two classic roles—market leader and challenger—beforediscussing the advantages for M&A of
the long view and the need to prepare formore hostile deals.
Leaders and challengersWhen industries consolidate, market leadersand challengers can make acquisitionswithin their industries to create economiesof scale or across industries to gaineconomies of scope. To know what to doand when, companies need to develop aperspective on restructuring trends and theway these affect their particular industry. Toenvision the likely endgame, they shouldconsider shifts in customer behavior and thefactors required for success. And as theymake their moves, they must evaluate howcompetitors will probably respond.
Market leaders. In restructuring sectors,market leaders aim to protect their positionfrom challengers while seizing opportunitiesto extend their dominance; they thereforemake acquisitions to head off thosechallengers and to increase their scale. Inthe high-tech sector as a whole, marketleaders should defend the customer base by
High tech’s coming consolidation | 3
e x h i b i t 2
Unsustainable
Average EBIT1 margin of public IT companies by revenues,2 2002, %
1 Earnings before interest and taxes.2 Includes 2,121 companies worldwide in software (913), hardware (562), IT services (266), semiconductors (380).
Source: Bloomberg; Thomson Financial; McKinsey analysis
<$50 million
$50,000,000–$99,999,999
$100,000,000–$299,999,999
$300,000,000–$499,999,999
$500,000,000–$999,999,999
$1 billion–$5 billion
>$5 billion
–320
–1
2
–2
12
11
29
SoftwareRevenues
–167
–1
–1
2
4
3
5
Hardware
–29
–3
4
5
6
6
6
IT Services
–59
Semiconductors
–13
–9
–15
2
–4
11
4 | McKinsey on Finance | Spring 2004
e x h i b i t 3
Scale, scope, or skedaddle
1 Selling, general, and administrative.
Source: McKinsey analysis
Restructuring activity Drivers Examples
Scale: peer consolidation • Improved fixed-cost structures (SG&A,1 R&D, depreciation)
• Customer preference for bigger suppliers
• Network, platform effects
• Logic
• Memory
• Network/systems management, security
• Storage hardware
Scope: strategic cross-segment moves
• Customer preference for broader-reaching suppliers
• Channel, cross-selling synergies
• Technological synergies (such as those between networking and storage)
• Value migration from hardware to software, services
• Maturing core businesses; capital market pressures for growth
• Database: middleware, application server
• Hardware: IT services
Exit • Desire to limit losses, free up capital
• Refocusing resources on other businesses
• Logic
• PCs/notebooks
• Networking hardware: storage hardware, software
• Semiconductor equipment
tightening their control of the value chainand customer relationships or by creatingscale advantages in R&D and sales. Oracle,for instance, is pursuing a broader footprintand new growth in its play for PeopleSoft.
Scale offers efficiencies in large fixed costs—essential in industries requiring massiveup-front capital investment (like memorychips) or expensive R&D (like software). Italso extends control over the value chain.Customers gain confidence in the vendor’sability to provide long-term support servicesand are more likely to choose it as apreferred supplier. HP’s merger withCompaq, for example, gave HP enhancedcontrol over its value chain, cost synergies,and access to additional customers, to whichit could now sell more comprehensivesolutions. These factors should help HPcompete with IBM and Dell.
Scope acquisitions can broaden thefootprint of a leader and increase thedependence of its customers. Cisco Systems’growth strategy in the 1990s was based on
scope acquisitions, and the company swiftlyused its distribution capabilities to stake outstrong positions in access solutions andsecurity. Microsoft’s purchase of GreatPlains Software and Navision extended itsreach into enterprise applications. EMC’sacquisition of Legato Systems presaged amove away from the slower-growth andrapidly commoditizing storage-disk-subsystem market and into the system-management-software market—a corecontrol point of an enterprise ITinfrastructure. The company’s decision tobuy Documentum shows a similar moveinto content management.
For companies in some segments, such as IT services, scope deals offer an opportunity to become the primeintegrator for customers’ needs; IBM’sacquisition of the consulting arm ofPricewaterhouseCoopers is a recentexample. A few words of warning shouldbe sounded, however: if the acquisition hasa different revenue model (as in the case ofa hardware company acquiring a software
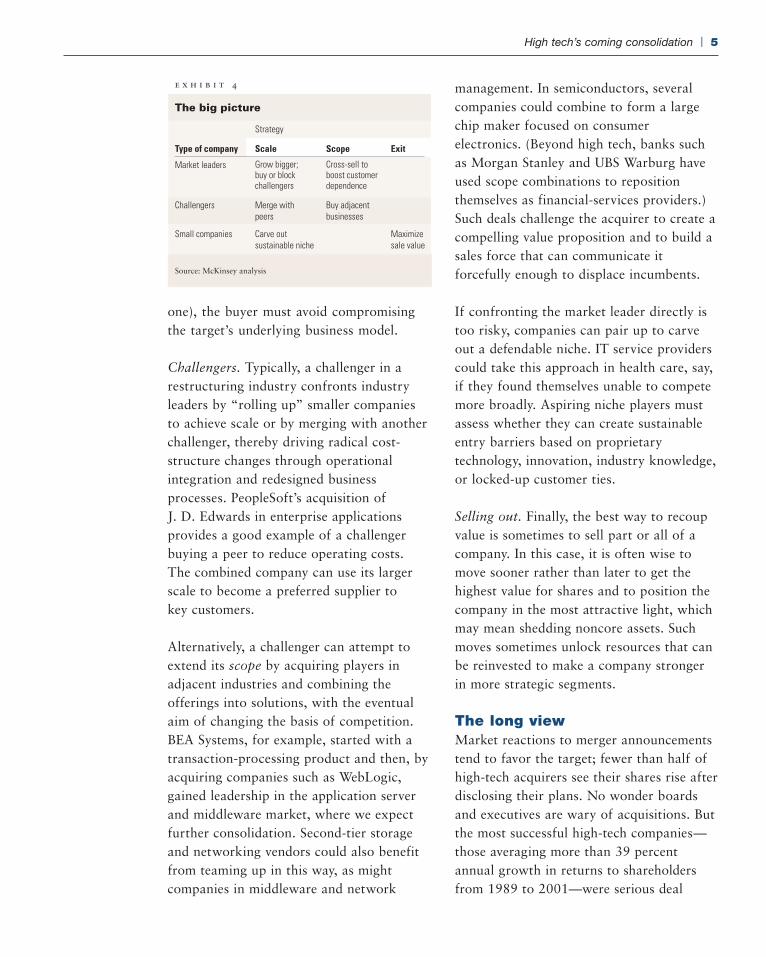
e x h i b i t 4
The big picture
Type of company Scale
Market leaders Grow bigger; buy or block challengers
Exit
Challengers Merge with peers
Scope
Cross-sell to boost customer dependence
Buy adjacent businesses
Small companies Carve out sustainable niche
Maximize sale value
Strategy
Source: McKinsey analysis
one), the buyer must avoid compromisingthe target’s underlying business model.
Challengers. Typically, a challenger in arestructuring industry confronts industryleaders by “rolling up” smaller companiesto achieve scale or by merging with anotherchallenger, thereby driving radical cost-structure changes through operationalintegration and redesigned businessprocesses. PeopleSoft’s acquisition ofJ. D. Edwards in enterprise applicationsprovides a good example of a challengerbuying a peer to reduce operating costs. The combined company can use its largerscale to become a preferred supplier to key customers.
Alternatively, a challenger can attempt toextend its scope by acquiring players inadjacent industries and combining theofferings into solutions, with the eventualaim of changing the basis of competition.BEA Systems, for example, started with atransaction-processing product and then, byacquiring companies such as WebLogic,gained leadership in the application serverand middleware market, where we expectfurther consolidation. Second-tier storageand networking vendors could also benefitfrom teaming up in this way, as mightcompanies in middleware and network
management. In semiconductors, severalcompanies could combine to form a largechip maker focused on consumerelectronics. (Beyond high tech, banks suchas Morgan Stanley and UBS Warburg haveused scope combinations to repositionthemselves as financial-services providers.)Such deals challenge the acquirer to create acompelling value proposition and to build asales force that can communicate itforcefully enough to displace incumbents.
If confronting the market leader directly istoo risky, companies can pair up to carveout a defendable niche. IT service providerscould take this approach in health care, say,if they found themselves unable to competemore broadly. Aspiring niche players mustassess whether they can create sustainableentry barriers based on proprietarytechnology, innovation, industry knowledge,or locked-up customer ties.
Selling out. Finally, the best way to recoupvalue is sometimes to sell part or all of acompany. In this case, it is often wise tomove sooner rather than later to get thehighest value for shares and to position thecompany in the most attractive light, whichmay mean shedding noncore assets. Suchmoves sometimes unlock resources that canbe reinvested to make a company strongerin more strategic segments.
The long viewMarket reactions to merger announcementstend to favor the target; fewer than half ofhigh-tech acquirers see their shares rise afterdisclosing their plans. No wonder boardsand executives are wary of acquisitions. Butthe most successful high-tech companies—those averaging more than 39 percentannual growth in returns to shareholdersfrom 1989 to 2001—were serious deal
High tech’s coming consolidation | 5
makers, undertaking almost twice as manyacquisitions as their competitors.2 Historyalso shows that companies with activeM&A agendas tend to outperform theirpeers during and after industry downturns.3
Companies that avoid acquisitions often runout of steam, whereas enterprising acquirersrenew and refocus themselves.
Companies should be cognizant of, but notoverly concerned with, investors’ short-termreactions. Instead, they need to ensure thatthe long-term returns from their acquisitionplans maximize shareholder value. TakeIntel, which in recent years has acquiredseveral suppliers of communications chips.Not all of the deals have been applauded assuccessful by observers (for example, theacquisition of Level One Communications),but together they helped Intel establish anew communications growth platform onwhich the company has built a multibillion-dollar business.
High valuations can sometimes makealliances more enticing than M&A,especially if synergies wouldn’t justify a fullacquisition. Dell’s recent alliances withEMC and Lexmark are examples of howthese arrangements can be used as a low-risk step to broaden a company’s scope intonew segments.
More hostile dealsMost technology mergers have been small,friendly affairs financed by the acquirer’sstock, but we expect that picture to change.Oracle’s attempt to acquire PeopleSoft is anearly example of what could become thenew reality in high-tech restructuring.Executives and boards should thus preparefor hostile takeovers, cash deals, and thegreater involvement of private equityfirms—all common in other sectors.
Furthermore, as companies reach for scaleand scope, they will attempt larger deals.While a hostile takeover is rarely thepreferred approach, these deals are likely tobecome more common, especially when thetarget’s management has strong incentivesto resist an acquisition that has realeconomic logic. For acquirers with deeppockets, cash offers may be more attractivein hostile situations, when cash can giveshareholders a low-risk way to take moneyout of their investments.
The scale and extent of the coming shifts inthe high-tech sector promise to unlocktremendous value for companies thatsurvive the consolidation. However quicklychange comes, those that act wisely canposition themselves as the shapers of hightech’s next era.
The authors wish to acknowledge the contributions of
Jukka Alanen and Jean-Francois Van Kerckhove,
consultants in McKinsey’s Silicon Valley office.
Bertil Chappuis ([email protected])
and Paul Roche ([email protected]) are
principals in McKinsey’s Silicon Valley office, where
Kevin Frick ([email protected]) is an
associate principal. Copyright © 2004 McKinsey &
Company. All rights reserved.
1 To measure the strength of each driver, we used qualitativeand quantitative metrics such as the Herfindahl-HirschmanIndex (a common metric established by the USDepartment of Justice and the US Federal TradeCommission) to assess the current degree offragmentation.
2 Kevin A. Frick and Alberto Torres, “Learning from high-techdeals,” The McKinsey Quarterly, 2002 Number 1,pp. 112–23.
3 Richard F. Dobbs, Tomas Karakolev, and Francis Malige,“Learning to love recessions,” The McKinsey Quarterly,2002 special edition: Risk and resilience, pp. 6–9.
MoF
6 | McKinsey on Finance | Spring 2004
When efficient capitaland operations go handin hand
Olli-Pekka Kallasvuo, Nokia’s head of mobilephones and a former CFO, discusses strategicorganization, performance measurement, andthe value of financial transparency.
When efficient capital and operations go hand in hand | 7
Nokia’s transformation from a Finnishconglomerate with its roots in pulp andpaper to the world’s leading mobile-phonesupplier has earned it a reputation as amodel of innovation, brand building, andoperational efficiency. Even during thesevere downturn in the telecommunicationsindustry the company maintained strongmargins on its sales of mobile phones.Today Nokia runs 16 manufacturingfacilities in 9 countries, conducts R&D in11 countries, and has more than 51,000employees around the world
Nokia is reorganizing itself yet again as itanticipates increased demand for high-techphones and other mobility products. A base of four business groups—mobilephones, networks, multimedia, andenterprise solutions—will exploit scaleadvantages across common functions suchas finance, marketing, and operations toprovide maximum flexibility for businessunits. The goal: “to go after every marketin this industry and take share.”
So says Olli-Pekka Kallasvuo, who inJanuary of this year was named head of the
mobile-phones group after serving as chieffinancial officer from 1992 to 1996 and1999 to 2003. A lawyer by training,Kallasvuo, 50, sees his move from financeto the leadership of the business groupresponsible for most of Nokia’s profits asperfectly natural. In an interview conductedat Nokia headquarters outside Helsinki,Kallasvuo spoke to Fredrik Lind andRisto Perttunen of McKinsey about Nokia’sstrategy, communicating with markets, andthe CFO’s mind-set when operational andcapital efficiencies go hand in hand.
McKinsey on Finance: What long-termtrends in the handset business do you see,and how are they affecting Nokia’s strategy?
Kallasvuo: The biggest long-term trend isour customers’ increasing mobility and, as aresult, their demands for ever moresophisticated handsets. In one sense, it’s akind of convergence of businesses into anew business domain defined by mobility.The result is that we’ll continue to see avery simplistic entry-level phone, with nobells and whistles, on one hand, and on theother hand we’ll see a multipurpose devicethat has all sorts of capabilities, like mobilegaming or mobile imaging. This is what weneed to tackle at Nokia, and hence thereorganization to align our structure todifferent segments of this market.
MoF: How do you think about measuringperformance?
Kallasvuo: The thinking over the years has definitely changed. We’ve learned tounderstand that for us, traditional measuresof performance like working capital, forexample, are financial matters, yes, butmore important they’re indicators of how a company is performing operationally.
Fredrik Lind andRisto Perttunen
8 | McKinsey on Finance | Spring 2004
When I look at working capital, I really see it first as a reflection of efficiency andthen as a reflection of where our capital isinvested, which is the reverse of the usualway of thinking.
MoF: So how do you track the company’sperformance over time?
Kallasvuo: A more capital-intensivebusiness would probably look much moreclosely at its returns on investment, butROI just is not as useful a measure for acompany that makes its money by investingin people, in research and development, andin brand marketing. Measures of efficiencyare much more helpful—operationalefficiencies, production efficiencies, and yes,financial efficiencies—and they really all gohand in hand. Production efficiencies andcapital efficiencies are very relevant forevery finance person at Nokia.
And if there were just one single thing todo to improve performance, it would havebeen done already. Improvement is usuallynot about making a quantum leap; it’sabout taking small steps, improving a littlebit every day. Nor is this about pushingresponsibility off to individual departmentsand saying, “You look at working capital,”or, “You look at inventory.” These are theresponsibility of everyone at Nokia becauseefficiency is the core of the business—and then working capital becomes areflection of how efficient we are, andthat’s why it’s such an important indicatorthat remains very high on our agenda evenif financially it’s not critically relevant atthe moment.
MoF: Can the corporate team and the CFOteam contribute to and lead the differentdivisions and businesses on the workingcapital dimension?
Kallasvuo: No; this is exactly the point.Efficiency is so intricately entwined in thesystem that everyone has a stake in it,everyone is helping out. So if you were tostart some big push for working capital atNokia, with a big headline saying, “Now weare going to emphasize working capital,” orannounce that suddenly financial concernswill drive everything, no one wouldunderstand what you’re talking about.Everyone understands that working capital iseveryone’s job—by taking those little stepsto get logistics working even better. This isone of our key competitive areas.
MoF: Are there any particular structures or processes at Nokia to make thiscooperation work?
Kallasvuo: In the end, it really comes downto a company’s business infrastructure and
Olli-Pekka Kallasvuo
Vital statistics• Born July 13, 1953, in Lavia, in western Finland
Education• Holds a Master of Laws degree from the University of Helsinki
Career highlights• Nokia, Inc. (1980 to present)
– Assistant vice president of the legal department (1987) – Assistant vice president of finance (1988) – Senior vice president of finance (1990) – Executive vice president and chief financial officer (1992 to 1996) – Corporate executive vice president, Nokia Americas (1997 to1998) – Chief financial officer (1999 to 2003) – Executive vice president and general manager of mobile phones at Nokia (2004–present)
Fast facts• Served as chair and board member of Helsinki Stock Exchange from
1991 to 1996• Serves on the boards of:
– Sampo, a Finnish full-service financial group – Nextrom Holding, a Swiss machine manufacturer – F-Secure, a Finnish company specializing in data security solutions
• In spare time, enjoys golf, tennis, and reading about political history
how it operates in general. As we havegrown from a small, flexible player to sucha large company, we’ve put considerableeffort into combining flexibility andeconomies of scale, which has an impact onhow we operate. The emphasis has been ondoing everything we can to take advantageof economies of scale where we can andwhere it makes sense, but not to centralizeanything that is business specific. We’vedrawn that line very carefully. If somethingis business specific, it gets maximumflexibility, empowerment, decentralization.If it’s not business specific, then let’s takethe economies of scale. The result has beenan increasing platformization, if you will, ofthe business infrastructure. And here thebusiness infrastructure means other than IT,so it’s a wider concept.
MoF: What have been the special challengesof communicating the results of a very fast-growing company to financial markets?
Kallasvuo: Communicating results is easy.Giving estimates is more of a challenge,because in this type of fast-moving businessno one can really know what will happenover three months—no one. No system inthis world can make that prediction in away that is certain. The best you can do iscommunicate your best understanding to the market at the time, which is actuallypretty simple.
At Nokia, we have been simply communi-cating our best possible understanding tothe market. We have not been playinggames. I was personally criticized by someinvestors for not playing games—for notgiving an estimate and then exceeding it byone penny, which so many companies weredoing. Now, of course, everyone feels thisway. Whatever numbers come out of the
system, in accordance with your accountingprinciples, those are your results.
MoF: What is your view of the emergenceof companies over the past year or so thatare minimizing their financial transparencyto the markets?
Kallasvuo: Of course, I can’t speak onbehalf of other companies, but I feel thatour investor base wants quarterly guidance.It’s very much a matter of providing themarkets with the information they want,rather than telling them what we think theyshould want. This isn’t brain surgery. If themarkets want information, you give theminformation.
The question has to be, how can we betterunderstand what our investors want? Themind-set really needs to be that we mustlisten and communicate in terms of what isexpected. This is very relevant coming froma small market and growing into one of themost traded shares in the world. We comefrom a context where we really didn’t havethe benefit of the doubt when it came toour existence and our ability to deliver overthe long-term. It really was an imperative tolisten to what investors expected—if we didnot have that mind-set, we never wouldhave become one of the most widely heldshares in the United States.
MoF: What is the optimal way to distributevalue back to the shareholders—for example,through share buybacks or dividends?
Kallasvuo: I don’t think there is a bigdifference between dividends and buybacks.In the end it’s a pragmatic choice, verymuch driven by tax questions and theshareholder base. Otherwise they’re bothpretty equal from the financial perspective.
When efficient capital and operations go hand in hand | 9
10 | McKinsey on Finance | Spring 2004
MoF: How important is it for a company tobe listed in the United States?
Kallasvuo: It’s really not possible tobecome a major name among US investorsif you’re not represented in the US marketin a major way. Being listed supports thebusiness, and the business supports thelisting—which Nokia’s experience in the1990s illustrates very well. Indeed, I would claim that without its listing in New York, Nokia would not have becomethe market leader in the United States.Furthermore, if it had not become a market leader in the United States, theshare story would have been a lot less well-known. When we first issued our IPO inthe United States, it wasn’t really that weneeded US capital but rather that the listingwould support the business, which is howit worked out. The result was a positivespiral, if there is such a thing, each onesupporting the other.
MoF: And how has that transformationchanged your relationship with shareholders—on both sides of the Atlantic?
Kallasvuo: Sometime in 1995 or 1996, we became the first company in the worldwith a major market cap that had themajority of its market capitalization comingfrom outside its home country, as domesticFinnish share dipped below 50 percent.That happened very suddenly andcontinued at a rapid pace. Other companies have since found themselves insimilar positions, but not to the sameextent. So we basically said to ourselves,“Now we have to see ourselves as a US company and we have to do things inthe same way a US company would,because that’s what a majority of ourinvestors will expect.”
That became a real priority. For example,instead of having our US investor relations(IR) staff report to an IR executive inHelsinki, we located the IR head office forthe entire company in the United States—andthen of course allocated a lot of resourcesand everything to make it work. Even theHelsinki-based IR office reported for manyyears to the US office. When it came tocommunications, we said to ourselves, weneed to communicate like a US company.Even today, if some capital-markets-relatedlegislation or other comes out of the UnitedStates that isn’t necessarily applicable tonon-US companies, we comply anyway, evenif the legislation does not, strictly speaking,apply. There is no other way for us.
Other companies have chosen exactly theother way: to be domestic first andforemost, abiding primarily by their owngovernment’s practices and legislation anddomestic shareholders. Which one is wrongor right I can’t say.
MoF: And how comfortable are you withNokia’s current level of transparency?
Kallasvuo: I can say that every time we havehad a discussion internally about whetherwe should go into this more transparentreporting, and every time we have made adecision to report instead of holding back,the decision to report has been the rightdecision, eventually. It’s what I feel. Notonce have I looked back and thought, “Whydid we have to tell this?” But here again, I would suggest that theories aside, in ourcase it’s been a necessity. You are foreign.You are an ADR.1 You don’t have the optionof not listening to what the market wants.
MoF: Is there any risk, as Nokia beginsreporting separately for multimedia

handsets and enterprise solutions? What ifone unit doesn’t achieve very good results?
Kallasvuo: No, definitely not. As I said,every time we’ve increased our transparencyit was the right decision, so it must be theright decision here too. And you have to alsoremember that external pressure is good foryou. It makes you run even harder. Thepeople running those operations have evenmore reason to perform if external pressureis there also. That’s been our experience.
MoF: Has the CFO been a part of thestrategic decision-making process in Nokia,and do you see that role being strengthenedin the future?
Kallasvuo: I don’t really think there is oneand only one role for a CFO. Of course, therole of a CFO has to be aligned with the waythe company operates, and it also dependsvery much on the size of the company. But itreally can’t be the same in every company, inevery business situation, and in every type ofbusiness a company is in.
At Nokia, being CFO has meant being very much a part of the management team, looking at matters from a financialperspective but really not taking the role of a finance guy who primarily becomesthe voice of that department. Instead ofdefining the role in one way and takingthat into the management team, the CFO at Nokia has a responsibility for the samedecisions as everyone else on themanagement team. Yes, of course, youmight look at those decisions from acertain perspective, but that doesn’t have to mean that you always take the same sort of role. You have to be more versatilethan that, which makes the role a verystrategic one.
MoF: In many companies, the role of theCFO has been expanding on the traditionalrole in two directions: the first is a morestrategic-architect or strategic-planning typeof role, even to the point of having M&Aor strategy divisions; the second is movingtoward a more involved operations role,enhancing some business-controllingactivities or leading corporate-pricing orworking-capital programs. What are yourthoughts on the evolution of the CFO rolein general?
Kallasvuo: If you assume a traditional sortof controller role as the starting point, thenyes, those are the two natural directions forthe role to evolve. But because it variesdepending on how the company operates,it’s also possible that both of those rolesmight even be combined. The latter role—the more involved operations role—isparticularly apt for the CFO of a majorbusiness unit, which is very much anoperational role in an operational unit. The former, more strategic role is more aptfor a corporate, head-office CFO whooperates, supervises, and oversees severalbusiness units. And both are quite relevantat Nokia, too, because of how we operateand how the roles of the business units oreven business groups have been defined.And I would also claim that the role of theCFO must be aligned to the approach ofthe CEO. Without alignment, success isdifficult.
Fredrik Lind ([email protected]) is a
principal in McKinsey’s Stockholm office, and
Risto Perttunen ([email protected])
is a director in the Helsinki office. Copyright © 2004
McKinsey & Company. All rights reserved.
1 American depository receipt
MoF
When efficient capital and operations go hand in hand | 11
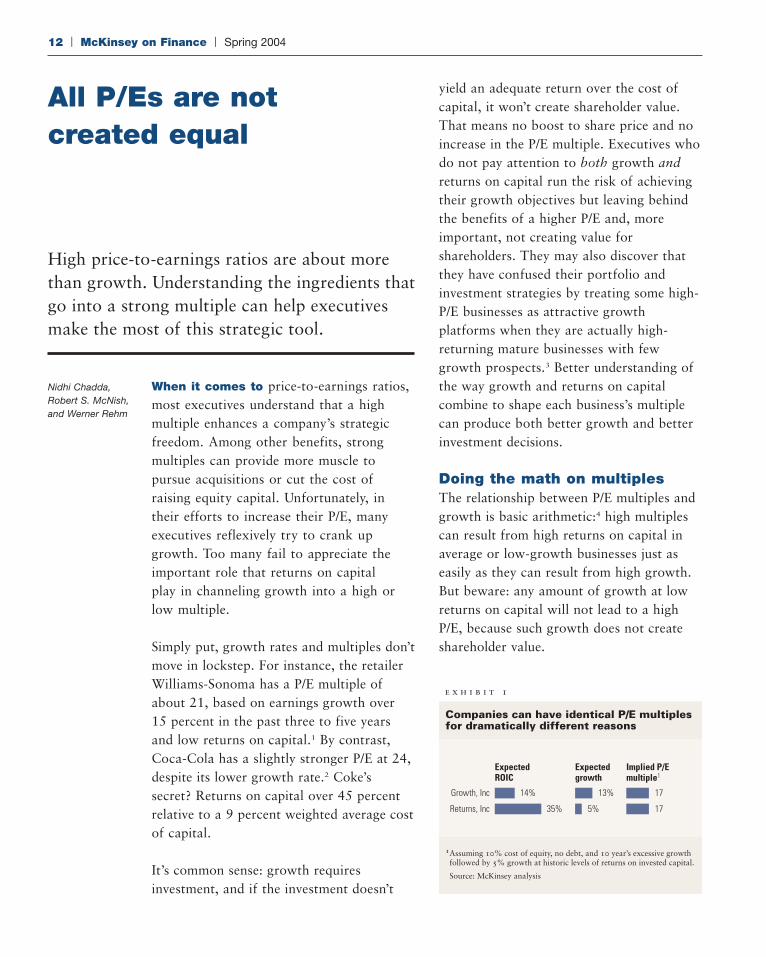
e x h i b i t 1
Companies can have identical P/E multiples for dramatically different reasons
1 Assuming 10% cost of equity, no debt, and 10 year’s excessive growth followed by 5% growth at historic levels of returns on invested capital.
Source: McKinsey analysis
Expected ROIC
Expected growth
Implied P/E multiple1
Growth, Inc 14% 13% 17
Returns, Inc 35% 5% 17
All P/Es are not created equal
High price-to-earnings ratios are about morethan growth. Understanding the ingredients thatgo into a strong multiple can help executivesmake the most of this strategic tool.
When it comes to price-to-earnings ratios,most executives understand that a highmultiple enhances a company’s strategicfreedom. Among other benefits, strongmultiples can provide more muscle topursue acquisitions or cut the cost ofraising equity capital. Unfortunately, intheir efforts to increase their P/E, manyexecutives reflexively try to crank upgrowth. Too many fail to appreciate theimportant role that returns on capital play in channeling growth into a high orlow multiple.
Simply put, growth rates and multiples don’tmove in lockstep. For instance, the retailerWilliams-Sonoma has a P/E multiple ofabout 21, based on earnings growth over15 percent in the past three to five yearsand low returns on capital.1 By contrast,Coca-Cola has a slightly stronger P/E at 24,despite its lower growth rate.2 Coke’ssecret? Returns on capital over 45 percentrelative to a 9 percent weighted average costof capital.
It’s common sense: growth requiresinvestment, and if the investment doesn’t
yield an adequate return over the cost ofcapital, it won’t create shareholder value.That means no boost to share price and noincrease in the P/E multiple. Executives whodo not pay attention to both growth andreturns on capital run the risk of achievingtheir growth objectives but leaving behindthe benefits of a higher P/E and, moreimportant, not creating value forshareholders. They may also discover thatthey have confused their portfolio andinvestment strategies by treating some high-P/E businesses as attractive growthplatforms when they are actually high-returning mature businesses with fewgrowth prospects.3 Better understanding ofthe way growth and returns on capitalcombine to shape each business’s multiplecan produce both better growth and betterinvestment decisions.
Doing the math on multiplesThe relationship between P/E multiples andgrowth is basic arithmetic:4 high multiplescan result from high returns on capital inaverage or low-growth businesses just aseasily as they can result from high growth.But beware: any amount of growth at lowreturns on capital will not lead to a highP/E, because such growth does not createshareholder value.
12 | McKinsey on Finance | Spring 2004
Nidhi Chadda,Robert S. McNish,and Werner Rehm
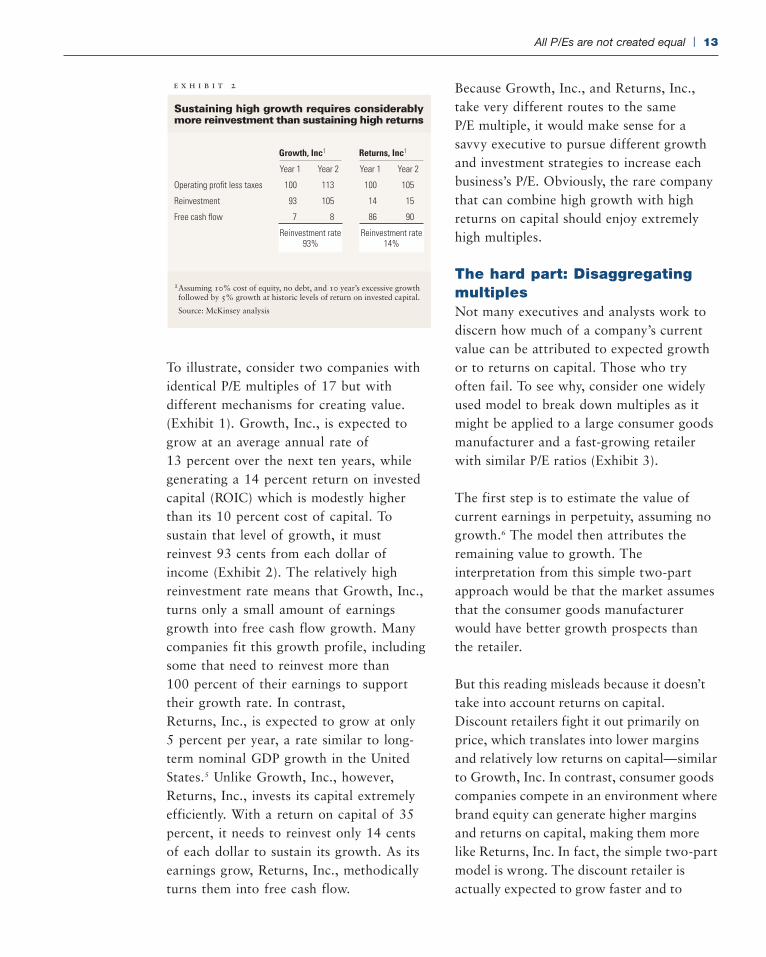
To illustrate, consider two companies withidentical P/E multiples of 17 but withdifferent mechanisms for creating value.(Exhibit 1). Growth, Inc., is expected togrow at an average annual rate of13 percent over the next ten years, whilegenerating a 14 percent return on investedcapital (ROIC) which is modestly higherthan its 10 percent cost of capital. Tosustain that level of growth, it mustreinvest 93 cents from each dollar ofincome (Exhibit 2). The relatively highreinvestment rate means that Growth, Inc.,turns only a small amount of earningsgrowth into free cash flow growth. Manycompanies fit this growth profile, includingsome that need to reinvest more than100 percent of their earnings to supporttheir growth rate. In contrast,Returns, Inc., is expected to grow at only5 percent per year, a rate similar to long-term nominal GDP growth in the UnitedStates.5 Unlike Growth, Inc., however,Returns, Inc., invests its capital extremelyefficiently. With a return on capital of 35percent, it needs to reinvest only 14 centsof each dollar to sustain its growth. As itsearnings grow, Returns, Inc., methodicallyturns them into free cash flow.
Because Growth, Inc., and Returns, Inc.,take very different routes to the sameP/E multiple, it would make sense for asavvy executive to pursue different growthand investment strategies to increase eachbusiness’s P/E. Obviously, the rare companythat can combine high growth with highreturns on capital should enjoy extremelyhigh multiples.
The hard part: DisaggregatingmultiplesNot many executives and analysts work todiscern how much of a company’s currentvalue can be attributed to expected growthor to returns on capital. Those who tryoften fail. To see why, consider one widelyused model to break down multiples as itmight be applied to a large consumer goodsmanufacturer and a fast-growing retailerwith similar P/E ratios (Exhibit 3).
The first step is to estimate the value ofcurrent earnings in perpetuity, assuming nogrowth.6 The model then attributes theremaining value to growth. Theinterpretation from this simple two-partapproach would be that the market assumesthat the consumer goods manufacturerwould have better growth prospects thanthe retailer.
But this reading misleads because it doesn’ttake into account returns on capital.Discount retailers fight it out primarily onprice, which translates into lower marginsand relatively low returns on capital—similarto Growth, Inc. In contrast, consumer goodscompanies compete in an environment wherebrand equity can generate higher marginsand returns on capital, making them morelike Returns, Inc. In fact, the simple two-partmodel is wrong. The discount retailer isactually expected to grow faster and to
All P/Es are not created equal | 13
e x h i b i t 2
Sustaining high growth requires considerably more reinvestment than sustaining high returns
1 Assuming 10% cost of equity, no debt, and 10 year’s excessive growth followed by 5% growth at historic levels of return on invested capital.
Source: McKinsey analysis
Growth, Inc1 Returns, Inc1
Operating profit less taxes
Year 1 Year 2 Year 1
Reinvestment rate 93%
Reinvestment rate 14%
Year 2
100 113 100 105
93 105 14 15
7 8 86 90
Reinvestment
Free cash flow
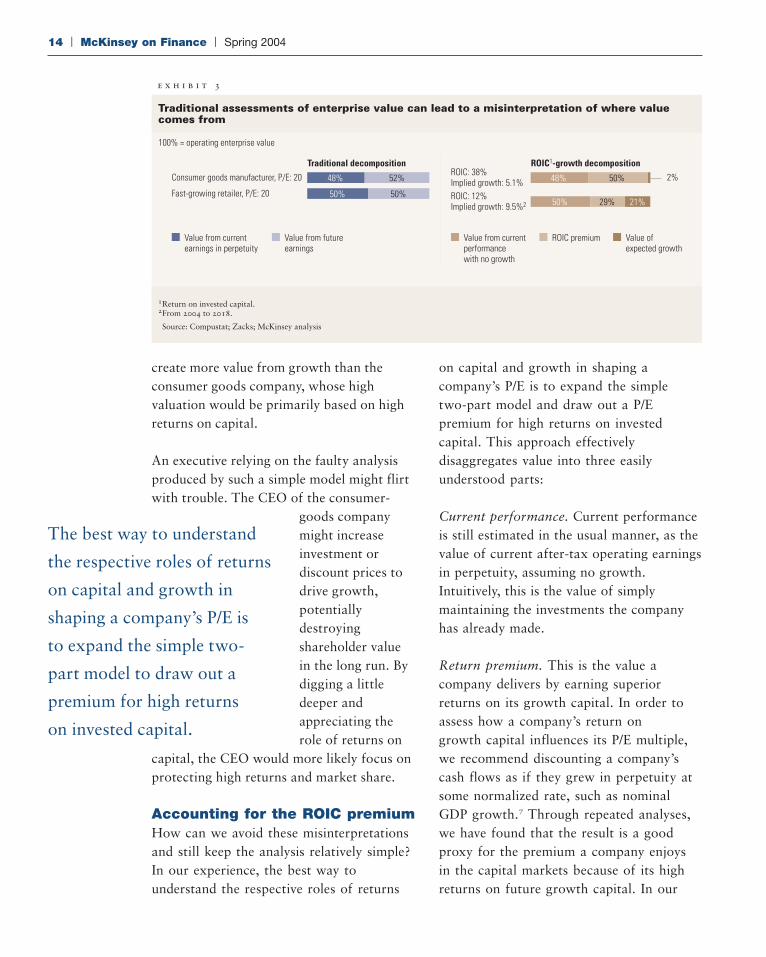
e x h i b i t 3
Traditional assessments of enterprise value can lead to a misinterpretation of where value comes from
1 Return on invested capital.2 From 2004 to 2018.
Source: Compustat; Zacks; McKinsey analysis
100% = operating enterprise value
Traditional decomposition
Consumer goods manufacturer, P/E: 20
Fast-growing retailer, P/E: 20
52%48%
50%50%
ROIC1-growth decompositionROIC: 38% Implied growth: 5.1%ROIC: 12% Implied growth: 9.5%2 21%
2%
29%
50%
50%
48%
Value from current performance with no growth
ROIC premiumValue from current earnings in perpetuity
Value from future earnings
Value of expected growth
14 | McKinsey on Finance | Spring 2004
create more value from growth than theconsumer goods company, whose highvaluation would be primarily based on highreturns on capital.
An executive relying on the faulty analysisproduced by such a simple model might flirtwith trouble. The CEO of the consumer-
goods companymight increaseinvestment ordiscount prices todrive growth,potentiallydestroyingshareholder valuein the long run. Bydigging a littledeeper andappreciating therole of returns on
capital, the CEO would more likely focus onprotecting high returns and market share.
Accounting for the ROIC premiumHow can we avoid these misinterpretationsand still keep the analysis relatively simple?In our experience, the best way tounderstand the respective roles of returns
on capital and growth in shaping acompany’s P/E is to expand the simple two-part model and draw out a P/Epremium for high returns on investedcapital. This approach effectivelydisaggregates value into three easilyunderstood parts:
Current performance. Current performanceis still estimated in the usual manner, as thevalue of current after-tax operating earningsin perpetuity, assuming no growth.Intuitively, this is the value of simplymaintaining the investments the companyhas already made.
Return premium. This is the value acompany delivers by earning superiorreturns on its growth capital. In order toassess how a company’s return on growth capital influences its P/E multiple,we recommend discounting a company’scash flows as if they grew in perpetuity atsome normalized rate, such as nominalGDP growth.7 Through repeated analyses,we have found that the result is a goodproxy for the premium a company enjoys in the capital markets because of its highreturns on future growth capital. In our
The best way to understand
the respective roles of returns
on capital and growth in
shaping a company’s P/E is
to expand the simple two-
part model to draw out a
premium for high returns
on invested capital.
example, the consumer goods manufacturerwould enjoy a large return premium,consistent with its high historical returnson capital.
Value from growth. This value representshow much a company delivers by growingover and above nominal GDP growth. It canbe calculated as that portion of thecompany’s current market value that is notcaptured in current performance or thereturn premium.8 While more sophisticatedand time-consuming analyses are sometimesappropriate, in our experience executivescan learn a lot about their P/E multiple with
this simple three-part model.
How might anexecutive changehis or her insightsabout the consumergoods company andthe discount retailerusing this three-part
model? The consumer goods companywould be seen to enjoy a large premium forits return on capital. In the consumer goodssector, preserving that return premium mustbe paramount, but anything the companycan do to increase its organic growth ratewhile preserving its return premium wouldtranslate directly into shareholder value andthe possibility of a very high multiple.
In contrast, the CEO of the discount retailerwould face a tiny premium for return oncapital, since his or her company derivesmost of its value from the rapid growthprospects. Anything this company could doto increase its ROIC, possibly even reiningin its growth rate, would add value. Byapplying the model to calibrate the trade-offbetween growth and return, the CEO could
even determine that a top managementpriority is to redirect some attention fromgrowth to operations improvement.
High P/E multiples can serve as a powerfulstrategic tool. Executives who understandthe complex chemistry of growth, returns,and P/E multiples will be better positionedto make strategic and operating decisionsthat increase shareholder value.
Nidhi Chadda ([email protected])
and Werner Rehm ([email protected])
are consultants in McKinsey’s New York office.
Rob McNish ([email protected]) is a
principal in the Washington, DC, office.
Copyright © 2004, McKinsey & Company.
All rights reserved.
1 Adjusted for operating leases, Williams-Sonoma’s ROIChas historically averaged about 10 percent, the same as itscost of capital.
2 Coke reports earnings around 3 percent over the pastseven years.
3 Likewise, stock market investors can make the samemistake by thinking they are investing in high P/E “growthstocks” when in fact some of these stocks are high-returning “value” investments.
4 For instance, assuming perpetuity growth for a companywithout any financial leverage, P/E = (1 – growth/return oncapital)/(cost of capital – growth).
5 Real GDP growth over the past 40 years in the UnitedStates was 3.5 percent.
6 At no growth, we assume that depreciation is equal tocapital expenditure, and therefore net operating profits lessadjusted taxes (NOPLAT) is equal to free cash flow for abusiness that does not grow. In effect, the first contributoris calculated as NOPLAT divided by the company’s cost ofcapital.
7 This can be achieved without an explicit discounted cashflow model by using, for example, the value driver formuladerived by Tom Copeland, Tim Koller, and Jack Murrin,Valuation: Measuring and Managing the Value ofCompanies, third edition, New York: John Wiley & Sons,2000.
8 For a company that grows more slowly than GDP, thisvalue will be negative.
MoF
All P/Es are not created equal | 15
While more sophisticated
analyses are sometimes
appropriate, executives can
learn a lot about their P/E
multiple with this simple
three-part model.
Putting value back in value-basedmanagement
Value-based management programs focus too much on measurement and too little on the management activities that createshareholder value.
Value-based management (VBM) burstonto the scene a decade ago with arevolutionary promise: a company thattraded in traditional managementapproaches in favor of VBM could align itsaspirations, mind-set, and managementprocesses with everyday decisions that trulyadd shareholder value. Name the initiative—investing in a new project, say, or spinningoff a subsidiary, or implementing newcustomer-service guidelines—andmanagement could not only pinpoint betterprojects but also better understand the valuethey would create for shareholders. Indeed,well-implemented VBM programs typicallydeliver a 5 to 15 percent increase inbottom-line results.
Sadly, even as VBM has evolved, mostprograms are notable more for theirimplementation shortfalls than for theirsuccesses. In our ongoing work anddiscussions with executives, we have begunto identify a few common pitfalls that haverepeatedly plagued underperformingVBM programs going back years as well assome newer wrinkles that stanch the benefitsthat VBM can deliver. We’ve also developed
16 | McKinsey on Finance | Spring 2004
Richard J. Benson-Armer, Richard F.Dobbs, andPaul Todd
an anecdotal view of how the mostsuccessful practitioners push the principlesof VBM to achieve its real promise forshareholders.
Simply put, ailing VBM programs typicallysettle for merely measuring value creation inbusiness initiatives, while successfulapproaches push to link tightly themeasurement to how the business can beimproved. For example, some companiesmechanically measure historicalperformance but then fail to apply whatthey’ve learned to the strategies from whichvalue should flow. Most also neglect toaccount for future growth andsustainability. Others make this importantlink but then set targets in ways that fail tomobilize the troops needed to make VBMpay off. Still others go to great lengths toimplement VBM programs but then relegatethem to the finance department, where theylanguish without the commitment of senior-level management.
Troubled VBM programs do not necessarilymanifest all these symptoms at once. In ourexperience, however, the vast majoritysuffer from at least one. Moreover, the bestpractitioners have learned to overcome themand can provide guidance about how topush VBM to better fulfill its potential.
Missing the link betweenmeasurement and valueThe original breakthrough of value-basedmanagement was to draw attention to thefailure of traditional accounting measures,such as net income and earnings per share,to account for the cost of capital.Traditional managers focused far moreintently on improving cost and grossmargin and paid little if any attention tothe capital invested in the business. As a

Putting value back in value-based management | 17
result, it was common to find projects inwhich much of the capital deployed inbusinesses was wasted.
As managers focused on value creation andthe true economic cost of capital deployedin the business, VBM proponentsintroduced metrics to measure a business’sor program’s value, including return oninvested capital (ROIC), economic profit,cash flow return on investment (CFROI), oreconomic value added (EVA™).1 Theadvantages of different measures vary(Exhibit 1), but they all attempt torecognize the cost of capital in thebenchmarks managers use to gauge thevalue their decisions create.
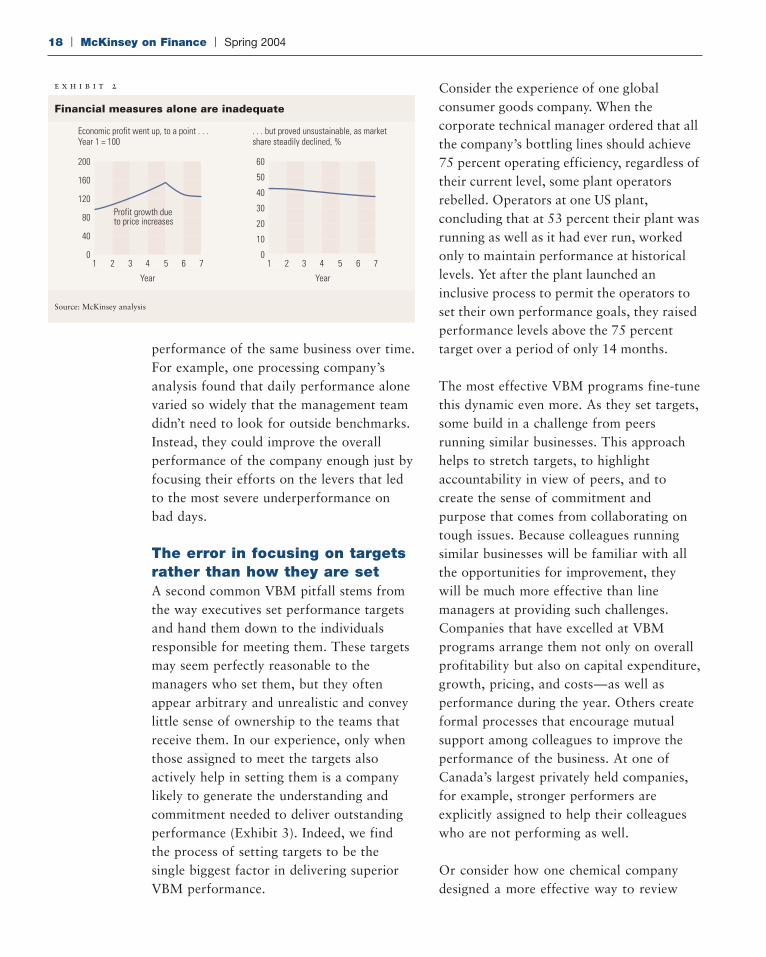
Yet many companies fall into the trap offocusing their measurement too much onhistorical returns, which are easilyquantified, and too little on more forward-looking contributors to value: growth andsustainability. For instance, one consumergoods company (Exhibit 2) was able todemonstrate strong economic returns for
five years as measured by economic profit.But because the company delivered itsgrowth by increasing prices, it ultimatelydamaged its customer franchise and couldnot sustain its growth rate.
Companies that apply VBM at a moreadvanced level move beyond measurement tohelp the management team focus on thelevers that can be used to improve thebusiness. The best programs use value trees2
to identify underlying drivers of operatingvalue. These have long been at the core ofVBM theory, but we find that they are stillconspicuously missing in many applications.
Savvy VBM practitioners use these trees toidentify areas of improvement, pushing deepinto a business’s operating performance andcomparing it with others to create clearbenchmarks. These benchmarks can also bepegged to the performance of peers outsidethe company, or to the performance ofsimilar internal businesses. One particularlyinformative and credible internal benchmarkcomes from analyzing the historical
e x h i b i t 1
Metrics designed to measure value have strengths—and weaknesses
1 EBITDA = earnings before interest, taxes, depreciation, amortization; ROS = return on sales; EPS = earnings per share; ROE = return on equity; ROCE = return on capital employed; ROIC = return on invested capital; ROA = return on assets; EVA = economic value added; DCF = discounted cash flow; IRR = internal rate of return; CFROI = cash flow return on investment
Source: McKinsey analysis
Traditional P&L and balance sheet approaches
• Revenues• EBITDA1
• Net income• Book value• ROS1
• EPS1 (diluted or not)
• Relevance for management declining, but still widely used by companies for communication to investors (e.g., EPS)
• Economic cost of the capital invested ignored
• Growth, long-term performance, and sustainability not taken into account
Value creation: historical metrics
• Return ratios –ROE1 –ROCE,1 ROIC1 –ROA1
• Economic profit or EVA1
• Widely used concepts orientated towards taking into account the economic cost of the capital in the business
• Growth, long-term performance, and sustainability not taken into account
Value: forward-looking metrics
• DCF1-value• Discounted EVA1
• IRR1
• CFROI1
• Required for active management of company’s value
• Explicit consideration of growth and long-term impact of decisions
• High correlation to market value of company
• Much harder to measure accurately and so can be gamed
18 | McKinsey on Finance | Spring 2004
performance of the same business over time.For example, one processing company’sanalysis found that daily performance alonevaried so widely that the management teamdidn’t need to look for outside benchmarks.Instead, they could improve the overallperformance of the company enough just byfocusing their efforts on the levers that ledto the most severe underperformance onbad days.
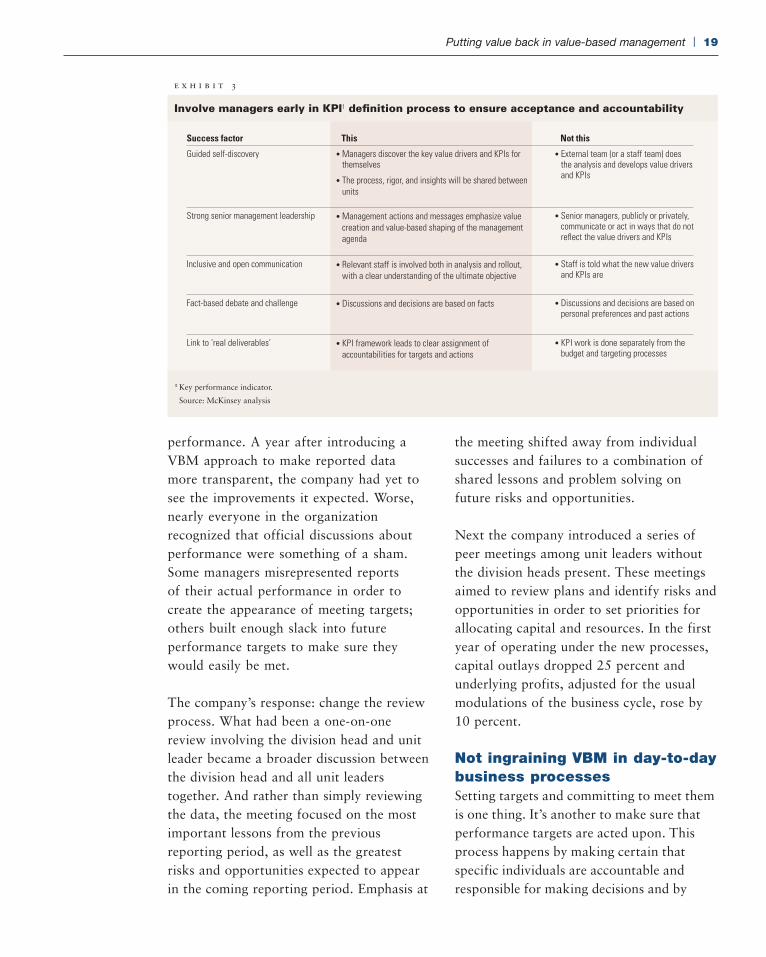
The error in focusing on targetsrather than how they are setA second common VBM pitfall stems fromthe way executives set performance targetsand hand them down to the individualsresponsible for meeting them. These targetsmay seem perfectly reasonable to themanagers who set them, but they oftenappear arbitrary and unrealistic and conveylittle sense of ownership to the teams thatreceive them. In our experience, only whenthose assigned to meet the targets alsoactively help in setting them is a companylikely to generate the understanding andcommitment needed to deliver outstandingperformance (Exhibit 3). Indeed, we findthe process of setting targets to be thesingle biggest factor in delivering superiorVBM performance.
Consider the experience of one globalconsumer goods company. When thecorporate technical manager ordered that allthe company’s bottling lines should achieve75 percent operating efficiency, regardless oftheir current level, some plant operatorsrebelled. Operators at one US plant,concluding that at 53 percent their plant wasrunning as well as it had ever run, workedonly to maintain performance at historicallevels. Yet after the plant launched aninclusive process to permit the operators toset their own performance goals, they raisedperformance levels above the 75 percenttarget over a period of only 14 months.
The most effective VBM programs fine-tunethis dynamic even more. As they set targets,some build in a challenge from peersrunning similar businesses. This approachhelps to stretch targets, to highlightaccountability in view of peers, and tocreate the sense of commitment andpurpose that comes from collaborating ontough issues. Because colleagues runningsimilar businesses will be familiar with allthe opportunities for improvement, theywill be much more effective than linemanagers at providing such challenges.Companies that have excelled at VBMprograms arrange them not only on overallprofitability but also on capital expenditure,growth, pricing, and costs—as well asperformance during the year. Others createformal processes that encourage mutualsupport among colleagues to improve theperformance of the business. At one ofCanada’s largest privately held companies,for example, stronger performers areexplicitly assigned to help their colleagueswho are not performing as well.
Or consider how one chemical companydesigned a more effective way to review
e x h i b i t 2
Financial measures alone are inadequate
Economic profit went up, to a point . . . Year 1 = 100
. . . but proved unsustainable, as market share steadily declined, %
Source: McKinsey analysis
160
120
200
Year Year
80
40
01 3 5 72 4 6
0
10
20
30
40
50
60
1 3 5 72 4 6
Profit growth due to price increases
performance. A year after introducing aVBM approach to make reported data more transparent, the company had yet tosee the improvements it expected. Worse,nearly everyone in the organizationrecognized that official discussions aboutperformance were something of a sham.Some managers misrepresented reports of their actual performance in order tocreate the appearance of meeting targets;others built enough slack into futureperformance targets to make sure theywould easily be met.
The company’s response: change the reviewprocess. What had been a one-on-onereview involving the division head and unitleader became a broader discussion betweenthe division head and all unit leaderstogether. And rather than simply reviewingthe data, the meeting focused on the mostimportant lessons from the previousreporting period, as well as the greatestrisks and opportunities expected to appearin the coming reporting period. Emphasis at
the meeting shifted away from individualsuccesses and failures to a combination ofshared lessons and problem solving onfuture risks and opportunities.
Next the company introduced a series ofpeer meetings among unit leaders withoutthe division heads present. These meetingsaimed to review plans and identify risks andopportunities in order to set priorities forallocating capital and resources. In the firstyear of operating under the new processes,capital outlays dropped 25 percent andunderlying profits, adjusted for the usualmodulations of the business cycle, rose by10 percent.
Not ingraining VBM in day-to-daybusiness processesSetting targets and committing to meet themis one thing. It’s another to make sure thatperformance targets are acted upon. Thisprocess happens by making certain thatspecific individuals are accountable andresponsible for making decisions and by
Putting value back in value-based management | 19
e x h i b i t 3
Involve managers early in KPI1 definition process to ensure acceptance and accountability
Success factor This Not this
Guided self-discovery • Managers discover the key value drivers and KPIs for themselves
• The process, rigor, and insights will be shared between units
• External team (or a staff team) does the analysis and develops value drivers and KPIs
Strong senior management leadership • Management actions and messages emphasize value creation and value-based shaping of the management agenda
• Senior managers, publicly or privately, communicate or act in ways that do not reflect the value drivers and KPIs
Inclusive and open communication • Relevant staff is involved both in analysis and rollout, with a clear understanding of the ultimate objective
• Staff is told what the new value drivers and KPIs are
Fact-based debate and challenge • Discussions and decisions are based on facts • Discussions and decisions are based on personal preferences and past actions
Link to ‘real deliverables’ • KPI framework leads to clear assignment of accountabilities for targets and actions
• KPI work is done separately from the budget and targeting processes
1 Key performance indicator.
Source: McKinsey analysis
20 | McKinsey on Finance | Spring 2004
guaranteeing a link between performanceand an individual’s evaluation process.
One energy company, for example,implemented a VBM program that seemedto have all the right parts. But managementthen failed to carry it over from a discreteprogram in the finance department to
engage theentire company.This result wasdespite the factthat thecompany’sfinance teamdeveloped afirst-rate
scorecard covering financial performance,operating drivers, organizational health,and customer service. Nearly a year later,there was no discernible impact. Beyondtop-level conversations, few of thecompany’s managers used the scorecard—some didn’t even know what it was. Theyhad had no involvement in the program’sdevelopment, little understanding of whythe new scorecard was necessary, and noincentive to use it. The few that did use itfound that targets regularly were missed.
Some companies overcome this pitfall byusing a formal performance contract toexplicitly link the key performanceindicators—such as sales, profit margin,return on investment, and customersatisfaction—with roles such as salesmanager, business unit manager, financemanager, and call-center managerrespectively. This link forces an explicitconversation to take place about whetherroles and decision rights are correctly linedup. Other companies link their people-evaluation system to hitting targets, withexplicit rules about dismissals for
individuals who fail to meet their targetsmore than once. By tying performanceevaluation and compensation to individualobjectives, performance can also be alignedwith the objectives of the VBM program.
A rule of thumb: until a VBM program isan integral part of how a companymanages, it will always be simply“something else to do” and will inevitablyfail as employees continue to perform asthey always have. Finance department inputis essential, for example, but delegatingVBM to the finance department as adiscrete, isolated program is a surefire wayto snuff its potential.
Too few VBM programs have fulfilled theirearly promise. But recognizing commonpatterns in programs that have gone awry isa first step in moving VBM closer to its goalto help line managers deliver betterperformance for shareholders.
Richard Benson-Armer (Richard_Benson-
[email protected]) is a principal in McKinsey’s
Toronto office. Richard Dobbs (Richard_Dobbs
@McKinsey.com) is a principal in the London office,
where Paul Todd ([email protected]) is an
associate principal. Copyright © 2004 McKinsey &
Company. All rights reserved.
The authors wish to acknowledge the valuable
contributions of Joe Hughes, Tim Koller, and
Carlos Murrieta to the development of this article.
1 EVA is a registered trade mark of Stern, Stewart & Co.,New York, and is synonymous with the more generic term,“economic profit.”
2 Tom Copeland, Tim Koller, and Jack Murrin, Valuation:Measuring and Managing the Value of Companies, thirdedition, New York: John Wiley & Sons, 2000.
MoF
Until a VBM program is an
integral part of how a company
manages, it will always be
simply something else to do
and will inevitably fail.

AMSTERDAMANTWERP
ATHENSATLANTA
AUCKLANDAUSTIN
BANGKOKBARCELONA
BEIJINGBERLIN
BOGOTABOSTON
BRUSSELSBUDAPEST
BUENOS AIRESCARACAS
CHARLOTTECHICAGO
CLEVELANDCOLOGNE
COPENHAGENDALLAS
DELHIDETROIT
DUBAIDUBLIN
DÜSSELDORFFRANKFURT
GENEVAGOTHENBURG
HAMBURGHELSINKI
HONG KONGHOUSTONISTANBULJAKARTA
JOHANNESBURGKUALA LUMPUR
LISBONLONDON
LOS ANGELESMADRIDMANILA
MELBOURNEMEXICO CITY
MIAMIMILAN
MINNEAPOLISMONTERREY
MONTRÉALMOROCCO
MOSCOWMUMBAIMUNICH
NEW JERSEYNEW YORK
OSLOPACIFIC NORTHWEST
PARISPITTSBURGH
PRAGUEQATAR
RIO DE JANEIROROME
SAN FRANCISCOSANTIAGO
SÃO PAULOSEOUL
SHANGHAISILICON VALLEY
SINGAPORESTAMFORD
STOCKHOLMSTUTTGART
SYDNEYTAIPEI
TEL AVIVTOKYO
TORONTOVERONAVIENNA
WARSAWWASHINGTON, DC
ZAGREBZURICH

Copyright © 2004 McKinsey & Company
Top Related
Copyright © 2022 FDOKUMEN

