


Bahasa
Halaman
Hukum


Massachusetts Division of Insurance Statistical Supplement to the Annual
Home Insurance Report For Calendar Year 2015


Acknowledgements
The enclosed statistical supplement was prepared by the State Rating Bureau staff of the Massachusetts Division
of Insurance (“Division”). Matthew M. Mancini, State Rating Bureau Director, Gerald B. Condon, State Rating
Bureau Researcher, Caleb E. Huntington, State Rating Bureau Mathematician, Bashiru Abubakare, State Rating
Bureau Actuary / Statistician and Daniel M. D’Amico, State Rating Bureau Research Analyst as material that
complement what is included in the 2015 Annual Report on the Massachusetts Market for Home Insurance.
The material included in this statistical supplement to the annual report is based primarily on responses from
companies and statistical reporting organizations reflecting the experience of companies in the home insurance
market. Unless otherwise noted in the report, references to home insurance, includes traditional home insurance,
as well as condominium and rental insurance. The Division makes all appropriate efforts to check the
completeness and consistency of data reported by insurance companies and their statistical agents, but
does rely on the insurance companies for the accuracy of all reported information.

STATISTISICAL SUPPLEMENT TO
THE 2015 REPORT ON
THE MASSACHUSETTS MARKET FOR HOME INSURANCE Page Title
2015 Market Summary 1 History of Multi-Peril Home Insurance in Massachusetts
7 Exhibit 1A M.G.L. c. 175, § 4A
10 Exhibit 1B M.G.L. c. 175, § 4B
FAIR Plan Credits and Credit Eligible Zip Codes
11 Exhibit 2A 2015 FAIR Plan Calendar Year Credit Eligible Zip Codes and Weights
12 Exhibit 2B 2015 FAIR Plan Calendar Year Coastal Zip Codes Eligible for Take-Out Credits
Wind Deductibles
13 Exhibit 3A Mandatory Wind/Hurricane/Named Storm Deductible Summary
14 Exhibit 3B Policies In-Force for Selected Zip Codes - Wind/Hurricane/Named Storm Deductibles
2015 Premiums and Losses (M.G.L. c. 175, § 4A) Home Insurance Written Premium
19 Exhibit 4A 2013-15 Total Market Home Written Premium by Territory
20 Exhibit 4B 2013-15 Total Market Home Written Premium by Zip Code
35 Exhibit 4C 2013-15 FAIR Plan Home Premium Market Share by Territory
Home Insurance Premium & Loss Experience by Territory
36 Exhibit 5A 2015 Voluntary Market Home Premium & Loss Experience by Territory by Form
40 Exhibit 5B 2015 FAIR Plan Home Premium & Loss Experience by Territory by Form
44 Exhibit 5C 2015 Total Market Home Premium & Loss Experience by Territory by Form
48 Exhibit 5D 2015 Top 25 Insurers/FAIR Plan Aggregate Premium & Loss Experience by Zip Code
Home Insurance Loss Ratios
75 Exhibit 6A Changes in Massachusetts Loss Ratios, All Home Forms
76 Exhibit 6B Changes in Massachusetts Loss Ratios, Home Forms Only
77 Exhibit 6C 2015 Cause of Loss by Territory by Form, All Home Forms
Causes of Home Losses
88 Exhibit 7A 2011-15 Percent of Loss Dollars by Cause of Loss by Territory
90 Exhibit 7B Snowfall, Boston, Massachusetts, 1974-2016 Winter Seasons
Snowfall, Boston, Massachusetts, 2002-2015 Calendar Years
2015 Home Insurance Cancellation/Nonrenewal (M.G.L. c. 175, § 4B) 92 Exhibit 8A Individual Insurer and FAIR Plan 2015 Cancellation/Nonrenewal Reports
222 Exhibit 8B Top 25 Insurers and FAIR Plan 2015 Aggregate Cancellation/Nonrenewal Report
227 Exhibit 8C Summary of 2015 Cancellations
228 Exhibit 8D Summary of 2015 Nonrenewals
229 Exhibit 8E 2015 Renewal/Nonrenewal Claims History


HISTORY OF MULTI-PERIL HOME
INSURANCE IN MASSACHUSETTS
1

[Page intentionally left blank]
2
Multi-Peril Home Insurance
The Division of Insurance produces “A Massachusetts Guide to Insurance for Your Home and Ways to Reduce
Your Insurance Premiums”1 that describes the differing types of home insurance. Home insurance has several
forms, but ordinarily the insured is the occupant. In this report, statistics on home insurance refer to traditional
home insurance, as well as condominium and rental insurance.
Fire insurance on real property has been commonplace in the United States since the nineteenth century. In the
1950’s, multi-peril home insurance policy was introduced. This coverage provided a more comprehensive
coverage for damage from additional perils, as well as fire and protection against personal liability arising from
use of the real property. Multi-peril home insurance policies became the standard by the 1960’s with Insurance
Services Office, Inc. (ISO), an industry rating and statistical organization, as the lead sponsor of the standard
home insurance policies since that time.2 The Division of Insurance maintains a listing on its website3 of 72
commercial insurance companies that have indicated they have written ten or more home insurance policies in
the second half of 2015 in Massachusetts.
Creation and Evolution of the Massachusetts FAIR Plan
In the 1960’s, there were periods of civil unrest resulting in extensive property damage (not to mention loss of
life) in a number of large metropolitan areas across the United States. Many insurers withdrew from offering
property coverage in urban areas. A national advisory panel on the nation’s cities advised the President of the
United States that fair access to property insurance was a prerequisite for revitalization of urban America and
called for a significant change in the insurance and reinsurance markets in relation to the protection of urban
property. Following the recommendation of the advisory panel, Congress enacted the Urban Property and
Reinsurance Act of 1968 authorizing the establishment of state “FAIR (Fair Access to Insurance Requirements)
Plans” along with federal riot reinsurance to insurers.
The Massachusetts FAIR Plan, formally known as the Massachusetts Property Insurance Underwriting
Association (MPIUA), was established in 1968 to operate in a manner similar to a traditional insurance company
in that it inspects property, collects premium, issues its own policies, and adjusts its own claims, but with the
requirement that it offer coverage to those denied coverage in the private market. The FAIR Plan initially offered
a standard fire insurance policy for both personal and commercial lines, which also covered direct loss from the
perils of vandalism and malicious mischief, and offered coverage to home in specific urban areas of the
Commonwealth. Originally, the Commissioner determined that the FAIR Plan would operate in “urban areas”4.
In 1970, the Commissioner of Insurance broadened the operation of the FAIR Plan to include the entire
Commonwealth of Massachusetts. The Commissioner also established that the commission rate to producers
placing business in the FAIR Plan would be 12% of the premium charged to the insured.5
In 1975, the Commissioner of Insurance expanded the personal lines coverage offered by the FAIR Plan from
what is covered in a standard fire insurance policy to what is covered in a multi-peril insurance policy. In
1 “A Massachusetts Guide to Insurance for Your Home and Ways to Reduce Your Insurance Premiums” and “A Massachusetts Guide
to Understanding the Insurance Policy Covering Your Home” are available at www.mass.gov/doi. 2 General revisions of these home policies – usually referred to as HO-3 plans - have historically been filed by ISO on an intermittent
basis, usually once every five to ten years. 3 The listing of home insurance companies on the Division of Insurance website can be located at www.mass.gov/doi. 4 Chapter 731 of the Acts of 1968 defined “urban area” as “any city or town, or streets or sections thereof, in the commonwealth
so designated by the commissioner after appropriate hearing.” This designation was subsequently accomplished through regulation
211 CMR 5.00. 5 The 12% commission rate has remained constant since that time.
3
addition, the Commissioner required that premium rates charged by the FAIR Plan to home be tied to the
published manual rates of the ISO (Insurance Services Offices) rating organization for standard home risks.6
Studies of Urban Insurance Availability (Redlining)
During the 1990s, there appeared to be continued problems in the availability of home insurance in urban areas
and some analysts claimed that insurance companies had been “redlining” or unfairly discriminating against
certain risks solely due to the geographic location and/or the racial or ethnic characteristics of potential insureds.
“Redlining” is and has been a controversial issue in property insurance since at least the 1960’s and charges of
redlining have been raised against certain property insurers and the property insurance industry as a whole over
the years.
In 1993-95, the National Association of Insurance Commissioners (NAIC) undertook several studies on the
issues of availability and affordability of urban insurance in the personal automobile and home insurance
markets;7 the studies were not conclusive regarding redlining in urban areas. These studies did identify problems
in obtaining coverage in many urban areas, but they were not able to pinpoint whether this could be solely tied to
company underwriting practices, or whether it was also due to the lack of urban insurance producers (agents or
brokers), rate inadequacy for certain urban areas, or carrier misconceptions relative to urban risks. It was
generally found, however, that premiums were higher in urban areas.8
In 1995, following the release of the NAIC studies, the Massachusetts Division of Insurance (DOI) Special
Investigative Unit (SIU) conducted an examination of eight insurers who were major writers of coverage in the
Massachusetts home insurance market and representative of the home market as a whole.9 The SIU examination
focused on the marketing and underwriting practices of these insurers in the Boston area. The purpose of the
examination was to determine whether any of the eight insurers were engaged in unlawful discrimination in
underwriting in Boston or any of its neighborhoods. This examination did not reveal any illegal discrimination
by these insurers.
The NAIC studies helped focus attention on the need for insurers to reassess their approach to urban markets. In
Massachusetts, this resulted in at least two small changes. First, a brokerage system was designed to help
insurers find potential customers who met their underwriting criteria.10 Second, the Massachusetts Affordable
Housing Alliance (MAHA) and several insurers undertook to encourage risk management training for insureds in
urban areas, with discounted premiums made available as a reward for completion of the training.
Chapter 93 of the Acts of 1996
Following the publication of the NAIC studies and the subsequent DOI examination of urban home policies, a
number of parties with a role in the home market - including insurers, insurance producers, consumers,
legislators, and regulators - wanted to address the availability of home insurance in urban and coastal areas in the
6 The ISO rates were based on premium and loss data from all insurance companies that reported their premium and loss data to ISO as
their statistical agent. These insurers at that time collectively wrote more than 70% of the home insurance market in Massachusetts. 7 A Preliminary Analysis of Urban Insurance Markets, Robert W. Klein, 1994. Urban Insurance Problems And Solutions: Interim
Report, National Association of Insurance Commissioners Insurance Availability and Affordability (EX3) Task Force, 1994. The
Impact of Loss Costs on Urban Home Insurance Markets, Robert W. Klein, 1995. 8 The loss costs (cost of claims) associated with homes and businesses in those areas were higher as well. 9 Report of Examination of Homeowner Insurance Availability in The Metropolitan Boston Area, Massachusetts Division of Insurance,
November 1995. 10 This Market Assistance Plan (MAP) was required by Chapter 93 of the Acts of 1996.
4
voluntary market.11 They considered whether there should be monetary incentives for insurers to write urban and
coastal property in the voluntary market, changes in the way that FAIR Plan (MPIUA) rates were determined,
and regular reporting so that the DOI could analyze home insurance data on both a company and industry basis.
Chapter 93 of the Acts of 1996 made several changes in the FAIR Plan operation, Chapter 93 made the following
changes:
1. Provided FAIR Plan assessment credits in 1997-98 for insurers writing voluntary business in territories where the FAIR
Plan had high market penetration.
2. Required FAIR Plan to provide assessment credits starting January 1, 1999 for insurers writing voluntary business in zip
codes where the FAIR Plan had high market penetration. (See Exhibit 2A)
3. Provided FAIR Plan assessment credits (“take-out credits”) for insurers writing voluntary business in coastal territories
where more than 60% of the territory business had previously been written in the FAIR Plan.
4. Required FAIR Plan to provide take-out credits starting January 1, 1999 for insurers writing voluntary business in
coastal zip codes where the FAIR Plan had a greater than 60% market penetration. (See Exhibit 2B)
5. Tied FAIR Plan to rate changes in the voluntary market12. (See Exhibit 2C)
6. Provided for the top twenty-five insurers and the FAIR Plan to annually provide detailed cancellation and nonrenewal
information by zip code for home insurance.
7. Provided that statistical agents for home insurance in Massachusetts are to submit premium and loss data reports by zip
code and type of coverage, including detail on the causes of loss for each reported company.13
8. Provided that the Commissioner of Insurance report annually on the state of the Massachusetts home insurance market
after substantial analysis of the data submitted in (6) and (7).
9. Authorized alternative loss settlement practices subject to the use of disclosure forms designed by the Commissioner.
10. Required the FAIR Plan to offer an installment plan and provide coverage for scheduled personal property.
11. Required the FAIR Plan to develop a market assistance plan (MAP) to assist applicants to obtain home insurance in the
voluntary market.
Changes to MPIUA Rating Rules
Chapter 175C, section 5 requires the FAIR Plan to develop its rates by territory and follow different rating rules
for homes in “large share territories” - where the FAIR Plan has a significant share of the business – as compared
to all other homes.
Previously, in large share territories, the FAIR Plan rates could not increase by more than the “overall statewide
average percentage increase” of the top 10 largest home insurance by market share in the Massachusetts in the
prior calendar year. For all other territories, the commissioner could disapprove the FAIR Plan’s proposed rates
if they exceed the ninetieth percentile of the rates in use in the territory by the 10 insurers with the largest market
shares of home insurance written in the commonwealth on a statewide basis.
In 2004 two major changes were made to the ways that FAIR Plan rates are calculated:
11 The voluntary market is a group of insurers who write insurance in an environment that allows the right to accept and reject business
submitted. The voluntary market does not include Excess or Surplus Lines. 12 Chapter 436 of the Acts of 2004 (An Act Relative to the Joint Underwriting Association) permits the FAIR Plan to factor in the
predicted costs of hurricane losses and the cost of catastrophe reinsurance. 13 The first data submission provided in 1996 was exclusively on a territorial basis. All subsequent data submissions have been required
to include certain data on a zip code basis.
5

The law was changed to modify “large share territories.”
o Defined large share territories as ones covering 7% of more of the home premium over the past 3
years.
o Limited the number of “large share territories” to 13 in any one year
The Commissioner of Insurance was directed to consider the effects of predicted hurricane losses and the
cost of catastrophe reinsurance when examining the FAIR Plan’s proposed rates.
6

Exhibit 1A
GENERAL LAWS OF MASSACHUSETTS
PART I. ADMINISTRATION OF THE GOVERNMENT
________________________________________________________________________
TITLE XXII. CORPORATIONS
________________________________________________________________________
CHAPTER 175. INSURANCE
________________________________________________________________________
POWERS AND DUTIES OF COMMISSIONER OF INSURANCE
Chapter 175: Section 4A. Provision of data to commissioner by homeowners
insurers and joint underwriting association; access to confidential data; annual
report to general court
Section 4A. As of July first, nineteen hundred and ninety-six, and annually thereafter,
each admitted insurer writing homeowners insurance in the commonwealth, in
accordance with the provisions of section four, and the joint underwriting association,
formed pursuant to the provisions of chapter one hundred and seventy-five C shall
furnish for examination and inspection by the commissioner of insurance, in accordance
with section five of chapter one hundred and seventy-five C, for the owners, tenants and
condominium, separately, forms of homeowners insurance written since January first,
nineteen hundred and ninety-four, by standard statistical territories approved by the
commissioner, a statistical report of its homeowners insurance experience showing the
following data: written premiums; earned premiums; incurred losses, including loss
adjustment expenses; loss ratio; number of incurred claims; and number of exposures.
As of July first, nineteen hundred and ninety-seven, or such later reasonable date as the
commissioner may order after a hearing, but not later than July first, nineteen hundred
and ninety-eight, the twenty-five admitted insurers with the largest homeowners market
share in the commonwealth and the joint underwriting association, formed pursuant to the
provisions of chapter one hundred and seventy-five C, shall furnish such data as provided
in the preceding paragraph on the basis of the postal zip codes of credit-eligible
territories, under the plan authorized by section four of chapter one hundred and seventy-
five C, of all other postal zip codes in the city of Boston and such other postal zip codes
as may be designated by the commissioner.
All data reports shall be formatted and produced in accordance with the National
Association of Insurance Commissioners statistical handbook. Compliance with the
requirements of this section shall be effected through statistical agents approved by the
commissioner to act on behalf of the reporting insurers. In setting the effective date for
data reporting in accordance with the preceding paragraph, the commissioner shall
consider the practical ability of each statistical agent to so collect and report such data
with an acceptable level of statistical credibility.
7

Exhibit 1A
Access to such confidential data shall be granted by the commissioner to the attorney
general, to the extent he so requests, for law enforcement purposes, and to the chairmen
of the joint committee on insurance; provided, however, that the attorney general and the
chairmen of the joint committee on insurance shall hold and keep such data confidential.
All information reported pursuant to this section shall be given confidential treatment and
shall not be subject to subpoena and shall not be made public by the commissioner,
attorney general, chairmen of the joint committee on insurance, or any other person,
without the prior written consent of the insurer to which it pertains, except by the insurer;
provided, however, that if the commissioner, after giving the insurer and its affiliates who
would be affected thereby, as well as the person or organization making the request,
notice and the opportunity to be heard, determines that the interests of policyholders,
shareholders or the public will be served by the publication thereof. In the event that the
commissioner determines that such publication is appropriate, he may publish all or part
of such data in such manner as he deems appropriate. Such hearing shall be held
according to the adjudicatory procedures in chapter thirty A of the General Laws.
As of October first, nineteen hundred and ninety-six, and annually thereafter, the
commissioner shall report to the general court concerning the current state of the
homeowners insurance market in the commonwealth, both voluntary and residual market,
and the conclusions reached by the commissioner based upon his most recent
examination and inspection of the industry premium and loss data. Each such annual
report shall be filed with the clerks of the senate and house of representatives who shall
forward the same to the joint committee on insurance, the house and senate committees
on ways and means and the attorney general. Such report shall be made available to the
public by the commissioner. Said report shall summarize on an aggregate industry basis,
by standard statistical territory and, when available, by zip code, broken down between
voluntary and residual markets, the data concerning premiums and losses on homeowners
insurance disclosed by the reporting insurers. Further, said report shall substantively
analyze: the causes of loss and any trends discerned from the data by the commissioner;
the respective market shares and levels of rate subsidies of the residual market policies
written by the joint underwriting association, formed pursuant to the provisions of
chapter one hundred and seventy-five C, compared to the voluntary homeowners
insurance market; the availability and affordability of homeowners insurance in those
territories whose association market share equals or exceeds four percent, with particular
attention to credit-eligible territories; and the impact of such rate subsidies of the residual
market policies written by said association upon the availability of homeowners
insurance in the voluntary insurance market.
Each such annual report shall further examine the availability of homeowners insurance
through the admitted insurers and the joint underwriting association, formed pursuant to
the provisions of chapter one hundred and seventy-five C, in coastal municipalities, as
well as the extent to which direct losses to residences caused by wind affect such
availability. Said report may also contain any recommendations of the commissioner
concerning legislation or other suggestions relative to the homeowners insurance market,
loss control or disaster mitigation in the commonwealth.
8
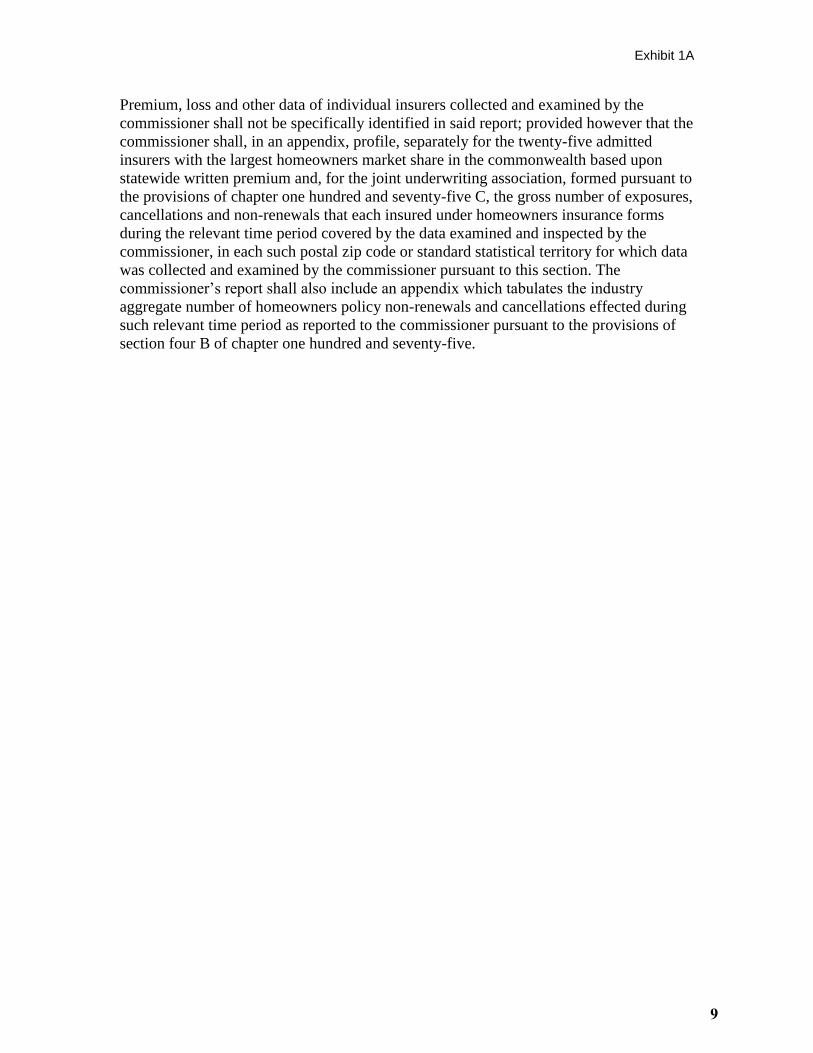
Exhibit 1A
Premium, loss and other data of individual insurers collected and examined by the
commissioner shall not be specifically identified in said report; provided however that the
commissioner shall, in an appendix, profile, separately for the twenty-five admitted
insurers with the largest homeowners market share in the commonwealth based upon
statewide written premium and, for the joint underwriting association, formed pursuant to
the provisions of chapter one hundred and seventy-five C, the gross number of exposures,
cancellations and non-renewals that each insured under homeowners insurance forms
during the relevant time period covered by the data examined and inspected by the
commissioner, in each such postal zip code or standard statistical territory for which data
was collected and examined by the commissioner pursuant to this section. The
commissioner’s report shall also include an appendix which tabulates the industry
aggregate number of homeowners policy non-renewals and cancellations effected during
such relevant time period as reported to the commissioner pursuant to the provisions of
section four B of chapter one hundred and seventy-five.
9
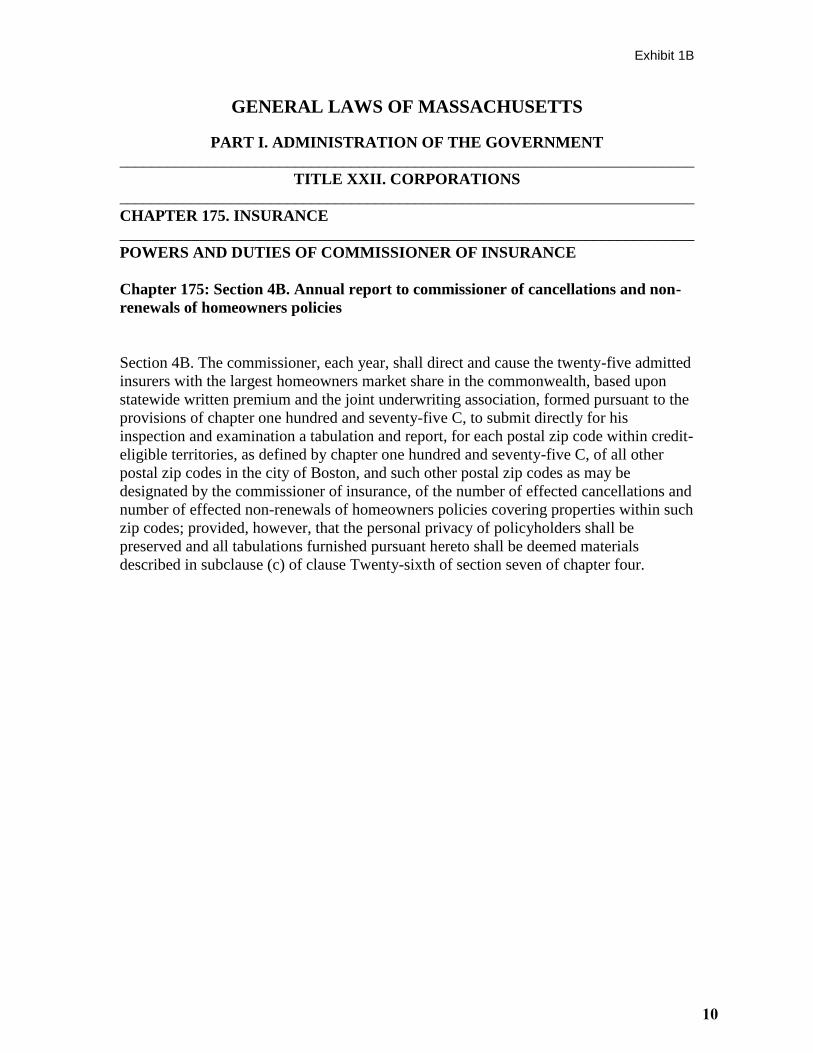
Exhibit 1B
GENERAL LAWS OF MASSACHUSETTS
PART I. ADMINISTRATION OF THE GOVERNMENT
________________________________________________________________________
TITLE XXII. CORPORATIONS
________________________________________________________________________
CHAPTER 175. INSURANCE
________________________________________________________________________
POWERS AND DUTIES OF COMMISSIONER OF INSURANCE
Chapter 175: Section 4B. Annual report to commissioner of cancellations and non-
renewals of homeowners policies
Section 4B. The commissioner, each year, shall direct and cause the twenty-five admitted
insurers with the largest homeowners market share in the commonwealth, based upon
statewide written premium and the joint underwriting association, formed pursuant to the
provisions of chapter one hundred and seventy-five C, to submit directly for his
inspection and examination a tabulation and report, for each postal zip code within credit-
eligible territories, as defined by chapter one hundred and seventy-five C, of all other
postal zip codes in the city of Boston, and such other postal zip codes as may be
designated by the commissioner of insurance, of the number of effected cancellations and
number of effected non-renewals of homeowners policies covering properties within such
zip codes; provided, however, that the personal privacy of policyholders shall be
preserved and all tabulations furnished pursuant hereto shall be deemed materials
described in subclause (c) of clause Twenty-sixth of section seven of chapter four.
10
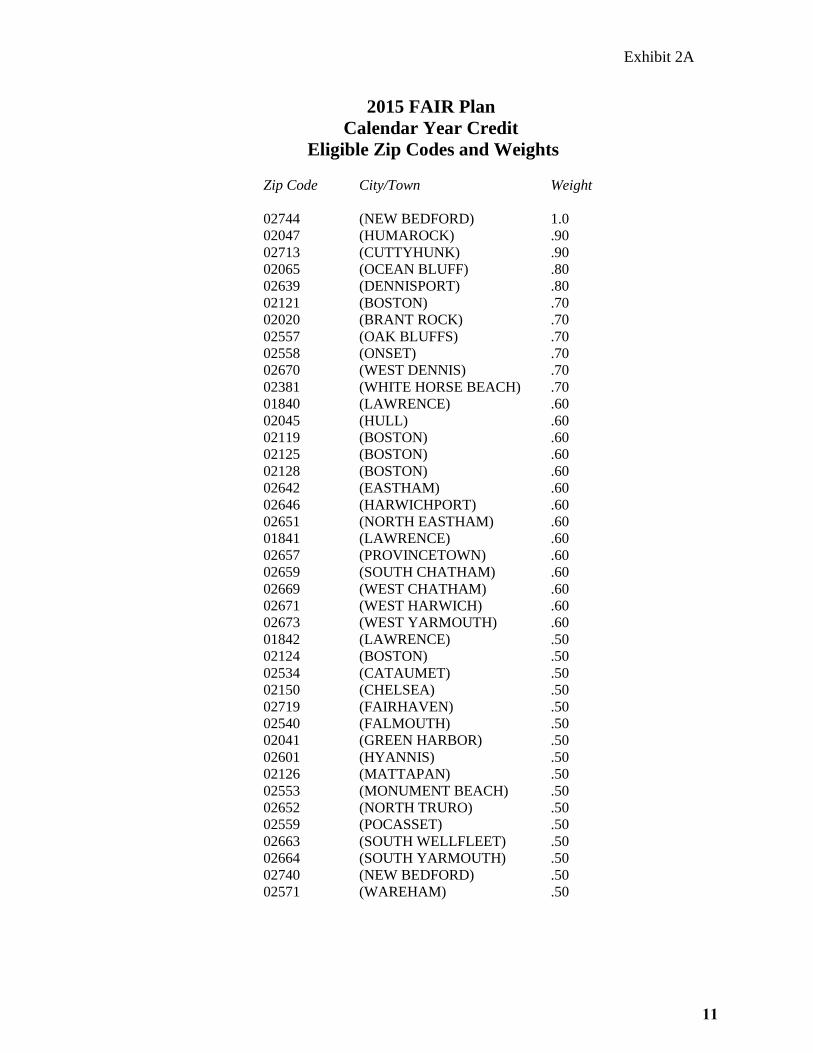
Exhibit 2A
2015 FAIR Plan
Calendar Year Credit
Eligible Zip Codes and Weights
Zip Code City/Town Weight
02744 (NEW BEDFORD) 1.0
02047 (HUMAROCK) .90
02713 (CUTTYHUNK) .90
02065 (OCEAN BLUFF) .80
02639 (DENNISPORT) .80
02121 (BOSTON) .70
02020 (BRANT ROCK) .70
02557 (OAK BLUFFS) .70
02558 (ONSET) .70
02670 (WEST DENNIS) .70
02381 (WHITE HORSE BEACH) .70
01840 (LAWRENCE) .60
02045 (HULL) .60
02119 (BOSTON) .60
02125 (BOSTON) .60
02128 (BOSTON) .60
02642 (EASTHAM) .60
02646 (HARWICHPORT) .60
02651 (NORTH EASTHAM) .60
01841 (LAWRENCE) .60
02657 (PROVINCETOWN) .60
02659 (SOUTH CHATHAM) .60
02669 (WEST CHATHAM) .60
02671 (WEST HARWICH) .60
02673 (WEST YARMOUTH) .60
01842 (LAWRENCE) .50
02124 (BOSTON) .50
02534 (CATAUMET) .50
02150 (CHELSEA) .50
02719 (FAIRHAVEN) .50
02540 (FALMOUTH) .50
02041 (GREEN HARBOR) .50
02601 (HYANNIS) .50
02126 (MATTAPAN) .50
02553 (MONUMENT BEACH) .50
02652 (NORTH TRURO) .50
02559 (POCASSET) .50
02663 (SOUTH WELLFLEET) .50
02664 (SOUTH YARMOUTH) .50
02740 (NEW BEDFORD) .50
02571 (WAREHAM) .50
11
Exhibit 2B
2015 FAIR Plan
Calendar Year Coastal Zip Codes
Eligible for Take Out-Credits
Zip Code City/Town
No coastal zip codes were eligible for take-out credits.
12
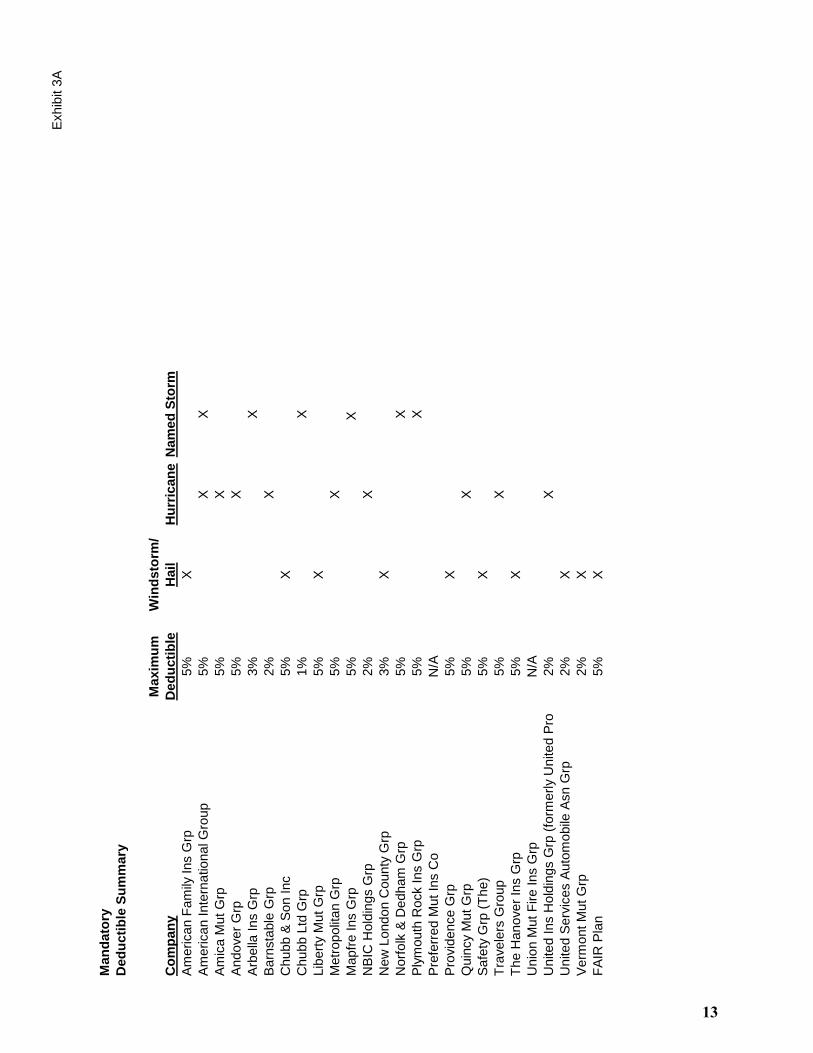
Exhib
it 3
A
Man
dato
ry
Ded
ucti
ble
Su
mm
ary
Maxim
um
Win
dsto
rm/
Co
mp
an
yD
ed
ucti
ble
Hail
Hu
rric
an
eN
am
ed
Sto
rm
Am
erican F
am
ily Ins G
rp5%
X
Am
erican Inte
rnational G
roup
5%
XX
Am
ica M
ut G
rp5%
X
Andover
Grp
5%
X
Arb
ella
Ins G
rp3%
X
Barn
sta
ble
Grp
2%
X
Chubb &
Son Inc
5%
X
Chubb L
td G
rp1%
X
Lib
ert
y M
ut G
rp5%
X
Metr
opolit
an G
rp5%
X
Mapfr
e Ins G
rp
5%
X
NB
IC H
old
ings G
rp2%
X
New
London C
ounty
Grp
3%
X
Norf
olk
& D
edham
Grp
5%
X
Ply
mouth
Rock Ins G
rp5%
X
Pre
ferr
ed M
ut In
s C
oN
/A
Pro
vid
ence G
rp5%
X
Quin
cy M
ut G
rp5%
X
Safe
ty G
rp (
The)
5%
X
Tra
vele
rs G
roup
5%
X
The H
anover
Ins G
rp5%
X
Unio
n M
ut F
ire Ins G
rpN
/A
United Ins H
old
ings G
rp (
form
erly
United P
ropert
y a
nd C
asualty Ins C
o)
2%
X
United S
erv
ices A
uto
mobile
Asn G
rp2%
X
Verm
ont M
ut G
rp2%
X
FA
IR P
lan
5%
X
13

Mandatory Wind Deductible
Report
Exhibit 3B
Page 1
Top Twenty-Five Insurers & FAIR Plan
Calendar Year---2015 Policies
in Force
Mandatory Wind/ Percentage of Policies with
Policies Hurricane Mandatory Wind/
Zip in Force* Deductible Hurricane
Code City/Town/Post Office as of 12/31/15 as of 12/31/15 Deductible
01101 SPRINGFIELD 56 8 14.3%
01102 SPRINGFIELD 5 0 0.0%
01103 SPRINGFIELD 266 27 10.2%
01104 SPRINGFIELD 4,157 993 23.9%
01105 SPRINGFIELD 645 159 24.7%
01107 SPRINGFIELD 1,014 261 25.7%
01108 SPRINGFIELD 4,026 903 22.4%
01109 SPRINGFIELD 4,341 1,254 28.9%
01111 SPRINGFIELD 1 1 100.0%
01114 SPRINGFIELD 0 0 0.0%
01115 SPRINGFIELD 2 0 0.0%
01118 SPRINGFIELD 3,959 745 18.8%
01119 SPRINGFIELD 2,921 668 22.9%
01128 SPRINGFIELD 848 175 20.6%
01129 SPRINGFIELD 2,043 438 21.4%
01133 SPRINGFIELD 0 0 0.0%
01138 SPRINGFIELD 0 0 0.0%
01139 SPRINGFIELD 2 0 0.0%
01144 SPRINGFIELD 0 0 0.0%
01151 INDIAN ORCHARD 1,376 296 21.5%
01152 SPRINGFIELD 1 0 0.0%
01199 SPRINGFIELD 0 0 0.0%
01601 WORCESTER 42 9 21.4%
01602 WORCESTER 5,189 951 18.3%
01603 WORCESTER 3,131 794 25.4%
01604 WORCESTER 6,534 1,348 20.6%
01605 WORCESTER 3,654 771 21.1%
01606 WORCESTER 4,898 888 18.1%
01607 WORCESTER 1,317 286 21.7%
01608 WORCESTER 201 39 19.4%
01609 WORCESTER 2,832 479 16.9%
01610 WORCESTER 1,609 434 27.0%
01611 CHERRY VALLEY 513 95 18.5%
01612 PAXTON 1,220 170 13.9%
01613 WORCESTER 15 2 13.3%
01614 WORCESTER 2 1 50.0%
01615 WORCESTER 3 0 0.0%
01653 WORCESTER 3 0 0.0%
01654 WORCESTER 0 0 0.0%
01655 WORCESTER 0 0 0.0%
01840 LAWRENCE 208 54 26.0%
01841 LAWRENCE 4,448 1,595 35.9%
01842 LAWRENCE 50 16 32.0%
01843 LAWRENCE 3,344 903 27.0%
01850 LOWELL 2,482 565 22.8%
01851 LOWELL 4,279 1,203 28.1%
01852 LOWELL 6,171 1,358 22.0%
01853 LOWELL 48 0 0.0%
01854 LOWELL 3,873 857 22.1%
01901 LYNN 248 87 35.1%
01902 LYNN 5,806 3,206 55.2%
01903 LYNN 25 21 84.0%
14
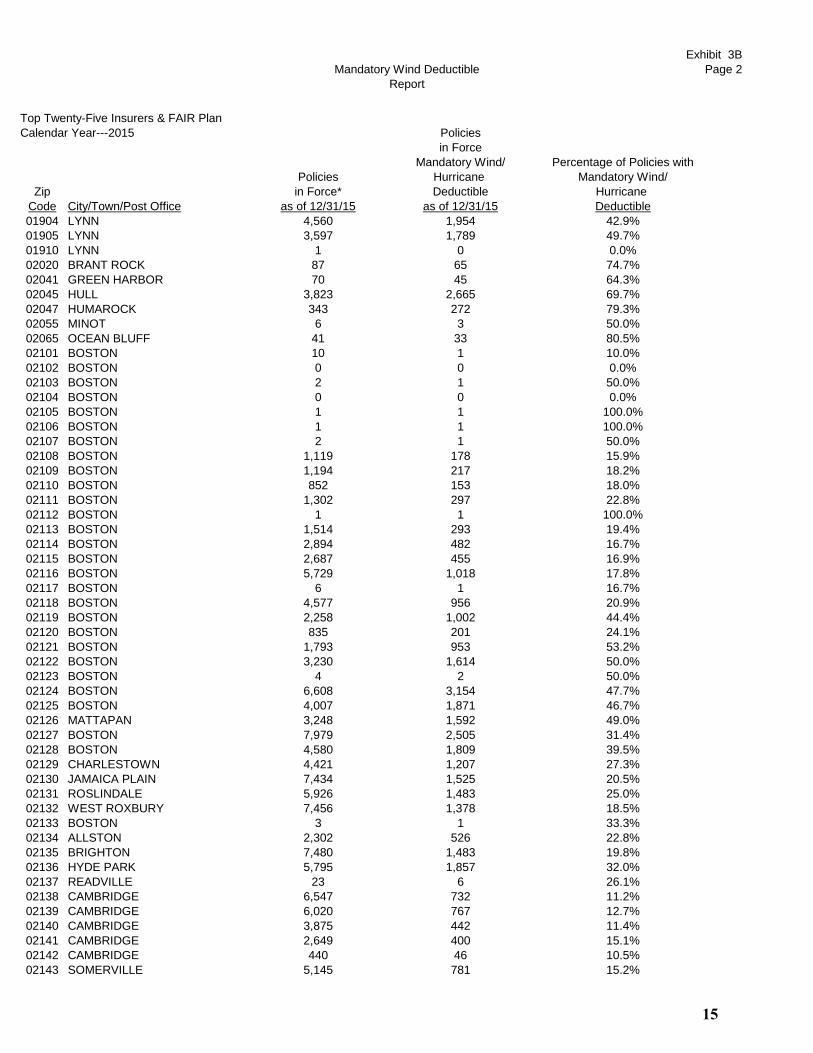
Mandatory Wind Deductible
Report
Exhibit 3B
Page 2
Top Twenty-Five Insurers & FAIR Plan
Calendar Year---2015 Policies
in Force
Mandatory Wind/ Percentage of Policies with
Policies Hurricane Mandatory Wind/
Zip in Force* Deductible Hurricane
Code City/Town/Post Office as of 12/31/15 as of 12/31/15 Deductible
01904 LYNN 4,560 1,954 42.9%
01905 LYNN 3,597 1,789 49.7%
01910 LYNN 1 0 0.0%
02020 BRANT ROCK 87 65 74.7%
02041 GREEN HARBOR 70 45 64.3%
02045 HULL 3,823 2,665 69.7%
02047 HUMAROCK 343 272 79.3%
02055 MINOT 6 3 50.0%
02065 OCEAN BLUFF 41 33 80.5%
02101 BOSTON 10 1 10.0%
02102 BOSTON 0 0 0.0%
02103 BOSTON 2 1 50.0%
02104 BOSTON 0 0 0.0%
02105 BOSTON 1 1 100.0%
02106 BOSTON 1 1 100.0%
02107 BOSTON 2 1 50.0%
02108 BOSTON 1,119 178 15.9%
02109 BOSTON 1,194 217 18.2%
02110 BOSTON 852 153 18.0%
02111 BOSTON 1,302 297 22.8%
02112 BOSTON 1 1 100.0%
02113 BOSTON 1,514 293 19.4%
02114 BOSTON 2,894 482 16.7%
02115 BOSTON 2,687 455 16.9%
02116 BOSTON 5,729 1,018 17.8%
02117 BOSTON 6 1 16.7%
02118 BOSTON 4,577 956 20.9%
02119 BOSTON 2,258 1,002 44.4%
02120 BOSTON 835 201 24.1%
02121 BOSTON 1,793 953 53.2%
02122 BOSTON 3,230 1,614 50.0%
02123 BOSTON 4 2 50.0%
02124 BOSTON 6,608 3,154 47.7%
02125 BOSTON 4,007 1,871 46.7%
02126 MATTAPAN 3,248 1,592 49.0%
02127 BOSTON 7,979 2,505 31.4%
02128 BOSTON 4,580 1,809 39.5%
02129 CHARLESTOWN 4,421 1,207 27.3%
02130 JAMAICA PLAIN 7,434 1,525 20.5%
02131 ROSLINDALE 5,926 1,483 25.0%
02132 WEST ROXBURY 7,456 1,378 18.5%
02133 BOSTON 3 1 33.3%
02134 ALLSTON 2,302 526 22.8%
02135 BRIGHTON 7,480 1,483 19.8%
02136 HYDE PARK 5,795 1,857 32.0%
02137 READVILLE 23 6 26.1%
02138 CAMBRIDGE 6,547 732 11.2%
02139 CAMBRIDGE 6,020 767 12.7%
02140 CAMBRIDGE 3,875 442 11.4%
02141 CAMBRIDGE 2,649 400 15.1%
02142 CAMBRIDGE 440 46 10.5%
02143 SOMERVILLE 5,145 781 15.2%
15

Mandatory Wind Deductible
Report
Exhibit 3B
Page 3
Top Twenty-Five Insurers & FAIR Plan
Calendar Year---2015 Policies
in Force
Mandatory Wind/ Percentage of Policies with
Policies Hurricane Mandatory Wind/
Zip in Force* Deductible Hurricane
Code City/Town/Post Office as of 12/31/15 as of 12/31/15 Deductible
02144 SOMERVILLE 5,395 709 13.1%
02145 SOMERVILLE 4,184 732 17.5%
02150 CHELSEA 3,468 1,156 33.3%
02151 REVERE 8,912 4,426 49.7%
02152 WINTHROP 3,904 2,281 58.4%
02163 BOSTON 52 6 11.5%
02196 BOSTON 4 1 25.0%
02199 BOSTON 321 49 15.3%
02201 BOSTON 0 0 0.0%
02202 BOSTON 0 0 0.0%
02203 BOSTON 0 0 0.0%
02204 BOSTON 0 0 0.0%
02205 BOSTON 0 0 0.0%
02206 BOSTON 0 0 0.0%
02207 BOSTON 0 0 0.0%
02208 BOSTON 0 0 0.0%
02209 BOSTON 0 0 0.0%
02210 BOSTON 901 180 20.0%
02211 BOSTON 1 0 0.0%
02212 BOSTON 0 0 0.0%
02215 BOSTON 1,964 316 16.1%
02216 BOSTON 2 1 50.0%
02217 BOSTON 0 0 0.0%
02222 BOSTON 0 0 0.0%
02228 EAST BOSTON 1 1 100.0%
02238 CAMBRIDGE 2 0 0.0%
02239 CAMBRIDGE 0 0 0.0%
02241 BOSTON 0 0 0.0%
02266 BOSTON 0 0 0.0%
02283 BOSTON 0 0 0.0%
02284 BOSTON 0 0 0.0%
02293 BOSTON 1 1 100.0%
02295 BOSTON 0 0 0.0%
02297 BOSTON 0 0 0.0%
02298 BOSTON 0 0 0.0%
02301 BROCKTON 10,072 2,634 26.2%
02302 BROCKTON 6,657 1,783 26.8%
02303 BROCKTON 38 12 31.6%
02304 BROCKTON 6 2 33.3%
02305 BROCKTON 1 0 0.0%
02360 PLYMOUTH 17,225 10,646 61.8%
02361 PLYMOUTH 6 3 50.0%
02362 PLYMOUTH 16 11 68.8%
02381 WHITE HORSE BEACH 70 56 80.0%
02532 BUZZARDS BAY 4,102 3,113 75.9%
02534 CATAUMET 439 420 95.7%
02535 CHILMARK 932 862 92.5%
02536 EAST FALMOUTH 8,654 7,423 85.8%
02537 EAST SANDWICH 2,364 1,882 79.6%
02538 EAST WAREHAM 1,187 665 56.0%
02539 EDGARTOWN 2,577 2,376 92.2%
02540 FALMOUTH 4,178 3,528 84.4%
16
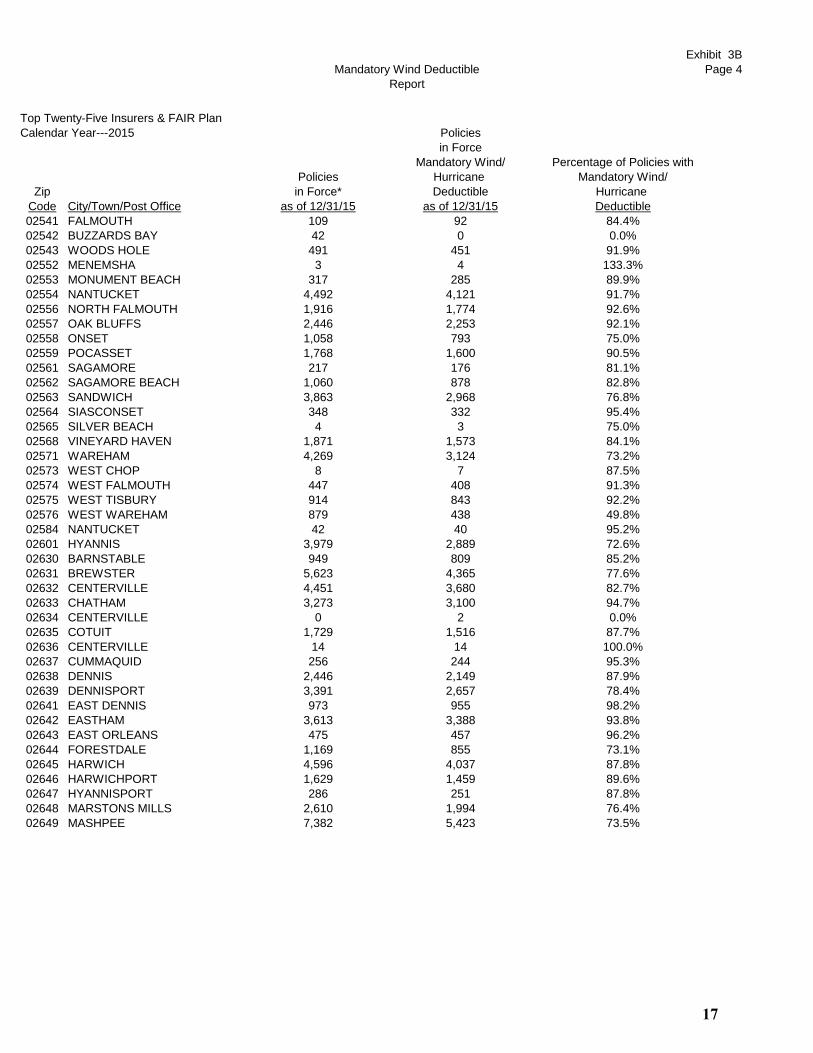
Mandatory Wind Deductible
Report
Exhibit 3B
Page 4
Top Twenty-Five Insurers & FAIR Plan
Calendar Year---2015 Policies
in Force
Mandatory Wind/ Percentage of Policies with
Policies Hurricane Mandatory Wind/
Zip in Force* Deductible Hurricane
Code City/Town/Post Office as of 12/31/15 as of 12/31/15 Deductible
02541 FALMOUTH 109 92 84.4%
02542 BUZZARDS BAY 42 0 0.0%
02543 WOODS HOLE 491 451 91.9%
02552 MENEMSHA 3 4 133.3%
02553 MONUMENT BEACH 317 285 89.9%
02554 NANTUCKET 4,492 4,121 91.7%
02556 NORTH FALMOUTH 1,916 1,774 92.6%
02557 OAK BLUFFS 2,446 2,253 92.1%
02558 ONSET 1,058 793 75.0%
02559 POCASSET 1,768 1,600 90.5%
02561 SAGAMORE 217 176 81.1%
02562 SAGAMORE BEACH 1,060 878 82.8%
02563 SANDWICH 3,863 2,968 76.8%
02564 SIASCONSET 348 332 95.4%
02565 SILVER BEACH 4 3 75.0%
02568 VINEYARD HAVEN 1,871 1,573 84.1%
02571 WAREHAM 4,269 3,124 73.2%
02573 WEST CHOP 8 7 87.5%
02574 WEST FALMOUTH 447 408 91.3%
02575 WEST TISBURY 914 843 92.2%
02576 WEST WAREHAM 879 438 49.8%
02584 NANTUCKET 42 40 95.2%
02601 HYANNIS 3,979 2,889 72.6%
02630 BARNSTABLE 949 809 85.2%
02631 BREWSTER 5,623 4,365 77.6%
02632 CENTERVILLE 4,451 3,680 82.7%
02633 CHATHAM 3,273 3,100 94.7%
02634 CENTERVILLE 0 2 0.0%
02635 COTUIT 1,729 1,516 87.7%
02636 CENTERVILLE 14 14 100.0%
02637 CUMMAQUID 256 244 95.3%
02638 DENNIS 2,446 2,149 87.9%
02639 DENNISPORT 3,391 2,657 78.4%
02641 EAST DENNIS 973 955 98.2%
02642 EASTHAM 3,613 3,388 93.8%
02643 EAST ORLEANS 475 457 96.2%
02644 FORESTDALE 1,169 855 73.1%
02645 HARWICH 4,596 4,037 87.8%
02646 HARWICHPORT 1,629 1,459 89.6%
02647 HYANNISPORT 286 251 87.8%
02648 MARSTONS MILLS 2,610 1,994 76.4%
02649 MASHPEE 7,382 5,423 73.5%
17

Mandatory Wind Deductible
Report
Exhibit 3B
Page 5
Top Twenty-Five Insurers & FAIR Plan
Calendar Year---2015 Policies
in Force
Mandatory Wind/ Percentage of Policies with
Policies Hurricane Mandatory Wind/
Zip in Force* Deductible Hurricane
Code City/Town/Post Office as of 12/31/15 as of 12/31/15 Deductible
02650 NORTH CHATHAM 579 542 93.6%
02651 NORTH EASTHAM 647 597 92.3%
02652 NORTH TRURO 797 597 74.9%
02653 ORLEANS 2,930 2,295 78.3%
02655 OSTERVILLE 2,008 1,774 88.3%
02657 PROVINCETOWN 2,483 1,150 46.3%
02659 SOUTH CHATHAM 907 829 91.4%
02660 SOUTH DENNIS 2,868 2,349 81.9%
02661 SOUTH HARWICH 243 225 92.6%
02662 SOUTH ORLEANS 234 221 94.4%
02663 SOUTH WELLFLEET 393 360 91.6%
02664 SOUTH YARMOUTH 4,576 3,930 85.9%
02666 TRURO 1,249 1,189 95.2%
02667 WELLFLEET 2,538 2,304 90.8%
02668 WEST BARNSTABLE 1,100 887 80.6%
02669 WEST CHATHAM 372 348 93.5%
02670 WEST DENNIS 1,686 1,580 93.7%
02671 WEST HARWICH 1,010 854 84.6%
02672 WEST HYANNISPORT 335 309 92.2%
02673 WEST YARMOUTH 4,376 3,574 81.7%
02675 YARMOUTHPORT 3,068 2,289 74.6%
02713 CUTTYHUNK 92 66 71.7%
02714 DARTMOUTH 32 24 75.0%
02719 FAIRHAVEN 4,330 3,201 73.9%
02720 FALL RIVER 5,685 2,618 46.1%
02721 FALL RIVER 3,759 2,040 54.3%
02722 FALL RIVER 49 25 51.0%
02723 FALL RIVER 1,962 1,046 53.3%
02724 FALL RIVER 2,397 1,470 61.3%
02725 SOMERSET 674 402 59.6%
02726 SOMERSET 4,735 1,718 36.3%
02738 MARION 1,787 1,416 79.2%
02739 MATTAPOISETT 2,608 2,033 78.0%
02740 NEW BEDFORD 7,162 4,641 64.8%
02741 NEW BEDFORD 18 10 55.6%
02742 NEW BEDFORD 4 2 50.0%
02743 ACUSHNET 2,814 827 29.4%
02744 NEW BEDFORD 1,550 1,248 80.5%
02745 NEW BEDFORD 5,530 1,561 28.2%
02746 NEW BEDFORD 1,378 636 46.2%
02747 NORTH DARTMOUTH 4,923 2,023 41.1%
02748 SOUTH DARTMOUTH 3,656 2,451 67.0%
02777 SWANSEA 4,685 2,582 55.1%
02790 WESTPORT 5,143 1,798 35.0%
02791 WESTPORT POINT 118 76 64.4%
All Zip Codes Above Combined 484,819 230,078 47.5%
Urban 293,295 86,783 29.6%
Coastal 191,524 143,295 74.8%
*The number of policies in force as of December 31 of the 2015 calendar year that were not originally issued in the 2015 calendar year.
18

Exhibit 4A
Territory 2013 2014 2015
2 BOSTON DISTRICT-A 26,340,155 26,709,476 26,501,534
3 BOSTON DISTRICT-B 8,481,786 8,665,119 9,034,443
4 BOSTON DISTRICT-C 8,765,641 8,986,865 9,275,392
5 SUFFOLK (EXCEPT BOSTON) 25,392,444 26,696,963 28,985,312
11 SUFFOLK (EXCEPT DISTRICTS A-B-C) 72,866,618 74,787,808 77,269,886
12 BROOKLINE 19,690,916 20,232,244 20,797,818
30 QUINCY 20,675,307 21,202,706 22,069,880
31 NORFOLK (EXCEPT BROOKLINE & QUINCY) 175,628,146 184,838,136 195,268,121
32 FALL RIVER 16,577,012 17,117,284 17,549,275
33 NEW BEDFORD 19,574,190 20,117,062 20,667,639
34 BRISTOL (EXCEPT FALL RIVER & NEW BEDFORD) 120,237,747 126,108,050 132,746,765
35 BROCKTON 22,485,269 23,459,873 24,653,219
36 PLYMOUTH (EXCEPT BROCKTON) 164,816,225 174,068,939 184,754,887
37 BARNSTABLE, DUKES, & NANTUCKET 296,923,584 303,387,331 311,748,616
38 LAWRENCE 9,917,129 10,296,527 10,826,777
39 LYNN 22,242,511 23,152,488 23,236,391
40 ESSEX (EXCEPT LAWRENCE AND LYNN) 186,134,074 197,187,868 209,208,739
41 CAMBRIDGE & SOMERVILLE 32,719,060 33,632,913 34,768,581
42 LOWELL 16,755,065 17,286,896 17,887,950
43 NEWTON 32,383,374 34,137,608 35,963,625
44 MIDDLESEX (EXCEPT CAM,NEW,LOW,SOM) 332,902,218 349,814,117 366,986,833
45 CITY OF WORCESTER 33,354,320 34,612,299 35,891,864
46 WORCESTER (EXCEPT CITY OF WORCESTER) 164,786,138 173,959,473 184,270,036
47 SPRINGFIELD 27,129,498 28,425,495 29,458,382
48 CHICOPEE & HOLYOKE 15,621,857 16,505,669 17,374,399
49 HAMPDEN (EXCEPT CH,SP,HOL) & HAMPSHIRE 84,620,312 89,232,985 94,588,046
50 BERKSHIRE & FRANKLIN 65,083,353 68,214,865 71,322,273
Total 2,022,103,949 2,112,837,059 2,213,106,683
Note: Totals differ from annual statement state page totals due to statistical reporting issues.
Massachusetts Homeowners Insurance
CY 2013-15 Written Premium by Territory
19
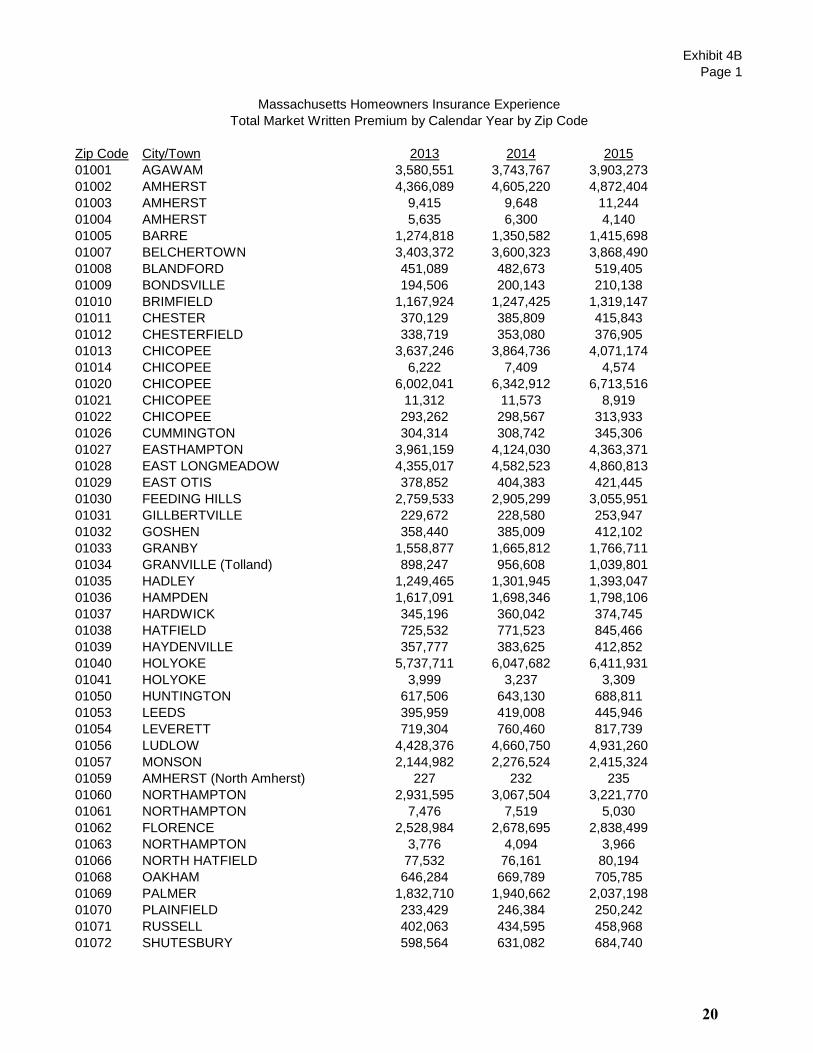
Exhibit 4B
Page 1
Zip Code City/Town 2013 2014 2015
01001 AGAWAM 3,580,551 3,743,767 3,903,273
01002 AMHERST 4,366,089 4,605,220 4,872,404
01003 AMHERST 9,415 9,648 11,244
01004 AMHERST 5,635 6,300 4,140
01005 BARRE 1,274,818 1,350,582 1,415,698
01007 BELCHERTOWN 3,403,372 3,600,323 3,868,490
01008 BLANDFORD 451,089 482,673 519,405
01009 BONDSVILLE 194,506 200,143 210,138
01010 BRIMFIELD 1,167,924 1,247,425 1,319,147
01011 CHESTER 370,129 385,809 415,843
01012 CHESTERFIELD 338,719 353,080 376,905
01013 CHICOPEE 3,637,246 3,864,736 4,071,174
01014 CHICOPEE 6,222 7,409 4,574
01020 CHICOPEE 6,002,041 6,342,912 6,713,516
01021 CHICOPEE 11,312 11,573 8,919
01022 CHICOPEE 293,262 298,567 313,933
01026 CUMMINGTON 304,314 308,742 345,306
01027 EASTHAMPTON 3,961,159 4,124,030 4,363,371
01028 EAST LONGMEADOW 4,355,017 4,582,523 4,860,813
01029 EAST OTIS 378,852 404,383 421,445
01030 FEEDING HILLS 2,759,533 2,905,299 3,055,951
01031 GILLBERTVILLE 229,672 228,580 253,947
01032 GOSHEN 358,440 385,009 412,102
01033 GRANBY 1,558,877 1,665,812 1,766,711
01034 GRANVILLE (Tolland) 898,247 956,608 1,039,801
01035 HADLEY 1,249,465 1,301,945 1,393,047
01036 HAMPDEN 1,617,091 1,698,346 1,798,106
01037 HARDWICK 345,196 360,042 374,745
01038 HATFIELD 725,532 771,523 845,466
01039 HAYDENVILLE 357,777 383,625 412,852
01040 HOLYOKE 5,737,711 6,047,682 6,411,931
01041 HOLYOKE 3,999 3,237 3,309
01050 HUNTINGTON 617,506 643,130 688,811
01053 LEEDS 395,959 419,008 445,946
01054 LEVERETT 719,304 760,460 817,739
01056 LUDLOW 4,428,376 4,660,750 4,931,260
01057 MONSON 2,144,982 2,276,524 2,415,324
01059 AMHERST (North Amherst) 227 232 235
01060 NORTHAMPTON 2,931,595 3,067,504 3,221,770
01061 NORTHAMPTON 7,476 7,519 5,030
01062 FLORENCE 2,528,984 2,678,695 2,838,499
01063 NORTHAMPTON 3,776 4,094 3,966
01066 NORTH HATFIELD 77,532 76,161 80,194
01068 OAKHAM 646,284 669,789 705,785
01069 PALMER 1,832,710 1,940,662 2,037,198
01070 PLAINFIELD 233,429 246,384 250,242
01071 RUSSELL 402,063 434,595 458,968
01072 SHUTESBURY 598,564 631,082 684,740
Massachusetts Homeowners Insurance Experience
Total Market Written Premium by Calendar Year by Zip Code
20
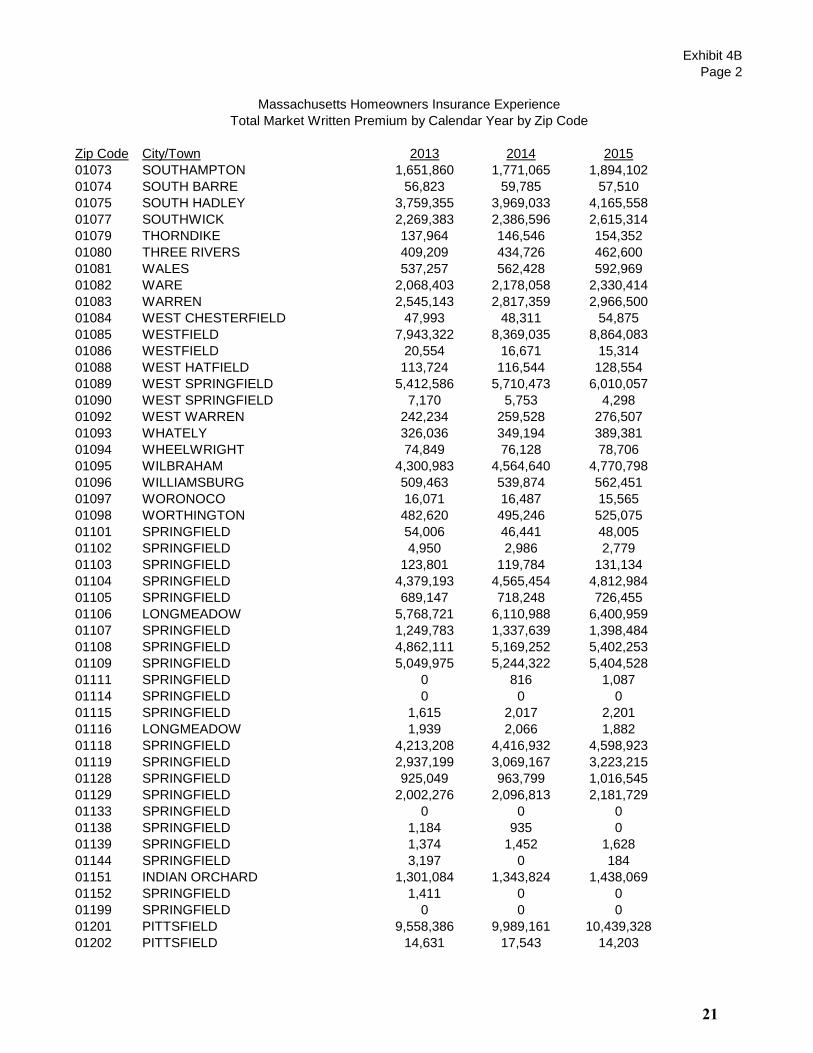
Exhibit 4B
Page 2
Zip Code City/Town 2013 2014 2015
Massachusetts Homeowners Insurance Experience
Total Market Written Premium by Calendar Year by Zip Code
01073 SOUTHAMPTON 1,651,860 1,771,065 1,894,102
01074 SOUTH BARRE 56,823 59,785 57,510
01075 SOUTH HADLEY 3,759,355 3,969,033 4,165,558
01077 SOUTHWICK 2,269,383 2,386,596 2,615,314
01079 THORNDIKE 137,964 146,546 154,352
01080 THREE RIVERS 409,209 434,726 462,600
01081 WALES 537,257 562,428 592,969
01082 WARE 2,068,403 2,178,058 2,330,414
01083 WARREN 2,545,143 2,817,359 2,966,500
01084 WEST CHESTERFIELD 47,993 48,311 54,875
01085 WESTFIELD 7,943,322 8,369,035 8,864,083
01086 WESTFIELD 20,554 16,671 15,314
01088 WEST HATFIELD 113,724 116,544 128,554
01089 WEST SPRINGFIELD 5,412,586 5,710,473 6,010,057
01090 WEST SPRINGFIELD 7,170 5,753 4,298
01092 WEST WARREN 242,234 259,528 276,507
01093 WHATELY 326,036 349,194 389,381
01094 WHEELWRIGHT 74,849 76,128 78,706
01095 WILBRAHAM 4,300,983 4,564,640 4,770,798
01096 WILLIAMSBURG 509,463 539,874 562,451
01097 WORONOCO 16,071 16,487 15,565
01098 WORTHINGTON 482,620 495,246 525,075
01101 SPRINGFIELD 54,006 46,441 48,005
01102 SPRINGFIELD 4,950 2,986 2,779
01103 SPRINGFIELD 123,801 119,784 131,134
01104 SPRINGFIELD 4,379,193 4,565,454 4,812,984
01105 SPRINGFIELD 689,147 718,248 726,455
01106 LONGMEADOW 5,768,721 6,110,988 6,400,959
01107 SPRINGFIELD 1,249,783 1,337,639 1,398,484
01108 SPRINGFIELD 4,862,111 5,169,252 5,402,253
01109 SPRINGFIELD 5,049,975 5,244,322 5,404,528
01111 SPRINGFIELD 0 816 1,087
01114 SPRINGFIELD 0 0 0
01115 SPRINGFIELD 1,615 2,017 2,201
01116 LONGMEADOW 1,939 2,066 1,882
01118 SPRINGFIELD 4,213,208 4,416,932 4,598,923
01119 SPRINGFIELD 2,937,199 3,069,167 3,223,215
01128 SPRINGFIELD 925,049 963,799 1,016,545
01129 SPRINGFIELD 2,002,276 2,096,813 2,181,729
01133 SPRINGFIELD 0 0 0
01138 SPRINGFIELD 1,184 935 0
01139 SPRINGFIELD 1,374 1,452 1,628
01144 SPRINGFIELD 3,197 0 184
01151 INDIAN ORCHARD 1,301,084 1,343,824 1,438,069
01152 SPRINGFIELD 1,411 0 0
01199 SPRINGFIELD 0 0 0
01201 PITTSFIELD 9,558,386 9,989,161 10,439,328
01202 PITTSFIELD 14,631 17,543 14,203
21

Exhibit 4B
Page 3
Zip Code City/Town 2013 2014 2015
Massachusetts Homeowners Insurance Experience
Total Market Written Premium by Calendar Year by Zip Code
01203 PITTSFIELD 671 678 -138
01220 ADAMS 1,752,205 1,790,835 1,872,854
01222 ASHLEY FALLS 285,597 289,880 303,179
01223 BECKET 1,620,702 1,705,065 1,782,995
01224 BERKSHIRE 55,515 60,344 63,159
01225 CHESHIRE, 786,437 827,697 876,414
01226 DALTON 1,691,775 1,765,541 1,843,900
01227 DALTON 1,973 2,100 5,702
01229 GLENDALE 68,279 61,208 65,940
01230 GREAT BARRINGTON 3,665,300 3,913,845 4,053,757
01235 HINSDALE 951,342 998,868 1,047,851
01236 HOUSATONIC 422,565 437,478 444,440
01237 LANESBORO 1,170,526 1,248,438 1,330,357
01238 LEE 1,594,815 1,665,360 1,751,620
01240 LENOX 2,174,104 2,286,718 2,368,682
01242 LENOXDALE 117,562 123,367 130,769
01243 MIDDLEFIELD 186,290 203,700 219,965
01244 MILL RIVER 197,799 216,433 220,312
01245 MONTEREY 991,711 1,051,160 1,136,772
01247 NORTH ADAMS 2,817,723 2,991,944 3,065,356
01252 NORTH EGREMONT 298,623 284,239 318,457
01253 OTIS 1,010,227 1,057,769 1,121,935
01254 RICHMOND 1,018,419 1,074,706 1,137,395
01255 SANDISFIELD 635,158 670,857 679,461
01256 SAVOY 225,850 226,168 242,598
01257 SHEFFIELD 1,254,277 1,317,438 1,378,696
01258 SOUTH EGREMONT 733,923 770,810 805,774
01259 SOUTHFIELD 387,580 424,721 434,103
01260 SOUTH LEE 60,089 59,762 63,256
01262 STOCKBRIDGE 1,610,468 1,637,685 1,718,684
01263 STOCKBRIDGE 43,120 41,444 40,972
01264 TYRINGHAM 354,773 351,850 394,958
01266 W STOCKBRIDGE 1,189,587 1,262,854 1,308,712
01267 WILLIAMSTOWN 2,238,405 2,429,583 2,569,265
01270 WINDSOR 337,894 350,810 372,888
01301 GREENFIELD 3,468,672 3,594,264 3,726,315
01302 GREENFIELD 9,596 7,716 5,365
01330 ASHFIELD 625,809 659,413 691,954
01331 ATHOL 3,092,412 3,218,660 3,393,866
01337 BERNARDSTON 719,601 756,939 791,729
01338 BUCKLAND 282,667 303,976 307,030
01339 CHARLEMONT 476,754 506,213 526,388
01340 COLRAIN 492,224 515,264 531,362
01341 CONWAY 660,319 692,767 697,826
01342 DEERFIELD 341,915 363,035 376,454
01343 DRURY 32,801 34,208 33,188
01344 ERVING 379,991 404,431 419,932
01346 HEATH 260,765 271,693 280,591
22
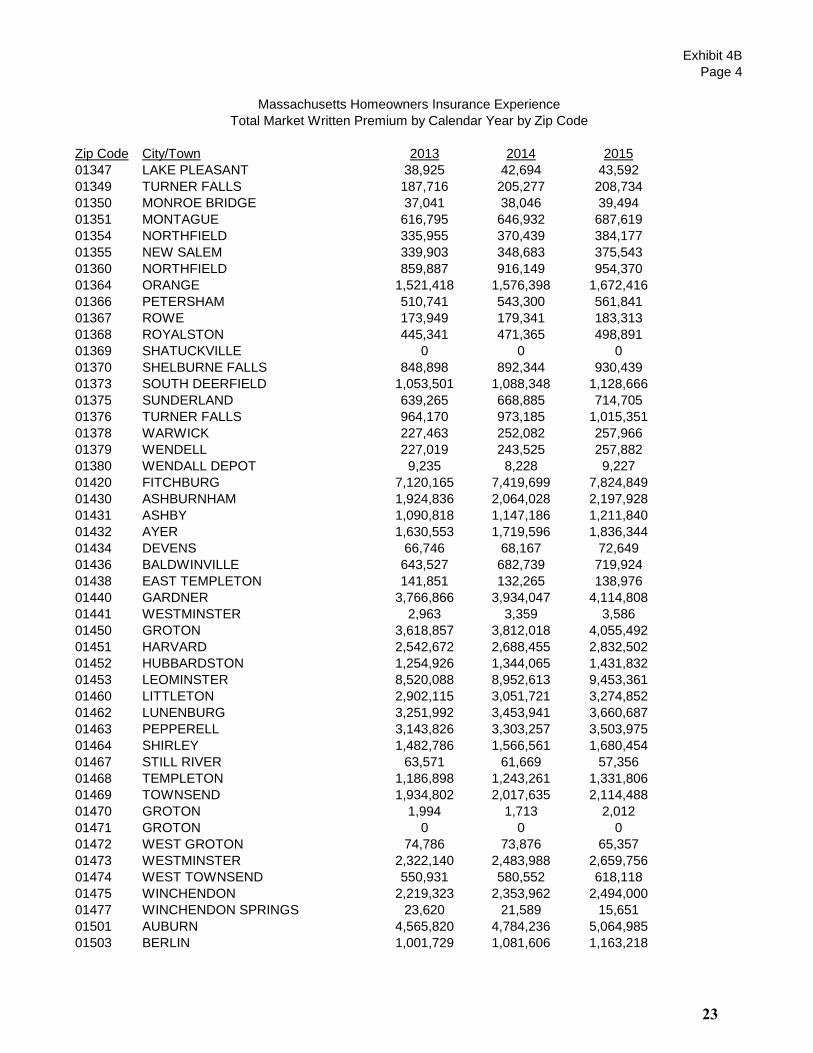
Exhibit 4B
Page 4
Zip Code City/Town 2013 2014 2015
Massachusetts Homeowners Insurance Experience
Total Market Written Premium by Calendar Year by Zip Code
01347 LAKE PLEASANT 38,925 42,694 43,592
01349 TURNER FALLS 187,716 205,277 208,734
01350 MONROE BRIDGE 37,041 38,046 39,494
01351 MONTAGUE 616,795 646,932 687,619
01354 NORTHFIELD 335,955 370,439 384,177
01355 NEW SALEM 339,903 348,683 375,543
01360 NORTHFIELD 859,887 916,149 954,370
01364 ORANGE 1,521,418 1,576,398 1,672,416
01366 PETERSHAM 510,741 543,300 561,841
01367 ROWE 173,949 179,341 183,313
01368 ROYALSTON 445,341 471,365 498,891
01369 SHATUCKVILLE 0 0 0
01370 SHELBURNE FALLS 848,898 892,344 930,439
01373 SOUTH DEERFIELD 1,053,501 1,088,348 1,128,666
01375 SUNDERLAND 639,265 668,885 714,705
01376 TURNER FALLS 964,170 973,185 1,015,351
01378 WARWICK 227,463 252,082 257,966
01379 WENDELL 227,019 243,525 257,882
01380 WENDALL DEPOT 9,235 8,228 9,227
01420 FITCHBURG 7,120,165 7,419,699 7,824,849
01430 ASHBURNHAM 1,924,836 2,064,028 2,197,928
01431 ASHBY 1,090,818 1,147,186 1,211,840
01432 AYER 1,630,553 1,719,596 1,836,344
01434 DEVENS 66,746 68,167 72,649
01436 BALDWINVILLE 643,527 682,739 719,924
01438 EAST TEMPLETON 141,851 132,265 138,976
01440 GARDNER 3,766,866 3,934,047 4,114,808
01441 WESTMINSTER 2,963 3,359 3,586
01450 GROTON 3,618,857 3,812,018 4,055,492
01451 HARVARD 2,542,672 2,688,455 2,832,502
01452 HUBBARDSTON 1,254,926 1,344,065 1,431,832
01453 LEOMINSTER 8,520,088 8,952,613 9,453,361
01460 LITTLETON 2,902,115 3,051,721 3,274,852
01462 LUNENBURG 3,251,992 3,453,941 3,660,687
01463 PEPPERELL 3,143,826 3,303,257 3,503,975
01464 SHIRLEY 1,482,786 1,566,561 1,680,454
01467 STILL RIVER 63,571 61,669 57,356
01468 TEMPLETON 1,186,898 1,243,261 1,331,806
01469 TOWNSEND 1,934,802 2,017,635 2,114,488
01470 GROTON 1,994 1,713 2,012
01471 GROTON 0 0 0
01472 WEST GROTON 74,786 73,876 65,357
01473 WESTMINSTER 2,322,140 2,483,988 2,659,756
01474 WEST TOWNSEND 550,931 580,552 618,118
01475 WINCHENDON 2,219,323 2,353,962 2,494,000
01477 WINCHENDON SPRINGS 23,620 21,589 15,651
01501 AUBURN 4,565,820 4,784,236 5,064,985
01503 BERLIN 1,001,729 1,081,606 1,163,218
23

Exhibit 4B
Page 5
Zip Code City/Town 2013 2014 2015
Massachusetts Homeowners Insurance Experience
Total Market Written Premium by Calendar Year by Zip Code
01504 BLACKSTONE 2,185,415 2,308,087 2,481,429
01505 BOYLSTON 1,578,794 1,715,335 1,800,415
01506 BROOKFIELD 862,054 905,320 970,459
01507 CHARLTON 3,666,667 3,903,459 4,179,024
01508 CHARLTON CITY 89,217 89,225 86,106
01509 CHARLTON DEPOT 15,349 13,132 12,723
01510 CLINTON 2,788,075 2,959,554 3,145,972
01515 EAST BROOKFIELD 679,608 699,832 753,333
01516 DOUGLAS 2,518,121 2,639,469 2,805,269
01517 EAST PRINCETON 725 0 0
01518 FISKDALE 874,010 964,728 1,020,357
01519 GRAFTON 2,231,613 2,300,018 2,392,958
01520 HOLDEN 4,659,122 4,906,530 5,215,603
01521 HOLLAND 969,747 1,005,976 1,077,654
01522 JEFFERSON 843,149 890,274 955,189
01523 LANCASTER 1,907,601 2,036,086 2,179,761
01524 LEICESTER 1,918,093 1,980,962 2,080,129
01525 LINWOOD 81,688 85,470 86,148
01526 MANCHAUG 88,973 87,487 84,654
01527 MILLBURY 3,712,540 3,878,950 4,085,134
01529 MILLVILLE 818,206 863,219 912,786
01531 NEW BRAINTREE 303,395 326,444 332,470
01532 NORTHBOROUGH 4,625,567 4,883,227 5,145,657
01534 NORTHBRIDGE 1,626,959 1,742,200 1,849,635
01535 NORTH BROOKFIELD 1,250,519 1,301,050 1,370,855
01536 NORTH GRAFTON 2,001,966 2,143,812 2,246,206
01537 NORTH OXFORD 519,164 543,721 568,283
01538 NORTH UXBRIDGE 89,418 90,172 92,281
01540 OXFORD 2,819,380 2,952,619 3,139,893
01541 PRINCETON 1,426,109 1,508,029 1,576,464
01542 ROCHDALE 517,111 550,608 570,783
01543 RUTLAND 2,185,091 2,327,363 2,494,307
01545 SHREWSBURY 10,379,384 10,814,486 11,412,566
01546 SHREWSBURY 5,498 5,275 4,626
01550 SOUTHBRIDGE 3,152,749 3,301,107 3,468,029
01560 SOUTH GRAFTON 955,401 1,016,353 1,109,720
01561 SOUTH LANCASTER 67,849 66,110 65,346
01562 SPENCER 2,991,757 3,152,541 3,304,099
01564 STERLING 2,546,191 2,695,997 2,858,201
01566 STURBRIDGE 2,164,859 2,255,489 2,402,274
01568 UPTON 2,509,400 2,659,256 2,817,664
01569 UXBRIDGE 3,624,116 3,820,207 4,111,241
01570 WEBSTER 3,737,607 3,922,621 4,153,341
01571 DUDLEY 2,719,292 2,877,312 3,057,464
01580 WESTBOROUGH 3,876 4,425 2,279
01581 WESTBOROUGH 5,105,735 5,416,109 5,728,821
01582 WESTBOROUGH 3,447 3,734 1,045
01583 WEST BOYLSTON 2,064,936 2,152,326 2,245,320
24
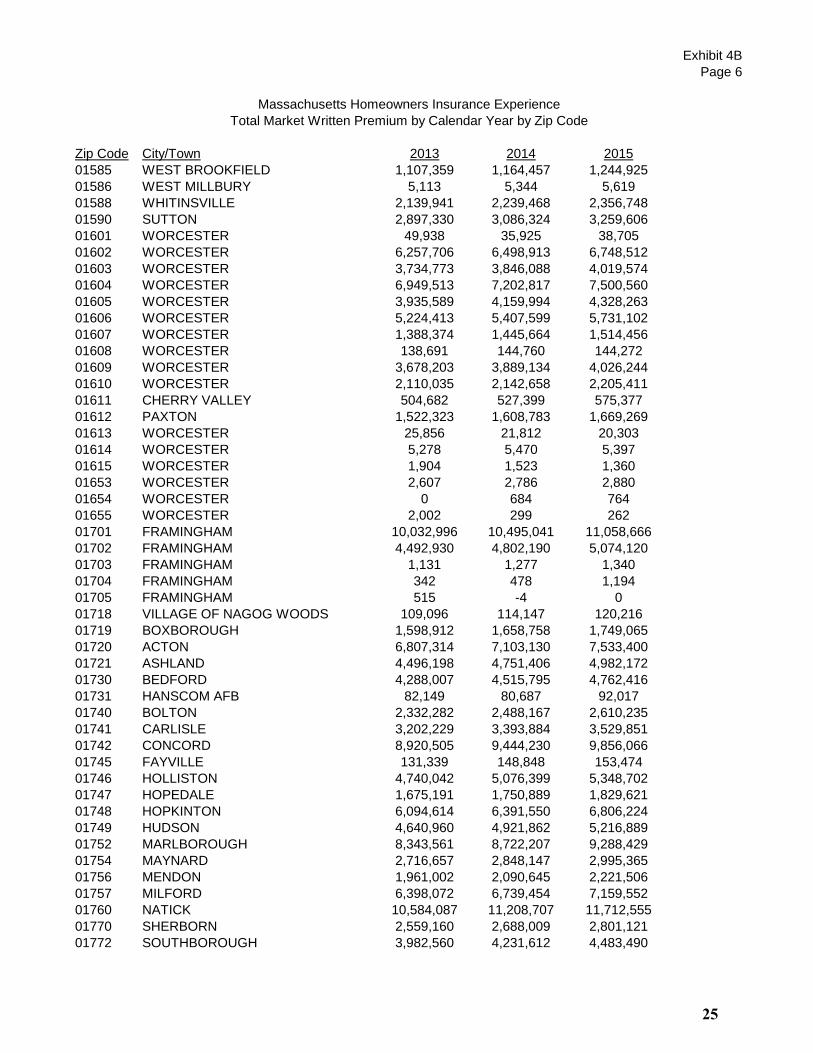
Exhibit 4B
Page 6
Zip Code City/Town 2013 2014 2015
Massachusetts Homeowners Insurance Experience
Total Market Written Premium by Calendar Year by Zip Code
01585 WEST BROOKFIELD 1,107,359 1,164,457 1,244,925
01586 WEST MILLBURY 5,113 5,344 5,619
01588 WHITINSVILLE 2,139,941 2,239,468 2,356,748
01590 SUTTON 2,897,330 3,086,324 3,259,606
01601 WORCESTER 49,938 35,925 38,705
01602 WORCESTER 6,257,706 6,498,913 6,748,512
01603 WORCESTER 3,734,773 3,846,088 4,019,574
01604 WORCESTER 6,949,513 7,202,817 7,500,560
01605 WORCESTER 3,935,589 4,159,994 4,328,263
01606 WORCESTER 5,224,413 5,407,599 5,731,102
01607 WORCESTER 1,388,374 1,445,664 1,514,456
01608 WORCESTER 138,691 144,760 144,272
01609 WORCESTER 3,678,203 3,889,134 4,026,244
01610 WORCESTER 2,110,035 2,142,658 2,205,411
01611 CHERRY VALLEY 504,682 527,399 575,377
01612 PAXTON 1,522,323 1,608,783 1,669,269
01613 WORCESTER 25,856 21,812 20,303
01614 WORCESTER 5,278 5,470 5,397
01615 WORCESTER 1,904 1,523 1,360
01653 WORCESTER 2,607 2,786 2,880
01654 WORCESTER 0 684 764
01655 WORCESTER 2,002 299 262
01701 FRAMINGHAM 10,032,996 10,495,041 11,058,666
01702 FRAMINGHAM 4,492,930 4,802,190 5,074,120
01703 FRAMINGHAM 1,131 1,277 1,340
01704 FRAMINGHAM 342 478 1,194
01705 FRAMINGHAM 515 -4 0
01718 VILLAGE OF NAGOG WOODS 109,096 114,147 120,216
01719 BOXBOROUGH 1,598,912 1,658,758 1,749,065
01720 ACTON 6,807,314 7,103,130 7,533,400
01721 ASHLAND 4,496,198 4,751,406 4,982,172
01730 BEDFORD 4,288,007 4,515,795 4,762,416
01731 HANSCOM AFB 82,149 80,687 92,017
01740 BOLTON 2,332,282 2,488,167 2,610,235
01741 CARLISLE 3,202,229 3,393,884 3,529,851
01742 CONCORD 8,920,505 9,444,230 9,856,066
01745 FAYVILLE 131,339 148,848 153,474
01746 HOLLISTON 4,740,042 5,076,399 5,348,702
01747 HOPEDALE 1,675,191 1,750,889 1,829,621
01748 HOPKINTON 6,094,614 6,391,550 6,806,224
01749 HUDSON 4,640,960 4,921,862 5,216,889
01752 MARLBOROUGH 8,343,561 8,722,207 9,288,429
01754 MAYNARD 2,716,657 2,848,147 2,995,365
01756 MENDON 1,961,002 2,090,645 2,221,506
01757 MILFORD 6,398,072 6,739,454 7,159,552
01760 NATICK 10,584,087 11,208,707 11,712,555
01770 SHERBORN 2,559,160 2,688,009 2,801,121
01772 SOUTHBOROUGH 3,982,560 4,231,612 4,483,490
25
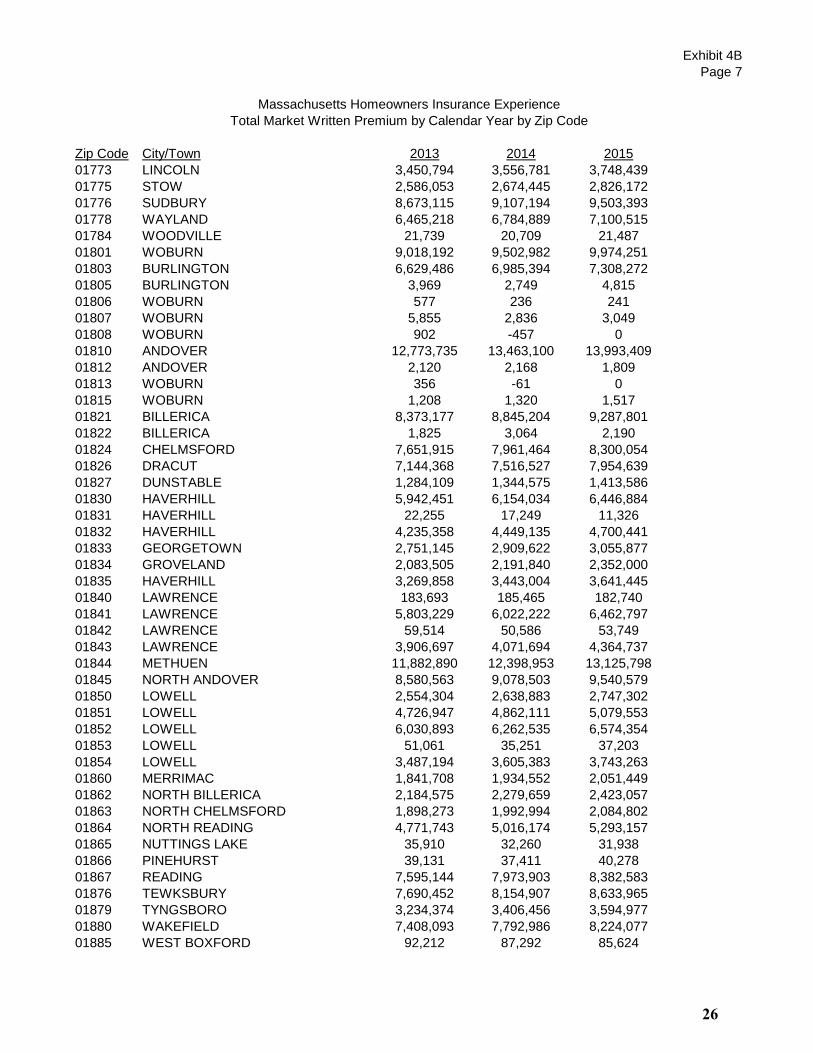
Exhibit 4B
Page 7
Zip Code City/Town 2013 2014 2015
Massachusetts Homeowners Insurance Experience
Total Market Written Premium by Calendar Year by Zip Code
01773 LINCOLN 3,450,794 3,556,781 3,748,439
01775 STOW 2,586,053 2,674,445 2,826,172
01776 SUDBURY 8,673,115 9,107,194 9,503,393
01778 WAYLAND 6,465,218 6,784,889 7,100,515
01784 WOODVILLE 21,739 20,709 21,487
01801 WOBURN 9,018,192 9,502,982 9,974,251
01803 BURLINGTON 6,629,486 6,985,394 7,308,272
01805 BURLINGTON 3,969 2,749 4,815
01806 WOBURN 577 236 241
01807 WOBURN 5,855 2,836 3,049
01808 WOBURN 902 -457 0
01810 ANDOVER 12,773,735 13,463,100 13,993,409
01812 ANDOVER 2,120 2,168 1,809
01813 WOBURN 356 -61 0
01815 WOBURN 1,208 1,320 1,517
01821 BILLERICA 8,373,177 8,845,204 9,287,801
01822 BILLERICA 1,825 3,064 2,190
01824 CHELMSFORD 7,651,915 7,961,464 8,300,054
01826 DRACUT 7,144,368 7,516,527 7,954,639
01827 DUNSTABLE 1,284,109 1,344,575 1,413,586
01830 HAVERHILL 5,942,451 6,154,034 6,446,884
01831 HAVERHILL 22,255 17,249 11,326
01832 HAVERHILL 4,235,358 4,449,135 4,700,441
01833 GEORGETOWN 2,751,145 2,909,622 3,055,877
01834 GROVELAND 2,083,505 2,191,840 2,352,000
01835 HAVERHILL 3,269,858 3,443,004 3,641,445
01840 LAWRENCE 183,693 185,465 182,740
01841 LAWRENCE 5,803,229 6,022,222 6,462,797
01842 LAWRENCE 59,514 50,586 53,749
01843 LAWRENCE 3,906,697 4,071,694 4,364,737
01844 METHUEN 11,882,890 12,398,953 13,125,798
01845 NORTH ANDOVER 8,580,563 9,078,503 9,540,579
01850 LOWELL 2,554,304 2,638,883 2,747,302
01851 LOWELL 4,726,947 4,862,111 5,079,553
01852 LOWELL 6,030,893 6,262,535 6,574,354
01853 LOWELL 51,061 35,251 37,203
01854 LOWELL 3,487,194 3,605,383 3,743,263
01860 MERRIMAC 1,841,708 1,934,552 2,051,449
01862 NORTH BILLERICA 2,184,575 2,279,659 2,423,057
01863 NORTH CHELMSFORD 1,898,273 1,992,994 2,084,802
01864 NORTH READING 4,771,743 5,016,174 5,293,157
01865 NUTTINGS LAKE 35,910 32,260 31,938
01866 PINEHURST 39,131 37,411 40,278
01867 READING 7,595,144 7,973,903 8,382,583
01876 TEWKSBURY 7,690,452 8,154,907 8,633,965
01879 TYNGSBORO 3,234,374 3,406,456 3,594,977
01880 WAKEFIELD 7,408,093 7,792,986 8,224,077
01885 WEST BOXFORD 92,212 87,292 85,624
26
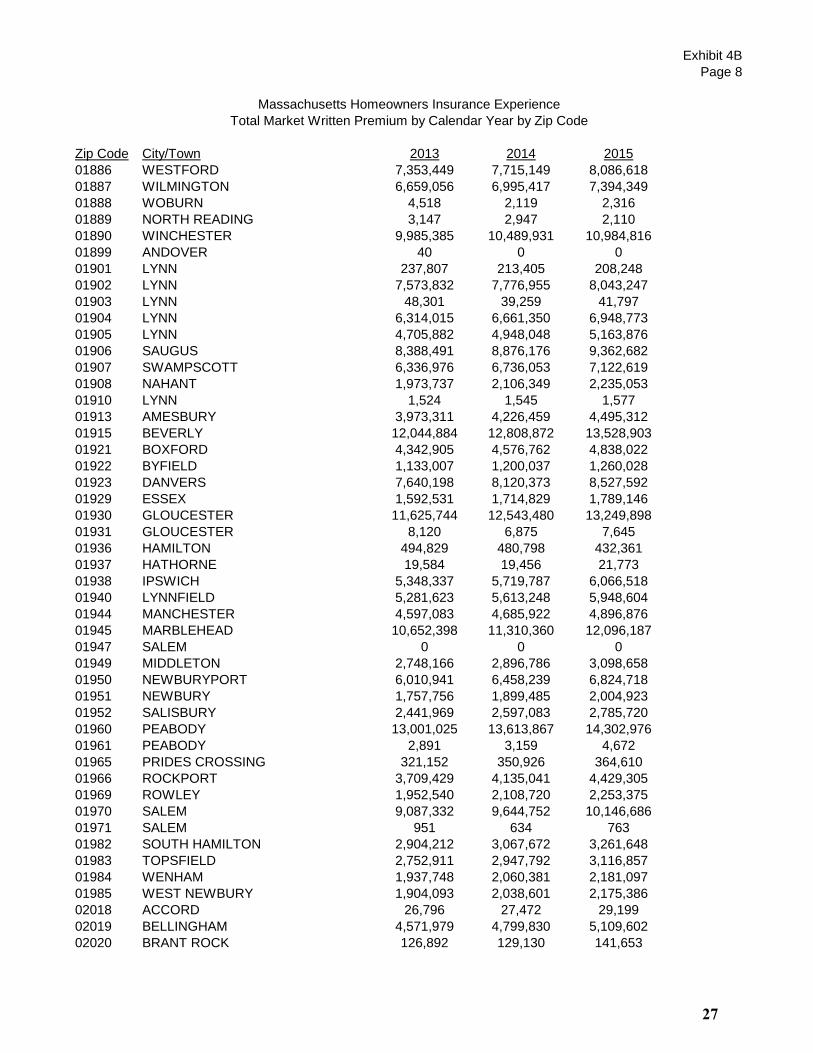
Exhibit 4B
Page 8
Zip Code City/Town 2013 2014 2015
Massachusetts Homeowners Insurance Experience
Total Market Written Premium by Calendar Year by Zip Code
01886 WESTFORD 7,353,449 7,715,149 8,086,618
01887 WILMINGTON 6,659,056 6,995,417 7,394,349
01888 WOBURN 4,518 2,119 2,316
01889 NORTH READING 3,147 2,947 2,110
01890 WINCHESTER 9,985,385 10,489,931 10,984,816
01899 ANDOVER 40 0 0
01901 LYNN 237,807 213,405 208,248
01902 LYNN 7,573,832 7,776,955 8,043,247
01903 LYNN 48,301 39,259 41,797
01904 LYNN 6,314,015 6,661,350 6,948,773
01905 LYNN 4,705,882 4,948,048 5,163,876
01906 SAUGUS 8,388,491 8,876,176 9,362,682
01907 SWAMPSCOTT 6,336,976 6,736,053 7,122,619
01908 NAHANT 1,973,737 2,106,349 2,235,053
01910 LYNN 1,524 1,545 1,577
01913 AMESBURY 3,973,311 4,226,459 4,495,312
01915 BEVERLY 12,044,884 12,808,872 13,528,903
01921 BOXFORD 4,342,905 4,576,762 4,838,022
01922 BYFIELD 1,133,007 1,200,037 1,260,028
01923 DANVERS 7,640,198 8,120,373 8,527,592
01929 ESSEX 1,592,531 1,714,829 1,789,146
01930 GLOUCESTER 11,625,744 12,543,480 13,249,898
01931 GLOUCESTER 8,120 6,875 7,645
01936 HAMILTON 494,829 480,798 432,361
01937 HATHORNE 19,584 19,456 21,773
01938 IPSWICH 5,348,337 5,719,787 6,066,518
01940 LYNNFIELD 5,281,623 5,613,248 5,948,604
01944 MANCHESTER 4,597,083 4,685,922 4,896,876
01945 MARBLEHEAD 10,652,398 11,310,360 12,096,187
01947 SALEM 0 0 0
01949 MIDDLETON 2,748,166 2,896,786 3,098,658
01950 NEWBURYPORT 6,010,941 6,458,239 6,824,718
01951 NEWBURY 1,757,756 1,899,485 2,004,923
01952 SALISBURY 2,441,969 2,597,083 2,785,720
01960 PEABODY 13,001,025 13,613,867 14,302,976
01961 PEABODY 2,891 3,159 4,672
01965 PRIDES CROSSING 321,152 350,926 364,610
01966 ROCKPORT 3,709,429 4,135,041 4,429,305
01969 ROWLEY 1,952,540 2,108,720 2,253,375
01970 SALEM 9,087,332 9,644,752 10,146,686
01971 SALEM 951 634 763
01982 SOUTH HAMILTON 2,904,212 3,067,672 3,261,648
01983 TOPSFIELD 2,752,911 2,947,792 3,116,857
01984 WENHAM 1,937,748 2,060,381 2,181,097
01985 WEST NEWBURY 1,904,093 2,038,601 2,175,386
02018 ACCORD 26,796 27,472 29,199
02019 BELLINGHAM 4,571,979 4,799,830 5,109,602
02020 BRANT ROCK 126,892 129,130 141,653
27

Exhibit 4B
Page 9
Zip Code City/Town 2013 2014 2015
Massachusetts Homeowners Insurance Experience
Total Market Written Premium by Calendar Year by Zip Code
02021 CANTON 7,146,060 7,479,928 7,894,196
02025 COHASSET 5,255,691 5,577,026 5,947,876
02026 DEDHAM 8,085,671 8,539,208 8,906,426
02027 DEDHAM 9,246 8,732 9,013
02030 DOVER 4,672,495 4,927,831 5,137,207
02031 EAST MANSFIELD 7,535 2,198 3,859
02032 EAST WALPOLE 1,447,269 1,545,920 1,626,520
02035 FOXBORO 5,045,244 5,364,177 5,647,232
02038 FRANKLIN 9,136,997 9,659,407 10,165,001
02040 GREENBUSH 16,612 13,822 12,340
02041 GREEN HARBOR 115,549 102,341 100,501
02043 HINGHAM 12,056,841 12,753,966 13,586,421
02044 HINGHAM 1,470 653 644
02045 HULL 5,831,096 6,063,576 6,184,482
02047 HUMAROCK 520,218 533,971 551,800
02048 MANSFIELD 7,123,113 7,548,538 7,957,801
02050 MARSHFIELD 11,899,927 12,572,936 13,425,076
02051 MARSHFIELD HILLS 262,340 259,295 263,680
02052 MEDFIELD 5,114,584 5,436,112 5,780,428
02053 MEDWAY 4,084,863 4,304,497 4,556,907
02054 MILLIS 2,434,507 2,560,835 2,738,878
02055 MINOT 25,917 15,237 15,713
02056 NORFOLK 3,524,339 3,705,601 3,942,866
02059 NORTH MARSHFIELD 151,537 118,885 125,736
02060 NORTH SCITUATE 104,087 89,276 87,771
02061 NORWELL 5,417,631 5,810,683 6,185,908
02062 NORWOOD 6,959,598 7,292,527 7,610,327
02065 OCEAN BLUFF 59,545 61,903 62,754
02066 SCITUATE 10,342,521 10,984,330 11,565,092
02067 SHARON 6,740,885 7,022,562 7,474,239
02070 SHELDONVILLE 25,522 19,830 20,272
02071 SOUTH WALPOLE 290,634 307,700 334,863
02072 STOUGHTON 7,241,058 7,610,954 8,067,711
02081 WALPOLE 6,146,375 6,496,846 6,880,904
02090 WESTWOOD 6,661,682 7,016,033 7,407,939
02093 WRENTHAM 3,768,560 4,011,432 4,242,895
02101 BOSTON 14,764 7,113 8,657
02102 BOSTON 136 120 0
02103 BOSTON 1,447 1,585 1,429
02104 BOSTON -82 0 0
02105 BOSTON 350 355 360
02106 BOSTON 122 354 278
02107 BOSTON 1,602 1,719 591
02108 BOSTON 3,031,133 3,012,192 3,179,432
02109 BOSTON 906,102 967,548 1,003,904
02110 BOSTON 1,022,400 1,057,008 1,102,984
02111 BOSTON 1,180,093 1,272,963 1,276,204
02112 BOSTON 3,286 2,315 1,602
28
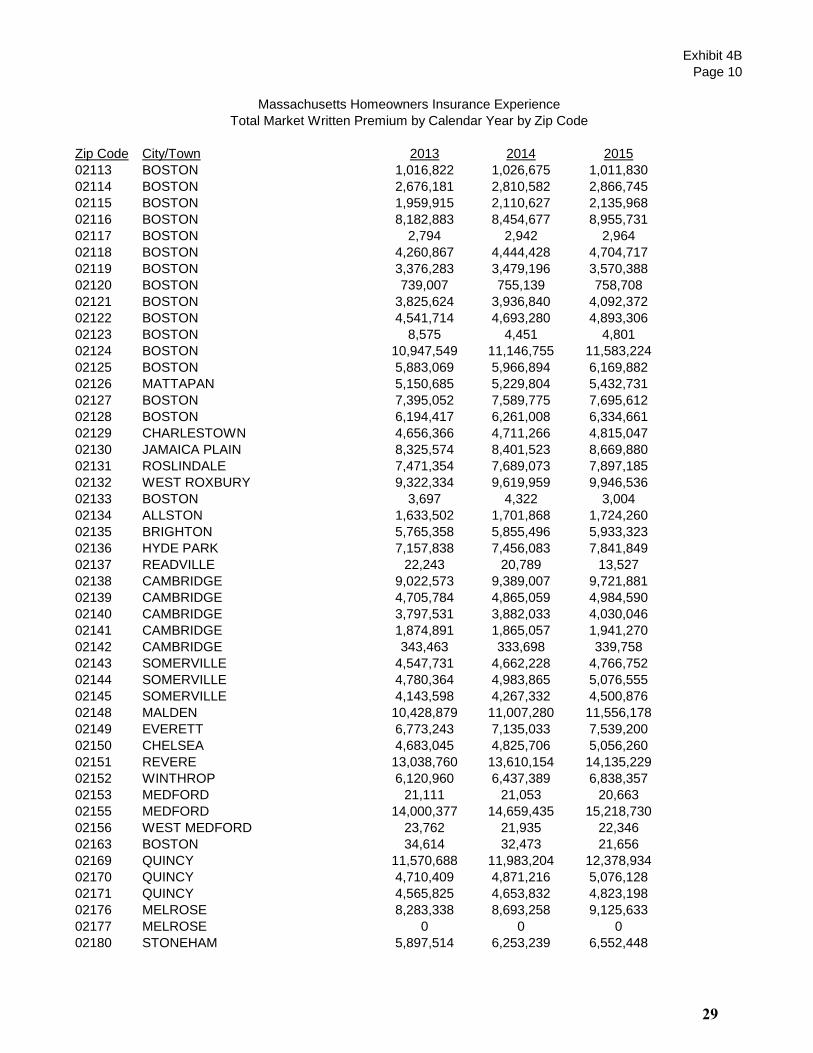
Exhibit 4B
Page 10
Zip Code City/Town 2013 2014 2015
Massachusetts Homeowners Insurance Experience
Total Market Written Premium by Calendar Year by Zip Code
02113 BOSTON 1,016,822 1,026,675 1,011,830
02114 BOSTON 2,676,181 2,810,582 2,866,745
02115 BOSTON 1,959,915 2,110,627 2,135,968
02116 BOSTON 8,182,883 8,454,677 8,955,731
02117 BOSTON 2,794 2,942 2,964
02118 BOSTON 4,260,867 4,444,428 4,704,717
02119 BOSTON 3,376,283 3,479,196 3,570,388
02120 BOSTON 739,007 755,139 758,708
02121 BOSTON 3,825,624 3,936,840 4,092,372
02122 BOSTON 4,541,714 4,693,280 4,893,306
02123 BOSTON 8,575 4,451 4,801
02124 BOSTON 10,947,549 11,146,755 11,583,224
02125 BOSTON 5,883,069 5,966,894 6,169,882
02126 MATTAPAN 5,150,685 5,229,804 5,432,731
02127 BOSTON 7,395,052 7,589,775 7,695,612
02128 BOSTON 6,194,417 6,261,008 6,334,661
02129 CHARLESTOWN 4,656,366 4,711,266 4,815,047
02130 JAMAICA PLAIN 8,325,574 8,401,523 8,669,880
02131 ROSLINDALE 7,471,354 7,689,073 7,897,185
02132 WEST ROXBURY 9,322,334 9,619,959 9,946,536
02133 BOSTON 3,697 4,322 3,004
02134 ALLSTON 1,633,502 1,701,868 1,724,260
02135 BRIGHTON 5,765,358 5,855,496 5,933,323
02136 HYDE PARK 7,157,838 7,456,083 7,841,849
02137 READVILLE 22,243 20,789 13,527
02138 CAMBRIDGE 9,022,573 9,389,007 9,721,881
02139 CAMBRIDGE 4,705,784 4,865,059 4,984,590
02140 CAMBRIDGE 3,797,531 3,882,033 4,030,046
02141 CAMBRIDGE 1,874,891 1,865,057 1,941,270
02142 CAMBRIDGE 343,463 333,698 339,758
02143 SOMERVILLE 4,547,731 4,662,228 4,766,752
02144 SOMERVILLE 4,780,364 4,983,865 5,076,555
02145 SOMERVILLE 4,143,598 4,267,332 4,500,876
02148 MALDEN 10,428,879 11,007,280 11,556,178
02149 EVERETT 6,773,243 7,135,033 7,539,200
02150 CHELSEA 4,683,045 4,825,706 5,056,260
02151 REVERE 13,038,760 13,610,154 14,135,229
02152 WINTHROP 6,120,960 6,437,389 6,838,357
02153 MEDFORD 21,111 21,053 20,663
02155 MEDFORD 14,000,377 14,659,435 15,218,730
02156 WEST MEDFORD 23,762 21,935 22,346
02163 BOSTON 34,614 32,473 21,656
02169 QUINCY 11,570,688 11,983,204 12,378,934
02170 QUINCY 4,710,409 4,871,216 5,076,128
02171 QUINCY 4,565,825 4,653,832 4,823,198
02176 MELROSE 8,283,338 8,693,258 9,125,633
02177 MELROSE 0 0 0
02180 STONEHAM 5,897,514 6,253,239 6,552,448
29
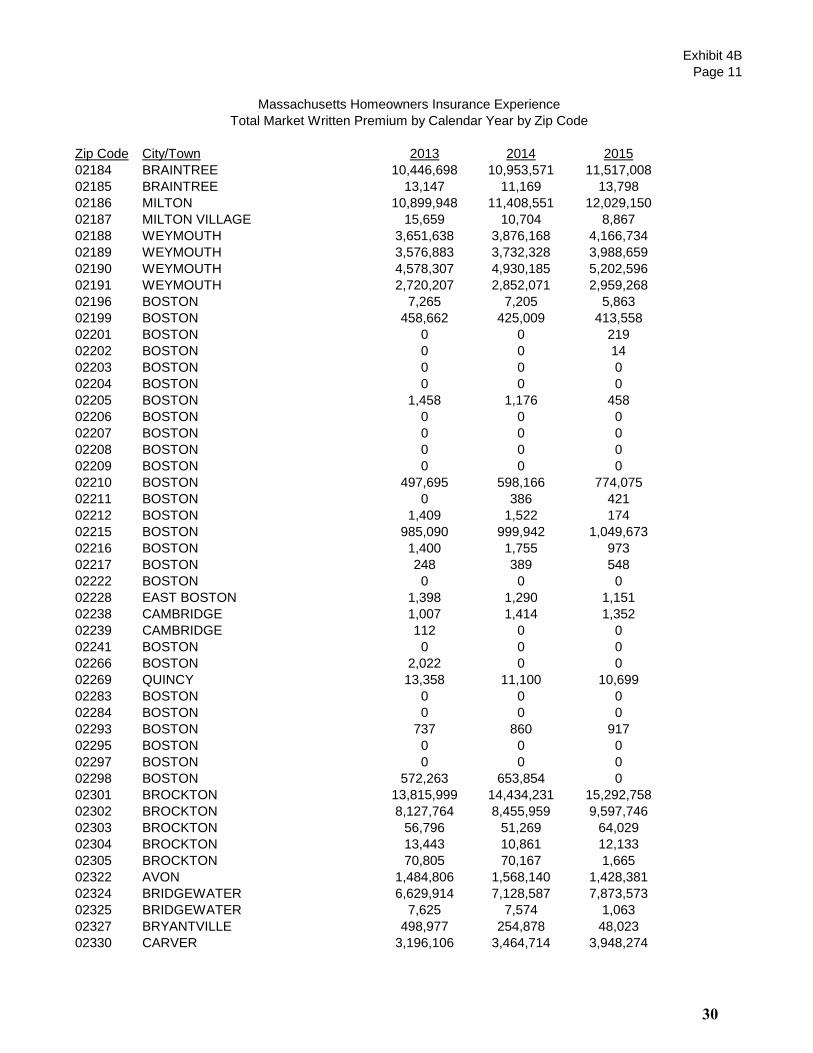
Exhibit 4B
Page 11
Zip Code City/Town 2013 2014 2015
Massachusetts Homeowners Insurance Experience
Total Market Written Premium by Calendar Year by Zip Code
02184 BRAINTREE 10,446,698 10,953,571 11,517,008
02185 BRAINTREE 13,147 11,169 13,798
02186 MILTON 10,899,948 11,408,551 12,029,150
02187 MILTON VILLAGE 15,659 10,704 8,867
02188 WEYMOUTH 3,651,638 3,876,168 4,166,734
02189 WEYMOUTH 3,576,883 3,732,328 3,988,659
02190 WEYMOUTH 4,578,307 4,930,185 5,202,596
02191 WEYMOUTH 2,720,207 2,852,071 2,959,268
02196 BOSTON 7,265 7,205 5,863
02199 BOSTON 458,662 425,009 413,558
02201 BOSTON 0 0 219
02202 BOSTON 0 0 14
02203 BOSTON 0 0 0
02204 BOSTON 0 0 0
02205 BOSTON 1,458 1,176 458
02206 BOSTON 0 0 0
02207 BOSTON 0 0 0
02208 BOSTON 0 0 0
02209 BOSTON 0 0 0
02210 BOSTON 497,695 598,166 774,075
02211 BOSTON 0 386 421
02212 BOSTON 1,409 1,522 174
02215 BOSTON 985,090 999,942 1,049,673
02216 BOSTON 1,400 1,755 973
02217 BOSTON 248 389 548
02222 BOSTON 0 0 0
02228 EAST BOSTON 1,398 1,290 1,151
02238 CAMBRIDGE 1,007 1,414 1,352
02239 CAMBRIDGE 112 0 0
02241 BOSTON 0 0 0
02266 BOSTON 2,022 0 0
02269 QUINCY 13,358 11,100 10,699
02283 BOSTON 0 0 0
02284 BOSTON 0 0 0
02293 BOSTON 737 860 917
02295 BOSTON 0 0 0
02297 BOSTON 0 0 0
02298 BOSTON 572,263 653,854 0
02301 BROCKTON 13,815,999 14,434,231 15,292,758
02302 BROCKTON 8,127,764 8,455,959 9,597,746
02303 BROCKTON 56,796 51,269 64,029
02304 BROCKTON 13,443 10,861 12,133
02305 BROCKTON 70,805 70,167 1,665
02322 AVON 1,484,806 1,568,140 1,428,381
02324 BRIDGEWATER 6,629,914 7,128,587 7,873,573
02325 BRIDGEWATER 7,625 7,574 1,063
02327 BRYANTVILLE 498,977 254,878 48,023
02330 CARVER 3,196,106 3,464,714 3,948,274
30
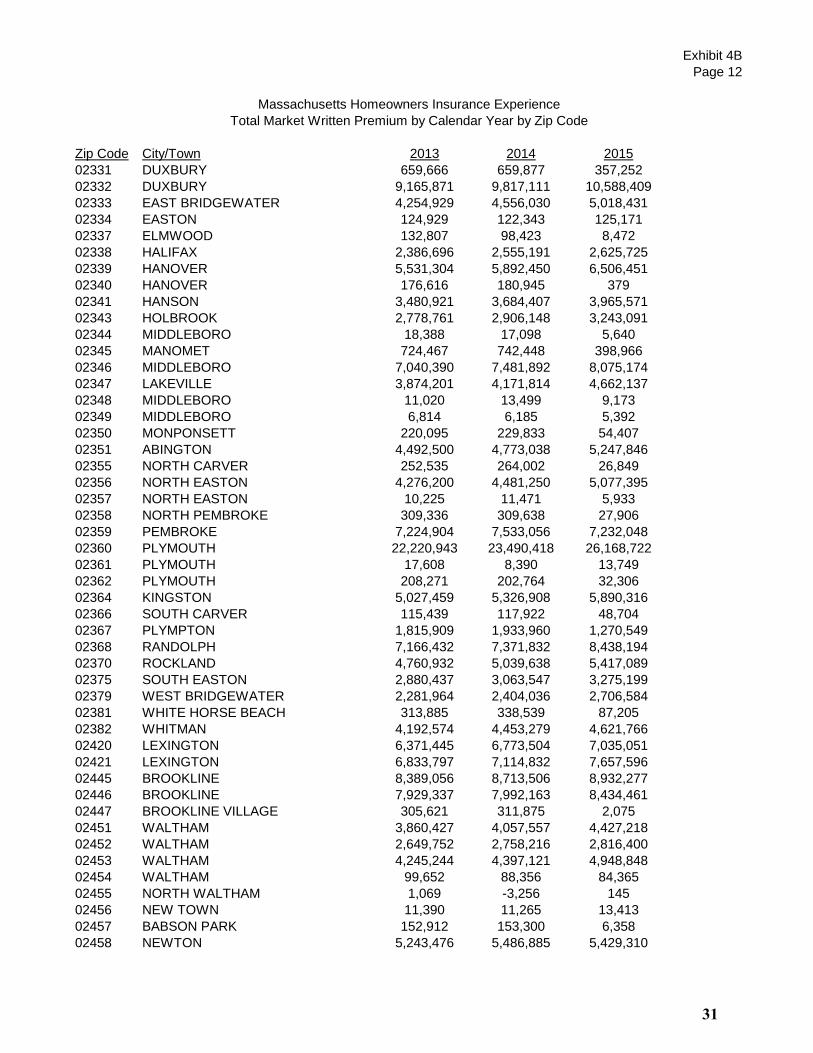
Exhibit 4B
Page 12
Zip Code City/Town 2013 2014 2015
Massachusetts Homeowners Insurance Experience
Total Market Written Premium by Calendar Year by Zip Code
02331 DUXBURY 659,666 659,877 357,252
02332 DUXBURY 9,165,871 9,817,111 10,588,409
02333 EAST BRIDGEWATER 4,254,929 4,556,030 5,018,431
02334 EASTON 124,929 122,343 125,171
02337 ELMWOOD 132,807 98,423 8,472
02338 HALIFAX 2,386,696 2,555,191 2,625,725
02339 HANOVER 5,531,304 5,892,450 6,506,451
02340 HANOVER 176,616 180,945 379
02341 HANSON 3,480,921 3,684,407 3,965,571
02343 HOLBROOK 2,778,761 2,906,148 3,243,091
02344 MIDDLEBORO 18,388 17,098 5,640
02345 MANOMET 724,467 742,448 398,966
02346 MIDDLEBORO 7,040,390 7,481,892 8,075,174
02347 LAKEVILLE 3,874,201 4,171,814 4,662,137
02348 MIDDLEBORO 11,020 13,499 9,173
02349 MIDDLEBORO 6,814 6,185 5,392
02350 MONPONSETT 220,095 229,833 54,407
02351 ABINGTON 4,492,500 4,773,038 5,247,846
02355 NORTH CARVER 252,535 264,002 26,849
02356 NORTH EASTON 4,276,200 4,481,250 5,077,395
02357 NORTH EASTON 10,225 11,471 5,933
02358 NORTH PEMBROKE 309,336 309,638 27,906
02359 PEMBROKE 7,224,904 7,533,056 7,232,048
02360 PLYMOUTH 22,220,943 23,490,418 26,168,722
02361 PLYMOUTH 17,608 8,390 13,749
02362 PLYMOUTH 208,271 202,764 32,306
02364 KINGSTON 5,027,459 5,326,908 5,890,316
02366 SOUTH CARVER 115,439 117,922 48,704
02367 PLYMPTON 1,815,909 1,933,960 1,270,549
02368 RANDOLPH 7,166,432 7,371,832 8,438,194
02370 ROCKLAND 4,760,932 5,039,638 5,417,089
02375 SOUTH EASTON 2,880,437 3,063,547 3,275,199
02379 WEST BRIDGEWATER 2,281,964 2,404,036 2,706,584
02381 WHITE HORSE BEACH 313,885 338,539 87,205
02382 WHITMAN 4,192,574 4,453,279 4,621,766
02420 LEXINGTON 6,371,445 6,773,504 7,035,051
02421 LEXINGTON 6,833,797 7,114,832 7,657,596
02445 BROOKLINE 8,389,056 8,713,506 8,932,277
02446 BROOKLINE 7,929,337 7,992,163 8,434,461
02447 BROOKLINE VILLAGE 305,621 311,875 2,075
02451 WALTHAM 3,860,427 4,057,557 4,427,218
02452 WALTHAM 2,649,752 2,758,216 2,816,400
02453 WALTHAM 4,245,244 4,397,121 4,948,848
02454 WALTHAM 99,652 88,356 84,365
02455 NORTH WALTHAM 1,069 -3,256 145
02456 NEW TOWN 11,390 11,265 13,413
02457 BABSON PARK 152,912 153,300 6,358
02458 NEWTON 5,243,476 5,486,885 5,429,310
31

Exhibit 4B
Page 13
Zip Code City/Town 2013 2014 2015
Massachusetts Homeowners Insurance Experience
Total Market Written Premium by Calendar Year by Zip Code
02459 NEWTON CENTER 9,206,909 9,565,094 10,319,308
02460 NEWTONVILLE 3,137,036 3,277,289 3,451,102
02461 NEWTON HIGHLANDS 2,712,028 2,859,419 3,120,186
02462 NEWTON LOWER FALLS 496,949 525,845 528,134
02464 NEWTON UPPER FALLS 866,030 882,169 756,149
02465 WEST NEWTON 5,912,768 6,202,954 6,623,828
02466 AUBURNDALE 2,403,752 2,513,680 2,428,432
02467 CHESTNUT HILL 8,021,581 8,486,277 8,917,518
02468 WABAN 3,281,300 3,444,565 3,764,956
02471 WATERTOWN 421,287 451,146 19,187
02472 WATERTOWN 7,416,874 7,757,391 8,068,520
02474 ARLINGTON 6,965,444 7,311,973 8,007,621
02475 ARLINGTON HEIGHTS 310,085 304,792 2,318
02476 ARLINGTON 4,738,883 4,981,490 5,523,642
02477 WATERTOWN 387,075 400,877 0
02478 BELMONT 8,537,284 8,906,790 9,771,618
02479 WAVERLY 361,904 379,172 2,253
02481 WELLESLEY HILLS 9,958,108 10,507,574 11,205,566
02482 WELLESLEY 5,366,345 5,609,388 5,723,224
02492 NEEDHAM 9,287,184 9,778,574 10,488,381
02493 WESTON 9,497,157 10,198,966 10,542,839
02494 NEEDHAM HEIGHTS 3,033,791 3,186,134 3,590,306
02495 NEWTON (Nonantum) 201,824 232,360 0
02532 BUZZARDS BAY 5,939,879 6,105,800 6,544,503
02534 CATAUMET 1,401,887 1,376,310 1,374,961
02535 CHILMARK 7,138,218 7,440,423 7,059,010
02536 EAST FALMOUTH 15,332,097 15,526,769 16,413,298
02537 EAST SANDWICH 4,745,815 4,879,236 5,198,185
02538 EAST WAREHAM 1,529,869 1,607,123 1,505,156
02539 EDGARTOWN 12,301,177 12,543,329 12,878,385
02540 FALMOUTH 9,688,061 10,002,910 10,490,960
02541 FALMOUTH 355,870 343,940 358,767
02542 BUZZARDS BAY 43,691 56,426 27,767
02543 WOODS HOLE 1,818,036 1,784,300 1,863,806
02552 MENEMSHA 97,628 88,092 23,266
02553 MONUMENT BEACH 822,699 855,231 615,968
02554 NANTUCKET 30,322,375 30,554,386 31,303,742
02556 NORTH FALMOUTH 4,807,976 4,912,263 5,269,627
02557 OAK BLUFFS 6,315,591 6,449,146 6,573,711
02558 ONSET 1,481,055 1,484,918 1,411,041
02559 POCASSET 3,410,380 3,470,442 3,704,337
02561 SAGAMORE 422,680 424,001 371,425
02562 SAGAMORE BEACH 2,183,285 2,243,829 2,217,521
02563 SANDWICH 6,691,400 6,889,133 7,267,698
02564 SIASCONSET 2,446,758 2,426,207 2,579,183
02565 SILVER BEACH 252,109 232,065 8,278
02568 VINEYARD HAVEN 6,598,125 6,821,158 6,989,962
02571 WAREHAM 5,549,976 5,718,733 6,181,140
32
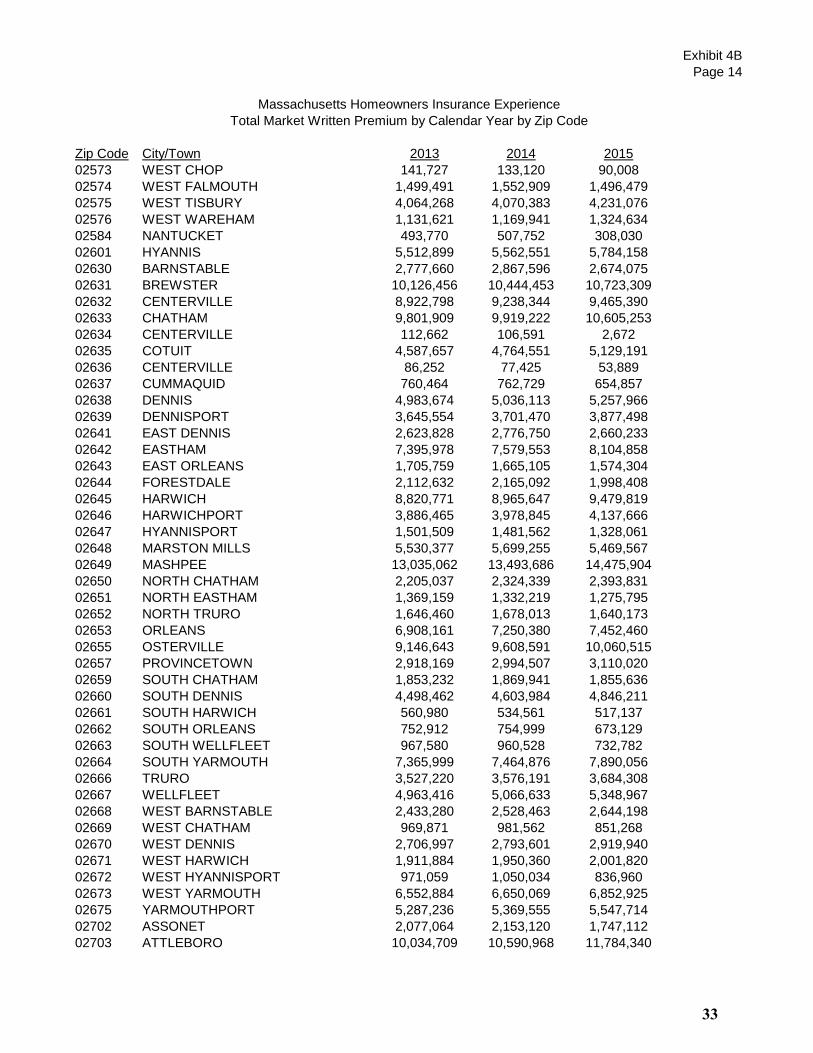
Exhibit 4B
Page 14
Zip Code City/Town 2013 2014 2015
Massachusetts Homeowners Insurance Experience
Total Market Written Premium by Calendar Year by Zip Code
02573 WEST CHOP 141,727 133,120 90,008
02574 WEST FALMOUTH 1,499,491 1,552,909 1,496,479
02575 WEST TISBURY 4,064,268 4,070,383 4,231,076
02576 WEST WAREHAM 1,131,621 1,169,941 1,324,634
02584 NANTUCKET 493,770 507,752 308,030
02601 HYANNIS 5,512,899 5,562,551 5,784,158
02630 BARNSTABLE 2,777,660 2,867,596 2,674,075
02631 BREWSTER 10,126,456 10,444,453 10,723,309
02632 CENTERVILLE 8,922,798 9,238,344 9,465,390
02633 CHATHAM 9,801,909 9,919,222 10,605,253
02634 CENTERVILLE 112,662 106,591 2,672
02635 COTUIT 4,587,657 4,764,551 5,129,191
02636 CENTERVILLE 86,252 77,425 53,889
02637 CUMMAQUID 760,464 762,729 654,857
02638 DENNIS 4,983,674 5,036,113 5,257,966
02639 DENNISPORT 3,645,554 3,701,470 3,877,498
02641 EAST DENNIS 2,623,828 2,776,750 2,660,233
02642 EASTHAM 7,395,978 7,579,553 8,104,858
02643 EAST ORLEANS 1,705,759 1,665,105 1,574,304
02644 FORESTDALE 2,112,632 2,165,092 1,998,408
02645 HARWICH 8,820,771 8,965,647 9,479,819
02646 HARWICHPORT 3,886,465 3,978,845 4,137,666
02647 HYANNISPORT 1,501,509 1,481,562 1,328,061
02648 MARSTON MILLS 5,530,377 5,699,255 5,469,567
02649 MASHPEE 13,035,062 13,493,686 14,475,904
02650 NORTH CHATHAM 2,205,037 2,324,339 2,393,831
02651 NORTH EASTHAM 1,369,159 1,332,219 1,275,795
02652 NORTH TRURO 1,646,460 1,678,013 1,640,173
02653 ORLEANS 6,908,161 7,250,380 7,452,460
02655 OSTERVILLE 9,146,643 9,608,591 10,060,515
02657 PROVINCETOWN 2,918,169 2,994,507 3,110,020
02659 SOUTH CHATHAM 1,853,232 1,869,941 1,855,636
02660 SOUTH DENNIS 4,498,462 4,603,984 4,846,211
02661 SOUTH HARWICH 560,980 534,561 517,137
02662 SOUTH ORLEANS 752,912 754,999 673,129
02663 SOUTH WELLFLEET 967,580 960,528 732,782
02664 SOUTH YARMOUTH 7,365,999 7,464,876 7,890,056
02666 TRURO 3,527,220 3,576,191 3,684,308
02667 WELLFLEET 4,963,416 5,066,633 5,348,967
02668 WEST BARNSTABLE 2,433,280 2,528,463 2,644,198
02669 WEST CHATHAM 969,871 981,562 851,268
02670 WEST DENNIS 2,706,997 2,793,601 2,919,940
02671 WEST HARWICH 1,911,884 1,950,360 2,001,820
02672 WEST HYANNISPORT 971,059 1,050,034 836,960
02673 WEST YARMOUTH 6,552,884 6,650,069 6,852,925
02675 YARMOUTHPORT 5,287,236 5,369,555 5,547,714
02702 ASSONET 2,077,064 2,153,120 1,747,112
02703 ATTLEBORO 10,034,709 10,590,968 11,784,340
33
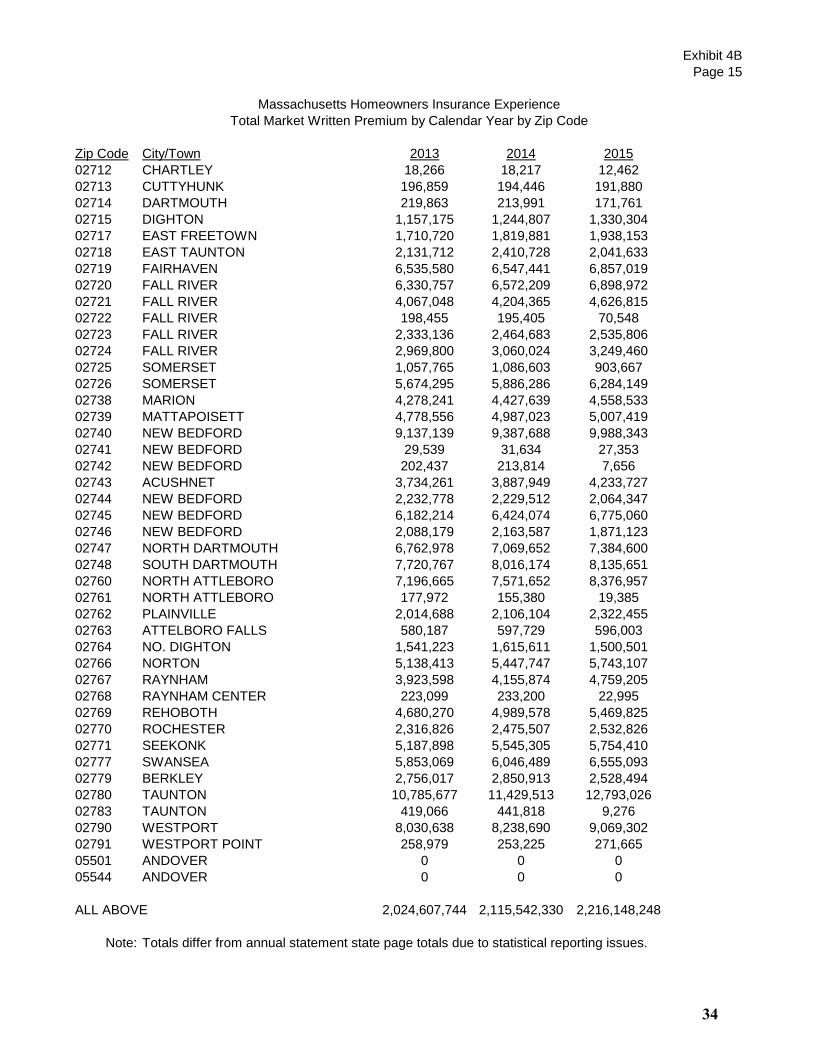
Exhibit 4B
Page 15
Zip Code City/Town 2013 2014 2015
Massachusetts Homeowners Insurance Experience
Total Market Written Premium by Calendar Year by Zip Code
02712 CHARTLEY 18,266 18,217 12,462
02713 CUTTYHUNK 196,859 194,446 191,880
02714 DARTMOUTH 219,863 213,991 171,761
02715 DIGHTON 1,157,175 1,244,807 1,330,304
02717 EAST FREETOWN 1,710,720 1,819,881 1,938,153
02718 EAST TAUNTON 2,131,712 2,410,728 2,041,633
02719 FAIRHAVEN 6,535,580 6,547,441 6,857,019
02720 FALL RIVER 6,330,757 6,572,209 6,898,972
02721 FALL RIVER 4,067,048 4,204,365 4,626,815
02722 FALL RIVER 198,455 195,405 70,548
02723 FALL RIVER 2,333,136 2,464,683 2,535,806
02724 FALL RIVER 2,969,800 3,060,024 3,249,460
02725 SOMERSET 1,057,765 1,086,603 903,667
02726 SOMERSET 5,674,295 5,886,286 6,284,149
02738 MARION 4,278,241 4,427,639 4,558,533
02739 MATTAPOISETT 4,778,556 4,987,023 5,007,419
02740 NEW BEDFORD 9,137,139 9,387,688 9,988,343
02741 NEW BEDFORD 29,539 31,634 27,353
02742 NEW BEDFORD 202,437 213,814 7,656
02743 ACUSHNET 3,734,261 3,887,949 4,233,727
02744 NEW BEDFORD 2,232,778 2,229,512 2,064,347
02745 NEW BEDFORD 6,182,214 6,424,074 6,775,060
02746 NEW BEDFORD 2,088,179 2,163,587 1,871,123
02747 NORTH DARTMOUTH 6,762,978 7,069,652 7,384,600
02748 SOUTH DARTMOUTH 7,720,767 8,016,174 8,135,651
02760 NORTH ATTLEBORO 7,196,665 7,571,652 8,376,957
02761 NORTH ATTLEBORO 177,972 155,380 19,385
02762 PLAINVILLE 2,014,688 2,106,104 2,322,455
02763 ATTELBORO FALLS 580,187 597,729 596,003
02764 NO. DIGHTON 1,541,223 1,615,611 1,500,501
02766 NORTON 5,138,413 5,447,747 5,743,107
02767 RAYNHAM 3,923,598 4,155,874 4,759,205
02768 RAYNHAM CENTER 223,099 233,200 22,995
02769 REHOBOTH 4,680,270 4,989,578 5,469,825
02770 ROCHESTER 2,316,826 2,475,507 2,532,826
02771 SEEKONK 5,187,898 5,545,305 5,754,410
02777 SWANSEA 5,853,069 6,046,489 6,555,093
02779 BERKLEY 2,756,017 2,850,913 2,528,494
02780 TAUNTON 10,785,677 11,429,513 12,793,026
02783 TAUNTON 419,066 441,818 9,276
02790 WESTPORT 8,030,638 8,238,690 9,069,302
02791 WESTPORT POINT 258,979 253,225 271,665
05501 ANDOVER 0 0 0
05544 ANDOVER 0 0 0
ALL ABOVE 2,024,607,744 2,115,542,330 2,216,148,248
Note: Totals differ from annual statement state page totals due to statistical reporting issues.
34
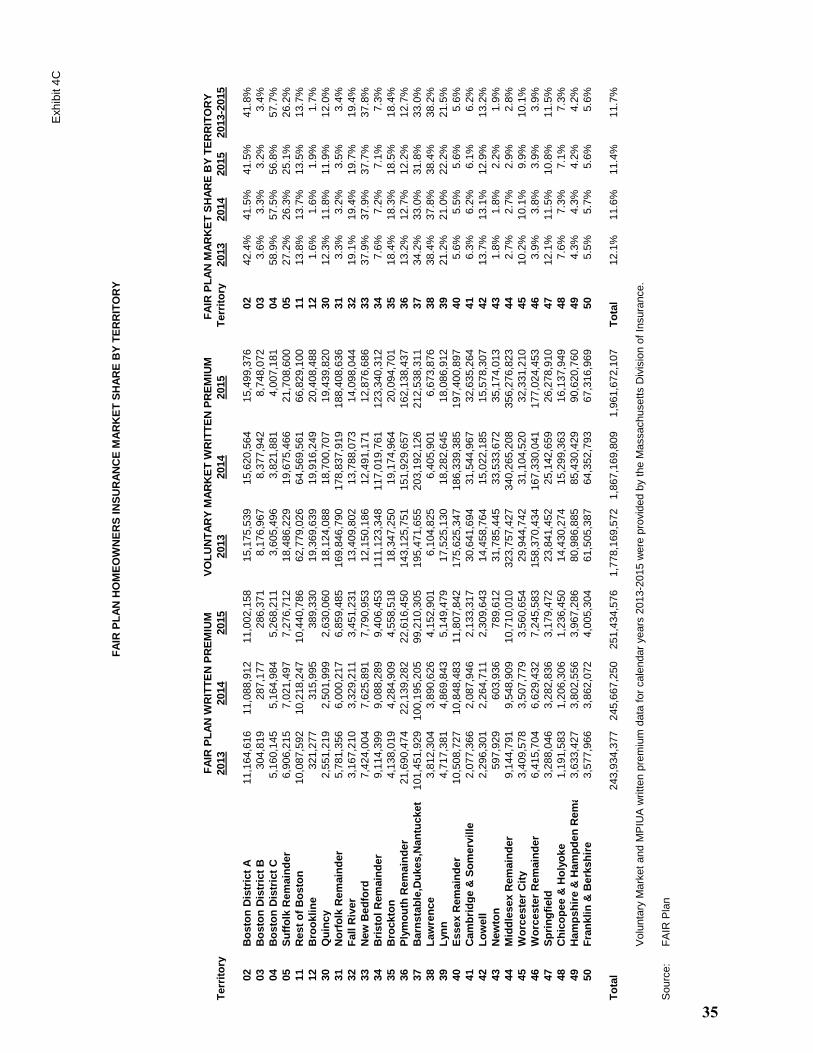
Exh
ibit 4
C
FA
IR P
LA
N H
OM
EO
WN
ER
S I
NS
UR
AN
CE
MA
RK
ET
SH
AR
E B
Y T
ER
RIT
OR
Y
Terr
ito
ry2013
2014
2015
2013
2014
2015
Terr
ito
ry2013
2014
2015
2013-2
015
02
Bo
sto
n D
istr
ict
A11,1
64,6
16
11,0
88,9
12
11,0
02,1
58
15,1
75,5
39
15,6
20,5
64
15,4
99,3
76
02
42.4
%41.5
%41.5
%41.8
%
03
Bo
sto
n D
istr
ict
B304,8
19
287,1
77
286,3
71
8,1
76,9
67
8,3
77,9
42
8,7
48,0
72
03
3.6
%3.3
%3.2
%3.4
%
04
Bo
sto
n D
istr
ict
C5,1
60,1
45
5,1
64,9
84
5,2
68,2
11
3,6
05,4
96
3,8
21,8
81
4,0
07,1
81
04
58.9
%57.5
%56.8
%57.7
%
05
Su
ffo
lk R
em
ain
de
r6,9
06,2
15
7,0
21,4
97
7,2
76,7
12
18,4
86,2
29
19,6
75,4
66
21,7
08,6
00
05
27.2
%26.3
%25.1
%26.2
%
11
Rest
of
Bo
sto
n10,0
87,5
92
10,2
18,2
47
10,4
40,7
86
62,7
79,0
26
64,5
69,5
61
66,8
29,1
00
11
13.8
%13.7
%13.5
%13.7
%
12
Bro
ok
lin
e321,2
77
315,9
95
389,3
30
19,3
69,6
39
19,9
16,2
49
20,4
08,4
88
12
1.6
%1.6
%1.9
%1.7
%
30
Qu
inc
y2,5
51,2
19
2,5
01,9
99
2,6
30,0
60
18,1
24,0
88
18,7
00,7
07
19,4
39,8
20
30
12.3
%11.8
%11.9
%12.0
%
31
No
rfo
lk R
em
ain
de
r5,7
81,3
56
6,0
00,2
17
6,8
59,4
85
169,8
46,7
90
178,8
37,9
19
188,4
08,6
36
31
3.3
%3.2
%3.5
%3.4
%
32
Fa
ll R
iver
3,1
67,2
10
3,3
29,2
11
3,4
51,2
31
13,4
09,8
02
13,7
88,0
73
14,0
98,0
44
32
19.1
%19.4
%19.7
%19.4
%
33
New
Bed
ford
7,4
24,0
04
7,6
25,8
91
7,7
90,9
53
12,1
50,1
86
12,4
91,1
71
12,8
76,6
86
33
37.9
%37.9
%37.7
%37.8
%
34
Bri
sto
l R
em
ain
de
r9,1
14,3
99
9,0
88,2
89
9,4
06,4
53
111,1
23,3
48
117,0
19,7
61
123,3
40,3
12
34
7.6
%7.2
%7.1
%7.3
%
35
Bro
ckto
n4,1
38,0
19
4,2
84,9
09
4,5
58,5
18
18,3
47,2
50
19,1
74,9
64
20,0
94,7
01
35
18.4
%18.3
%18.5
%18.4
%
36
Ply
mo
uth
Rem
ain
de
r21,6
90,4
74
22,1
39,2
82
22,6
16,4
50
143,1
25,7
51
151,9
29,6
57
162,1
38,4
37
36
13.2
%12.7
%12.2
%12.7
%
37
Barn
sta
ble
,Du
kes,N
an
tuc
ket
101,4
51,9
29
100,1
95,2
05
99,2
10,3
05
195,4
71,6
55
203,1
92,1
26
212,5
38,3
11
37
34.2
%33.0
%31.8
%33.0
%
38
La
wre
nc
e3,8
12,3
04
3,8
90,6
26
4,1
52,9
01
6,1
04,8
25
6,4
05,9
01
6,6
73,8
76
38
38.4
%37.8
%38.4
%38.2
%
39
Lyn
n4,7
17,3
81
4,8
69,8
43
5,1
49,4
79
17,5
25,1
30
18,2
82,6
45
18,0
86,9
12
39
21.2
%21.0
%22.2
%21.5
%
40
Essex R
em
ain
de
r10,5
08,7
27
10,8
48,4
83
11,8
07,8
42
175,6
25,3
47
186,3
39,3
85
197,4
00,8
97
40
5.6
%5.5
%5.6
%5.6
%
41
Cam
bri
dg
e &
So
merv
ille
2,0
77,3
66
2,0
87,9
46
2,1
33,3
17
30,6
41,6
94
31,5
44,9
67
32,6
35,2
64
41
6.3
%6.2
%6.1
%6.2
%
42
Lo
well
2,2
96,3
01
2,2
64,7
11
2,3
09,6
43
14,4
58,7
64
15,0
22,1
85
15,5
78,3
07
42
13.7
%13.1
%12.9
%13.2
%
43
New
ton
597,9
29
603,9
36
789,6
12
31,7
85,4
45
33,5
33,6
72
35,1
74,0
13
43
1.8
%1.8
%2.2
%1.9
%
44
Mid
dle
sex R
em
ain
de
r9,1
44,7
91
9,5
48,9
09
10,7
10,0
10
323,7
57,4
27
340,2
65,2
08
356,2
76,8
23
44
2.7
%2.7
%2.9
%2.8
%
45
Wo
rceste
r C
ity
3,4
09,5
78
3,5
07,7
79
3,5
60,6
54
29,9
44,7
42
31,1
04,5
20
32,3
31,2
10
45
10.2
%10.1
%9.9
%10.1
%
46
Wo
rceste
r R
em
ain
de
r6,4
15,7
04
6,6
29,4
32
7,2
45,5
83
158,3
70,4
34
167,3
30,0
41
177,0
24,4
53
46
3.9
%3.8
%3.9
%3.9
%
47
Sp
rin
gfi
eld
3,2
88,0
46
3,2
82,8
36
3,1
79,4
72
23,8
41,4
52
25,1
42,6
59
26,2
78,9
10
47
12.1
%11.5
%10.8
%11.5
%
48
Ch
ico
pe
e &
Ho
lyo
ke
1,1
91,5
83
1,2
06,3
06
1,2
36,4
50
14,4
30,2
74
15,2
99,3
63
16,1
37,9
49
48
7.6
%7.3
%7.1
%7.3
%
49
Ham
ps
hir
e &
Ham
pd
en
Rem
ain
de
r3,6
33,4
27
3,8
02,5
56
3,9
67,2
86
80,9
86,8
85
85,4
30,4
29
90,6
20,7
60
49
4.3
%4.3
%4.2
%4.2
%
50
Fra
nk
lin
& B
erk
sh
ire
3,5
77,9
66
3,8
62,0
72
4,0
05,3
04
61,5
05,3
87
64,3
52,7
93
67,3
16,9
69
50
5.5
%5.7
%5.6
%5.6
%
To
tal
243,9
34,3
77
245,6
67,2
50
251,4
34,5
76
1,7
78,1
69,5
72
1,8
67,1
69,8
09
1,9
61,6
72,1
07
To
tal
12.1
%11.6
%11.4
%11.7
%
Volu
nta
ry M
ark
et
and M
PIU
A w
ritt
en p
rem
ium
data
for
cale
ndar
years
2013-2
015 w
ere
pro
vid
ed b
y t
he M
assachusett
s D
ivis
ion o
f In
sura
nce.
Sourc
e:
FA
IR P
lan
FA
IR P
LA
N M
AR
KE
T S
HA
RE
BY
TE
RR
ITO
RY
VO
LU
NT
AR
Y M
AR
KE
T W
RIT
TE
N P
RE
MIU
MF
AIR
PL
AN
WR
ITT
EN
PR
EM
IUM
35
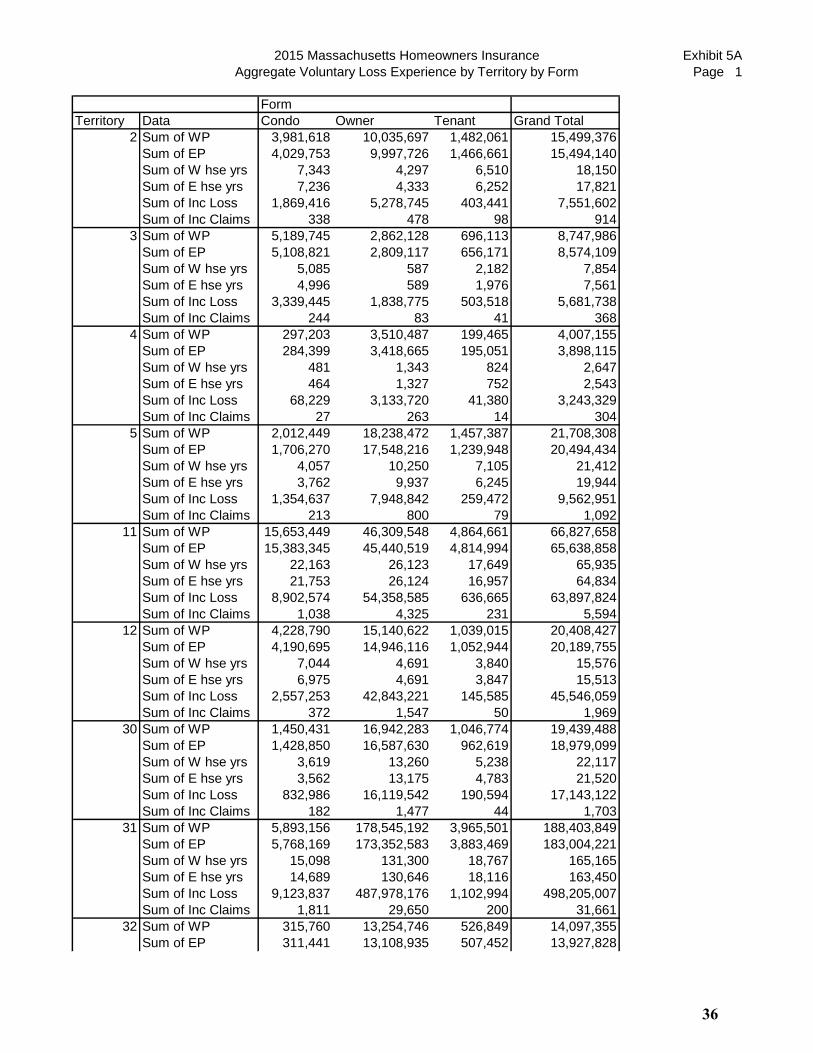
2015 Massachusetts Homeowners Insurance
Aggregate Voluntary Loss Experience by Territory by Form
Exhibit 5A
Page 1
Form
Territory Data Condo Owner Tenant Grand Total
2 Sum of WP 3,981,618 10,035,697 1,482,061 15,499,376
Sum of EP 4,029,753 9,997,726 1,466,661 15,494,140
Sum of W hse yrs 7,343 4,297 6,510 18,150
Sum of E hse yrs 7,236 4,333 6,252 17,821
Sum of Inc Loss 1,869,416 5,278,745 403,441 7,551,602
Sum of Inc Claims 338 478 98 914
3 Sum of WP 5,189,745 2,862,128 696,113 8,747,986
Sum of EP 5,108,821 2,809,117 656,171 8,574,109
Sum of W hse yrs 5,085 587 2,182 7,854
Sum of E hse yrs 4,996 589 1,976 7,561
Sum of Inc Loss 3,339,445 1,838,775 503,518 5,681,738
Sum of Inc Claims 244 83 41 368
4 Sum of WP 297,203 3,510,487 199,465 4,007,155
Sum of EP 284,399 3,418,665 195,051 3,898,115
Sum of W hse yrs 481 1,343 824 2,647
Sum of E hse yrs 464 1,327 752 2,543
Sum of Inc Loss 68,229 3,133,720 41,380 3,243,329
Sum of Inc Claims 27 263 14 304
5 Sum of WP 2,012,449 18,238,472 1,457,387 21,708,308
Sum of EP 1,706,270 17,548,216 1,239,948 20,494,434
Sum of W hse yrs 4,057 10,250 7,105 21,412
Sum of E hse yrs 3,762 9,937 6,245 19,944
Sum of Inc Loss 1,354,637 7,948,842 259,472 9,562,951
Sum of Inc Claims 213 800 79 1,092
11 Sum of WP 15,653,449 46,309,548 4,864,661 66,827,658
Sum of EP 15,383,345 45,440,519 4,814,994 65,638,858
Sum of W hse yrs 22,163 26,123 17,649 65,935
Sum of E hse yrs 21,753 26,124 16,957 64,834
Sum of Inc Loss 8,902,574 54,358,585 636,665 63,897,824
Sum of Inc Claims 1,038 4,325 231 5,594
12 Sum of WP 4,228,790 15,140,622 1,039,015 20,408,427
Sum of EP 4,190,695 14,946,116 1,052,944 20,189,755
Sum of W hse yrs 7,044 4,691 3,840 15,576
Sum of E hse yrs 6,975 4,691 3,847 15,513
Sum of Inc Loss 2,557,253 42,843,221 145,585 45,546,059
Sum of Inc Claims 372 1,547 50 1,969
30 Sum of WP 1,450,431 16,942,283 1,046,774 19,439,488
Sum of EP 1,428,850 16,587,630 962,619 18,979,099
Sum of W hse yrs 3,619 13,260 5,238 22,117
Sum of E hse yrs 3,562 13,175 4,783 21,520
Sum of Inc Loss 832,986 16,119,542 190,594 17,143,122
Sum of Inc Claims 182 1,477 44 1,703
31 Sum of WP 5,893,156 178,545,192 3,965,501 188,403,849
Sum of EP 5,768,169 173,352,583 3,883,469 183,004,221
Sum of W hse yrs 15,098 131,300 18,767 165,165
Sum of E hse yrs 14,689 130,646 18,116 163,450
Sum of Inc Loss 9,123,837 487,978,176 1,102,994 498,205,007
Sum of Inc Claims 1,811 29,650 200 31,661
32 Sum of WP 315,760 13,254,746 526,849 14,097,355
Sum of EP 311,441 13,108,935 507,452 13,927,828
36

2015 Massachusetts Homeowners Insurance
Aggregate Voluntary Loss Experience by Territory by Form
Exhibit 5A
Page 2
Form
Territory Data Condo Owner Tenant Grand Total
Sum of W hse yrs 883 9,833 2,991 13,707
Sum of E hse yrs 869 9,917 2,859 13,645
Sum of Inc Loss 153,550 6,339,728 123,012 6,616,290
Sum of Inc Claims 30 472 31 533
33 Sum of WP 121,186 12,507,147 248,185 12,876,518
Sum of EP 117,328 12,265,703 229,845 12,612,876
Sum of W hse yrs 339 9,512 1,303 11,154
Sum of E hse yrs 329 9,451 1,202 10,982
Sum of Inc Loss 6,508 3,750,083 57,606 3,814,197
Sum of Inc Claims 4 409 15 428
34 Sum of WP 2,559,471 119,291,929 1,481,446 123,332,846
Sum of EP 2,496,096 115,755,250 1,409,086 119,660,432
Sum of W hse yrs 6,528 91,767 7,643 105,937
Sum of E hse yrs 6,435 90,832 7,112 104,379
Sum of Inc Loss 3,201,863 125,122,961 148,349 128,473,173
Sum of Inc Claims 726 9,727 43 10,496
35 Sum of WP 269,434 19,589,766 234,428 20,093,628
Sum of EP 266,818 19,034,643 222,586 19,524,047
Sum of W hse yrs 758 13,891 1,173 15,821
Sum of E hse yrs 747 13,852 1,067 15,665
Sum of Inc Loss 303,840 32,328,520 83,534 32,715,894
Sum of Inc Claims 30 1,992 13 2,035
36 Sum of WP 4,204,339 156,245,131 1,682,104 162,131,574
Sum of EP 4,069,404 150,652,040 1,622,396 156,343,840
Sum of W hse yrs 9,377 103,732 7,814 120,922
Sum of E hse yrs 9,131 102,356 7,431 118,919
Sum of Inc Loss 3,710,119 203,617,000 397,172 207,724,291
Sum of Inc Claims 806 13,830 63 14,699
37 Sum of WP 4,027,507 207,655,917 854,685 212,538,109
Sum of EP 3,931,155 202,805,257 815,225 207,551,637
Sum of W hse yrs 7,339 70,102 2,949 80,390
Sum of E hse yrs 7,168 68,820 2,768 78,755
Sum of Inc Loss 2,033,172 66,829,304 232,704 69,095,180
Sum of Inc Claims 288 2,951 32 3,271
38 Sum of WP 119,482 6,222,252 330,865 6,672,599
Sum of EP 112,036 6,076,849 316,468 6,505,353
Sum of W hse yrs 445 4,538 1,862 6,844
Sum of E hse yrs 425 4,529 1,795 6,749
Sum of Inc Loss 62,299 3,362,436 106,544 3,531,279
Sum of Inc Claims 19 382 17 418
39 Sum of WP 535,661 17,268,984 281,260 18,085,905
Sum of EP 528,582 17,344,745 282,914 18,156,241
Sum of W hse yrs 1,330 10,854 1,480 13,665
Sum of E hse yrs 1,302 11,024 1,450 13,775
Sum of Inc Loss 800,697 12,032,174 37,106 12,869,977
Sum of Inc Claims 52 1,088 10 1,150
40 Sum of WP 9,683,028 183,222,188 4,491,377 197,396,593
Sum of EP 9,496,885 177,252,531 4,315,415 191,064,831
Sum of W hse yrs 25,322 133,226 21,609 180,157
Sum of E hse yrs 24,524 131,247 20,566 176,337
37
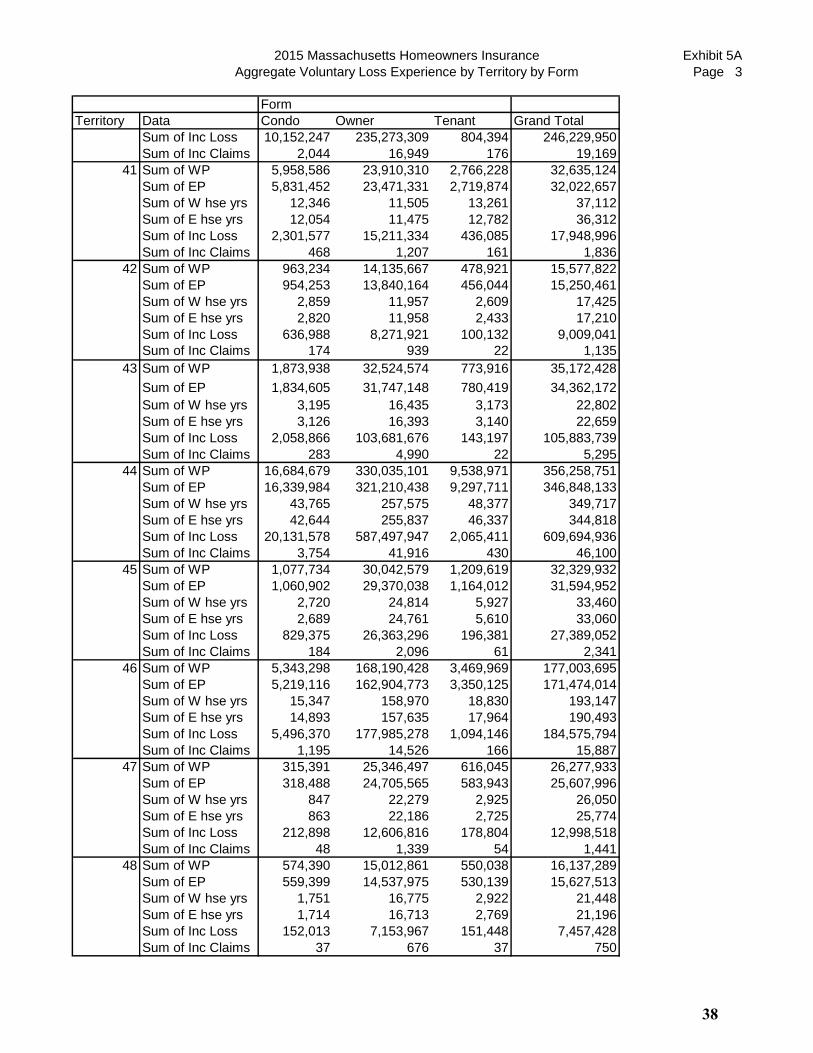
2015 Massachusetts Homeowners Insurance
Aggregate Voluntary Loss Experience by Territory by Form
Exhibit 5A
Page 3
Form
Territory Data Condo Owner Tenant Grand Total
Sum of Inc Loss 10,152,247 235,273,309 804,394 246,229,950
Sum of Inc Claims 2,044 16,949 176 19,169
41 Sum of WP 5,958,586 23,910,310 2,766,228 32,635,124
Sum of EP 5,831,452 23,471,331 2,719,874 32,022,657
Sum of W hse yrs 12,346 11,505 13,261 37,112
Sum of E hse yrs 12,054 11,475 12,782 36,312
Sum of Inc Loss 2,301,577 15,211,334 436,085 17,948,996
Sum of Inc Claims 468 1,207 161 1,836
42 Sum of WP 963,234 14,135,667 478,921 15,577,822
Sum of EP 954,253 13,840,164 456,044 15,250,461
Sum of W hse yrs 2,859 11,957 2,609 17,425
Sum of E hse yrs 2,820 11,958 2,433 17,210
Sum of Inc Loss 636,988 8,271,921 100,132 9,009,041
Sum of Inc Claims 174 939 22 1,135
43 Sum of WP 1,873,938 32,524,574 773,916 35,172,428
Sum of EP 1,834,605 31,747,148 780,419 34,362,172
Sum of W hse yrs 3,195 16,435 3,173 22,802
Sum of E hse yrs 3,126 16,393 3,140 22,659
Sum of Inc Loss 2,058,866 103,681,676 143,197 105,883,739
Sum of Inc Claims 283 4,990 22 5,295
44 Sum of WP 16,684,679 330,035,101 9,538,971 356,258,751
Sum of EP 16,339,984 321,210,438 9,297,711 346,848,133
Sum of W hse yrs 43,765 257,575 48,377 349,717
Sum of E hse yrs 42,644 255,837 46,337 344,818
Sum of Inc Loss 20,131,578 587,497,947 2,065,411 609,694,936
Sum of Inc Claims 3,754 41,916 430 46,100
45 Sum of WP 1,077,734 30,042,579 1,209,619 32,329,932
Sum of EP 1,060,902 29,370,038 1,164,012 31,594,952
Sum of W hse yrs 2,720 24,814 5,927 33,460
Sum of E hse yrs 2,689 24,761 5,610 33,060
Sum of Inc Loss 829,375 26,363,296 196,381 27,389,052
Sum of Inc Claims 184 2,096 61 2,341
46 Sum of WP 5,343,298 168,190,428 3,469,969 177,003,695
Sum of EP 5,219,116 162,904,773 3,350,125 171,474,014
Sum of W hse yrs 15,347 158,970 18,830 193,147
Sum of E hse yrs 14,893 157,635 17,964 190,493
Sum of Inc Loss 5,496,370 177,985,278 1,094,146 184,575,794
Sum of Inc Claims 1,195 14,526 166 15,887
47 Sum of WP 315,391 25,346,497 616,045 26,277,933
Sum of EP 318,488 24,705,565 583,943 25,607,996
Sum of W hse yrs 847 22,279 2,925 26,050
Sum of E hse yrs 863 22,186 2,725 25,774
Sum of Inc Loss 212,898 12,606,816 178,804 12,998,518
Sum of Inc Claims 48 1,339 54 1,441
48 Sum of WP 574,390 15,012,861 550,038 16,137,289
Sum of EP 559,399 14,537,975 530,139 15,627,513
Sum of W hse yrs 1,751 16,775 2,922 21,448
Sum of E hse yrs 1,714 16,713 2,769 21,196
Sum of Inc Loss 152,013 7,153,967 151,448 7,457,428
Sum of Inc Claims 37 676 37 750
38
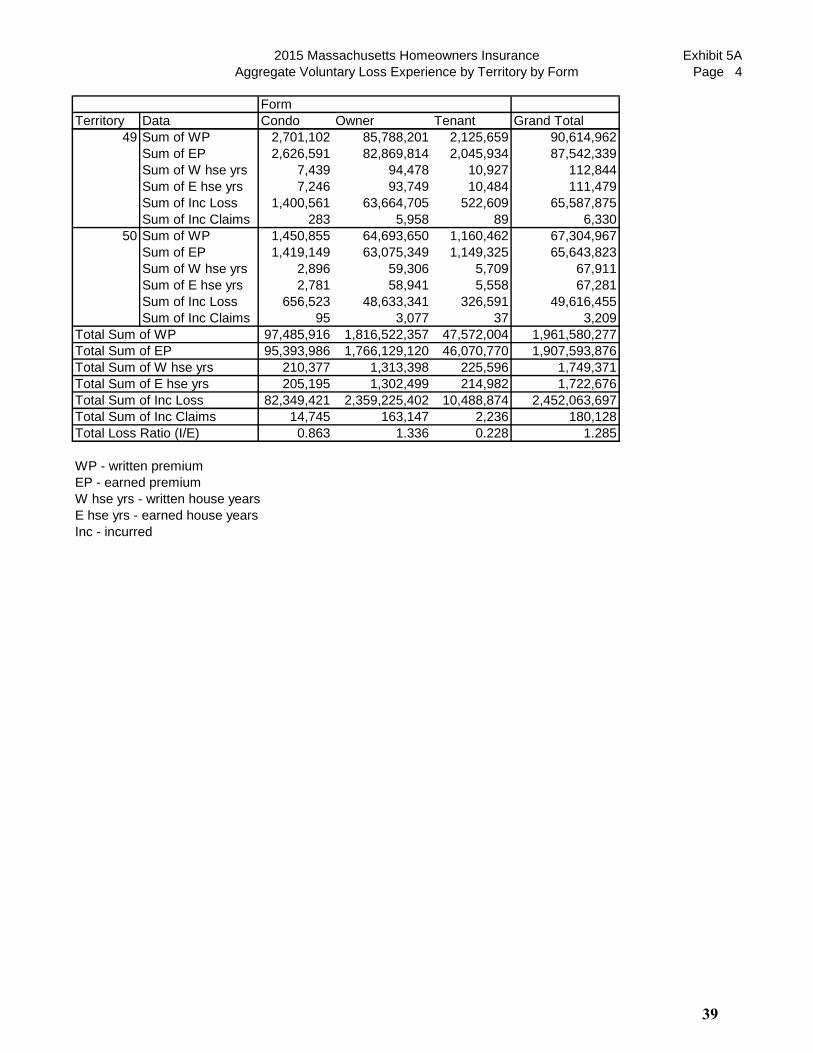
2015 Massachusetts Homeowners Insurance
Aggregate Voluntary Loss Experience by Territory by Form
Exhibit 5A
Page 4
Form
Territory Data Condo Owner Tenant Grand Total
49 Sum of WP 2,701,102 85,788,201 2,125,659 90,614,962
Sum of EP 2,626,591 82,869,814 2,045,934 87,542,339
Sum of W hse yrs 7,439 94,478 10,927 112,844
Sum of E hse yrs 7,246 93,749 10,484 111,479
Sum of Inc Loss 1,400,561 63,664,705 522,609 65,587,875
Sum of Inc Claims 283 5,958 89 6,330
50 Sum of WP 1,450,855 64,693,650 1,160,462 67,304,967
Sum of EP 1,419,149 63,075,349 1,149,325 65,643,823
Sum of W hse yrs 2,896 59,306 5,709 67,911
Sum of E hse yrs 2,781 58,941 5,558 67,281
Sum of Inc Loss 656,523 48,633,341 326,591 49,616,455
Sum of Inc Claims 95 3,077 37 3,209
Total Sum of WP 97,485,916 1,816,522,357 47,572,004 1,961,580,277
Total Sum of EP 95,393,986 1,766,129,120 46,070,770 1,907,593,876
Total Sum of W hse yrs 210,377 1,313,398 225,596 1,749,371
Total Sum of E hse yrs 205,195 1,302,499 214,982 1,722,676
Total Sum of Inc Loss 82,349,421 2,359,225,402 10,488,874 2,452,063,697
Total Sum of Inc Claims 14,745 163,147 2,236 180,128
Total Loss Ratio (I/E) 0.863 1.336 0.228 1.285
WP - written premium
EP - earned premium
W hse yrs - written house years
E hse yrs - earned house years
Inc - incurred
39
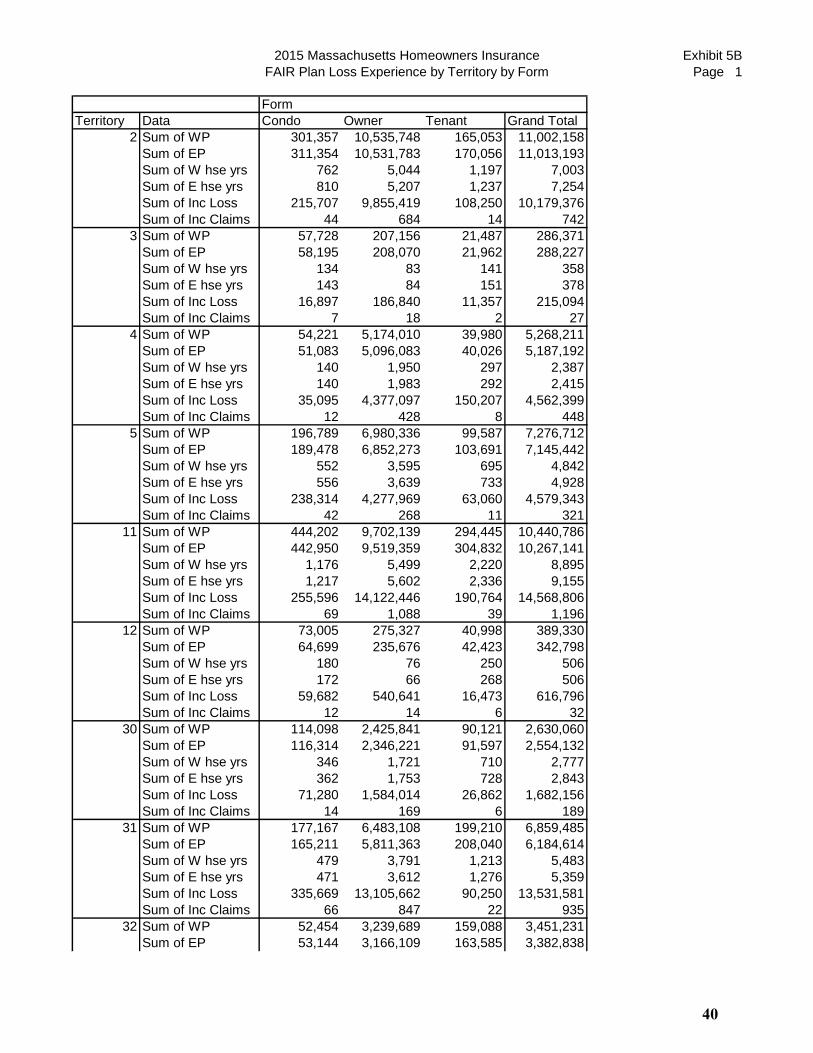
2015 Massachusetts Homeowners Insurance
FAIR Plan Loss Experience by Territory by Form
Exhibit 5B
Page 1
Form
Territory Data Condo Owner Tenant Grand Total
2 Sum of WP 301,357 10,535,748 165,053 11,002,158
Sum of EP 311,354 10,531,783 170,056 11,013,193
Sum of W hse yrs 762 5,044 1,197 7,003
Sum of E hse yrs 810 5,207 1,237 7,254
Sum of Inc Loss 215,707 9,855,419 108,250 10,179,376
Sum of Inc Claims 44 684 14 742
3 Sum of WP 57,728 207,156 21,487 286,371
Sum of EP 58,195 208,070 21,962 288,227
Sum of W hse yrs 134 83 141 358
Sum of E hse yrs 143 84 151 378
Sum of Inc Loss 16,897 186,840 11,357 215,094
Sum of Inc Claims 7 18 2 27
4 Sum of WP 54,221 5,174,010 39,980 5,268,211
Sum of EP 51,083 5,096,083 40,026 5,187,192
Sum of W hse yrs 140 1,950 297 2,387
Sum of E hse yrs 140 1,983 292 2,415
Sum of Inc Loss 35,095 4,377,097 150,207 4,562,399
Sum of Inc Claims 12 428 8 448
5 Sum of WP 196,789 6,980,336 99,587 7,276,712
Sum of EP 189,478 6,852,273 103,691 7,145,442
Sum of W hse yrs 552 3,595 695 4,842
Sum of E hse yrs 556 3,639 733 4,928
Sum of Inc Loss 238,314 4,277,969 63,060 4,579,343
Sum of Inc Claims 42 268 11 321
11 Sum of WP 444,202 9,702,139 294,445 10,440,786
Sum of EP 442,950 9,519,359 304,832 10,267,141
Sum of W hse yrs 1,176 5,499 2,220 8,895
Sum of E hse yrs 1,217 5,602 2,336 9,155
Sum of Inc Loss 255,596 14,122,446 190,764 14,568,806
Sum of Inc Claims 69 1,088 39 1,196
12 Sum of WP 73,005 275,327 40,998 389,330
Sum of EP 64,699 235,676 42,423 342,798
Sum of W hse yrs 180 76 250 506
Sum of E hse yrs 172 66 268 506
Sum of Inc Loss 59,682 540,641 16,473 616,796
Sum of Inc Claims 12 14 6 32
30 Sum of WP 114,098 2,425,841 90,121 2,630,060
Sum of EP 116,314 2,346,221 91,597 2,554,132
Sum of W hse yrs 346 1,721 710 2,777
Sum of E hse yrs 362 1,753 728 2,843
Sum of Inc Loss 71,280 1,584,014 26,862 1,682,156
Sum of Inc Claims 14 169 6 189
31 Sum of WP 177,167 6,483,108 199,210 6,859,485
Sum of EP 165,211 5,811,363 208,040 6,184,614
Sum of W hse yrs 479 3,791 1,213 5,483
Sum of E hse yrs 471 3,612 1,276 5,359
Sum of Inc Loss 335,669 13,105,662 90,250 13,531,581
Sum of Inc Claims 66 847 22 935
32 Sum of WP 52,454 3,239,689 159,088 3,451,231
Sum of EP 53,144 3,166,109 163,585 3,382,838
40
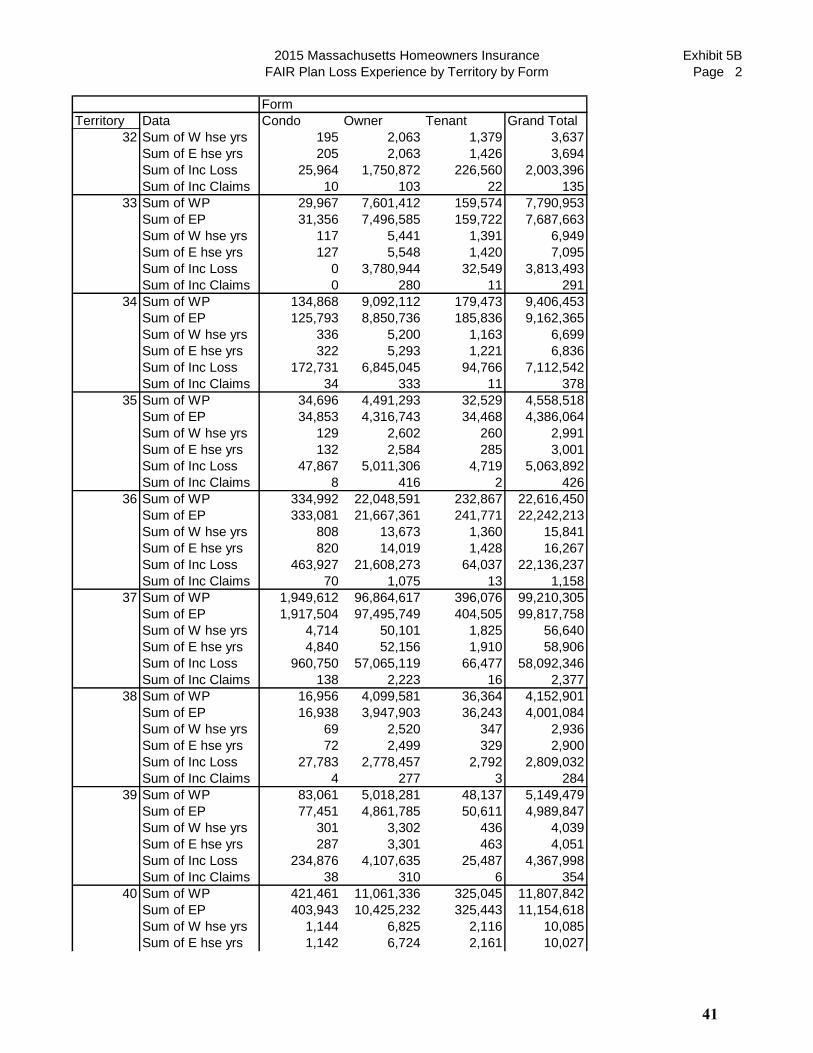
2015 Massachusetts Homeowners Insurance
FAIR Plan Loss Experience by Territory by Form
Exhibit 5B
Page 2
Form
Territory Data Condo Owner Tenant Grand Total
32 Sum of W hse yrs 195 2,063 1,379 3,637
Sum of E hse yrs 205 2,063 1,426 3,694
Sum of Inc Loss 25,964 1,750,872 226,560 2,003,396
Sum of Inc Claims 10 103 22 135
33 Sum of WP 29,967 7,601,412 159,574 7,790,953
Sum of EP 31,356 7,496,585 159,722 7,687,663
Sum of W hse yrs 117 5,441 1,391 6,949
Sum of E hse yrs 127 5,548 1,420 7,095
Sum of Inc Loss 0 3,780,944 32,549 3,813,493
Sum of Inc Claims 0 280 11 291
34 Sum of WP 134,868 9,092,112 179,473 9,406,453
Sum of EP 125,793 8,850,736 185,836 9,162,365
Sum of W hse yrs 336 5,200 1,163 6,699
Sum of E hse yrs 322 5,293 1,221 6,836
Sum of Inc Loss 172,731 6,845,045 94,766 7,112,542
Sum of Inc Claims 34 333 11 378
35 Sum of WP 34,696 4,491,293 32,529 4,558,518
Sum of EP 34,853 4,316,743 34,468 4,386,064
Sum of W hse yrs 129 2,602 260 2,991
Sum of E hse yrs 132 2,584 285 3,001
Sum of Inc Loss 47,867 5,011,306 4,719 5,063,892
Sum of Inc Claims 8 416 2 426
36 Sum of WP 334,992 22,048,591 232,867 22,616,450
Sum of EP 333,081 21,667,361 241,771 22,242,213
Sum of W hse yrs 808 13,673 1,360 15,841
Sum of E hse yrs 820 14,019 1,428 16,267
Sum of Inc Loss 463,927 21,608,273 64,037 22,136,237
Sum of Inc Claims 70 1,075 13 1,158
37 Sum of WP 1,949,612 96,864,617 396,076 99,210,305
Sum of EP 1,917,504 97,495,749 404,505 99,817,758
Sum of W hse yrs 4,714 50,101 1,825 56,640
Sum of E hse yrs 4,840 52,156 1,910 58,906
Sum of Inc Loss 960,750 57,065,119 66,477 58,092,346
Sum of Inc Claims 138 2,223 16 2,377
38 Sum of WP 16,956 4,099,581 36,364 4,152,901
Sum of EP 16,938 3,947,903 36,243 4,001,084
Sum of W hse yrs 69 2,520 347 2,936
Sum of E hse yrs 72 2,499 329 2,900
Sum of Inc Loss 27,783 2,778,457 2,792 2,809,032
Sum of Inc Claims 4 277 3 284
39 Sum of WP 83,061 5,018,281 48,137 5,149,479
Sum of EP 77,451 4,861,785 50,611 4,989,847
Sum of W hse yrs 301 3,302 436 4,039
Sum of E hse yrs 287 3,301 463 4,051
Sum of Inc Loss 234,876 4,107,635 25,487 4,367,998
Sum of Inc Claims 38 310 6 354
40 Sum of WP 421,461 11,061,336 325,045 11,807,842
Sum of EP 403,943 10,425,232 325,443 11,154,618
Sum of W hse yrs 1,144 6,825 2,116 10,085
Sum of E hse yrs 1,142 6,724 2,161 10,027
41
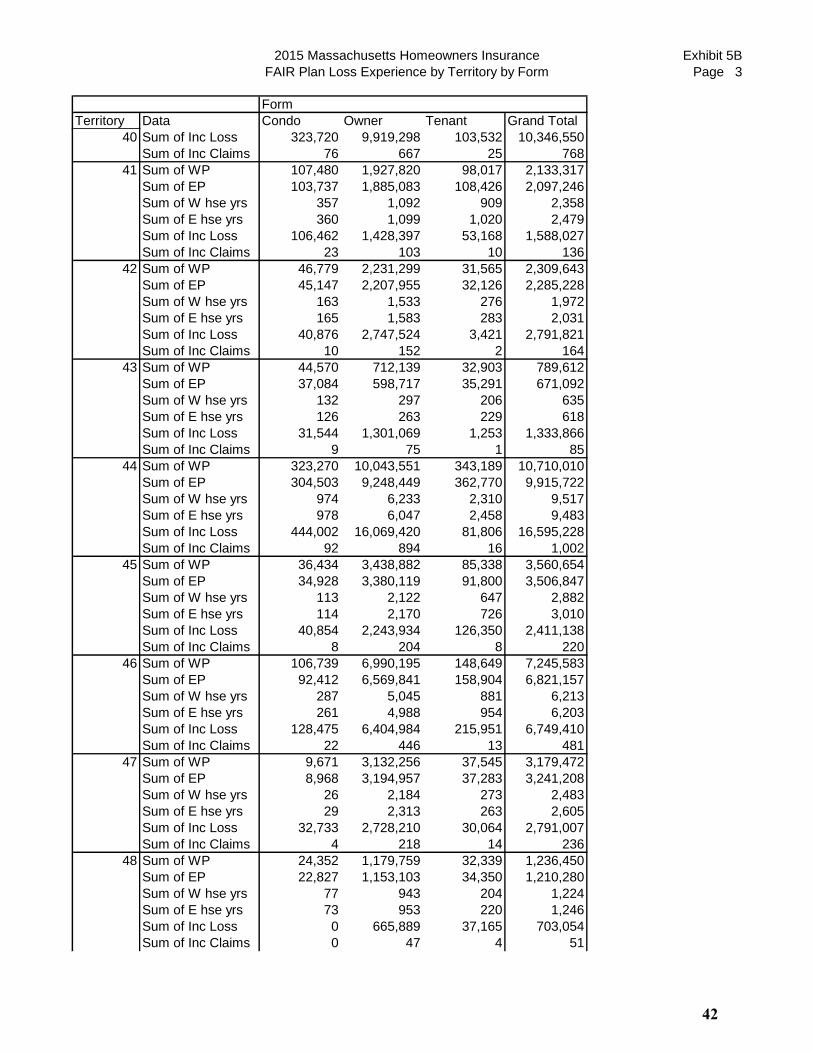
2015 Massachusetts Homeowners Insurance
FAIR Plan Loss Experience by Territory by Form
Exhibit 5B
Page 3
Form
Territory Data Condo Owner Tenant Grand Total
40 Sum of Inc Loss 323,720 9,919,298 103,532 10,346,550
Sum of Inc Claims 76 667 25 768
41 Sum of WP 107,480 1,927,820 98,017 2,133,317
Sum of EP 103,737 1,885,083 108,426 2,097,246
Sum of W hse yrs 357 1,092 909 2,358
Sum of E hse yrs 360 1,099 1,020 2,479
Sum of Inc Loss 106,462 1,428,397 53,168 1,588,027
Sum of Inc Claims 23 103 10 136
42 Sum of WP 46,779 2,231,299 31,565 2,309,643
Sum of EP 45,147 2,207,955 32,126 2,285,228
Sum of W hse yrs 163 1,533 276 1,972
Sum of E hse yrs 165 1,583 283 2,031
Sum of Inc Loss 40,876 2,747,524 3,421 2,791,821
Sum of Inc Claims 10 152 2 164
43 Sum of WP 44,570 712,139 32,903 789,612
Sum of EP 37,084 598,717 35,291 671,092
Sum of W hse yrs 132 297 206 635
Sum of E hse yrs 126 263 229 618
Sum of Inc Loss 31,544 1,301,069 1,253 1,333,866
Sum of Inc Claims 9 75 1 85
44 Sum of WP 323,270 10,043,551 343,189 10,710,010
Sum of EP 304,503 9,248,449 362,770 9,915,722
Sum of W hse yrs 974 6,233 2,310 9,517
Sum of E hse yrs 978 6,047 2,458 9,483
Sum of Inc Loss 444,002 16,069,420 81,806 16,595,228
Sum of Inc Claims 92 894 16 1,002
45 Sum of WP 36,434 3,438,882 85,338 3,560,654
Sum of EP 34,928 3,380,119 91,800 3,506,847
Sum of W hse yrs 113 2,122 647 2,882
Sum of E hse yrs 114 2,170 726 3,010
Sum of Inc Loss 40,854 2,243,934 126,350 2,411,138
Sum of Inc Claims 8 204 8 220
46 Sum of WP 106,739 6,990,195 148,649 7,245,583
Sum of EP 92,412 6,569,841 158,904 6,821,157
Sum of W hse yrs 287 5,045 881 6,213
Sum of E hse yrs 261 4,988 954 6,203
Sum of Inc Loss 128,475 6,404,984 215,951 6,749,410
Sum of Inc Claims 22 446 13 481
47 Sum of WP 9,671 3,132,256 37,545 3,179,472
Sum of EP 8,968 3,194,957 37,283 3,241,208
Sum of W hse yrs 26 2,184 273 2,483
Sum of E hse yrs 29 2,313 263 2,605
Sum of Inc Loss 32,733 2,728,210 30,064 2,791,007
Sum of Inc Claims 4 218 14 236
48 Sum of WP 24,352 1,179,759 32,339 1,236,450
Sum of EP 22,827 1,153,103 34,350 1,210,280
Sum of W hse yrs 77 943 204 1,224
Sum of E hse yrs 73 953 220 1,246
Sum of Inc Loss 0 665,889 37,165 703,054
Sum of Inc Claims 0 47 4 51
42

2015 Massachusetts Homeowners Insurance
FAIR Plan Loss Experience by Territory by Form
Exhibit 5B
Page 4
Form
Territory Data Condo Owner Tenant Grand Total
49 Sum of WP 36,887 3,836,278 94,121 3,967,286
Sum of EP 33,676 3,760,014 99,798 3,893,488
Sum of W hse yrs 111 3,103 594 3,808
Sum of E hse yrs 106 3,192 638 3,936
Sum of Inc Loss 16,705 2,968,926 5,212 2,990,843
Sum of Inc Claims 4 233 4 241
50 Sum of WP 18,911 3,926,953 59,440 4,005,304
Sum of EP 17,753 3,817,898 61,547 3,897,198
Sum of W hse yrs 43 3,235 363 3,641
Sum of E hse yrs 42 3,266 370 3,678
Sum of Inc Loss 0 1,102,758 79,013 1,181,771
Sum of Inc Claims 0 165 9 174
Total Sum of WP 5,231,727 242,719,709 3,483,140 251,434,576
Total Sum of EP 5,094,382 238,645,167 3,607,106 247,346,655
Total Sum of W hse yrs 13,865 139,273 23,663 176,801
Total Sum of E hse yrs 14,072 142,007 24,825 180,904
Total Sum of Inc Loss 4,327,509 198,578,148 1,911,545 204,817,202
Total Sum of Inc Claims 816 11,737 298 12,851
Total Loss Ratio (I/E) 0.849 0.832 0.530 0.828
WP - written premium
EP - earned premium
W hse yrs - written house years
E hse yrs - earned house years
Inc - incurred
43
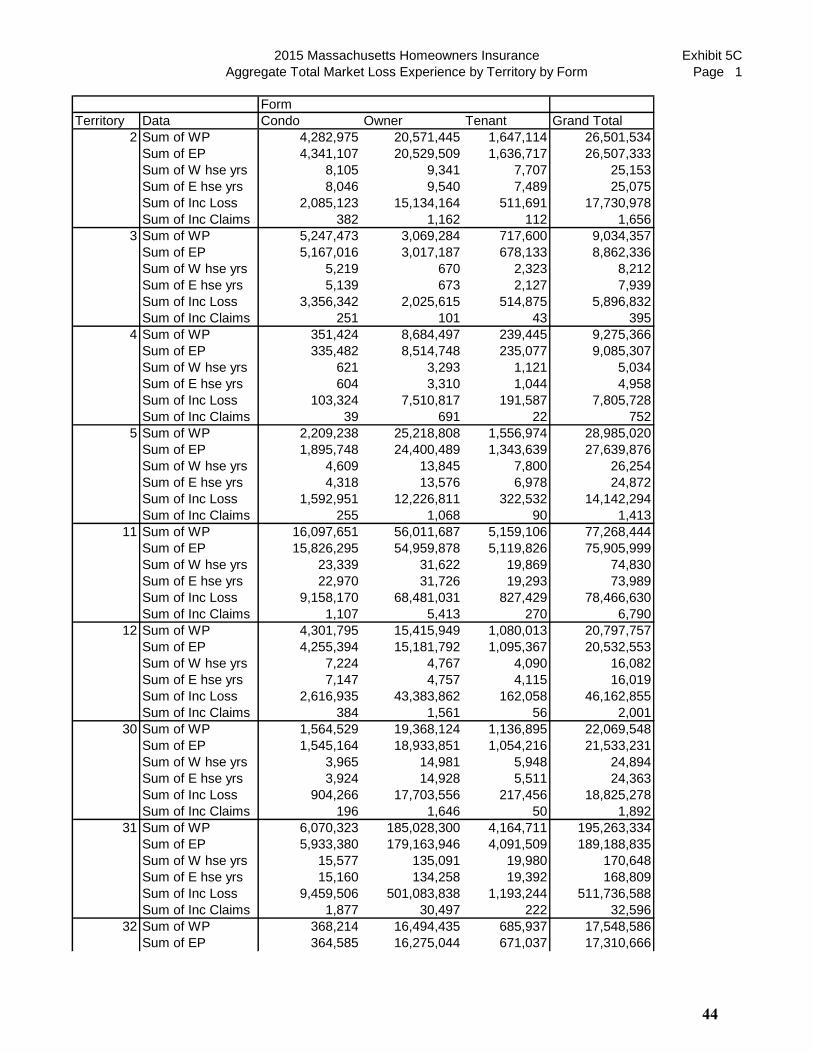
2015 Massachusetts Homeowners Insurance
Aggregate Total Market Loss Experience by Territory by Form
Exhibit 5C
Page 1
Form
Territory Data Condo Owner Tenant Grand Total
2 Sum of WP 4,282,975 20,571,445 1,647,114 26,501,534
Sum of EP 4,341,107 20,529,509 1,636,717 26,507,333
Sum of W hse yrs 8,105 9,341 7,707 25,153
Sum of E hse yrs 8,046 9,540 7,489 25,075
Sum of Inc Loss 2,085,123 15,134,164 511,691 17,730,978
Sum of Inc Claims 382 1,162 112 1,656
3 Sum of WP 5,247,473 3,069,284 717,600 9,034,357
Sum of EP 5,167,016 3,017,187 678,133 8,862,336
Sum of W hse yrs 5,219 670 2,323 8,212
Sum of E hse yrs 5,139 673 2,127 7,939
Sum of Inc Loss 3,356,342 2,025,615 514,875 5,896,832
Sum of Inc Claims 251 101 43 395
4 Sum of WP 351,424 8,684,497 239,445 9,275,366
Sum of EP 335,482 8,514,748 235,077 9,085,307
Sum of W hse yrs 621 3,293 1,121 5,034
Sum of E hse yrs 604 3,310 1,044 4,958
Sum of Inc Loss 103,324 7,510,817 191,587 7,805,728
Sum of Inc Claims 39 691 22 752
5 Sum of WP 2,209,238 25,218,808 1,556,974 28,985,020
Sum of EP 1,895,748 24,400,489 1,343,639 27,639,876
Sum of W hse yrs 4,609 13,845 7,800 26,254
Sum of E hse yrs 4,318 13,576 6,978 24,872
Sum of Inc Loss 1,592,951 12,226,811 322,532 14,142,294
Sum of Inc Claims 255 1,068 90 1,413
11 Sum of WP 16,097,651 56,011,687 5,159,106 77,268,444
Sum of EP 15,826,295 54,959,878 5,119,826 75,905,999
Sum of W hse yrs 23,339 31,622 19,869 74,830
Sum of E hse yrs 22,970 31,726 19,293 73,989
Sum of Inc Loss 9,158,170 68,481,031 827,429 78,466,630
Sum of Inc Claims 1,107 5,413 270 6,790
12 Sum of WP 4,301,795 15,415,949 1,080,013 20,797,757
Sum of EP 4,255,394 15,181,792 1,095,367 20,532,553
Sum of W hse yrs 7,224 4,767 4,090 16,082
Sum of E hse yrs 7,147 4,757 4,115 16,019
Sum of Inc Loss 2,616,935 43,383,862 162,058 46,162,855
Sum of Inc Claims 384 1,561 56 2,001
30 Sum of WP 1,564,529 19,368,124 1,136,895 22,069,548
Sum of EP 1,545,164 18,933,851 1,054,216 21,533,231
Sum of W hse yrs 3,965 14,981 5,948 24,894
Sum of E hse yrs 3,924 14,928 5,511 24,363
Sum of Inc Loss 904,266 17,703,556 217,456 18,825,278
Sum of Inc Claims 196 1,646 50 1,892
31 Sum of WP 6,070,323 185,028,300 4,164,711 195,263,334
Sum of EP 5,933,380 179,163,946 4,091,509 189,188,835
Sum of W hse yrs 15,577 135,091 19,980 170,648
Sum of E hse yrs 15,160 134,258 19,392 168,809
Sum of Inc Loss 9,459,506 501,083,838 1,193,244 511,736,588
Sum of Inc Claims 1,877 30,497 222 32,596
32 Sum of WP 368,214 16,494,435 685,937 17,548,586
Sum of EP 364,585 16,275,044 671,037 17,310,666
44
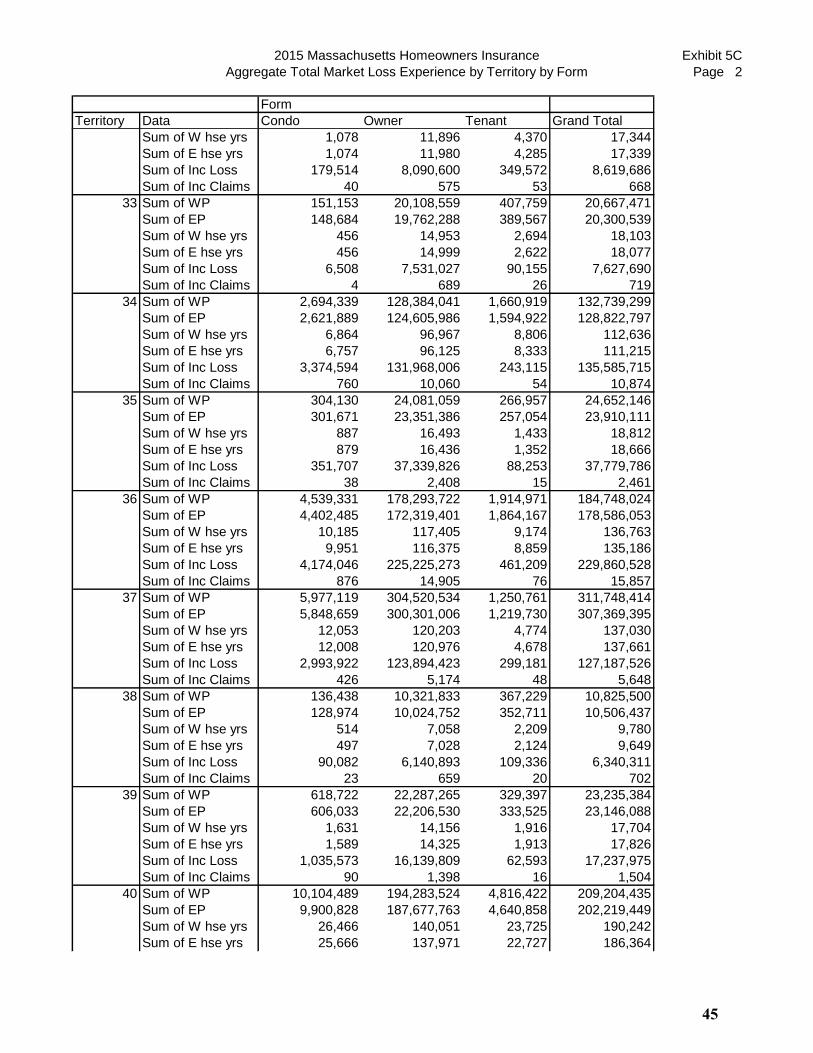
2015 Massachusetts Homeowners Insurance
Aggregate Total Market Loss Experience by Territory by Form
Exhibit 5C
Page 2
Form
Territory Data Condo Owner Tenant Grand Total
Sum of W hse yrs 1,078 11,896 4,370 17,344
Sum of E hse yrs 1,074 11,980 4,285 17,339
Sum of Inc Loss 179,514 8,090,600 349,572 8,619,686
Sum of Inc Claims 40 575 53 668
33 Sum of WP 151,153 20,108,559 407,759 20,667,471
Sum of EP 148,684 19,762,288 389,567 20,300,539
Sum of W hse yrs 456 14,953 2,694 18,103
Sum of E hse yrs 456 14,999 2,622 18,077
Sum of Inc Loss 6,508 7,531,027 90,155 7,627,690
Sum of Inc Claims 4 689 26 719
34 Sum of WP 2,694,339 128,384,041 1,660,919 132,739,299
Sum of EP 2,621,889 124,605,986 1,594,922 128,822,797
Sum of W hse yrs 6,864 96,967 8,806 112,636
Sum of E hse yrs 6,757 96,125 8,333 111,215
Sum of Inc Loss 3,374,594 131,968,006 243,115 135,585,715
Sum of Inc Claims 760 10,060 54 10,874
35 Sum of WP 304,130 24,081,059 266,957 24,652,146
Sum of EP 301,671 23,351,386 257,054 23,910,111
Sum of W hse yrs 887 16,493 1,433 18,812
Sum of E hse yrs 879 16,436 1,352 18,666
Sum of Inc Loss 351,707 37,339,826 88,253 37,779,786
Sum of Inc Claims 38 2,408 15 2,461
36 Sum of WP 4,539,331 178,293,722 1,914,971 184,748,024
Sum of EP 4,402,485 172,319,401 1,864,167 178,586,053
Sum of W hse yrs 10,185 117,405 9,174 136,763
Sum of E hse yrs 9,951 116,375 8,859 135,186
Sum of Inc Loss 4,174,046 225,225,273 461,209 229,860,528
Sum of Inc Claims 876 14,905 76 15,857
37 Sum of WP 5,977,119 304,520,534 1,250,761 311,748,414
Sum of EP 5,848,659 300,301,006 1,219,730 307,369,395
Sum of W hse yrs 12,053 120,203 4,774 137,030
Sum of E hse yrs 12,008 120,976 4,678 137,661
Sum of Inc Loss 2,993,922 123,894,423 299,181 127,187,526
Sum of Inc Claims 426 5,174 48 5,648
38 Sum of WP 136,438 10,321,833 367,229 10,825,500
Sum of EP 128,974 10,024,752 352,711 10,506,437
Sum of W hse yrs 514 7,058 2,209 9,780
Sum of E hse yrs 497 7,028 2,124 9,649
Sum of Inc Loss 90,082 6,140,893 109,336 6,340,311
Sum of Inc Claims 23 659 20 702
39 Sum of WP 618,722 22,287,265 329,397 23,235,384
Sum of EP 606,033 22,206,530 333,525 23,146,088
Sum of W hse yrs 1,631 14,156 1,916 17,704
Sum of E hse yrs 1,589 14,325 1,913 17,826
Sum of Inc Loss 1,035,573 16,139,809 62,593 17,237,975
Sum of Inc Claims 90 1,398 16 1,504
40 Sum of WP 10,104,489 194,283,524 4,816,422 209,204,435
Sum of EP 9,900,828 187,677,763 4,640,858 202,219,449
Sum of W hse yrs 26,466 140,051 23,725 190,242
Sum of E hse yrs 25,666 137,971 22,727 186,364
45
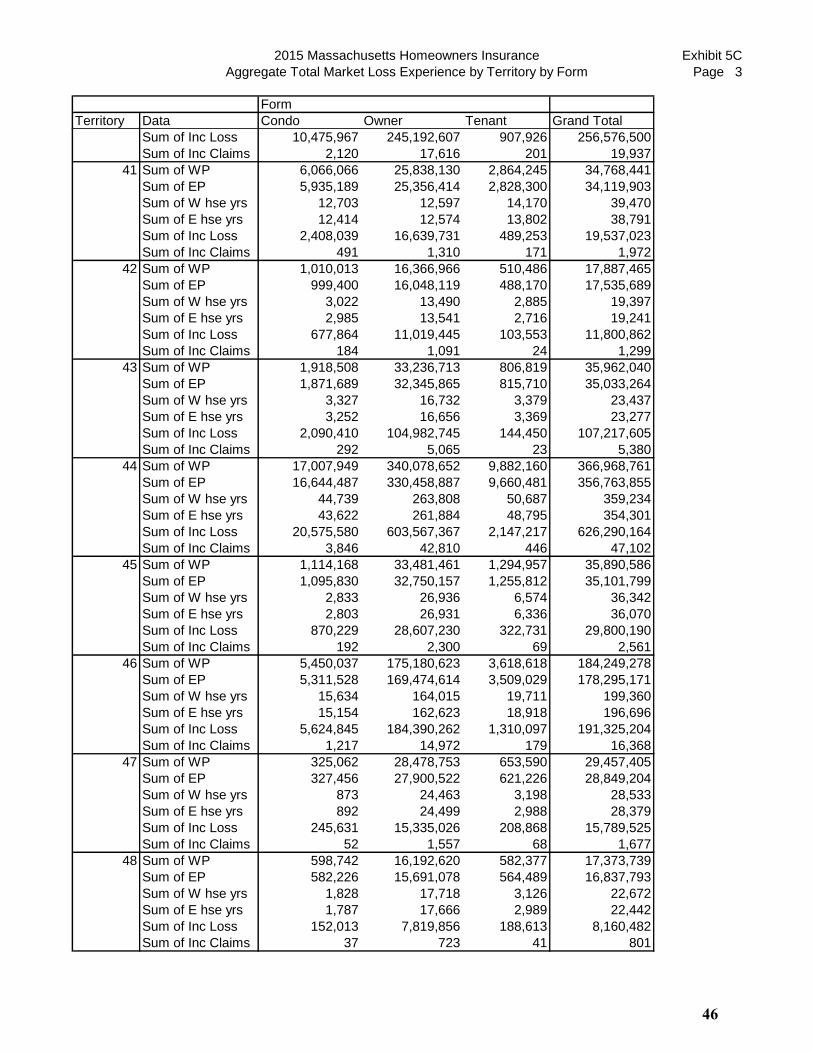
2015 Massachusetts Homeowners Insurance
Aggregate Total Market Loss Experience by Territory by Form
Exhibit 5C
Page 3
Form
Territory Data Condo Owner Tenant Grand Total
Sum of Inc Loss 10,475,967 245,192,607 907,926 256,576,500
Sum of Inc Claims 2,120 17,616 201 19,937
41 Sum of WP 6,066,066 25,838,130 2,864,245 34,768,441
Sum of EP 5,935,189 25,356,414 2,828,300 34,119,903
Sum of W hse yrs 12,703 12,597 14,170 39,470
Sum of E hse yrs 12,414 12,574 13,802 38,791
Sum of Inc Loss 2,408,039 16,639,731 489,253 19,537,023
Sum of Inc Claims 491 1,310 171 1,972
42 Sum of WP 1,010,013 16,366,966 510,486 17,887,465
Sum of EP 999,400 16,048,119 488,170 17,535,689
Sum of W hse yrs 3,022 13,490 2,885 19,397
Sum of E hse yrs 2,985 13,541 2,716 19,241
Sum of Inc Loss 677,864 11,019,445 103,553 11,800,862
Sum of Inc Claims 184 1,091 24 1,299
43 Sum of WP 1,918,508 33,236,713 806,819 35,962,040
Sum of EP 1,871,689 32,345,865 815,710 35,033,264
Sum of W hse yrs 3,327 16,732 3,379 23,437
Sum of E hse yrs 3,252 16,656 3,369 23,277
Sum of Inc Loss 2,090,410 104,982,745 144,450 107,217,605
Sum of Inc Claims 292 5,065 23 5,380
44 Sum of WP 17,007,949 340,078,652 9,882,160 366,968,761
Sum of EP 16,644,487 330,458,887 9,660,481 356,763,855
Sum of W hse yrs 44,739 263,808 50,687 359,234
Sum of E hse yrs 43,622 261,884 48,795 354,301
Sum of Inc Loss 20,575,580 603,567,367 2,147,217 626,290,164
Sum of Inc Claims 3,846 42,810 446 47,102
45 Sum of WP 1,114,168 33,481,461 1,294,957 35,890,586
Sum of EP 1,095,830 32,750,157 1,255,812 35,101,799
Sum of W hse yrs 2,833 26,936 6,574 36,342
Sum of E hse yrs 2,803 26,931 6,336 36,070
Sum of Inc Loss 870,229 28,607,230 322,731 29,800,190
Sum of Inc Claims 192 2,300 69 2,561
46 Sum of WP 5,450,037 175,180,623 3,618,618 184,249,278
Sum of EP 5,311,528 169,474,614 3,509,029 178,295,171
Sum of W hse yrs 15,634 164,015 19,711 199,360
Sum of E hse yrs 15,154 162,623 18,918 196,696
Sum of Inc Loss 5,624,845 184,390,262 1,310,097 191,325,204
Sum of Inc Claims 1,217 14,972 179 16,368
47 Sum of WP 325,062 28,478,753 653,590 29,457,405
Sum of EP 327,456 27,900,522 621,226 28,849,204
Sum of W hse yrs 873 24,463 3,198 28,533
Sum of E hse yrs 892 24,499 2,988 28,379
Sum of Inc Loss 245,631 15,335,026 208,868 15,789,525
Sum of Inc Claims 52 1,557 68 1,677
48 Sum of WP 598,742 16,192,620 582,377 17,373,739
Sum of EP 582,226 15,691,078 564,489 16,837,793
Sum of W hse yrs 1,828 17,718 3,126 22,672
Sum of E hse yrs 1,787 17,666 2,989 22,442
Sum of Inc Loss 152,013 7,819,856 188,613 8,160,482
Sum of Inc Claims 37 723 41 801
46

2015 Massachusetts Homeowners Insurance
Aggregate Total Market Loss Experience by Territory by Form
Exhibit 5C
Page 4
Form
Territory Data Condo Owner Tenant Grand Total
49 Sum of WP 2,737,989 89,624,479 2,219,780 94,582,248
Sum of EP 2,660,267 86,629,828 2,145,732 91,435,827
Sum of W hse yrs 7,550 97,581 11,521 116,652
Sum of E hse yrs 7,352 96,941 11,122 115,415
Sum of Inc Loss 1,417,266 66,633,631 527,821 68,578,718
Sum of Inc Claims 287 6,191 93 6,571
50 Sum of WP 1,469,766 68,620,603 1,219,902 71,310,271
Sum of EP 1,436,902 66,893,247 1,210,872 69,541,021
Sum of W hse yrs 2,939 62,541 6,072 71,552
Sum of E hse yrs 2,823 62,207 5,928 70,959
Sum of Inc Loss 656,523 49,736,099 405,604 50,798,226
Sum of Inc Claims 95 3,242 46 3,383
Total Sum of WP 102,717,643 2,059,242,066 51,055,144 2,213,014,853
Total Sum of EP 100,488,368 2,004,774,287 49,677,876 2,154,940,531
Total Sum of W hse yrs 224,242 1,452,671 249,259 1,926,172
Total Sum of E hse yrs 219,267 1,444,506 239,807 1,903,580
Total Sum of Inc Loss 86,676,930 2,557,803,550 12,400,419 2,656,880,899
Total Sum of Inc Claims 15,561 174,884 2,534 192,979
Total Loss Ratio (I/E) 0.863 1.276 0.250 1.233
WP - written premium
EP - earned premium
W hse yrs - written house years
E hse yrs - earned house years
Inc - incurred
47
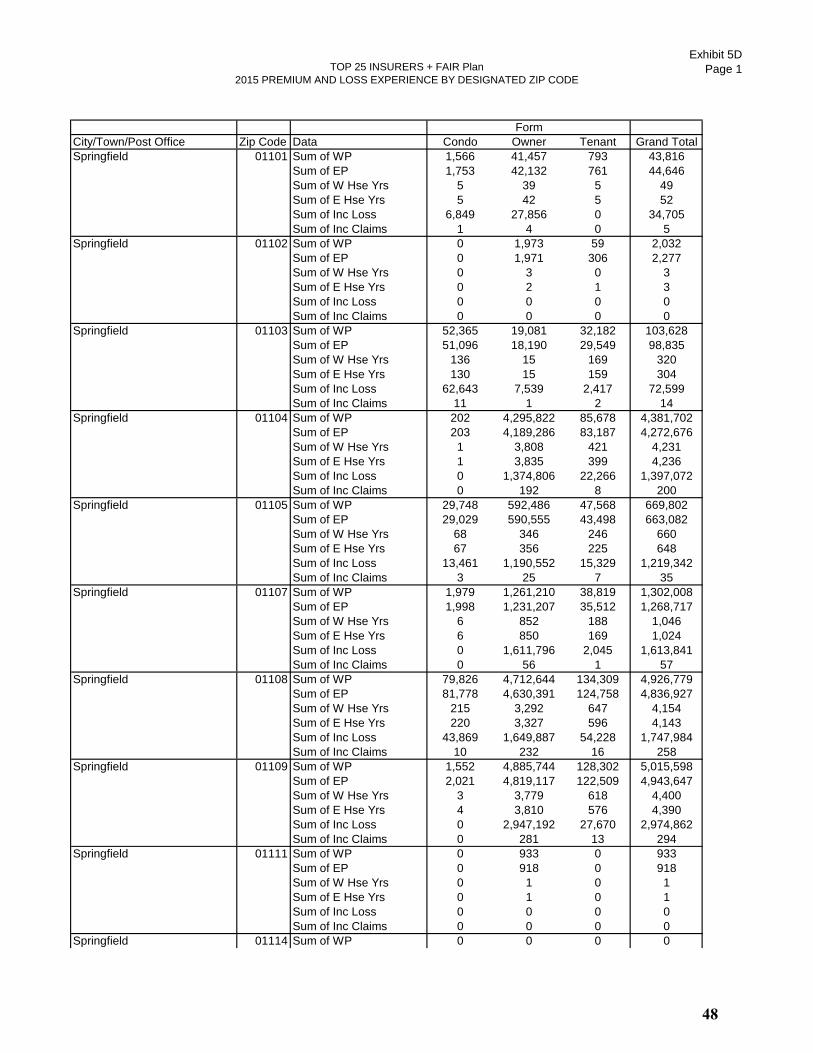
TOP 25 INSURERS + FAIR Plan
2015 PREMIUM AND LOSS EXPERIENCE BY DESIGNATED ZIP CODE
Exhibit 5D
Page 1
City/Town/Post Office Zip Code Data Condo Owner Tenant Grand Total
Springfield 01101 Sum of WP 1,566 41,457 793 43,816
Sum of EP 1,753 42,132 761 44,646
Sum of W Hse Yrs 5 39 5 49
Sum of E Hse Yrs 5 42 5 52
Sum of Inc Loss 6,849 27,856 0 34,705
Sum of Inc Claims 1 4 0 5
Springfield 01102 Sum of WP 0 1,973 59 2,032
Sum of EP 0 1,971 306 2,277
Sum of W Hse Yrs 0 3 0 3
Sum of E Hse Yrs 0 2 1 3
Sum of Inc Loss 0 0 0 0
Sum of Inc Claims 0 0 0 0
Springfield 01103 Sum of WP 52,365 19,081 32,182 103,628
Sum of EP 51,096 18,190 29,549 98,835
Sum of W Hse Yrs 136 15 169 320
Sum of E Hse Yrs 130 15 159 304
Sum of Inc Loss 62,643 7,539 2,417 72,599
Sum of Inc Claims 11 1 2 14
Springfield 01104 Sum of WP 202 4,295,822 85,678 4,381,702
Sum of EP 203 4,189,286 83,187 4,272,676
Sum of W Hse Yrs 1 3,808 421 4,231
Sum of E Hse Yrs 1 3,835 399 4,236
Sum of Inc Loss 0 1,374,806 22,266 1,397,072
Sum of Inc Claims 0 192 8 200
Springfield 01105 Sum of WP 29,748 592,486 47,568 669,802
Sum of EP 29,029 590,555 43,498 663,082
Sum of W Hse Yrs 68 346 246 660
Sum of E Hse Yrs 67 356 225 648
Sum of Inc Loss 13,461 1,190,552 15,329 1,219,342
Sum of Inc Claims 3 25 7 35
Springfield 01107 Sum of WP 1,979 1,261,210 38,819 1,302,008
Sum of EP 1,998 1,231,207 35,512 1,268,717
Sum of W Hse Yrs 6 852 188 1,046
Sum of E Hse Yrs 6 850 169 1,024
Sum of Inc Loss 0 1,611,796 2,045 1,613,841
Sum of Inc Claims 0 56 1 57
Springfield 01108 Sum of WP 79,826 4,712,644 134,309 4,926,779
Sum of EP 81,778 4,630,391 124,758 4,836,927
Sum of W Hse Yrs 215 3,292 647 4,154
Sum of E Hse Yrs 220 3,327 596 4,143
Sum of Inc Loss 43,869 1,649,887 54,228 1,747,984
Sum of Inc Claims 10 232 16 258
Springfield 01109 Sum of WP 1,552 4,885,744 128,302 5,015,598
Sum of EP 2,021 4,819,117 122,509 4,943,647
Sum of W Hse Yrs 3 3,779 618 4,400
Sum of E Hse Yrs 4 3,810 576 4,390
Sum of Inc Loss 0 2,947,192 27,670 2,974,862
Sum of Inc Claims 0 281 13 294
Springfield 01111 Sum of WP 0 933 0 933
Sum of EP 0 918 0 918
Sum of W Hse Yrs 0 1 0 1
Sum of E Hse Yrs 0 1 0 1
Sum of Inc Loss 0 0 0 0
Sum of Inc Claims 0 0 0 0
Springfield 01114 Sum of WP 0 0 0 0
Form
48
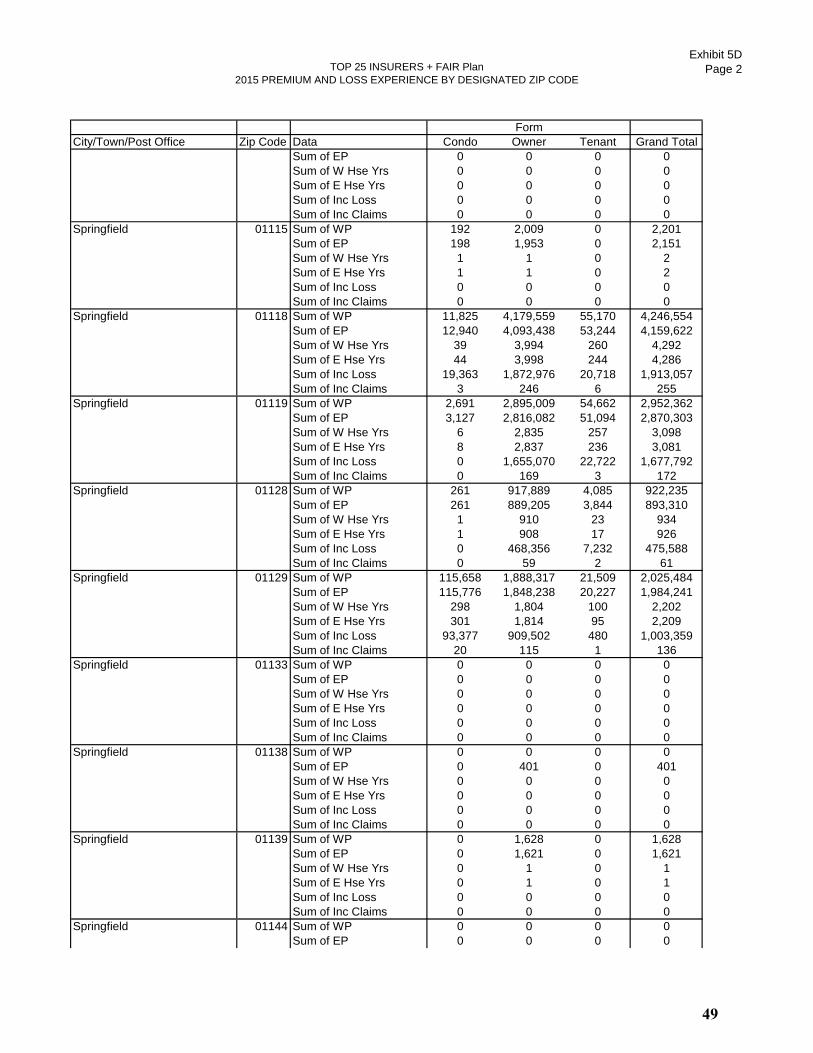
TOP 25 INSURERS + FAIR Plan
2015 PREMIUM AND LOSS EXPERIENCE BY DESIGNATED ZIP CODE
Exhibit 5D
Page 2
City/Town/Post Office Zip Code Data Condo Owner Tenant Grand Total
Form
Sum of EP 0 0 0 0
Sum of W Hse Yrs 0 0 0 0
Sum of E Hse Yrs 0 0 0 0
Sum of Inc Loss 0 0 0 0
Sum of Inc Claims 0 0 0 0
Springfield 01115 Sum of WP 192 2,009 0 2,201
Sum of EP 198 1,953 0 2,151
Sum of W Hse Yrs 1 1 0 2
Sum of E Hse Yrs 1 1 0 2
Sum of Inc Loss 0 0 0 0
Sum of Inc Claims 0 0 0 0
Springfield 01118 Sum of WP 11,825 4,179,559 55,170 4,246,554
Sum of EP 12,940 4,093,438 53,244 4,159,622
Sum of W Hse Yrs 39 3,994 260 4,292
Sum of E Hse Yrs 44 3,998 244 4,286
Sum of Inc Loss 19,363 1,872,976 20,718 1,913,057
Sum of Inc Claims 3 246 6 255
Springfield 01119 Sum of WP 2,691 2,895,009 54,662 2,952,362
Sum of EP 3,127 2,816,082 51,094 2,870,303
Sum of W Hse Yrs 6 2,835 257 3,098
Sum of E Hse Yrs 8 2,837 236 3,081
Sum of Inc Loss 0 1,655,070 22,722 1,677,792
Sum of Inc Claims 0 169 3 172
Springfield 01128 Sum of WP 261 917,889 4,085 922,235
Sum of EP 261 889,205 3,844 893,310
Sum of W Hse Yrs 1 910 23 934
Sum of E Hse Yrs 1 908 17 926
Sum of Inc Loss 0 468,356 7,232 475,588
Sum of Inc Claims 0 59 2 61
Springfield 01129 Sum of WP 115,658 1,888,317 21,509 2,025,484
Sum of EP 115,776 1,848,238 20,227 1,984,241
Sum of W Hse Yrs 298 1,804 100 2,202
Sum of E Hse Yrs 301 1,814 95 2,209
Sum of Inc Loss 93,377 909,502 480 1,003,359
Sum of Inc Claims 20 115 1 136
Springfield 01133 Sum of WP 0 0 0 0
Sum of EP 0 0 0 0
Sum of W Hse Yrs 0 0 0 0
Sum of E Hse Yrs 0 0 0 0
Sum of Inc Loss 0 0 0 0
Sum of Inc Claims 0 0 0 0
Springfield 01138 Sum of WP 0 0 0 0
Sum of EP 0 401 0 401
Sum of W Hse Yrs 0 0 0 0
Sum of E Hse Yrs 0 0 0 0
Sum of Inc Loss 0 0 0 0
Sum of Inc Claims 0 0 0 0
Springfield 01139 Sum of WP 0 1,628 0 1,628
Sum of EP 0 1,621 0 1,621
Sum of W Hse Yrs 0 1 0 1
Sum of E Hse Yrs 0 1 0 1
Sum of Inc Loss 0 0 0 0
Sum of Inc Claims 0 0 0 0
Springfield 01144 Sum of WP 0 0 0 0
Sum of EP 0 0 0 0
49
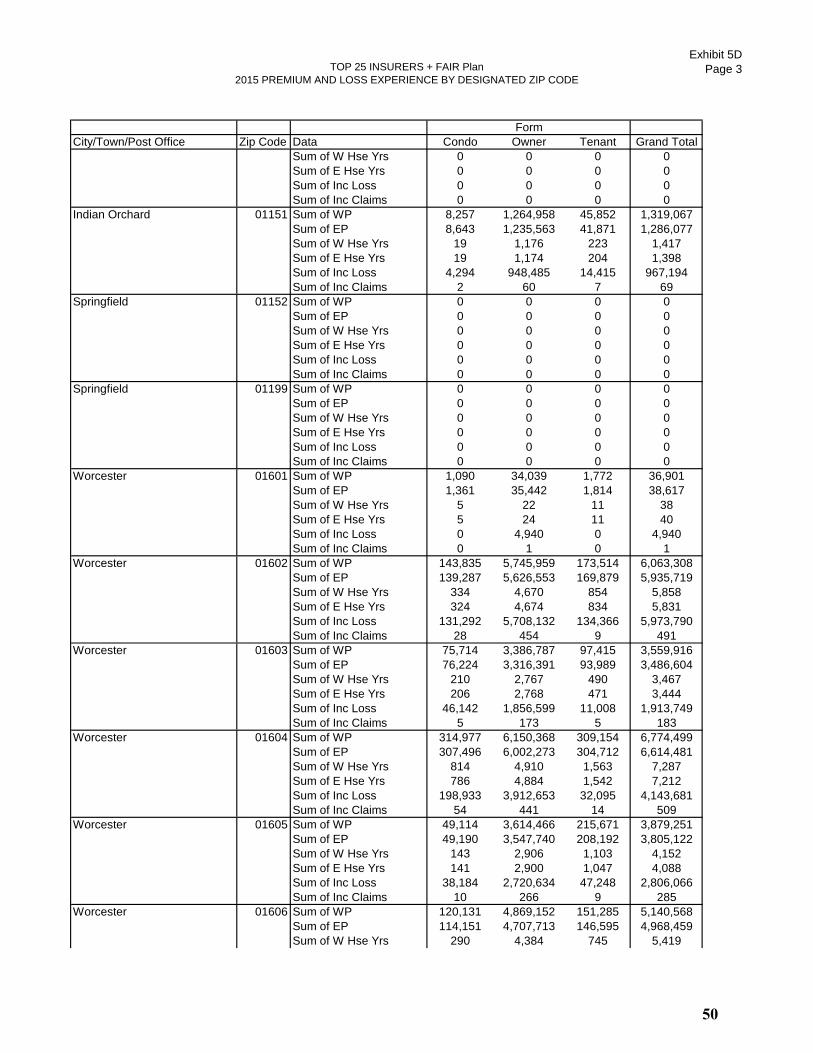
TOP 25 INSURERS + FAIR Plan
2015 PREMIUM AND LOSS EXPERIENCE BY DESIGNATED ZIP CODE
Exhibit 5D
Page 3
City/Town/Post Office Zip Code Data Condo Owner Tenant Grand Total
Form
Sum of W Hse Yrs 0 0 0 0
Sum of E Hse Yrs 0 0 0 0
Sum of Inc Loss 0 0 0 0
Sum of Inc Claims 0 0 0 0
Indian Orchard 01151 Sum of WP 8,257 1,264,958 45,852 1,319,067
Sum of EP 8,643 1,235,563 41,871 1,286,077
Sum of W Hse Yrs 19 1,176 223 1,417
Sum of E Hse Yrs 19 1,174 204 1,398
Sum of Inc Loss 4,294 948,485 14,415 967,194
Sum of Inc Claims 2 60 7 69
Springfield 01152 Sum of WP 0 0 0 0
Sum of EP 0 0 0 0
Sum of W Hse Yrs 0 0 0 0
Sum of E Hse Yrs 0 0 0 0
Sum of Inc Loss 0 0 0 0
Sum of Inc Claims 0 0 0 0
Springfield 01199 Sum of WP 0 0 0 0
Sum of EP 0 0 0 0
Sum of W Hse Yrs 0 0 0 0
Sum of E Hse Yrs 0 0 0 0
Sum of Inc Loss 0 0 0 0
Sum of Inc Claims 0 0 0 0
Worcester 01601 Sum of WP 1,090 34,039 1,772 36,901
Sum of EP 1,361 35,442 1,814 38,617
Sum of W Hse Yrs 5 22 11 38
Sum of E Hse Yrs 5 24 11 40
Sum of Inc Loss 0 4,940 0 4,940
Sum of Inc Claims 0 1 0 1
Worcester 01602 Sum of WP 143,835 5,745,959 173,514 6,063,308
Sum of EP 139,287 5,626,553 169,879 5,935,719
Sum of W Hse Yrs 334 4,670 854 5,858
Sum of E Hse Yrs 324 4,674 834 5,831
Sum of Inc Loss 131,292 5,708,132 134,366 5,973,790
Sum of Inc Claims 28 454 9 491
Worcester 01603 Sum of WP 75,714 3,386,787 97,415 3,559,916
Sum of EP 76,224 3,316,391 93,989 3,486,604
Sum of W Hse Yrs 210 2,767 490 3,467
Sum of E Hse Yrs 206 2,768 471 3,444
Sum of Inc Loss 46,142 1,856,599 11,008 1,913,749
Sum of Inc Claims 5 173 5 183
Worcester 01604 Sum of WP 314,977 6,150,368 309,154 6,774,499
Sum of EP 307,496 6,002,273 304,712 6,614,481
Sum of W Hse Yrs 814 4,910 1,563 7,287
Sum of E Hse Yrs 786 4,884 1,542 7,212
Sum of Inc Loss 198,933 3,912,653 32,095 4,143,681
Sum of Inc Claims 54 441 14 509
Worcester 01605 Sum of WP 49,114 3,614,466 215,671 3,879,251
Sum of EP 49,190 3,547,740 208,192 3,805,122
Sum of W Hse Yrs 143 2,906 1,103 4,152
Sum of E Hse Yrs 141 2,900 1,047 4,088
Sum of Inc Loss 38,184 2,720,634 47,248 2,806,066
Sum of Inc Claims 10 266 9 285
Worcester 01606 Sum of WP 120,131 4,869,152 151,285 5,140,568
Sum of EP 114,151 4,707,713 146,595 4,968,459
Sum of W Hse Yrs 290 4,384 745 5,419
50
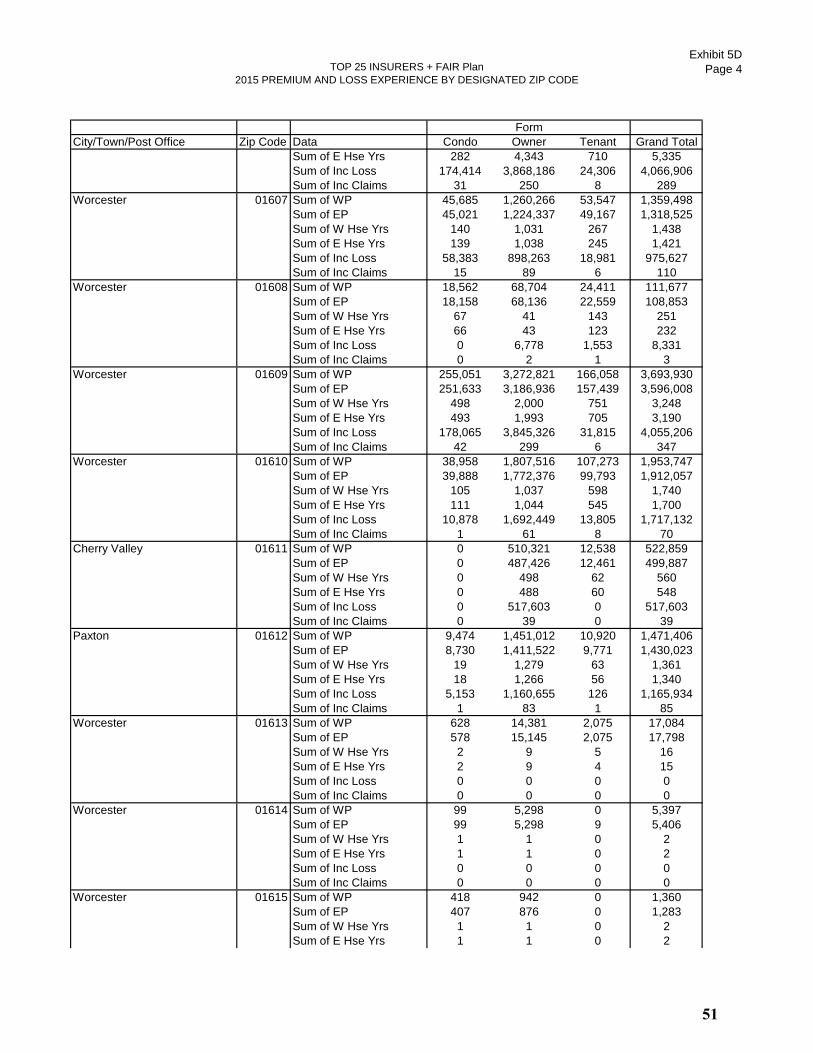
TOP 25 INSURERS + FAIR Plan
2015 PREMIUM AND LOSS EXPERIENCE BY DESIGNATED ZIP CODE
Exhibit 5D
Page 4
City/Town/Post Office Zip Code Data Condo Owner Tenant Grand Total
Form
Sum of E Hse Yrs 282 4,343 710 5,335
Sum of Inc Loss 174,414 3,868,186 24,306 4,066,906
Sum of Inc Claims 31 250 8 289
Worcester 01607 Sum of WP 45,685 1,260,266 53,547 1,359,498
Sum of EP 45,021 1,224,337 49,167 1,318,525
Sum of W Hse Yrs 140 1,031 267 1,438
Sum of E Hse Yrs 139 1,038 245 1,421
Sum of Inc Loss 58,383 898,263 18,981 975,627
Sum of Inc Claims 15 89 6 110
Worcester 01608 Sum of WP 18,562 68,704 24,411 111,677
Sum of EP 18,158 68,136 22,559 108,853
Sum of W Hse Yrs 67 41 143 251
Sum of E Hse Yrs 66 43 123 232
Sum of Inc Loss 0 6,778 1,553 8,331
Sum of Inc Claims 0 2 1 3
Worcester 01609 Sum of WP 255,051 3,272,821 166,058 3,693,930
Sum of EP 251,633 3,186,936 157,439 3,596,008
Sum of W Hse Yrs 498 2,000 751 3,248
Sum of E Hse Yrs 493 1,993 705 3,190
Sum of Inc Loss 178,065 3,845,326 31,815 4,055,206
Sum of Inc Claims 42 299 6 347
Worcester 01610 Sum of WP 38,958 1,807,516 107,273 1,953,747
Sum of EP 39,888 1,772,376 99,793 1,912,057
Sum of W Hse Yrs 105 1,037 598 1,740
Sum of E Hse Yrs 111 1,044 545 1,700
Sum of Inc Loss 10,878 1,692,449 13,805 1,717,132
Sum of Inc Claims 1 61 8 70
Cherry Valley 01611 Sum of WP 0 510,321 12,538 522,859
Sum of EP 0 487,426 12,461 499,887
Sum of W Hse Yrs 0 498 62 560
Sum of E Hse Yrs 0 488 60 548
Sum of Inc Loss 0 517,603 0 517,603
Sum of Inc Claims 0 39 0 39
Paxton 01612 Sum of WP 9,474 1,451,012 10,920 1,471,406
Sum of EP 8,730 1,411,522 9,771 1,430,023
Sum of W Hse Yrs 19 1,279 63 1,361
Sum of E Hse Yrs 18 1,266 56 1,340
Sum of Inc Loss 5,153 1,160,655 126 1,165,934
Sum of Inc Claims 1 83 1 85
Worcester 01613 Sum of WP 628 14,381 2,075 17,084
Sum of EP 578 15,145 2,075 17,798
Sum of W Hse Yrs 2 9 5 16
Sum of E Hse Yrs 2 9 4 15
Sum of Inc Loss 0 0 0 0
Sum of Inc Claims 0 0 0 0
Worcester 01614 Sum of WP 99 5,298 0 5,397
Sum of EP 99 5,298 9 5,406
Sum of W Hse Yrs 1 1 0 2
Sum of E Hse Yrs 1 1 0 2
Sum of Inc Loss 0 0 0 0
Sum of Inc Claims 0 0 0 0
Worcester 01615 Sum of WP 418 942 0 1,360
Sum of EP 407 876 0 1,283
Sum of W Hse Yrs 1 1 0 2
Sum of E Hse Yrs 1 1 0 2
51
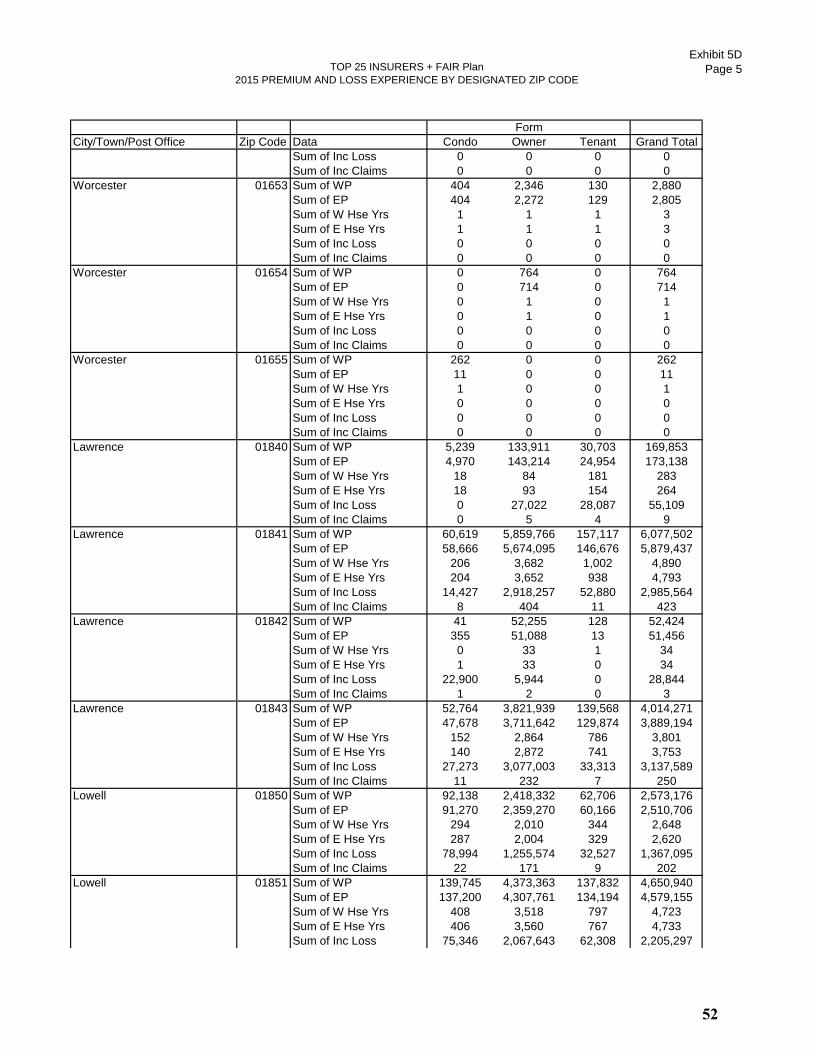
TOP 25 INSURERS + FAIR Plan
2015 PREMIUM AND LOSS EXPERIENCE BY DESIGNATED ZIP CODE
Exhibit 5D
Page 5
City/Town/Post Office Zip Code Data Condo Owner Tenant Grand Total
Form
Sum of Inc Loss 0 0 0 0
Sum of Inc Claims 0 0 0 0
Worcester 01653 Sum of WP 404 2,346 130 2,880
Sum of EP 404 2,272 129 2,805
Sum of W Hse Yrs 1 1 1 3
Sum of E Hse Yrs 1 1 1 3
Sum of Inc Loss 0 0 0 0
Sum of Inc Claims 0 0 0 0
Worcester 01654 Sum of WP 0 764 0 764
Sum of EP 0 714 0 714
Sum of W Hse Yrs 0 1 0 1
Sum of E Hse Yrs 0 1 0 1
Sum of Inc Loss 0 0 0 0
Sum of Inc Claims 0 0 0 0
Worcester 01655 Sum of WP 262 0 0 262
Sum of EP 11 0 0 11
Sum of W Hse Yrs 1 0 0 1
Sum of E Hse Yrs 0 0 0 0
Sum of Inc Loss 0 0 0 0
Sum of Inc Claims 0 0 0 0
Lawrence 01840 Sum of WP 5,239 133,911 30,703 169,853
Sum of EP 4,970 143,214 24,954 173,138
Sum of W Hse Yrs 18 84 181 283
Sum of E Hse Yrs 18 93 154 264
Sum of Inc Loss 0 27,022 28,087 55,109
Sum of Inc Claims 0 5 4 9
Lawrence 01841 Sum of WP 60,619 5,859,766 157,117 6,077,502
Sum of EP 58,666 5,674,095 146,676 5,879,437
Sum of W Hse Yrs 206 3,682 1,002 4,890
Sum of E Hse Yrs 204 3,652 938 4,793
Sum of Inc Loss 14,427 2,918,257 52,880 2,985,564
Sum of Inc Claims 8 404 11 423
Lawrence 01842 Sum of WP 41 52,255 128 52,424
Sum of EP 355 51,088 13 51,456
Sum of W Hse Yrs 0 33 1 34
Sum of E Hse Yrs 1 33 0 34
Sum of Inc Loss 22,900 5,944 0 28,844
Sum of Inc Claims 1 2 0 3
Lawrence 01843 Sum of WP 52,764 3,821,939 139,568 4,014,271
Sum of EP 47,678 3,711,642 129,874 3,889,194
Sum of W Hse Yrs 152 2,864 786 3,801
Sum of E Hse Yrs 140 2,872 741 3,753
Sum of Inc Loss 27,273 3,077,003 33,313 3,137,589
Sum of Inc Claims 11 232 7 250
Lowell 01850 Sum of WP 92,138 2,418,332 62,706 2,573,176
Sum of EP 91,270 2,359,270 60,166 2,510,706
Sum of W Hse Yrs 294 2,010 344 2,648
Sum of E Hse Yrs 287 2,004 329 2,620
Sum of Inc Loss 78,994 1,255,574 32,527 1,367,095
Sum of Inc Claims 22 171 9 202
Lowell 01851 Sum of WP 139,745 4,373,363 137,832 4,650,940
Sum of EP 137,200 4,307,761 134,194 4,579,155
Sum of W Hse Yrs 408 3,518 797 4,723
Sum of E Hse Yrs 406 3,560 767 4,733
Sum of Inc Loss 75,346 2,067,643 62,308 2,205,297
52
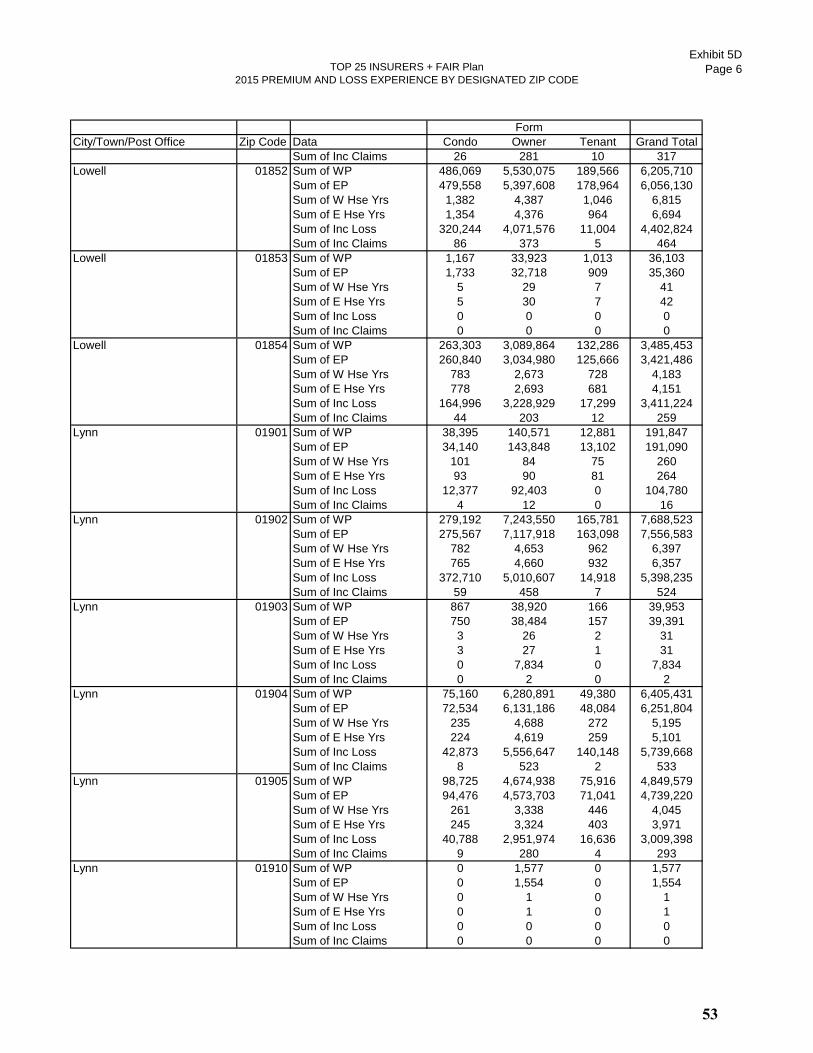
TOP 25 INSURERS + FAIR Plan
2015 PREMIUM AND LOSS EXPERIENCE BY DESIGNATED ZIP CODE
Exhibit 5D
Page 6
City/Town/Post Office Zip Code Data Condo Owner Tenant Grand Total
Form
Sum of Inc Claims 26 281 10 317
Lowell 01852 Sum of WP 486,069 5,530,075 189,566 6,205,710
Sum of EP 479,558 5,397,608 178,964 6,056,130
Sum of W Hse Yrs 1,382 4,387 1,046 6,815
Sum of E Hse Yrs 1,354 4,376 964 6,694
Sum of Inc Loss 320,244 4,071,576 11,004 4,402,824
Sum of Inc Claims 86 373 5 464
Lowell 01853 Sum of WP 1,167 33,923 1,013 36,103
Sum of EP 1,733 32,718 909 35,360
Sum of W Hse Yrs 5 29 7 41
Sum of E Hse Yrs 5 30 7 42
Sum of Inc Loss 0 0 0 0
Sum of Inc Claims 0 0 0 0
Lowell 01854 Sum of WP 263,303 3,089,864 132,286 3,485,453
Sum of EP 260,840 3,034,980 125,666 3,421,486
Sum of W Hse Yrs 783 2,673 728 4,183
Sum of E Hse Yrs 778 2,693 681 4,151
Sum of Inc Loss 164,996 3,228,929 17,299 3,411,224
Sum of Inc Claims 44 203 12 259
Lynn 01901 Sum of WP 38,395 140,571 12,881 191,847
Sum of EP 34,140 143,848 13,102 191,090
Sum of W Hse Yrs 101 84 75 260
Sum of E Hse Yrs 93 90 81 264
Sum of Inc Loss 12,377 92,403 0 104,780
Sum of Inc Claims 4 12 0 16
Lynn 01902 Sum of WP 279,192 7,243,550 165,781 7,688,523
Sum of EP 275,567 7,117,918 163,098 7,556,583
Sum of W Hse Yrs 782 4,653 962 6,397
Sum of E Hse Yrs 765 4,660 932 6,357
Sum of Inc Loss 372,710 5,010,607 14,918 5,398,235
Sum of Inc Claims 59 458 7 524
Lynn 01903 Sum of WP 867 38,920 166 39,953
Sum of EP 750 38,484 157 39,391
Sum of W Hse Yrs 3 26 2 31
Sum of E Hse Yrs 3 27 1 31
Sum of Inc Loss 0 7,834 0 7,834
Sum of Inc Claims 0 2 0 2
Lynn 01904 Sum of WP 75,160 6,280,891 49,380 6,405,431
Sum of EP 72,534 6,131,186 48,084 6,251,804
Sum of W Hse Yrs 235 4,688 272 5,195
Sum of E Hse Yrs 224 4,619 259 5,101
Sum of Inc Loss 42,873 5,556,647 140,148 5,739,668
Sum of Inc Claims 8 523 2 533
Lynn 01905 Sum of WP 98,725 4,674,938 75,916 4,849,579
Sum of EP 94,476 4,573,703 71,041 4,739,220
Sum of W Hse Yrs 261 3,338 446 4,045
Sum of E Hse Yrs 245 3,324 403 3,971
Sum of Inc Loss 40,788 2,951,974 16,636 3,009,398
Sum of Inc Claims 9 280 4 293
Lynn 01910 Sum of WP 0 1,577 0 1,577
Sum of EP 0 1,554 0 1,554
Sum of W Hse Yrs 0 1 0 1
Sum of E Hse Yrs 0 1 0 1
Sum of Inc Loss 0 0 0 0
Sum of Inc Claims 0 0 0 0
53

TOP 25 INSURERS + FAIR Plan
2015 PREMIUM AND LOSS EXPERIENCE BY DESIGNATED ZIP CODE
Exhibit 5D
Page 7
City/Town/Post Office Zip Code Data Condo Owner Tenant Grand Total
Form
Brant Rock 02020 Sum of WP 0 135,517 730 136,247
Sum of EP 0 129,509 582 130,091
Sum of W Hse Yrs 0 80 3 83
Sum of E Hse Yrs 0 76 2 78
Sum of Inc Loss 0 25,011 4,452 29,463
Sum of Inc Claims 0 4 2 6
Green Harbor 02041 Sum of WP 11 100,121 369 100,501
Sum of EP 439 104,769 446 105,654
Sum of W Hse Yrs 1 57 2 60
Sum of E Hse Yrs 1 65 3 69
Sum of Inc Loss 0 5,177 0 5,177
Sum of Inc Claims 0 2 0 2
Hull 02045 Sum of WP 299,812 5,598,448 76,329 5,974,589
Sum of EP 294,462 5,413,508 71,607 5,779,577
Sum of W Hse Yrs 625 3,225 345 4,195
Sum of E Hse Yrs 623 3,164 317 4,104
Sum of Inc Loss 343,475 5,670,577 23,377 6,037,429
Sum of Inc Claims 62 241 4 307
Humarock 02047 Sum of WP 1,399 540,213 3,850 545,462
Sum of EP 1,450 527,763 4,341 533,554
Sum of W Hse Yrs 2 330 18 350
Sum of E Hse Yrs 1 330 19 350
Sum of Inc Loss 0 532,953 0 532,953
Sum of Inc Claims 0 26 0 26
Minot 02055 Sum of WP 0 15,713 0 15,713
Sum of EP 0 15,380 0 15,380
Sum of W Hse Yrs 0 5 0 5
Sum of E Hse Yrs 0 6 0 6
Sum of Inc Loss 0 0 0 0
Sum of Inc Claims 0 0 0 0
Ocean Bluff 02065 Sum of WP 0 59,301 115 59,416
Sum of EP 67 57,958 108 58,133
Sum of W Hse Yrs 0 38 0 38
Sum of E Hse Yrs 0 36 1 37
Sum of Inc Loss 0 109,585 0 109,585
Sum of Inc Claims 0 2 0 2
Boston 02101 Sum of WP 5,692 837 385 6,914
Sum of EP 5,529 835 382 6,746
Sum of W Hse Yrs 6 1 2 9
Sum of E Hse Yrs 6 1 2 9
Sum of Inc Loss 0 0 5,098 5,098
Sum of Inc Claims 0 0 2 2
Boston 02102 Sum of WP 0 0 0 0
Sum of EP 0 0 95 95
Sum of W Hse Yrs 0 0 0 0
Sum of E Hse Yrs 0 0 1 1
Sum of Inc Loss 0 0 0 0
Sum of Inc Claims 0 0 0 0
Boston 02103 Sum of WP 0 1,429 0 1,429
Sum of EP 71 1,360 0 1,431
Sum of W Hse Yrs 0 1 0 1
Sum of E Hse Yrs 0 1 0 1
Sum of Inc Loss 0 0 0 0
Sum of Inc Claims 0 0 0 0
Boston 02104 Sum of WP 0 0 0 0
54

TOP 25 INSURERS + FAIR Plan
2015 PREMIUM AND LOSS EXPERIENCE BY DESIGNATED ZIP CODE
Exhibit 5D
Page 8
City/Town/Post Office Zip Code Data Condo Owner Tenant Grand Total
Form
Sum of EP 0 0 0 0
Sum of W Hse Yrs 0 0 0 0
Sum of E Hse Yrs 0 0 0 0
Sum of Inc Loss 0 0 0 0
Sum of Inc Claims 0 0 0 0
Boston 02105 Sum of WP 360 0 0 360
Sum of EP 358 0 0 358
Sum of W Hse Yrs 1 0 0 1
Sum of E Hse Yrs 1 0 0 1
Sum of Inc Loss 0 0 0 0
Sum of Inc Claims 0 0 0 0
Boston 02106 Sum of WP 278 0 0 278
Sum of EP 230 0 16 246
Sum of W Hse Yrs 1 0 0 1
Sum of E Hse Yrs 1 0 0 1
Sum of Inc Loss 0 0 0 0
Sum of Inc Claims 0 0 0 0
Boston 02107 Sum of WP 424 117 50 591
Sum of EP 365 1,315 15 1,695
Sum of W Hse Yrs 0 0 1 1
Sum of E Hse Yrs 0 1 0 1
Sum of Inc Loss 0 0 0 0
Sum of Inc Claims 0 0 0 0
Boston 02108 Sum of WP 919,322 1,883,285 145,858 2,948,465
Sum of EP 881,060 1,778,140 147,245 2,806,445
Sum of W Hse Yrs 721 202 363 1,287
Sum of E Hse Yrs 708 198 363 1,269
Sum of Inc Loss 471,309 749,605 220,431 1,441,345
Sum of Inc Claims 28 19 8 55
Boston 02109 Sum of WP 707,283 66,244 165,766 939,293
Sum of EP 678,543 81,904 157,065 917,512
Sum of W Hse Yrs 895 24 580 1,498
Sum of E Hse Yrs 865 23 551 1,438
Sum of Inc Loss 321,777 90,603 7,578 419,958
Sum of Inc Claims 44 6 5 55
Boston 02110 Sum of WP 877,391 114,347 63,077 1,054,815
Sum of EP 861,832 93,921 62,587 1,018,340
Sum of W Hse Yrs 815 7 182 1,005
Sum of E Hse Yrs 793 7 177 977
Sum of Inc Loss 705,113 0 0 705,113
Sum of Inc Claims 31 0 0 31
Boston 02111 Sum of WP 985,018 33,062 158,056 1,176,136
Sum of EP 956,724 53,489 156,045 1,166,258
Sum of W Hse Yrs 1,031 14 477 1,522
Sum of E Hse Yrs 1,021 17 457 1,494
Sum of Inc Loss 163,475 7,193 14,148 184,816
Sum of Inc Claims 24 1 6 31
Boston 02112 Sum of WP 1,493 0 0 1,493
Sum of EP 1,362 0 0 1,362
Sum of W Hse Yrs 3 0 0 3
Sum of E Hse Yrs 2 0 0 2
Sum of Inc Loss 0 0 0 0
Sum of Inc Claims 0 0 0 0
Boston 02113 Sum of WP 395,414 335,029 239,179 969,622
Sum of EP 388,495 353,661 234,361 976,517
55

TOP 25 INSURERS + FAIR Plan
2015 PREMIUM AND LOSS EXPERIENCE BY DESIGNATED ZIP CODE
Exhibit 5D
Page 9
City/Town/Post Office Zip Code Data Condo Owner Tenant Grand Total
Form
Sum of W Hse Yrs 726 122 998 1,846
Sum of E Hse Yrs 717 128 966 1,811
Sum of Inc Loss 262,076 196,579 83,193 541,848
Sum of Inc Claims 39 23 15 77
Boston 02114 Sum of WP 1,089,476 1,165,394 389,427 2,644,297
Sum of EP 1,080,537 1,124,403 401,517 2,606,457
Sum of W Hse Yrs 1,679 229 1,500 3,408
Sum of E Hse Yrs 1,664 221 1,500 3,385
Sum of Inc Loss 581,918 299,494 104,520 985,932
Sum of Inc Claims 66 27 23 116
Boston 02115 Sum of WP 1,096,199 509,644 397,047 2,002,890
Sum of EP 1,076,133 512,595 406,507 1,995,235
Sum of W Hse Yrs 1,442 76 1,625 3,143
Sum of E Hse Yrs 1,429 76 1,617 3,122
Sum of Inc Loss 872,993 573,730 124,500 1,571,223
Sum of Inc Claims 77 19 27 123
Boston 02116 Sum of WP 5,257,552 2,178,047 736,973 8,172,572
Sum of EP 5,069,464 2,125,802 713,126 7,908,392
Sum of W Hse Yrs 4,355 332 2,100 6,788
Sum of E Hse Yrs 4,245 336 2,056 6,637
Sum of Inc Loss 4,282,595 1,210,067 117,219 5,609,881
Sum of Inc Claims 210 48 26 284
Boston 02117 Sum of WP 2,167 0 216 2,383
Sum of EP 1,993 0 174 2,167
Sum of W Hse Yrs 6 0 1 7
Sum of E Hse Yrs 4 0 1 5
Sum of Inc Loss 0 0 0 0
Sum of Inc Claims 0 0 0 0
Boston 02118 Sum of WP 2,492,828 1,444,677 461,779 4,399,284
Sum of EP 2,444,530 1,423,229 436,785 4,304,544
Sum of W Hse Yrs 3,438 332 1,759 5,530
Sum of E Hse Yrs 3,355 329 1,642 5,326
Sum of Inc Loss 1,617,773 853,436 427,633 2,898,842
Sum of Inc Claims 192 55 39 286
Boston 02119 Sum of WP 293,044 3,049,737 139,032 3,481,813
Sum of EP 282,685 3,014,182 133,490 3,430,357
Sum of W Hse Yrs 444 1,361 627 2,431
Sum of E Hse Yrs 436 1,386 575 2,396
Sum of Inc Loss 168,741 4,734,421 57,569 4,960,731
Sum of Inc Claims 37 295 19 351
Boston 02120 Sum of WP 111,659 492,302 110,373 714,334
Sum of EP 108,819 487,416 105,997 702,232
Sum of W Hse Yrs 214 228 538 980
Sum of E Hse Yrs 215 232 519 966
Sum of Inc Loss 20,865 446,565 39,477 506,907
Sum of Inc Claims 5 51 11 67
Boston 02121 Sum of WP 53,496 3,875,153 98,312 4,026,961
Sum of EP 49,234 3,778,167 94,497 3,921,898
Sum of W Hse Yrs 112 1,388 461 1,960
Sum of E Hse Yrs 100 1,384 427 1,911
Sum of Inc Loss 5,379 4,017,630 18,003 4,041,012
Sum of Inc Claims 4 295 8 307
Boston 02122 Sum of WP 404,925 4,193,859 146,416 4,745,200
Sum of EP 387,410 4,101,063 140,981 4,629,454
Sum of W Hse Yrs 813 2,163 695 3,671
56

TOP 25 INSURERS + FAIR Plan
2015 PREMIUM AND LOSS EXPERIENCE BY DESIGNATED ZIP CODE
Exhibit 5D
Page 10
City/Town/Post Office Zip Code Data Condo Owner Tenant Grand Total
Form
Sum of E Hse Yrs 789 2,162 669 3,621
Sum of Inc Loss 211,009 2,783,494 55,320 3,049,823
Sum of Inc Claims 44 247 12 303
Boston 02123 Sum of WP 1,251 3,550 0 4,801
Sum of EP 1,224 3,436 0 4,660
Sum of W Hse Yrs 2 3 0 5
Sum of E Hse Yrs 2 3 0 5
Sum of Inc Loss 5,153 0 0 5,153
Sum of Inc Claims 1 0 0 1
Boston 02124 Sum of WP 363,307 10,586,181 255,194 11,204,682
Sum of EP 351,317 10,349,418 244,237 10,944,972
Sum of W Hse Yrs 738 5,154 1,167 7,060
Sum of E Hse Yrs 724 5,162 1,100 6,986
Sum of Inc Loss 57,789 10,875,921 191,285 11,124,995
Sum of Inc Claims 23 902 24 949
Boston 02125 Sum of WP 531,833 5,256,815 208,705 5,997,353
Sum of EP 517,218 5,166,458 206,503 5,890,179
Sum of W Hse Yrs 1,058 2,262 1,055 4,374
Sum of E Hse Yrs 1,031 2,279 1,000 4,310
Sum of Inc Loss 173,578 3,424,032 25,955 3,623,565
Sum of Inc Claims 35 283 16 334
Mattapan 02126 Sum of WP 50,940 5,028,103 99,868 5,178,911
Sum of EP 48,999 4,922,514 95,971 5,067,484
Sum of W Hse Yrs 108 2,817 586 3,511
Sum of E Hse Yrs 104 2,842 563 3,509
Sum of Inc Loss 31,769 6,307,975 45,225 6,384,969
Sum of Inc Claims 11 681 10 702
Boston 02127 Sum of WP 2,290,396 4,450,839 710,116 7,451,351
Sum of EP 2,235,331 4,433,291 700,268 7,368,890
Sum of W Hse Yrs 4,248 2,011 3,157 9,416
Sum of E Hse Yrs 4,170 2,056 3,090 9,316
Sum of Inc Loss 1,159,008 1,986,512 299,238 3,444,758
Sum of Inc Claims 198 204 52 454
Boston 02128 Sum of WP 403,160 5,466,485 259,315 6,128,960
Sum of EP 390,467 5,458,449 240,434 6,089,350
Sum of W Hse Yrs 846 2,736 1,284 4,867
Sum of E Hse Yrs 806 2,783 1,170 4,759
Sum of Inc Loss 78,513 4,759,815 56,311 4,894,639
Sum of Inc Claims 24 235 14 273
Charlestown 02129 Sum of WP 1,613,852 2,712,161 329,009 4,655,022
Sum of EP 1,595,271 2,673,530 337,685 4,606,486
Sum of W Hse Yrs 2,625 1,213 1,349 5,188
Sum of E Hse Yrs 2,578 1,218 1,331 5,127
Sum of Inc Loss 1,001,369 3,431,003 70,497 4,502,869
Sum of Inc Claims 173 155 21 349
Jamaica Plain 02130 Sum of WP 2,026,294 5,796,380 491,864 8,314,538
Sum of EP 1,993,744 5,642,224 478,423 8,114,391
Sum of W Hse Yrs 3,594 2,798 1,963 8,356
Sum of E Hse Yrs 3,531 2,797 1,872 8,200
Sum of Inc Loss 801,611 7,641,088 92,697 8,535,396
Sum of Inc Claims 187 544 40 771
Roslindale 02131 Sum of WP 548,381 6,853,812 226,190 7,628,383
Sum of EP 534,845 6,738,810 220,565 7,494,220
Sum of W Hse Yrs 1,077 4,476 923 6,475
Sum of E Hse Yrs 1,044 4,488 873 6,404
57

TOP 25 INSURERS + FAIR Plan
2015 PREMIUM AND LOSS EXPERIENCE BY DESIGNATED ZIP CODE
Exhibit 5D
Page 11
City/Town/Post Office Zip Code Data Condo Owner Tenant Grand Total
Form
Sum of Inc Loss 218,848 6,704,728 6,485 6,930,061
Sum of Inc Claims 48 643 4 695
West Roxbury 02132 Sum of WP 347,937 8,982,545 210,163 9,540,645
Sum of EP 349,242 8,760,449 209,220 9,318,911
Sum of W Hse Yrs 801 6,506 867 8,173
Sum of E Hse Yrs 791 6,455 839 8,085
Sum of Inc Loss 225,625 12,390,288 46,702 12,662,615
Sum of Inc Claims 46 1,032 13 1,091
Boston 02133 Sum of WP 2,265 0 215 2,480
Sum of EP 2,950 0 371 3,321
Sum of W Hse Yrs 2 0 1 3
Sum of E Hse Yrs 3 0 2 5
Sum of Inc Loss 0 0 0 0
Sum of Inc Claims 0 0 0 0
Allston 02134 Sum of WP 279,146 1,029,192 322,327 1,630,665
Sum of EP 279,902 1,033,995 324,593 1,638,490
Sum of W Hse Yrs 670 550 1,508 2,728
Sum of E Hse Yrs 669 565 1,506 2,740
Sum of Inc Loss 113,630 478,207 19,784 611,621
Sum of Inc Claims 19 60 18 97
Brighton 02135 Sum of WP 1,044,095 3,832,053 819,818 5,695,966
Sum of EP 1,043,514 3,793,407 825,806 5,662,727
Sum of W Hse Yrs 2,551 2,153 3,802 8,506
Sum of E Hse Yrs 2,534 2,168 3,747 8,449
Sum of Inc Loss 297,483 3,748,669 84,166 4,130,318
Sum of Inc Claims 87 358 49 494
Hyde Park 02136 Sum of WP 185,722 7,249,814 131,789 7,567,325
Sum of EP 177,030 7,032,739 129,422 7,339,191
Sum of W Hse Yrs 388 5,232 632 6,252
Sum of E Hse Yrs 372 5,209 608 6,189
Sum of Inc Loss 88,128 14,182,917 35,464 14,306,509
Sum of Inc Claims 27 1,060 11 1,098
Readville 02137 Sum of WP 1,131 11,592 804 13,527
Sum of EP 1,470 15,313 866 17,649
Sum of W Hse Yrs 3 12 3 18
Sum of E Hse Yrs 4 13 4 21
Sum of Inc Loss 0 11,629 0 11,629
Sum of Inc Claims 0 4 0 4
Cambridge 02138 Sum of WP 1,532,514 7,004,072 583,900 9,120,486
Sum of EP 1,508,605 6,779,899 579,716 8,868,220
Sum of W Hse Yrs 2,765 2,310 2,458 7,533
Sum of E Hse Yrs 2,702 2,282 2,404 7,388
Sum of Inc Loss 487,630 5,763,747 144,753 6,396,130
Sum of Inc Claims 112 327 32 471
Cambridge 02139 Sum of WP 1,327,291 2,863,561 542,676 4,733,528
Sum of EP 1,302,637 2,823,800 541,792 4,668,229
Sum of W Hse Yrs 2,863 1,439 2,724 7,026
Sum of E Hse Yrs 2,813 1,432 2,707 6,952
Sum of Inc Loss 466,670 2,908,020 106,586 3,481,276
Sum of Inc Claims 111 165 56 332
Cambridge 02140 Sum of WP 749,987 2,782,283 299,163 3,831,433
Sum of EP 736,429 2,726,316 297,442 3,760,187
Sum of W Hse Yrs 1,615 1,372 1,512 4,499
Sum of E Hse Yrs 1,569 1,360 1,460 4,389
Sum of Inc Loss 295,248 1,567,138 75,541 1,937,927
58
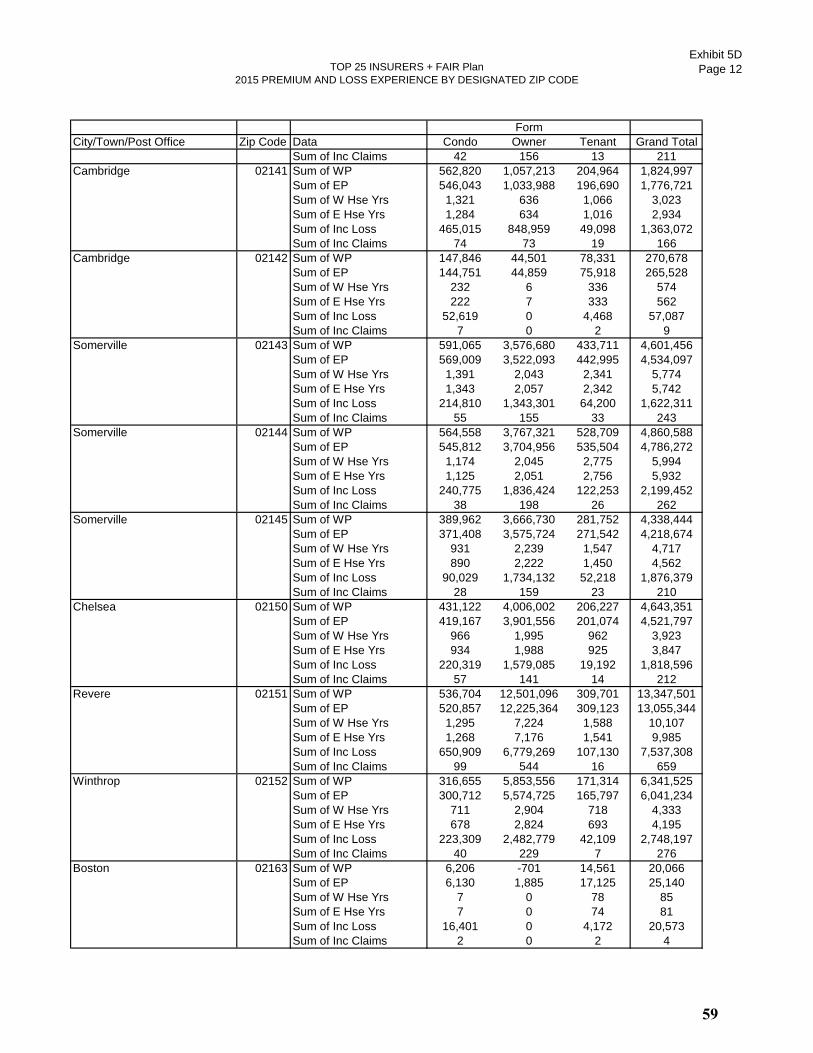
TOP 25 INSURERS + FAIR Plan
2015 PREMIUM AND LOSS EXPERIENCE BY DESIGNATED ZIP CODE
Exhibit 5D
Page 12
City/Town/Post Office Zip Code Data Condo Owner Tenant Grand Total
Form
Sum of Inc Claims 42 156 13 211
Cambridge 02141 Sum of WP 562,820 1,057,213 204,964 1,824,997
Sum of EP 546,043 1,033,988 196,690 1,776,721
Sum of W Hse Yrs 1,321 636 1,066 3,023
Sum of E Hse Yrs 1,284 634 1,016 2,934
Sum of Inc Loss 465,015 848,959 49,098 1,363,072
Sum of Inc Claims 74 73 19 166
Cambridge 02142 Sum of WP 147,846 44,501 78,331 270,678
Sum of EP 144,751 44,859 75,918 265,528
Sum of W Hse Yrs 232 6 336 574
Sum of E Hse Yrs 222 7 333 562
Sum of Inc Loss 52,619 0 4,468 57,087
Sum of Inc Claims 7 0 2 9
Somerville 02143 Sum of WP 591,065 3,576,680 433,711 4,601,456
Sum of EP 569,009 3,522,093 442,995 4,534,097
Sum of W Hse Yrs 1,391 2,043 2,341 5,774
Sum of E Hse Yrs 1,343 2,057 2,342 5,742
Sum of Inc Loss 214,810 1,343,301 64,200 1,622,311
Sum of Inc Claims 55 155 33 243
Somerville 02144 Sum of WP 564,558 3,767,321 528,709 4,860,588
Sum of EP 545,812 3,704,956 535,504 4,786,272
Sum of W Hse Yrs 1,174 2,045 2,775 5,994
Sum of E Hse Yrs 1,125 2,051 2,756 5,932
Sum of Inc Loss 240,775 1,836,424 122,253 2,199,452
Sum of Inc Claims 38 198 26 262
Somerville 02145 Sum of WP 389,962 3,666,730 281,752 4,338,444
Sum of EP 371,408 3,575,724 271,542 4,218,674
Sum of W Hse Yrs 931 2,239 1,547 4,717
Sum of E Hse Yrs 890 2,222 1,450 4,562
Sum of Inc Loss 90,029 1,734,132 52,218 1,876,379
Sum of Inc Claims 28 159 23 210
Chelsea 02150 Sum of WP 431,122 4,006,002 206,227 4,643,351
Sum of EP 419,167 3,901,556 201,074 4,521,797
Sum of W Hse Yrs 966 1,995 962 3,923
Sum of E Hse Yrs 934 1,988 925 3,847
Sum of Inc Loss 220,319 1,579,085 19,192 1,818,596
Sum of Inc Claims 57 141 14 212
Revere 02151 Sum of WP 536,704 12,501,096 309,701 13,347,501
Sum of EP 520,857 12,225,364 309,123 13,055,344
Sum of W Hse Yrs 1,295 7,224 1,588 10,107
Sum of E Hse Yrs 1,268 7,176 1,541 9,985
Sum of Inc Loss 650,909 6,779,269 107,130 7,537,308
Sum of Inc Claims 99 544 16 659
Winthrop 02152 Sum of WP 316,655 5,853,556 171,314 6,341,525
Sum of EP 300,712 5,574,725 165,797 6,041,234
Sum of W Hse Yrs 711 2,904 718 4,333
Sum of E Hse Yrs 678 2,824 693 4,195
Sum of Inc Loss 223,309 2,482,779 42,109 2,748,197
Sum of Inc Claims 40 229 7 276
Boston 02163 Sum of WP 6,206 -701 14,561 20,066
Sum of EP 6,130 1,885 17,125 25,140
Sum of W Hse Yrs 7 0 78 85
Sum of E Hse Yrs 7 0 74 81
Sum of Inc Loss 16,401 0 4,172 20,573
Sum of Inc Claims 2 0 2 4
59

TOP 25 INSURERS + FAIR Plan
2015 PREMIUM AND LOSS EXPERIENCE BY DESIGNATED ZIP CODE
Exhibit 5D
Page 13
City/Town/Post Office Zip Code Data Condo Owner Tenant Grand Total
Form
Boston 02196 Sum of WP 0 5,526 337 5,863
Sum of EP 0 6,813 335 7,148
Sum of W Hse Yrs 0 4 2 6
Sum of E Hse Yrs 0 5 2 7
Sum of Inc Loss 0 0 0 0
Sum of Inc Claims 0 0 0 0
Boston 02199 Sum of WP 257,189 3,605 119,277 380,071
Sum of EP 245,988 3,593 128,930 378,511
Sum of W Hse Yrs 82 1 308 391
Sum of E Hse Yrs 82 1 313 396
Sum of Inc Loss 19,756 0 2,519 22,275
Sum of Inc Claims 2 0 2 4
Boston 02201 Sum of WP 0 0 219 219
Sum of EP 0 0 119 119
Sum of W Hse Yrs 0 0 1 1
Sum of E Hse Yrs 0 0 1 1
Sum of Inc Loss 0 0 0 0
Sum of Inc Claims 0 0 0 0
Boston 02202 Sum of WP 0 0 14 14
Sum of EP 0 0 13 13
Sum of W Hse Yrs 0 0 0 0
Sum of E Hse Yrs 0 0 0 0
Sum of Inc Loss 0 0 0 0
Sum of Inc Claims 0 0 0 0
Boston 02203 Sum of WP 0 0 0 0
Sum of EP 0 0 0 0
Sum of W Hse Yrs 0 0 0 0
Sum of E Hse Yrs 0 0 0 0
Sum of Inc Loss 0 0 0 0
Sum of Inc Claims 0 0 0 0
Boston 02204 Sum of WP 0 0 0 0
Sum of EP 0 0 0 0
Sum of W Hse Yrs 0 0 0 0
Sum of E Hse Yrs 0 0 0 0
Sum of Inc Loss 0 0 0 0
Sum of Inc Claims 0 0 0 0
Boston 02205 Sum of WP 0 130 132 262
Sum of EP 837 132 126 1,095
Sum of W Hse Yrs 0 1 1 2
Sum of E Hse Yrs 1 1 1 3
Sum of Inc Loss 0 8,139 0 8,139
Sum of Inc Claims 0 1 0 1
Boston 02206 Sum of WP 0 0 0 0
Sum of EP 0 0 0 0
Sum of W Hse Yrs 0 0 0 0
Sum of E Hse Yrs 0 0 0 0
Sum of Inc Loss 0 0 0 0
Sum of Inc Claims 0 0 0 0
Boston 02207 Sum of WP 0 0 0 0
Sum of EP 0 0 0 0
Sum of W Hse Yrs 0 0 0 0
Sum of E Hse Yrs 0 0 0 0
Sum of Inc Loss 0 0 0 0
Sum of Inc Claims 0 0 0 0
Boston 02208 Sum of WP 0 0 0 0
60
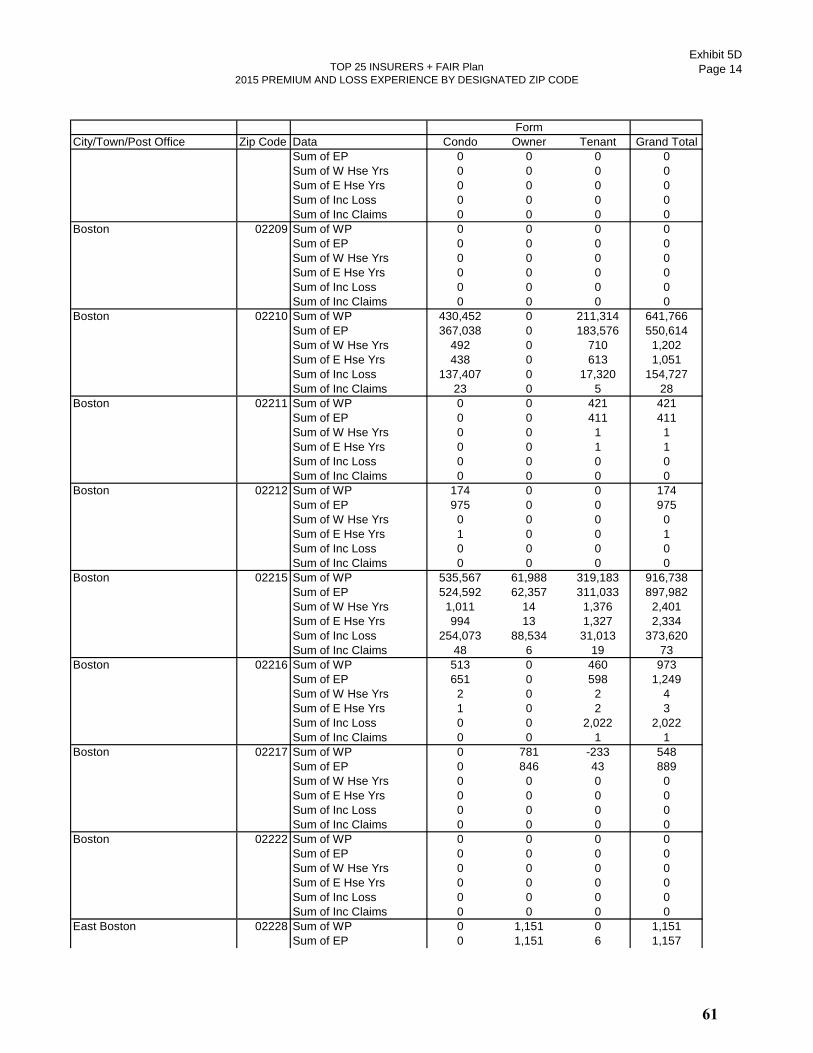
TOP 25 INSURERS + FAIR Plan
2015 PREMIUM AND LOSS EXPERIENCE BY DESIGNATED ZIP CODE
Exhibit 5D
Page 14
City/Town/Post Office Zip Code Data Condo Owner Tenant Grand Total
Form
Sum of EP 0 0 0 0
Sum of W Hse Yrs 0 0 0 0
Sum of E Hse Yrs 0 0 0 0
Sum of Inc Loss 0 0 0 0
Sum of Inc Claims 0 0 0 0
Boston 02209 Sum of WP 0 0 0 0
Sum of EP 0 0 0 0
Sum of W Hse Yrs 0 0 0 0
Sum of E Hse Yrs 0 0 0 0
Sum of Inc Loss 0 0 0 0
Sum of Inc Claims 0 0 0 0
Boston 02210 Sum of WP 430,452 0 211,314 641,766
Sum of EP 367,038 0 183,576 550,614
Sum of W Hse Yrs 492 0 710 1,202
Sum of E Hse Yrs 438 0 613 1,051
Sum of Inc Loss 137,407 0 17,320 154,727
Sum of Inc Claims 23 0 5 28
Boston 02211 Sum of WP 0 0 421 421
Sum of EP 0 0 411 411
Sum of W Hse Yrs 0 0 1 1
Sum of E Hse Yrs 0 0 1 1
Sum of Inc Loss 0 0 0 0
Sum of Inc Claims 0 0 0 0
Boston 02212 Sum of WP 174 0 0 174
Sum of EP 975 0 0 975
Sum of W Hse Yrs 0 0 0 0
Sum of E Hse Yrs 1 0 0 1
Sum of Inc Loss 0 0 0 0
Sum of Inc Claims 0 0 0 0
Boston 02215 Sum of WP 535,567 61,988 319,183 916,738
Sum of EP 524,592 62,357 311,033 897,982
Sum of W Hse Yrs 1,011 14 1,376 2,401
Sum of E Hse Yrs 994 13 1,327 2,334
Sum of Inc Loss 254,073 88,534 31,013 373,620
Sum of Inc Claims 48 6 19 73
Boston 02216 Sum of WP 513 0 460 973
Sum of EP 651 0 598 1,249
Sum of W Hse Yrs 2 0 2 4
Sum of E Hse Yrs 1 0 2 3
Sum of Inc Loss 0 0 2,022 2,022
Sum of Inc Claims 0 0 1 1
Boston 02217 Sum of WP 0 781 -233 548
Sum of EP 0 846 43 889
Sum of W Hse Yrs 0 0 0 0
Sum of E Hse Yrs 0 0 0 0
Sum of Inc Loss 0 0 0 0
Sum of Inc Claims 0 0 0 0
Boston 02222 Sum of WP 0 0 0 0
Sum of EP 0 0 0 0
Sum of W Hse Yrs 0 0 0 0
Sum of E Hse Yrs 0 0 0 0
Sum of Inc Loss 0 0 0 0
Sum of Inc Claims 0 0 0 0
East Boston 02228 Sum of WP 0 1,151 0 1,151
Sum of EP 0 1,151 6 1,157
61

TOP 25 INSURERS + FAIR Plan
2015 PREMIUM AND LOSS EXPERIENCE BY DESIGNATED ZIP CODE
Exhibit 5D
Page 15
City/Town/Post Office Zip Code Data Condo Owner Tenant Grand Total
Form
Sum of W Hse Yrs 0 1 0 1
Sum of E Hse Yrs 0 1 0 1
Sum of Inc Loss 0 7,296 0 7,296
Sum of Inc Claims 0 1 0 1
Cambridge 02238 Sum of WP 1,299 0 0 1,299
Sum of EP 1,352 0 0 1,352
Sum of W Hse Yrs 3 0 0 3
Sum of E Hse Yrs 3 0 0 3
Sum of Inc Loss 0 0 0 0
Sum of Inc Claims 0 0 0 0
Cambridge 02239 Sum of WP 0 0 0 0
Sum of EP 0 0 0 0
Sum of W Hse Yrs 0 0 0 0
Sum of E Hse Yrs 0 0 0 0
Sum of Inc Loss 0 0 0 0
Sum of Inc Claims 0 0 0 0
Boston 02241 Sum of WP 0 0 0 0
Sum of EP 0 0 0 0
Sum of W Hse Yrs 0 0 0 0
Sum of E Hse Yrs 0 0 0 0
Sum of Inc Loss 0 0 0 0
Sum of Inc Claims 0 0 0 0
Boston 02266 Sum of WP 0 0 0 0
Sum of EP 0 0 0 0
Sum of W Hse Yrs 0 0 0 0
Sum of E Hse Yrs 0 0 0 0
Sum of Inc Loss 0 0 0 0
Sum of Inc Claims 0 0 0 0
Boston 02283 Sum of WP 0 0 0 0
Sum of EP 0 0 0 0
Sum of W Hse Yrs 0 0 0 0
Sum of E Hse Yrs 0 0 0 0
Sum of Inc Loss 0 0 0 0
Sum of Inc Claims 0 0 0 0
Boston 02284 Sum of WP 0 0 0 0
Sum of EP 0 0 0 0
Sum of W Hse Yrs 0 0 0 0
Sum of E Hse Yrs 0 0 0 0
Sum of Inc Loss 0 0 0 0
Sum of Inc Claims 0 0 0 0
Boston 02293 Sum of WP 0 917 0 917
Sum of EP 0 915 0 915
Sum of W Hse Yrs 0 1 0 1
Sum of E Hse Yrs 0 1 0 1
Sum of Inc Loss 0 0 0 0
Sum of Inc Claims 0 0 0 0
Boston 02295 Sum of WP 0 0 0 0
Sum of EP 0 0 0 0
Sum of W Hse Yrs 0 0 0 0
Sum of E Hse Yrs 0 0 0 0
Sum of Inc Loss 0 0 0 0
Sum of Inc Claims 0 0 0 0
Boston 02297 Sum of WP 0 0 0 0
Sum of EP 0 0 0 0
Sum of W Hse Yrs 0 0 0 0
62
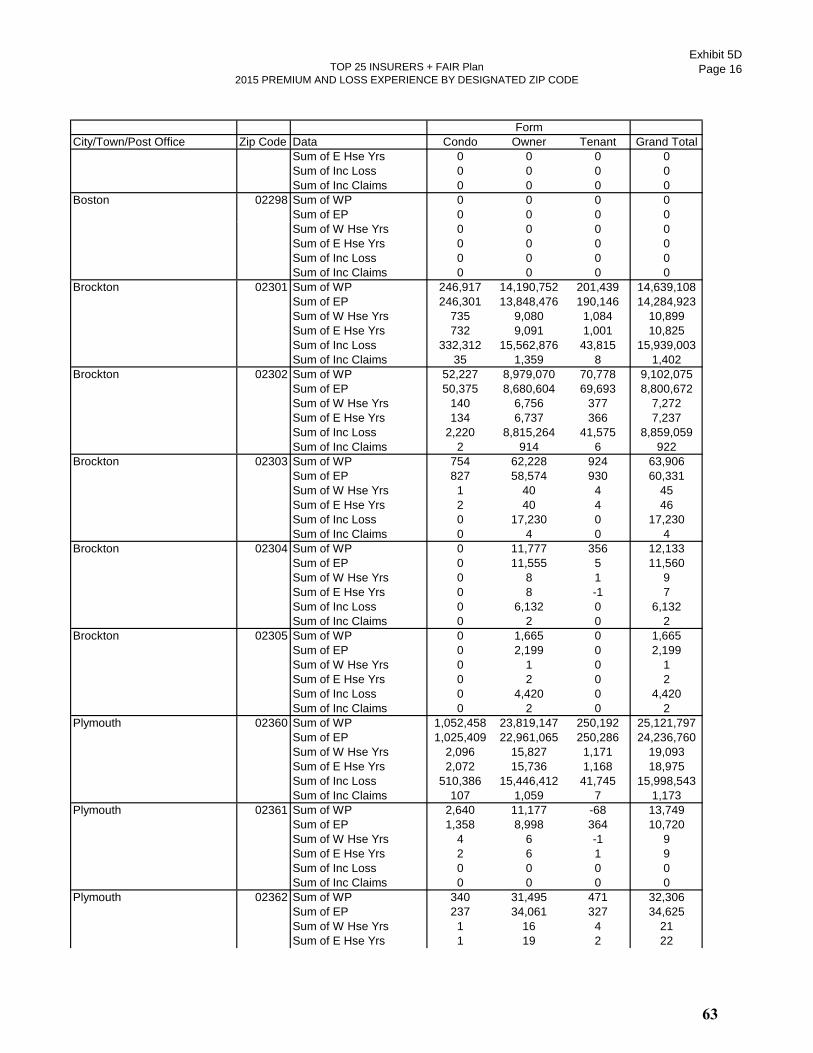
TOP 25 INSURERS + FAIR Plan
2015 PREMIUM AND LOSS EXPERIENCE BY DESIGNATED ZIP CODE
Exhibit 5D
Page 16
City/Town/Post Office Zip Code Data Condo Owner Tenant Grand Total
Form
Sum of E Hse Yrs 0 0 0 0
Sum of Inc Loss 0 0 0 0
Sum of Inc Claims 0 0 0 0
Boston 02298 Sum of WP 0 0 0 0
Sum of EP 0 0 0 0
Sum of W Hse Yrs 0 0 0 0
Sum of E Hse Yrs 0 0 0 0
Sum of Inc Loss 0 0 0 0
Sum of Inc Claims 0 0 0 0
Brockton 02301 Sum of WP 246,917 14,190,752 201,439 14,639,108
Sum of EP 246,301 13,848,476 190,146 14,284,923
Sum of W Hse Yrs 735 9,080 1,084 10,899
Sum of E Hse Yrs 732 9,091 1,001 10,825
Sum of Inc Loss 332,312 15,562,876 43,815 15,939,003
Sum of Inc Claims 35 1,359 8 1,402
Brockton 02302 Sum of WP 52,227 8,979,070 70,778 9,102,075
Sum of EP 50,375 8,680,604 69,693 8,800,672
Sum of W Hse Yrs 140 6,756 377 7,272
Sum of E Hse Yrs 134 6,737 366 7,237
Sum of Inc Loss 2,220 8,815,264 41,575 8,859,059
Sum of Inc Claims 2 914 6 922
Brockton 02303 Sum of WP 754 62,228 924 63,906
Sum of EP 827 58,574 930 60,331
Sum of W Hse Yrs 1 40 4 45
Sum of E Hse Yrs 2 40 4 46
Sum of Inc Loss 0 17,230 0 17,230
Sum of Inc Claims 0 4 0 4
Brockton 02304 Sum of WP 0 11,777 356 12,133
Sum of EP 0 11,555 5 11,560
Sum of W Hse Yrs 0 8 1 9
Sum of E Hse Yrs 0 8 -1 7
Sum of Inc Loss 0 6,132 0 6,132
Sum of Inc Claims 0 2 0 2
Brockton 02305 Sum of WP 0 1,665 0 1,665
Sum of EP 0 2,199 0 2,199
Sum of W Hse Yrs 0 1 0 1
Sum of E Hse Yrs 0 2 0 2
Sum of Inc Loss 0 4,420 0 4,420
Sum of Inc Claims 0 2 0 2
Plymouth 02360 Sum of WP 1,052,458 23,819,147 250,192 25,121,797
Sum of EP 1,025,409 22,961,065 250,286 24,236,760
Sum of W Hse Yrs 2,096 15,827 1,171 19,093
Sum of E Hse Yrs 2,072 15,736 1,168 18,975
Sum of Inc Loss 510,386 15,446,412 41,745 15,998,543
Sum of Inc Claims 107 1,059 7 1,173
Plymouth 02361 Sum of WP 2,640 11,177 -68 13,749
Sum of EP 1,358 8,998 364 10,720
Sum of W Hse Yrs 4 6 -1 9
Sum of E Hse Yrs 2 6 1 9
Sum of Inc Loss 0 0 0 0
Sum of Inc Claims 0 0 0 0
Plymouth 02362 Sum of WP 340 31,495 471 32,306
Sum of EP 237 34,061 327 34,625
Sum of W Hse Yrs 1 16 4 21
Sum of E Hse Yrs 1 19 2 22
63
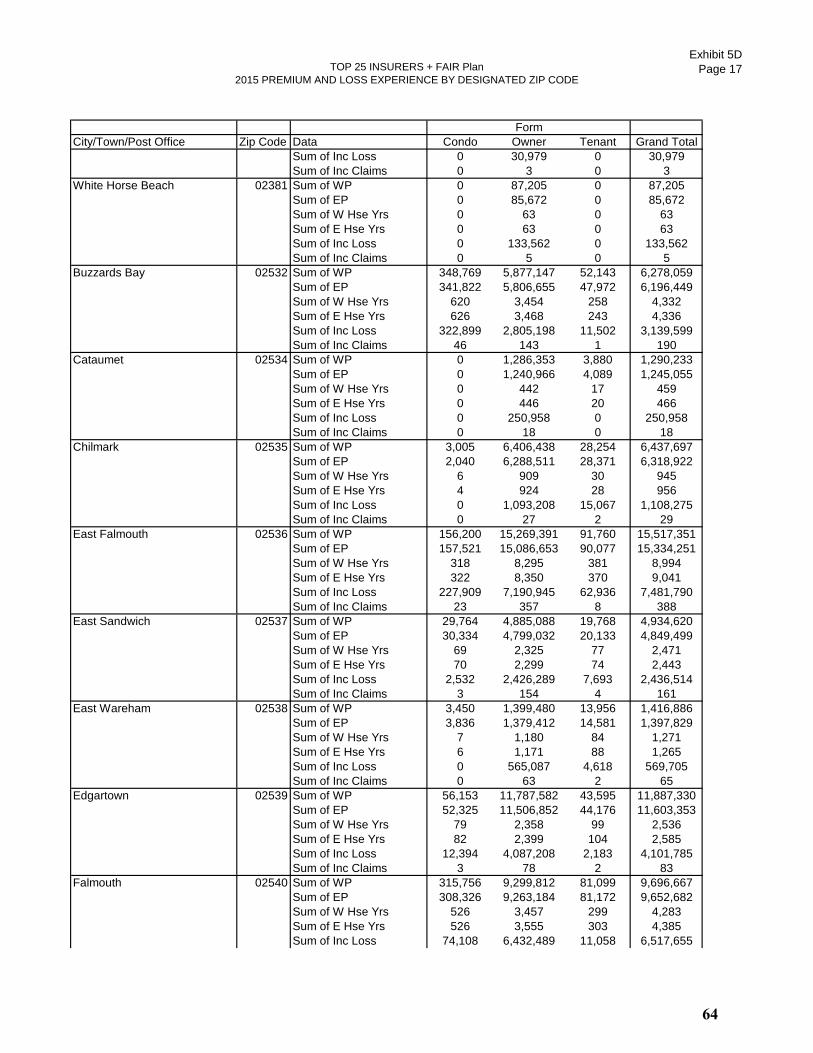
TOP 25 INSURERS + FAIR Plan
2015 PREMIUM AND LOSS EXPERIENCE BY DESIGNATED ZIP CODE
Exhibit 5D
Page 17
City/Town/Post Office Zip Code Data Condo Owner Tenant Grand Total
Form
Sum of Inc Loss 0 30,979 0 30,979
Sum of Inc Claims 0 3 0 3
White Horse Beach 02381 Sum of WP 0 87,205 0 87,205
Sum of EP 0 85,672 0 85,672
Sum of W Hse Yrs 0 63 0 63
Sum of E Hse Yrs 0 63 0 63
Sum of Inc Loss 0 133,562 0 133,562
Sum of Inc Claims 0 5 0 5
Buzzards Bay 02532 Sum of WP 348,769 5,877,147 52,143 6,278,059
Sum of EP 341,822 5,806,655 47,972 6,196,449
Sum of W Hse Yrs 620 3,454 258 4,332
Sum of E Hse Yrs 626 3,468 243 4,336
Sum of Inc Loss 322,899 2,805,198 11,502 3,139,599
Sum of Inc Claims 46 143 1 190
Cataumet 02534 Sum of WP 0 1,286,353 3,880 1,290,233
Sum of EP 0 1,240,966 4,089 1,245,055
Sum of W Hse Yrs 0 442 17 459
Sum of E Hse Yrs 0 446 20 466
Sum of Inc Loss 0 250,958 0 250,958
Sum of Inc Claims 0 18 0 18
Chilmark 02535 Sum of WP 3,005 6,406,438 28,254 6,437,697
Sum of EP 2,040 6,288,511 28,371 6,318,922
Sum of W Hse Yrs 6 909 30 945
Sum of E Hse Yrs 4 924 28 956
Sum of Inc Loss 0 1,093,208 15,067 1,108,275
Sum of Inc Claims 0 27 2 29
East Falmouth 02536 Sum of WP 156,200 15,269,391 91,760 15,517,351
Sum of EP 157,521 15,086,653 90,077 15,334,251
Sum of W Hse Yrs 318 8,295 381 8,994
Sum of E Hse Yrs 322 8,350 370 9,041
Sum of Inc Loss 227,909 7,190,945 62,936 7,481,790
Sum of Inc Claims 23 357 8 388
East Sandwich 02537 Sum of WP 29,764 4,885,088 19,768 4,934,620
Sum of EP 30,334 4,799,032 20,133 4,849,499
Sum of W Hse Yrs 69 2,325 77 2,471
Sum of E Hse Yrs 70 2,299 74 2,443
Sum of Inc Loss 2,532 2,426,289 7,693 2,436,514
Sum of Inc Claims 3 154 4 161
East Wareham 02538 Sum of WP 3,450 1,399,480 13,956 1,416,886
Sum of EP 3,836 1,379,412 14,581 1,397,829
Sum of W Hse Yrs 7 1,180 84 1,271
Sum of E Hse Yrs 6 1,171 88 1,265
Sum of Inc Loss 0 565,087 4,618 569,705
Sum of Inc Claims 0 63 2 65
Edgartown 02539 Sum of WP 56,153 11,787,582 43,595 11,887,330
Sum of EP 52,325 11,506,852 44,176 11,603,353
Sum of W Hse Yrs 79 2,358 99 2,536
Sum of E Hse Yrs 82 2,399 104 2,585
Sum of Inc Loss 12,394 4,087,208 2,183 4,101,785
Sum of Inc Claims 3 78 2 83
Falmouth 02540 Sum of WP 315,756 9,299,812 81,099 9,696,667
Sum of EP 308,326 9,263,184 81,172 9,652,682
Sum of W Hse Yrs 526 3,457 299 4,283
Sum of E Hse Yrs 526 3,555 303 4,385
Sum of Inc Loss 74,108 6,432,489 11,058 6,517,655
64
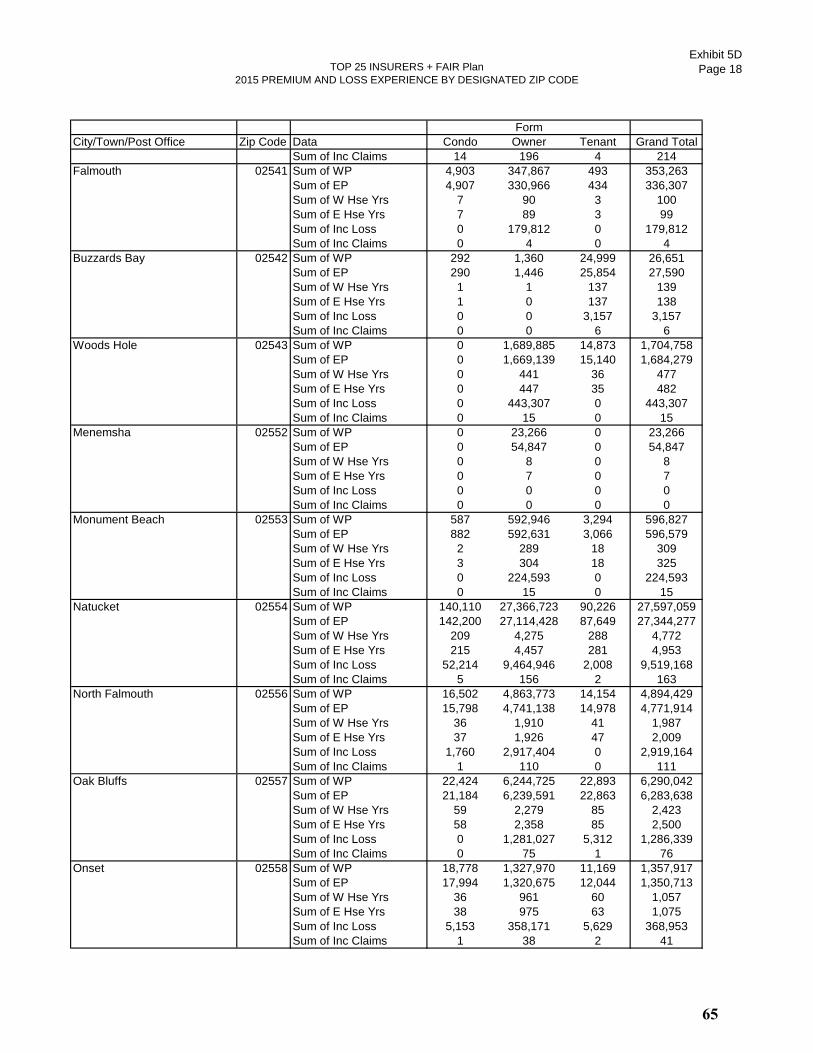
TOP 25 INSURERS + FAIR Plan
2015 PREMIUM AND LOSS EXPERIENCE BY DESIGNATED ZIP CODE
Exhibit 5D
Page 18
City/Town/Post Office Zip Code Data Condo Owner Tenant Grand Total
Form
Sum of Inc Claims 14 196 4 214
Falmouth 02541 Sum of WP 4,903 347,867 493 353,263
Sum of EP 4,907 330,966 434 336,307
Sum of W Hse Yrs 7 90 3 100
Sum of E Hse Yrs 7 89 3 99
Sum of Inc Loss 0 179,812 0 179,812
Sum of Inc Claims 0 4 0 4
Buzzards Bay 02542 Sum of WP 292 1,360 24,999 26,651
Sum of EP 290 1,446 25,854 27,590
Sum of W Hse Yrs 1 1 137 139
Sum of E Hse Yrs 1 0 137 138
Sum of Inc Loss 0 0 3,157 3,157
Sum of Inc Claims 0 0 6 6
Woods Hole 02543 Sum of WP 0 1,689,885 14,873 1,704,758
Sum of EP 0 1,669,139 15,140 1,684,279
Sum of W Hse Yrs 0 441 36 477
Sum of E Hse Yrs 0 447 35 482
Sum of Inc Loss 0 443,307 0 443,307
Sum of Inc Claims 0 15 0 15
Menemsha 02552 Sum of WP 0 23,266 0 23,266
Sum of EP 0 54,847 0 54,847
Sum of W Hse Yrs 0 8 0 8
Sum of E Hse Yrs 0 7 0 7
Sum of Inc Loss 0 0 0 0
Sum of Inc Claims 0 0 0 0
Monument Beach 02553 Sum of WP 587 592,946 3,294 596,827
Sum of EP 882 592,631 3,066 596,579
Sum of W Hse Yrs 2 289 18 309
Sum of E Hse Yrs 3 304 18 325
Sum of Inc Loss 0 224,593 0 224,593
Sum of Inc Claims 0 15 0 15
Natucket 02554 Sum of WP 140,110 27,366,723 90,226 27,597,059
Sum of EP 142,200 27,114,428 87,649 27,344,277
Sum of W Hse Yrs 209 4,275 288 4,772
Sum of E Hse Yrs 215 4,457 281 4,953
Sum of Inc Loss 52,214 9,464,946 2,008 9,519,168
Sum of Inc Claims 5 156 2 163
North Falmouth 02556 Sum of WP 16,502 4,863,773 14,154 4,894,429
Sum of EP 15,798 4,741,138 14,978 4,771,914
Sum of W Hse Yrs 36 1,910 41 1,987
Sum of E Hse Yrs 37 1,926 47 2,009
Sum of Inc Loss 1,760 2,917,404 0 2,919,164
Sum of Inc Claims 1 110 0 111
Oak Bluffs 02557 Sum of WP 22,424 6,244,725 22,893 6,290,042
Sum of EP 21,184 6,239,591 22,863 6,283,638
Sum of W Hse Yrs 59 2,279 85 2,423
Sum of E Hse Yrs 58 2,358 85 2,500
Sum of Inc Loss 0 1,281,027 5,312 1,286,339
Sum of Inc Claims 0 75 1 76
Onset 02558 Sum of WP 18,778 1,327,970 11,169 1,357,917
Sum of EP 17,994 1,320,675 12,044 1,350,713
Sum of W Hse Yrs 36 961 60 1,057
Sum of E Hse Yrs 38 975 63 1,075
Sum of Inc Loss 5,153 358,171 5,629 368,953
Sum of Inc Claims 1 38 2 41
65
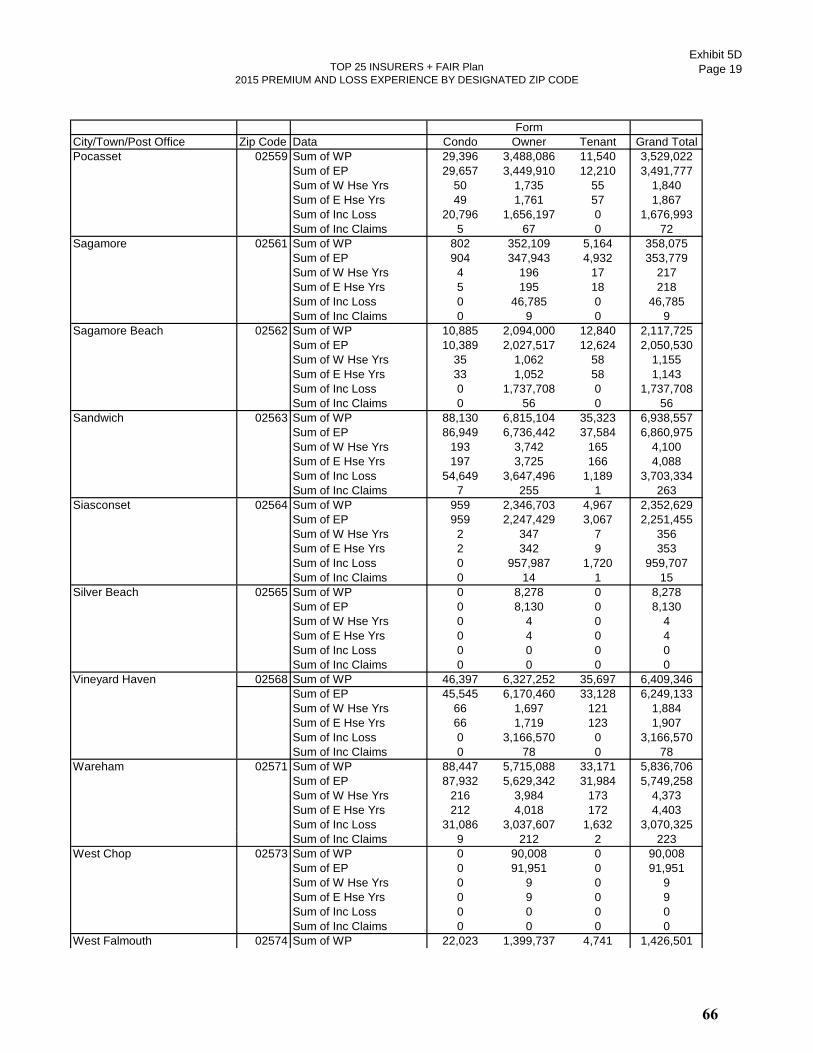
TOP 25 INSURERS + FAIR Plan
2015 PREMIUM AND LOSS EXPERIENCE BY DESIGNATED ZIP CODE
Exhibit 5D
Page 19
City/Town/Post Office Zip Code Data Condo Owner Tenant Grand Total
Form
Pocasset 02559 Sum of WP 29,396 3,488,086 11,540 3,529,022
Sum of EP 29,657 3,449,910 12,210 3,491,777
Sum of W Hse Yrs 50 1,735 55 1,840
Sum of E Hse Yrs 49 1,761 57 1,867
Sum of Inc Loss 20,796 1,656,197 0 1,676,993
Sum of Inc Claims 5 67 0 72
Sagamore 02561 Sum of WP 802 352,109 5,164 358,075
Sum of EP 904 347,943 4,932 353,779
Sum of W Hse Yrs 4 196 17 217
Sum of E Hse Yrs 5 195 18 218
Sum of Inc Loss 0 46,785 0 46,785
Sum of Inc Claims 0 9 0 9
Sagamore Beach 02562 Sum of WP 10,885 2,094,000 12,840 2,117,725
Sum of EP 10,389 2,027,517 12,624 2,050,530
Sum of W Hse Yrs 35 1,062 58 1,155
Sum of E Hse Yrs 33 1,052 58 1,143
Sum of Inc Loss 0 1,737,708 0 1,737,708
Sum of Inc Claims 0 56 0 56
Sandwich 02563 Sum of WP 88,130 6,815,104 35,323 6,938,557
Sum of EP 86,949 6,736,442 37,584 6,860,975
Sum of W Hse Yrs 193 3,742 165 4,100
Sum of E Hse Yrs 197 3,725 166 4,088
Sum of Inc Loss 54,649 3,647,496 1,189 3,703,334
Sum of Inc Claims 7 255 1 263
Siasconset 02564 Sum of WP 959 2,346,703 4,967 2,352,629
Sum of EP 959 2,247,429 3,067 2,251,455
Sum of W Hse Yrs 2 347 7 356
Sum of E Hse Yrs 2 342 9 353
Sum of Inc Loss 0 957,987 1,720 959,707
Sum of Inc Claims 0 14 1 15
Silver Beach 02565 Sum of WP 0 8,278 0 8,278
Sum of EP 0 8,130 0 8,130
Sum of W Hse Yrs 0 4 0 4
Sum of E Hse Yrs 0 4 0 4
Sum of Inc Loss 0 0 0 0
Sum of Inc Claims 0 0 0 0
Vineyard Haven 02568 Sum of WP 46,397 6,327,252 35,697 6,409,346
Sum of EP 45,545 6,170,460 33,128 6,249,133
Sum of W Hse Yrs 66 1,697 121 1,884
Sum of E Hse Yrs 66 1,719 123 1,907
Sum of Inc Loss 0 3,166,570 0 3,166,570
Sum of Inc Claims 0 78 0 78
Wareham 02571 Sum of WP 88,447 5,715,088 33,171 5,836,706
Sum of EP 87,932 5,629,342 31,984 5,749,258
Sum of W Hse Yrs 216 3,984 173 4,373
Sum of E Hse Yrs 212 4,018 172 4,403
Sum of Inc Loss 31,086 3,037,607 1,632 3,070,325
Sum of Inc Claims 9 212 2 223
West Chop 02573 Sum of WP 0 90,008 0 90,008
Sum of EP 0 91,951 0 91,951
Sum of W Hse Yrs 0 9 0 9
Sum of E Hse Yrs 0 9 0 9
Sum of Inc Loss 0 0 0 0
Sum of Inc Claims 0 0 0 0
West Falmouth 02574 Sum of WP 22,023 1,399,737 4,741 1,426,501
66
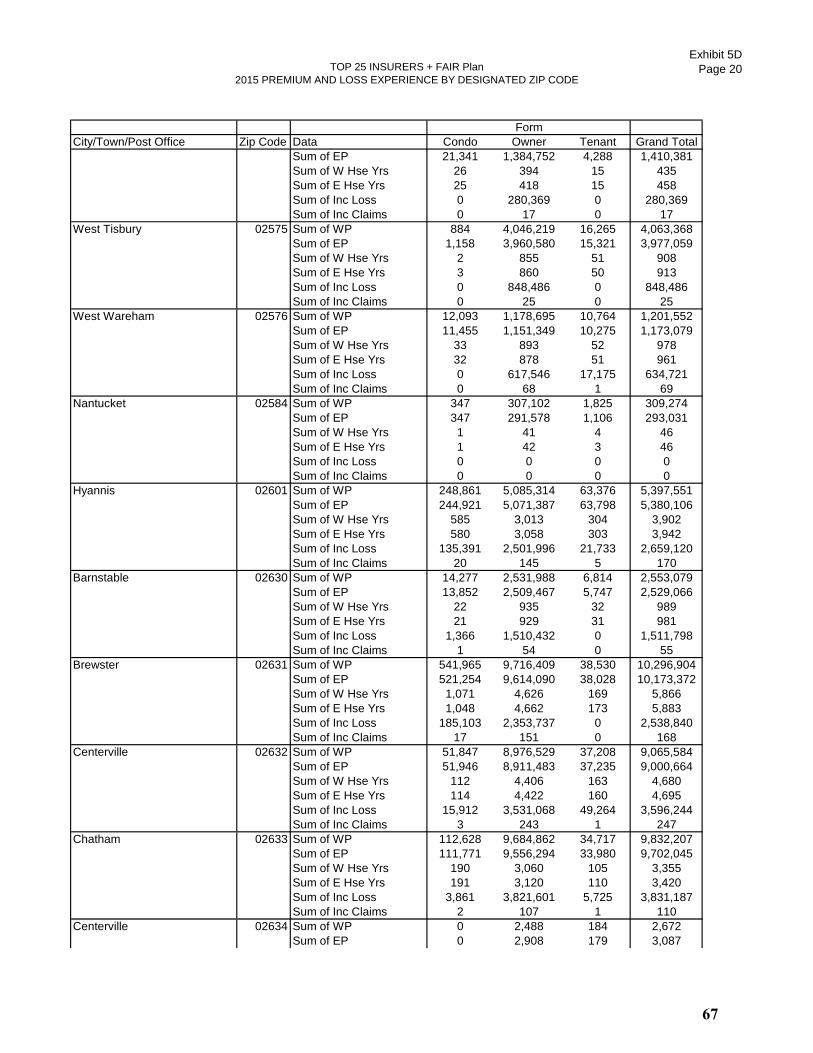
TOP 25 INSURERS + FAIR Plan
2015 PREMIUM AND LOSS EXPERIENCE BY DESIGNATED ZIP CODE
Exhibit 5D
Page 20
City/Town/Post Office Zip Code Data Condo Owner Tenant Grand Total
Form
Sum of EP 21,341 1,384,752 4,288 1,410,381
Sum of W Hse Yrs 26 394 15 435
Sum of E Hse Yrs 25 418 15 458
Sum of Inc Loss 0 280,369 0 280,369
Sum of Inc Claims 0 17 0 17
West Tisbury 02575 Sum of WP 884 4,046,219 16,265 4,063,368
Sum of EP 1,158 3,960,580 15,321 3,977,059
Sum of W Hse Yrs 2 855 51 908
Sum of E Hse Yrs 3 860 50 913
Sum of Inc Loss 0 848,486 0 848,486
Sum of Inc Claims 0 25 0 25
West Wareham 02576 Sum of WP 12,093 1,178,695 10,764 1,201,552
Sum of EP 11,455 1,151,349 10,275 1,173,079
Sum of W Hse Yrs 33 893 52 978
Sum of E Hse Yrs 32 878 51 961
Sum of Inc Loss 0 617,546 17,175 634,721
Sum of Inc Claims 0 68 1 69
Nantucket 02584 Sum of WP 347 307,102 1,825 309,274
Sum of EP 347 291,578 1,106 293,031
Sum of W Hse Yrs 1 41 4 46
Sum of E Hse Yrs 1 42 3 46
Sum of Inc Loss 0 0 0 0
Sum of Inc Claims 0 0 0 0
Hyannis 02601 Sum of WP 248,861 5,085,314 63,376 5,397,551
Sum of EP 244,921 5,071,387 63,798 5,380,106
Sum of W Hse Yrs 585 3,013 304 3,902
Sum of E Hse Yrs 580 3,058 303 3,942
Sum of Inc Loss 135,391 2,501,996 21,733 2,659,120
Sum of Inc Claims 20 145 5 170
Barnstable 02630 Sum of WP 14,277 2,531,988 6,814 2,553,079
Sum of EP 13,852 2,509,467 5,747 2,529,066
Sum of W Hse Yrs 22 935 32 989
Sum of E Hse Yrs 21 929 31 981
Sum of Inc Loss 1,366 1,510,432 0 1,511,798
Sum of Inc Claims 1 54 0 55
Brewster 02631 Sum of WP 541,965 9,716,409 38,530 10,296,904
Sum of EP 521,254 9,614,090 38,028 10,173,372
Sum of W Hse Yrs 1,071 4,626 169 5,866
Sum of E Hse Yrs 1,048 4,662 173 5,883
Sum of Inc Loss 185,103 2,353,737 0 2,538,840
Sum of Inc Claims 17 151 0 168
Centerville 02632 Sum of WP 51,847 8,976,529 37,208 9,065,584
Sum of EP 51,946 8,911,483 37,235 9,000,664
Sum of W Hse Yrs 112 4,406 163 4,680
Sum of E Hse Yrs 114 4,422 160 4,695
Sum of Inc Loss 15,912 3,531,068 49,264 3,596,244
Sum of Inc Claims 3 243 1 247
Chatham 02633 Sum of WP 112,628 9,684,862 34,717 9,832,207
Sum of EP 111,771 9,556,294 33,980 9,702,045
Sum of W Hse Yrs 190 3,060 105 3,355
Sum of E Hse Yrs 191 3,120 110 3,420
Sum of Inc Loss 3,861 3,821,601 5,725 3,831,187
Sum of Inc Claims 2 107 1 110
Centerville 02634 Sum of WP 0 2,488 184 2,672
Sum of EP 0 2,908 179 3,087
67

TOP 25 INSURERS + FAIR Plan
2015 PREMIUM AND LOSS EXPERIENCE BY DESIGNATED ZIP CODE
Exhibit 5D
Page 21
City/Town/Post Office Zip Code Data Condo Owner Tenant Grand Total
Form
Sum of W Hse Yrs 0 1 1 2
Sum of E Hse Yrs 0 2 1 3
Sum of Inc Loss 0 0 0 0
Sum of Inc Claims 0 0 0 0
Cotuit 02635 Sum of WP 5,262 4,800,302 14,774 4,820,338
Sum of EP 5,193 4,626,183 13,912 4,645,288
Sum of W Hse Yrs 10 1,744 51 1,805
Sum of E Hse Yrs 10 1,712 45 1,766
Sum of Inc Loss 0 1,723,738 0 1,723,738
Sum of Inc Claims 0 87 0 87
Centerville 02636 Sum of WP 0 53,889 0 53,889
Sum of EP 0 57,600 0 57,600
Sum of W Hse Yrs 0 12 0 12
Sum of E Hse Yrs 0 16 0 16
Sum of Inc Loss 0 10,236 0 10,236
Sum of Inc Claims 0 1 0 1
Cummaquid 02637 Sum of WP 3,939 631,149 2,115 637,203
Sum of EP 4,091 630,820 2,120 637,031
Sum of W Hse Yrs 6 250 5 261
Sum of E Hse Yrs 7 251 7 265
Sum of Inc Loss 0 305,412 0 305,412
Sum of Inc Claims 0 12 0 12
Dennis 02638 Sum of WP 89,439 4,868,972 14,711 4,973,122
Sum of EP 86,404 4,801,272 13,812 4,901,488
Sum of W Hse Yrs 193 2,250 61 2,505
Sum of E Hse Yrs 196 2,262 58 2,516
Sum of Inc Loss 107,822 3,355,512 7,057 3,470,391
Sum of Inc Claims 11 118 2 131
Dennisport 02639 Sum of WP 159,309 3,596,103 22,579 3,777,991
Sum of EP 153,679 3,533,737 22,376 3,709,792
Sum of W Hse Yrs 460 2,618 123 3,201
Sum of E Hse Yrs 457 2,647 120 3,223
Sum of Inc Loss 35,453 897,486 0 932,939
Sum of Inc Claims 10 79 0 89
East Dennis 02641 Sum of WP 13,236 2,520,824 5,049 2,539,109
Sum of EP 12,878 2,488,807 5,242 2,506,927
Sum of W Hse Yrs 35 969 17 1,021
Sum of E Hse Yrs 34 972 15 1,021
Sum of Inc Loss 0 664,657 0 664,657
Sum of Inc Claims 0 45 0 45
Eastham 02642 Sum of WP 54,567 7,714,306 20,897 7,789,770
Sum of EP 53,033 7,571,744 21,443 7,646,220
Sum of W Hse Yrs 101 3,576 72 3,749
Sum of E Hse Yrs 98 3,594 70 3,761
Sum of Inc Loss 2,235 3,046,464 0 3,048,699
Sum of Inc Claims 1 105 0 106
East Orleans 02643 Sum of WP 8,520 1,484,909 2,716 1,496,145
Sum of EP 9,760 1,485,042 2,831 1,497,633
Sum of W Hse Yrs 15 465 5 485
Sum of E Hse Yrs 15 480 6 500
Sum of Inc Loss 0 1,514,947 0 1,514,947
Sum of Inc Claims 0 19 0 19
Forestdale 02644 Sum of WP 5,495 1,900,097 13,761 1,919,353
Sum of EP 5,163 1,869,530 12,485 1,887,178
Sum of W Hse Yrs 13 1,182 55 1,249
68
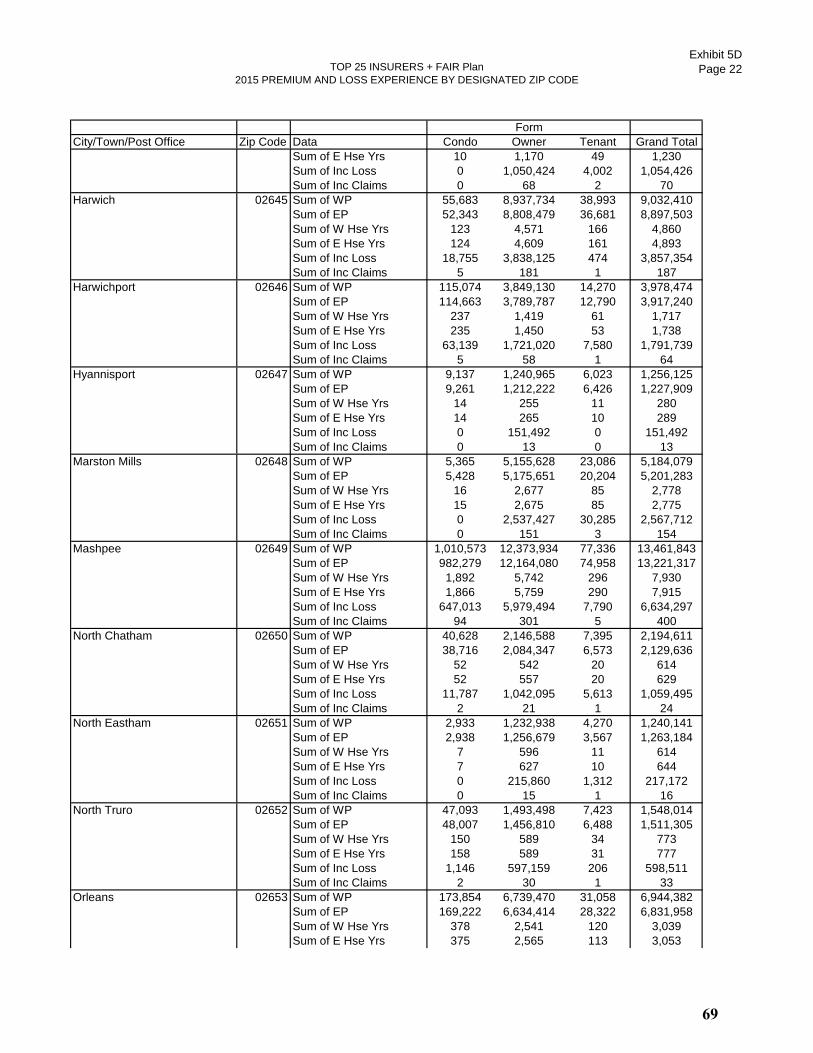
TOP 25 INSURERS + FAIR Plan
2015 PREMIUM AND LOSS EXPERIENCE BY DESIGNATED ZIP CODE
Exhibit 5D
Page 22
City/Town/Post Office Zip Code Data Condo Owner Tenant Grand Total
Form
Sum of E Hse Yrs 10 1,170 49 1,230
Sum of Inc Loss 0 1,050,424 4,002 1,054,426
Sum of Inc Claims 0 68 2 70
Harwich 02645 Sum of WP 55,683 8,937,734 38,993 9,032,410
Sum of EP 52,343 8,808,479 36,681 8,897,503
Sum of W Hse Yrs 123 4,571 166 4,860
Sum of E Hse Yrs 124 4,609 161 4,893
Sum of Inc Loss 18,755 3,838,125 474 3,857,354
Sum of Inc Claims 5 181 1 187
Harwichport 02646 Sum of WP 115,074 3,849,130 14,270 3,978,474
Sum of EP 114,663 3,789,787 12,790 3,917,240
Sum of W Hse Yrs 237 1,419 61 1,717
Sum of E Hse Yrs 235 1,450 53 1,738
Sum of Inc Loss 63,139 1,721,020 7,580 1,791,739
Sum of Inc Claims 5 58 1 64
Hyannisport 02647 Sum of WP 9,137 1,240,965 6,023 1,256,125
Sum of EP 9,261 1,212,222 6,426 1,227,909
Sum of W Hse Yrs 14 255 11 280
Sum of E Hse Yrs 14 265 10 289
Sum of Inc Loss 0 151,492 0 151,492
Sum of Inc Claims 0 13 0 13
Marston Mills 02648 Sum of WP 5,365 5,155,628 23,086 5,184,079
Sum of EP 5,428 5,175,651 20,204 5,201,283
Sum of W Hse Yrs 16 2,677 85 2,778
Sum of E Hse Yrs 15 2,675 85 2,775
Sum of Inc Loss 0 2,537,427 30,285 2,567,712
Sum of Inc Claims 0 151 3 154
Mashpee 02649 Sum of WP 1,010,573 12,373,934 77,336 13,461,843
Sum of EP 982,279 12,164,080 74,958 13,221,317
Sum of W Hse Yrs 1,892 5,742 296 7,930
Sum of E Hse Yrs 1,866 5,759 290 7,915
Sum of Inc Loss 647,013 5,979,494 7,790 6,634,297
Sum of Inc Claims 94 301 5 400
North Chatham 02650 Sum of WP 40,628 2,146,588 7,395 2,194,611
Sum of EP 38,716 2,084,347 6,573 2,129,636
Sum of W Hse Yrs 52 542 20 614
Sum of E Hse Yrs 52 557 20 629
Sum of Inc Loss 11,787 1,042,095 5,613 1,059,495
Sum of Inc Claims 2 21 1 24
North Eastham 02651 Sum of WP 2,933 1,232,938 4,270 1,240,141
Sum of EP 2,938 1,256,679 3,567 1,263,184
Sum of W Hse Yrs 7 596 11 614
Sum of E Hse Yrs 7 627 10 644
Sum of Inc Loss 0 215,860 1,312 217,172
Sum of Inc Claims 0 15 1 16
North Truro 02652 Sum of WP 47,093 1,493,498 7,423 1,548,014
Sum of EP 48,007 1,456,810 6,488 1,511,305
Sum of W Hse Yrs 150 589 34 773
Sum of E Hse Yrs 158 589 31 777
Sum of Inc Loss 1,146 597,159 206 598,511
Sum of Inc Claims 2 30 1 33
Orleans 02653 Sum of WP 173,854 6,739,470 31,058 6,944,382
Sum of EP 169,222 6,634,414 28,322 6,831,958
Sum of W Hse Yrs 378 2,541 120 3,039
Sum of E Hse Yrs 375 2,565 113 3,053
69

TOP 25 INSURERS + FAIR Plan
2015 PREMIUM AND LOSS EXPERIENCE BY DESIGNATED ZIP CODE
Exhibit 5D
Page 23
City/Town/Post Office Zip Code Data Condo Owner Tenant Grand Total
Form
Sum of Inc Loss 36,519 2,873,988 13,626 2,924,133
Sum of Inc Claims 17 99 3 119
Osterville 02655 Sum of WP 119,009 8,853,035 33,583 9,005,627
Sum of EP 119,412 8,740,031 37,510 8,896,953
Sum of W Hse Yrs 163 1,911 96 2,170
Sum of E Hse Yrs 161 1,929 92 2,181
Sum of Inc Loss 110,580 4,314,467 3,251 4,428,298
Sum of Inc Claims 7 105 1 113
Provincetown 02657 Sum of WP 665,133 2,289,135 35,741 2,990,009
Sum of EP 647,084 2,249,635 36,494 2,933,213
Sum of W Hse Yrs 1,510 930 148 2,588
Sum of E Hse Yrs 1,502 943 151 2,596
Sum of Inc Loss 287,629 1,096,484 2,945 1,387,058
Sum of Inc Claims 44 39 1 84
South Chatham 02659 Sum of WP 13,104 1,754,732 4,940 1,772,776
Sum of EP 12,727 1,725,789 4,524 1,743,040
Sum of W Hse Yrs 29 824 17 870
Sum of E Hse Yrs 27 833 18 878
Sum of Inc Loss 2,407 1,081,752 0 1,084,159
Sum of Inc Claims 1 36 0 37
South Dennis 02660 Sum of WP 33,870 4,592,521 33,390 4,659,781
Sum of EP 33,240 4,518,880 31,689 4,583,809
Sum of W Hse Yrs 85 2,754 136 2,974
Sum of E Hse Yrs 88 2,738 129 2,955
Sum of Inc Loss 6,815 1,580,460 13,639 1,600,914
Sum of Inc Claims 2 93 2 97
South Harwich 02661 Sum of WP 1,734 487,712 1,708 491,154
Sum of EP 1,814 505,550 1,443 508,807
Sum of W Hse Yrs 4 226 8 238
Sum of E Hse Yrs 4 239 7 250
Sum of Inc Loss 0 51,887 0 51,887
Sum of Inc Claims 0 8 0 8
South Orleans 02662 Sum of WP 1,249 628,288 4,709 634,246
Sum of EP 1,381 670,289 6,144 677,814
Sum of W Hse Yrs 4 224 6 234
Sum of E Hse Yrs 3 230 8 241
Sum of Inc Loss 0 325,094 0 325,094
Sum of Inc Claims 0 6 0 6
South Wellfleet 02663 Sum of WP 6,267 703,000 1,149 710,416
Sum of EP 6,376 710,427 1,210 718,013
Sum of W Hse Yrs 15 348 5 368
Sum of E Hse Yrs 16 360 6 382
Sum of Inc Loss 0 240,234 0 240,234
Sum of Inc Claims 0 11 0 11
South Yarmouth 02664 Sum of WP 36,863 7,447,431 64,643 7,548,937
Sum of EP 34,301 7,342,758 64,273 7,441,332
Sum of W Hse Yrs 98 4,334 270 4,702
Sum of E Hse Yrs 93 4,369 266 4,728
Sum of Inc Loss 49,724 2,841,184 5,404 2,896,312
Sum of Inc Claims 3 147 5 155
Truro 02666 Sum of WP 18,031 3,493,802 6,554 3,518,387
Sum of EP 17,514 3,422,234 6,304 3,446,052
Sum of W Hse Yrs 49 1,217 26 1,292
Sum of E Hse Yrs 49 1,227 25 1,301
Sum of Inc Loss 1,337 324,527 0 325,864
70
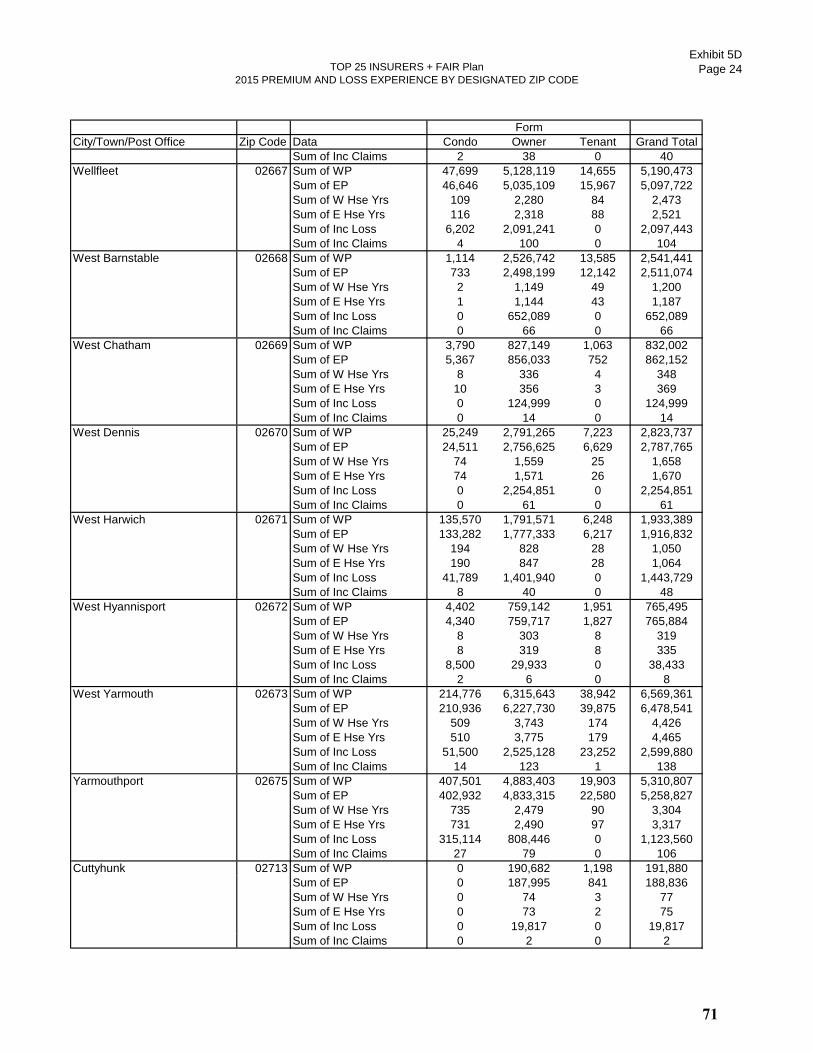
TOP 25 INSURERS + FAIR Plan
2015 PREMIUM AND LOSS EXPERIENCE BY DESIGNATED ZIP CODE
Exhibit 5D
Page 24
City/Town/Post Office Zip Code Data Condo Owner Tenant Grand Total
Form
Sum of Inc Claims 2 38 0 40
Wellfleet 02667 Sum of WP 47,699 5,128,119 14,655 5,190,473
Sum of EP 46,646 5,035,109 15,967 5,097,722
Sum of W Hse Yrs 109 2,280 84 2,473
Sum of E Hse Yrs 116 2,318 88 2,521
Sum of Inc Loss 6,202 2,091,241 0 2,097,443
Sum of Inc Claims 4 100 0 104
West Barnstable 02668 Sum of WP 1,114 2,526,742 13,585 2,541,441
Sum of EP 733 2,498,199 12,142 2,511,074
Sum of W Hse Yrs 2 1,149 49 1,200
Sum of E Hse Yrs 1 1,144 43 1,187
Sum of Inc Loss 0 652,089 0 652,089
Sum of Inc Claims 0 66 0 66
West Chatham 02669 Sum of WP 3,790 827,149 1,063 832,002
Sum of EP 5,367 856,033 752 862,152
Sum of W Hse Yrs 8 336 4 348
Sum of E Hse Yrs 10 356 3 369
Sum of Inc Loss 0 124,999 0 124,999
Sum of Inc Claims 0 14 0 14
West Dennis 02670 Sum of WP 25,249 2,791,265 7,223 2,823,737
Sum of EP 24,511 2,756,625 6,629 2,787,765
Sum of W Hse Yrs 74 1,559 25 1,658
Sum of E Hse Yrs 74 1,571 26 1,670
Sum of Inc Loss 0 2,254,851 0 2,254,851
Sum of Inc Claims 0 61 0 61
West Harwich 02671 Sum of WP 135,570 1,791,571 6,248 1,933,389
Sum of EP 133,282 1,777,333 6,217 1,916,832
Sum of W Hse Yrs 194 828 28 1,050
Sum of E Hse Yrs 190 847 28 1,064
Sum of Inc Loss 41,789 1,401,940 0 1,443,729
Sum of Inc Claims 8 40 0 48
West Hyannisport 02672 Sum of WP 4,402 759,142 1,951 765,495
Sum of EP 4,340 759,717 1,827 765,884
Sum of W Hse Yrs 8 303 8 319
Sum of E Hse Yrs 8 319 8 335
Sum of Inc Loss 8,500 29,933 0 38,433
Sum of Inc Claims 2 6 0 8
West Yarmouth 02673 Sum of WP 214,776 6,315,643 38,942 6,569,361
Sum of EP 210,936 6,227,730 39,875 6,478,541
Sum of W Hse Yrs 509 3,743 174 4,426
Sum of E Hse Yrs 510 3,775 179 4,465
Sum of Inc Loss 51,500 2,525,128 23,252 2,599,880
Sum of Inc Claims 14 123 1 138
Yarmouthport 02675 Sum of WP 407,501 4,883,403 19,903 5,310,807
Sum of EP 402,932 4,833,315 22,580 5,258,827
Sum of W Hse Yrs 735 2,479 90 3,304
Sum of E Hse Yrs 731 2,490 97 3,317
Sum of Inc Loss 315,114 808,446 0 1,123,560
Sum of Inc Claims 27 79 0 106
Cuttyhunk 02713 Sum of WP 0 190,682 1,198 191,880
Sum of EP 0 187,995 841 188,836
Sum of W Hse Yrs 0 74 3 77
Sum of E Hse Yrs 0 73 2 75
Sum of Inc Loss 0 19,817 0 19,817
Sum of Inc Claims 0 2 0 2
71
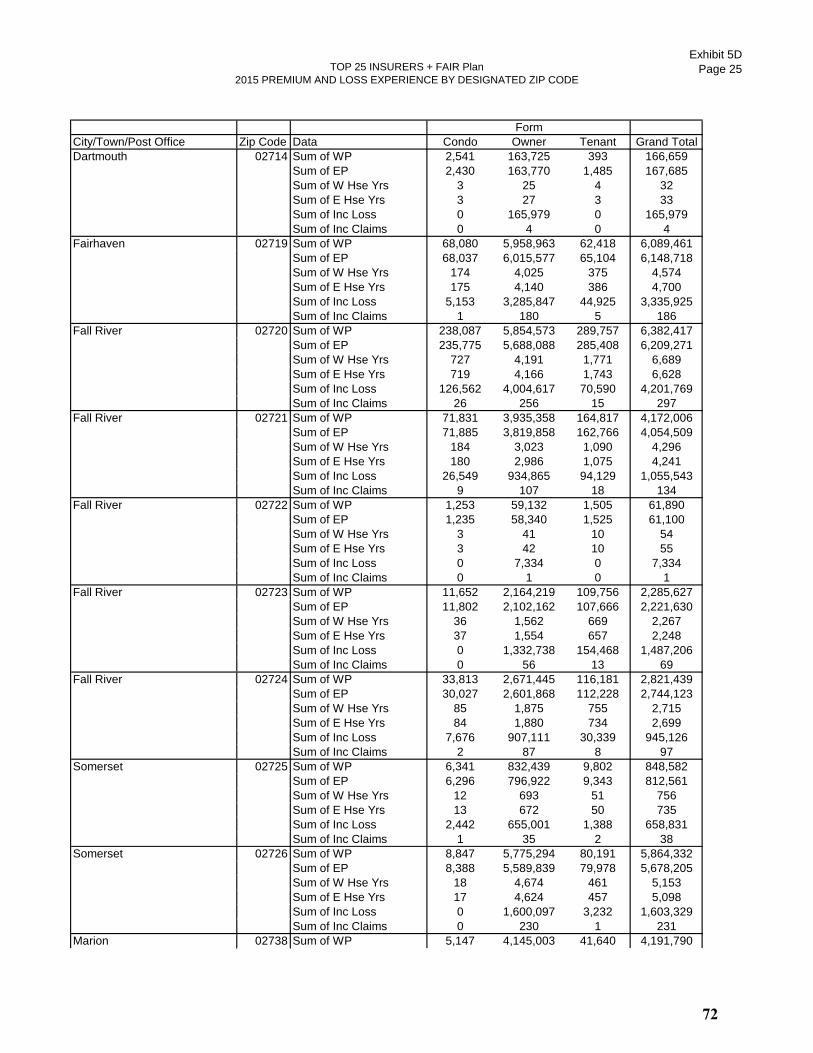
TOP 25 INSURERS + FAIR Plan
2015 PREMIUM AND LOSS EXPERIENCE BY DESIGNATED ZIP CODE
Exhibit 5D
Page 25
City/Town/Post Office Zip Code Data Condo Owner Tenant Grand Total
Form
Dartmouth 02714 Sum of WP 2,541 163,725 393 166,659
Sum of EP 2,430 163,770 1,485 167,685
Sum of W Hse Yrs 3 25 4 32
Sum of E Hse Yrs 3 27 3 33
Sum of Inc Loss 0 165,979 0 165,979
Sum of Inc Claims 0 4 0 4
Fairhaven 02719 Sum of WP 68,080 5,958,963 62,418 6,089,461
Sum of EP 68,037 6,015,577 65,104 6,148,718
Sum of W Hse Yrs 174 4,025 375 4,574
Sum of E Hse Yrs 175 4,140 386 4,700
Sum of Inc Loss 5,153 3,285,847 44,925 3,335,925
Sum of Inc Claims 1 180 5 186
Fall River 02720 Sum of WP 238,087 5,854,573 289,757 6,382,417
Sum of EP 235,775 5,688,088 285,408 6,209,271
Sum of W Hse Yrs 727 4,191 1,771 6,689
Sum of E Hse Yrs 719 4,166 1,743 6,628
Sum of Inc Loss 126,562 4,004,617 70,590 4,201,769
Sum of Inc Claims 26 256 15 297
Fall River 02721 Sum of WP 71,831 3,935,358 164,817 4,172,006
Sum of EP 71,885 3,819,858 162,766 4,054,509
Sum of W Hse Yrs 184 3,023 1,090 4,296
Sum of E Hse Yrs 180 2,986 1,075 4,241
Sum of Inc Loss 26,549 934,865 94,129 1,055,543
Sum of Inc Claims 9 107 18 134
Fall River 02722 Sum of WP 1,253 59,132 1,505 61,890
Sum of EP 1,235 58,340 1,525 61,100
Sum of W Hse Yrs 3 41 10 54
Sum of E Hse Yrs 3 42 10 55
Sum of Inc Loss 0 7,334 0 7,334
Sum of Inc Claims 0 1 0 1
Fall River 02723 Sum of WP 11,652 2,164,219 109,756 2,285,627
Sum of EP 11,802 2,102,162 107,666 2,221,630
Sum of W Hse Yrs 36 1,562 669 2,267
Sum of E Hse Yrs 37 1,554 657 2,248
Sum of Inc Loss 0 1,332,738 154,468 1,487,206
Sum of Inc Claims 0 56 13 69
Fall River 02724 Sum of WP 33,813 2,671,445 116,181 2,821,439
Sum of EP 30,027 2,601,868 112,228 2,744,123
Sum of W Hse Yrs 85 1,875 755 2,715
Sum of E Hse Yrs 84 1,880 734 2,699
Sum of Inc Loss 7,676 907,111 30,339 945,126
Sum of Inc Claims 2 87 8 97
Somerset 02725 Sum of WP 6,341 832,439 9,802 848,582
Sum of EP 6,296 796,922 9,343 812,561
Sum of W Hse Yrs 12 693 51 756
Sum of E Hse Yrs 13 672 50 735
Sum of Inc Loss 2,442 655,001 1,388 658,831
Sum of Inc Claims 1 35 2 38
Somerset 02726 Sum of WP 8,847 5,775,294 80,191 5,864,332
Sum of EP 8,388 5,589,839 79,978 5,678,205
Sum of W Hse Yrs 18 4,674 461 5,153
Sum of E Hse Yrs 17 4,624 457 5,098
Sum of Inc Loss 0 1,600,097 3,232 1,603,329
Sum of Inc Claims 0 230 1 231
Marion 02738 Sum of WP 5,147 4,145,003 41,640 4,191,790
72
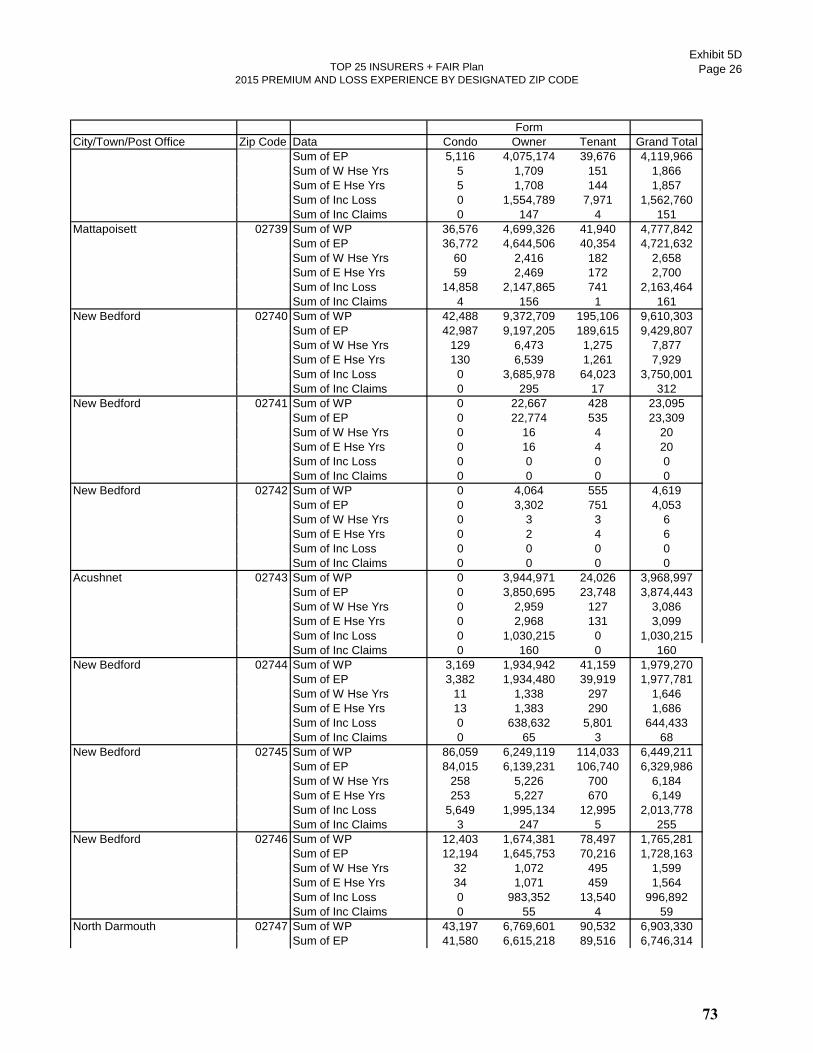
TOP 25 INSURERS + FAIR Plan
2015 PREMIUM AND LOSS EXPERIENCE BY DESIGNATED ZIP CODE
Exhibit 5D
Page 26
City/Town/Post Office Zip Code Data Condo Owner Tenant Grand Total
Form
Sum of EP 5,116 4,075,174 39,676 4,119,966
Sum of W Hse Yrs 5 1,709 151 1,866
Sum of E Hse Yrs 5 1,708 144 1,857
Sum of Inc Loss 0 1,554,789 7,971 1,562,760
Sum of Inc Claims 0 147 4 151
Mattapoisett 02739 Sum of WP 36,576 4,699,326 41,940 4,777,842
Sum of EP 36,772 4,644,506 40,354 4,721,632
Sum of W Hse Yrs 60 2,416 182 2,658
Sum of E Hse Yrs 59 2,469 172 2,700
Sum of Inc Loss 14,858 2,147,865 741 2,163,464
Sum of Inc Claims 4 156 1 161
New Bedford 02740 Sum of WP 42,488 9,372,709 195,106 9,610,303
Sum of EP 42,987 9,197,205 189,615 9,429,807
Sum of W Hse Yrs 129 6,473 1,275 7,877
Sum of E Hse Yrs 130 6,539 1,261 7,929
Sum of Inc Loss 0 3,685,978 64,023 3,750,001
Sum of Inc Claims 0 295 17 312
New Bedford 02741 Sum of WP 0 22,667 428 23,095
Sum of EP 0 22,774 535 23,309
Sum of W Hse Yrs 0 16 4 20
Sum of E Hse Yrs 0 16 4 20
Sum of Inc Loss 0 0 0 0
Sum of Inc Claims 0 0 0 0
New Bedford 02742 Sum of WP 0 4,064 555 4,619
Sum of EP 0 3,302 751 4,053
Sum of W Hse Yrs 0 3 3 6
Sum of E Hse Yrs 0 2 4 6
Sum of Inc Loss 0 0 0 0
Sum of Inc Claims 0 0 0 0
Acushnet 02743 Sum of WP 0 3,944,971 24,026 3,968,997
Sum of EP 0 3,850,695 23,748 3,874,443
Sum of W Hse Yrs 0 2,959 127 3,086
Sum of E Hse Yrs 0 2,968 131 3,099
Sum of Inc Loss 0 1,030,215 0 1,030,215
Sum of Inc Claims 0 160 0 160
New Bedford 02744 Sum of WP 3,169 1,934,942 41,159 1,979,270
Sum of EP 3,382 1,934,480 39,919 1,977,781
Sum of W Hse Yrs 11 1,338 297 1,646
Sum of E Hse Yrs 13 1,383 290 1,686
Sum of Inc Loss 0 638,632 5,801 644,433
Sum of Inc Claims 0 65 3 68
New Bedford 02745 Sum of WP 86,059 6,249,119 114,033 6,449,211
Sum of EP 84,015 6,139,231 106,740 6,329,986
Sum of W Hse Yrs 258 5,226 700 6,184
Sum of E Hse Yrs 253 5,227 670 6,149
Sum of Inc Loss 5,649 1,995,134 12,995 2,013,778
Sum of Inc Claims 3 247 5 255
New Bedford 02746 Sum of WP 12,403 1,674,381 78,497 1,765,281
Sum of EP 12,194 1,645,753 70,216 1,728,163
Sum of W Hse Yrs 32 1,072 495 1,599
Sum of E Hse Yrs 34 1,071 459 1,564
Sum of Inc Loss 0 983,352 13,540 996,892
Sum of Inc Claims 0 55 4 59
North Darmouth 02747 Sum of WP 43,197 6,769,601 90,532 6,903,330
Sum of EP 41,580 6,615,218 89,516 6,746,314
73

TOP 25 INSURERS + FAIR Plan
2015 PREMIUM AND LOSS EXPERIENCE BY DESIGNATED ZIP CODE
Exhibit 5D
Page 27
City/Town/Post Office Zip Code Data Condo Owner Tenant Grand Total
Form
Sum of W Hse Yrs 73 4,851 479 5,403
Sum of E Hse Yrs 71 4,851 475 5,397
Sum of Inc Loss 23,403 2,559,716 28,060 2,611,179
Sum of Inc Claims 5 307 4 316
South Darmouth 02748 Sum of WP 151,778 7,131,534 61,995 7,345,307
Sum of EP 144,922 7,068,944 58,839 7,272,705
Sum of W Hse Yrs 206 3,454 294 3,953
Sum of E Hse Yrs 206 3,495 284 3,986
Sum of Inc Loss 79,240 1,949,057 5,009 2,033,306
Sum of Inc Claims 18 161 2 181
Swansea 02777 Sum of WP 8,591 6,022,976 49,820 6,081,387
Sum of EP 8,534 5,821,096 48,399 5,878,029
Sum of W Hse Yrs 23 4,789 268 5,081
Sum of E Hse Yrs 22 4,701 260 4,983
Sum of Inc Loss 4,404 2,301,923 35,161 2,341,488
Sum of Inc Claims 1 250 6 257
Westport 02790 Sum of WP 44,987 8,243,349 75,898 8,364,234
Sum of EP 46,378 7,914,481 73,307 8,034,166
Sum of W Hse Yrs 76 5,116 348 5,540
Sum of E Hse Yrs 76 5,049 335 5,460
Sum of Inc Loss 4,580 2,940,071 17,578 2,962,229
Sum of Inc Claims 2 270 7 279
Westport Point 02791 Sum of WP 5,972 235,445 1,603 243,020
Sum of EP 5,835 228,946 1,382 236,163
Sum of W Hse Yrs 3 105 6 114
Sum of E Hse Yrs 3 105 7 115
Sum of Inc Loss 0 22,740 0 22,740
Sum of Inc Claims 0 4 0 4
ALL ABOVE Total Sum of WP 44,201,075 673,197,482 18,478,110 735,876,667
Total Sum of EP 43,116,097 660,489,285 18,093,070 721,698,452
Total Sum of W Hse Yrs 77,936 365,477 85,768 529,180
Total Sum of E Hse Yrs 76,468 366,468 82,930 525,866
Total Sum of Inc Loss 24,472,233 393,769,607 5,107,988 423,349,828
Total Sum of Inc Claims 3,632 27,969 1,165 32,766
WP - written premium
EP - earned premium
W hse yrs - written house years
E hse yrs - earned house years
Inc - incurred
74
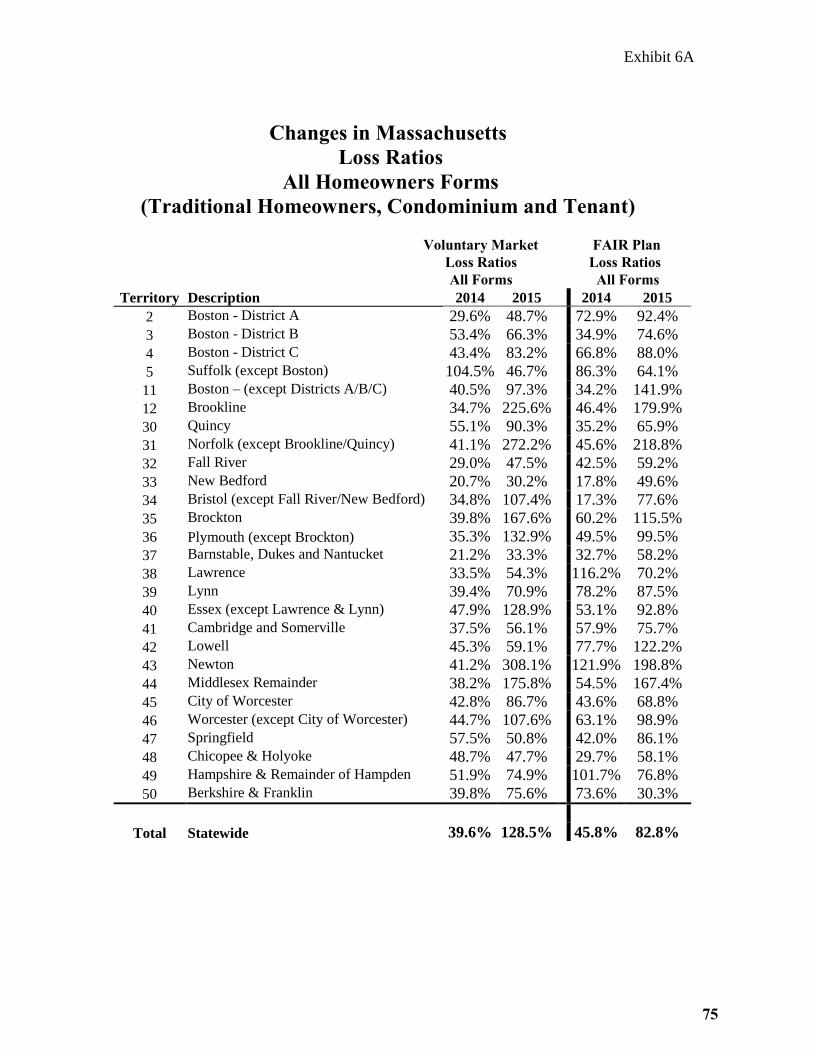
Exhibit 6A
Changes in Massachusetts
Loss Ratios
All Homeowners Forms
(Traditional Homeowners, Condominium and Tenant)
Voluntary Market FAIR Plan
Loss Ratios Loss Ratios
All Forms All Forms
Territory Description 2014 2015 2014 2015
2 Boston - District A 29.6% 48.7% 72.9% 92.4%
3 Boston - District B 53.4% 66.3% 34.9% 74.6%
4 Boston - District C 43.4% 83.2% 66.8% 88.0%
5 Suffolk (except Boston) 104.5% 46.7% 86.3% 64.1%
11 Boston – (except Districts A/B/C) 40.5% 97.3% 34.2% 141.9%
12 Brookline 34.7% 225.6% 46.4% 179.9%
30 Quincy 55.1% 90.3% 35.2% 65.9%
31 Norfolk (except Brookline/Quincy) 41.1% 272.2% 45.6% 218.8%
32 Fall River 29.0% 47.5% 42.5% 59.2%
33 New Bedford 20.7% 30.2% 17.8% 49.6%
34 Bristol (except Fall River/New Bedford) 34.8% 107.4% 17.3% 77.6%
35 Brockton 39.8% 167.6% 60.2% 115.5%
36 Plymouth (except Brockton) 35.3% 132.9% 49.5% 99.5%
37 Barnstable, Dukes and Nantucket 21.2% 33.3% 32.7% 58.2%
38 Lawrence 33.5% 54.3% 116.2% 70.2%
39 Lynn 39.4% 70.9% 78.2% 87.5%
40 Essex (except Lawrence & Lynn) 47.9% 128.9% 53.1% 92.8%
41 Cambridge and Somerville 37.5% 56.1% 57.9% 75.7%
42 Lowell 45.3% 59.1% 77.7% 122.2%
43 Newton 41.2% 308.1% 121.9% 198.8%
44 Middlesex Remainder 38.2% 175.8% 54.5% 167.4%
45 City of Worcester 42.8% 86.7% 43.6% 68.8%
46 Worcester (except City of Worcester) 44.7% 107.6% 63.1% 98.9%
47 Springfield 57.5% 50.8% 42.0% 86.1%
48 Chicopee & Holyoke 48.7% 47.7% 29.7% 58.1%
49 Hampshire & Remainder of Hampden 51.9% 74.9% 101.7% 76.8%
50 Berkshire & Franklin 39.8% 75.6% 73.6% 30.3%
Total Statewide 39.6% 128.5% 45.8% 82.8%
75

Exhibit 6B
Massachusetts Homeowners Insurance Loss Ratios
Homeowners Insurance Only
(No Condominium or Tenant Insurance)
2015 2015 Loss Ratios
Territory Territory Description FAIR Plan
Mkt.
Share
Vol.
Market
FAIR
Plan
2 Boston - District A 51.2% 52.8% 93.6% 3 Boston - District B 6.7% 65.5% 89.8% 4 Boston - District C 59.6% 91.7% 85.9% 5 Suffolk (except Boston) 27.7% 45.3% 62.4%
11 Boston – (except Districts A, B & C) 17.3% 119.6% 148.4% 12 Brookline 1.8% 286.7% 229.4% 30 Quincy 12.5% 97.2% 67.5% 31 Norfolk (except Brookline & Quincy) 3.5% 281.5% 225.5% 32 Fall River 19.6% 48.4% 55.3% 33 New Bedford 37.8% 30.6% 50.4% 34 Bristol (except Fall River & New
Bedford) 7.1% 108.1% 77.3% 35 Brockton 18.7% 169.8% 116.1% 36 Plymouth (except Brockton) 12.4% 135.2% 99.7% 37 Barnstable, Dukes and Nantucket 31.8% 33.0% 58.5% 38 Lawrence 39.7% 55.3% 70.4% 39 Lynn 22.5% 69.4% 84.5% 40 Essex (except Lawrence & Lynn) 5.7% 132.7% 95.1% 41 Cambridge & Somerville 7.5% 64.8% 75.8% 42 Lowell 13.6% 59.8% 124.4% 43 Newton 2.1% 326.6% 217.3% 44 Middlesex Remainder 3.0% 182.9% 173.8% 45 City of Worcester 10.3% 89.8% 66.4% 46 Worcester (except City of Worcester) 4.0% 109.3% 97.5% 47 Springfield 11.0% 51.0% 85.4% 48 Chicopee & Holyoke 7.3% 49.2% 57.7% 49 Hampshire & Remainder of Hampden 4.3% 76.8% 79.0% 50 Berkshire & Franklin 5.7% 77.1% 28.9%
Total Statewide 11.8% 133.6% 83.2%
76
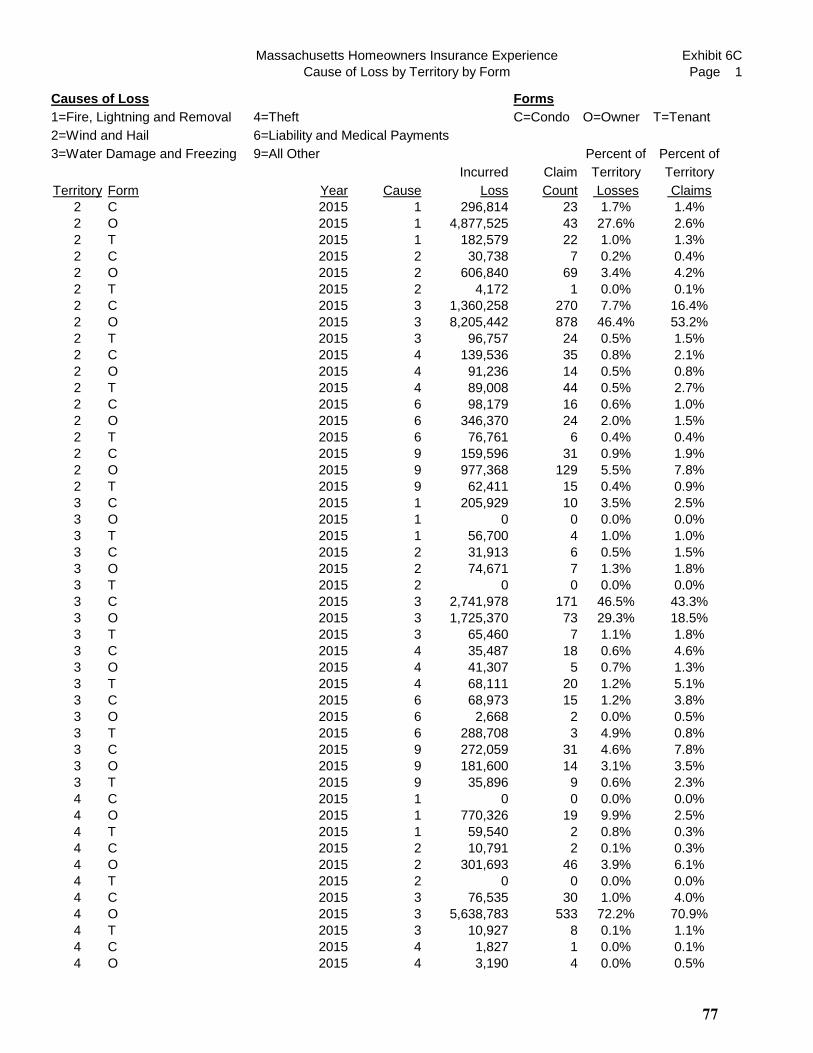
Massachusetts Homeowners Insurance Experience
Cause of Loss by Territory by Form
Exhibit 6C
Page 1
Causes of Loss Forms
1=Fire, Lightning and Removal 4=Theft C=Condo O=Owner T=Tenant
2=Wind and Hail 6=Liability and Medical Payments
3=Water Damage and Freezing 9=All Other Percent of Percent of
Incurred Claim Territory Territory
Territory Form Year Cause Loss Count Losses Claims
2 C 2015 1 296,814 23 1.7% 1.4%
2 O 2015 1 4,877,525 43 27.6% 2.6%
2 T 2015 1 182,579 22 1.0% 1.3%
2 C 2015 2 30,738 7 0.2% 0.4%
2 O 2015 2 606,840 69 3.4% 4.2%
2 T 2015 2 4,172 1 0.0% 0.1%
2 C 2015 3 1,360,258 270 7.7% 16.4%
2 O 2015 3 8,205,442 878 46.4% 53.2%
2 T 2015 3 96,757 24 0.5% 1.5%
2 C 2015 4 139,536 35 0.8% 2.1%
2 O 2015 4 91,236 14 0.5% 0.8%
2 T 2015 4 89,008 44 0.5% 2.7%
2 C 2015 6 98,179 16 0.6% 1.0%
2 O 2015 6 346,370 24 2.0% 1.5%
2 T 2015 6 76,761 6 0.4% 0.4%
2 C 2015 9 159,596 31 0.9% 1.9%
2 O 2015 9 977,368 129 5.5% 7.8%
2 T 2015 9 62,411 15 0.4% 0.9%
3 C 2015 1 205,929 10 3.5% 2.5%
3 O 2015 1 0 0 0.0% 0.0%
3 T 2015 1 56,700 4 1.0% 1.0%
3 C 2015 2 31,913 6 0.5% 1.5%
3 O 2015 2 74,671 7 1.3% 1.8%
3 T 2015 2 0 0 0.0% 0.0%
3 C 2015 3 2,741,978 171 46.5% 43.3%
3 O 2015 3 1,725,370 73 29.3% 18.5%
3 T 2015 3 65,460 7 1.1% 1.8%
3 C 2015 4 35,487 18 0.6% 4.6%
3 O 2015 4 41,307 5 0.7% 1.3%
3 T 2015 4 68,111 20 1.2% 5.1%
3 C 2015 6 68,973 15 1.2% 3.8%
3 O 2015 6 2,668 2 0.0% 0.5%
3 T 2015 6 288,708 3 4.9% 0.8%
3 C 2015 9 272,059 31 4.6% 7.8%
3 O 2015 9 181,600 14 3.1% 3.5%
3 T 2015 9 35,896 9 0.6% 2.3%
4 C 2015 1 0 0 0.0% 0.0%
4 O 2015 1 770,326 19 9.9% 2.5%
4 T 2015 1 59,540 2 0.8% 0.3%
4 C 2015 2 10,791 2 0.1% 0.3%
4 O 2015 2 301,693 46 3.9% 6.1%
4 T 2015 2 0 0 0.0% 0.0%
4 C 2015 3 76,535 30 1.0% 4.0%
4 O 2015 3 5,638,783 533 72.2% 70.9%
4 T 2015 3 10,927 8 0.1% 1.1%
4 C 2015 4 1,827 1 0.0% 0.1%
4 O 2015 4 3,190 4 0.0% 0.5%
77
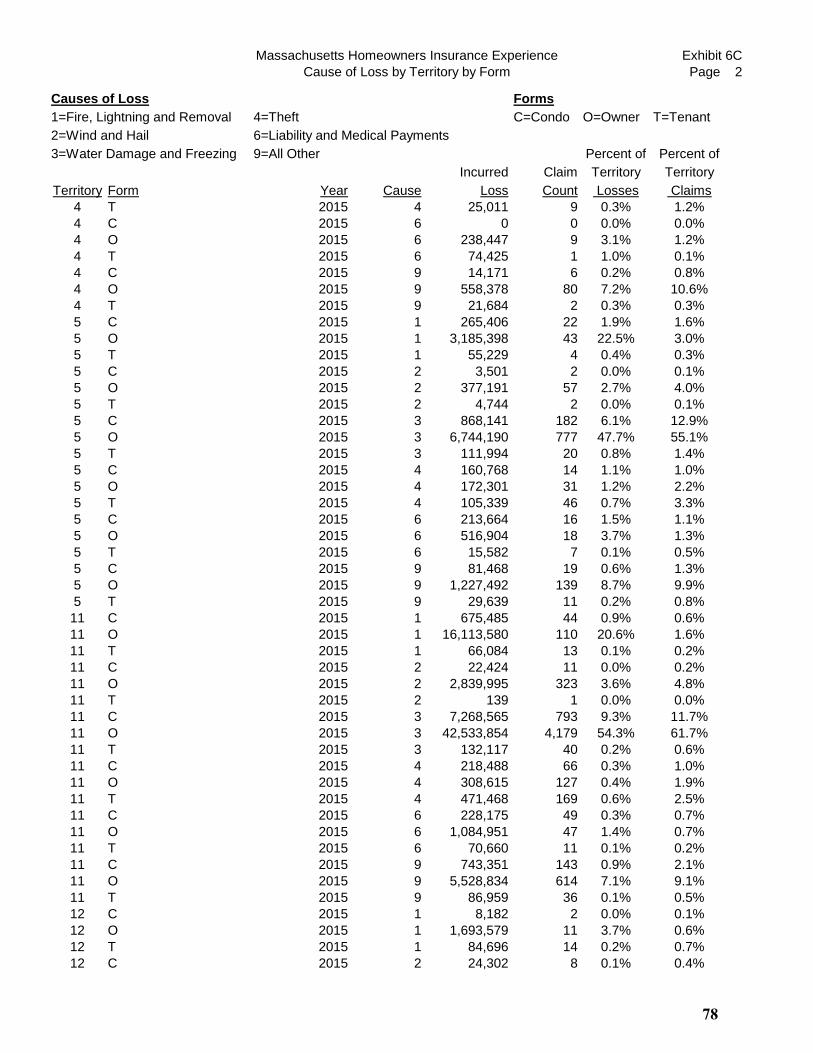
Massachusetts Homeowners Insurance Experience
Cause of Loss by Territory by Form
Exhibit 6C
Page 2
Causes of Loss Forms
1=Fire, Lightning and Removal 4=Theft C=Condo O=Owner T=Tenant
2=Wind and Hail 6=Liability and Medical Payments
3=Water Damage and Freezing 9=All Other Percent of Percent of
Incurred Claim Territory Territory
Territory Form Year Cause Loss Count Losses Claims
4 T 2015 4 25,011 9 0.3% 1.2%
4 C 2015 6 0 0 0.0% 0.0%
4 O 2015 6 238,447 9 3.1% 1.2%
4 T 2015 6 74,425 1 1.0% 0.1%
4 C 2015 9 14,171 6 0.2% 0.8%
4 O 2015 9 558,378 80 7.2% 10.6%
4 T 2015 9 21,684 2 0.3% 0.3%
5 C 2015 1 265,406 22 1.9% 1.6%
5 O 2015 1 3,185,398 43 22.5% 3.0%
5 T 2015 1 55,229 4 0.4% 0.3%
5 C 2015 2 3,501 2 0.0% 0.1%
5 O 2015 2 377,191 57 2.7% 4.0%
5 T 2015 2 4,744 2 0.0% 0.1%
5 C 2015 3 868,141 182 6.1% 12.9%
5 O 2015 3 6,744,190 777 47.7% 55.1%
5 T 2015 3 111,994 20 0.8% 1.4%
5 C 2015 4 160,768 14 1.1% 1.0%
5 O 2015 4 172,301 31 1.2% 2.2%
5 T 2015 4 105,339 46 0.7% 3.3%
5 C 2015 6 213,664 16 1.5% 1.1%
5 O 2015 6 516,904 18 3.7% 1.3%
5 T 2015 6 15,582 7 0.1% 0.5%
5 C 2015 9 81,468 19 0.6% 1.3%
5 O 2015 9 1,227,492 139 8.7% 9.9%
5 T 2015 9 29,639 11 0.2% 0.8%
11 C 2015 1 675,485 44 0.9% 0.6%
11 O 2015 1 16,113,580 110 20.6% 1.6%
11 T 2015 1 66,084 13 0.1% 0.2%
11 C 2015 2 22,424 11 0.0% 0.2%
11 O 2015 2 2,839,995 323 3.6% 4.8%
11 T 2015 2 139 1 0.0% 0.0%
11 C 2015 3 7,268,565 793 9.3% 11.7%
11 O 2015 3 42,533,854 4,179 54.3% 61.7%
11 T 2015 3 132,117 40 0.2% 0.6%
11 C 2015 4 218,488 66 0.3% 1.0%
11 O 2015 4 308,615 127 0.4% 1.9%
11 T 2015 4 471,468 169 0.6% 2.5%
11 C 2015 6 228,175 49 0.3% 0.7%
11 O 2015 6 1,084,951 47 1.4% 0.7%
11 T 2015 6 70,660 11 0.1% 0.2%
11 C 2015 9 743,351 143 0.9% 2.1%
11 O 2015 9 5,528,834 614 7.1% 9.1%
11 T 2015 9 86,959 36 0.1% 0.5%
12 C 2015 1 8,182 2 0.0% 0.1%
12 O 2015 1 1,693,579 11 3.7% 0.6%
12 T 2015 1 84,696 14 0.2% 0.7%
12 C 2015 2 24,302 8 0.1% 0.4%
78
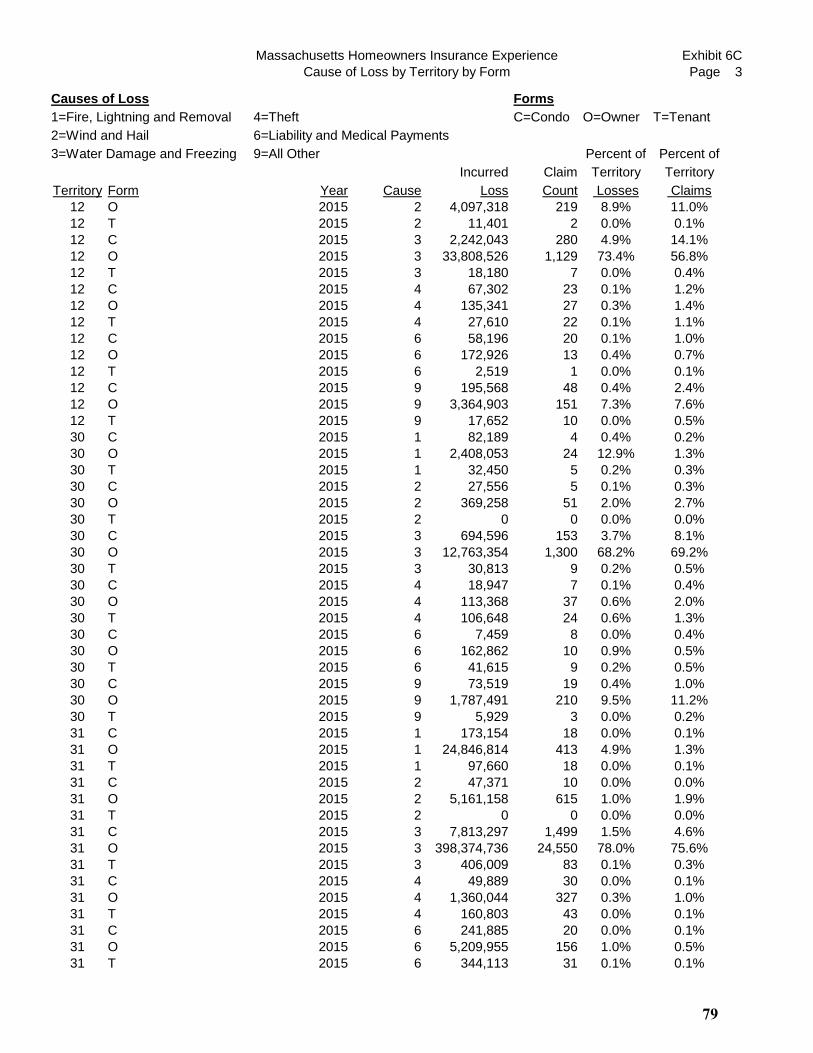
Massachusetts Homeowners Insurance Experience
Cause of Loss by Territory by Form
Exhibit 6C
Page 3
Causes of Loss Forms
1=Fire, Lightning and Removal 4=Theft C=Condo O=Owner T=Tenant
2=Wind and Hail 6=Liability and Medical Payments
3=Water Damage and Freezing 9=All Other Percent of Percent of
Incurred Claim Territory Territory
Territory Form Year Cause Loss Count Losses Claims
12 O 2015 2 4,097,318 219 8.9% 11.0%
12 T 2015 2 11,401 2 0.0% 0.1%
12 C 2015 3 2,242,043 280 4.9% 14.1%
12 O 2015 3 33,808,526 1,129 73.4% 56.8%
12 T 2015 3 18,180 7 0.0% 0.4%
12 C 2015 4 67,302 23 0.1% 1.2%
12 O 2015 4 135,341 27 0.3% 1.4%
12 T 2015 4 27,610 22 0.1% 1.1%
12 C 2015 6 58,196 20 0.1% 1.0%
12 O 2015 6 172,926 13 0.4% 0.7%
12 T 2015 6 2,519 1 0.0% 0.1%
12 C 2015 9 195,568 48 0.4% 2.4%
12 O 2015 9 3,364,903 151 7.3% 7.6%
12 T 2015 9 17,652 10 0.0% 0.5%
30 C 2015 1 82,189 4 0.4% 0.2%
30 O 2015 1 2,408,053 24 12.9% 1.3%
30 T 2015 1 32,450 5 0.2% 0.3%
30 C 2015 2 27,556 5 0.1% 0.3%
30 O 2015 2 369,258 51 2.0% 2.7%
30 T 2015 2 0 0 0.0% 0.0%
30 C 2015 3 694,596 153 3.7% 8.1%
30 O 2015 3 12,763,354 1,300 68.2% 69.2%
30 T 2015 3 30,813 9 0.2% 0.5%
30 C 2015 4 18,947 7 0.1% 0.4%
30 O 2015 4 113,368 37 0.6% 2.0%
30 T 2015 4 106,648 24 0.6% 1.3%
30 C 2015 6 7,459 8 0.0% 0.4%
30 O 2015 6 162,862 10 0.9% 0.5%
30 T 2015 6 41,615 9 0.2% 0.5%
30 C 2015 9 73,519 19 0.4% 1.0%
30 O 2015 9 1,787,491 210 9.5% 11.2%
30 T 2015 9 5,929 3 0.0% 0.2%
31 C 2015 1 173,154 18 0.0% 0.1%
31 O 2015 1 24,846,814 413 4.9% 1.3%
31 T 2015 1 97,660 18 0.0% 0.1%
31 C 2015 2 47,371 10 0.0% 0.0%
31 O 2015 2 5,161,158 615 1.0% 1.9%
31 T 2015 2 0 0 0.0% 0.0%
31 C 2015 3 7,813,297 1,499 1.5% 4.6%
31 O 2015 3 398,374,736 24,550 78.0% 75.6%
31 T 2015 3 406,009 83 0.1% 0.3%
31 C 2015 4 49,889 30 0.0% 0.1%
31 O 2015 4 1,360,044 327 0.3% 1.0%
31 T 2015 4 160,803 43 0.0% 0.1%
31 C 2015 6 241,885 20 0.0% 0.1%
31 O 2015 6 5,209,955 156 1.0% 0.5%
31 T 2015 6 344,113 31 0.1% 0.1%
79
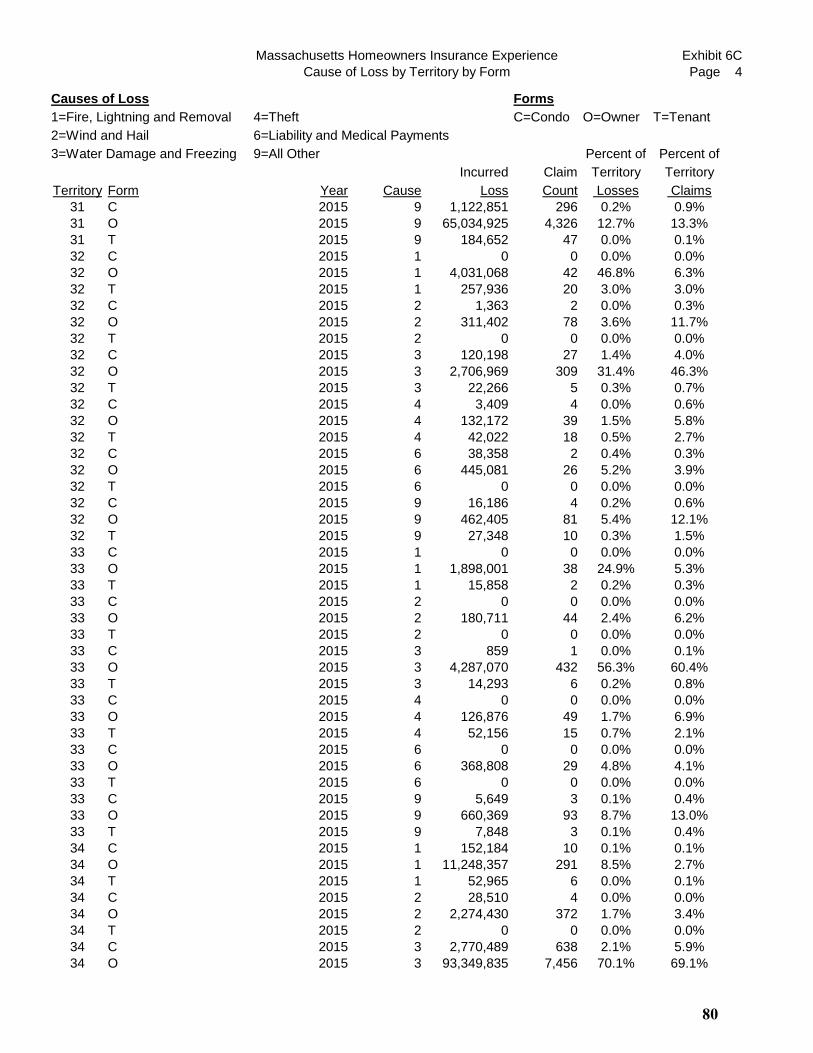
Massachusetts Homeowners Insurance Experience
Cause of Loss by Territory by Form
Exhibit 6C
Page 4
Causes of Loss Forms
1=Fire, Lightning and Removal 4=Theft C=Condo O=Owner T=Tenant
2=Wind and Hail 6=Liability and Medical Payments
3=Water Damage and Freezing 9=All Other Percent of Percent of
Incurred Claim Territory Territory
Territory Form Year Cause Loss Count Losses Claims
31 C 2015 9 1,122,851 296 0.2% 0.9%
31 O 2015 9 65,034,925 4,326 12.7% 13.3%
31 T 2015 9 184,652 47 0.0% 0.1%
32 C 2015 1 0 0 0.0% 0.0%
32 O 2015 1 4,031,068 42 46.8% 6.3%
32 T 2015 1 257,936 20 3.0% 3.0%
32 C 2015 2 1,363 2 0.0% 0.3%
32 O 2015 2 311,402 78 3.6% 11.7%
32 T 2015 2 0 0 0.0% 0.0%
32 C 2015 3 120,198 27 1.4% 4.0%
32 O 2015 3 2,706,969 309 31.4% 46.3%
32 T 2015 3 22,266 5 0.3% 0.7%
32 C 2015 4 3,409 4 0.0% 0.6%
32 O 2015 4 132,172 39 1.5% 5.8%
32 T 2015 4 42,022 18 0.5% 2.7%
32 C 2015 6 38,358 2 0.4% 0.3%
32 O 2015 6 445,081 26 5.2% 3.9%
32 T 2015 6 0 0 0.0% 0.0%
32 C 2015 9 16,186 4 0.2% 0.6%
32 O 2015 9 462,405 81 5.4% 12.1%
32 T 2015 9 27,348 10 0.3% 1.5%
33 C 2015 1 0 0 0.0% 0.0%
33 O 2015 1 1,898,001 38 24.9% 5.3%
33 T 2015 1 15,858 2 0.2% 0.3%
33 C 2015 2 0 0 0.0% 0.0%
33 O 2015 2 180,711 44 2.4% 6.2%
33 T 2015 2 0 0 0.0% 0.0%
33 C 2015 3 859 1 0.0% 0.1%
33 O 2015 3 4,287,070 432 56.3% 60.4%
33 T 2015 3 14,293 6 0.2% 0.8%
33 C 2015 4 0 0 0.0% 0.0%
33 O 2015 4 126,876 49 1.7% 6.9%
33 T 2015 4 52,156 15 0.7% 2.1%
33 C 2015 6 0 0 0.0% 0.0%
33 O 2015 6 368,808 29 4.8% 4.1%
33 T 2015 6 0 0 0.0% 0.0%
33 C 2015 9 5,649 3 0.1% 0.4%
33 O 2015 9 660,369 93 8.7% 13.0%
33 T 2015 9 7,848 3 0.1% 0.4%
34 C 2015 1 152,184 10 0.1% 0.1%
34 O 2015 1 11,248,357 291 8.5% 2.7%
34 T 2015 1 52,965 6 0.0% 0.1%
34 C 2015 2 28,510 4 0.0% 0.0%
34 O 2015 2 2,274,430 372 1.7% 3.4%
34 T 2015 2 0 0 0.0% 0.0%
34 C 2015 3 2,770,489 638 2.1% 5.9%
34 O 2015 3 93,349,835 7,456 70.1% 69.1%
80
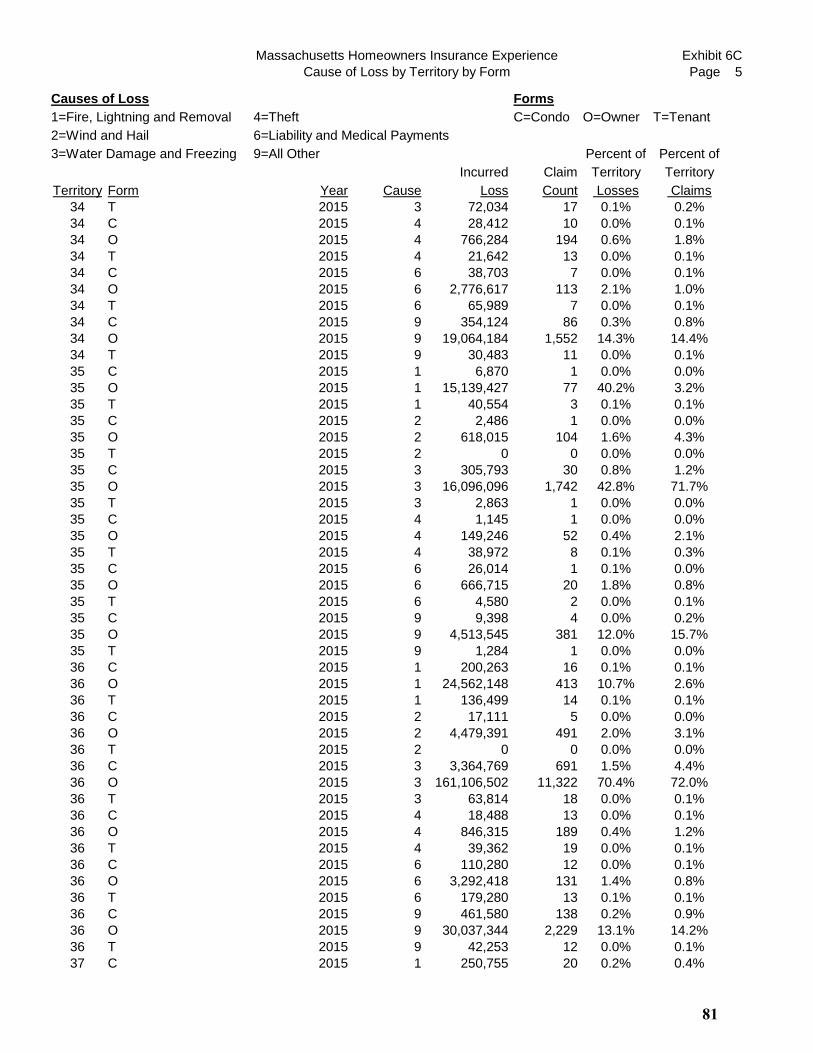
Massachusetts Homeowners Insurance Experience
Cause of Loss by Territory by Form
Exhibit 6C
Page 5
Causes of Loss Forms
1=Fire, Lightning and Removal 4=Theft C=Condo O=Owner T=Tenant
2=Wind and Hail 6=Liability and Medical Payments
3=Water Damage and Freezing 9=All Other Percent of Percent of
Incurred Claim Territory Territory
Territory Form Year Cause Loss Count Losses Claims
34 T 2015 3 72,034 17 0.1% 0.2%
34 C 2015 4 28,412 10 0.0% 0.1%
34 O 2015 4 766,284 194 0.6% 1.8%
34 T 2015 4 21,642 13 0.0% 0.1%
34 C 2015 6 38,703 7 0.0% 0.1%
34 O 2015 6 2,776,617 113 2.1% 1.0%
34 T 2015 6 65,989 7 0.0% 0.1%
34 C 2015 9 354,124 86 0.3% 0.8%
34 O 2015 9 19,064,184 1,552 14.3% 14.4%
34 T 2015 9 30,483 11 0.0% 0.1%
35 C 2015 1 6,870 1 0.0% 0.0%
35 O 2015 1 15,139,427 77 40.2% 3.2%
35 T 2015 1 40,554 3 0.1% 0.1%
35 C 2015 2 2,486 1 0.0% 0.0%
35 O 2015 2 618,015 104 1.6% 4.3%
35 T 2015 2 0 0 0.0% 0.0%
35 C 2015 3 305,793 30 0.8% 1.2%
35 O 2015 3 16,096,096 1,742 42.8% 71.7%
35 T 2015 3 2,863 1 0.0% 0.0%
35 C 2015 4 1,145 1 0.0% 0.0%
35 O 2015 4 149,246 52 0.4% 2.1%
35 T 2015 4 38,972 8 0.1% 0.3%
35 C 2015 6 26,014 1 0.1% 0.0%
35 O 2015 6 666,715 20 1.8% 0.8%
35 T 2015 6 4,580 2 0.0% 0.1%
35 C 2015 9 9,398 4 0.0% 0.2%
35 O 2015 9 4,513,545 381 12.0% 15.7%
35 T 2015 9 1,284 1 0.0% 0.0%
36 C 2015 1 200,263 16 0.1% 0.1%
36 O 2015 1 24,562,148 413 10.7% 2.6%
36 T 2015 1 136,499 14 0.1% 0.1%
36 C 2015 2 17,111 5 0.0% 0.0%
36 O 2015 2 4,479,391 491 2.0% 3.1%
36 T 2015 2 0 0 0.0% 0.0%
36 C 2015 3 3,364,769 691 1.5% 4.4%
36 O 2015 3 161,106,502 11,322 70.4% 72.0%
36 T 2015 3 63,814 18 0.0% 0.1%
36 C 2015 4 18,488 13 0.0% 0.1%
36 O 2015 4 846,315 189 0.4% 1.2%
36 T 2015 4 39,362 19 0.0% 0.1%
36 C 2015 6 110,280 12 0.0% 0.1%
36 O 2015 6 3,292,418 131 1.4% 0.8%
36 T 2015 6 179,280 13 0.1% 0.1%
36 C 2015 9 461,580 138 0.2% 0.9%
36 O 2015 9 30,037,344 2,229 13.1% 14.2%
36 T 2015 9 42,253 12 0.0% 0.1%
37 C 2015 1 250,755 20 0.2% 0.4%
81

Massachusetts Homeowners Insurance Experience
Cause of Loss by Territory by Form
Exhibit 6C
Page 6
Causes of Loss Forms
1=Fire, Lightning and Removal 4=Theft C=Condo O=Owner T=Tenant
2=Wind and Hail 6=Liability and Medical Payments
3=Water Damage and Freezing 9=All Other Percent of Percent of
Incurred Claim Territory Territory
Territory Form Year Cause Loss Count Losses Claims
37 O 2015 1 16,260,625 271 12.8% 4.8%
37 T 2015 1 99,346 13 0.1% 0.2%
37 C 2015 2 23,591 9 0.0% 0.2%
37 O 2015 2 1,664,540 251 1.3% 4.5%
37 T 2015 2 0 0 0.0% 0.0%
37 C 2015 3 2,170,548 320 1.7% 5.7%
37 O 2015 3 95,037,110 3,652 74.8% 64.8%
37 T 2015 3 92,973 11 0.1% 0.2%
37 C 2015 4 84,588 17 0.1% 0.3%
37 O 2015 4 513,256 154 0.4% 2.7%
37 T 2015 4 18,326 11 0.0% 0.2%
37 C 2015 6 242,897 9 0.2% 0.2%
37 O 2015 6 2,954,466 112 2.3% 2.0%
37 T 2015 6 50,128 6 0.0% 0.1%
37 C 2015 9 221,542 51 0.2% 0.9%
37 O 2015 9 7,400,784 725 5.8% 12.9%
37 T 2015 9 24,234 6 0.0% 0.1%
38 C 2015 1 0 0 0.0% 0.0%
38 O 2015 1 1,554,042 29 24.6% 4.1%
38 T 2015 1 41,304 5 0.7% 0.7%
38 C 2015 2 0 0 0.0% 0.0%
38 O 2015 2 396,703 58 6.3% 8.3%
38 T 2015 2 0 0 0.0% 0.0%
38 C 2015 3 85,691 20 1.4% 2.9%
38 O 2015 3 3,161,833 427 50.1% 61.1%
38 T 2015 3 1,096 1 0.0% 0.1%
38 C 2015 4 767 1 0.0% 0.1%
38 O 2015 4 92,525 22 1.5% 3.1%
38 T 2015 4 25,462 12 0.4% 1.7%
38 C 2015 6 0 0 0.0% 0.0%
38 O 2015 6 115,128 15 1.8% 2.1%
38 T 2015 6 18,785 1 0.3% 0.1%
38 C 2015 9 3,624 2 0.1% 0.3%
38 O 2015 9 794,156 105 12.6% 15.0%
38 T 2015 9 22,689 1 0.4% 0.1%
39 C 2015 1 524,241 2 3.0% 0.1%
39 O 2015 1 3,655,077 45 21.2% 3.0%
39 T 2015 1 11,450 1 0.1% 0.1%
39 C 2015 2 9,902 2 0.1% 0.1%
39 O 2015 2 352,469 68 2.0% 4.5%
39 T 2015 2 0 0 0.0% 0.0%
39 C 2015 3 440,681 72 2.6% 4.8%
39 O 2015 3 10,010,295 1,040 58.1% 69.4%
39 T 2015 3 25,406 4 0.1% 0.3%
39 C 2015 4 15,068 3 0.1% 0.2%
39 O 2015 4 123,383 38 0.7% 2.5%
39 T 2015 4 23,779 10 0.1% 0.7%
82

Massachusetts Homeowners Insurance Experience
Cause of Loss by Territory by Form
Exhibit 6C
Page 7
Causes of Loss Forms
1=Fire, Lightning and Removal 4=Theft C=Condo O=Owner T=Tenant
2=Wind and Hail 6=Liability and Medical Payments
3=Water Damage and Freezing 9=All Other Percent of Percent of
Incurred Claim Territory Territory
Territory Form Year Cause Loss Count Losses Claims
39 C 2015 6 16,064 5 0.1% 0.3%
39 O 2015 6 592,815 30 3.4% 2.0%
39 T 2015 6 1,958 1 0.0% 0.1%
39 C 2015 9 29,618 6 0.2% 0.4%
39 O 2015 9 1,382,417 171 8.0% 11.4%
39 T 2015 9 0 0 0.0% 0.0%
40 C 2015 1 870,269 35 0.3% 0.2%
40 O 2015 1 18,822,232 386 7.4% 1.9%
40 T 2015 1 90,935 15 0.0% 0.1%
40 C 2015 2 31,818 17 0.0% 0.1%
40 O 2015 2 5,018,179 693 2.0% 3.5%
40 T 2015 2 20,332 2 0.0% 0.0%
40 C 2015 3 7,853,995 1,669 3.1% 8.4%
40 O 2015 3 179,331,766 13,065 70.2% 65.8%
40 T 2015 3 216,447 60 0.1% 0.3%
40 C 2015 4 139,386 37 0.1% 0.2%
40 O 2015 4 824,410 260 0.3% 1.3%
40 T 2015 4 124,749 59 0.0% 0.3%
40 C 2015 6 186,673 37 0.1% 0.2%
40 O 2015 6 5,124,780 198 2.0% 1.0%
40 T 2015 6 349,347 33 0.1% 0.2%
40 C 2015 9 1,377,895 320 0.5% 1.6%
40 O 2015 9 34,926,834 2,937 13.7% 14.8%
40 T 2015 9 106,108 32 0.0% 0.2%
41 C 2015 1 91,220 12 0.5% 0.6%
41 O 2015 1 2,938,448 32 15.1% 1.6%
41 T 2015 1 104,932 15 0.5% 0.8%
41 C 2015 2 70,163 8 0.4% 0.4%
41 O 2015 2 252,524 37 1.3% 1.9%
41 T 2015 2 0 0 0.0% 0.0%
41 C 2015 3 1,764,475 345 9.1% 17.6%
41 O 2015 3 11,630,262 996 59.8% 50.8%
41 T 2015 3 70,488 18 0.4% 0.9%
41 C 2015 4 122,644 59 0.6% 3.0%
41 O 2015 4 177,793 50 0.9% 2.6%
41 T 2015 4 209,670 118 1.1% 6.0%
41 C 2015 6 149,129 22 0.8% 1.1%
41 O 2015 6 302,240 18 1.6% 0.9%
41 T 2015 6 84,208 8 0.4% 0.4%
41 C 2015 9 176,146 42 0.9% 2.1%
41 O 2015 9 1,281,898 167 6.6% 8.5%
41 T 2015 9 19,955 12 0.1% 0.6%
42 C 2015 1 0 0 0.0% 0.0%
42 O 2015 1 2,600,091 25 22.1% 1.9%
42 T 2015 1 42,186 3 0.4% 0.2%
42 C 2015 2 21,207 4 0.2% 0.3%
42 O 2015 2 236,067 47 2.0% 3.6%
83
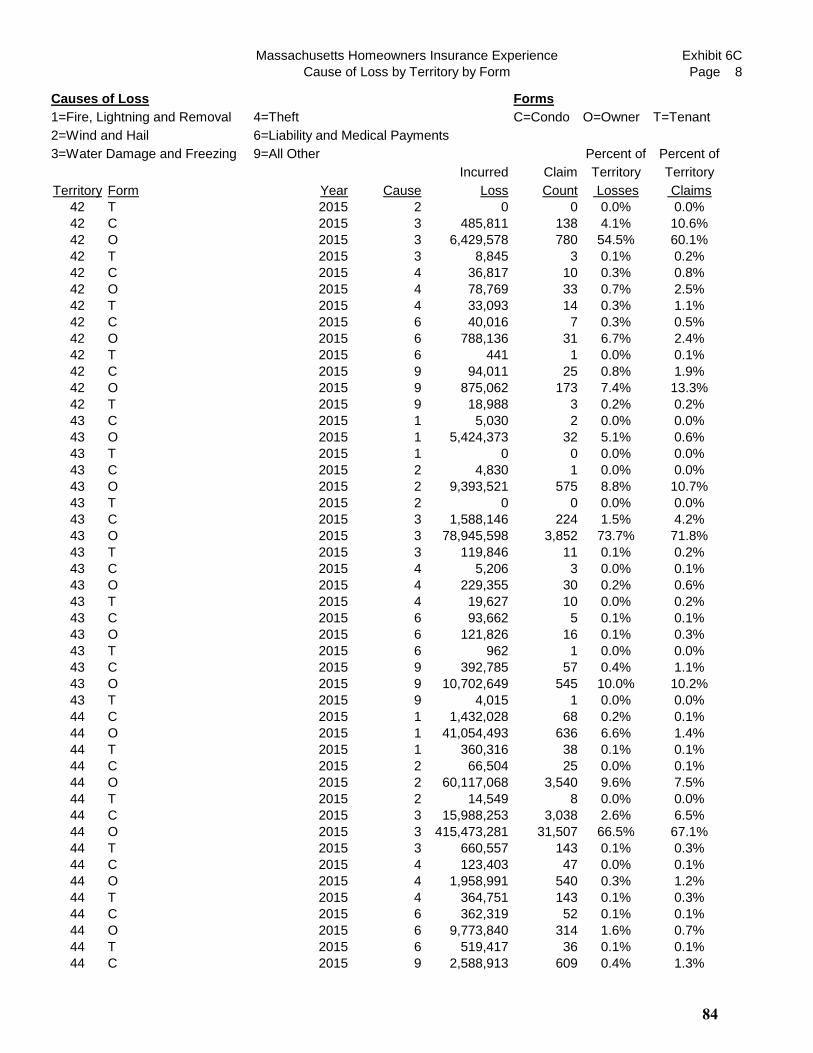
Massachusetts Homeowners Insurance Experience
Cause of Loss by Territory by Form
Exhibit 6C
Page 8
Causes of Loss Forms
1=Fire, Lightning and Removal 4=Theft C=Condo O=Owner T=Tenant
2=Wind and Hail 6=Liability and Medical Payments
3=Water Damage and Freezing 9=All Other Percent of Percent of
Incurred Claim Territory Territory
Territory Form Year Cause Loss Count Losses Claims
42 T 2015 2 0 0 0.0% 0.0%
42 C 2015 3 485,811 138 4.1% 10.6%
42 O 2015 3 6,429,578 780 54.5% 60.1%
42 T 2015 3 8,845 3 0.1% 0.2%
42 C 2015 4 36,817 10 0.3% 0.8%
42 O 2015 4 78,769 33 0.7% 2.5%
42 T 2015 4 33,093 14 0.3% 1.1%
42 C 2015 6 40,016 7 0.3% 0.5%
42 O 2015 6 788,136 31 6.7% 2.4%
42 T 2015 6 441 1 0.0% 0.1%
42 C 2015 9 94,011 25 0.8% 1.9%
42 O 2015 9 875,062 173 7.4% 13.3%
42 T 2015 9 18,988 3 0.2% 0.2%
43 C 2015 1 5,030 2 0.0% 0.0%
43 O 2015 1 5,424,373 32 5.1% 0.6%
43 T 2015 1 0 0 0.0% 0.0%
43 C 2015 2 4,830 1 0.0% 0.0%
43 O 2015 2 9,393,521 575 8.8% 10.7%
43 T 2015 2 0 0 0.0% 0.0%
43 C 2015 3 1,588,146 224 1.5% 4.2%
43 O 2015 3 78,945,598 3,852 73.7% 71.8%
43 T 2015 3 119,846 11 0.1% 0.2%
43 C 2015 4 5,206 3 0.0% 0.1%
43 O 2015 4 229,355 30 0.2% 0.6%
43 T 2015 4 19,627 10 0.0% 0.2%
43 C 2015 6 93,662 5 0.1% 0.1%
43 O 2015 6 121,826 16 0.1% 0.3%
43 T 2015 6 962 1 0.0% 0.0%
43 C 2015 9 392,785 57 0.4% 1.1%
43 O 2015 9 10,702,649 545 10.0% 10.2%
43 T 2015 9 4,015 1 0.0% 0.0%
44 C 2015 1 1,432,028 68 0.2% 0.1%
44 O 2015 1 41,054,493 636 6.6% 1.4%
44 T 2015 1 360,316 38 0.1% 0.1%
44 C 2015 2 66,504 25 0.0% 0.1%
44 O 2015 2 60,117,068 3,540 9.6% 7.5%
44 T 2015 2 14,549 8 0.0% 0.0%
44 C 2015 3 15,988,253 3,038 2.6% 6.5%
44 O 2015 3 415,473,281 31,507 66.5% 67.1%
44 T 2015 3 660,557 143 0.1% 0.3%
44 C 2015 4 123,403 47 0.0% 0.1%
44 O 2015 4 1,958,991 540 0.3% 1.2%
44 T 2015 4 364,751 143 0.1% 0.3%
44 C 2015 6 362,319 52 0.1% 0.1%
44 O 2015 6 9,773,840 314 1.6% 0.7%
44 T 2015 6 519,417 36 0.1% 0.1%
44 C 2015 9 2,588,913 609 0.4% 1.3%
84
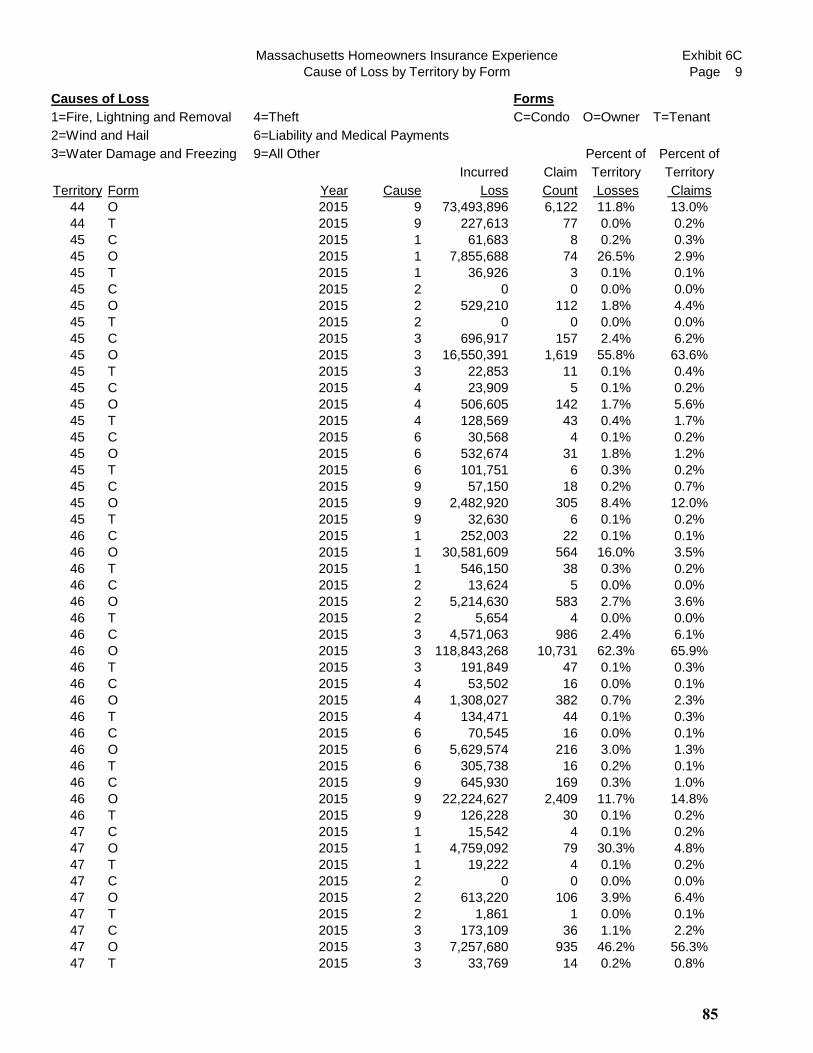
Massachusetts Homeowners Insurance Experience
Cause of Loss by Territory by Form
Exhibit 6C
Page 9
Causes of Loss Forms
1=Fire, Lightning and Removal 4=Theft C=Condo O=Owner T=Tenant
2=Wind and Hail 6=Liability and Medical Payments
3=Water Damage and Freezing 9=All Other Percent of Percent of
Incurred Claim Territory Territory
Territory Form Year Cause Loss Count Losses Claims
44 O 2015 9 73,493,896 6,122 11.8% 13.0%
44 T 2015 9 227,613 77 0.0% 0.2%
45 C 2015 1 61,683 8 0.2% 0.3%
45 O 2015 1 7,855,688 74 26.5% 2.9%
45 T 2015 1 36,926 3 0.1% 0.1%
45 C 2015 2 0 0 0.0% 0.0%
45 O 2015 2 529,210 112 1.8% 4.4%
45 T 2015 2 0 0 0.0% 0.0%
45 C 2015 3 696,917 157 2.4% 6.2%
45 O 2015 3 16,550,391 1,619 55.8% 63.6%
45 T 2015 3 22,853 11 0.1% 0.4%
45 C 2015 4 23,909 5 0.1% 0.2%
45 O 2015 4 506,605 142 1.7% 5.6%
45 T 2015 4 128,569 43 0.4% 1.7%
45 C 2015 6 30,568 4 0.1% 0.2%
45 O 2015 6 532,674 31 1.8% 1.2%
45 T 2015 6 101,751 6 0.3% 0.2%
45 C 2015 9 57,150 18 0.2% 0.7%
45 O 2015 9 2,482,920 305 8.4% 12.0%
45 T 2015 9 32,630 6 0.1% 0.2%
46 C 2015 1 252,003 22 0.1% 0.1%
46 O 2015 1 30,581,609 564 16.0% 3.5%
46 T 2015 1 546,150 38 0.3% 0.2%
46 C 2015 2 13,624 5 0.0% 0.0%
46 O 2015 2 5,214,630 583 2.7% 3.6%
46 T 2015 2 5,654 4 0.0% 0.0%
46 C 2015 3 4,571,063 986 2.4% 6.1%
46 O 2015 3 118,843,268 10,731 62.3% 65.9%
46 T 2015 3 191,849 47 0.1% 0.3%
46 C 2015 4 53,502 16 0.0% 0.1%
46 O 2015 4 1,308,027 382 0.7% 2.3%
46 T 2015 4 134,471 44 0.1% 0.3%
46 C 2015 6 70,545 16 0.0% 0.1%
46 O 2015 6 5,629,574 216 3.0% 1.3%
46 T 2015 6 305,738 16 0.2% 0.1%
46 C 2015 9 645,930 169 0.3% 1.0%
46 O 2015 9 22,224,627 2,409 11.7% 14.8%
46 T 2015 9 126,228 30 0.1% 0.2%
47 C 2015 1 15,542 4 0.1% 0.2%
47 O 2015 1 4,759,092 79 30.3% 4.8%
47 T 2015 1 19,222 4 0.1% 0.2%
47 C 2015 2 0 0 0.0% 0.0%
47 O 2015 2 613,220 106 3.9% 6.4%
47 T 2015 2 1,861 1 0.0% 0.1%
47 C 2015 3 173,109 36 1.1% 2.2%
47 O 2015 3 7,257,680 935 46.2% 56.3%
47 T 2015 3 33,769 14 0.2% 0.8%
85
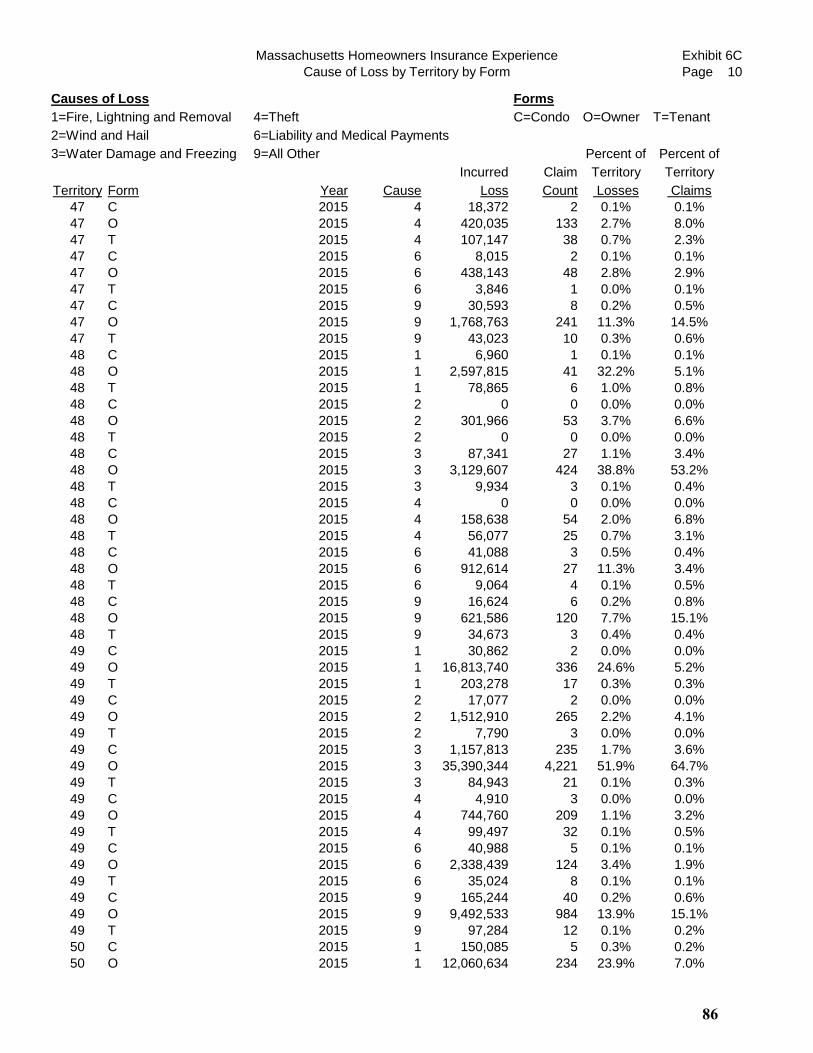
Massachusetts Homeowners Insurance Experience
Cause of Loss by Territory by Form
Exhibit 6C
Page 10
Causes of Loss Forms
1=Fire, Lightning and Removal 4=Theft C=Condo O=Owner T=Tenant
2=Wind and Hail 6=Liability and Medical Payments
3=Water Damage and Freezing 9=All Other Percent of Percent of
Incurred Claim Territory Territory
Territory Form Year Cause Loss Count Losses Claims
47 C 2015 4 18,372 2 0.1% 0.1%
47 O 2015 4 420,035 133 2.7% 8.0%
47 T 2015 4 107,147 38 0.7% 2.3%
47 C 2015 6 8,015 2 0.1% 0.1%
47 O 2015 6 438,143 48 2.8% 2.9%
47 T 2015 6 3,846 1 0.0% 0.1%
47 C 2015 9 30,593 8 0.2% 0.5%
47 O 2015 9 1,768,763 241 11.3% 14.5%
47 T 2015 9 43,023 10 0.3% 0.6%
48 C 2015 1 6,960 1 0.1% 0.1%
48 O 2015 1 2,597,815 41 32.2% 5.1%
48 T 2015 1 78,865 6 1.0% 0.8%
48 C 2015 2 0 0 0.0% 0.0%
48 O 2015 2 301,966 53 3.7% 6.6%
48 T 2015 2 0 0 0.0% 0.0%
48 C 2015 3 87,341 27 1.1% 3.4%
48 O 2015 3 3,129,607 424 38.8% 53.2%
48 T 2015 3 9,934 3 0.1% 0.4%
48 C 2015 4 0 0 0.0% 0.0%
48 O 2015 4 158,638 54 2.0% 6.8%
48 T 2015 4 56,077 25 0.7% 3.1%
48 C 2015 6 41,088 3 0.5% 0.4%
48 O 2015 6 912,614 27 11.3% 3.4%
48 T 2015 6 9,064 4 0.1% 0.5%
48 C 2015 9 16,624 6 0.2% 0.8%
48 O 2015 9 621,586 120 7.7% 15.1%
48 T 2015 9 34,673 3 0.4% 0.4%
49 C 2015 1 30,862 2 0.0% 0.0%
49 O 2015 1 16,813,740 336 24.6% 5.2%
49 T 2015 1 203,278 17 0.3% 0.3%
49 C 2015 2 17,077 2 0.0% 0.0%
49 O 2015 2 1,512,910 265 2.2% 4.1%
49 T 2015 2 7,790 3 0.0% 0.0%
49 C 2015 3 1,157,813 235 1.7% 3.6%
49 O 2015 3 35,390,344 4,221 51.9% 64.7%
49 T 2015 3 84,943 21 0.1% 0.3%
49 C 2015 4 4,910 3 0.0% 0.0%
49 O 2015 4 744,760 209 1.1% 3.2%
49 T 2015 4 99,497 32 0.1% 0.5%
49 C 2015 6 40,988 5 0.1% 0.1%
49 O 2015 6 2,338,439 124 3.4% 1.9%
49 T 2015 6 35,024 8 0.1% 0.1%
49 C 2015 9 165,244 40 0.2% 0.6%
49 O 2015 9 9,492,533 984 13.9% 15.1%
49 T 2015 9 97,284 12 0.1% 0.2%
50 C 2015 1 150,085 5 0.3% 0.2%
50 O 2015 1 12,060,634 234 23.9% 7.0%
86
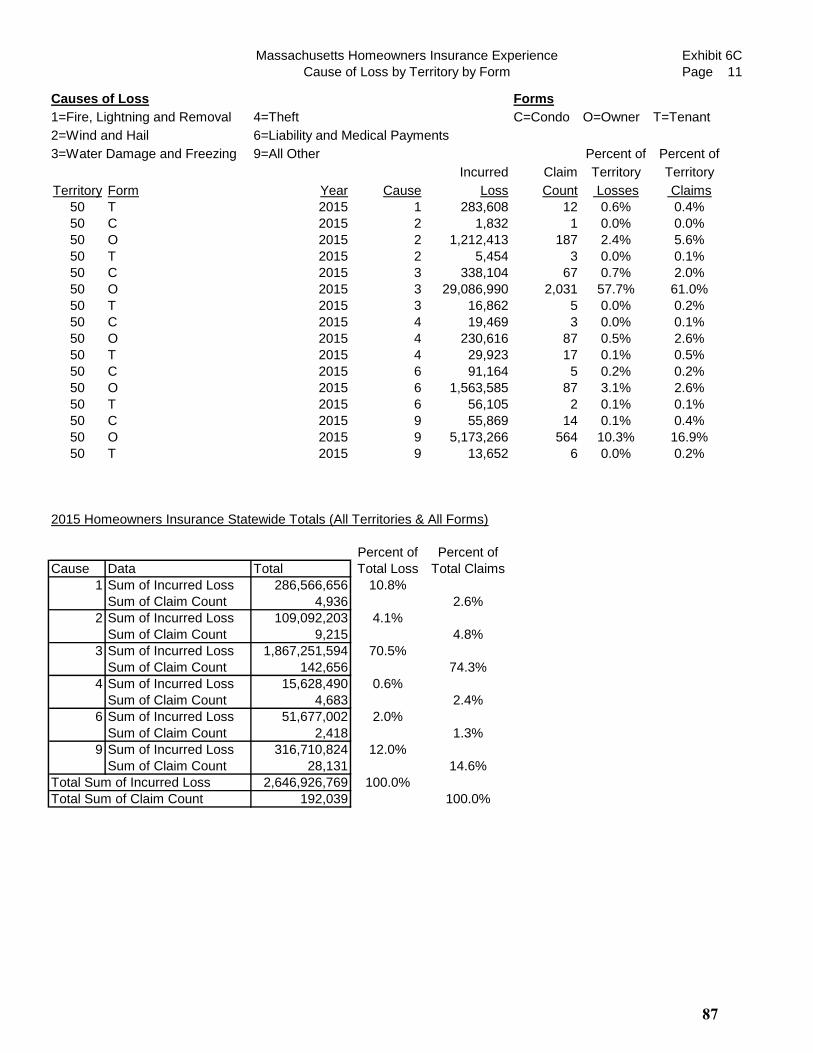
Massachusetts Homeowners Insurance Experience
Cause of Loss by Territory by Form
Exhibit 6C
Page 11
Causes of Loss Forms
1=Fire, Lightning and Removal 4=Theft C=Condo O=Owner T=Tenant
2=Wind and Hail 6=Liability and Medical Payments
3=Water Damage and Freezing 9=All Other Percent of Percent of
Incurred Claim Territory Territory
Territory Form Year Cause Loss Count Losses Claims
50 T 2015 1 283,608 12 0.6% 0.4%
50 C 2015 2 1,832 1 0.0% 0.0%
50 O 2015 2 1,212,413 187 2.4% 5.6%
50 T 2015 2 5,454 3 0.0% 0.1%
50 C 2015 3 338,104 67 0.7% 2.0%
50 O 2015 3 29,086,990 2,031 57.7% 61.0%
50 T 2015 3 16,862 5 0.0% 0.2%
50 C 2015 4 19,469 3 0.0% 0.1%
50 O 2015 4 230,616 87 0.5% 2.6%
50 T 2015 4 29,923 17 0.1% 0.5%
50 C 2015 6 91,164 5 0.2% 0.2%
50 O 2015 6 1,563,585 87 3.1% 2.6%
50 T 2015 6 56,105 2 0.1% 0.1%
50 C 2015 9 55,869 14 0.1% 0.4%
50 O 2015 9 5,173,266 564 10.3% 16.9%
50 T 2015 9 13,652 6 0.0% 0.2%
2015 Homeowners Insurance Statewide Totals (All Territories & All Forms)
Percent of Percent of
Cause Data Total Total Loss Total Claims
1 Sum of Incurred Loss 286,566,656 10.8%
Sum of Claim Count 4,936 2.6%
2 Sum of Incurred Loss 109,092,203 4.1%
Sum of Claim Count 9,215 4.8%
3 Sum of Incurred Loss 1,867,251,594 70.5%
Sum of Claim Count 142,656 74.3%
4 Sum of Incurred Loss 15,628,490 0.6%
Sum of Claim Count 4,683 2.4%
6 Sum of Incurred Loss 51,677,002 2.0%
Sum of Claim Count 2,418 1.3%
9 Sum of Incurred Loss 316,710,824 12.0%
Sum of Claim Count 28,131 14.6%
Total Sum of Incurred Loss 2,646,926,769 100.0%
Total Sum of Claim Count 192,039 100.0%
87

Exhibit 7A
page 1
Cause of Loss
1--Fire, Lightning, and Removal 2--Wind and Hail
3--Water Damage and Freezing 4--Theft
6--Liability and MedPay 9--All Other
1--Fire, Lightning, and Removal 2--Wind and Hail
Territory 2011 2012 2013 2014 2015 Territory 2011 2012 2013 2014 2015
2 49.5% 51.2% 40.2% 52.5% 30.3% 2 7.5% 18.5% 7.8% 3.6% 3.6%
3 11.4% 1.1% 18.9% 38.7% 4.5% 3 1.4% 11.9% 0.3% 2.2% 1.8%
4 65.4% 46.4% 68.5% 62.8% 10.6% 4 12.2% 18.9% 6.4% 4.8% 4.0%
5 47.3% 35.9% 47.7% 25.6% 24.8% 5 8.4% 23.3% 6.1% 55.0% 2.7%
11 38.5% 38.1% 43.0% 29.8% 21.5% 11 10.4% 14.8% 5.0% 3.5% 3.7%
12 21.3% 23.1% 29.6% 33.9% 3.9% 12 3.9% 11.7% 4.7% 2.6% 9.0%
30 32.2% 35.3% 45.7% 41.6% 13.5% 30 13.6% 14.6% 7.7% 7.7% 2.1%
31 15.7% 41.4% 29.7% 29.9% 4.9% 31 16.2% 15.9% 9.1% 7.3% 1.0%
32 33.9% 60.6% 63.4% 48.2% 49.8% 32 25.2% 17.1% 9.8% 5.2% 3.6%
33 20.8% 40.8% 36.2% 41.2% 25.1% 33 33.0% 25.5% 18.3% 8.6% 2.4%
34 21.9% 28.7% 40.9% 33.2% 8.6% 34 24.0% 34.7% 15.0% 5.4% 1.7%
35 36.5% 46.3% 38.3% 45.4% 40.4% 35 19.8% 12.6% 14.8% 7.2% 1.6%
36 29.5% 45.0% 27.1% 38.5% 10.9% 36 18.9% 13.8% 24.7% 5.0% 2.0%
37 29.7% 37.7% 20.1% 21.9% 13.1% 37 5.8% 6.4% 7.1% 2.9% 1.3%
38 35.1% 62.0% 62.0% 62.3% 25.3% 38 13.0% 12.3% 3.7% 7.1% 6.3%
39 30.7% 54.7% 54.4% 61.0% 24.3% 39 11.4% 19.4% 4.3% 6.7% 2.1%
40 22.2% 33.9% 37.7% 30.6% 7.7% 40 7.6% 20.4% 6.0% 9.3% 2.0%
41 27.0% 52.7% 62.9% 56.7% 16.1% 41 12.5% 19.9% 3.3% 2.7% 1.7%
42 15.3% 42.6% 54.3% 53.0% 22.4% 42 13.2% 15.3% 4.3% 3.8% 2.2%
43 13.6% 16.8% 38.1% 20.4% 5.1% 43 9.4% 25.3% 4.7% 3.8% 8.8%
44 17.0% 38.2% 39.7% 26.7% 6.9% 44 10.6% 24.4% 6.4% 9.7% 9.6%
45 16.9% 44.2% 47.8% 29.0% 26.8% 45 14.5% 15.5% 5.2% 9.8% 1.8%
46 16.0% 42.5% 45.2% 37.0% 16.5% 46 17.4% 17.3% 4.9% 4.4% 2.7%
47 3.9% 56.2% 54.2% 51.1% 30.5% 47 71.8% 6.9% 6.8% 4.6% 3.9%
48 4.9% 52.1% 37.9% 47.3% 33.3% 48 64.1% 7.9% 4.7% 4.6% 3.7%
49 5.5% 45.3% 46.7% 43.3% 25.0% 49 58.2% 9.7% 6.3% 5.9% 2.3%
50 22.6% 39.1% 42.4% 35.7% 24.8% 50 17.5% 14.0% 6.0% 7.6% 2.4%
All 16.6% 40.4% 37.6% 33.8% 10.8% All 27.8% 18.3% 9.5% 7.9% 4.1%
3--Water Damage and Freezing 4--Theft
Territory 2011 2012 2013 2014 2015 Territory 2011 2012 2013 2014 2015
2 22.0% 16.1% 30.2% 32.5% 54.6% 2 4.0% 3.9% 4.5% 2.8% 1.8%
3 49.2% 42.2% 61.2% 39.5% 76.9% 3 14.7% 12.6% 5.5% 3.5% 2.5%
4 14.0% 20.3% 14.2% 18.3% 73.4% 4 1.8% 6.6% 1.9% 2.5% 0.4%
5 23.9% 20.2% 23.3% 13.7% 54.6% 5 2.7% 3.3% 3.4% 0.9% 3.1%
11 27.4% 25.9% 33.1% 51.8% 63.7% 11 4.5% 6.0% 4.8% 3.2% 1.3%
12 39.1% 52.9% 48.7% 50.6% 78.4% 12 3.3% 4.9% 4.3% 3.4% 0.5%
30 24.5% 26.8% 32.4% 31.5% 72.0% 30 3.6% 5.5% 4.5% 1.5% 1.3%
31 30.5% 27.6% 43.7% 47.8% 79.6% 31 1.4% 3.9% 2.8% 2.4% 0.3%
32 17.3% 11.0% 13.5% 25.5% 33.1% 32 5.0% 4.6% 4.0% 3.5% 2.1%
33 22.8% 17.3% 26.0% 30.7% 56.5% 33 6.3% 5.5% 4.1% 4.8% 2.3%
34 25.7% 21.0% 27.1% 43.1% 72.3% 34 3.0% 4.6% 2.7% 2.3% 0.6%
35 20.1% 18.2% 21.2% 32.2% 43.6% 35 3.9% 7.7% 3.5% 3.5% 0.5%
36 28.0% 26.8% 35.2% 39.7% 71.9% 36 2.3% 3.6% 1.2% 1.6% 0.4%
37 50.1% 42.6% 59.9% 63.8% 76.5% 37 1.5% 2.8% 1.0% 1.2% 0.5%
38 19.7% 11.3% 16.0% 21.2% 51.5% 38 3.5% 1.6% 1.8% 2.5% 1.9%
39 28.9% 17.6% 21.5% 23.3% 60.9% 39 7.4% 2.4% 3.9% 1.6% 0.9%
40 32.5% 26.6% 38.3% 44.2% 73.4% 40 2.3% 3.2% 2.4% 1.5% 0.4%
41 29.5% 16.8% 15.8% 25.2% 69.2% 41 7.1% 5.7% 4.3% 2.7% 2.6%
42 34.1% 21.2% 18.5% 28.9% 58.7% 42 6.9% 5.1% 4.8% 2.9% 1.3%
43 35.8% 37.9% 42.8% 59.8% 75.3% 43 2.0% 4.7% 3.4% 4.1% 0.2%
44 31.3% 24.0% 34.5% 49.0% 69.2% 44 1.5% 3.3% 3.2% 2.0% 0.4%
45 32.8% 20.3% 28.7% 42.8% 58.2% 45 4.2% 8.1% 6.4% 6.7% 2.2%
46 29.9% 22.8% 32.8% 41.9% 64.8% 46 1.4% 3.5% 2.9% 2.2% 0.8%
47 11.4% 16.4% 17.0% 23.8% 47.5% 47 0.9% 9.0% 7.3% 5.3% 3.5%
48 11.9% 20.2% 32.5% 26.0% 40.0% 48 1.3% 7.6% 7.7% 4.3% 2.7%
49 16.6% 22.0% 26.6% 35.2% 53.7% 49 0.5% 5.8% 3.3% 1.8% 1.2%
50 27.7% 21.2% 31.6% 36.7% 58.4% 50 2.0% 3.7% 3.5% 2.2% 0.6%
All 26.3% 24.9% 35.6% 43.0% 70.5% All 1.7% 4.1% 2.9% 2.2% 0.6%
Massachusetts Homeowners Multi Peril Insurance Loss Experience
2011-2015 Territory Review--Percentage of Loss Dollars by Cause of Loss
88

Exhibit 7A
page 2
Cause of Loss
1--Fire, Lightning, and Removal 2--Wind and Hail
3--Water Damage and Freezing 4--Theft
6--Liability and MedPay 9--All Other
6--Liability and MedPay
Territory 2011 2012 2013 2014 2015 Territory 2011 2012 2013 2014 2015
2 10.4% 7.5% 7.7% 2.1% 2.9% 2 6.6% 2.8% 9.6% 6.5% 6.8%
3 12.9% 25.8% 0.7% 12.6% 6.1% 3 10.4% 6.4% 13.4% 3.4% 8.3%
4 0.9% 4.3% 2.5% 6.4% 4.0% 4 5.8% 3.5% 6.4% 5.1% 7.6%
5 8.5% 5.5% 8.4% 1.4% 5.3% 5 9.2% 11.7% 11.0% 3.5% 9.5%
11 4.4% 7.8% 6.2% 5.7% 1.8% 11 14.8% 7.4% 7.9% 6.0% 8.1%
12 6.3% 2.3% 5.1% 2.6% 0.5% 12 26.2% 5.1% 7.6% 6.8% 7.8%
30 9.8% 10.9% 4.0% 12.6% 1.1% 30 16.3% 6.9% 5.7% 5.2% 10.0%
31 2.3% 4.4% 4.4% 5.2% 1.1% 31 33.9% 6.7% 10.3% 7.3% 13.0%
32 10.0% 4.4% 4.7% 9.1% 5.6% 32 8.7% 2.3% 4.6% 8.5% 5.9%
33 7.1% 8.6% 5.8% 8.0% 4.8% 33 10.0% 2.3% 9.7% 6.8% 8.8%
34 8.6% 5.4% 6.5% 9.5% 2.2% 34 16.8% 5.7% 7.9% 6.6% 14.6%
35 8.2% 9.8% 14.7% 4.6% 1.9% 35 11.6% 5.5% 7.5% 7.1% 12.0%
36 5.4% 4.4% 3.7% 7.0% 1.6% 36 15.8% 6.5% 8.0% 8.3% 13.3%
37 3.3% 6.1% 3.6% 3.3% 2.6% 37 9.6% 4.4% 8.3% 6.9% 6.0%
38 10.2% 11.1% 10.1% 2.2% 2.1% 38 18.5% 1.7% 6.4% 4.7% 13.0%
39 2.6% 2.2% 5.8% 1.2% 3.5% 39 19.0% 3.6% 10.0% 6.2% 8.2%
40 3.5% 8.5% 7.1% 5.6% 2.2% 40 31.9% 7.4% 8.5% 8.9% 14.3%
41 5.9% 3.0% 7.7% 7.4% 2.8% 41 18.0% 1.8% 5.9% 5.4% 7.6%
42 3.6% 9.9% 7.3% 5.4% 7.0% 42 26.8% 5.9% 10.8% 6.0% 8.4%
43 2.2% 5.5% 2.9% 5.8% 0.2% 43 37.1% 9.8% 8.2% 6.1% 10.4%
44 2.8% 3.6% 6.1% 4.2% 1.7% 44 36.8% 6.5% 10.1% 8.4% 12.2%
45 1.9% 6.7% 3.8% 4.3% 2.2% 45 29.7% 5.2% 8.1% 7.3% 8.7%
46 3.6% 6.2% 6.2% 6.5% 3.1% 46 31.6% 7.7% 7.9% 8.0% 12.1%
47 0.8% 5.4% 8.7% 5.0% 2.9% 47 11.2% 6.1% 6.0% 10.2% 11.7%
48 2.0% 6.8% 7.8% 7.0% 11.9% 48 15.7% 5.4% 9.3% 10.7% 8.3%
49 0.9% 8.5% 7.3% 5.2% 3.5% 49 18.3% 8.7% 9.8% 8.7% 14.3%
50 2.9% 10.6% 6.9% 6.4% 3.4% 50 27.4% 11.4% 9.6% 11.4% 10.4%
All 3.0% 5.8% 5.7% 5.4% 2.0% All 24.6% 6.5% 8.7% 7.7% 12.0%
9--All Other
Massachusetts Homeowners Multi Peril Insurance Loss Experience
2011-2015 Territory Review--Percentage of Loss Dollars by Cause of Loss
89
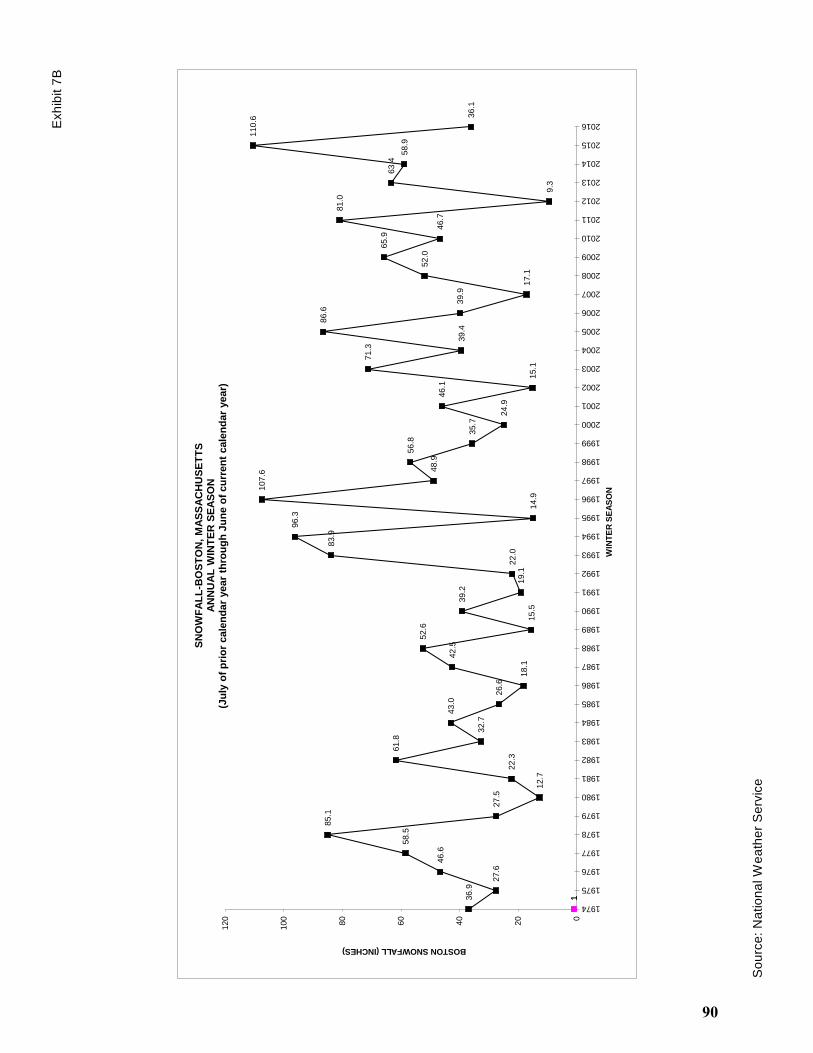
Exh
ibit 7
B
So
urc
e:
Na
tio
na
l W
ea
the
r S
erv
ice
1136.9
27.6
46.6
58.5
85.1
27.5
12.7
22.3
61.8
32.7
43.0
26.6
18.1
42.5
52.6
15.5
39.2
19.1
22.0
83.9
96.3
14.9
107.6
48.9
56.8
35.7
24.9
46.1
15.1
71.3
39.4
86.6
39.9
17.1
52.0
65.9
46.7
81.0
9.3
63.4
58.9
110.6
36.1
0
20
40
60
80
100
120
1974
1975
1976
1977
1978
1979
1980
1981
1982
1983
1984
1985
1986
1987
1988
1989
1990
1991
1992
1993
1994
1995
1996
1997
1998
1999
2000
2001
2002
2003
2004
2005
2006
2007
2008
2009
2010
2011
2012
2013
2014
2015
2016
BOSTON SNOWFALL (INCHES)
WIN
TE
R S
EA
SO
N
SN
OW
FA
LL
-BO
ST
ON
, M
AS
SA
CH
US
ET
TS
AN
NU
AL
WIN
TE
R S
EA
SO
N(J
uly
of
pri
or
cale
nd
ar
year
thro
ug
h J
un
e o
f cu
rren
t cale
nd
ar
year)
90
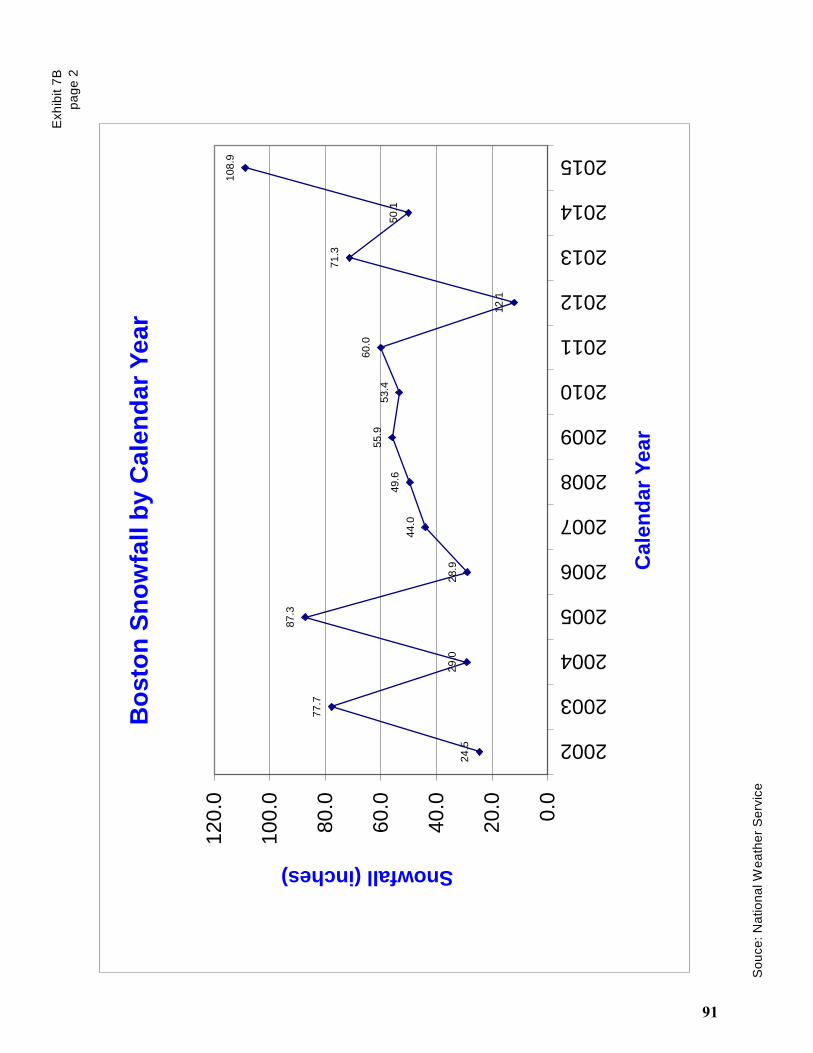
Exh
ibit 7
B
pa
ge
2
24.5
77.7
29.0
87.3
28.9
44.0
49.6
55.9
53.4
60.0
12.1
71.3
50.1
108.9
0.0
20.0
40.0
60.0
80.0
100.0
120.0
2002
2003
2004
2005
2006
2007
2008
2009
2010
2011
2012
2013
2014
2015
Snowfall (inches)
Ca
len
da
r Y
ea
r
Bo
sto
n S
no
wfa
ll b
y C
ale
nd
ar
Year
So
uce
: N
atio
na
l W
ea
the
r S
erv
ice
91
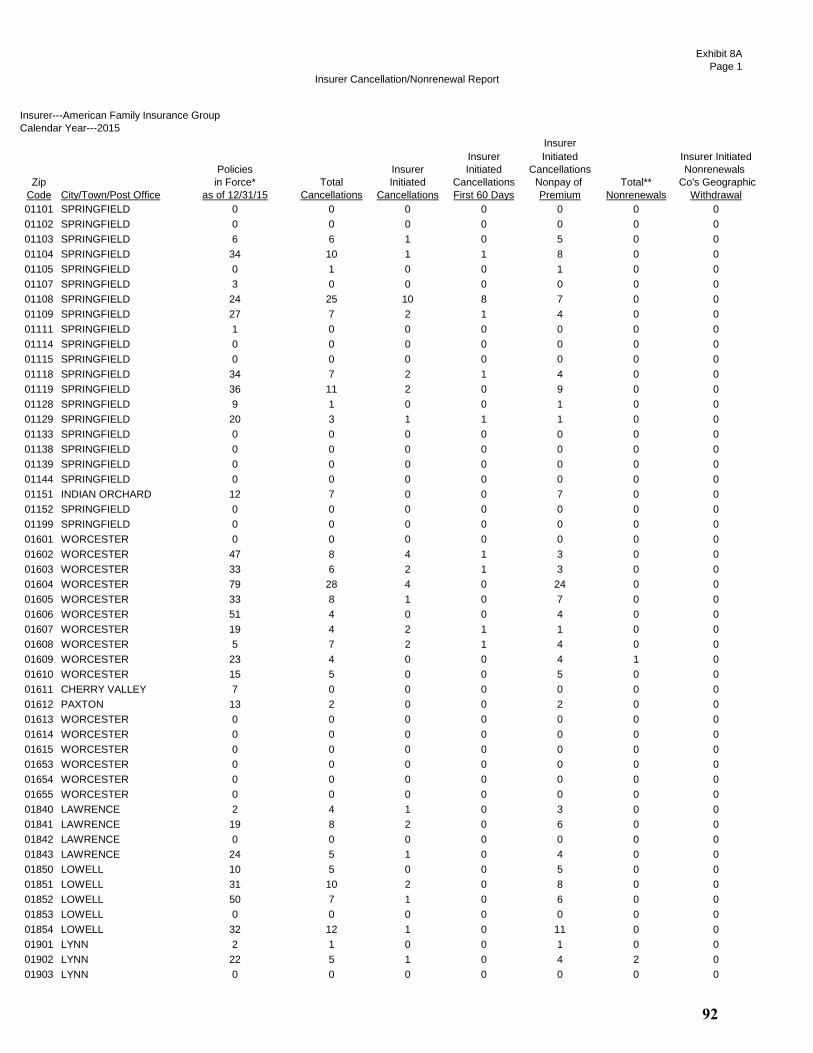
Insurer Cancellation/Nonrenewal Report
Exhibit 8A
Page 1
Insurer---American Family Insurance Group
Calendar Year---2015
Insurer
Insurer Initiated Insurer Initiated
Policies Insurer Initiated Cancellations Nonrenewals
Zip in Force* Total Initiated Cancellations Nonpay of Total** Co's Geographic
Code City/Town/Post Office as of 12/31/15 Cancellations Cancellations First 60 Days Premium Nonrenewals Withdrawal
01101 SPRINGFIELD 0 0 0 0 0 0 0
01102 SPRINGFIELD 0 0 0 0 0 0 0
01103 SPRINGFIELD 6 6 1 0 5 0 0
01104 SPRINGFIELD 34 10 1 1 8 0 0
01105 SPRINGFIELD 0 1 0 0 1 0 0
01107 SPRINGFIELD 3 0 0 0 0 0 0
01108 SPRINGFIELD 24 25 10 8 7 0 0
01109 SPRINGFIELD 27 7 2 1 4 0 0
01111 SPRINGFIELD 1 0 0 0 0 0 0
01114 SPRINGFIELD 0 0 0 0 0 0 0
01115 SPRINGFIELD 0 0 0 0 0 0 0
01118 SPRINGFIELD 34 7 2 1 4 0 0
01119 SPRINGFIELD 36 11 2 0 9 0 0
01128 SPRINGFIELD 9 1 0 0 1 0 0
01129 SPRINGFIELD 20 3 1 1 1 0 0
01133 SPRINGFIELD 0 0 0 0 0 0 0
01138 SPRINGFIELD 0 0 0 0 0 0 0
01139 SPRINGFIELD 0 0 0 0 0 0 0
01144 SPRINGFIELD 0 0 0 0 0 0 0
01151 INDIAN ORCHARD 12 7 0 0 7 0 0
01152 SPRINGFIELD 0 0 0 0 0 0 0
01199 SPRINGFIELD 0 0 0 0 0 0 0
01601 WORCESTER 0 0 0 0 0 0 0
01602 WORCESTER 47 8 4 1 3 0 0
01603 WORCESTER 33 6 2 1 3 0 0
01604 WORCESTER 79 28 4 0 24 0 0
01605 WORCESTER 33 8 1 0 7 0 0
01606 WORCESTER 51 4 0 0 4 0 0
01607 WORCESTER 19 4 2 1 1 0 0
01608 WORCESTER 5 7 2 1 4 0 0
01609 WORCESTER 23 4 0 0 4 1 0
01610 WORCESTER 15 5 0 0 5 0 0
01611 CHERRY VALLEY 7 0 0 0 0 0 0
01612 PAXTON 13 2 0 0 2 0 0
01613 WORCESTER 0 0 0 0 0 0 0
01614 WORCESTER 0 0 0 0 0 0 0
01615 WORCESTER 0 0 0 0 0 0 0
01653 WORCESTER 0 0 0 0 0 0 0
01654 WORCESTER 0 0 0 0 0 0 0
01655 WORCESTER 0 0 0 0 0 0 0
01840 LAWRENCE 2 4 1 0 3 0 0
01841 LAWRENCE 19 8 2 0 6 0 0
01842 LAWRENCE 0 0 0 0 0 0 0
01843 LAWRENCE 24 5 1 0 4 0 0
01850 LOWELL 10 5 0 0 5 0 0
01851 LOWELL 31 10 2 0 8 0 0
01852 LOWELL 50 7 1 0 6 0 0
01853 LOWELL 0 0 0 0 0 0 0
01854 LOWELL 32 12 1 0 11 0 0
01901 LYNN 2 1 0 0 1 0 0
01902 LYNN 22 5 1 0 4 2 0
01903 LYNN 0 0 0 0 0 0 0
92
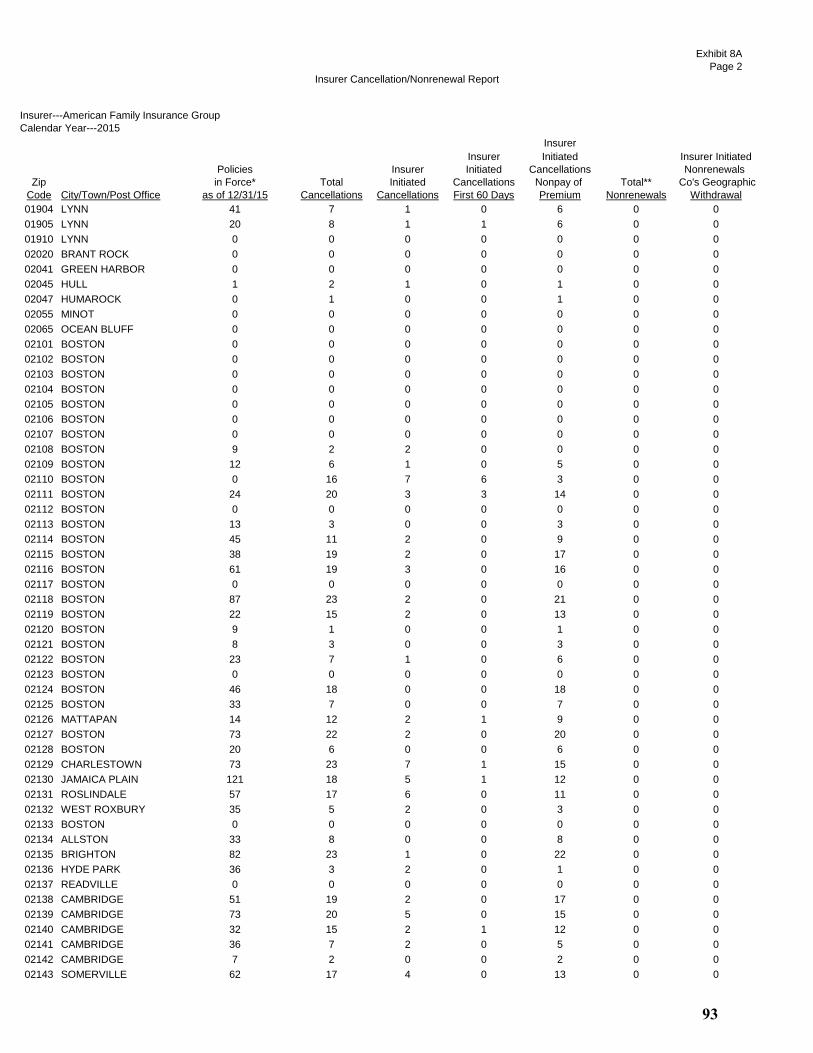
Insurer Cancellation/Nonrenewal Report
Exhibit 8A
Page 2
Insurer---American Family Insurance Group
Calendar Year---2015
Insurer
Insurer Initiated Insurer Initiated
Policies Insurer Initiated Cancellations Nonrenewals
Zip in Force* Total Initiated Cancellations Nonpay of Total** Co's Geographic
Code City/Town/Post Office as of 12/31/15 Cancellations Cancellations First 60 Days Premium Nonrenewals Withdrawal
01904 LYNN 41 7 1 0 6 0 0
01905 LYNN 20 8 1 1 6 0 0
01910 LYNN 0 0 0 0 0 0 0
02020 BRANT ROCK 0 0 0 0 0 0 0
02041 GREEN HARBOR 0 0 0 0 0 0 0
02045 HULL 1 2 1 0 1 0 0
02047 HUMAROCK 0 1 0 0 1 0 0
02055 MINOT 0 0 0 0 0 0 0
02065 OCEAN BLUFF 0 0 0 0 0 0 0
02101 BOSTON 0 0 0 0 0 0 0
02102 BOSTON 0 0 0 0 0 0 0
02103 BOSTON 0 0 0 0 0 0 0
02104 BOSTON 0 0 0 0 0 0 0
02105 BOSTON 0 0 0 0 0 0 0
02106 BOSTON 0 0 0 0 0 0 0
02107 BOSTON 0 0 0 0 0 0 0
02108 BOSTON 9 2 2 0 0 0 0
02109 BOSTON 12 6 1 0 5 0 0
02110 BOSTON 0 16 7 6 3 0 0
02111 BOSTON 24 20 3 3 14 0 0
02112 BOSTON 0 0 0 0 0 0 0
02113 BOSTON 13 3 0 0 3 0 0
02114 BOSTON 45 11 2 0 9 0 0
02115 BOSTON 38 19 2 0 17 0 0
02116 BOSTON 61 19 3 0 16 0 0
02117 BOSTON 0 0 0 0 0 0 0
02118 BOSTON 87 23 2 0 21 0 0
02119 BOSTON 22 15 2 0 13 0 0
02120 BOSTON 9 1 0 0 1 0 0
02121 BOSTON 8 3 0 0 3 0 0
02122 BOSTON 23 7 1 0 6 0 0
02123 BOSTON 0 0 0 0 0 0 0
02124 BOSTON 46 18 0 0 18 0 0
02125 BOSTON 33 7 0 0 7 0 0
02126 MATTAPAN 14 12 2 1 9 0 0
02127 BOSTON 73 22 2 0 20 0 0
02128 BOSTON 20 6 0 0 6 0 0
02129 CHARLESTOWN 73 23 7 1 15 0 0
02130 JAMAICA PLAIN 121 18 5 1 12 0 0
02131 ROSLINDALE 57 17 6 0 11 0 0
02132 WEST ROXBURY 35 5 2 0 3 0 0
02133 BOSTON 0 0 0 0 0 0 0
02134 ALLSTON 33 8 0 0 8 0 0
02135 BRIGHTON 82 23 1 0 22 0 0
02136 HYDE PARK 36 3 2 0 1 0 0
02137 READVILLE 0 0 0 0 0 0 0
02138 CAMBRIDGE 51 19 2 0 17 0 0
02139 CAMBRIDGE 73 20 5 0 15 0 0
02140 CAMBRIDGE 32 15 2 1 12 0 0
02141 CAMBRIDGE 36 7 2 0 5 0 0
02142 CAMBRIDGE 7 2 0 0 2 0 0
02143 SOMERVILLE 62 17 4 0 13 0 0
93
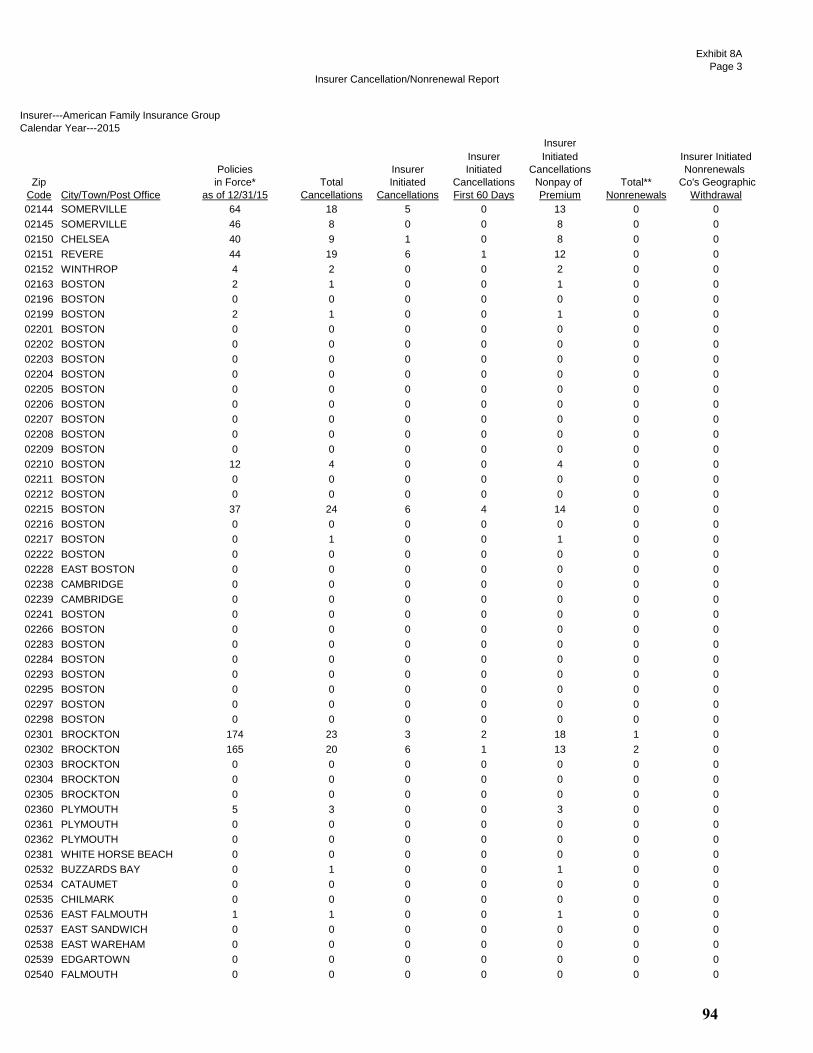
Insurer Cancellation/Nonrenewal Report
Exhibit 8A
Page 3
Insurer---American Family Insurance Group
Calendar Year---2015
Insurer
Insurer Initiated Insurer Initiated
Policies Insurer Initiated Cancellations Nonrenewals
Zip in Force* Total Initiated Cancellations Nonpay of Total** Co's Geographic
Code City/Town/Post Office as of 12/31/15 Cancellations Cancellations First 60 Days Premium Nonrenewals Withdrawal
02144 SOMERVILLE 64 18 5 0 13 0 0
02145 SOMERVILLE 46 8 0 0 8 0 0
02150 CHELSEA 40 9 1 0 8 0 0
02151 REVERE 44 19 6 1 12 0 0
02152 WINTHROP 4 2 0 0 2 0 0
02163 BOSTON 2 1 0 0 1 0 0
02196 BOSTON 0 0 0 0 0 0 0
02199 BOSTON 2 1 0 0 1 0 0
02201 BOSTON 0 0 0 0 0 0 0
02202 BOSTON 0 0 0 0 0 0 0
02203 BOSTON 0 0 0 0 0 0 0
02204 BOSTON 0 0 0 0 0 0 0
02205 BOSTON 0 0 0 0 0 0 0
02206 BOSTON 0 0 0 0 0 0 0
02207 BOSTON 0 0 0 0 0 0 0
02208 BOSTON 0 0 0 0 0 0 0
02209 BOSTON 0 0 0 0 0 0 0
02210 BOSTON 12 4 0 0 4 0 0
02211 BOSTON 0 0 0 0 0 0 0
02212 BOSTON 0 0 0 0 0 0 0
02215 BOSTON 37 24 6 4 14 0 0
02216 BOSTON 0 0 0 0 0 0 0
02217 BOSTON 0 1 0 0 1 0 0
02222 BOSTON 0 0 0 0 0 0 0
02228 EAST BOSTON 0 0 0 0 0 0 0
02238 CAMBRIDGE 0 0 0 0 0 0 0
02239 CAMBRIDGE 0 0 0 0 0 0 0
02241 BOSTON 0 0 0 0 0 0 0
02266 BOSTON 0 0 0 0 0 0 0
02283 BOSTON 0 0 0 0 0 0 0
02284 BOSTON 0 0 0 0 0 0 0
02293 BOSTON 0 0 0 0 0 0 0
02295 BOSTON 0 0 0 0 0 0 0
02297 BOSTON 0 0 0 0 0 0 0
02298 BOSTON 0 0 0 0 0 0 0
02301 BROCKTON 174 23 3 2 18 1 0
02302 BROCKTON 165 20 6 1 13 2 0
02303 BROCKTON 0 0 0 0 0 0 0
02304 BROCKTON 0 0 0 0 0 0 0
02305 BROCKTON 0 0 0 0 0 0 0
02360 PLYMOUTH 5 3 0 0 3 0 0
02361 PLYMOUTH 0 0 0 0 0 0 0
02362 PLYMOUTH 0 0 0 0 0 0 0
02381 WHITE HORSE BEACH 0 0 0 0 0 0 0
02532 BUZZARDS BAY 0 1 0 0 1 0 0
02534 CATAUMET 0 0 0 0 0 0 0
02535 CHILMARK 0 0 0 0 0 0 0
02536 EAST FALMOUTH 1 1 0 0 1 0 0
02537 EAST SANDWICH 0 0 0 0 0 0 0
02538 EAST WAREHAM 0 0 0 0 0 0 0
02539 EDGARTOWN 0 0 0 0 0 0 0
02540 FALMOUTH 0 0 0 0 0 0 0
94
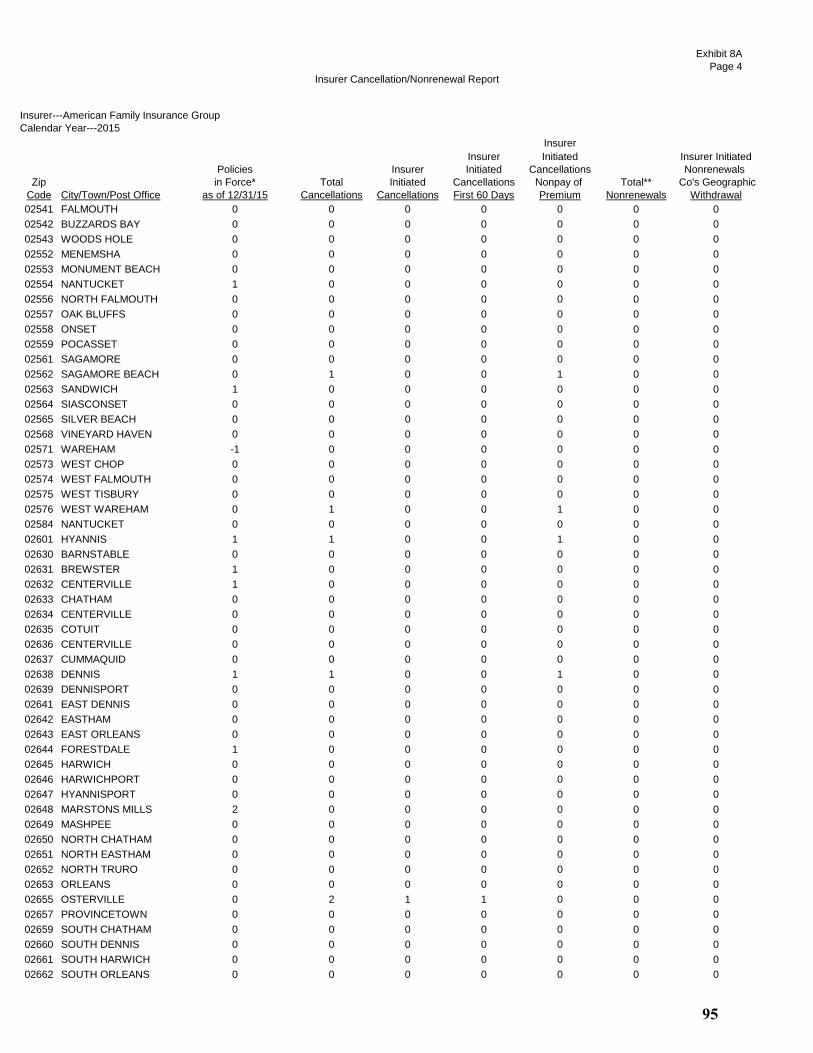
Insurer Cancellation/Nonrenewal Report
Exhibit 8A
Page 4
Insurer---American Family Insurance Group
Calendar Year---2015
Insurer
Insurer Initiated Insurer Initiated
Policies Insurer Initiated Cancellations Nonrenewals
Zip in Force* Total Initiated Cancellations Nonpay of Total** Co's Geographic
Code City/Town/Post Office as of 12/31/15 Cancellations Cancellations First 60 Days Premium Nonrenewals Withdrawal
02541 FALMOUTH 0 0 0 0 0 0 0
02542 BUZZARDS BAY 0 0 0 0 0 0 0
02543 WOODS HOLE 0 0 0 0 0 0 0
02552 MENEMSHA 0 0 0 0 0 0 0
02553 MONUMENT BEACH 0 0 0 0 0 0 0
02554 NANTUCKET 1 0 0 0 0 0 0
02556 NORTH FALMOUTH 0 0 0 0 0 0 0
02557 OAK BLUFFS 0 0 0 0 0 0 0
02558 ONSET 0 0 0 0 0 0 0
02559 POCASSET 0 0 0 0 0 0 0
02561 SAGAMORE 0 0 0 0 0 0 0
02562 SAGAMORE BEACH 0 1 0 0 1 0 0
02563 SANDWICH 1 0 0 0 0 0 0
02564 SIASCONSET 0 0 0 0 0 0 0
02565 SILVER BEACH 0 0 0 0 0 0 0
02568 VINEYARD HAVEN 0 0 0 0 0 0 0
02571 WAREHAM -1 0 0 0 0 0 0
02573 WEST CHOP 0 0 0 0 0 0 0
02574 WEST FALMOUTH 0 0 0 0 0 0 0
02575 WEST TISBURY 0 0 0 0 0 0 0
02576 WEST WAREHAM 0 1 0 0 1 0 0
02584 NANTUCKET 0 0 0 0 0 0 0
02601 HYANNIS 1 1 0 0 1 0 0
02630 BARNSTABLE 0 0 0 0 0 0 0
02631 BREWSTER 1 0 0 0 0 0 0
02632 CENTERVILLE 1 0 0 0 0 0 0
02633 CHATHAM 0 0 0 0 0 0 0
02634 CENTERVILLE 0 0 0 0 0 0 0
02635 COTUIT 0 0 0 0 0 0 0
02636 CENTERVILLE 0 0 0 0 0 0 0
02637 CUMMAQUID 0 0 0 0 0 0 0
02638 DENNIS 1 1 0 0 1 0 0
02639 DENNISPORT 0 0 0 0 0 0 0
02641 EAST DENNIS 0 0 0 0 0 0 0
02642 EASTHAM 0 0 0 0 0 0 0
02643 EAST ORLEANS 0 0 0 0 0 0 0
02644 FORESTDALE 1 0 0 0 0 0 0
02645 HARWICH 0 0 0 0 0 0 0
02646 HARWICHPORT 0 0 0 0 0 0 0
02647 HYANNISPORT 0 0 0 0 0 0 0
02648 MARSTONS MILLS 2 0 0 0 0 0 0
02649 MASHPEE 0 0 0 0 0 0 0
02650 NORTH CHATHAM 0 0 0 0 0 0 0
02651 NORTH EASTHAM 0 0 0 0 0 0 0
02652 NORTH TRURO 0 0 0 0 0 0 0
02653 ORLEANS 0 0 0 0 0 0 0
02655 OSTERVILLE 0 2 1 1 0 0 0
02657 PROVINCETOWN 0 0 0 0 0 0 0
02659 SOUTH CHATHAM 0 0 0 0 0 0 0
02660 SOUTH DENNIS 0 0 0 0 0 0 0
02661 SOUTH HARWICH 0 0 0 0 0 0 0
02662 SOUTH ORLEANS 0 0 0 0 0 0 0
95
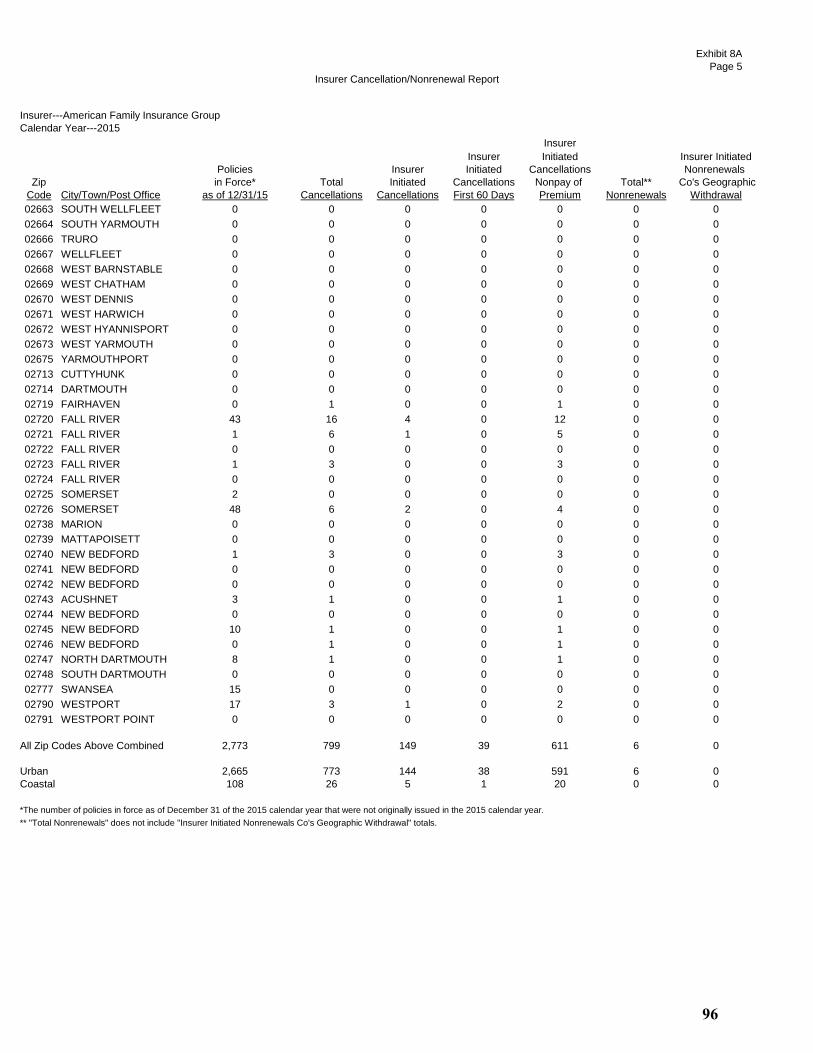
Insurer Cancellation/Nonrenewal Report
Exhibit 8A
Page 5
Insurer---American Family Insurance Group
Calendar Year---2015
Insurer
Insurer Initiated Insurer Initiated
Policies Insurer Initiated Cancellations Nonrenewals
Zip in Force* Total Initiated Cancellations Nonpay of Total** Co's Geographic
Code City/Town/Post Office as of 12/31/15 Cancellations Cancellations First 60 Days Premium Nonrenewals Withdrawal
02663 SOUTH WELLFLEET 0 0 0 0 0 0 0
02664 SOUTH YARMOUTH 0 0 0 0 0 0 0
02666 TRURO 0 0 0 0 0 0 0
02667 WELLFLEET 0 0 0 0 0 0 0
02668 WEST BARNSTABLE 0 0 0 0 0 0 0
02669 WEST CHATHAM 0 0 0 0 0 0 0
02670 WEST DENNIS 0 0 0 0 0 0 0
02671 WEST HARWICH 0 0 0 0 0 0 0
02672 WEST HYANNISPORT 0 0 0 0 0 0 0
02673 WEST YARMOUTH 0 0 0 0 0 0 0
02675 YARMOUTHPORT 0 0 0 0 0 0 0
02713 CUTTYHUNK 0 0 0 0 0 0 0
02714 DARTMOUTH 0 0 0 0 0 0 0
02719 FAIRHAVEN 0 1 0 0 1 0 0
02720 FALL RIVER 43 16 4 0 12 0 0
02721 FALL RIVER 1 6 1 0 5 0 0
02722 FALL RIVER 0 0 0 0 0 0 0
02723 FALL RIVER 1 3 0 0 3 0 0
02724 FALL RIVER 0 0 0 0 0 0 0
02725 SOMERSET 2 0 0 0 0 0 0
02726 SOMERSET 48 6 2 0 4 0 0
02738 MARION 0 0 0 0 0 0 0
02739 MATTAPOISETT 0 0 0 0 0 0 0
02740 NEW BEDFORD 1 3 0 0 3 0 0
02741 NEW BEDFORD 0 0 0 0 0 0 0
02742 NEW BEDFORD 0 0 0 0 0 0 0
02743 ACUSHNET 3 1 0 0 1 0 0
02744 NEW BEDFORD 0 0 0 0 0 0 0
02745 NEW BEDFORD 10 1 0 0 1 0 0
02746 NEW BEDFORD 0 1 0 0 1 0 0
02747 NORTH DARTMOUTH 8 1 0 0 1 0 0
02748 SOUTH DARTMOUTH 0 0 0 0 0 0 0
02777 SWANSEA 15 0 0 0 0 0 0
02790 WESTPORT 17 3 1 0 2 0 0
02791 WESTPORT POINT 0 0 0 0 0 0 0
All Zip Codes Above Combined 2,773 799 149 39 611 6 0
Urban 2,665 773 144 38 591 6 0
Coastal 108 26 5 1 20 0 0
*The number of policies in force as of December 31 of the 2015 calendar year that were not originally issued in the 2015 calendar year.
** "Total Nonrenewals" does not include "Insurer Initiated Nonrenewals Co's Geographic Withdrawal" totals.
96

Insurer Cancellation/Nonrenewal Report
Exhibit 8A
Page 6
Insurer---American International Group
Calendar Year---2015
Insurer
Insurer Initiated Insurer Initiated
Policies Insurer Initiated Cancellations Nonrenewals
Zip in Force* Total Initiated Cancellations Nonpay of Total** Co's Geographic
Code City/Town/Post Office as of 12/31/15 Cancellations Cancellations First 60 Days Premium Nonrenewals Withdrawal
01101 SPRINGFIELD 0 0 0 0 0 0 0
01102 SPRINGFIELD 0 0 0 0 0 0 0
01103 SPRINGFIELD 0 0 0 0 0 0 0
01104 SPRINGFIELD 0 0 0 0 0 0 0
01105 SPRINGFIELD 0 1 0 0 0 0 0
01107 SPRINGFIELD 0 0 0 0 0 0 0
01108 SPRINGFIELD 0 0 0 0 0 0 0
01109 SPRINGFIELD 0 0 0 0 0 0 0
01111 SPRINGFIELD 0 0 0 0 0 0 0
01114 SPRINGFIELD 0 0 0 0 0 0 0
01115 SPRINGFIELD 0 0 0 0 0 0 0
01118 SPRINGFIELD 0 0 0 0 0 0 0
01119 SPRINGFIELD 0 0 0 0 0 0 0
01128 SPRINGFIELD 0 0 0 0 0 0 0
01129 SPRINGFIELD 0 0 0 0 0 0 0
01133 SPRINGFIELD 0 0 0 0 0 0 0
01138 SPRINGFIELD 0 0 0 0 0 0 0
01139 SPRINGFIELD 0 0 0 0 0 0 0
01144 SPRINGFIELD 0 0 0 0 0 0 0
01151 INDIAN ORCHARD 0 0 0 0 0 0 0
01152 SPRINGFIELD 0 0 0 0 0 0 0
01199 SPRINGFIELD 0 0 0 0 0 0 0
01601 WORCESTER 0 0 0 0 0 0 0
01602 WORCESTER 1 0 0 0 0 0 0
01603 WORCESTER 0 0 0 0 0 0 0
01604 WORCESTER 0 0 0 0 0 0 0
01605 WORCESTER 0 0 0 0 0 0 0
01606 WORCESTER 0 0 0 0 0 0 0
01607 WORCESTER 0 0 0 0 0 0 0
01608 WORCESTER 0 0 0 0 0 0 0
01609 WORCESTER 7 0 0 0 0 0 0
01610 WORCESTER 1 0 0 0 0 0 0
01611 CHERRY VALLEY 0 0 0 0 0 0 0
01612 PAXTON 1 0 0 0 0 0 0
01613 WORCESTER 0 0 0 0 0 0 0
01614 WORCESTER 0 0 0 0 0 0 0
01615 WORCESTER 0 0 0 0 0 0 0
01653 WORCESTER 1 0 0 0 0 0 0
01654 WORCESTER 0 0 0 0 0 0 0
01655 WORCESTER 0 0 0 0 0 0 0
01840 LAWRENCE 0 0 0 0 0 0 0
01841 LAWRENCE 0 0 0 0 0 0 0
01842 LAWRENCE 0 0 0 0 0 0 0
01843 LAWRENCE 0 0 0 0 0 0 0
01850 LOWELL 0 0 0 0 0 0 0
01851 LOWELL 0 0 0 0 0 0 0
01852 LOWELL 1 0 0 0 0 0 0
01853 LOWELL 0 0 0 0 0 0 0
01854 LOWELL 0 0 0 0 0 0 0
01901 LYNN 0 0 0 0 0 0 0
01902 LYNN 1 0 0 0 0 0 0
01903 LYNN 0 0 0 0 0 0 0
97

Insurer Cancellation/Nonrenewal Report
Exhibit 8A
Page 7
Insurer---American International Group
Calendar Year---2015
Insurer
Insurer Initiated Insurer Initiated
Policies Insurer Initiated Cancellations Nonrenewals
Zip in Force* Total Initiated Cancellations Nonpay of Total** Co's Geographic
Code City/Town/Post Office as of 12/31/15 Cancellations Cancellations First 60 Days Premium Nonrenewals Withdrawal
01904 LYNN 0 0 0 0 0 0 0
01905 LYNN 0 0 0 0 0 0 0
01910 LYNN 0 0 0 0 0 0 0
02020 BRANT ROCK 1 0 0 0 0 0 0
02041 GREEN HARBOR 0 0 0 0 0 0 0
02045 HULL 12 6 0 0 0 0 0
02047 HUMAROCK 0 0 0 0 0 0 0
02055 MINOT 0 0 0 0 0 0 0
02065 OCEAN BLUFF 0 0 0 0 0 0 0
02101 BOSTON 1 0 0 0 0 0 0
02102 BOSTON 0 0 0 0 0 0 0
02103 BOSTON 0 0 0 0 0 0 0
02104 BOSTON 0 0 0 0 0 0 0
02105 BOSTON 0 0 0 0 0 0 0
02106 BOSTON 0 0 0 0 0 0 0
02107 BOSTON 0 0 0 0 0 0 0
02108 BOSTON 39 4 0 0 0 0 0
02109 BOSTON 23 3 0 0 0 0 0
02110 BOSTON 21 3 0 0 0 0 0
02111 BOSTON 26 6 0 0 1 0 0
02112 BOSTON 0 0 0 0 0 0 0
02113 BOSTON 3 1 0 0 0 0 0
02114 BOSTON 26 4 0 0 0 0 0
02115 BOSTON 23 5 0 0 0 0 0
02116 BOSTON 184 17 0 0 0 0 0
02117 BOSTON 0 0 0 0 0 0 0
02118 BOSTON 39 7 0 0 0 0 0
02119 BOSTON 3 1 0 0 0 0 0
02120 BOSTON 1 0 0 0 0 0 0
02121 BOSTON 0 0 0 0 0 0 0
02122 BOSTON 1 0 0 0 0 0 0
02123 BOSTON 0 0 0 0 0 0 0
02124 BOSTON 0 0 0 0 0 0 0
02125 BOSTON 0 0 0 0 0 0 0
02126 MATTAPAN 0 0 0 0 0 0 0
02127 BOSTON 10 2 0 0 0 0 0
02128 BOSTON 3 0 0 0 0 0 0
02129 CHARLESTOWN 12 1 0 0 0 0 0
02130 JAMAICA PLAIN 7 1 0 0 0 0 0
02131 ROSLINDALE 2 1 0 0 0 0 0
02132 WEST ROXBURY 1 0 0 0 0 0 0
02133 BOSTON 1 0 0 0 0 0 0
02134 ALLSTON 1 0 0 0 0 0 0
02135 BRIGHTON 5 0 0 0 0 0 0
02136 HYDE PARK 1 0 0 0 0 0 0
02137 READVILLE 0 0 0 0 0 0 0
02138 CAMBRIDGE 44 1 0 0 0 0 0
02139 CAMBRIDGE 2 0 0 0 0 0 0
02140 CAMBRIDGE 8 0 0 0 0 0 0
02141 CAMBRIDGE 4 2 0 0 0 0 0
02142 CAMBRIDGE 4 0 0 0 0 0 0
02143 SOMERVILLE 3 0 0 0 0 0 0
98

Insurer Cancellation/Nonrenewal Report
Exhibit 8A
Page 8
Insurer---American International Group
Calendar Year---2015
Insurer
Insurer Initiated Insurer Initiated
Policies Insurer Initiated Cancellations Nonrenewals
Zip in Force* Total Initiated Cancellations Nonpay of Total** Co's Geographic
Code City/Town/Post Office as of 12/31/15 Cancellations Cancellations First 60 Days Premium Nonrenewals Withdrawal
02144 SOMERVILLE 3 0 0 0 0 0 0
02145 SOMERVILLE 0 0 0 0 0 0 0
02150 CHELSEA 0 0 0 0 0 0 0
02151 REVERE 1 0 0 0 0 0 0
02152 WINTHROP 4 0 0 0 0 0 0
02163 BOSTON 0 0 0 0 0 0 0
02196 BOSTON 0 0 0 0 0 0 0
02199 BOSTON 6 2 0 0 0 0 0
02201 BOSTON 0 0 0 0 0 0 0
02202 BOSTON 0 0 0 0 0 0 0
02203 BOSTON 0 0 0 0 0 0 0
02204 BOSTON 0 0 0 0 0 0 0
02205 BOSTON 0 0 0 0 0 0 0
02206 BOSTON 0 0 0 0 0 0 0
02207 BOSTON 0 0 0 0 0 0 0
02208 BOSTON 0 0 0 0 0 0 0
02209 BOSTON 0 0 0 0 0 0 0
02210 BOSTON 4 1 0 0 0 0 0
02211 BOSTON 0 0 0 0 0 0 0
02212 BOSTON 0 0 0 0 0 0 0
02215 BOSTON 6 2 0 0 0 0 0
02216 BOSTON 0 0 0 0 0 0 0
02217 BOSTON 0 0 0 0 0 0 0
02222 BOSTON 0 0 0 0 0 0 0
02228 EAST BOSTON 0 0 0 0 0 0 0
02238 CAMBRIDGE 0 0 0 0 0 0 0
02239 CAMBRIDGE 0 0 0 0 0 0 0
02241 BOSTON 0 0 0 0 0 0 0
02266 BOSTON 0 0 0 0 0 0 0
02283 BOSTON 0 0 0 0 0 0 0
02284 BOSTON 0 0 0 0 0 0 0
02293 BOSTON 0 0 0 0 0 0 0
02295 BOSTON 0 0 0 0 0 0 0
02297 BOSTON 0 0 0 0 0 0 0
02298 BOSTON 0 0 0 0 0 0 0
02301 BROCKTON 1 0 0 0 0 0 0
02302 BROCKTON 0 0 0 0 0 0 0
02303 BROCKTON 0 0 0 0 0 0 0
02304 BROCKTON 0 0 0 0 0 0 0
02305 BROCKTON 0 0 0 0 0 0 0
02360 PLYMOUTH 22 4 0 0 0 0 0
02361 PLYMOUTH 0 0 0 0 0 0 0
02362 PLYMOUTH 1 0 0 0 0 0 0
02381 WHITE HORSE BEACH 0 0 0 0 0 0 0
02532 BUZZARDS BAY 6 0 0 0 0 0 0
02534 CATAUMET 9 0 0 0 0 0 0
02535 CHILMARK 55 6 0 0 0 0 0
02536 EAST FALMOUTH 23 5 0 0 0 0 0
02537 EAST SANDWICH 6 3 0 0 0 0 0
02538 EAST WAREHAM 0 0 0 0 0 0 0
02539 EDGARTOWN 117 13 0 0 0 0 0
02540 FALMOUTH 43 5 0 0 0 0 0
99

Insurer Cancellation/Nonrenewal Report
Exhibit 8A
Page 9
Insurer---American International Group
Calendar Year---2015
Insurer
Insurer Initiated Insurer Initiated
Policies Insurer Initiated Cancellations Nonrenewals
Zip in Force* Total Initiated Cancellations Nonpay of Total** Co's Geographic
Code City/Town/Post Office as of 12/31/15 Cancellations Cancellations First 60 Days Premium Nonrenewals Withdrawal
02541 FALMOUTH 5 0 0 0 0 0 0
02542 BUZZARDS BAY 0 0 0 0 0 0 0
02543 WOODS HOLE 10 0 0 0 0 1 0
02552 MENEMSHA 1 0 0 0 0 0 0
02553 MONUMENT BEACH 2 0 0 0 0 0 0
02554 NANTUCKET 308 49 0 0 1 0 0
02556 NORTH FALMOUTH 25 2 0 0 2 0 0
02557 OAK BLUFFS 12 2 0 0 0 0 0
02558 ONSET 3 0 0 0 0 0 0
02559 POCASSET 11 0 0 0 0 0 0
02561 SAGAMORE 0 0 0 0 0 0 0
02562 SAGAMORE BEACH 2 0 0 0 0 0 0
02563 SANDWICH 4 0 0 0 0 0 0
02564 SIASCONSET 32 1 0 0 0 0 0
02565 SILVER BEACH 0 0 0 0 0 0 0
02568 VINEYARD HAVEN 43 6 0 0 0 0 0
02571 WAREHAM 9 0 0 0 0 0 0
02573 WEST CHOP 0 0 0 0 0 0 0
02574 WEST FALMOUTH 13 1 0 0 0 0 0
02575 WEST TISBURY 17 1 0 0 0 0 0
02576 WEST WAREHAM 0 0 0 0 0 0 0
02584 NANTUCKET 4 1 0 0 0 0 0
02601 HYANNIS 5 0 0 0 0 0 0
02630 BARNSTABLE 6 1 0 0 0 0 0
02631 BREWSTER 21 2 0 0 0 0 0
02632 CENTERVILLE 18 1 0 0 0 0 0
02633 CHATHAM 70 8 0 0 1 0 0
02634 CENTERVILLE 0 0 0 0 0 0 0
02635 COTUIT 19 3 0 0 0 0 0
02636 CENTERVILLE 2 0 0 0 0 0 0
02637 CUMMAQUID 1 2 0 0 0 0 0
02638 DENNIS 12 4 0 0 0 0 0
02639 DENNISPORT 1 0 0 0 0 0 0
02641 EAST DENNIS 9 2 0 0 0 0 0
02642 EASTHAM 5 2 0 0 0 0 0
02643 EAST ORLEANS 10 1 0 0 0 0 0
02644 FORESTDALE 1 0 0 0 0 0 0
02645 HARWICH 12 0 0 0 0 0 0
02646 HARWICHPORT 11 3 0 0 0 0 0
02647 HYANNISPORT 10 1 0 0 0 0 0
02648 MARSTONS MILLS 10 0 0 0 0 0 0
02649 MASHPEE 61 12 0 0 1 0 0
02650 NORTH CHATHAM 21 3 0 0 0 0 0
02651 NORTH EASTHAM 0 0 0 0 0 0 0
02652 NORTH TRURO 2 0 0 0 0 0 0
02653 ORLEANS 25 4 0 0 0 0 0
02655 OSTERVILLE 81 11 0 0 0 0 0
02657 PROVINCETOWN 11 3 0 0 0 0 0
02659 SOUTH CHATHAM 4 0 0 0 0 0 0
02660 SOUTH DENNIS 1 0 0 0 0 0 0
02661 SOUTH HARWICH 1 0 0 0 0 0 0
02662 SOUTH ORLEANS 7 0 0 0 0 0 0
100

Insurer Cancellation/Nonrenewal Report
Exhibit 8A
Page 10
Insurer---American International Group
Calendar Year---2015
Insurer
Insurer Initiated Insurer Initiated
Policies Insurer Initiated Cancellations Nonrenewals
Zip in Force* Total Initiated Cancellations Nonpay of Total** Co's Geographic
Code City/Town/Post Office as of 12/31/15 Cancellations Cancellations First 60 Days Premium Nonrenewals Withdrawal
02663 SOUTH WELLFLEET 1 0 0 0 0 0 0
02664 SOUTH YARMOUTH 5 0 0 0 0 0 0
02666 TRURO 11 3 0 0 0 0 0
02667 WELLFLEET 21 1 0 0 0 0 0
02668 WEST BARNSTABLE 0 0 0 0 0 0 0
02669 WEST CHATHAM 9 1 0 0 0 0 0
02670 WEST DENNIS 0 1 0 0 0 0 0
02671 WEST HARWICH 4 1 0 0 0 0 0
02672 WEST HYANNISPORT 4 0 0 0 0 0 0
02673 WEST YARMOUTH 13 2 0 0 0 0 0
02675 YARMOUTHPORT 5 2 0 0 0 0 0
02713 CUTTYHUNK 1 0 0 0 0 0 0
02714 DARTMOUTH 0 1 0 0 1 0 0
02719 FAIRHAVEN 8 0 0 0 0 0 0
02720 FALL RIVER 2 1 0 0 0 0 0
02721 FALL RIVER 0 0 0 0 0 0 0
02722 FALL RIVER 0 0 0 0 0 0 0
02723 FALL RIVER 0 0 0 0 0 0 0
02724 FALL RIVER 0 0 0 0 0 0 0
02725 SOMERSET 0 0 0 0 0 0 0
02726 SOMERSET 2 0 0 0 0 0 0
02738 MARION 26 3 0 0 0 1 0
02739 MATTAPOISETT 14 4 0 0 0 0 0
02740 NEW BEDFORD 5 0 0 0 0 0 0
02741 NEW BEDFORD 0 0 0 0 0 0 0
02742 NEW BEDFORD 0 0 0 0 0 0 0
02743 ACUSHNET 1 1 0 0 0 0 0
02744 NEW BEDFORD 0 1 0 0 0 0 0
02745 NEW BEDFORD 0 0 0 0 0 0 0
02746 NEW BEDFORD 2 0 0 0 0 0 0
02747 NORTH DARTMOUTH 4 0 0 0 0 0 0
02748 SOUTH DARTMOUTH 89 7 0 0 0 0 0
02777 SWANSEA 3 0 0 0 0 0 0
02790 WESTPORT 30 3 0 0 0 0 0
02791 WESTPORT POINT 6 0 0 0 0 0 0
All Zip Codes Above Combined 2,035 265 0 0 7 2 0
Urban 545 67 0 0 1 0 0
Coastal 1,490 198 0 0 6 2 0
*The number of policies in force as of December 31 of the 2015 calendar year that were not originally issued in the 2015 calendar year.
** "Total Nonrenewals" does not include "Insurer Initiated Nonrenewals Co's Geographic Withdrawal" totals.
101
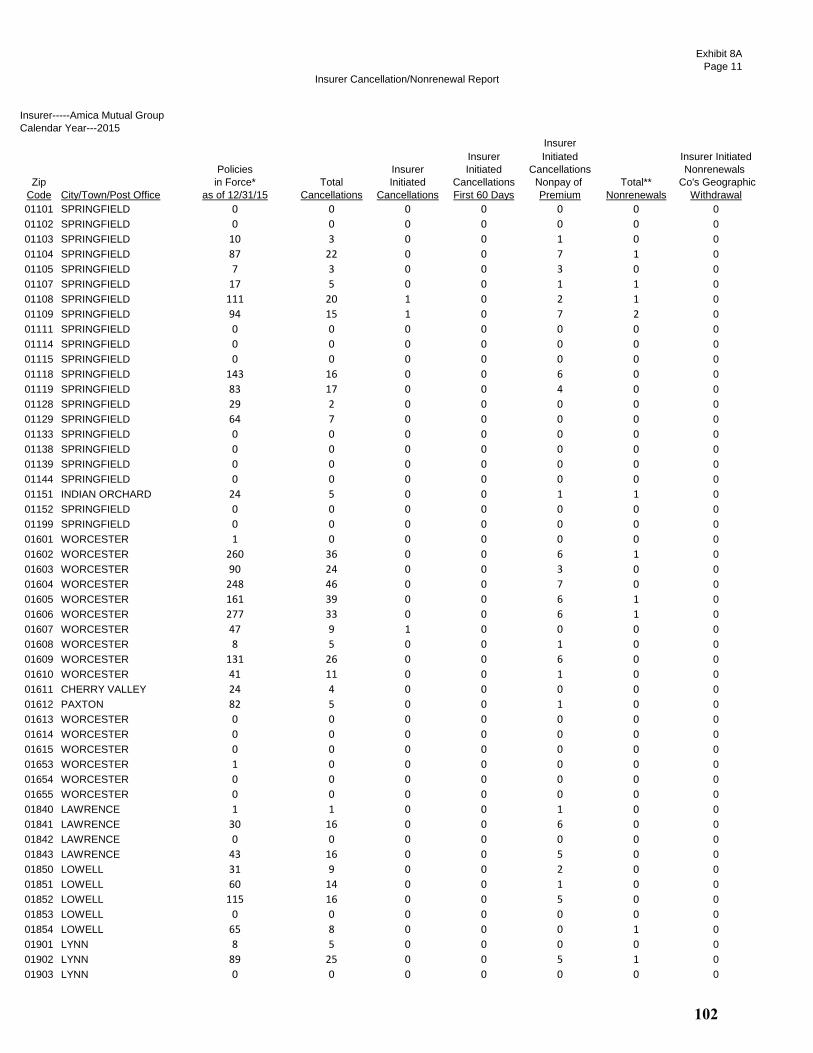
Insurer Cancellation/Nonrenewal Report
Exhibit 8A
Page 11
Insurer-----Amica Mutual Group
Calendar Year---2015
Insurer
Insurer Initiated Insurer Initiated
Policies Insurer Initiated Cancellations Nonrenewals
Zip in Force* Total Initiated Cancellations Nonpay of Total** Co's Geographic
Code City/Town/Post Office as of 12/31/15 Cancellations Cancellations First 60 Days Premium Nonrenewals Withdrawal
01101 SPRINGFIELD 0 0 0 0 0 0 0
01102 SPRINGFIELD 0 0 0 0 0 0 0
01103 SPRINGFIELD 10 3 0 0 1 0 0
01104 SPRINGFIELD 87 22 0 0 7 1 0
01105 SPRINGFIELD 7 3 0 0 3 0 0
01107 SPRINGFIELD 17 5 0 0 1 1 0
01108 SPRINGFIELD 111 20 1 0 2 1 0
01109 SPRINGFIELD 94 15 1 0 7 2 0
01111 SPRINGFIELD 0 0 0 0 0 0 0
01114 SPRINGFIELD 0 0 0 0 0 0 0
01115 SPRINGFIELD 0 0 0 0 0 0 0
01118 SPRINGFIELD 143 16 0 0 6 0 0
01119 SPRINGFIELD 83 17 0 0 4 0 0
01128 SPRINGFIELD 29 2 0 0 0 0 0
01129 SPRINGFIELD 64 7 0 0 0 0 0
01133 SPRINGFIELD 0 0 0 0 0 0 0
01138 SPRINGFIELD 0 0 0 0 0 0 0
01139 SPRINGFIELD 0 0 0 0 0 0 0
01144 SPRINGFIELD 0 0 0 0 0 0 0
01151 INDIAN ORCHARD 24 5 0 0 1 1 0
01152 SPRINGFIELD 0 0 0 0 0 0 0
01199 SPRINGFIELD 0 0 0 0 0 0 0
01601 WORCESTER 1 0 0 0 0 0 0
01602 WORCESTER 260 36 0 0 6 1 0
01603 WORCESTER 90 24 0 0 3 0 0
01604 WORCESTER 248 46 0 0 7 0 0
01605 WORCESTER 161 39 0 0 6 1 0
01606 WORCESTER 277 33 0 0 6 1 0
01607 WORCESTER 47 9 1 0 0 0 0
01608 WORCESTER 8 5 0 0 1 0 0
01609 WORCESTER 131 26 0 0 6 0 0
01610 WORCESTER 41 11 0 0 1 0 0
01611 CHERRY VALLEY 24 4 0 0 0 0 0
01612 PAXTON 82 5 0 0 1 0 0
01613 WORCESTER 0 0 0 0 0 0 0
01614 WORCESTER 0 0 0 0 0 0 0
01615 WORCESTER 0 0 0 0 0 0 0
01653 WORCESTER 1 0 0 0 0 0 0
01654 WORCESTER 0 0 0 0 0 0 0
01655 WORCESTER 0 0 0 0 0 0 0
01840 LAWRENCE 1 1 0 0 1 0 0
01841 LAWRENCE 30 16 0 0 6 0 0
01842 LAWRENCE 0 0 0 0 0 0 0
01843 LAWRENCE 43 16 0 0 5 0 0
01850 LOWELL 31 9 0 0 2 0 0
01851 LOWELL 60 14 0 0 1 0 0
01852 LOWELL 115 16 0 0 5 0 0
01853 LOWELL 0 0 0 0 0 0 0
01854 LOWELL 65 8 0 0 0 1 0
01901 LYNN 8 5 0 0 0 0 0
01902 LYNN 89 25 0 0 5 1 0
01903 LYNN 0 0 0 0 0 0 0
102
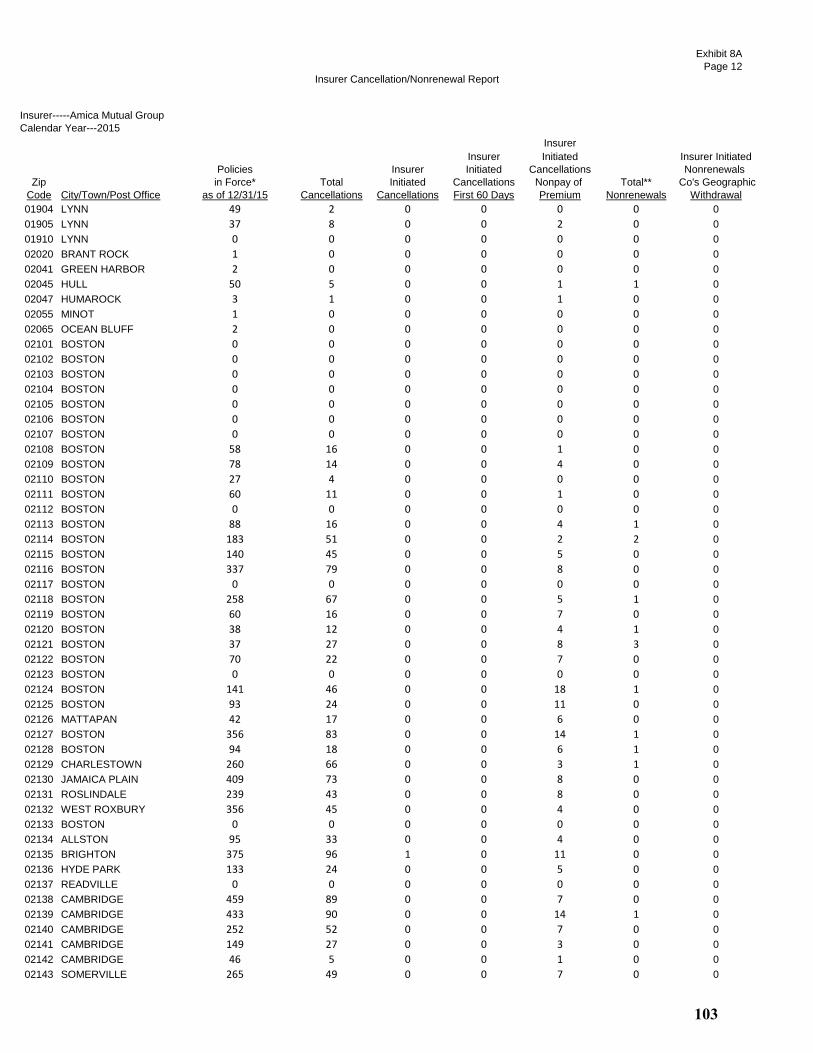
Insurer Cancellation/Nonrenewal Report
Exhibit 8A
Page 12
Insurer-----Amica Mutual Group
Calendar Year---2015
Insurer
Insurer Initiated Insurer Initiated
Policies Insurer Initiated Cancellations Nonrenewals
Zip in Force* Total Initiated Cancellations Nonpay of Total** Co's Geographic
Code City/Town/Post Office as of 12/31/15 Cancellations Cancellations First 60 Days Premium Nonrenewals Withdrawal
01904 LYNN 49 2 0 0 0 0 0
01905 LYNN 37 8 0 0 2 0 0
01910 LYNN 0 0 0 0 0 0 0
02020 BRANT ROCK 1 0 0 0 0 0 0
02041 GREEN HARBOR 2 0 0 0 0 0 0
02045 HULL 50 5 0 0 1 1 0
02047 HUMAROCK 3 1 0 0 1 0 0
02055 MINOT 1 0 0 0 0 0 0
02065 OCEAN BLUFF 2 0 0 0 0 0 0
02101 BOSTON 0 0 0 0 0 0 0
02102 BOSTON 0 0 0 0 0 0 0
02103 BOSTON 0 0 0 0 0 0 0
02104 BOSTON 0 0 0 0 0 0 0
02105 BOSTON 0 0 0 0 0 0 0
02106 BOSTON 0 0 0 0 0 0 0
02107 BOSTON 0 0 0 0 0 0 0
02108 BOSTON 58 16 0 0 1 0 0
02109 BOSTON 78 14 0 0 4 0 0
02110 BOSTON 27 4 0 0 0 0 0
02111 BOSTON 60 11 0 0 1 0 0
02112 BOSTON 0 0 0 0 0 0 0
02113 BOSTON 88 16 0 0 4 1 0
02114 BOSTON 183 51 0 0 2 2 0
02115 BOSTON 140 45 0 0 5 0 0
02116 BOSTON 337 79 0 0 8 0 0
02117 BOSTON 0 0 0 0 0 0 0
02118 BOSTON 258 67 0 0 5 1 0
02119 BOSTON 60 16 0 0 7 0 0
02120 BOSTON 38 12 0 0 4 1 0
02121 BOSTON 37 27 0 0 8 3 0
02122 BOSTON 70 22 0 0 7 0 0
02123 BOSTON 0 0 0 0 0 0 0
02124 BOSTON 141 46 0 0 18 1 0
02125 BOSTON 93 24 0 0 11 0 0
02126 MATTAPAN 42 17 0 0 6 0 0
02127 BOSTON 356 83 0 0 14 1 0
02128 BOSTON 94 18 0 0 6 1 0
02129 CHARLESTOWN 260 66 0 0 3 1 0
02130 JAMAICA PLAIN 409 73 0 0 8 0 0
02131 ROSLINDALE 239 43 0 0 8 0 0
02132 WEST ROXBURY 356 45 0 0 4 0 0
02133 BOSTON 0 0 0 0 0 0 0
02134 ALLSTON 95 33 0 0 4 0 0
02135 BRIGHTON 375 96 1 0 11 0 0
02136 HYDE PARK 133 24 0 0 5 0 0
02137 READVILLE 0 0 0 0 0 0 0
02138 CAMBRIDGE 459 89 0 0 7 0 0
02139 CAMBRIDGE 433 90 0 0 14 1 0
02140 CAMBRIDGE 252 52 0 0 7 0 0
02141 CAMBRIDGE 149 27 0 0 3 0 0
02142 CAMBRIDGE 46 5 0 0 1 0 0
02143 SOMERVILLE 265 49 0 0 7 0 0
103
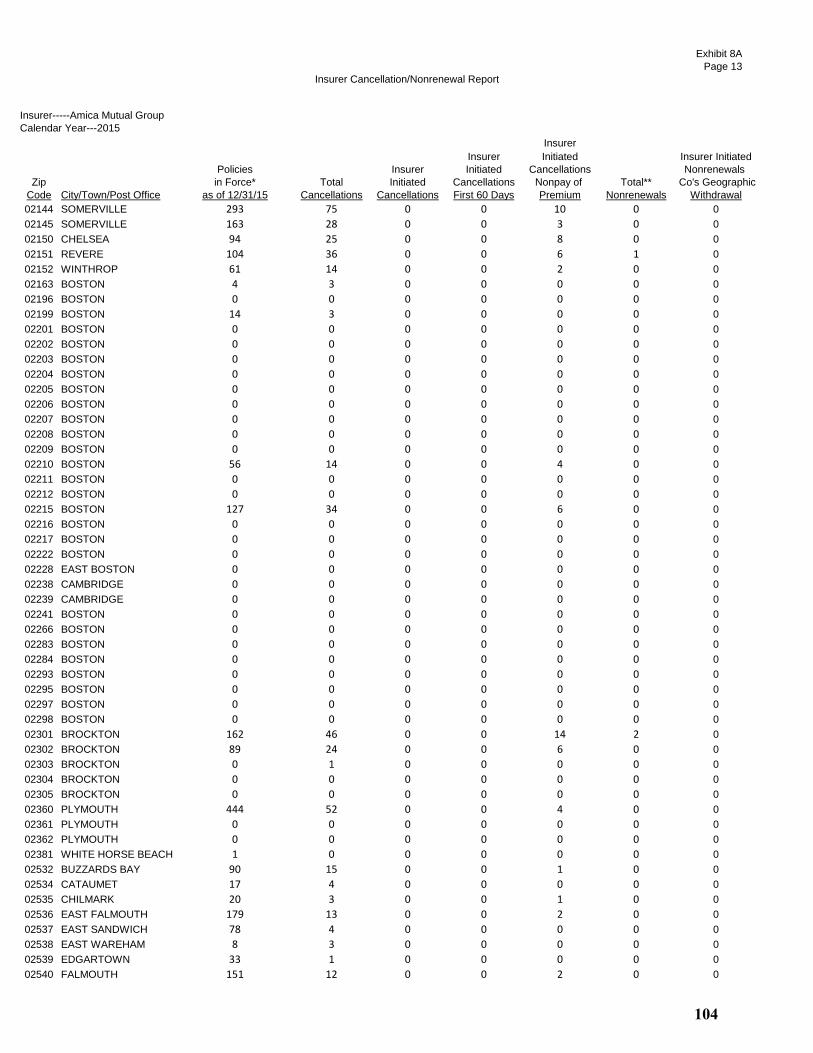
Insurer Cancellation/Nonrenewal Report
Exhibit 8A
Page 13
Insurer-----Amica Mutual Group
Calendar Year---2015
Insurer
Insurer Initiated Insurer Initiated
Policies Insurer Initiated Cancellations Nonrenewals
Zip in Force* Total Initiated Cancellations Nonpay of Total** Co's Geographic
Code City/Town/Post Office as of 12/31/15 Cancellations Cancellations First 60 Days Premium Nonrenewals Withdrawal
02144 SOMERVILLE 293 75 0 0 10 0 0
02145 SOMERVILLE 163 28 0 0 3 0 0
02150 CHELSEA 94 25 0 0 8 0 0
02151 REVERE 104 36 0 0 6 1 0
02152 WINTHROP 61 14 0 0 2 0 0
02163 BOSTON 4 3 0 0 0 0 0
02196 BOSTON 0 0 0 0 0 0 0
02199 BOSTON 14 3 0 0 0 0 0
02201 BOSTON 0 0 0 0 0 0 0
02202 BOSTON 0 0 0 0 0 0 0
02203 BOSTON 0 0 0 0 0 0 0
02204 BOSTON 0 0 0 0 0 0 0
02205 BOSTON 0 0 0 0 0 0 0
02206 BOSTON 0 0 0 0 0 0 0
02207 BOSTON 0 0 0 0 0 0 0
02208 BOSTON 0 0 0 0 0 0 0
02209 BOSTON 0 0 0 0 0 0 0
02210 BOSTON 56 14 0 0 4 0 0
02211 BOSTON 0 0 0 0 0 0 0
02212 BOSTON 0 0 0 0 0 0 0
02215 BOSTON 127 34 0 0 6 0 0
02216 BOSTON 0 0 0 0 0 0 0
02217 BOSTON 0 0 0 0 0 0 0
02222 BOSTON 0 0 0 0 0 0 0
02228 EAST BOSTON 0 0 0 0 0 0 0
02238 CAMBRIDGE 0 0 0 0 0 0 0
02239 CAMBRIDGE 0 0 0 0 0 0 0
02241 BOSTON 0 0 0 0 0 0 0
02266 BOSTON 0 0 0 0 0 0 0
02283 BOSTON 0 0 0 0 0 0 0
02284 BOSTON 0 0 0 0 0 0 0
02293 BOSTON 0 0 0 0 0 0 0
02295 BOSTON 0 0 0 0 0 0 0
02297 BOSTON 0 0 0 0 0 0 0
02298 BOSTON 0 0 0 0 0 0 0
02301 BROCKTON 162 46 0 0 14 2 0
02302 BROCKTON 89 24 0 0 6 0 0
02303 BROCKTON 0 1 0 0 0 0 0
02304 BROCKTON 0 0 0 0 0 0 0
02305 BROCKTON 0 0 0 0 0 0 0
02360 PLYMOUTH 444 52 0 0 4 0 0
02361 PLYMOUTH 0 0 0 0 0 0 0
02362 PLYMOUTH 0 0 0 0 0 0 0
02381 WHITE HORSE BEACH 1 0 0 0 0 0 0
02532 BUZZARDS BAY 90 15 0 0 1 0 0
02534 CATAUMET 17 4 0 0 0 0 0
02535 CHILMARK 20 3 0 0 1 0 0
02536 EAST FALMOUTH 179 13 0 0 2 0 0
02537 EAST SANDWICH 78 4 0 0 0 0 0
02538 EAST WAREHAM 8 3 0 0 0 0 0
02539 EDGARTOWN 33 1 0 0 0 0 0
02540 FALMOUTH 151 12 0 0 2 0 0
104

Insurer Cancellation/Nonrenewal Report
Exhibit 8A
Page 14
Insurer-----Amica Mutual Group
Calendar Year---2015
Insurer
Insurer Initiated Insurer Initiated
Policies Insurer Initiated Cancellations Nonrenewals
Zip in Force* Total Initiated Cancellations Nonpay of Total** Co's Geographic
Code City/Town/Post Office as of 12/31/15 Cancellations Cancellations First 60 Days Premium Nonrenewals Withdrawal
02541 FALMOUTH 3 0 0 0 0 0 0
02542 BUZZARDS BAY 0 0 0 0 0 0 0
02543 WOODS HOLE 8 0 0 0 0 0 0
02552 MENEMSHA 0 0 0 0 0 0 0
02553 MONUMENT BEACH 4 0 0 0 0 0 0
02554 NANTUCKET 44 3 0 0 1 0 0
02556 NORTH FALMOUTH 65 0 0 0 0 0 0
02557 OAK BLUFFS 22 4 0 0 0 0 0
02558 ONSET 11 7 0 0 0 0 0
02559 POCASSET 50 7 0 0 0 0 0
02561 SAGAMORE 5 0 0 0 0 0 0
02562 SAGAMORE BEACH 29 4 0 0 1 0 0
02563 SANDWICH 113 15 0 0 0 0 0
02564 SIASCONSET 0 0 0 0 0 0 0
02565 SILVER BEACH 0 0 0 0 0 0 0
02568 VINEYARD HAVEN 26 2 0 0 0 1 0
02571 WAREHAM 60 4 0 0 0 0 0
02573 WEST CHOP 0 0 0 0 0 0 0
02574 WEST FALMOUTH 25 1 0 0 0 0 0
02575 WEST TISBURY 7 2 0 0 0 0 0
02576 WEST WAREHAM 6 0 0 0 0 0 0
02584 NANTUCKET 1 0 0 0 0 0 0
02601 HYANNIS 61 14 0 0 2 0 0
02630 BARNSTABLE 41 5 0 0 0 0 0
02631 BREWSTER 197 16 0 0 1 2 0
02632 CENTERVILLE 111 14 0 0 3 0 0
02633 CHATHAM 100 8 0 0 0 0 0
02634 CENTERVILLE 0 0 0 0 0 0 0
02635 COTUIT 38 2 0 0 0 0 0
02636 CENTERVILLE 1 0 0 0 0 0 0
02637 CUMMAQUID 8 0 0 0 0 0 0
02638 DENNIS 70 6 0 0 1 0 0
02639 DENNISPORT 47 5 0 0 0 0 0
02641 EAST DENNIS 49 3 0 0 0 0 0
02642 EASTHAM 86 7 0 0 0 0 0
02643 EAST ORLEANS 25 1 0 0 0 0 0
02644 FORESTDALE 24 2 0 0 2 0 0
02645 HARWICH 118 8 0 0 1 0 0
02646 HARWICHPORT 56 5 0 0 0 1 0
02647 HYANNISPORT 2 0 0 0 0 0 0
02648 MARSTONS MILLS 56 6 0 0 0 0 0
02649 MASHPEE 233 23 0 0 2 0 0
02650 NORTH CHATHAM 13 0 0 0 0 0 0
02651 NORTH EASTHAM 27 3 0 0 0 0 0
02652 NORTH TRURO 3 1 0 0 0 0 0
02653 ORLEANS 106 18 1 0 1 0 0
02655 OSTERVILLE 52 8 0 0 0 0 0
02657 PROVINCETOWN 23 1 0 0 0 0 0
02659 SOUTH CHATHAM 28 0 0 0 0 0 0
02660 SOUTH DENNIS 110 5 0 0 0 0 0
02661 SOUTH HARWICH 5 1 0 0 0 0 0
02662 SOUTH ORLEANS 10 2 0 0 0 0 0
105
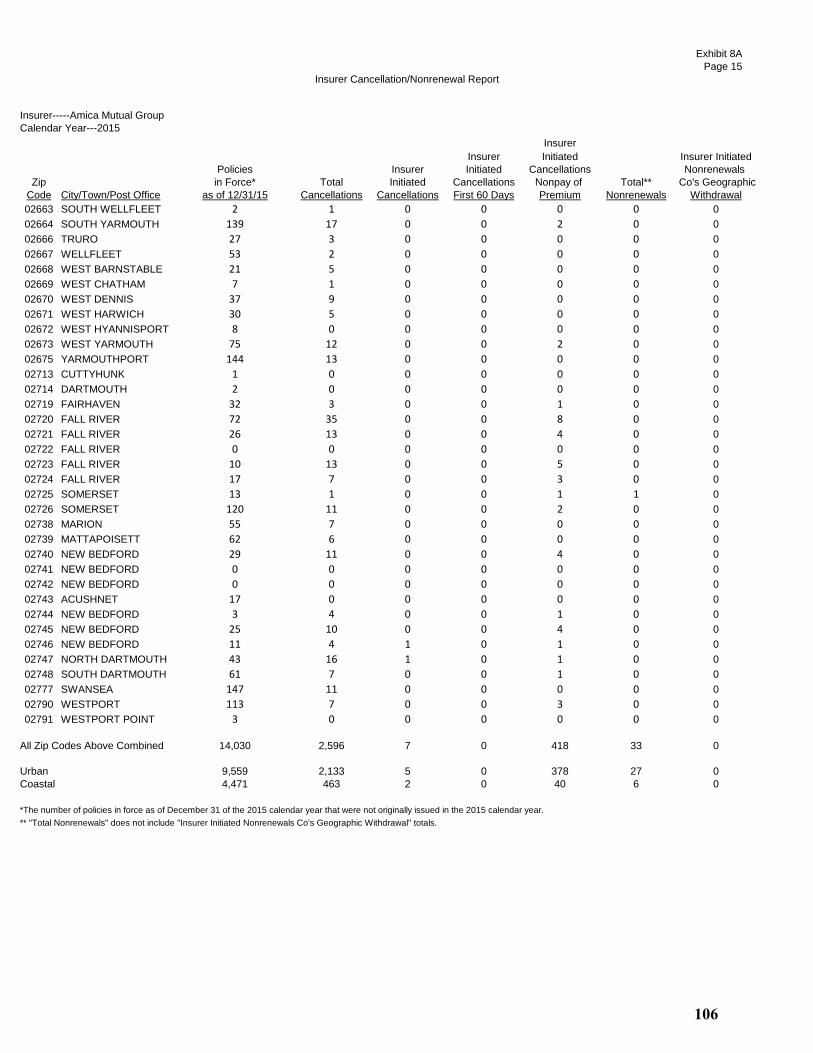
Insurer Cancellation/Nonrenewal Report
Exhibit 8A
Page 15
Insurer-----Amica Mutual Group
Calendar Year---2015
Insurer
Insurer Initiated Insurer Initiated
Policies Insurer Initiated Cancellations Nonrenewals
Zip in Force* Total Initiated Cancellations Nonpay of Total** Co's Geographic
Code City/Town/Post Office as of 12/31/15 Cancellations Cancellations First 60 Days Premium Nonrenewals Withdrawal
02663 SOUTH WELLFLEET 2 1 0 0 0 0 0
02664 SOUTH YARMOUTH 139 17 0 0 2 0 0
02666 TRURO 27 3 0 0 0 0 0
02667 WELLFLEET 53 2 0 0 0 0 0
02668 WEST BARNSTABLE 21 5 0 0 0 0 0
02669 WEST CHATHAM 7 1 0 0 0 0 0
02670 WEST DENNIS 37 9 0 0 0 0 0
02671 WEST HARWICH 30 5 0 0 0 0 0
02672 WEST HYANNISPORT 8 0 0 0 0 0 0
02673 WEST YARMOUTH 75 12 0 0 2 0 0
02675 YARMOUTHPORT 144 13 0 0 0 0 0
02713 CUTTYHUNK 1 0 0 0 0 0 0
02714 DARTMOUTH 2 0 0 0 0 0 0
02719 FAIRHAVEN 32 3 0 0 1 0 0
02720 FALL RIVER 72 35 0 0 8 0 0
02721 FALL RIVER 26 13 0 0 4 0 0
02722 FALL RIVER 0 0 0 0 0 0 0
02723 FALL RIVER 10 13 0 0 5 0 0
02724 FALL RIVER 17 7 0 0 3 0 0
02725 SOMERSET 13 1 0 0 1 1 0
02726 SOMERSET 120 11 0 0 2 0 0
02738 MARION 55 7 0 0 0 0 0
02739 MATTAPOISETT 62 6 0 0 0 0 0
02740 NEW BEDFORD 29 11 0 0 4 0 0
02741 NEW BEDFORD 0 0 0 0 0 0 0
02742 NEW BEDFORD 0 0 0 0 0 0 0
02743 ACUSHNET 17 0 0 0 0 0 0
02744 NEW BEDFORD 3 4 0 0 1 0 0
02745 NEW BEDFORD 25 10 0 0 4 0 0
02746 NEW BEDFORD 11 4 1 0 1 0 0
02747 NORTH DARTMOUTH 43 16 1 0 1 0 0
02748 SOUTH DARTMOUTH 61 7 0 0 1 0 0
02777 SWANSEA 147 11 0 0 0 0 0
02790 WESTPORT 113 7 0 0 3 0 0
02791 WESTPORT POINT 3 0 0 0 0 0 0
All Zip Codes Above Combined 14,030 2,596 7 0 418 33 0
Urban 9,559 2,133 5 0 378 27 0
Coastal 4,471 463 2 0 40 6 0
*The number of policies in force as of December 31 of the 2015 calendar year that were not originally issued in the 2015 calendar year.
** "Total Nonrenewals" does not include "Insurer Initiated Nonrenewals Co's Geographic Withdrawal" totals.
106
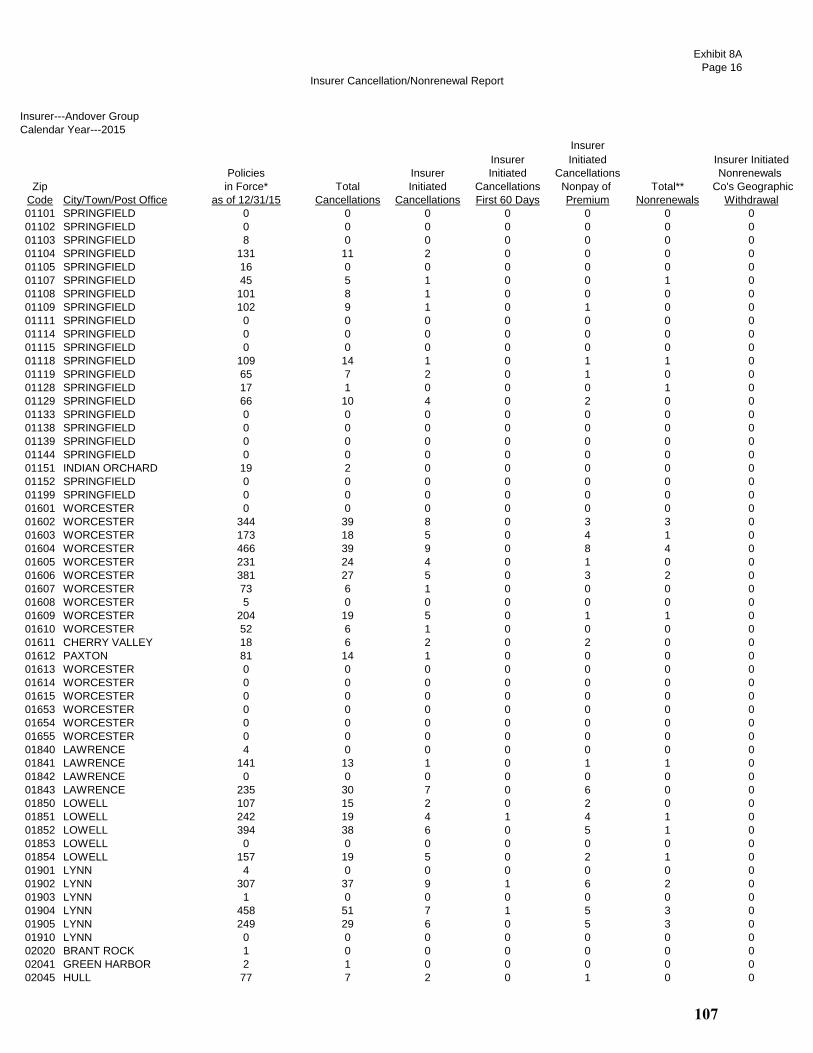
Insurer Cancellation/Nonrenewal Report
Exhibit 8A
Page 16
Insurer---Andover Group
Calendar Year---2015
Insurer
Insurer Initiated Insurer Initiated
Policies Insurer Initiated Cancellations Nonrenewals
Zip in Force* Total Initiated Cancellations Nonpay of Total** Co's Geographic
Code City/Town/Post Office as of 12/31/15 Cancellations Cancellations First 60 Days Premium Nonrenewals Withdrawal
01101 SPRINGFIELD 0 0 0 0 0 0 0
01102 SPRINGFIELD 0 0 0 0 0 0 0
01103 SPRINGFIELD 8 0 0 0 0 0 0
01104 SPRINGFIELD 131 11 2 0 0 0 0
01105 SPRINGFIELD 16 0 0 0 0 0 0
01107 SPRINGFIELD 45 5 1 0 0 1 0
01108 SPRINGFIELD 101 8 1 0 0 0 0
01109 SPRINGFIELD 102 9 1 0 1 0 0
01111 SPRINGFIELD 0 0 0 0 0 0 0
01114 SPRINGFIELD 0 0 0 0 0 0 0
01115 SPRINGFIELD 0 0 0 0 0 0 0
01118 SPRINGFIELD 109 14 1 0 1 1 0
01119 SPRINGFIELD 65 7 2 0 1 0 0
01128 SPRINGFIELD 17 1 0 0 0 1 0
01129 SPRINGFIELD 66 10 4 0 2 0 0
01133 SPRINGFIELD 0 0 0 0 0 0 0
01138 SPRINGFIELD 0 0 0 0 0 0 0
01139 SPRINGFIELD 0 0 0 0 0 0 0
01144 SPRINGFIELD 0 0 0 0 0 0 0
01151 INDIAN ORCHARD 19 2 0 0 0 0 0
01152 SPRINGFIELD 0 0 0 0 0 0 0
01199 SPRINGFIELD 0 0 0 0 0 0 0
01601 WORCESTER 0 0 0 0 0 0 0
01602 WORCESTER 344 39 8 0 3 3 0
01603 WORCESTER 173 18 5 0 4 1 0
01604 WORCESTER 466 39 9 0 8 4 0
01605 WORCESTER 231 24 4 0 1 0 0
01606 WORCESTER 381 27 5 0 3 2 0
01607 WORCESTER 73 6 1 0 0 0 0
01608 WORCESTER 5 0 0 0 0 0 0
01609 WORCESTER 204 19 5 0 1 1 0
01610 WORCESTER 52 6 1 0 0 0 0
01611 CHERRY VALLEY 18 6 2 0 2 0 0
01612 PAXTON 81 14 1 0 0 0 0
01613 WORCESTER 0 0 0 0 0 0 0
01614 WORCESTER 0 0 0 0 0 0 0
01615 WORCESTER 0 0 0 0 0 0 0
01653 WORCESTER 0 0 0 0 0 0 0
01654 WORCESTER 0 0 0 0 0 0 0
01655 WORCESTER 0 0 0 0 0 0 0
01840 LAWRENCE 4 0 0 0 0 0 0
01841 LAWRENCE 141 13 1 0 1 1 0
01842 LAWRENCE 0 0 0 0 0 0 0
01843 LAWRENCE 235 30 7 0 6 0 0
01850 LOWELL 107 15 2 0 2 0 0
01851 LOWELL 242 19 4 1 4 1 0
01852 LOWELL 394 38 6 0 5 1 0
01853 LOWELL 0 0 0 0 0 0 0
01854 LOWELL 157 19 5 0 2 1 0
01901 LYNN 4 0 0 0 0 0 0
01902 LYNN 307 37 9 1 6 2 0
01903 LYNN 1 0 0 0 0 0 0
01904 LYNN 458 51 7 1 5 3 0
01905 LYNN 249 29 6 0 5 3 0
01910 LYNN 0 0 0 0 0 0 0
02020 BRANT ROCK 1 0 0 0 0 0 0
02041 GREEN HARBOR 2 1 0 0 0 0 0
02045 HULL 77 7 2 0 1 0 0
107

Insurer Cancellation/Nonrenewal Report
Exhibit 8A
Page 17
Insurer---Andover Group
Calendar Year---2015
Insurer
Insurer Initiated Insurer Initiated
Policies Insurer Initiated Cancellations Nonrenewals
Zip in Force* Total Initiated Cancellations Nonpay of Total** Co's Geographic
Code City/Town/Post Office as of 12/31/15 Cancellations Cancellations First 60 Days Premium Nonrenewals Withdrawal
02047 HUMAROCK 4 0 0 0 0 0 0
02055 MINOT 0 0 0 0 0 0 0
02065 OCEAN BLUFF 0 0 0 0 0 0 0
02101 BOSTON 1 0 0 0 0 0 0
02102 BOSTON 0 0 0 0 0 0 0
02103 BOSTON 0 0 0 0 0 0 0
02104 BOSTON 0 0 0 0 0 0 0
02105 BOSTON 0 0 0 0 0 0 0
02106 BOSTON 0 0 0 0 0 0 0
02107 BOSTON 0 0 0 0 0 0 0
02108 BOSTON 29 7 2 0 2 0 0
02109 BOSTON 46 10 1 0 1 0 0
02110 BOSTON 42 3 1 0 1 0 0
02111 BOSTON 35 6 2 0 2 0 0
02112 BOSTON 0 0 0 0 0 0 0
02113 BOSTON 53 5 0 0 0 0 0
02114 BOSTON 78 18 3 0 2 1 0
02115 BOSTON 69 7 0 0 0 0 0
02116 BOSTON 163 29 7 0 7 1 0
02117 BOSTON 0 0 0 0 0 0 0
02118 BOSTON 98 19 0 0 0 0 0
02119 BOSTON 13 2 0 0 0 0 0
02120 BOSTON 5 2 1 0 1 0 0
02121 BOSTON 9 0 0 0 0 1 0
02122 BOSTON 42 8 4 0 2 0 0
02123 BOSTON 0 0 0 0 0 0 0
02124 BOSTON 58 11 2 0 1 0 0
02125 BOSTON 31 5 0 0 0 0 0
02126 MATTAPAN 21 0 0 0 0 0 0
02127 BOSTON 128 18 2 0 2 1 0
02128 BOSTON 50 5 0 0 0 1 0
02129 CHARLESTOWN 135 30 4 0 3 0 0
02130 JAMAICA PLAIN 170 22 3 0 3 1 0
02131 ROSLINDALE 148 15 2 0 1 0 0
02132 WEST ROXBURY 335 18 3 0 3 1 0
02133 BOSTON 0 0 0 0 0 0 0
02134 ALLSTON 72 1 0 0 0 0 0
02135 BRIGHTON 361 22 3 1 2 0 0
02136 HYDE PARK 118 12 2 0 1 1 0
02137 READVILLE 0 0 0 0 0 0 0
02138 CAMBRIDGE 432 52 9 0 7 4 0
02139 CAMBRIDGE 262 26 3 0 3 2 0
02140 CAMBRIDGE 215 13 3 0 2 0 0
02141 CAMBRIDGE 80 10 1 1 1 1 0
02142 CAMBRIDGE 17 2 0 0 0 0 0
02143 SOMERVILLE 195 27 3 0 2 1 0
02144 SOMERVILLE 269 31 4 0 4 0 0
02145 SOMERVILLE 140 19 3 1 3 1 0
02150 CHELSEA 42 9 3 0 3 0 0
02151 REVERE 239 34 8 0 8 1 0
02152 WINTHROP 145 11 0 0 0 1 0
02163 BOSTON 0 0 0 0 0 0 0
02196 BOSTON 0 0 0 0 0 0 0
02199 BOSTON 10 1 0 0 0 0 0
02201 BOSTON 0 0 0 0 0 0 0
02202 BOSTON 0 0 0 0 0 0 0
02203 BOSTON 0 0 0 0 0 0 0
02204 BOSTON 0 0 0 0 0 0 0
108

Insurer Cancellation/Nonrenewal Report
Exhibit 8A
Page 18
Insurer---Andover Group
Calendar Year---2015
Insurer
Insurer Initiated Insurer Initiated
Policies Insurer Initiated Cancellations Nonrenewals
Zip in Force* Total Initiated Cancellations Nonpay of Total** Co's Geographic
Code City/Town/Post Office as of 12/31/15 Cancellations Cancellations First 60 Days Premium Nonrenewals Withdrawal
02205 BOSTON 0 0 0 0 0 0 0
02206 BOSTON 0 0 0 0 0 0 0
02207 BOSTON 0 0 0 0 0 0 0
02208 BOSTON 0 0 0 0 0 0 0
02209 BOSTON 0 0 0 0 0 0 0
02210 BOSTON 17 9 1 0 1 0 0
02211 BOSTON 0 0 0 0 0 0 0
02212 BOSTON 0 0 0 0 0 0 0
02215 BOSTON 52 8 2 0 2 0 0
02216 BOSTON 0 0 0 0 0 0 0
02217 BOSTON 0 0 0 0 0 0 0
02222 BOSTON 0 0 0 0 0 0 0
02228 EAST BOSTON 0 0 0 0 0 0 0
02238 CAMBRIDGE 0 0 0 0 0 0 0
02239 CAMBRIDGE 0 0 0 0 0 0 0
02241 BOSTON 0 0 0 0 0 0 0
02266 BOSTON 0 0 0 0 0 0 0
02283 BOSTON 0 0 0 0 0 0 0
02284 BOSTON 0 0 0 0 0 0 0
02293 BOSTON 0 0 0 0 0 0 0
02295 BOSTON 0 0 0 0 0 0 0
02297 BOSTON 0 0 0 0 0 0 0
02298 BOSTON 0 0 0 0 0 0 0
02301 BROCKTON 48 4 0 0 0 0 0
02302 BROCKTON 56 3 0 0 0 1 0
02303 BROCKTON 0 0 0 0 0 0 0
02304 BROCKTON 0 0 0 0 0 0 0
02305 BROCKTON 0 0 0 0 0 0 0
02360 PLYMOUTH 669 66 12 0 10 0 0
02361 PLYMOUTH 0 0 0 0 0 0 0
02362 PLYMOUTH 0 0 0 0 0 0 0
02381 WHITE HORSE BEACH 4 2 0 0 0 0 0
02532 BUZZARDS BAY 7 1 0 0 0 0 0
02534 CATAUMET 0 0 0 0 0 0 0
02535 CHILMARK 0 0 0 0 0 0 0
02536 EAST FALMOUTH 0 1 0 0 0 0 0
02537 EAST SANDWICH 0 0 0 0 0 0 0
02538 EAST WAREHAM 38 2 1 0 1 0 0
02539 EDGARTOWN 0 0 0 0 0 0 0
02540 FALMOUTH 0 0 0 0 0 0 0
02541 FALMOUTH 0 0 0 0 0 0 0
02542 BUZZARDS BAY 0 0 0 0 0 0 0
02543 WOODS HOLE 0 0 0 0 0 0 0
02552 MENEMSHA 0 0 0 0 0 0 0
02553 MONUMENT BEACH 0 0 0 0 0 0 0
02554 NANTUCKET 0 0 0 0 0 0 0
02556 NORTH FALMOUTH 0 0 0 0 0 0 0
02557 OAK BLUFFS 0 0 0 0 0 0 0
02558 ONSET 23 1 0 0 0 0 0
02559 POCASSET 0 0 0 0 0 0 0
02561 SAGAMORE 1 0 0 0 0 0 0
02562 SAGAMORE BEACH 1 0 0 0 0 0 0
02563 SANDWICH 1 0 0 0 0 0 0
02564 SIASCONSET 0 0 0 0 0 0 0
02565 SILVER BEACH 0 0 0 0 0 0 0
02568 VINEYARD HAVEN 0 0 0 0 0 0 0
02571 WAREHAM 110 11 3 0 3 0 0
02573 WEST CHOP 0 0 0 0 0 0 0
109
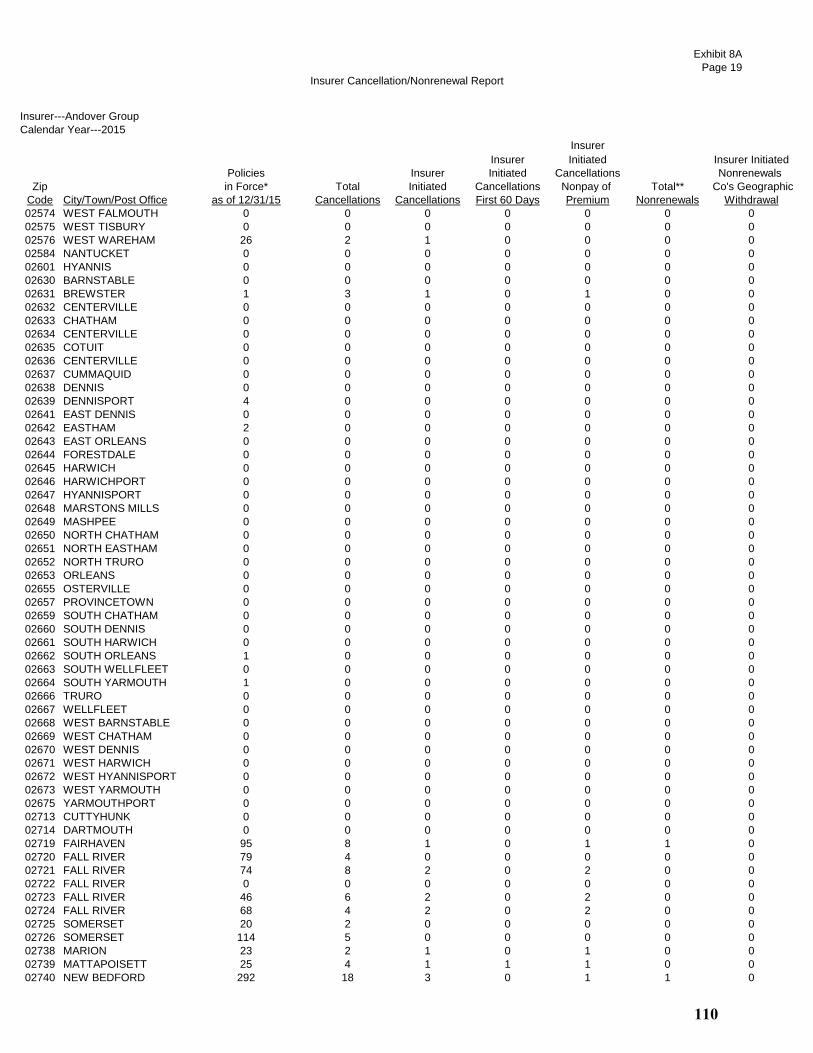
Insurer Cancellation/Nonrenewal Report
Exhibit 8A
Page 19
Insurer---Andover Group
Calendar Year---2015
Insurer
Insurer Initiated Insurer Initiated
Policies Insurer Initiated Cancellations Nonrenewals
Zip in Force* Total Initiated Cancellations Nonpay of Total** Co's Geographic
Code City/Town/Post Office as of 12/31/15 Cancellations Cancellations First 60 Days Premium Nonrenewals Withdrawal
02574 WEST FALMOUTH 0 0 0 0 0 0 0
02575 WEST TISBURY 0 0 0 0 0 0 0
02576 WEST WAREHAM 26 2 1 0 0 0 0
02584 NANTUCKET 0 0 0 0 0 0 0
02601 HYANNIS 0 0 0 0 0 0 0
02630 BARNSTABLE 0 0 0 0 0 0 0
02631 BREWSTER 1 3 1 0 1 0 0
02632 CENTERVILLE 0 0 0 0 0 0 0
02633 CHATHAM 0 0 0 0 0 0 0
02634 CENTERVILLE 0 0 0 0 0 0 0
02635 COTUIT 0 0 0 0 0 0 0
02636 CENTERVILLE 0 0 0 0 0 0 0
02637 CUMMAQUID 0 0 0 0 0 0 0
02638 DENNIS 0 0 0 0 0 0 0
02639 DENNISPORT 4 0 0 0 0 0 0
02641 EAST DENNIS 0 0 0 0 0 0 0
02642 EASTHAM 2 0 0 0 0 0 0
02643 EAST ORLEANS 0 0 0 0 0 0 0
02644 FORESTDALE 0 0 0 0 0 0 0
02645 HARWICH 0 0 0 0 0 0 0
02646 HARWICHPORT 0 0 0 0 0 0 0
02647 HYANNISPORT 0 0 0 0 0 0 0
02648 MARSTONS MILLS 0 0 0 0 0 0 0
02649 MASHPEE 0 0 0 0 0 0 0
02650 NORTH CHATHAM 0 0 0 0 0 0 0
02651 NORTH EASTHAM 0 0 0 0 0 0 0
02652 NORTH TRURO 0 0 0 0 0 0 0
02653 ORLEANS 0 0 0 0 0 0 0
02655 OSTERVILLE 0 0 0 0 0 0 0
02657 PROVINCETOWN 0 0 0 0 0 0 0
02659 SOUTH CHATHAM 0 0 0 0 0 0 0
02660 SOUTH DENNIS 0 0 0 0 0 0 0
02661 SOUTH HARWICH 0 0 0 0 0 0 0
02662 SOUTH ORLEANS 1 0 0 0 0 0 0
02663 SOUTH WELLFLEET 0 0 0 0 0 0 0
02664 SOUTH YARMOUTH 1 0 0 0 0 0 0
02666 TRURO 0 0 0 0 0 0 0
02667 WELLFLEET 0 0 0 0 0 0 0
02668 WEST BARNSTABLE 0 0 0 0 0 0 0
02669 WEST CHATHAM 0 0 0 0 0 0 0
02670 WEST DENNIS 0 0 0 0 0 0 0
02671 WEST HARWICH 0 0 0 0 0 0 0
02672 WEST HYANNISPORT 0 0 0 0 0 0 0
02673 WEST YARMOUTH 0 0 0 0 0 0 0
02675 YARMOUTHPORT 0 0 0 0 0 0 0
02713 CUTTYHUNK 0 0 0 0 0 0 0
02714 DARTMOUTH 0 0 0 0 0 0 0
02719 FAIRHAVEN 95 8 1 0 1 1 0
02720 FALL RIVER 79 4 0 0 0 0 0
02721 FALL RIVER 74 8 2 0 2 0 0
02722 FALL RIVER 0 0 0 0 0 0 0
02723 FALL RIVER 46 6 2 0 2 0 0
02724 FALL RIVER 68 4 2 0 2 0 0
02725 SOMERSET 20 2 0 0 0 0 0
02726 SOMERSET 114 5 0 0 0 0 0
02738 MARION 23 2 1 0 1 0 0
02739 MATTAPOISETT 25 4 1 1 1 0 0
02740 NEW BEDFORD 292 18 3 0 1 1 0
110
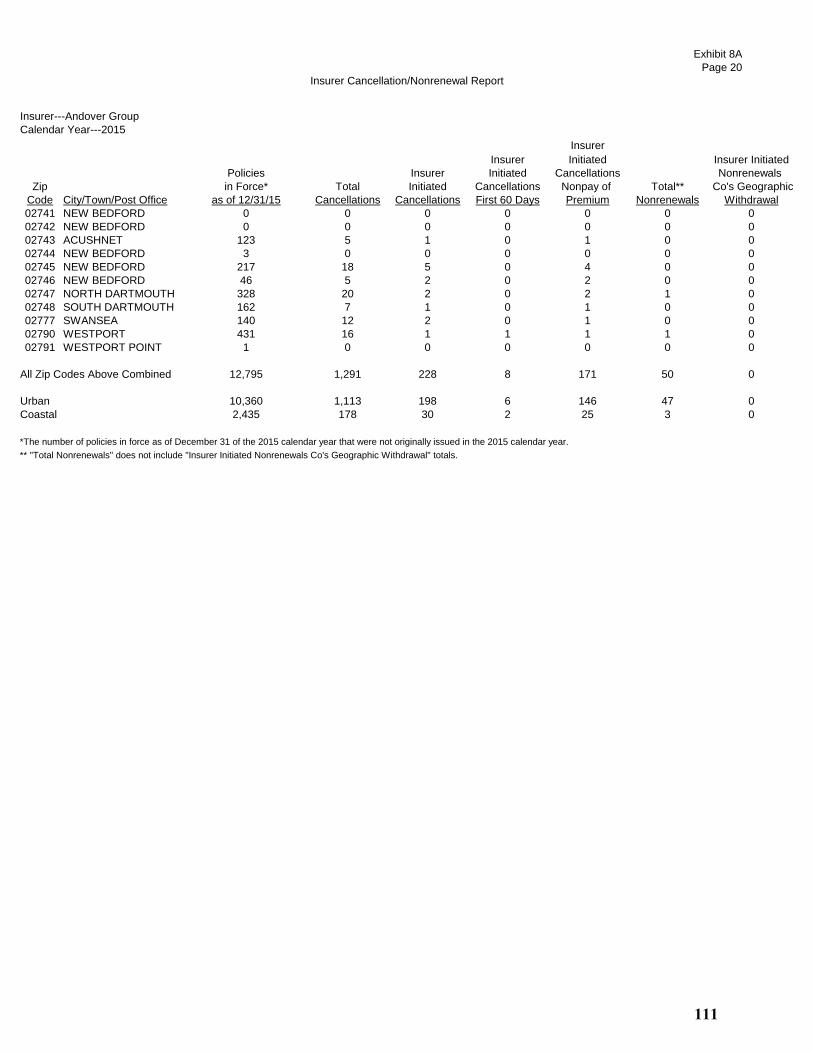
Insurer Cancellation/Nonrenewal Report
Exhibit 8A
Page 20
Insurer---Andover Group
Calendar Year---2015
Insurer
Insurer Initiated Insurer Initiated
Policies Insurer Initiated Cancellations Nonrenewals
Zip in Force* Total Initiated Cancellations Nonpay of Total** Co's Geographic
Code City/Town/Post Office as of 12/31/15 Cancellations Cancellations First 60 Days Premium Nonrenewals Withdrawal
02741 NEW BEDFORD 0 0 0 0 0 0 0
02742 NEW BEDFORD 0 0 0 0 0 0 0
02743 ACUSHNET 123 5 1 0 1 0 0
02744 NEW BEDFORD 3 0 0 0 0 0 0
02745 NEW BEDFORD 217 18 5 0 4 0 0
02746 NEW BEDFORD 46 5 2 0 2 0 0
02747 NORTH DARTMOUTH 328 20 2 0 2 1 0
02748 SOUTH DARTMOUTH 162 7 1 0 1 0 0
02777 SWANSEA 140 12 2 0 1 0 0
02790 WESTPORT 431 16 1 1 1 1 0
02791 WESTPORT POINT 1 0 0 0 0 0 0
All Zip Codes Above Combined 12,795 1,291 228 8 171 50 0
Urban 10,360 1,113 198 6 146 47 0
Coastal 2,435 178 30 2 25 3 0
*The number of policies in force as of December 31 of the 2015 calendar year that were not originally issued in the 2015 calendar year.
** "Total Nonrenewals" does not include "Insurer Initiated Nonrenewals Co's Geographic Withdrawal" totals.
111

Insurer Cancellation/Nonrenewal Report
Exhibit 8A
Page 21
Insurer---Arbella Insurance Group
Calendar Year---2015
Insurer
Insurer Initiated Insurer Initiated
Policies Insurer Initiated Cancellations Nonrenewals
Zip in Force* Total Initiated Cancellations Nonpay of Total** Co's Geographic
Code City/Town/Post Office as of 12/31/15 Cancellations Cancellations First 60 Days Premium Nonrenewals Withdrawal
01101 SPRINGFIELD 11 0 0 0 0 0 0
01102 SPRINGFIELD 3 0 0 0 0 0 0
01103 SPRINGFIELD 18 1 0 0 0 0 0
01104 SPRINGFIELD 324 25 0 1 1 3 0
01105 SPRINGFIELD 27 5 0 0 1 1 0
01107 SPRINGFIELD 59 7 0 0 1 0 0
01108 SPRINGFIELD 304 28 0 2 4 1 0
01109 SPRINGFIELD 263 21 0 0 1 3 0
01111 SPRINGFIELD 0 0 0 0 0 0 0
01114 SPRINGFIELD 0 0 0 0 0 0 0
01115 SPRINGFIELD 0 0 0 0 0 0 0
01118 SPRINGFIELD 331 37 0 2 6 2 0
01119 SPRINGFIELD 213 20 0 0 2 3 0
01128 SPRINGFIELD 85 7 0 0 0 1 0
01129 SPRINGFIELD 179 16 1 0 1 0 0
01133 SPRINGFIELD 0 0 0 0 0 0 0
01138 SPRINGFIELD 0 0 0 0 0 0 0
01139 SPRINGFIELD 0 0 0 0 0 0 0
01144 SPRINGFIELD 0 0 0 0 0 0 0
01151 INDIAN ORCHARD 83 8 0 0 2 0 0
01152 SPRINGFIELD 0 0 0 0 0 0 0
01199 SPRINGFIELD 0 0 0 0 0 0 0
01601 WORCESTER 6 1 0 0 0 2 0
01602 WORCESTER 305 44 0 0 9 2 0
01603 WORCESTER 178 12 0 0 7 1 0
01604 WORCESTER 307 37 0 0 7 4 0
01605 WORCESTER 203 22 0 0 3 2 0
01606 WORCESTER 248 19 0 0 1 0 0
01607 WORCESTER 75 5 0 0 2 0 0
01608 WORCESTER 9 3 0 0 2 0 0
01609 WORCESTER 163 21 0 0 4 2 0
01610 WORCESTER 77 9 0 0 4 1 0
01611 CHERRY VALLEY 29 3 0 0 0 0 0
01612 PAXTON 75 5 0 0 0 1 0
01613 WORCESTER 3 1 0 0 0 0 0
01614 WORCESTER 0 0 0 0 0 0 0
01615 WORCESTER 1 0 0 0 0 0 0
01653 WORCESTER 0 0 0 0 0 0 0
01654 WORCESTER 0 0 0 0 0 0 0
01655 WORCESTER 0 0 0 0 0 0 0
01840 LAWRENCE 14 6 0 0 1 0 0
01841 LAWRENCE 392 47 0 0 19 1 0
01842 LAWRENCE 10 0 0 0 0 0 0
01843 LAWRENCE 275 34 0 1 3 4 0
01850 LOWELL 243 25 0 1 5 3 0
01851 LOWELL 461 61 0 1 11 2 0
01852 LOWELL 813 68 0 2 10 9 0
01853 LOWELL 15 1 0 0 0 0 0
01854 LOWELL 374 42 0 0 8 10 0
01901 LYNN 22 3 0 0 2 0 0
01902 LYNN 680 69 1 1 8 39 0
01903 LYNN 3 1 0 0 0 0 0
01904 LYNN 924 80 0 0 7 21 0
01905 LYNN 548 52 0 2 4 14 0
01910 LYNN 0 0 0 0 0 0 0
02020 BRANT ROCK 2 0 0 0 0 0 0
02041 GREEN HARBOR 3 1 0 0 0 0 0
02045 HULL 73 4 0 0 1 1 0
112
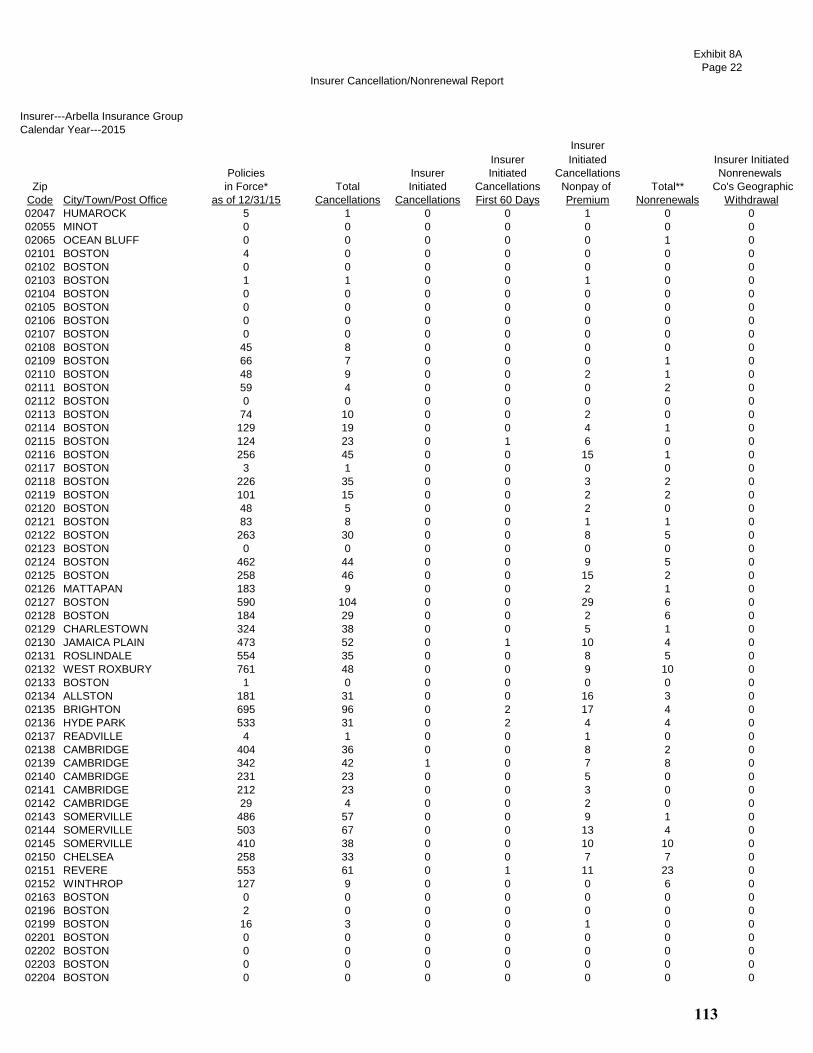
Insurer Cancellation/Nonrenewal Report
Exhibit 8A
Page 22
Insurer---Arbella Insurance Group
Calendar Year---2015
Insurer
Insurer Initiated Insurer Initiated
Policies Insurer Initiated Cancellations Nonrenewals
Zip in Force* Total Initiated Cancellations Nonpay of Total** Co's Geographic
Code City/Town/Post Office as of 12/31/15 Cancellations Cancellations First 60 Days Premium Nonrenewals Withdrawal
02047 HUMAROCK 5 1 0 0 1 0 0
02055 MINOT 0 0 0 0 0 0 0
02065 OCEAN BLUFF 0 0 0 0 0 1 0
02101 BOSTON 4 0 0 0 0 0 0
02102 BOSTON 0 0 0 0 0 0 0
02103 BOSTON 1 1 0 0 1 0 0
02104 BOSTON 0 0 0 0 0 0 0
02105 BOSTON 0 0 0 0 0 0 0
02106 BOSTON 0 0 0 0 0 0 0
02107 BOSTON 0 0 0 0 0 0 0
02108 BOSTON 45 8 0 0 0 0 0
02109 BOSTON 66 7 0 0 0 1 0
02110 BOSTON 48 9 0 0 2 1 0
02111 BOSTON 59 4 0 0 0 2 0
02112 BOSTON 0 0 0 0 0 0 0
02113 BOSTON 74 10 0 0 2 0 0
02114 BOSTON 129 19 0 0 4 1 0
02115 BOSTON 124 23 0 1 6 0 0
02116 BOSTON 256 45 0 0 15 1 0
02117 BOSTON 3 1 0 0 0 0 0
02118 BOSTON 226 35 0 0 3 2 0
02119 BOSTON 101 15 0 0 2 2 0
02120 BOSTON 48 5 0 0 2 0 0
02121 BOSTON 83 8 0 0 1 1 0
02122 BOSTON 263 30 0 0 8 5 0
02123 BOSTON 0 0 0 0 0 0 0
02124 BOSTON 462 44 0 0 9 5 0
02125 BOSTON 258 46 0 0 15 2 0
02126 MATTAPAN 183 9 0 0 2 1 0
02127 BOSTON 590 104 0 0 29 6 0
02128 BOSTON 184 29 0 0 2 6 0
02129 CHARLESTOWN 324 38 0 0 5 1 0
02130 JAMAICA PLAIN 473 52 0 1 10 4 0
02131 ROSLINDALE 554 35 0 0 8 5 0
02132 WEST ROXBURY 761 48 0 0 9 10 0
02133 BOSTON 1 0 0 0 0 0 0
02134 ALLSTON 181 31 0 0 16 3 0
02135 BRIGHTON 695 96 0 2 17 4 0
02136 HYDE PARK 533 31 0 2 4 4 0
02137 READVILLE 4 1 0 0 1 0 0
02138 CAMBRIDGE 404 36 0 0 8 2 0
02139 CAMBRIDGE 342 42 1 0 7 8 0
02140 CAMBRIDGE 231 23 0 0 5 0 0
02141 CAMBRIDGE 212 23 0 0 3 0 0
02142 CAMBRIDGE 29 4 0 0 2 0 0
02143 SOMERVILLE 486 57 0 0 9 1 0
02144 SOMERVILLE 503 67 0 0 13 4 0
02145 SOMERVILLE 410 38 0 0 10 10 0
02150 CHELSEA 258 33 0 0 7 7 0
02151 REVERE 553 61 0 1 11 23 0
02152 WINTHROP 127 9 0 0 0 6 0
02163 BOSTON 0 0 0 0 0 0 0
02196 BOSTON 2 0 0 0 0 0 0
02199 BOSTON 16 3 0 0 1 0 0
02201 BOSTON 0 0 0 0 0 0 0
02202 BOSTON 0 0 0 0 0 0 0
02203 BOSTON 0 0 0 0 0 0 0
02204 BOSTON 0 0 0 0 0 0 0
113

Insurer Cancellation/Nonrenewal Report
Exhibit 8A
Page 23
Insurer---Arbella Insurance Group
Calendar Year---2015
Insurer
Insurer Initiated Insurer Initiated
Policies Insurer Initiated Cancellations Nonrenewals
Zip in Force* Total Initiated Cancellations Nonpay of Total** Co's Geographic
Code City/Town/Post Office as of 12/31/15 Cancellations Cancellations First 60 Days Premium Nonrenewals Withdrawal
02205 BOSTON 0 1 0 0 0 0 0
02206 BOSTON 0 0 0 0 0 0 0
02207 BOSTON 0 0 0 0 0 0 0
02208 BOSTON 0 0 0 0 0 0 0
02209 BOSTON 0 0 0 0 0 0 0
02210 BOSTON 56 7 0 0 4 0 0
02211 BOSTON 0 0 0 0 0 0 0
02212 BOSTON 0 0 0 0 0 0 0
02215 BOSTON 82 12 0 0 2 0 0
02216 BOSTON 0 1 0 0 0 0 0
02217 BOSTON 0 0 0 0 0 0 0
02222 BOSTON 0 0 0 0 0 0 0
02228 EAST BOSTON 0 0 0 0 0 0 0
02238 CAMBRIDGE 2 0 0 0 0 0 0
02239 CAMBRIDGE 0 0 0 0 0 0 0
02241 BOSTON 0 0 0 0 0 0 0
02266 BOSTON 0 0 0 0 0 0 0
02283 BOSTON 0 0 0 0 0 0 0
02284 BOSTON 0 0 0 0 0 0 0
02293 BOSTON 0 0 0 0 0 0 0
02295 BOSTON 0 0 0 0 0 0 0
02297 BOSTON 0 0 0 0 0 0 0
02298 BOSTON 0 0 0 0 0 0 0
02301 BROCKTON 1,175 98 1 2 17 12 0
02302 BROCKTON 787 75 1 1 13 7 0
02303 BROCKTON 8 1 0 0 1 0 0
02304 BROCKTON 0 1 0 0 1 0 0
02305 BROCKTON 0 0 0 0 0 0 0
02360 PLYMOUTH 1,536 146 0 0 14 11 0
02361 PLYMOUTH 1 0 0 0 0 0 0
02362 PLYMOUTH 2 0 0 0 0 0 0
02381 WHITE HORSE BEACH 0 0 0 0 0 0 0
02532 BUZZARDS BAY 162 16 0 0 0 1 0
02534 CATAUMET 5 0 0 0 0 0 0
02535 CHILMARK 11 1 0 0 0 0 0
02536 EAST FALMOUTH 455 22 0 0 2 7 0
02537 EAST SANDWICH 85 6 0 1 0 2 0
02538 EAST WAREHAM 159 7 0 1 0 9 0
02539 EDGARTOWN 68 3 0 0 0 2 0
02540 FALMOUTH 97 11 1 1 1 2 0
02541 FALMOUTH 6 1 0 0 0 0 0
02542 BUZZARDS BAY 0 0 0 0 0 0 0
02543 WOODS HOLE 4 1 0 0 0 0 0
02552 MENEMSHA 1 0 0 0 0 0 0
02553 MONUMENT BEACH 14 4 0 0 2 0 0
02554 NANTUCKET 44 4 0 0 0 0 0
02556 NORTH FALMOUTH 42 2 0 0 0 0 0
02557 OAK BLUFFS 61 2 0 0 0 0 0
02558 ONSET 29 5 0 0 1 0 0
02559 POCASSET 44 4 0 0 1 1 0
02561 SAGAMORE 12 1 0 0 0 0 0
02562 SAGAMORE BEACH 41 1 0 0 0 0 0
02563 SANDWICH 156 6 0 0 1 1 0
02564 SIASCONSET 0 1 0 0 0 0 0
02565 SILVER BEACH 2 0 0 0 0 0 0
02568 VINEYARD HAVEN 52 1 0 0 0 1 0
02571 WAREHAM 266 12 0 1 4 10 0
02573 WEST CHOP 0 0 0 0 0 0 0
114

Insurer Cancellation/Nonrenewal Report
Exhibit 8A
Page 24
Insurer---Arbella Insurance Group
Calendar Year---2015
Insurer
Insurer Initiated Insurer Initiated
Policies Insurer Initiated Cancellations Nonrenewals
Zip in Force* Total Initiated Cancellations Nonpay of Total** Co's Geographic
Code City/Town/Post Office as of 12/31/15 Cancellations Cancellations First 60 Days Premium Nonrenewals Withdrawal
02574 WEST FALMOUTH 18 0 0 0 0 0 0
02575 WEST TISBURY 46 2 0 0 0 0 0
02576 WEST WAREHAM 147 13 0 0 2 5 0
02584 NANTUCKET 1 0 0 0 0 0 0
02601 HYANNIS 127 11 0 0 4 3 0
02630 BARNSTABLE 18 0 0 0 0 0 0
02631 BREWSTER 105 6 0 0 1 2 0
02632 CENTERVILLE 138 5 0 0 2 2 0
02633 CHATHAM 57 7 0 0 0 1 0
02634 CENTERVILLE 0 0 0 0 0 0 0
02635 COTUIT 36 2 0 0 0 1 0
02636 CENTERVILLE 0 0 0 0 0 0 0
02637 CUMMAQUID 6 1 0 0 1 0 0
02638 DENNIS 53 3 0 0 0 3 0
02639 DENNISPORT 54 1 0 0 0 0 0
02641 EAST DENNIS 20 0 0 0 0 0 0
02642 EASTHAM 29 1 0 0 0 2 0
02643 EAST ORLEANS 7 0 0 0 0 1 0
02644 FORESTDALE 59 3 0 0 0 0 0
02645 HARWICH 135 3 0 1 1 3 0
02646 HARWICHPORT 18 0 0 0 0 0 0
02647 HYANNISPORT 5 0 0 0 0 0 0
02648 MARSTONS MILLS 96 4 0 0 0 1 0
02649 MASHPEE 306 19 0 1 1 1 0
02650 NORTH CHATHAM 13 2 0 0 0 0 0
02651 NORTH EASTHAM 5 0 0 0 0 0 0
02652 NORTH TRURO 4 1 0 0 0 0 0
02653 ORLEANS 39 5 0 0 1 0 0
02655 OSTERVILLE 44 3 0 0 0 0 0
02657 PROVINCETOWN 21 2 0 0 0 0 0
02659 SOUTH CHATHAM 8 0 0 0 0 0 0
02660 SOUTH DENNIS 88 4 0 0 0 2 0
02661 SOUTH HARWICH 5 0 0 0 0 0 0
02662 SOUTH ORLEANS 2 0 0 0 0 0 0
02663 SOUTH WELLFLEET 9 0 0 0 0 0 0
02664 SOUTH YARMOUTH 135 10 0 0 3 2 0
02666 TRURO 10 1 0 0 0 0 0
02667 WELLFLEET 22 0 0 0 0 0 0
02668 WEST BARNSTABLE 29 2 0 0 0 1 0
02669 WEST CHATHAM 4 0 0 0 0 0 0
02670 WEST DENNIS 22 0 0 0 0 1 0
02671 WEST HARWICH 12 2 0 0 0 0 0
02672 WEST HYANNISPORT 9 0 0 0 0 0 0
02673 WEST YARMOUTH 84 2 0 0 1 2 0
02675 YARMOUTHPORT 90 5 0 0 0 0 0
02713 CUTTYHUNK 0 0 0 0 0 0 0
02714 DARTMOUTH 2 1 0 0 0 0 0
02719 FAIRHAVEN 372 24 0 0 3 6 0
02720 FALL RIVER 1,045 102 0 1 25 4 0
02721 FALL RIVER 578 58 0 0 8 9 0
02722 FALL RIVER 11 0 0 0 0 0 0
02723 FALL RIVER 324 33 0 0 6 3 0
02724 FALL RIVER 219 21 0 0 5 1 0
02725 SOMERSET 107 8 0 0 1 0 0
02726 SOMERSET 941 85 0 0 9 10 0
02738 MARION 96 13 0 0 0 2 0
02739 MATTAPOISETT 171 9 0 0 2 3 0
02740 NEW BEDFORD 689 49 0 1 7 8 0
115

Insurer Cancellation/Nonrenewal Report
Exhibit 8A
Page 25
Insurer---Arbella Insurance Group
Calendar Year---2015
Insurer
Insurer Initiated Insurer Initiated
Policies Insurer Initiated Cancellations Nonrenewals
Zip in Force* Total Initiated Cancellations Nonpay of Total** Co's Geographic
Code City/Town/Post Office as of 12/31/15 Cancellations Cancellations First 60 Days Premium Nonrenewals Withdrawal
02741 NEW BEDFORD 2 0 0 0 0 0 0
02742 NEW BEDFORD 0 0 0 0 0 0 0
02743 ACUSHNET 392 24 0 0 3 3 0
02744 NEW BEDFORD 19 5 0 0 1 0 0
02745 NEW BEDFORD 527 38 0 0 5 4 0
02746 NEW BEDFORD 116 9 0 0 4 1 0
02747 NORTH DARTMOUTH 773 65 1 0 8 12 0
02748 SOUTH DARTMOUTH 504 25 0 1 2 7 0
02777 SWANSEA 902 61 0 0 2 6 0
02790 WESTPORT 562 36 0 2 5 3 0
02791 WESTPORT POINT 12 0 0 0 0 0 0
All Zip Codes Above Combined 34,707 3,271 7 34 564 443 0
Urban 24,299 2,537 5 25 484 309 0
Coastal 10,408 734 2 9 80 134 0
*The number of policies in force as of December 31 of the 2015 calendar year that were not originally issued in the 2015 calendar year.
** "Total Nonrenewals" does not include "Insurer Initiated Nonrenewals Co's Geographic Withdrawal" totals.
116

Insurer Cancellation/Nonrenewal Report
Exhibit 8A
Page 26
Insurer-----Barnstable Group
Calendar Year---2015
Insurer
Insurer Initiated Insurer Initiated
Policies Insurer Initiated Cancellations Nonrenewals
Zip in Force* Total Initiated Cancellations Nonpay of Total** Co's Geographic
Code City/Town/Post Office as of 12/31/15 Cancellations Cancellations First 60 Days Premium Nonrenewals Withdrawal
01101 SPRINGFIELD 0 0 0 0 0 0 0
01102 SPRINGFIELD 0 0 0 0 0 0 0
01103 SPRINGFIELD 0 0 0 0 0 0 0
01104 SPRINGFIELD 0 0 0 0 0 0 0
01105 SPRINGFIELD 0 0 0 0 0 0 0
01107 SPRINGFIELD 0 0 0 0 0 0 0
01108 SPRINGFIELD 0 0 0 0 0 0 0
01109 SPRINGFIELD 0 0 0 0 0 0 0
01111 SPRINGFIELD 0 0 0 0 0 0 0
01114 SPRINGFIELD 0 0 0 0 0 0 0
01115 SPRINGFIELD 0 0 0 0 0 0 0
01118 SPRINGFIELD 1 0 0 0 0 0 0
01119 SPRINGFIELD 0 0 0 0 0 0 0
01128 SPRINGFIELD 0 0 0 0 0 0 0
01129 SPRINGFIELD 0 0 0 0 0 0 0
01133 SPRINGFIELD 0 0 0 0 0 0 0
01138 SPRINGFIELD 0 0 0 0 0 0 0
01139 SPRINGFIELD 0 0 0 0 0 0 0
01144 SPRINGFIELD 0 0 0 0 0 0 0
01151 INDIAN ORCHARD 0 0 0 0 0 0 0
01152 SPRINGFIELD 0 0 0 0 0 0 0
01199 SPRINGFIELD 0 0 0 0 0 0 0
01601 WORCESTER 0 0 0 0 0 0 0
01602 WORCESTER 0 1 0 0 0 0 0
01603 WORCESTER 0 0 0 0 0 0 0
01604 WORCESTER 0 0 0 0 0 0 0
01605 WORCESTER 0 0 0 0 0 0 0
01606 WORCESTER 1 1 0 0 0 0 0
01607 WORCESTER 0 0 0 0 0 0 0
01608 WORCESTER 0 0 0 0 0 0 0
01609 WORCESTER 0 0 0 0 0 0 0
01610 WORCESTER 1 0 0 0 0 0 0
01611 CHERRY VALLEY 0 0 0 0 0 0 0
01612 PAXTON 0 0 0 0 0 0 0
01613 WORCESTER 0 0 0 0 0 0 0
01614 WORCESTER 0 0 0 0 0 0 0
01615 WORCESTER 0 0 0 0 0 0 0
01653 WORCESTER 0 0 0 0 0 0 0
01654 WORCESTER 0 0 0 0 0 0 0
01655 WORCESTER 0 0 0 0 0 0 0
01840 LAWRENCE 0 0 0 0 0 0 0
01841 LAWRENCE 0 0 0 0 0 0 0
01842 LAWRENCE 0 0 0 0 0 0 0
01843 LAWRENCE 0 0 0 0 0 0 0
01850 LOWELL 0 0 0 0 0 0 0
01851 LOWELL 0 0 0 0 0 0 0
01852 LOWELL 2 0 0 0 0 0 0
01853 LOWELL 0 0 0 0 0 0 0
01854 LOWELL 0 0 0 0 0 0 0
01901 LYNN 0 0 0 0 0 0 0
01902 LYNN 0 0 0 0 0 0 0
01903 LYNN 0 0 0 0 0 0 0
01904 LYNN 0 0 0 0 0 0 0
01905 LYNN 0 0 0 0 0 0 0
01910 LYNN 0 0 0 0 0 0 0
02020 BRANT ROCK 0 0 0 0 0 0 0
02041 GREEN HARBOR 0 0 0 0 0 0 0
02045 HULL 1 0 0 0 0 0 0
117
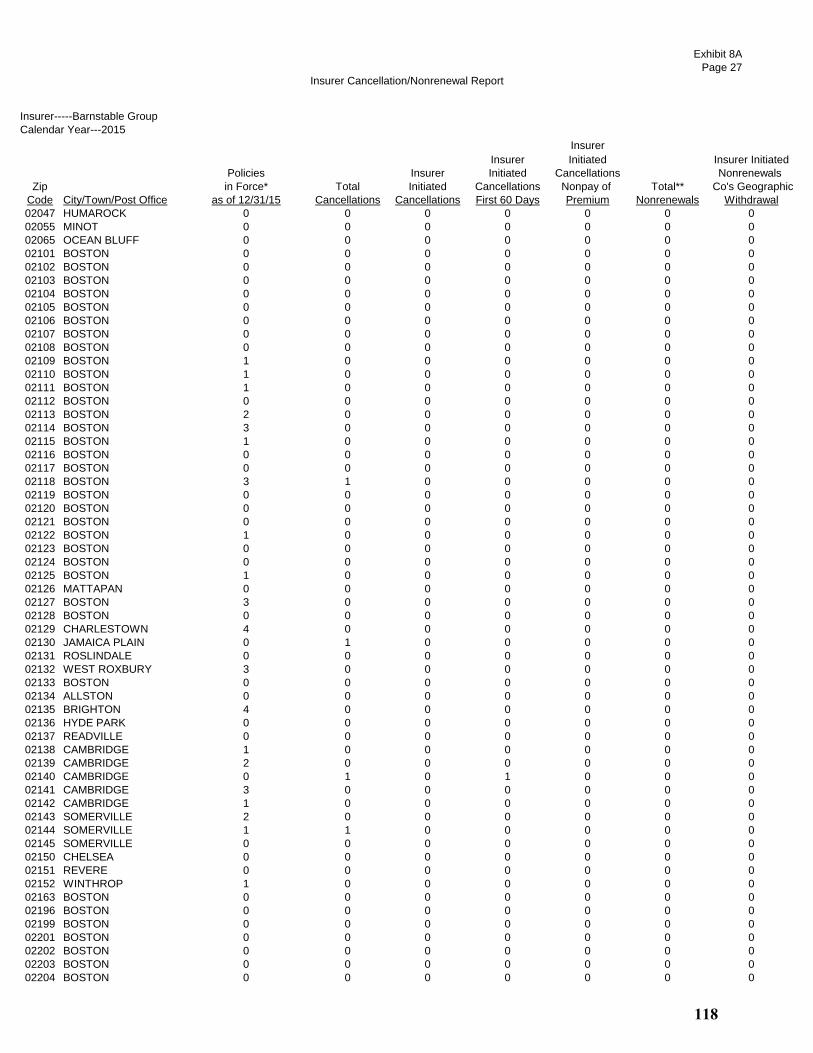
Insurer Cancellation/Nonrenewal Report
Exhibit 8A
Page 27
Insurer-----Barnstable Group
Calendar Year---2015
Insurer
Insurer Initiated Insurer Initiated
Policies Insurer Initiated Cancellations Nonrenewals
Zip in Force* Total Initiated Cancellations Nonpay of Total** Co's Geographic
Code City/Town/Post Office as of 12/31/15 Cancellations Cancellations First 60 Days Premium Nonrenewals Withdrawal
02047 HUMAROCK 0 0 0 0 0 0 0
02055 MINOT 0 0 0 0 0 0 0
02065 OCEAN BLUFF 0 0 0 0 0 0 0
02101 BOSTON 0 0 0 0 0 0 0
02102 BOSTON 0 0 0 0 0 0 0
02103 BOSTON 0 0 0 0 0 0 0
02104 BOSTON 0 0 0 0 0 0 0
02105 BOSTON 0 0 0 0 0 0 0
02106 BOSTON 0 0 0 0 0 0 0
02107 BOSTON 0 0 0 0 0 0 0
02108 BOSTON 0 0 0 0 0 0 0
02109 BOSTON 1 0 0 0 0 0 0
02110 BOSTON 1 0 0 0 0 0 0
02111 BOSTON 1 0 0 0 0 0 0
02112 BOSTON 0 0 0 0 0 0 0
02113 BOSTON 2 0 0 0 0 0 0
02114 BOSTON 3 0 0 0 0 0 0
02115 BOSTON 1 0 0 0 0 0 0
02116 BOSTON 0 0 0 0 0 0 0
02117 BOSTON 0 0 0 0 0 0 0
02118 BOSTON 3 1 0 0 0 0 0
02119 BOSTON 0 0 0 0 0 0 0
02120 BOSTON 0 0 0 0 0 0 0
02121 BOSTON 0 0 0 0 0 0 0
02122 BOSTON 1 0 0 0 0 0 0
02123 BOSTON 0 0 0 0 0 0 0
02124 BOSTON 0 0 0 0 0 0 0
02125 BOSTON 1 0 0 0 0 0 0
02126 MATTAPAN 0 0 0 0 0 0 0
02127 BOSTON 3 0 0 0 0 0 0
02128 BOSTON 0 0 0 0 0 0 0
02129 CHARLESTOWN 4 0 0 0 0 0 0
02130 JAMAICA PLAIN 0 1 0 0 0 0 0
02131 ROSLINDALE 0 0 0 0 0 0 0
02132 WEST ROXBURY 3 0 0 0 0 0 0
02133 BOSTON 0 0 0 0 0 0 0
02134 ALLSTON 0 0 0 0 0 0 0
02135 BRIGHTON 4 0 0 0 0 0 0
02136 HYDE PARK 0 0 0 0 0 0 0
02137 READVILLE 0 0 0 0 0 0 0
02138 CAMBRIDGE 1 0 0 0 0 0 0
02139 CAMBRIDGE 2 0 0 0 0 0 0
02140 CAMBRIDGE 0 1 0 1 0 0 0
02141 CAMBRIDGE 3 0 0 0 0 0 0
02142 CAMBRIDGE 1 0 0 0 0 0 0
02143 SOMERVILLE 2 0 0 0 0 0 0
02144 SOMERVILLE 1 1 0 0 0 0 0
02145 SOMERVILLE 0 0 0 0 0 0 0
02150 CHELSEA 0 0 0 0 0 0 0
02151 REVERE 0 0 0 0 0 0 0
02152 WINTHROP 1 0 0 0 0 0 0
02163 BOSTON 0 0 0 0 0 0 0
02196 BOSTON 0 0 0 0 0 0 0
02199 BOSTON 0 0 0 0 0 0 0
02201 BOSTON 0 0 0 0 0 0 0
02202 BOSTON 0 0 0 0 0 0 0
02203 BOSTON 0 0 0 0 0 0 0
02204 BOSTON 0 0 0 0 0 0 0
118
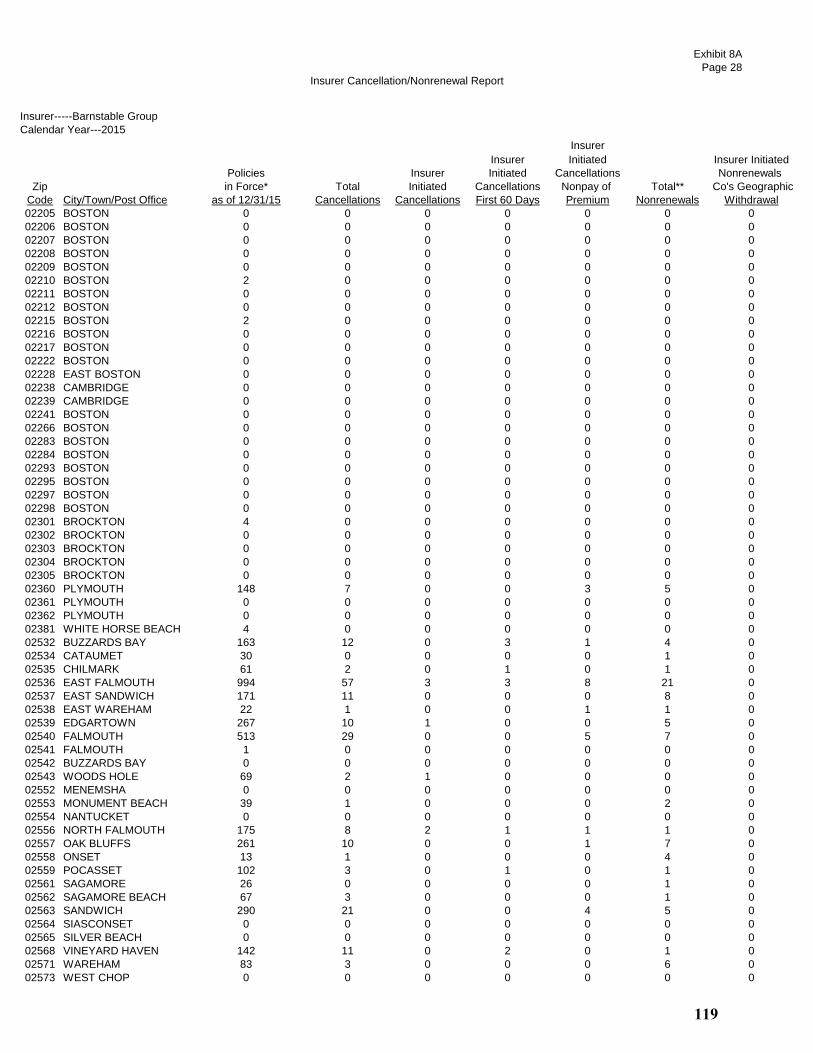
Insurer Cancellation/Nonrenewal Report
Exhibit 8A
Page 28
Insurer-----Barnstable Group
Calendar Year---2015
Insurer
Insurer Initiated Insurer Initiated
Policies Insurer Initiated Cancellations Nonrenewals
Zip in Force* Total Initiated Cancellations Nonpay of Total** Co's Geographic
Code City/Town/Post Office as of 12/31/15 Cancellations Cancellations First 60 Days Premium Nonrenewals Withdrawal
02205 BOSTON 0 0 0 0 0 0 0
02206 BOSTON 0 0 0 0 0 0 0
02207 BOSTON 0 0 0 0 0 0 0
02208 BOSTON 0 0 0 0 0 0 0
02209 BOSTON 0 0 0 0 0 0 0
02210 BOSTON 2 0 0 0 0 0 0
02211 BOSTON 0 0 0 0 0 0 0
02212 BOSTON 0 0 0 0 0 0 0
02215 BOSTON 2 0 0 0 0 0 0
02216 BOSTON 0 0 0 0 0 0 0
02217 BOSTON 0 0 0 0 0 0 0
02222 BOSTON 0 0 0 0 0 0 0
02228 EAST BOSTON 0 0 0 0 0 0 0
02238 CAMBRIDGE 0 0 0 0 0 0 0
02239 CAMBRIDGE 0 0 0 0 0 0 0
02241 BOSTON 0 0 0 0 0 0 0
02266 BOSTON 0 0 0 0 0 0 0
02283 BOSTON 0 0 0 0 0 0 0
02284 BOSTON 0 0 0 0 0 0 0
02293 BOSTON 0 0 0 0 0 0 0
02295 BOSTON 0 0 0 0 0 0 0
02297 BOSTON 0 0 0 0 0 0 0
02298 BOSTON 0 0 0 0 0 0 0
02301 BROCKTON 4 0 0 0 0 0 0
02302 BROCKTON 0 0 0 0 0 0 0
02303 BROCKTON 0 0 0 0 0 0 0
02304 BROCKTON 0 0 0 0 0 0 0
02305 BROCKTON 0 0 0 0 0 0 0
02360 PLYMOUTH 148 7 0 0 3 5 0
02361 PLYMOUTH 0 0 0 0 0 0 0
02362 PLYMOUTH 0 0 0 0 0 0 0
02381 WHITE HORSE BEACH 4 0 0 0 0 0 0
02532 BUZZARDS BAY 163 12 0 3 1 4 0
02534 CATAUMET 30 0 0 0 0 1 0
02535 CHILMARK 61 2 0 1 0 1 0
02536 EAST FALMOUTH 994 57 3 3 8 21 0
02537 EAST SANDWICH 171 11 0 0 0 8 0
02538 EAST WAREHAM 22 1 0 0 1 1 0
02539 EDGARTOWN 267 10 1 0 0 5 0
02540 FALMOUTH 513 29 0 0 5 7 0
02541 FALMOUTH 1 0 0 0 0 0 0
02542 BUZZARDS BAY 0 0 0 0 0 0 0
02543 WOODS HOLE 69 2 1 0 0 0 0
02552 MENEMSHA 0 0 0 0 0 0 0
02553 MONUMENT BEACH 39 1 0 0 0 2 0
02554 NANTUCKET 0 0 0 0 0 0 0
02556 NORTH FALMOUTH 175 8 2 1 1 1 0
02557 OAK BLUFFS 261 10 0 0 1 7 0
02558 ONSET 13 1 0 0 0 4 0
02559 POCASSET 102 3 0 1 0 1 0
02561 SAGAMORE 26 0 0 0 0 1 0
02562 SAGAMORE BEACH 67 3 0 0 0 1 0
02563 SANDWICH 290 21 0 0 4 5 0
02564 SIASCONSET 0 0 0 0 0 0 0
02565 SILVER BEACH 0 0 0 0 0 0 0
02568 VINEYARD HAVEN 142 11 0 2 0 1 0
02571 WAREHAM 83 3 0 0 0 6 0
02573 WEST CHOP 0 0 0 0 0 0 0
119
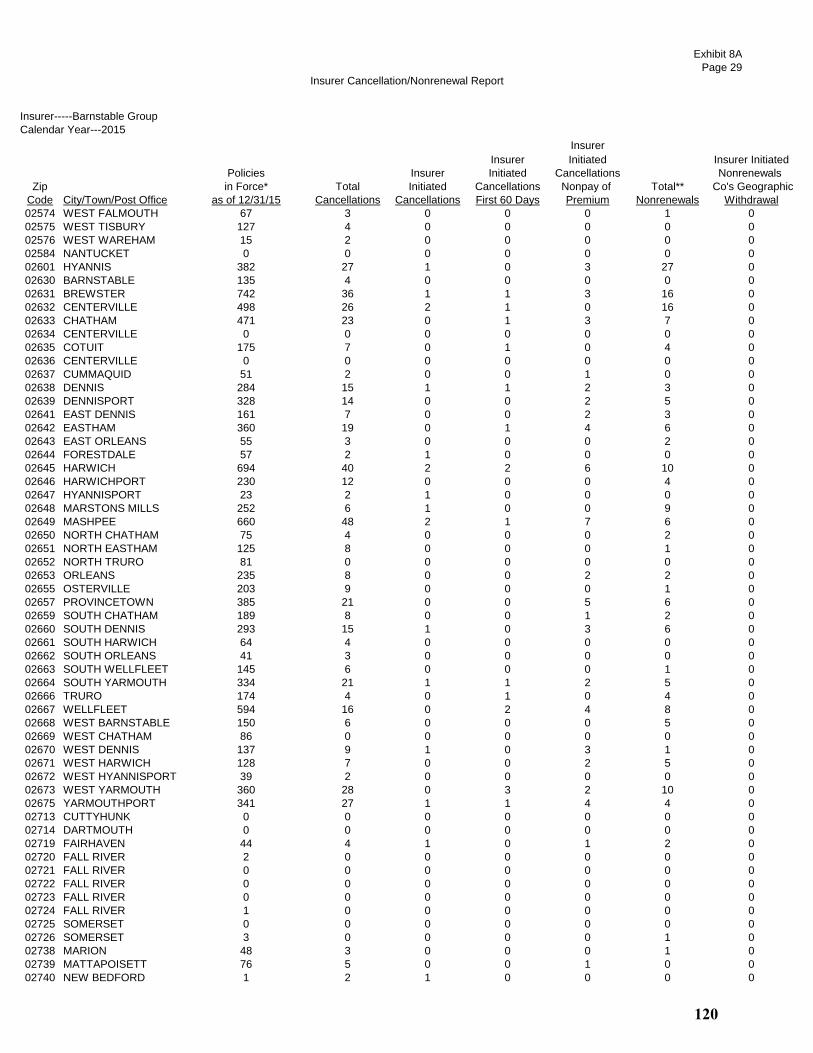
Insurer Cancellation/Nonrenewal Report
Exhibit 8A
Page 29
Insurer-----Barnstable Group
Calendar Year---2015
Insurer
Insurer Initiated Insurer Initiated
Policies Insurer Initiated Cancellations Nonrenewals
Zip in Force* Total Initiated Cancellations Nonpay of Total** Co's Geographic
Code City/Town/Post Office as of 12/31/15 Cancellations Cancellations First 60 Days Premium Nonrenewals Withdrawal
02574 WEST FALMOUTH 67 3 0 0 0 1 0
02575 WEST TISBURY 127 4 0 0 0 0 0
02576 WEST WAREHAM 15 2 0 0 0 0 0
02584 NANTUCKET 0 0 0 0 0 0 0
02601 HYANNIS 382 27 1 0 3 27 0
02630 BARNSTABLE 135 4 0 0 0 0 0
02631 BREWSTER 742 36 1 1 3 16 0
02632 CENTERVILLE 498 26 2 1 0 16 0
02633 CHATHAM 471 23 0 1 3 7 0
02634 CENTERVILLE 0 0 0 0 0 0 0
02635 COTUIT 175 7 0 1 0 4 0
02636 CENTERVILLE 0 0 0 0 0 0 0
02637 CUMMAQUID 51 2 0 0 1 0 0
02638 DENNIS 284 15 1 1 2 3 0
02639 DENNISPORT 328 14 0 0 2 5 0
02641 EAST DENNIS 161 7 0 0 2 3 0
02642 EASTHAM 360 19 0 1 4 6 0
02643 EAST ORLEANS 55 3 0 0 0 2 0
02644 FORESTDALE 57 2 1 0 0 0 0
02645 HARWICH 694 40 2 2 6 10 0
02646 HARWICHPORT 230 12 0 0 0 4 0
02647 HYANNISPORT 23 2 1 0 0 0 0
02648 MARSTONS MILLS 252 6 1 0 0 9 0
02649 MASHPEE 660 48 2 1 7 6 0
02650 NORTH CHATHAM 75 4 0 0 0 2 0
02651 NORTH EASTHAM 125 8 0 0 0 1 0
02652 NORTH TRURO 81 0 0 0 0 0 0
02653 ORLEANS 235 8 0 0 2 2 0
02655 OSTERVILLE 203 9 0 0 0 1 0
02657 PROVINCETOWN 385 21 0 0 5 6 0
02659 SOUTH CHATHAM 189 8 0 0 1 2 0
02660 SOUTH DENNIS 293 15 1 0 3 6 0
02661 SOUTH HARWICH 64 4 0 0 0 0 0
02662 SOUTH ORLEANS 41 3 0 0 0 0 0
02663 SOUTH WELLFLEET 145 6 0 0 0 1 0
02664 SOUTH YARMOUTH 334 21 1 1 2 5 0
02666 TRURO 174 4 0 1 0 4 0
02667 WELLFLEET 594 16 0 2 4 8 0
02668 WEST BARNSTABLE 150 6 0 0 0 5 0
02669 WEST CHATHAM 86 0 0 0 0 0 0
02670 WEST DENNIS 137 9 1 0 3 1 0
02671 WEST HARWICH 128 7 0 0 2 5 0
02672 WEST HYANNISPORT 39 2 0 0 0 0 0
02673 WEST YARMOUTH 360 28 0 3 2 10 0
02675 YARMOUTHPORT 341 27 1 1 4 4 0
02713 CUTTYHUNK 0 0 0 0 0 0 0
02714 DARTMOUTH 0 0 0 0 0 0 0
02719 FAIRHAVEN 44 4 1 0 1 2 0
02720 FALL RIVER 2 0 0 0 0 0 0
02721 FALL RIVER 0 0 0 0 0 0 0
02722 FALL RIVER 0 0 0 0 0 0 0
02723 FALL RIVER 0 0 0 0 0 0 0
02724 FALL RIVER 1 0 0 0 0 0 0
02725 SOMERSET 0 0 0 0 0 0 0
02726 SOMERSET 3 0 0 0 0 1 0
02738 MARION 48 3 0 0 0 1 0
02739 MATTAPOISETT 76 5 0 0 1 0 0
02740 NEW BEDFORD 1 2 1 0 0 0 0
120

Insurer Cancellation/Nonrenewal Report
Exhibit 8A
Page 30
Insurer-----Barnstable Group
Calendar Year---2015
Insurer
Insurer Initiated Insurer Initiated
Policies Insurer Initiated Cancellations Nonrenewals
Zip in Force* Total Initiated Cancellations Nonpay of Total** Co's Geographic
Code City/Town/Post Office as of 12/31/15 Cancellations Cancellations First 60 Days Premium Nonrenewals Withdrawal
02741 NEW BEDFORD 0 0 0 0 0 0 0
02742 NEW BEDFORD 0 0 0 0 0 0 0
02743 ACUSHNET 4 0 0 0 0 0 0
02744 NEW BEDFORD 2 0 0 0 0 0 0
02745 NEW BEDFORD 0 0 0 0 0 0 0
02746 NEW BEDFORD 0 0 0 0 0 0 0
02747 NORTH DARTMOUTH 4 0 0 0 0 0 0
02748 SOUTH DARTMOUTH 15 2 1 0 0 1 0
02777 SWANSEA 0 0 0 0 0 0 0
02790 WESTPORT 4 0 0 0 0 0 0
02791 WESTPORT POINT 0 0 0 0 0 0 0
All Zip Codes Above Combined 13,844 722 26 29 87 269 0
Urban 58 8 1 1 0 0 0
Coastal 13,786 714 25 28 87 269 0
*The number of policies in force as of December 31 of the 2015 calendar year that were not originally issued in the 2015 calendar year.
** "Total Nonrenewals" does not include "Insurer Initiated Nonrenewals Co's Geographic Withdrawal" totals.
121
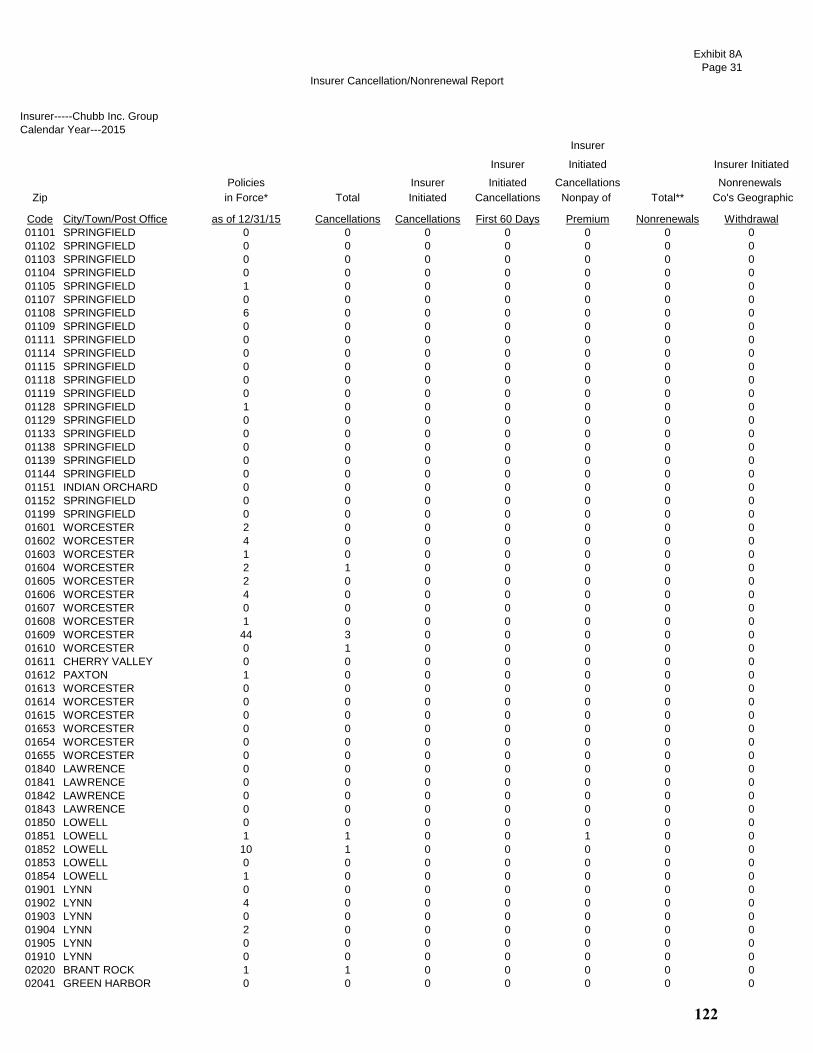
Insurer Cancellation/Nonrenewal Report
Exhibit 8A
Page 31
Insurer-----Chubb Inc. Group
Calendar Year---2015
Insurer
Insurer Initiated Insurer Initiated
Policies Insurer Initiated Cancellations Nonrenewals
Zip in Force* Total Initiated Cancellations Nonpay of Total** Co's Geographic
Code City/Town/Post Office as of 12/31/15 Cancellations Cancellations First 60 Days Premium Nonrenewals Withdrawal
01101 SPRINGFIELD 0 0 0 0 0 0 0
01102 SPRINGFIELD 0 0 0 0 0 0 0
01103 SPRINGFIELD 0 0 0 0 0 0 0
01104 SPRINGFIELD 0 0 0 0 0 0 0
01105 SPRINGFIELD 1 0 0 0 0 0 0
01107 SPRINGFIELD 0 0 0 0 0 0 0
01108 SPRINGFIELD 6 0 0 0 0 0 0
01109 SPRINGFIELD 0 0 0 0 0 0 0
01111 SPRINGFIELD 0 0 0 0 0 0 0
01114 SPRINGFIELD 0 0 0 0 0 0 0
01115 SPRINGFIELD 0 0 0 0 0 0 0
01118 SPRINGFIELD 0 0 0 0 0 0 0
01119 SPRINGFIELD 0 0 0 0 0 0 0
01128 SPRINGFIELD 1 0 0 0 0 0 0
01129 SPRINGFIELD 0 0 0 0 0 0 0
01133 SPRINGFIELD 0 0 0 0 0 0 0
01138 SPRINGFIELD 0 0 0 0 0 0 0
01139 SPRINGFIELD 0 0 0 0 0 0 0
01144 SPRINGFIELD 0 0 0 0 0 0 0
01151 INDIAN ORCHARD 0 0 0 0 0 0 0
01152 SPRINGFIELD 0 0 0 0 0 0 0
01199 SPRINGFIELD 0 0 0 0 0 0 0
01601 WORCESTER 2 0 0 0 0 0 0
01602 WORCESTER 4 0 0 0 0 0 0
01603 WORCESTER 1 0 0 0 0 0 0
01604 WORCESTER 2 1 0 0 0 0 0
01605 WORCESTER 2 0 0 0 0 0 0
01606 WORCESTER 4 0 0 0 0 0 0
01607 WORCESTER 0 0 0 0 0 0 0
01608 WORCESTER 1 0 0 0 0 0 0
01609 WORCESTER 44 3 0 0 0 0 0
01610 WORCESTER 0 1 0 0 0 0 0
01611 CHERRY VALLEY 0 0 0 0 0 0 0
01612 PAXTON 1 0 0 0 0 0 0
01613 WORCESTER 0 0 0 0 0 0 0
01614 WORCESTER 0 0 0 0 0 0 0
01615 WORCESTER 0 0 0 0 0 0 0
01653 WORCESTER 0 0 0 0 0 0 0
01654 WORCESTER 0 0 0 0 0 0 0
01655 WORCESTER 0 0 0 0 0 0 0
01840 LAWRENCE 0 0 0 0 0 0 0
01841 LAWRENCE 0 0 0 0 0 0 0
01842 LAWRENCE 0 0 0 0 0 0 0
01843 LAWRENCE 0 0 0 0 0 0 0
01850 LOWELL 0 0 0 0 0 0 0
01851 LOWELL 1 1 0 0 1 0 0
01852 LOWELL 10 1 0 0 0 0 0
01853 LOWELL 0 0 0 0 0 0 0
01854 LOWELL 1 0 0 0 0 0 0
01901 LYNN 0 0 0 0 0 0 0
01902 LYNN 4 0 0 0 0 0 0
01903 LYNN 0 0 0 0 0 0 0
01904 LYNN 2 0 0 0 0 0 0
01905 LYNN 0 0 0 0 0 0 0
01910 LYNN 0 0 0 0 0 0 0
02020 BRANT ROCK 1 1 0 0 0 0 0
02041 GREEN HARBOR 0 0 0 0 0 0 0
122
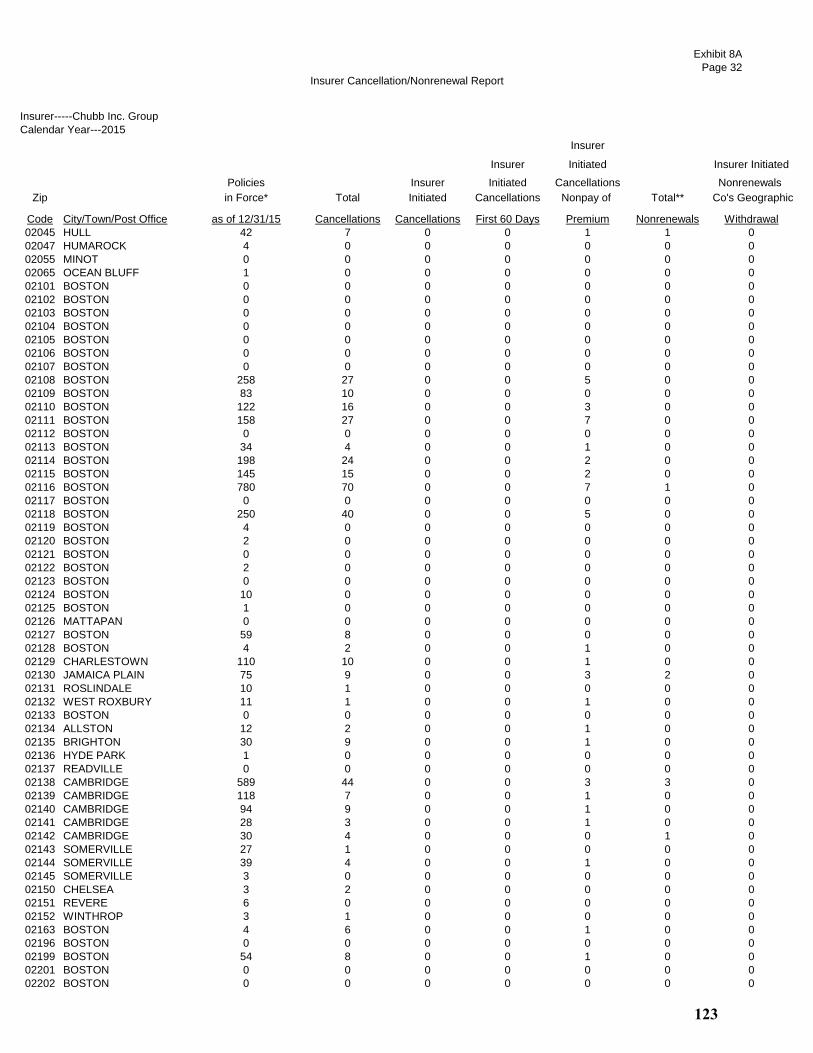
Insurer Cancellation/Nonrenewal Report
Exhibit 8A
Page 32
Insurer-----Chubb Inc. Group
Calendar Year---2015
Insurer
Insurer Initiated Insurer Initiated
Policies Insurer Initiated Cancellations Nonrenewals
Zip in Force* Total Initiated Cancellations Nonpay of Total** Co's Geographic
Code City/Town/Post Office as of 12/31/15 Cancellations Cancellations First 60 Days Premium Nonrenewals Withdrawal
02045 HULL 42 7 0 0 1 1 0
02047 HUMAROCK 4 0 0 0 0 0 0
02055 MINOT 0 0 0 0 0 0 0
02065 OCEAN BLUFF 1 0 0 0 0 0 0
02101 BOSTON 0 0 0 0 0 0 0
02102 BOSTON 0 0 0 0 0 0 0
02103 BOSTON 0 0 0 0 0 0 0
02104 BOSTON 0 0 0 0 0 0 0
02105 BOSTON 0 0 0 0 0 0 0
02106 BOSTON 0 0 0 0 0 0 0
02107 BOSTON 0 0 0 0 0 0 0
02108 BOSTON 258 27 0 0 5 0 0
02109 BOSTON 83 10 0 0 0 0 0
02110 BOSTON 122 16 0 0 3 0 0
02111 BOSTON 158 27 0 0 7 0 0
02112 BOSTON 0 0 0 0 0 0 0
02113 BOSTON 34 4 0 0 1 0 0
02114 BOSTON 198 24 0 0 2 0 0
02115 BOSTON 145 15 0 0 2 0 0
02116 BOSTON 780 70 0 0 7 1 0
02117 BOSTON 0 0 0 0 0 0 0
02118 BOSTON 250 40 0 0 5 0 0
02119 BOSTON 4 0 0 0 0 0 0
02120 BOSTON 2 0 0 0 0 0 0
02121 BOSTON 0 0 0 0 0 0 0
02122 BOSTON 2 0 0 0 0 0 0
02123 BOSTON 0 0 0 0 0 0 0
02124 BOSTON 10 0 0 0 0 0 0
02125 BOSTON 1 0 0 0 0 0 0
02126 MATTAPAN 0 0 0 0 0 0 0
02127 BOSTON 59 8 0 0 0 0 0
02128 BOSTON 4 2 0 0 1 0 0
02129 CHARLESTOWN 110 10 0 0 1 0 0
02130 JAMAICA PLAIN 75 9 0 0 3 2 0
02131 ROSLINDALE 10 1 0 0 0 0 0
02132 WEST ROXBURY 11 1 0 0 1 0 0
02133 BOSTON 0 0 0 0 0 0 0
02134 ALLSTON 12 2 0 0 1 0 0
02135 BRIGHTON 30 9 0 0 1 0 0
02136 HYDE PARK 1 0 0 0 0 0 0
02137 READVILLE 0 0 0 0 0 0 0
02138 CAMBRIDGE 589 44 0 0 3 3 0
02139 CAMBRIDGE 118 7 0 0 1 0 0
02140 CAMBRIDGE 94 9 0 0 1 0 0
02141 CAMBRIDGE 28 3 0 0 1 0 0
02142 CAMBRIDGE 30 4 0 0 0 1 0
02143 SOMERVILLE 27 1 0 0 0 0 0
02144 SOMERVILLE 39 4 0 0 1 0 0
02145 SOMERVILLE 3 0 0 0 0 0 0
02150 CHELSEA 3 2 0 0 0 0 0
02151 REVERE 6 0 0 0 0 0 0
02152 WINTHROP 3 1 0 0 0 0 0
02163 BOSTON 4 6 0 0 1 0 0
02196 BOSTON 0 0 0 0 0 0 0
02199 BOSTON 54 8 0 0 1 0 0
02201 BOSTON 0 0 0 0 0 0 0
02202 BOSTON 0 0 0 0 0 0 0
123
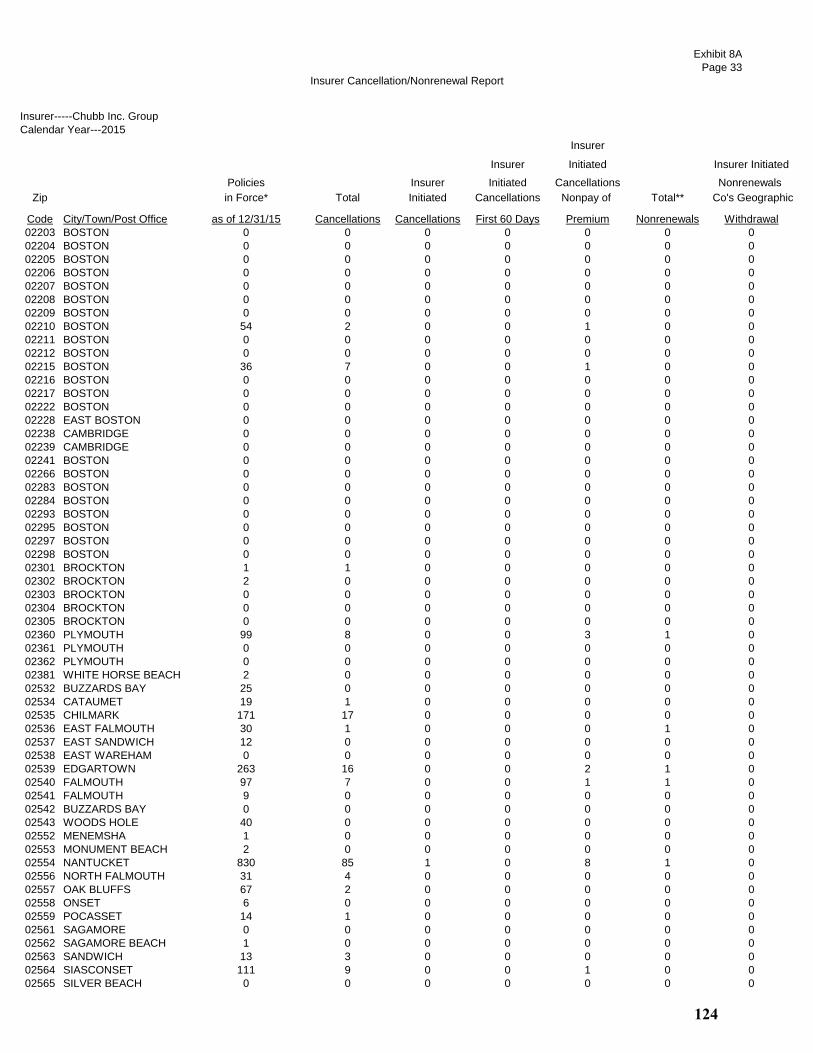
Insurer Cancellation/Nonrenewal Report
Exhibit 8A
Page 33
Insurer-----Chubb Inc. Group
Calendar Year---2015
Insurer
Insurer Initiated Insurer Initiated
Policies Insurer Initiated Cancellations Nonrenewals
Zip in Force* Total Initiated Cancellations Nonpay of Total** Co's Geographic
Code City/Town/Post Office as of 12/31/15 Cancellations Cancellations First 60 Days Premium Nonrenewals Withdrawal
02203 BOSTON 0 0 0 0 0 0 0
02204 BOSTON 0 0 0 0 0 0 0
02205 BOSTON 0 0 0 0 0 0 0
02206 BOSTON 0 0 0 0 0 0 0
02207 BOSTON 0 0 0 0 0 0 0
02208 BOSTON 0 0 0 0 0 0 0
02209 BOSTON 0 0 0 0 0 0 0
02210 BOSTON 54 2 0 0 1 0 0
02211 BOSTON 0 0 0 0 0 0 0
02212 BOSTON 0 0 0 0 0 0 0
02215 BOSTON 36 7 0 0 1 0 0
02216 BOSTON 0 0 0 0 0 0 0
02217 BOSTON 0 0 0 0 0 0 0
02222 BOSTON 0 0 0 0 0 0 0
02228 EAST BOSTON 0 0 0 0 0 0 0
02238 CAMBRIDGE 0 0 0 0 0 0 0
02239 CAMBRIDGE 0 0 0 0 0 0 0
02241 BOSTON 0 0 0 0 0 0 0
02266 BOSTON 0 0 0 0 0 0 0
02283 BOSTON 0 0 0 0 0 0 0
02284 BOSTON 0 0 0 0 0 0 0
02293 BOSTON 0 0 0 0 0 0 0
02295 BOSTON 0 0 0 0 0 0 0
02297 BOSTON 0 0 0 0 0 0 0
02298 BOSTON 0 0 0 0 0 0 0
02301 BROCKTON 1 1 0 0 0 0 0
02302 BROCKTON 2 0 0 0 0 0 0
02303 BROCKTON 0 0 0 0 0 0 0
02304 BROCKTON 0 0 0 0 0 0 0
02305 BROCKTON 0 0 0 0 0 0 0
02360 PLYMOUTH 99 8 0 0 3 1 0
02361 PLYMOUTH 0 0 0 0 0 0 0
02362 PLYMOUTH 0 0 0 0 0 0 0
02381 WHITE HORSE BEACH 2 0 0 0 0 0 0
02532 BUZZARDS BAY 25 0 0 0 0 0 0
02534 CATAUMET 19 1 0 0 0 0 0
02535 CHILMARK 171 17 0 0 0 0 0
02536 EAST FALMOUTH 30 1 0 0 0 1 0
02537 EAST SANDWICH 12 0 0 0 0 0 0
02538 EAST WAREHAM 0 0 0 0 0 0 0
02539 EDGARTOWN 263 16 0 0 2 1 0
02540 FALMOUTH 97 7 0 0 1 1 0
02541 FALMOUTH 9 0 0 0 0 0 0
02542 BUZZARDS BAY 0 0 0 0 0 0 0
02543 WOODS HOLE 40 0 0 0 0 0 0
02552 MENEMSHA 1 0 0 0 0 0 0
02553 MONUMENT BEACH 2 0 0 0 0 0 0
02554 NANTUCKET 830 85 1 0 8 1 0
02556 NORTH FALMOUTH 31 4 0 0 0 0 0
02557 OAK BLUFFS 67 2 0 0 0 0 0
02558 ONSET 6 0 0 0 0 0 0
02559 POCASSET 14 1 0 0 0 0 0
02561 SAGAMORE 0 0 0 0 0 0 0
02562 SAGAMORE BEACH 1 0 0 0 0 0 0
02563 SANDWICH 13 3 0 0 0 0 0
02564 SIASCONSET 111 9 0 0 1 0 0
02565 SILVER BEACH 0 0 0 0 0 0 0
124
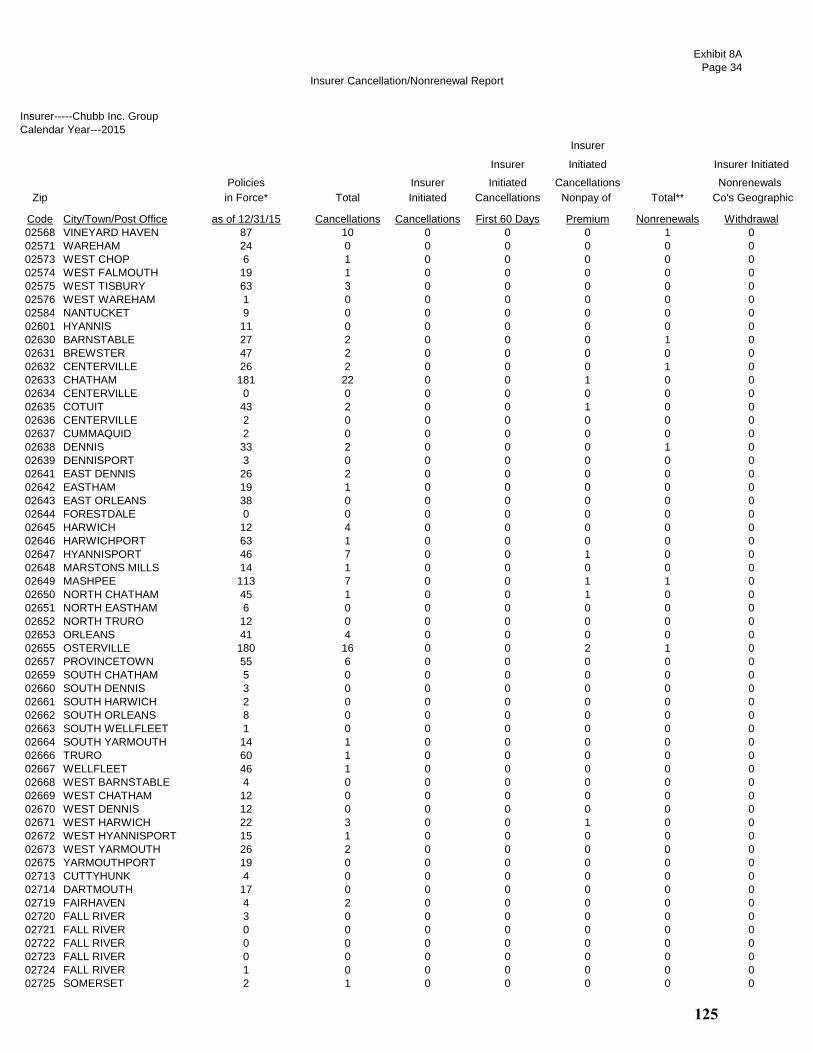
Insurer Cancellation/Nonrenewal Report
Exhibit 8A
Page 34
Insurer-----Chubb Inc. Group
Calendar Year---2015
Insurer
Insurer Initiated Insurer Initiated
Policies Insurer Initiated Cancellations Nonrenewals
Zip in Force* Total Initiated Cancellations Nonpay of Total** Co's Geographic
Code City/Town/Post Office as of 12/31/15 Cancellations Cancellations First 60 Days Premium Nonrenewals Withdrawal
02568 VINEYARD HAVEN 87 10 0 0 0 1 0
02571 WAREHAM 24 0 0 0 0 0 0
02573 WEST CHOP 6 1 0 0 0 0 0
02574 WEST FALMOUTH 19 1 0 0 0 0 0
02575 WEST TISBURY 63 3 0 0 0 0 0
02576 WEST WAREHAM 1 0 0 0 0 0 0
02584 NANTUCKET 9 0 0 0 0 0 0
02601 HYANNIS 11 0 0 0 0 0 0
02630 BARNSTABLE 27 2 0 0 0 1 0
02631 BREWSTER 47 2 0 0 0 0 0
02632 CENTERVILLE 26 2 0 0 0 1 0
02633 CHATHAM 181 22 0 0 1 0 0
02634 CENTERVILLE 0 0 0 0 0 0 0
02635 COTUIT 43 2 0 0 1 0 0
02636 CENTERVILLE 2 0 0 0 0 0 0
02637 CUMMAQUID 2 0 0 0 0 0 0
02638 DENNIS 33 2 0 0 0 1 0
02639 DENNISPORT 3 0 0 0 0 0 0
02641 EAST DENNIS 26 2 0 0 0 0 0
02642 EASTHAM 19 1 0 0 0 0 0
02643 EAST ORLEANS 38 0 0 0 0 0 0
02644 FORESTDALE 0 0 0 0 0 0 0
02645 HARWICH 12 4 0 0 0 0 0
02646 HARWICHPORT 63 1 0 0 0 0 0
02647 HYANNISPORT 46 7 0 0 1 0 0
02648 MARSTONS MILLS 14 1 0 0 0 0 0
02649 MASHPEE 113 7 0 0 1 1 0
02650 NORTH CHATHAM 45 1 0 0 1 0 0
02651 NORTH EASTHAM 6 0 0 0 0 0 0
02652 NORTH TRURO 12 0 0 0 0 0 0
02653 ORLEANS 41 4 0 0 0 0 0
02655 OSTERVILLE 180 16 0 0 2 1 0
02657 PROVINCETOWN 55 6 0 0 0 0 0
02659 SOUTH CHATHAM 5 0 0 0 0 0 0
02660 SOUTH DENNIS 3 0 0 0 0 0 0
02661 SOUTH HARWICH 2 0 0 0 0 0 0
02662 SOUTH ORLEANS 8 0 0 0 0 0 0
02663 SOUTH WELLFLEET 1 0 0 0 0 0 0
02664 SOUTH YARMOUTH 14 1 0 0 0 0 0
02666 TRURO 60 1 0 0 0 0 0
02667 WELLFLEET 46 1 0 0 0 0 0
02668 WEST BARNSTABLE 4 0 0 0 0 0 0
02669 WEST CHATHAM 12 0 0 0 0 0 0
02670 WEST DENNIS 12 0 0 0 0 0 0
02671 WEST HARWICH 22 3 0 0 1 0 0
02672 WEST HYANNISPORT 15 1 0 0 0 0 0
02673 WEST YARMOUTH 26 2 0 0 0 0 0
02675 YARMOUTHPORT 19 0 0 0 0 0 0
02713 CUTTYHUNK 4 0 0 0 0 0 0
02714 DARTMOUTH 17 0 0 0 0 0 0
02719 FAIRHAVEN 4 2 0 0 0 0 0
02720 FALL RIVER 3 0 0 0 0 0 0
02721 FALL RIVER 0 0 0 0 0 0 0
02722 FALL RIVER 0 0 0 0 0 0 0
02723 FALL RIVER 0 0 0 0 0 0 0
02724 FALL RIVER 1 0 0 0 0 0 0
02725 SOMERSET 2 1 0 0 0 0 0
125
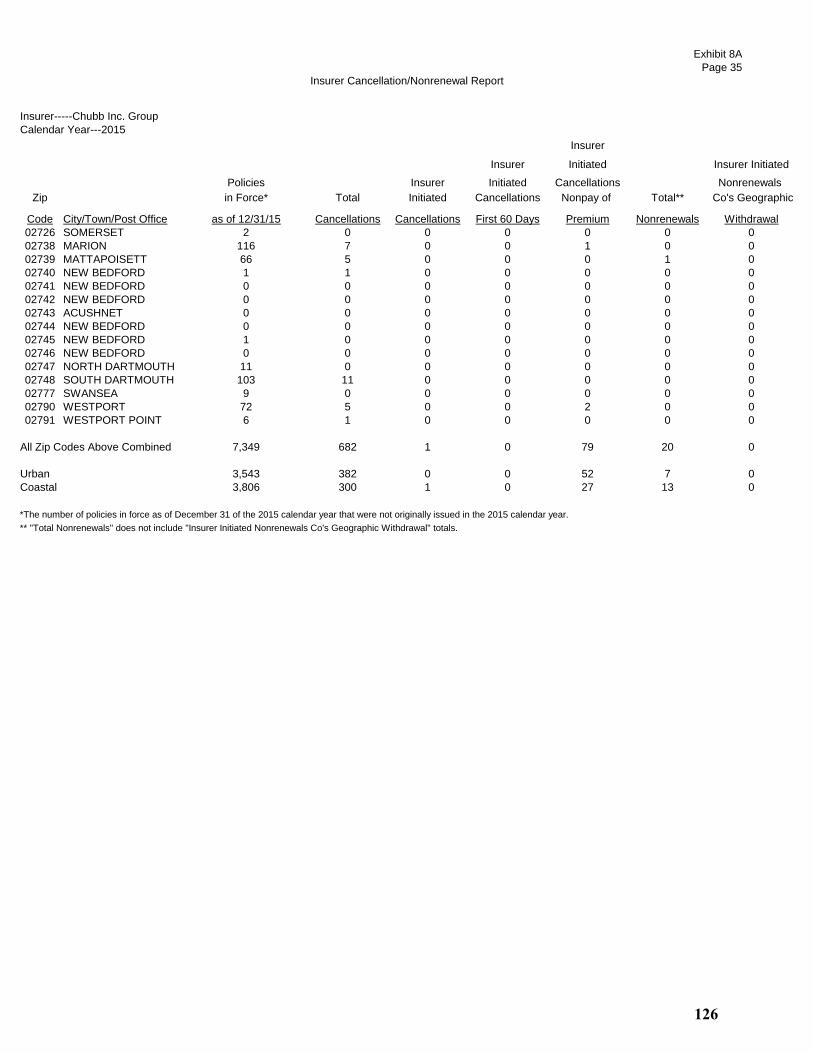
Insurer Cancellation/Nonrenewal Report
Exhibit 8A
Page 35
Insurer-----Chubb Inc. Group
Calendar Year---2015
Insurer
Insurer Initiated Insurer Initiated
Policies Insurer Initiated Cancellations Nonrenewals
Zip in Force* Total Initiated Cancellations Nonpay of Total** Co's Geographic
Code City/Town/Post Office as of 12/31/15 Cancellations Cancellations First 60 Days Premium Nonrenewals Withdrawal
02726 SOMERSET 2 0 0 0 0 0 0
02738 MARION 116 7 0 0 1 0 0
02739 MATTAPOISETT 66 5 0 0 0 1 0
02740 NEW BEDFORD 1 1 0 0 0 0 0
02741 NEW BEDFORD 0 0 0 0 0 0 0
02742 NEW BEDFORD 0 0 0 0 0 0 0
02743 ACUSHNET 0 0 0 0 0 0 0
02744 NEW BEDFORD 0 0 0 0 0 0 0
02745 NEW BEDFORD 1 0 0 0 0 0 0
02746 NEW BEDFORD 0 0 0 0 0 0 0
02747 NORTH DARTMOUTH 11 0 0 0 0 0 0
02748 SOUTH DARTMOUTH 103 11 0 0 0 0 0
02777 SWANSEA 9 0 0 0 0 0 0
02790 WESTPORT 72 5 0 0 2 0 0
02791 WESTPORT POINT 6 1 0 0 0 0 0
All Zip Codes Above Combined 7,349 682 1 0 79 20 0
Urban 3,543 382 0 0 52 7 0
Coastal 3,806 300 1 0 27 13 0
*The number of policies in force as of December 31 of the 2015 calendar year that were not originally issued in the 2015 calendar year.
** "Total Nonrenewals" does not include "Insurer Initiated Nonrenewals Co's Geographic Withdrawal" totals.
126

Insurer Cancellation/Nonrenewal Report
Exhibit 8A
Page 36
Insurer-----Chubb Ltd Group (formerly Ace Ltd Group)
Calendar Year---2015
Insurer
Insurer Initiated Insurer Initiated
Policies Insurer Initiated Cancellations Nonrenewals
Zip in Force* Total Initiated Cancellations Nonpay of Total** Co's Geographic
Code City/Town/Post Office as of 12/31/15 Cancellations Cancellations First 60 Days Premium Nonrenewals Withdrawal
01101 SPRINGFIELD 0 0 0 0 0 0 0
01102 SPRINGFIELD 0 0 0 0 0 0 0
01103 SPRINGFIELD 0 0 0 0 0 0 0
01104 SPRINGFIELD 0 0 0 0 0 0 0
01105 SPRINGFIELD 0 0 0 0 0 0 0
01107 SPRINGFIELD 0 0 0 0 0 0 0
01108 SPRINGFIELD 0 0 0 0 0 0 0
01109 SPRINGFIELD 0 0 0 0 0 0 0
01111 SPRINGFIELD 0 0 0 0 0 0 0
01114 SPRINGFIELD 0 0 0 0 0 0 0
01115 SPRINGFIELD 0 0 0 0 0 0 0
01118 SPRINGFIELD 0 0 0 0 0 0 0
01119 SPRINGFIELD 0 0 0 0 0 0 0
01128 SPRINGFIELD 0 0 0 0 0 0 0
01129 SPRINGFIELD 1 0 0 0 0 0 0
01133 SPRINGFIELD 0 0 0 0 0 0 0
01138 SPRINGFIELD 0 0 0 0 0 0 0
01139 SPRINGFIELD 0 0 0 0 0 0 0
01144 SPRINGFIELD 0 0 0 0 0 0 0
01151 INDIAN ORCHARD 0 0 0 0 0 0 0
01152 SPRINGFIELD 0 0 0 0 0 0 0
01199 SPRINGFIELD 0 0 0 0 0 0 0
01601 WORCESTER 0 0 0 0 0 0 0
01602 WORCESTER 0 0 0 0 0 0 0
01603 WORCESTER 1 0 0 0 0 0 0
01604 WORCESTER 0 0 0 0 0 0 0
01605 WORCESTER 0 0 0 0 0 0 0
01606 WORCESTER 0 0 0 0 0 0 0
01607 WORCESTER 0 0 0 0 0 0 0
01608 WORCESTER 0 0 0 0 0 0 0
01609 WORCESTER 0 1 0 0 1 0 0
01610 WORCESTER 0 0 0 0 0 0 0
01611 CHERRY VALLEY 0 0 0 0 0 0 0
01612 PAXTON 0 0 0 0 0 0 0
01613 WORCESTER 0 0 0 0 0 0 0
01614 WORCESTER 0 0 0 0 0 0 0
01615 WORCESTER 0 0 0 0 0 0 0
01653 WORCESTER 0 0 0 0 0 0 0
01654 WORCESTER 0 0 0 0 0 0 0
01655 WORCESTER 0 0 0 0 0 0 0
01840 LAWRENCE 0 0 0 0 0 0 0
01841 LAWRENCE 0 0 0 0 0 0 0
01842 LAWRENCE 0 0 0 0 0 0 0
01843 LAWRENCE 0 0 0 0 0 0 0
01850 LOWELL 0 0 0 0 0 0 0
01851 LOWELL 1 0 0 0 0 0 0
01852 LOWELL 1 0 0 0 0 0 0
01853 LOWELL 0 0 0 0 0 0 0
01854 LOWELL 0 0 0 0 0 0 0
01901 LYNN 0 0 0 0 0 0 0
01902 LYNN 0 0 0 0 0 0 0
01903 LYNN 0 0 0 0 0 0 0
01904 LYNN 0 0 0 0 0 0 0
01905 LYNN 0 0 0 0 0 0 0
01910 LYNN 0 0 0 0 0 0 0
02020 BRANT ROCK 0 0 0 0 0 0 0
02041 GREEN HARBOR 0 0 0 0 0 0 0
127
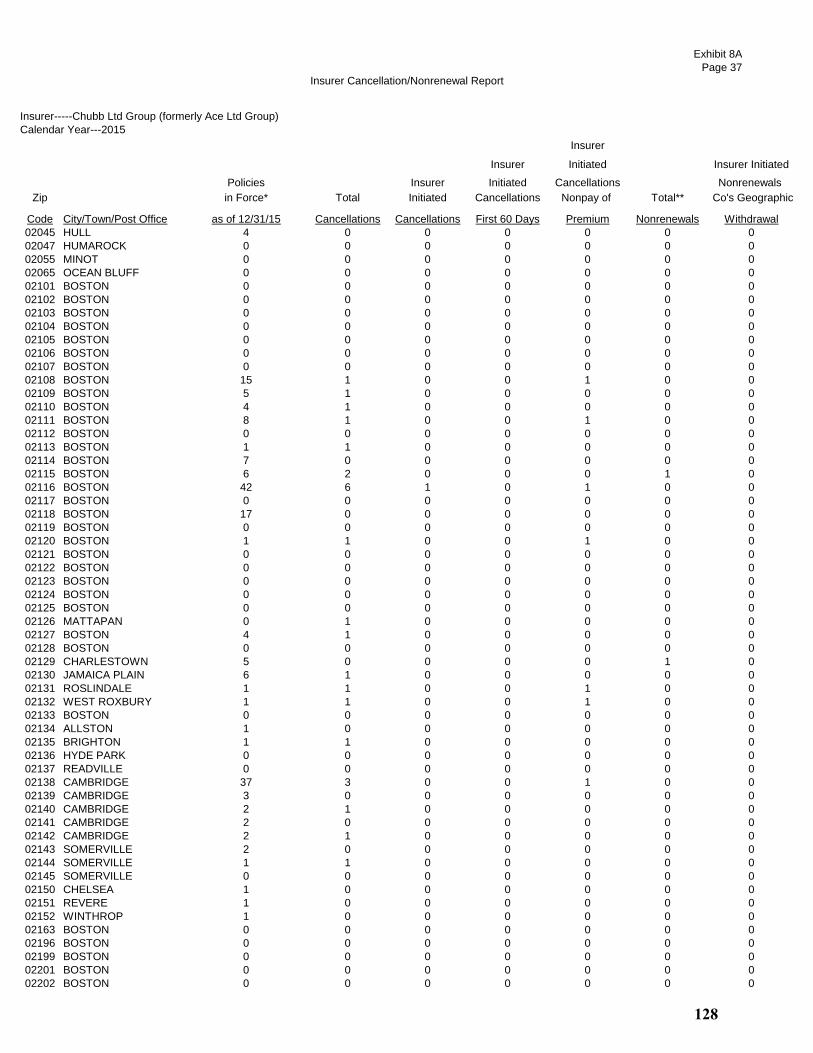
Insurer Cancellation/Nonrenewal Report
Exhibit 8A
Page 37
Insurer-----Chubb Ltd Group (formerly Ace Ltd Group)
Calendar Year---2015
Insurer
Insurer Initiated Insurer Initiated
Policies Insurer Initiated Cancellations Nonrenewals
Zip in Force* Total Initiated Cancellations Nonpay of Total** Co's Geographic
Code City/Town/Post Office as of 12/31/15 Cancellations Cancellations First 60 Days Premium Nonrenewals Withdrawal
02045 HULL 4 0 0 0 0 0 0
02047 HUMAROCK 0 0 0 0 0 0 0
02055 MINOT 0 0 0 0 0 0 0
02065 OCEAN BLUFF 0 0 0 0 0 0 0
02101 BOSTON 0 0 0 0 0 0 0
02102 BOSTON 0 0 0 0 0 0 0
02103 BOSTON 0 0 0 0 0 0 0
02104 BOSTON 0 0 0 0 0 0 0
02105 BOSTON 0 0 0 0 0 0 0
02106 BOSTON 0 0 0 0 0 0 0
02107 BOSTON 0 0 0 0 0 0 0
02108 BOSTON 15 1 0 0 1 0 0
02109 BOSTON 5 1 0 0 0 0 0
02110 BOSTON 4 1 0 0 0 0 0
02111 BOSTON 8 1 0 0 1 0 0
02112 BOSTON 0 0 0 0 0 0 0
02113 BOSTON 1 1 0 0 0 0 0
02114 BOSTON 7 0 0 0 0 0 0
02115 BOSTON 6 2 0 0 0 1 0
02116 BOSTON 42 6 1 0 1 0 0
02117 BOSTON 0 0 0 0 0 0 0
02118 BOSTON 17 0 0 0 0 0 0
02119 BOSTON 0 0 0 0 0 0 0
02120 BOSTON 1 1 0 0 1 0 0
02121 BOSTON 0 0 0 0 0 0 0
02122 BOSTON 0 0 0 0 0 0 0
02123 BOSTON 0 0 0 0 0 0 0
02124 BOSTON 0 0 0 0 0 0 0
02125 BOSTON 0 0 0 0 0 0 0
02126 MATTAPAN 0 1 0 0 0 0 0
02127 BOSTON 4 1 0 0 0 0 0
02128 BOSTON 0 0 0 0 0 0 0
02129 CHARLESTOWN 5 0 0 0 0 1 0
02130 JAMAICA PLAIN 6 1 0 0 0 0 0
02131 ROSLINDALE 1 1 0 0 1 0 0
02132 WEST ROXBURY 1 1 0 0 1 0 0
02133 BOSTON 0 0 0 0 0 0 0
02134 ALLSTON 1 0 0 0 0 0 0
02135 BRIGHTON 1 1 0 0 0 0 0
02136 HYDE PARK 0 0 0 0 0 0 0
02137 READVILLE 0 0 0 0 0 0 0
02138 CAMBRIDGE 37 3 0 0 1 0 0
02139 CAMBRIDGE 3 0 0 0 0 0 0
02140 CAMBRIDGE 2 1 0 0 0 0 0
02141 CAMBRIDGE 2 0 0 0 0 0 0
02142 CAMBRIDGE 2 1 0 0 0 0 0
02143 SOMERVILLE 2 0 0 0 0 0 0
02144 SOMERVILLE 1 1 0 0 0 0 0
02145 SOMERVILLE 0 0 0 0 0 0 0
02150 CHELSEA 1 0 0 0 0 0 0
02151 REVERE 1 0 0 0 0 0 0
02152 WINTHROP 1 0 0 0 0 0 0
02163 BOSTON 0 0 0 0 0 0 0
02196 BOSTON 0 0 0 0 0 0 0
02199 BOSTON 0 0 0 0 0 0 0
02201 BOSTON 0 0 0 0 0 0 0
02202 BOSTON 0 0 0 0 0 0 0
128
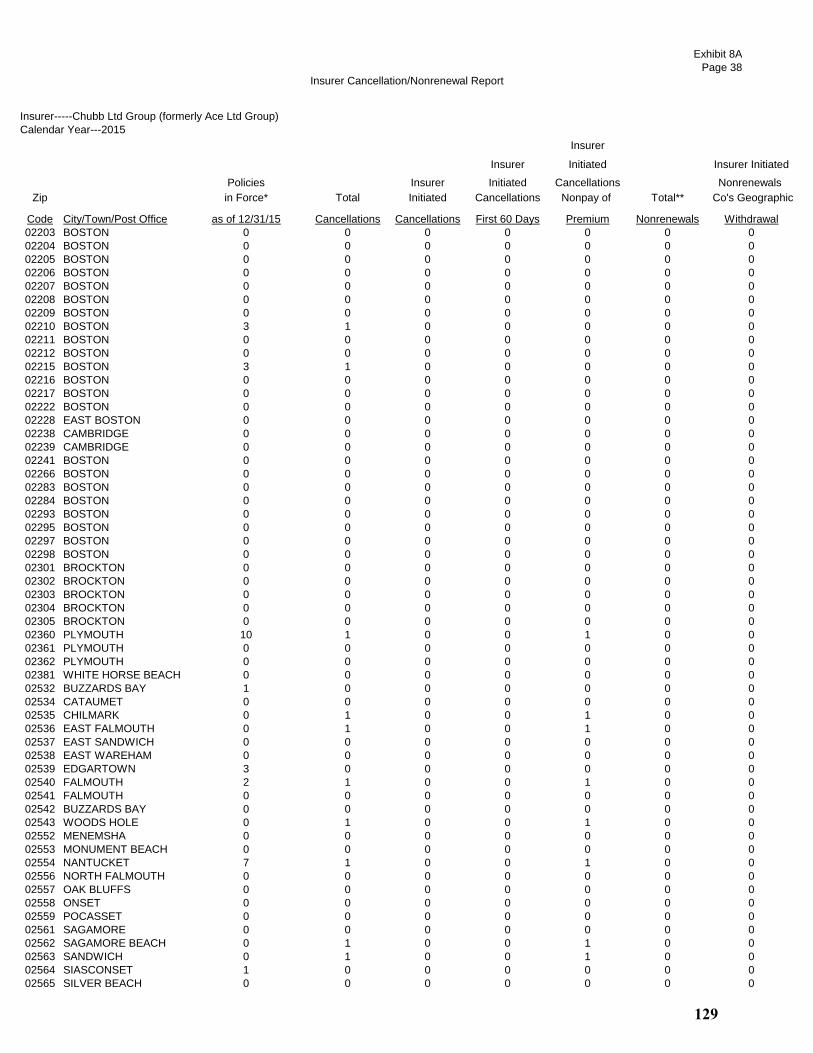
Insurer Cancellation/Nonrenewal Report
Exhibit 8A
Page 38
Insurer-----Chubb Ltd Group (formerly Ace Ltd Group)
Calendar Year---2015
Insurer
Insurer Initiated Insurer Initiated
Policies Insurer Initiated Cancellations Nonrenewals
Zip in Force* Total Initiated Cancellations Nonpay of Total** Co's Geographic
Code City/Town/Post Office as of 12/31/15 Cancellations Cancellations First 60 Days Premium Nonrenewals Withdrawal
02203 BOSTON 0 0 0 0 0 0 0
02204 BOSTON 0 0 0 0 0 0 0
02205 BOSTON 0 0 0 0 0 0 0
02206 BOSTON 0 0 0 0 0 0 0
02207 BOSTON 0 0 0 0 0 0 0
02208 BOSTON 0 0 0 0 0 0 0
02209 BOSTON 0 0 0 0 0 0 0
02210 BOSTON 3 1 0 0 0 0 0
02211 BOSTON 0 0 0 0 0 0 0
02212 BOSTON 0 0 0 0 0 0 0
02215 BOSTON 3 1 0 0 0 0 0
02216 BOSTON 0 0 0 0 0 0 0
02217 BOSTON 0 0 0 0 0 0 0
02222 BOSTON 0 0 0 0 0 0 0
02228 EAST BOSTON 0 0 0 0 0 0 0
02238 CAMBRIDGE 0 0 0 0 0 0 0
02239 CAMBRIDGE 0 0 0 0 0 0 0
02241 BOSTON 0 0 0 0 0 0 0
02266 BOSTON 0 0 0 0 0 0 0
02283 BOSTON 0 0 0 0 0 0 0
02284 BOSTON 0 0 0 0 0 0 0
02293 BOSTON 0 0 0 0 0 0 0
02295 BOSTON 0 0 0 0 0 0 0
02297 BOSTON 0 0 0 0 0 0 0
02298 BOSTON 0 0 0 0 0 0 0
02301 BROCKTON 0 0 0 0 0 0 0
02302 BROCKTON 0 0 0 0 0 0 0
02303 BROCKTON 0 0 0 0 0 0 0
02304 BROCKTON 0 0 0 0 0 0 0
02305 BROCKTON 0 0 0 0 0 0 0
02360 PLYMOUTH 10 1 0 0 1 0 0
02361 PLYMOUTH 0 0 0 0 0 0 0
02362 PLYMOUTH 0 0 0 0 0 0 0
02381 WHITE HORSE BEACH 0 0 0 0 0 0 0
02532 BUZZARDS BAY 1 0 0 0 0 0 0
02534 CATAUMET 0 0 0 0 0 0 0
02535 CHILMARK 0 1 0 0 1 0 0
02536 EAST FALMOUTH 0 1 0 0 1 0 0
02537 EAST SANDWICH 0 0 0 0 0 0 0
02538 EAST WAREHAM 0 0 0 0 0 0 0
02539 EDGARTOWN 3 0 0 0 0 0 0
02540 FALMOUTH 2 1 0 0 1 0 0
02541 FALMOUTH 0 0 0 0 0 0 0
02542 BUZZARDS BAY 0 0 0 0 0 0 0
02543 WOODS HOLE 0 1 0 0 1 0 0
02552 MENEMSHA 0 0 0 0 0 0 0
02553 MONUMENT BEACH 0 0 0 0 0 0 0
02554 NANTUCKET 7 1 0 0 1 0 0
02556 NORTH FALMOUTH 0 0 0 0 0 0 0
02557 OAK BLUFFS 0 0 0 0 0 0 0
02558 ONSET 0 0 0 0 0 0 0
02559 POCASSET 0 0 0 0 0 0 0
02561 SAGAMORE 0 0 0 0 0 0 0
02562 SAGAMORE BEACH 0 1 0 0 1 0 0
02563 SANDWICH 0 1 0 0 1 0 0
02564 SIASCONSET 1 0 0 0 0 0 0
02565 SILVER BEACH 0 0 0 0 0 0 0
129
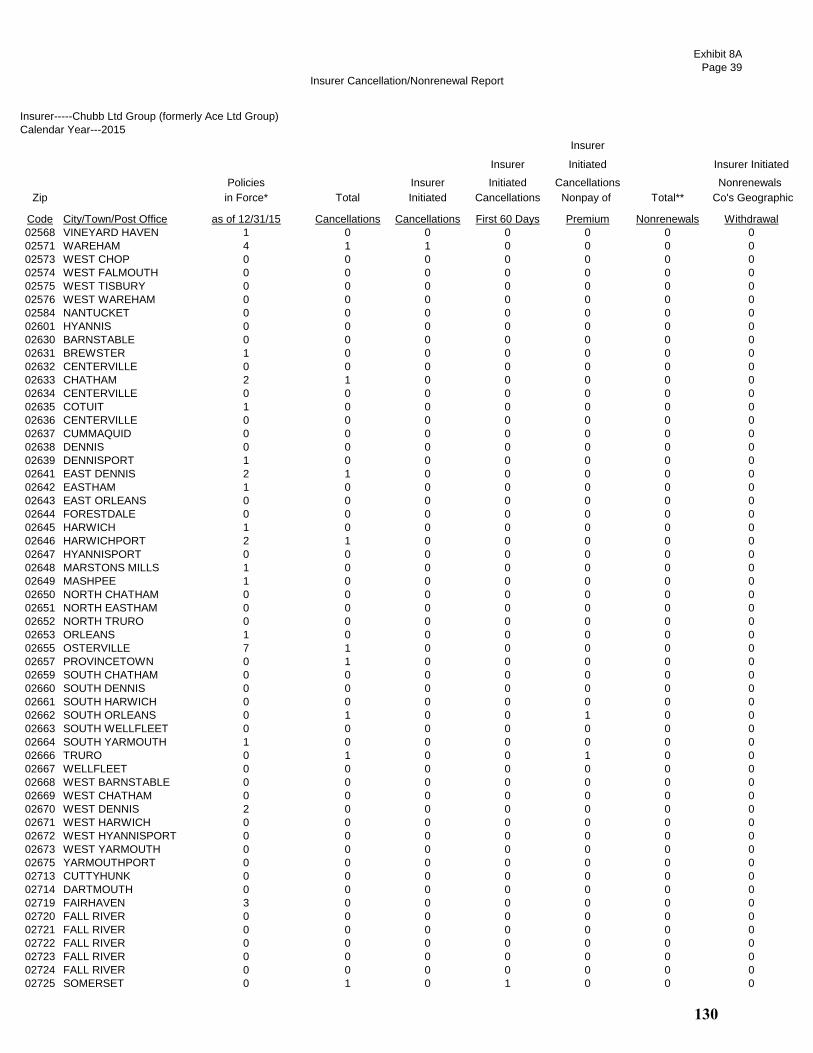
Insurer Cancellation/Nonrenewal Report
Exhibit 8A
Page 39
Insurer-----Chubb Ltd Group (formerly Ace Ltd Group)
Calendar Year---2015
Insurer
Insurer Initiated Insurer Initiated
Policies Insurer Initiated Cancellations Nonrenewals
Zip in Force* Total Initiated Cancellations Nonpay of Total** Co's Geographic
Code City/Town/Post Office as of 12/31/15 Cancellations Cancellations First 60 Days Premium Nonrenewals Withdrawal
02568 VINEYARD HAVEN 1 0 0 0 0 0 0
02571 WAREHAM 4 1 1 0 0 0 0
02573 WEST CHOP 0 0 0 0 0 0 0
02574 WEST FALMOUTH 0 0 0 0 0 0 0
02575 WEST TISBURY 0 0 0 0 0 0 0
02576 WEST WAREHAM 0 0 0 0 0 0 0
02584 NANTUCKET 0 0 0 0 0 0 0
02601 HYANNIS 0 0 0 0 0 0 0
02630 BARNSTABLE 0 0 0 0 0 0 0
02631 BREWSTER 1 0 0 0 0 0 0
02632 CENTERVILLE 0 0 0 0 0 0 0
02633 CHATHAM 2 1 0 0 0 0 0
02634 CENTERVILLE 0 0 0 0 0 0 0
02635 COTUIT 1 0 0 0 0 0 0
02636 CENTERVILLE 0 0 0 0 0 0 0
02637 CUMMAQUID 0 0 0 0 0 0 0
02638 DENNIS 0 0 0 0 0 0 0
02639 DENNISPORT 1 0 0 0 0 0 0
02641 EAST DENNIS 2 1 0 0 0 0 0
02642 EASTHAM 1 0 0 0 0 0 0
02643 EAST ORLEANS 0 0 0 0 0 0 0
02644 FORESTDALE 0 0 0 0 0 0 0
02645 HARWICH 1 0 0 0 0 0 0
02646 HARWICHPORT 2 1 0 0 0 0 0
02647 HYANNISPORT 0 0 0 0 0 0 0
02648 MARSTONS MILLS 1 0 0 0 0 0 0
02649 MASHPEE 1 0 0 0 0 0 0
02650 NORTH CHATHAM 0 0 0 0 0 0 0
02651 NORTH EASTHAM 0 0 0 0 0 0 0
02652 NORTH TRURO 0 0 0 0 0 0 0
02653 ORLEANS 1 0 0 0 0 0 0
02655 OSTERVILLE 7 1 0 0 0 0 0
02657 PROVINCETOWN 0 1 0 0 0 0 0
02659 SOUTH CHATHAM 0 0 0 0 0 0 0
02660 SOUTH DENNIS 0 0 0 0 0 0 0
02661 SOUTH HARWICH 0 0 0 0 0 0 0
02662 SOUTH ORLEANS 0 1 0 0 1 0 0
02663 SOUTH WELLFLEET 0 0 0 0 0 0 0
02664 SOUTH YARMOUTH 1 0 0 0 0 0 0
02666 TRURO 0 1 0 0 1 0 0
02667 WELLFLEET 0 0 0 0 0 0 0
02668 WEST BARNSTABLE 0 0 0 0 0 0 0
02669 WEST CHATHAM 0 0 0 0 0 0 0
02670 WEST DENNIS 2 0 0 0 0 0 0
02671 WEST HARWICH 0 0 0 0 0 0 0
02672 WEST HYANNISPORT 0 0 0 0 0 0 0
02673 WEST YARMOUTH 0 0 0 0 0 0 0
02675 YARMOUTHPORT 0 0 0 0 0 0 0
02713 CUTTYHUNK 0 0 0 0 0 0 0
02714 DARTMOUTH 0 0 0 0 0 0 0
02719 FAIRHAVEN 3 0 0 0 0 0 0
02720 FALL RIVER 0 0 0 0 0 0 0
02721 FALL RIVER 0 0 0 0 0 0 0
02722 FALL RIVER 0 0 0 0 0 0 0
02723 FALL RIVER 0 0 0 0 0 0 0
02724 FALL RIVER 0 0 0 0 0 0 0
02725 SOMERSET 0 1 0 1 0 0 0
130
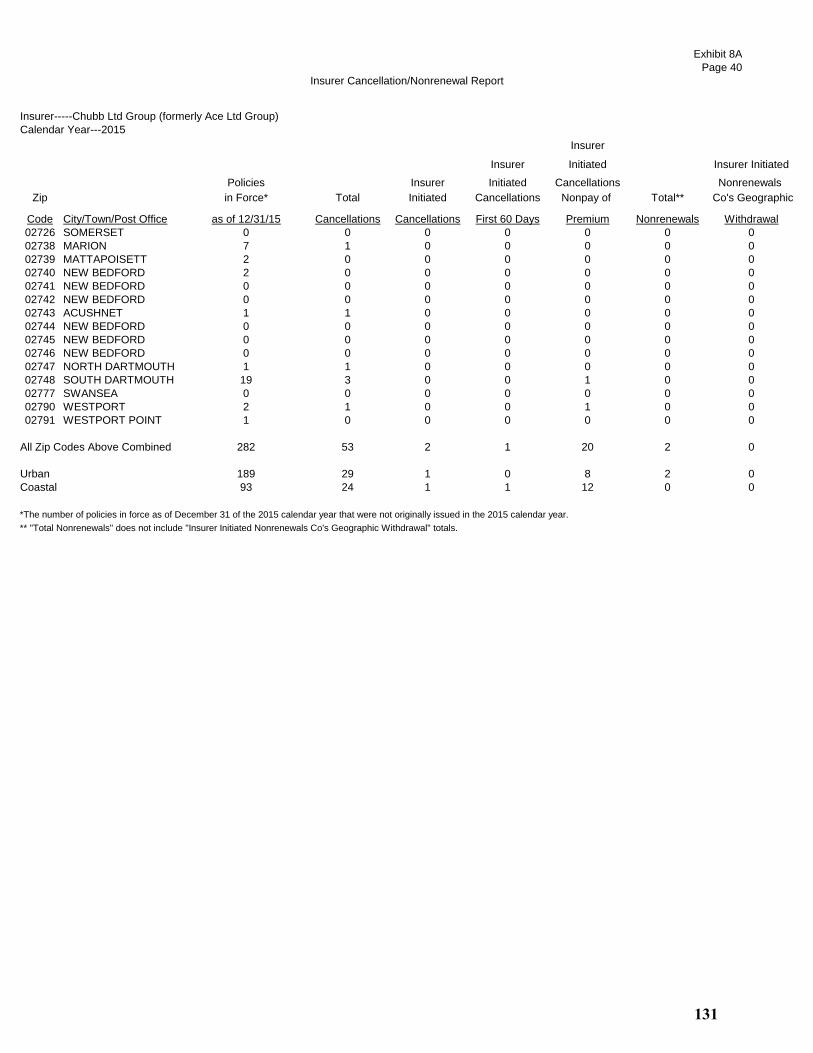
Insurer Cancellation/Nonrenewal Report
Exhibit 8A
Page 40
Insurer-----Chubb Ltd Group (formerly Ace Ltd Group)
Calendar Year---2015
Insurer
Insurer Initiated Insurer Initiated
Policies Insurer Initiated Cancellations Nonrenewals
Zip in Force* Total Initiated Cancellations Nonpay of Total** Co's Geographic
Code City/Town/Post Office as of 12/31/15 Cancellations Cancellations First 60 Days Premium Nonrenewals Withdrawal
02726 SOMERSET 0 0 0 0 0 0 0
02738 MARION 7 1 0 0 0 0 0
02739 MATTAPOISETT 2 0 0 0 0 0 0
02740 NEW BEDFORD 2 0 0 0 0 0 0
02741 NEW BEDFORD 0 0 0 0 0 0 0
02742 NEW BEDFORD 0 0 0 0 0 0 0
02743 ACUSHNET 1 1 0 0 0 0 0
02744 NEW BEDFORD 0 0 0 0 0 0 0
02745 NEW BEDFORD 0 0 0 0 0 0 0
02746 NEW BEDFORD 0 0 0 0 0 0 0
02747 NORTH DARTMOUTH 1 1 0 0 0 0 0
02748 SOUTH DARTMOUTH 19 3 0 0 1 0 0
02777 SWANSEA 0 0 0 0 0 0 0
02790 WESTPORT 2 1 0 0 1 0 0
02791 WESTPORT POINT 1 0 0 0 0 0 0
All Zip Codes Above Combined 282 53 2 1 20 2 0
Urban 189 29 1 0 8 2 0
Coastal 93 24 1 1 12 0 0
*The number of policies in force as of December 31 of the 2015 calendar year that were not originally issued in the 2015 calendar year.
** "Total Nonrenewals" does not include "Insurer Initiated Nonrenewals Co's Geographic Withdrawal" totals.
131
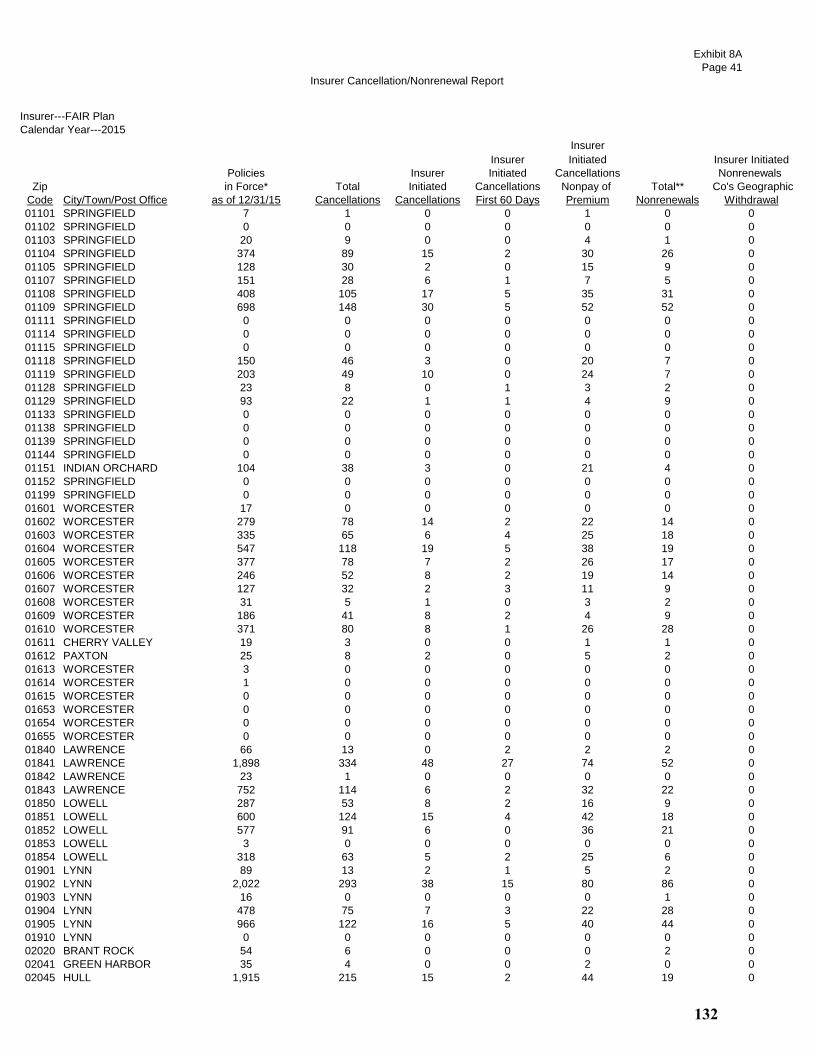
Insurer Cancellation/Nonrenewal Report
Exhibit 8A
Page 41
Insurer---FAIR Plan
Calendar Year---2015
Insurer
Insurer Initiated Insurer Initiated
Policies Insurer Initiated Cancellations Nonrenewals
Zip in Force* Total Initiated Cancellations Nonpay of Total** Co's Geographic
Code City/Town/Post Office as of 12/31/15 Cancellations Cancellations First 60 Days Premium Nonrenewals Withdrawal
01101 SPRINGFIELD 7 1 0 0 1 0 0
01102 SPRINGFIELD 0 0 0 0 0 0 0
01103 SPRINGFIELD 20 9 0 0 4 1 0
01104 SPRINGFIELD 374 89 15 2 30 26 0
01105 SPRINGFIELD 128 30 2 0 15 9 0
01107 SPRINGFIELD 151 28 6 1 7 5 0
01108 SPRINGFIELD 408 105 17 5 35 31 0
01109 SPRINGFIELD 698 148 30 5 52 52 0
01111 SPRINGFIELD 0 0 0 0 0 0 0
01114 SPRINGFIELD 0 0 0 0 0 0 0
01115 SPRINGFIELD 0 0 0 0 0 0 0
01118 SPRINGFIELD 150 46 3 0 20 7 0
01119 SPRINGFIELD 203 49 10 0 24 7 0
01128 SPRINGFIELD 23 8 0 1 3 2 0
01129 SPRINGFIELD 93 22 1 1 4 9 0
01133 SPRINGFIELD 0 0 0 0 0 0 0
01138 SPRINGFIELD 0 0 0 0 0 0 0
01139 SPRINGFIELD 0 0 0 0 0 0 0
01144 SPRINGFIELD 0 0 0 0 0 0 0
01151 INDIAN ORCHARD 104 38 3 0 21 4 0
01152 SPRINGFIELD 0 0 0 0 0 0 0
01199 SPRINGFIELD 0 0 0 0 0 0 0
01601 WORCESTER 17 0 0 0 0 0 0
01602 WORCESTER 279 78 14 2 22 14 0
01603 WORCESTER 335 65 6 4 25 18 0
01604 WORCESTER 547 118 19 5 38 19 0
01605 WORCESTER 377 78 7 2 26 17 0
01606 WORCESTER 246 52 8 2 19 14 0
01607 WORCESTER 127 32 2 3 11 9 0
01608 WORCESTER 31 5 1 0 3 2 0
01609 WORCESTER 186 41 8 2 4 9 0
01610 WORCESTER 371 80 8 1 26 28 0
01611 CHERRY VALLEY 19 3 0 0 1 1 0
01612 PAXTON 25 8 2 0 5 2 0
01613 WORCESTER 3 0 0 0 0 0 0
01614 WORCESTER 1 0 0 0 0 0 0
01615 WORCESTER 0 0 0 0 0 0 0
01653 WORCESTER 0 0 0 0 0 0 0
01654 WORCESTER 0 0 0 0 0 0 0
01655 WORCESTER 0 0 0 0 0 0 0
01840 LAWRENCE 66 13 0 2 2 2 0
01841 LAWRENCE 1,898 334 48 27 74 52 0
01842 LAWRENCE 23 1 0 0 0 0 0
01843 LAWRENCE 752 114 6 2 32 22 0
01850 LOWELL 287 53 8 2 16 9 0
01851 LOWELL 600 124 15 4 42 18 0
01852 LOWELL 577 91 6 0 36 21 0
01853 LOWELL 3 0 0 0 0 0 0
01854 LOWELL 318 63 5 2 25 6 0
01901 LYNN 89 13 2 1 5 2 0
01902 LYNN 2,022 293 38 15 80 86 0
01903 LYNN 16 0 0 0 0 1 0
01904 LYNN 478 75 7 3 22 28 0
01905 LYNN 966 122 16 5 40 44 0
01910 LYNN 0 0 0 0 0 0 0
02020 BRANT ROCK 54 6 0 0 0 2 0
02041 GREEN HARBOR 35 4 0 0 2 0 0
02045 HULL 1,915 215 15 2 44 19 0
132

Insurer Cancellation/Nonrenewal Report
Exhibit 8A
Page 42
Insurer---FAIR Plan
Calendar Year---2015
Insurer
Insurer Initiated Insurer Initiated
Policies Insurer Initiated Cancellations Nonrenewals
Zip in Force* Total Initiated Cancellations Nonpay of Total** Co's Geographic
Code City/Town/Post Office as of 12/31/15 Cancellations Cancellations First 60 Days Premium Nonrenewals Withdrawal
02047 HUMAROCK 242 21 2 1 5 3 0
02055 MINOT 0 0 0 0 0 0 0
02065 OCEAN BLUFF 32 1 0 0 0 0 0
02101 BOSTON 1 0 0 0 0 0 0
02102 BOSTON 0 0 0 0 0 0 0
02103 BOSTON 0 0 0 0 0 0 0
02104 BOSTON 0 0 0 0 0 0 0
02105 BOSTON 0 0 0 0 0 0 0
02106 BOSTON 0 0 0 0 0 0 0
02107 BOSTON 0 0 0 0 0 0 0
02108 BOSTON 41 9 1 0 1 0 0
02109 BOSTON 70 16 0 1 8 0 0
02110 BOSTON 54 12 1 0 3 1 0
02111 BOSTON 68 21 0 0 7 0 0
02112 BOSTON 0 0 0 0 0 0 0
02113 BOSTON 121 24 0 1 4 1 0
02114 BOSTON 156 23 1 0 6 0 0
02115 BOSTON 227 27 0 0 13 0 0
02116 BOSTON 202 44 2 0 13 1 0
02117 BOSTON 0 0 0 0 0 0 0
02118 BOSTON 222 53 4 0 15 1 0
02119 BOSTON 1,010 149 23 8 59 18 0
02120 BOSTON 209 36 1 0 6 1 0
02121 BOSTON 951 129 13 4 61 41 0
02122 BOSTON 1,097 188 18 7 50 54 0
02123 BOSTON 1 0 0 0 0 0 0
02124 BOSTON 2,653 383 60 15 122 90 0
02125 BOSTON 1,542 204 25 10 67 27 0
02126 MATTAPAN 1,516 155 16 12 56 50 0
02127 BOSTON 1,246 241 8 9 71 13 0
02128 BOSTON 2,163 269 11 6 69 37 0
02129 CHARLESTOWN 275 41 0 0 14 3 0
02130 JAMAICA PLAIN 795 109 2 1 39 14 0
02131 ROSLINDALE 744 118 22 8 29 21 0
02132 WEST ROXBURY 349 56 4 3 20 1 0
02133 BOSTON 0 0 0 0 0 0 0
02134 ALLSTON 257 64 3 0 24 11 0
02135 BRIGHTON 578 104 8 6 31 11 0
02136 HYDE PARK 1,320 137 20 11 44 45 0
02137 READVILLE 3 0 0 0 0 0 0
02138 CAMBRIDGE 218 38 1 3 13 2 0
02139 CAMBRIDGE 452 67 5 0 23 2 0
02140 CAMBRIDGE 165 24 1 0 7 3 0
02141 CAMBRIDGE 253 24 1 0 9 3 0
02142 CAMBRIDGE 11 4 0 0 1 0 0
02143 SOMERVILLE 434 67 8 2 18 10 0
02144 SOMERVILLE 259 63 2 2 16 5 0
02145 SOMERVILLE 454 65 7 2 18 7 0
02150 CHELSEA 1,222 152 21 1 46 52 0
02151 REVERE 2,354 313 26 8 87 72 0
02152 WINTHROP 1,039 154 11 5 39 23 0
02163 BOSTON 0 0 0 0 0 0 0
02196 BOSTON 0 0 0 0 0 0 0
02199 BOSTON 19 3 0 0 1 0 0
02201 BOSTON 0 0 0 0 0 0 0
02202 BOSTON 0 1 0 0 1 0 0
02203 BOSTON 0 0 0 0 0 0 0
02204 BOSTON 0 0 0 0 0 0 0
133
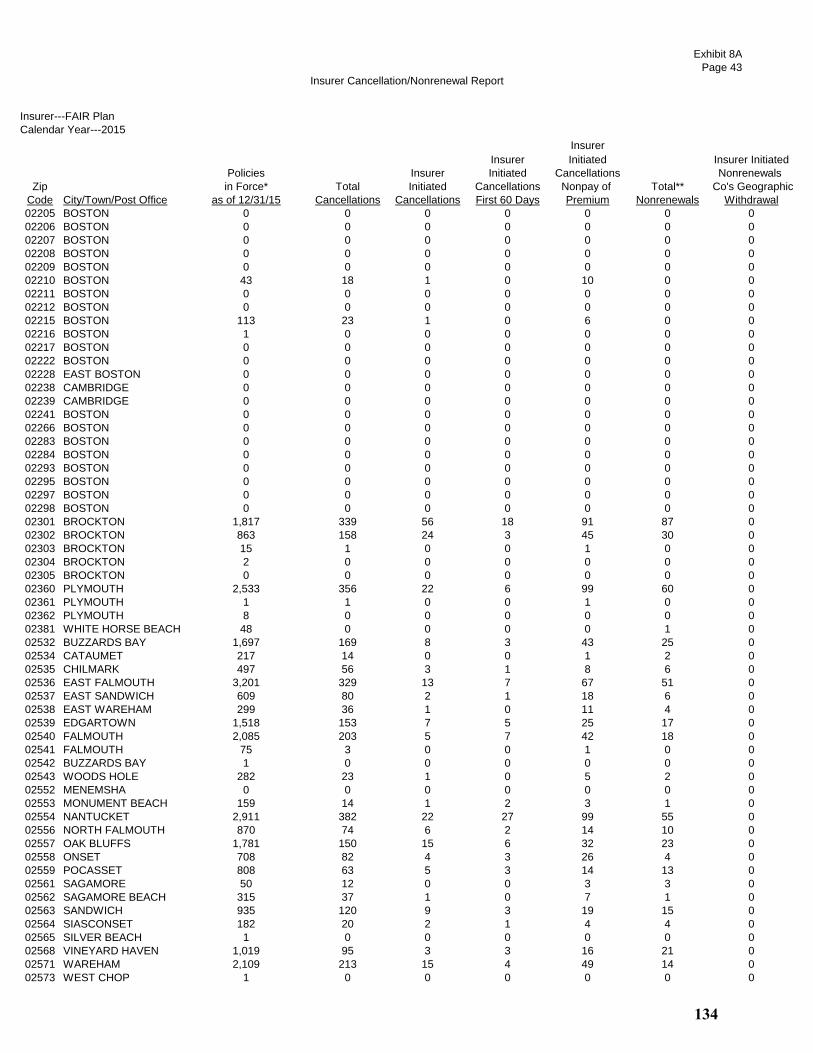
Insurer Cancellation/Nonrenewal Report
Exhibit 8A
Page 43
Insurer---FAIR Plan
Calendar Year---2015
Insurer
Insurer Initiated Insurer Initiated
Policies Insurer Initiated Cancellations Nonrenewals
Zip in Force* Total Initiated Cancellations Nonpay of Total** Co's Geographic
Code City/Town/Post Office as of 12/31/15 Cancellations Cancellations First 60 Days Premium Nonrenewals Withdrawal
02205 BOSTON 0 0 0 0 0 0 0
02206 BOSTON 0 0 0 0 0 0 0
02207 BOSTON 0 0 0 0 0 0 0
02208 BOSTON 0 0 0 0 0 0 0
02209 BOSTON 0 0 0 0 0 0 0
02210 BOSTON 43 18 1 0 10 0 0
02211 BOSTON 0 0 0 0 0 0 0
02212 BOSTON 0 0 0 0 0 0 0
02215 BOSTON 113 23 1 0 6 0 0
02216 BOSTON 1 0 0 0 0 0 0
02217 BOSTON 0 0 0 0 0 0 0
02222 BOSTON 0 0 0 0 0 0 0
02228 EAST BOSTON 0 0 0 0 0 0 0
02238 CAMBRIDGE 0 0 0 0 0 0 0
02239 CAMBRIDGE 0 0 0 0 0 0 0
02241 BOSTON 0 0 0 0 0 0 0
02266 BOSTON 0 0 0 0 0 0 0
02283 BOSTON 0 0 0 0 0 0 0
02284 BOSTON 0 0 0 0 0 0 0
02293 BOSTON 0 0 0 0 0 0 0
02295 BOSTON 0 0 0 0 0 0 0
02297 BOSTON 0 0 0 0 0 0 0
02298 BOSTON 0 0 0 0 0 0 0
02301 BROCKTON 1,817 339 56 18 91 87 0
02302 BROCKTON 863 158 24 3 45 30 0
02303 BROCKTON 15 1 0 0 1 0 0
02304 BROCKTON 2 0 0 0 0 0 0
02305 BROCKTON 0 0 0 0 0 0 0
02360 PLYMOUTH 2,533 356 22 6 99 60 0
02361 PLYMOUTH 1 1 0 0 1 0 0
02362 PLYMOUTH 8 0 0 0 0 0 0
02381 WHITE HORSE BEACH 48 0 0 0 0 1 0
02532 BUZZARDS BAY 1,697 169 8 3 43 25 0
02534 CATAUMET 217 14 0 0 1 2 0
02535 CHILMARK 497 56 3 1 8 6 0
02536 EAST FALMOUTH 3,201 329 13 7 67 51 0
02537 EAST SANDWICH 609 80 2 1 18 6 0
02538 EAST WAREHAM 299 36 1 0 11 4 0
02539 EDGARTOWN 1,518 153 7 5 25 17 0
02540 FALMOUTH 2,085 203 5 7 42 18 0
02541 FALMOUTH 75 3 0 0 1 0 0
02542 BUZZARDS BAY 1 0 0 0 0 0 0
02543 WOODS HOLE 282 23 1 0 5 2 0
02552 MENEMSHA 0 0 0 0 0 0 0
02553 MONUMENT BEACH 159 14 1 2 3 1 0
02554 NANTUCKET 2,911 382 22 27 99 55 0
02556 NORTH FALMOUTH 870 74 6 2 14 10 0
02557 OAK BLUFFS 1,781 150 15 6 32 23 0
02558 ONSET 708 82 4 3 26 4 0
02559 POCASSET 808 63 5 3 14 13 0
02561 SAGAMORE 50 12 0 0 3 3 0
02562 SAGAMORE BEACH 315 37 1 0 7 1 0
02563 SANDWICH 935 120 9 3 19 15 0
02564 SIASCONSET 182 20 2 1 4 4 0
02565 SILVER BEACH 1 0 0 0 0 0 0
02568 VINEYARD HAVEN 1,019 95 3 3 16 21 0
02571 WAREHAM 2,109 213 15 4 49 14 0
02573 WEST CHOP 1 0 0 0 0 0 0
134
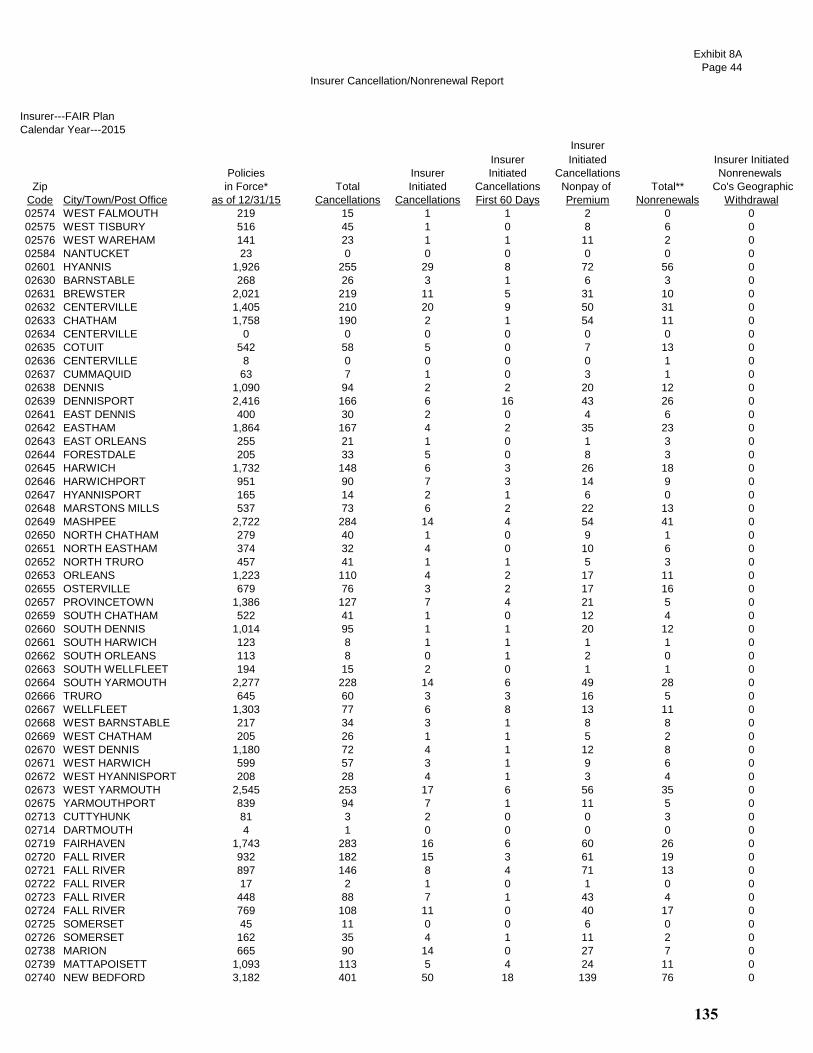
Insurer Cancellation/Nonrenewal Report
Exhibit 8A
Page 44
Insurer---FAIR Plan
Calendar Year---2015
Insurer
Insurer Initiated Insurer Initiated
Policies Insurer Initiated Cancellations Nonrenewals
Zip in Force* Total Initiated Cancellations Nonpay of Total** Co's Geographic
Code City/Town/Post Office as of 12/31/15 Cancellations Cancellations First 60 Days Premium Nonrenewals Withdrawal
02574 WEST FALMOUTH 219 15 1 1 2 0 0
02575 WEST TISBURY 516 45 1 0 8 6 0
02576 WEST WAREHAM 141 23 1 1 11 2 0
02584 NANTUCKET 23 0 0 0 0 0 0
02601 HYANNIS 1,926 255 29 8 72 56 0
02630 BARNSTABLE 268 26 3 1 6 3 0
02631 BREWSTER 2,021 219 11 5 31 10 0
02632 CENTERVILLE 1,405 210 20 9 50 31 0
02633 CHATHAM 1,758 190 2 1 54 11 0
02634 CENTERVILLE 0 0 0 0 0 0 0
02635 COTUIT 542 58 5 0 7 13 0
02636 CENTERVILLE 8 0 0 0 0 1 0
02637 CUMMAQUID 63 7 1 0 3 1 0
02638 DENNIS 1,090 94 2 2 20 12 0
02639 DENNISPORT 2,416 166 6 16 43 26 0
02641 EAST DENNIS 400 30 2 0 4 6 0
02642 EASTHAM 1,864 167 4 2 35 23 0
02643 EAST ORLEANS 255 21 1 0 1 3 0
02644 FORESTDALE 205 33 5 0 8 3 0
02645 HARWICH 1,732 148 6 3 26 18 0
02646 HARWICHPORT 951 90 7 3 14 9 0
02647 HYANNISPORT 165 14 2 1 6 0 0
02648 MARSTONS MILLS 537 73 6 2 22 13 0
02649 MASHPEE 2,722 284 14 4 54 41 0
02650 NORTH CHATHAM 279 40 1 0 9 1 0
02651 NORTH EASTHAM 374 32 4 0 10 6 0
02652 NORTH TRURO 457 41 1 1 5 3 0
02653 ORLEANS 1,223 110 4 2 17 11 0
02655 OSTERVILLE 679 76 3 2 17 16 0
02657 PROVINCETOWN 1,386 127 7 4 21 5 0
02659 SOUTH CHATHAM 522 41 1 0 12 4 0
02660 SOUTH DENNIS 1,014 95 1 1 20 12 0
02661 SOUTH HARWICH 123 8 1 1 1 1 0
02662 SOUTH ORLEANS 113 8 0 1 2 0 0
02663 SOUTH WELLFLEET 194 15 2 0 1 1 0
02664 SOUTH YARMOUTH 2,277 228 14 6 49 28 0
02666 TRURO 645 60 3 3 16 5 0
02667 WELLFLEET 1,303 77 6 8 13 11 0
02668 WEST BARNSTABLE 217 34 3 1 8 8 0
02669 WEST CHATHAM 205 26 1 1 5 2 0
02670 WEST DENNIS 1,180 72 4 1 12 8 0
02671 WEST HARWICH 599 57 3 1 9 6 0
02672 WEST HYANNISPORT 208 28 4 1 3 4 0
02673 WEST YARMOUTH 2,545 253 17 6 56 35 0
02675 YARMOUTHPORT 839 94 7 1 11 5 0
02713 CUTTYHUNK 81 3 2 0 0 3 0
02714 DARTMOUTH 4 1 0 0 0 0 0
02719 FAIRHAVEN 1,743 283 16 6 60 26 0
02720 FALL RIVER 932 182 15 3 61 19 0
02721 FALL RIVER 897 146 8 4 71 13 0
02722 FALL RIVER 17 2 1 0 1 0 0
02723 FALL RIVER 448 88 7 1 43 4 0
02724 FALL RIVER 769 108 11 0 40 17 0
02725 SOMERSET 45 11 0 0 6 0 0
02726 SOMERSET 162 35 4 1 11 2 0
02738 MARION 665 90 14 0 27 7 0
02739 MATTAPOISETT 1,093 113 5 4 24 11 0
02740 NEW BEDFORD 3,182 401 50 18 139 76 0
135
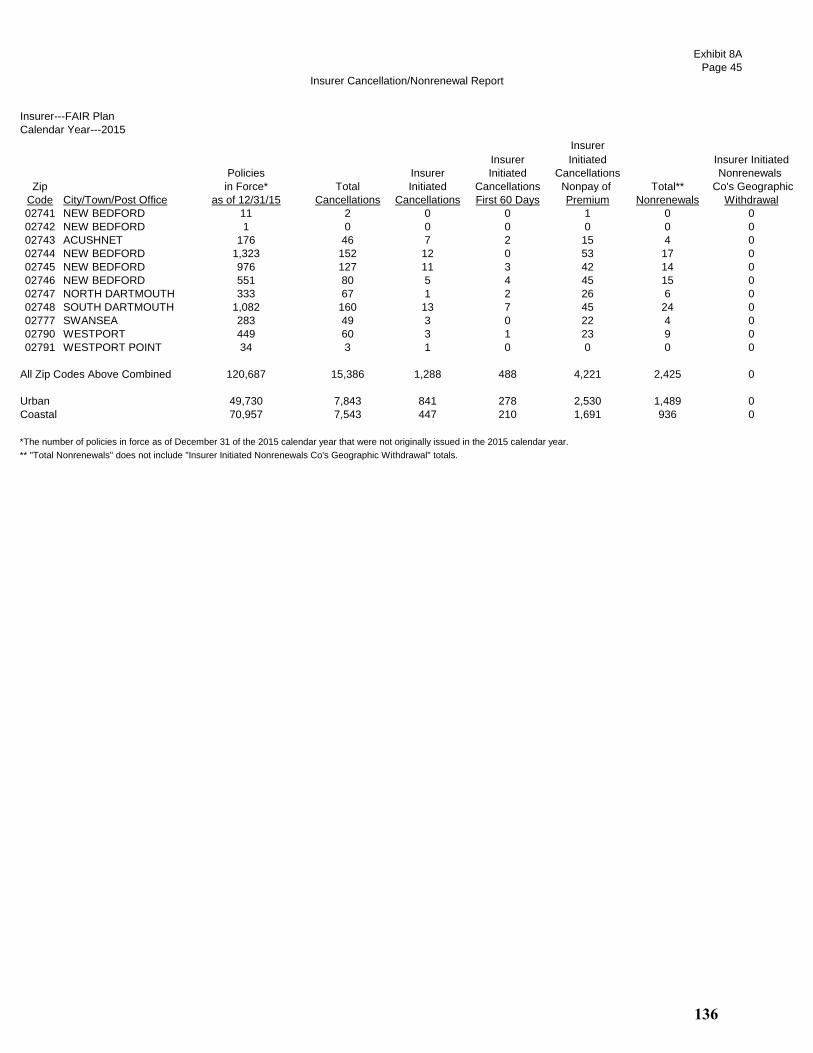
Insurer Cancellation/Nonrenewal Report
Exhibit 8A
Page 45
Insurer---FAIR Plan
Calendar Year---2015
Insurer
Insurer Initiated Insurer Initiated
Policies Insurer Initiated Cancellations Nonrenewals
Zip in Force* Total Initiated Cancellations Nonpay of Total** Co's Geographic
Code City/Town/Post Office as of 12/31/15 Cancellations Cancellations First 60 Days Premium Nonrenewals Withdrawal
02741 NEW BEDFORD 11 2 0 0 1 0 0
02742 NEW BEDFORD 1 0 0 0 0 0 0
02743 ACUSHNET 176 46 7 2 15 4 0
02744 NEW BEDFORD 1,323 152 12 0 53 17 0
02745 NEW BEDFORD 976 127 11 3 42 14 0
02746 NEW BEDFORD 551 80 5 4 45 15 0
02747 NORTH DARTMOUTH 333 67 1 2 26 6 0
02748 SOUTH DARTMOUTH 1,082 160 13 7 45 24 0
02777 SWANSEA 283 49 3 0 22 4 0
02790 WESTPORT 449 60 3 1 23 9 0
02791 WESTPORT POINT 34 3 1 0 0 0 0
All Zip Codes Above Combined 120,687 15,386 1,288 488 4,221 2,425 0
Urban 49,730 7,843 841 278 2,530 1,489 0
Coastal 70,957 7,543 447 210 1,691 936 0
*The number of policies in force as of December 31 of the 2015 calendar year that were not originally issued in the 2015 calendar year.
** "Total Nonrenewals" does not include "Insurer Initiated Nonrenewals Co's Geographic Withdrawal" totals.
136

Insurer Cancellation/Nonrenewal Report
Exhibit 8A
Page 46
Insurer-----The Hanover Insurance Group
Calendar Year---2015
Insurer
Insurer Initiated Insurer Initiated
Policies Insurer Initiated Cancellations Nonrenewals
Zip in Force* Total Initiated Cancellations Nonpay of Total** Co's Geographic
Code City/Town/Post Office as of 12/31/15 Cancellations Cancellations First 60 Days Premium Nonrenewals Withdrawal
01101 SPRINGFIELD 3 1 0 0 0 0 0
01102 SPRINGFIELD 0 0 0 0 0 0 0
01103 SPRINGFIELD 13 2 0 0 1 0 0
01104 SPRINGFIELD 228 24 0 0 6 2 0
01105 SPRINGFIELD 30 3 0 0 1 0 0
01107 SPRINGFIELD 44 8 0 0 0 1 0
01108 SPRINGFIELD 224 45 0 0 6 3 0
01109 SPRINGFIELD 171 27 0 0 3 0 0
01111 SPRINGFIELD 0 0 0 0 0 0 0
01114 SPRINGFIELD 0 0 0 0 0 0 0
01115 SPRINGFIELD 1 0 0 0 0 0 0
01118 SPRINGFIELD 331 37 0 0 4 2 0
01119 SPRINGFIELD 206 32 0 0 3 2 0
01128 SPRINGFIELD 66 5 0 0 1 0 0
01129 SPRINGFIELD 166 34 0 0 3 0 0
01133 SPRINGFIELD 0 0 0 0 0 0 0
01138 SPRINGFIELD 0 0 0 0 0 0 0
01139 SPRINGFIELD 2 0 0 0 0 0 0
01144 SPRINGFIELD 0 0 0 0 0 0 0
01151 INDIAN ORCHARD 82 17 0 0 2 0 0
01152 SPRINGFIELD 0 0 0 0 0 0 0
01199 SPRINGFIELD 0 0 0 0 0 0 0
01601 WORCESTER 1 0 0 0 0 0 0
01602 WORCESTER 549 102 0 0 9 6 0
01603 WORCESTER 217 39 0 0 6 0 0
01604 WORCESTER 609 116 0 0 5 2 0
01605 WORCESTER 329 61 0 0 8 4 0
01606 WORCESTER 484 85 0 0 6 3 0
01607 WORCESTER 115 21 0 0 1 0 0
01608 WORCESTER 19 5 0 0 1 0 0
01609 WORCESTER 330 66 0 0 5 3 0
01610 WORCESTER 93 27 0 0 5 0 0
01611 CHERRY VALLEY 41 12 0 0 1 0 0
01612 PAXTON 112 22 0 0 1 0 0
01613 WORCESTER 5 1 0 0 0 0 0
01614 WORCESTER 0 0 0 0 0 0 0
01615 WORCESTER 1 0 0 0 0 0 0
01653 WORCESTER 1 0 0 0 0 0 0
01654 WORCESTER 0 0 0 0 0 0 0
01655 WORCESTER 0 0 0 0 0 0 0
01840 LAWRENCE 5 2 0 0 0 0 0
01841 LAWRENCE 29 9 0 0 5 2 0
01842 LAWRENCE 0 0 0 0 0 0 0
01843 LAWRENCE 44 8 0 0 0 0 0
01850 LOWELL 37 6 0 0 2 0 0
01851 LOWELL 59 15 0 0 2 3 0
01852 LOWELL 125 25 0 0 6 0 0
01853 LOWELL 1 0 0 0 0 0 0
01854 LOWELL 58 14 0 0 6 0 0
01901 LYNN 2 0 0 0 0 0 0
01902 LYNN 38 8 0 0 0 0 0
01903 LYNN 0 0 0 0 0 0 0
01904 LYNN 40 11 0 0 1 0 0
01905 LYNN 21 4 0 0 0 0 0
01910 LYNN 0 0 0 0 0 0 0
02020 BRANT ROCK 1 0 0 0 0 0 0
02041 GREEN HARBOR 2 0 0 0 0 0 0
137

Insurer Cancellation/Nonrenewal Report
Exhibit 8A
Page 47
Insurer-----The Hanover Insurance Group
Calendar Year---2015
Insurer
Insurer Initiated Insurer Initiated
Policies Insurer Initiated Cancellations Nonrenewals
Zip in Force* Total Initiated Cancellations Nonpay of Total** Co's Geographic
Code City/Town/Post Office as of 12/31/15 Cancellations Cancellations First 60 Days Premium Nonrenewals Withdrawal
02045 HULL 14 1 0 0 0 0 0
02047 HUMAROCK 1 0 0 0 0 0 0
02055 MINOT 0 0 0 0 0 0 0
02065 OCEAN BLUFF 0 0 0 0 0 0 0
02101 BOSTON 0 0 0 0 0 0 0
02102 BOSTON 0 0 0 0 0 0 0
02103 BOSTON 0 0 0 0 0 0 0
02104 BOSTON 0 0 0 0 0 0 0
02105 BOSTON 0 0 0 0 0 0 0
02106 BOSTON 0 0 0 0 0 0 0
02107 BOSTON 0 0 0 0 0 0 0
02108 BOSTON 49 8 0 0 1 7 0
02109 BOSTON 29 4 0 0 0 0 0
02110 BOSTON 26 2 0 0 0 4 0
02111 BOSTON 21 10 0 0 4 0 0
02112 BOSTON 1 0 0 0 0 0 0
02113 BOSTON 22 15 0 0 0 3 0
02114 BOSTON 106 26 0 0 5 24 0
02115 BOSTON 100 18 0 0 4 4 0
02116 BOSTON 196 52 0 0 12 24 0
02117 BOSTON 0 0 0 0 0 0 0
02118 BOSTON 194 48 0 0 6 23 0
02119 BOSTON 15 4 0 0 1 0 0
02120 BOSTON 17 4 0 0 0 0 0
02121 BOSTON 5 2 0 0 1 0 0
02122 BOSTON 23 3 0 0 0 0 0
02123 BOSTON 0 1 0 0 0 0 0
02124 BOSTON 38 7 0 0 1 2 0
02125 BOSTON 41 11 0 0 2 0 0
02126 MATTAPAN 10 1 0 0 0 1 0
02127 BOSTON 153 50 0 0 3 4 0
02128 BOSTON 30 8 0 0 1 1 0
02129 CHARLESTOWN 113 35 0 0 2 10 0
02130 JAMAICA PLAIN 123 31 0 0 4 16 0
02131 ROSLINDALE 61 14 0 0 5 1 0
02132 WEST ROXBURY 92 15 0 0 2 3 0
02133 BOSTON 0 0 0 0 0 0 0
02134 ALLSTON 35 13 0 0 2 1 0
02135 BRIGHTON 96 27 0 0 2 0 0
02136 HYDE PARK 24 0 0 0 0 0 0
02137 READVILLE 0 0 0 0 0 0 0
02138 CAMBRIDGE 87 19 0 0 3 3 0
02139 CAMBRIDGE 75 17 0 0 3 3 0
02140 CAMBRIDGE 58 8 0 0 2 0 0
02141 CAMBRIDGE 31 7 0 0 1 0 0
02142 CAMBRIDGE 10 2 0 0 0 0 0
02143 SOMERVILLE 44 6 0 0 0 2 0
02144 SOMERVILLE 61 22 0 0 5 0 0
02145 SOMERVILLE 34 8 0 0 1 1 0
02150 CHELSEA 24 9 0 0 0 2 0
02151 REVERE 47 7 0 0 1 1 0
02152 WINTHROP 20 7 0 0 1 0 0
02163 BOSTON 0 1 0 0 0 0 0
02196 BOSTON 0 0 0 0 0 0 0
02199 BOSTON 16 1 0 0 0 1 0
02201 BOSTON 0 0 0 0 0 0 0
02202 BOSTON 0 0 0 0 0 0 0
138
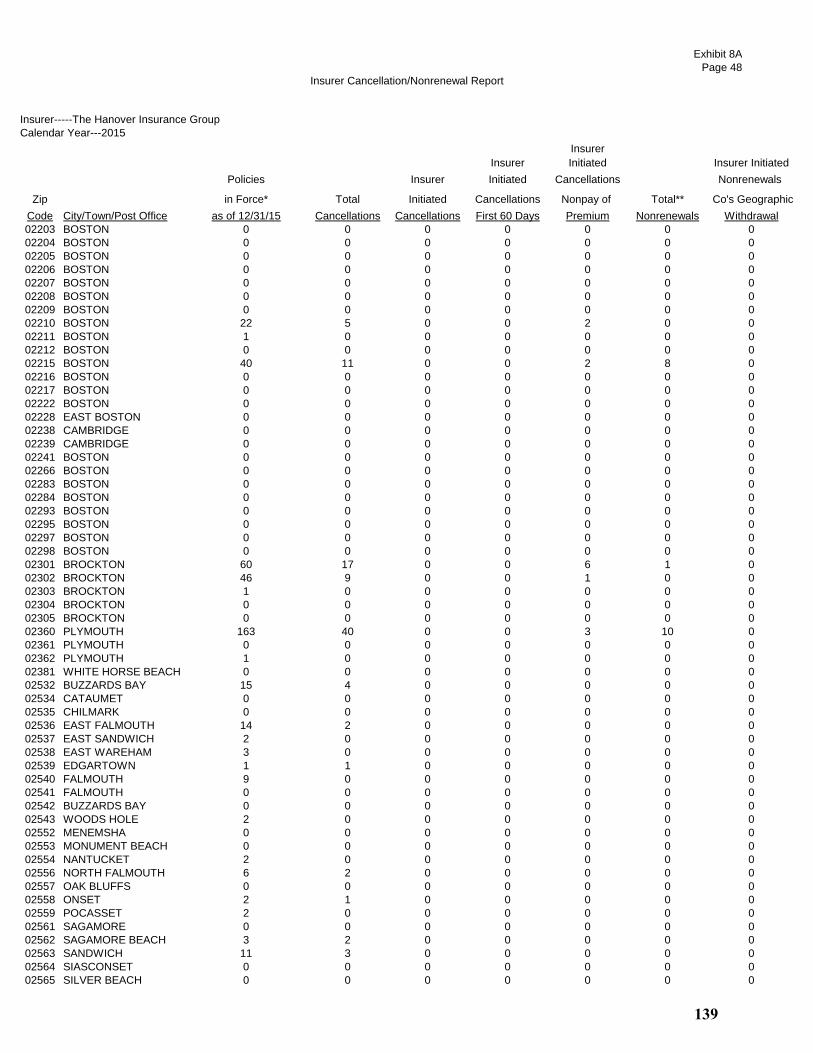
Insurer Cancellation/Nonrenewal Report
Exhibit 8A
Page 48
Insurer-----The Hanover Insurance Group
Calendar Year---2015
Insurer
Insurer Initiated Insurer Initiated
Policies Insurer Initiated Cancellations Nonrenewals
Zip in Force* Total Initiated Cancellations Nonpay of Total** Co's Geographic
Code City/Town/Post Office as of 12/31/15 Cancellations Cancellations First 60 Days Premium Nonrenewals Withdrawal
02203 BOSTON 0 0 0 0 0 0 0
02204 BOSTON 0 0 0 0 0 0 0
02205 BOSTON 0 0 0 0 0 0 0
02206 BOSTON 0 0 0 0 0 0 0
02207 BOSTON 0 0 0 0 0 0 0
02208 BOSTON 0 0 0 0 0 0 0
02209 BOSTON 0 0 0 0 0 0 0
02210 BOSTON 22 5 0 0 2 0 0
02211 BOSTON 1 0 0 0 0 0 0
02212 BOSTON 0 0 0 0 0 0 0
02215 BOSTON 40 11 0 0 2 8 0
02216 BOSTON 0 0 0 0 0 0 0
02217 BOSTON 0 0 0 0 0 0 0
02222 BOSTON 0 0 0 0 0 0 0
02228 EAST BOSTON 0 0 0 0 0 0 0
02238 CAMBRIDGE 0 0 0 0 0 0 0
02239 CAMBRIDGE 0 0 0 0 0 0 0
02241 BOSTON 0 0 0 0 0 0 0
02266 BOSTON 0 0 0 0 0 0 0
02283 BOSTON 0 0 0 0 0 0 0
02284 BOSTON 0 0 0 0 0 0 0
02293 BOSTON 0 0 0 0 0 0 0
02295 BOSTON 0 0 0 0 0 0 0
02297 BOSTON 0 0 0 0 0 0 0
02298 BOSTON 0 0 0 0 0 0 0
02301 BROCKTON 60 17 0 0 6 1 0
02302 BROCKTON 46 9 0 0 1 0 0
02303 BROCKTON 1 0 0 0 0 0 0
02304 BROCKTON 0 0 0 0 0 0 0
02305 BROCKTON 0 0 0 0 0 0 0
02360 PLYMOUTH 163 40 0 0 3 10 0
02361 PLYMOUTH 0 0 0 0 0 0 0
02362 PLYMOUTH 1 0 0 0 0 0 0
02381 WHITE HORSE BEACH 0 0 0 0 0 0 0
02532 BUZZARDS BAY 15 4 0 0 0 0 0
02534 CATAUMET 0 0 0 0 0 0 0
02535 CHILMARK 0 0 0 0 0 0 0
02536 EAST FALMOUTH 14 2 0 0 0 0 0
02537 EAST SANDWICH 2 0 0 0 0 0 0
02538 EAST WAREHAM 3 0 0 0 0 0 0
02539 EDGARTOWN 1 1 0 0 0 0 0
02540 FALMOUTH 9 0 0 0 0 0 0
02541 FALMOUTH 0 0 0 0 0 0 0
02542 BUZZARDS BAY 0 0 0 0 0 0 0
02543 WOODS HOLE 2 0 0 0 0 0 0
02552 MENEMSHA 0 0 0 0 0 0 0
02553 MONUMENT BEACH 0 0 0 0 0 0 0
02554 NANTUCKET 2 0 0 0 0 0 0
02556 NORTH FALMOUTH 6 2 0 0 0 0 0
02557 OAK BLUFFS 0 0 0 0 0 0 0
02558 ONSET 2 1 0 0 0 0 0
02559 POCASSET 2 0 0 0 0 0 0
02561 SAGAMORE 0 0 0 0 0 0 0
02562 SAGAMORE BEACH 3 2 0 0 0 0 0
02563 SANDWICH 11 3 0 0 0 0 0
02564 SIASCONSET 0 0 0 0 0 0 0
02565 SILVER BEACH 0 0 0 0 0 0 0
139

Insurer Cancellation/Nonrenewal Report
Exhibit 8A
Page 49
Insurer-----The Hanover Insurance Group
Calendar Year---2015
Insurer
Insurer Initiated Insurer Initiated
Policies Insurer Initiated Cancellations Nonrenewals
Zip in Force* Total Initiated Cancellations Nonpay of Total** Co's Geographic
Code City/Town/Post Office as of 12/31/15 Cancellations Cancellations First 60 Days Premium Nonrenewals Withdrawal
02568 VINEYARD HAVEN 0 0 0 0 0 0 0
02571 WAREHAM 12 2 0 0 0 0 0
02573 WEST CHOP 0 0 0 0 0 0 0
02574 WEST FALMOUTH 1 1 0 0 1 0 0
02575 WEST TISBURY 1 0 0 0 0 0 0
02576 WEST WAREHAM 3 5 0 0 0 0 0
02584 NANTUCKET 0 0 0 0 0 0 0
02601 HYANNIS 13 4 0 0 0 1 0
02630 BARNSTABLE 6 0 0 0 0 0 0
02631 BREWSTER 145 21 0 0 5 0 0
02632 CENTERVILLE 18 6 0 0 0 0 0
02633 CHATHAM 10 0 0 0 0 0 0
02634 CENTERVILLE 0 0 0 0 0 0 0
02635 COTUIT 4 1 0 0 0 0 0
02636 CENTERVILLE 0 0 0 0 0 0 0
02637 CUMMAQUID 0 0 0 0 0 0 0
02638 DENNIS 15 0 0 0 0 0 0
02639 DENNISPORT 10 1 0 0 0 0 0
02641 EAST DENNIS 6 0 0 0 0 0 0
02642 EASTHAM 4 0 0 0 0 0 0
02643 EAST ORLEANS 2 0 0 0 0 0 0
02644 FORESTDALE 4 0 0 0 0 0 0
02645 HARWICH 20 7 0 0 0 0 0
02646 HARWICHPORT 4 1 0 0 0 0 0
02647 HYANNISPORT 0 0 0 0 0 0 0
02648 MARSTONS MILLS 9 0 0 0 0 0 0
02649 MASHPEE 20 4 0 0 0 0 0
02650 NORTH CHATHAM 0 0 0 0 0 0 0
02651 NORTH EASTHAM 2 0 0 0 0 0 0
02652 NORTH TRURO 1 0 0 0 0 0 0
02653 ORLEANS 23 2 0 0 0 0 0
02655 OSTERVILLE 11 1 0 0 0 0 0
02657 PROVINCETOWN 11 3 0 0 1 0 0
02659 SOUTH CHATHAM 0 0 0 0 0 0 0
02660 SOUTH DENNIS 13 1 0 0 0 0 0
02661 SOUTH HARWICH 0 0 0 0 0 0 0
02662 SOUTH ORLEANS 1 0 0 0 0 0 0
02663 SOUTH WELLFLEET 0 0 0 0 0 0 0
02664 SOUTH YARMOUTH 31 9 0 0 0 0 0
02666 TRURO 2 0 0 0 0 0 0
02667 WELLFLEET 2 1 0 0 0 0 0
02668 WEST BARNSTABLE 7 0 0 0 0 0 0
02669 WEST CHATHAM 0 0 0 0 0 0 0
02670 WEST DENNIS 5 1 0 0 1 0 0
02671 WEST HARWICH 4 1 0 0 0 0 0
02672 WEST HYANNISPORT 1 0 0 0 0 0 0
02673 WEST YARMOUTH 38 13 0 0 2 0 0
02675 YARMOUTHPORT 36 5 0 0 0 0 0
02713 CUTTYHUNK 0 0 0 0 0 0 0
02714 DARTMOUTH 0 0 0 0 0 0 0
02719 FAIRHAVEN 14 2 0 0 0 0 0
02720 FALL RIVER 106 30 0 0 3 0 0
02721 FALL RIVER 36 13 0 0 3 0 0
02722 FALL RIVER 4 0 0 0 0 0 0
02723 FALL RIVER 24 6 0 0 2 0 0
02724 FALL RIVER 8 3 0 0 0 0 0
02725 SOMERSET 7 0 0 0 0 0 0
140

Insurer Cancellation/Nonrenewal Report
Exhibit 8A
Page 50
Insurer-----The Hanover Insurance Group
Calendar Year---2015
Insurer
Insurer Initiated Insurer Initiated
Policies Insurer Initiated Cancellations Nonrenewals
Zip in Force* Total Initiated Cancellations Nonpay of Total** Co's Geographic
Code City/Town/Post Office as of 12/31/15 Cancellations Cancellations First 60 Days Premium Nonrenewals Withdrawal
02726 SOMERSET 213 33 0 0 3 0 0
02738 MARION 9 2 0 0 0 0 0
02739 MATTAPOISETT 6 0 0 0 0 0 0
02740 NEW BEDFORD 30 5 0 0 1 0 0
02741 NEW BEDFORD 0 0 0 0 0 0 0
02742 NEW BEDFORD 0 1 0 0 0 0 0
02743 ACUSHNET 5 3 0 0 0 0 0
02744 NEW BEDFORD 3 0 0 0 0 0 0
02745 NEW BEDFORD 14 3 0 0 0 0 0
02746 NEW BEDFORD 3 4 0 0 0 0 0
02747 NORTH DARTMOUTH 18 6 0 0 1 0 0
02748 SOUTH DARTMOUTH 41 6 0 0 0 0 0
02777 SWANSEA 65 13 0 0 1 2 0
02790 WESTPORT 34 10 0 0 2 0 0
02791 WESTPORT POINT 0 0 0 0 0 0 0
All Zip Codes Above Combined 8,618 1,745 0 0 215 196 0
Urban 7,457 1,524 0 0 195 183 0
Coastal 1,161 221 0 0 20 13 0
*The number of policies in force as of December 31 of the 2015 calendar year that were not originally issued in the 2015 calendar year.
** "Total Nonrenewals" does not include "Insurer Initiated Nonrenewals Co's Geographic Withdrawal" totals.
141
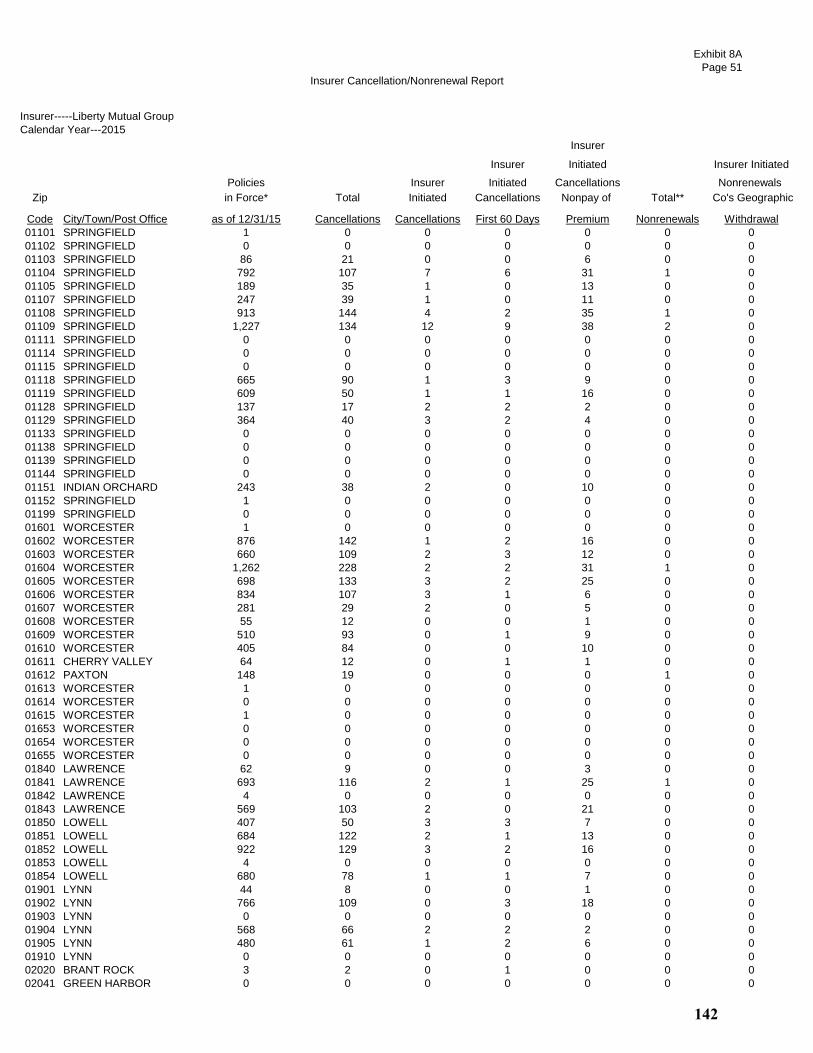
Insurer Cancellation/Nonrenewal Report
Exhibit 8A
Page 51
Insurer-----Liberty Mutual Group
Calendar Year---2015
Insurer
Insurer Initiated Insurer Initiated
Policies Insurer Initiated Cancellations Nonrenewals
Zip in Force* Total Initiated Cancellations Nonpay of Total** Co's Geographic
Code City/Town/Post Office as of 12/31/15 Cancellations Cancellations First 60 Days Premium Nonrenewals Withdrawal
01101 SPRINGFIELD 1 0 0 0 0 0 0
01102 SPRINGFIELD 0 0 0 0 0 0 0
01103 SPRINGFIELD 86 21 0 0 6 0 0
01104 SPRINGFIELD 792 107 7 6 31 1 0
01105 SPRINGFIELD 189 35 1 0 13 0 0
01107 SPRINGFIELD 247 39 1 0 11 0 0
01108 SPRINGFIELD 913 144 4 2 35 1 0
01109 SPRINGFIELD 1,227 134 12 9 38 2 0
01111 SPRINGFIELD 0 0 0 0 0 0 0
01114 SPRINGFIELD 0 0 0 0 0 0 0
01115 SPRINGFIELD 0 0 0 0 0 0 0
01118 SPRINGFIELD 665 90 1 3 9 0 0
01119 SPRINGFIELD 609 50 1 1 16 0 0
01128 SPRINGFIELD 137 17 2 2 2 0 0
01129 SPRINGFIELD 364 40 3 2 4 0 0
01133 SPRINGFIELD 0 0 0 0 0 0 0
01138 SPRINGFIELD 0 0 0 0 0 0 0
01139 SPRINGFIELD 0 0 0 0 0 0 0
01144 SPRINGFIELD 0 0 0 0 0 0 0
01151 INDIAN ORCHARD 243 38 2 0 10 0 0
01152 SPRINGFIELD 1 0 0 0 0 0 0
01199 SPRINGFIELD 0 0 0 0 0 0 0
01601 WORCESTER 1 0 0 0 0 0 0
01602 WORCESTER 876 142 1 2 16 0 0
01603 WORCESTER 660 109 2 3 12 0 0
01604 WORCESTER 1,262 228 2 2 31 1 0
01605 WORCESTER 698 133 3 2 25 0 0
01606 WORCESTER 834 107 3 1 6 0 0
01607 WORCESTER 281 29 2 0 5 0 0
01608 WORCESTER 55 12 0 0 1 0 0
01609 WORCESTER 510 93 0 1 9 0 0
01610 WORCESTER 405 84 0 0 10 0 0
01611 CHERRY VALLEY 64 12 0 1 1 0 0
01612 PAXTON 148 19 0 0 0 1 0
01613 WORCESTER 1 0 0 0 0 0 0
01614 WORCESTER 0 0 0 0 0 0 0
01615 WORCESTER 1 0 0 0 0 0 0
01653 WORCESTER 0 0 0 0 0 0 0
01654 WORCESTER 0 0 0 0 0 0 0
01655 WORCESTER 0 0 0 0 0 0 0
01840 LAWRENCE 62 9 0 0 3 0 0
01841 LAWRENCE 693 116 2 1 25 1 0
01842 LAWRENCE 4 0 0 0 0 0 0
01843 LAWRENCE 569 103 2 0 21 0 0
01850 LOWELL 407 50 3 3 7 0 0
01851 LOWELL 684 122 2 1 13 0 0
01852 LOWELL 922 129 3 2 16 0 0
01853 LOWELL 4 0 0 0 0 0 0
01854 LOWELL 680 78 1 1 7 0 0
01901 LYNN 44 8 0 0 1 0 0
01902 LYNN 766 109 0 3 18 0 0
01903 LYNN 0 0 0 0 0 0 0
01904 LYNN 568 66 2 2 2 0 0
01905 LYNN 480 61 1 2 6 0 0
01910 LYNN 0 0 0 0 0 0 0
02020 BRANT ROCK 3 2 0 1 0 0 0
02041 GREEN HARBOR 0 0 0 0 0 0 0
142

Insurer Cancellation/Nonrenewal Report
Exhibit 8A
Page 52
Insurer-----Liberty Mutual Group
Calendar Year---2015
Insurer
Insurer Initiated Insurer Initiated
Policies Insurer Initiated Cancellations Nonrenewals
Zip in Force* Total Initiated Cancellations Nonpay of Total** Co's Geographic
Code City/Town/Post Office as of 12/31/15 Cancellations Cancellations First 60 Days Premium Nonrenewals Withdrawal
02045 HULL 284 48 0 0 4 0 0
02047 HUMAROCK 20 2 0 0 0 0 0
02055 MINOT 1 0 0 0 0 0 0
02065 OCEAN BLUFF 0 0 0 0 0 0 0
02101 BOSTON 0 0 0 0 0 0 0
02102 BOSTON 0 0 0 0 0 0 0
02103 BOSTON 0 0 0 0 0 0 0
02104 BOSTON 0 0 0 0 0 0 0
02105 BOSTON 0 0 0 0 0 0 0
02106 BOSTON 0 0 0 0 0 0 0
02107 BOSTON 0 0 0 0 0 0 0
02108 BOSTON 145 28 0 0 3 0 0
02109 BOSTON 224 53 0 0 4 0 0
02110 BOSTON 120 14 0 0 1 0 0
02111 BOSTON 266 52 0 0 7 0 0
02112 BOSTON 0 0 0 0 0 0 0
02113 BOSTON 374 66 1 0 8 0 0
02114 BOSTON 561 119 0 0 4 0 0
02115 BOSTON 643 106 0 0 8 0 0
02116 BOSTON 1,048 190 0 0 11 0 0
02117 BOSTON 1 0 0 0 0 0 0
02118 BOSTON 1,050 210 1 0 14 1 0
02119 BOSTON 415 59 0 0 14 1 0
02120 BOSTON 183 28 0 0 6 0 0
02121 BOSTON 270 49 1 1 15 0 0
02122 BOSTON 411 67 0 0 17 0 0
02123 BOSTON 0 0 0 0 0 0 0
02124 BOSTON 1,000 130 1 1 32 0 0
02125 BOSTON 703 113 1 0 16 0 0
02126 MATTAPAN 523 44 1 0 14 0 0
02127 BOSTON 1,845 400 0 1 27 0 0
02128 BOSTON 682 111 0 0 17 0 0
02129 CHARLESTOWN 906 178 0 0 15 0 0
02130 JAMAICA PLAIN 1,401 214 1 0 14 0 0
02131 ROSLINDALE 876 121 2 1 10 1 0
02132 WEST ROXBURY 1,012 136 0 0 12 2 0
02133 BOSTON 0 0 0 0 0 0 0
02134 ALLSTON 596 146 0 0 10 0 0
02135 BRIGHTON 1,577 337 0 0 28 0 0
02136 HYDE PARK 756 85 0 1 13 0 0
02137 READVILLE 3 0 0 0 0 0 0
02138 CAMBRIDGE 988 189 2 1 12 0 0
02139 CAMBRIDGE 1,351 254 1 0 23 1 0
02140 CAMBRIDGE 743 121 0 0 17 0 0
02141 CAMBRIDGE 683 103 1 0 8 0 0
02142 CAMBRIDGE 98 31 0 0 1 0 0
02143 SOMERVILLE 1,129 212 1 0 17 1 0
02144 SOMERVILLE 1,244 244 1 0 16 0 0
02145 SOMERVILLE 804 143 1 0 16 1 0
02150 CHELSEA 510 103 0 0 17 0 0
02151 REVERE 955 166 0 0 11 0 0
02152 WINTHROP 347 63 0 2 7 0 0
02163 BOSTON 12 7 0 0 0 0 0
02196 BOSTON 0 0 0 0 0 0 0
02199 BOSTON 52 6 0 0 1 0 0
02201 BOSTON 0 0 0 0 0 0 0
02202 BOSTON 0 0 0 0 0 0 0
143

Insurer Cancellation/Nonrenewal Report
Exhibit 8A
Page 53
Insurer-----Liberty Mutual Group
Calendar Year---2015
Insurer
Insurer Initiated Insurer Initiated
Policies Insurer Initiated Cancellations Nonrenewals
Zip in Force* Total Initiated Cancellations Nonpay of Total** Co's Geographic
Code City/Town/Post Office as of 12/31/15 Cancellations Cancellations First 60 Days Premium Nonrenewals Withdrawal
02203 BOSTON 0 0 0 0 0 0 0
02204 BOSTON 0 0 0 0 0 0 0
02205 BOSTON 0 0 0 0 0 0 0
02206 BOSTON 0 0 0 0 0 0 0
02207 BOSTON 0 0 0 0 0 0 0
02208 BOSTON 0 0 0 0 0 0 0
02209 BOSTON 0 0 0 0 0 0 0
02210 BOSTON 231 47 0 0 7 0 0
02211 BOSTON 0 0 0 0 0 0 0
02212 BOSTON 0 0 0 0 0 0 0
02215 BOSTON 558 105 0 0 6 0 0
02216 BOSTON 0 0 0 0 0 0 0
02217 BOSTON 0 0 0 0 0 0 0
02222 BOSTON 0 0 0 0 0 0 0
02228 EAST BOSTON 0 0 0 0 0 0 0
02238 CAMBRIDGE 0 0 0 0 0 0 0
02239 CAMBRIDGE 0 0 0 0 0 0 0
02241 BOSTON 0 0 0 0 0 0 0
02266 BOSTON 0 0 0 0 0 0 0
02283 BOSTON 0 0 0 0 0 0 0
02284 BOSTON 0 0 0 0 0 0 0
02293 BOSTON 0 0 0 0 0 0 0
02295 BOSTON 0 0 0 0 0 0 0
02297 BOSTON 0 0 0 0 0 0 0
02298 BOSTON 0 0 0 0 0 0 0
02301 BROCKTON 1,464 178 2 13 33 1 0
02302 BROCKTON 962 100 2 3 10 1 0
02303 BROCKTON 0 0 0 0 0 0 0
02304 BROCKTON 0 0 0 0 0 0 0
02305 BROCKTON 0 0 0 0 0 0 0
02360 PLYMOUTH 1,074 157 1 1 10 0 0
02361 PLYMOUTH 0 0 0 0 0 0 0
02362 PLYMOUTH 0 0 0 0 0 0 0
02381 WHITE HORSE BEACH 3 0 0 0 0 0 0
02532 BUZZARDS BAY 178 23 1 0 1 0 0
02534 CATAUMET 13 1 0 0 0 0 0
02535 CHILMARK 11 1 0 0 0 0 0
02536 EAST FALMOUTH 295 27 0 0 1 0 0
02537 EAST SANDWICH 95 7 0 0 0 1 0
02538 EAST WAREHAM 51 5 0 0 2 0 0
02539 EDGARTOWN 44 7 0 0 1 0 0
02540 FALMOUTH 175 21 0 0 0 0 0
02541 FALMOUTH 3 0 0 0 0 0 0
02542 BUZZARDS BAY 0 0 0 0 0 0 0
02543 WOODS HOLE 23 4 0 0 0 0 0
02552 MENEMSHA 0 0 0 0 0 0 0
02553 MONUMENT BEACH 23 0 0 0 0 0 0
02554 NANTUCKET 57 12 1 0 4 0 0
02556 NORTH FALMOUTH 53 5 0 0 2 0 0
02557 OAK BLUFFS 41 6 0 0 0 0 0
02558 ONSET 46 4 0 0 0 0 0
02559 POCASSET 68 6 0 0 0 0 0
02561 SAGAMORE 14 2 0 0 0 0 0
02562 SAGAMORE BEACH 44 2 0 0 0 0 0
02563 SANDWICH 165 17 0 0 0 0 0
02564 SIASCONSET 0 0 0 0 0 0 0
02565 SILVER BEACH 0 0 0 0 0 0 0
144
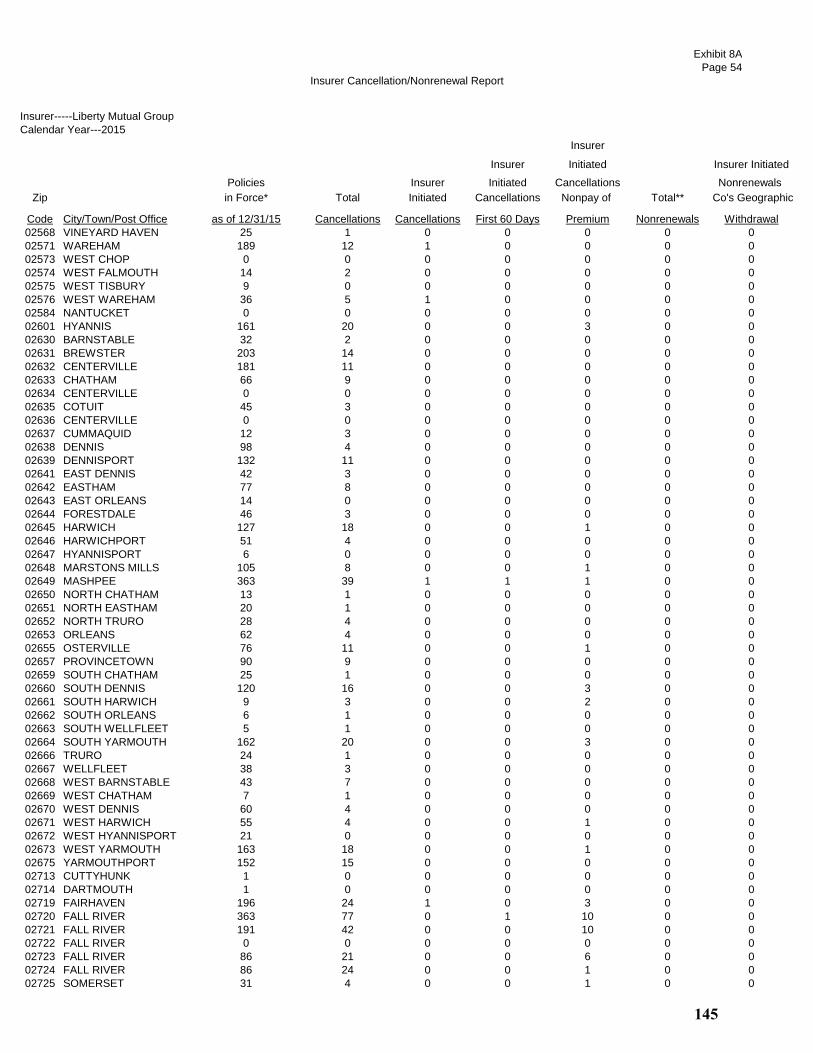
Insurer Cancellation/Nonrenewal Report
Exhibit 8A
Page 54
Insurer-----Liberty Mutual Group
Calendar Year---2015
Insurer
Insurer Initiated Insurer Initiated
Policies Insurer Initiated Cancellations Nonrenewals
Zip in Force* Total Initiated Cancellations Nonpay of Total** Co's Geographic
Code City/Town/Post Office as of 12/31/15 Cancellations Cancellations First 60 Days Premium Nonrenewals Withdrawal
02568 VINEYARD HAVEN 25 1 0 0 0 0 0
02571 WAREHAM 189 12 1 0 0 0 0
02573 WEST CHOP 0 0 0 0 0 0 0
02574 WEST FALMOUTH 14 2 0 0 0 0 0
02575 WEST TISBURY 9 0 0 0 0 0 0
02576 WEST WAREHAM 36 5 1 0 0 0 0
02584 NANTUCKET 0 0 0 0 0 0 0
02601 HYANNIS 161 20 0 0 3 0 0
02630 BARNSTABLE 32 2 0 0 0 0 0
02631 BREWSTER 203 14 0 0 0 0 0
02632 CENTERVILLE 181 11 0 0 0 0 0
02633 CHATHAM 66 9 0 0 0 0 0
02634 CENTERVILLE 0 0 0 0 0 0 0
02635 COTUIT 45 3 0 0 0 0 0
02636 CENTERVILLE 0 0 0 0 0 0 0
02637 CUMMAQUID 12 3 0 0 0 0 0
02638 DENNIS 98 4 0 0 0 0 0
02639 DENNISPORT 132 11 0 0 0 0 0
02641 EAST DENNIS 42 3 0 0 0 0 0
02642 EASTHAM 77 8 0 0 0 0 0
02643 EAST ORLEANS 14 0 0 0 0 0 0
02644 FORESTDALE 46 3 0 0 0 0 0
02645 HARWICH 127 18 0 0 1 0 0
02646 HARWICHPORT 51 4 0 0 0 0 0
02647 HYANNISPORT 6 0 0 0 0 0 0
02648 MARSTONS MILLS 105 8 0 0 1 0 0
02649 MASHPEE 363 39 1 1 1 0 0
02650 NORTH CHATHAM 13 1 0 0 0 0 0
02651 NORTH EASTHAM 20 1 0 0 0 0 0
02652 NORTH TRURO 28 4 0 0 0 0 0
02653 ORLEANS 62 4 0 0 0 0 0
02655 OSTERVILLE 76 11 0 0 1 0 0
02657 PROVINCETOWN 90 9 0 0 0 0 0
02659 SOUTH CHATHAM 25 1 0 0 0 0 0
02660 SOUTH DENNIS 120 16 0 0 3 0 0
02661 SOUTH HARWICH 9 3 0 0 2 0 0
02662 SOUTH ORLEANS 6 1 0 0 0 0 0
02663 SOUTH WELLFLEET 5 1 0 0 0 0 0
02664 SOUTH YARMOUTH 162 20 0 0 3 0 0
02666 TRURO 24 1 0 0 0 0 0
02667 WELLFLEET 38 3 0 0 0 0 0
02668 WEST BARNSTABLE 43 7 0 0 0 0 0
02669 WEST CHATHAM 7 1 0 0 0 0 0
02670 WEST DENNIS 60 4 0 0 0 0 0
02671 WEST HARWICH 55 4 0 0 1 0 0
02672 WEST HYANNISPORT 21 0 0 0 0 0 0
02673 WEST YARMOUTH 163 18 0 0 1 0 0
02675 YARMOUTHPORT 152 15 0 0 0 0 0
02713 CUTTYHUNK 1 0 0 0 0 0 0
02714 DARTMOUTH 1 0 0 0 0 0 0
02719 FAIRHAVEN 196 24 1 0 3 0 0
02720 FALL RIVER 363 77 0 1 10 0 0
02721 FALL RIVER 191 42 0 0 10 0 0
02722 FALL RIVER 0 0 0 0 0 0 0
02723 FALL RIVER 86 21 0 0 6 0 0
02724 FALL RIVER 86 24 0 0 1 0 0
02725 SOMERSET 31 4 0 0 1 0 0
145
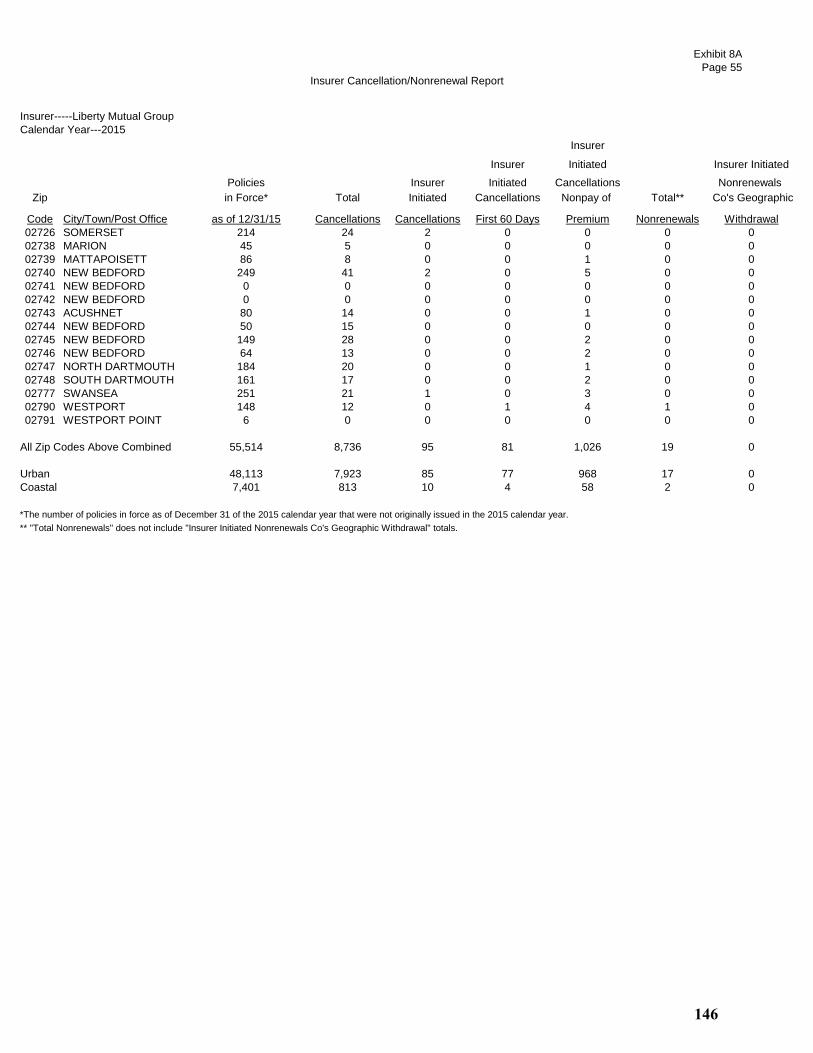
Insurer Cancellation/Nonrenewal Report
Exhibit 8A
Page 55
Insurer-----Liberty Mutual Group
Calendar Year---2015
Insurer
Insurer Initiated Insurer Initiated
Policies Insurer Initiated Cancellations Nonrenewals
Zip in Force* Total Initiated Cancellations Nonpay of Total** Co's Geographic
Code City/Town/Post Office as of 12/31/15 Cancellations Cancellations First 60 Days Premium Nonrenewals Withdrawal
02726 SOMERSET 214 24 2 0 0 0 0
02738 MARION 45 5 0 0 0 0 0
02739 MATTAPOISETT 86 8 0 0 1 0 0
02740 NEW BEDFORD 249 41 2 0 5 0 0
02741 NEW BEDFORD 0 0 0 0 0 0 0
02742 NEW BEDFORD 0 0 0 0 0 0 0
02743 ACUSHNET 80 14 0 0 1 0 0
02744 NEW BEDFORD 50 15 0 0 0 0 0
02745 NEW BEDFORD 149 28 0 0 2 0 0
02746 NEW BEDFORD 64 13 0 0 2 0 0
02747 NORTH DARTMOUTH 184 20 0 0 1 0 0
02748 SOUTH DARTMOUTH 161 17 0 0 2 0 0
02777 SWANSEA 251 21 1 0 3 0 0
02790 WESTPORT 148 12 0 1 4 1 0
02791 WESTPORT POINT 6 0 0 0 0 0 0
All Zip Codes Above Combined 55,514 8,736 95 81 1,026 19 0
Urban 48,113 7,923 85 77 968 17 0
Coastal 7,401 813 10 4 58 2 0
*The number of policies in force as of December 31 of the 2015 calendar year that were not originally issued in the 2015 calendar year.
** "Total Nonrenewals" does not include "Insurer Initiated Nonrenewals Co's Geographic Withdrawal" totals.
146

Insurer Cancellation/Nonrenewal Report
Exhibit 8A
Page 56
Insurer-----Mapfre Insurance Group
Calendar Year---2015
Insurer
Insurer Initiated Insurer Initiated
Policies Insurer Initiated Cancellations Nonrenewals
Zip in Force* Total Initiated Cancellations Nonpay of Total** Co's Geographic
Code City/Town/Post Office as of 12/31/15 Cancellations Cancellations First 60 Days Premium Nonrenewals Withdrawal
01101 SPRINGFIELD 0 0 0 0 0 0 0
01102 SPRINGFIELD 0 0 0 0 0 0 0
01103 SPRINGFIELD 26 2 0 0 1 0 0
01104 SPRINGFIELD 361 34 3 0 8 3 0
01105 SPRINGFIELD 35 7 0 0 2 0 0
01107 SPRINGFIELD 80 6 0 0 2 0 0
01108 SPRINGFIELD 265 45 4 0 8 4 0
01109 SPRINGFIELD 254 33 4 0 5 4 0
01111 SPRINGFIELD 0 0 0 0 0 0 0
01114 SPRINGFIELD 0 0 0 0 0 0 0
01115 SPRINGFIELD 0 0 0 0 0 0 0
01118 SPRINGFIELD 419 43 4 0 11 4 0
01119 SPRINGFIELD 249 29 6 0 3 6 0
01128 SPRINGFIELD 89 6 0 0 0 0 0
01129 SPRINGFIELD 235 28 3 0 7 3 0
01133 SPRINGFIELD 0 0 0 0 0 0 0
01138 SPRINGFIELD 0 0 0 0 0 0 0
01139 SPRINGFIELD 0 0 0 0 0 0 0
01144 SPRINGFIELD 0 0 0 0 0 0 0
01151 INDIAN ORCHARD 165 28 2 0 4 2 0
01152 SPRINGFIELD 0 0 0 0 0 0 0
01199 SPRINGFIELD 0 0 0 0 0 0 0
01601 WORCESTER 0 0 0 0 0 0 0
01602 WORCESTER 1,001 126 12 1 22 13 0
01603 WORCESTER 567 75 3 0 19 3 0
01604 WORCESTER 1,157 168 11 0 27 11 0
01605 WORCESTER 627 93 6 0 25 6 0
01606 WORCESTER 929 118 9 1 14 10 0
01607 WORCESTER 209 24 1 0 4 1 0
01608 WORCESTER 22 4 0 0 0 0 0
01609 WORCESTER 468 71 6 0 14 6 0
01610 WORCESTER 184 36 3 0 10 3 0
01611 CHERRY VALLEY 143 10 4 0 3 4 0
01612 PAXTON 340 33 2 0 3 2 0
01613 WORCESTER 0 0 0 0 0 0 0
01614 WORCESTER 0 0 0 0 0 0 0
01615 WORCESTER 0 0 0 0 0 0 0
01653 WORCESTER 0 0 0 0 0 0 0
01654 WORCESTER 0 0 0 0 0 0 0
01655 WORCESTER 0 0 0 0 0 0 0
01840 LAWRENCE 4 8 1 0 5 1 0
01841 LAWRENCE 197 32 7 0 8 7 0
01842 LAWRENCE 2 0 0 0 0 0 0
01843 LAWRENCE 298 52 4 0 8 4 0
01850 LOWELL 488 40 4 0 4 4 0
01851 LOWELL 701 74 7 0 10 7 0
01852 LOWELL 1,094 120 5 0 19 5 0
01853 LOWELL 0 1 0 0 0 0 0
01854 LOWELL 869 92 6 0 22 6 0
01901 LYNN 9 1 0 0 1 0 0
01902 LYNN 270 42 3 1 16 4 0
01903 LYNN 0 0 0 0 0 0 0
01904 LYNN 411 54 3 0 7 3 0
01905 LYNN 244 32 1 0 14 1 0
01910 LYNN 0 0 0 0 0 0 0
02020 BRANT ROCK 3 0 0 0 0 0 0
02041 GREEN HARBOR 7 0 0 0 0 0 0
02045 HULL 8 6 1 0 1 1 0
147

Insurer Cancellation/Nonrenewal Report
Exhibit 8A
Page 57
Insurer-----Mapfre Insurance Group
Calendar Year---2015
Insurer
Insurer Initiated Insurer Initiated
Policies Insurer Initiated Cancellations Nonrenewals
Zip in Force* Total Initiated Cancellations Nonpay of Total** Co's Geographic
Code City/Town/Post Office as of 12/31/15 Cancellations Cancellations First 60 Days Premium Nonrenewals Withdrawal
02047 HUMAROCK 2 0 0 0 0 0 0
02055 MINOT 0 0 0 0 0 0 0
02065 OCEAN BLUFF 0 0 0 0 0 0 0
02101 BOSTON 0 0 0 0 0 0 0
02102 BOSTON 0 0 0 0 0 0 0
02103 BOSTON 0 0 0 0 0 0 0
02104 BOSTON 0 0 0 0 0 0 0
02105 BOSTON 0 0 0 0 0 0 0
02106 BOSTON 0 0 0 0 0 0 0
02107 BOSTON 0 0 0 0 0 0 0
02108 BOSTON 56 16 0 0 4 0 0
02109 BOSTON 71 26 0 0 2 0 0
02110 BOSTON 57 8 0 0 1 0 0
02111 BOSTON 89 23 0 0 3 0 0
02112 BOSTON 0 0 0 0 0 0 0
02113 BOSTON 104 16 0 0 1 0 0
02114 BOSTON 236 32 1 0 8 1 0
02115 BOSTON 194 30 0 0 5 0 0
02116 BOSTON 398 83 2 0 13 2 0
02117 BOSTON 0 0 0 0 0 0 0
02118 BOSTON 321 58 4 0 12 4 0
02119 BOSTON 157 19 1 0 4 1 0
02120 BOSTON 68 12 0 1 4 1 0
02121 BOSTON 128 26 2 0 5 2 0
02122 BOSTON 321 50 2 0 7 2 0
02123 BOSTON 0 0 0 0 0 0 0
02124 BOSTON 644 83 5 0 16 5 0
02125 BOSTON 264 53 6 0 12 6 0
02126 MATTAPAN 327 39 6 0 4 6 0
02127 BOSTON 516 115 2 0 21 2 0
02128 BOSTON 261 32 2 0 7 2 0
02129 CHARLESTOWN 348 65 1 0 11 1 0
02130 JAMAICA PLAIN 1,258 146 15 0 31 15 0
02131 ROSLINDALE 1,275 113 12 0 22 12 0
02132 WEST ROXBURY 1,788 162 9 0 20 9 0
02133 BOSTON 0 0 0 0 0 0 0
02134 ALLSTON 249 49 1 0 16 1 0
02135 BRIGHTON 1,046 118 2 0 24 2 0
02136 HYDE PARK 1,067 86 15 0 11 15 0
02137 READVILLE 0 0 0 0 0 0 0
02138 CAMBRIDGE 751 82 7 0 12 7 0
02139 CAMBRIDGE 681 89 6 0 14 6 0
02140 CAMBRIDGE 549 57 1 0 9 1 0
02141 CAMBRIDGE 292 34 1 0 8 1 0
02142 CAMBRIDGE 40 8 0 0 3 0 0
02143 SOMERVILLE 628 76 3 0 7 3 0
02144 SOMERVILLE 636 68 4 0 6 4 0
02145 SOMERVILLE 585 68 1 1 13 2 0
02150 CHELSEA 439 48 4 0 13 4 0
02151 REVERE 642 93 5 1 17 6 0
02152 WINTHROP 9 8 4 0 0 4 0
02163 BOSTON 2 0 0 0 0 0 0
02196 BOSTON 0 0 0 0 0 0 0
02199 BOSTON 20 7 0 0 1 0 0
02201 BOSTON 0 0 0 0 0 0 0
02202 BOSTON 0 0 0 0 0 0 0
02203 BOSTON 0 0 0 0 0 0 0
02204 BOSTON 0 0 0 0 0 0 0
148

Insurer Cancellation/Nonrenewal Report
Exhibit 8A
Page 58
Insurer-----Mapfre Insurance Group
Calendar Year---2015
Insurer
Insurer Initiated Insurer Initiated
Policies Insurer Initiated Cancellations Nonrenewals
Zip in Force* Total Initiated Cancellations Nonpay of Total** Co's Geographic
Code City/Town/Post Office as of 12/31/15 Cancellations Cancellations First 60 Days Premium Nonrenewals Withdrawal
02205 BOSTON 0 0 0 0 0 0 0
02206 BOSTON 0 0 0 0 0 0 0
02207 BOSTON 0 0 0 0 0 0 0
02208 BOSTON 0 0 0 0 0 0 0
02209 BOSTON 0 0 0 0 0 0 0
02210 BOSTON 65 14 0 0 3 0 0
02211 BOSTON 0 0 0 0 0 0 0
02212 BOSTON 0 0 0 0 0 0 0
02215 BOSTON 193 24 1 0 4 1 0
02216 BOSTON 0 0 0 0 0 0 0
02217 BOSTON 0 0 0 0 0 0 0
02222 BOSTON 0 0 0 0 0 0 0
02228 EAST BOSTON 0 0 0 0 0 0 0
02238 CAMBRIDGE 0 0 0 0 0 0 0
02239 CAMBRIDGE 0 0 0 0 0 0 0
02241 BOSTON 0 0 0 0 0 0 0
02266 BOSTON 0 0 0 0 0 0 0
02283 BOSTON 0 0 0 0 0 0 0
02284 BOSTON 0 0 0 0 0 0 0
02293 BOSTON 0 0 0 0 0 0 0
02295 BOSTON 0 0 0 0 0 0 0
02297 BOSTON 0 0 0 0 0 0 0
02298 BOSTON 0 0 0 0 0 0 0
02301 BROCKTON 1,240 121 5 0 24 5 0
02302 BROCKTON 950 89 8 0 17 8 0
02303 BROCKTON 0 0 0 0 0 0 0
02304 BROCKTON 0 0 0 0 0 0 0
02305 BROCKTON 0 0 0 0 0 0 0
02360 PLYMOUTH 1,758 177 7 0 16 7 0
02361 PLYMOUTH 1 0 0 0 0 0 0
02362 PLYMOUTH 0 0 0 0 0 0 0
02381 WHITE HORSE BEACH 0 0 0 0 0 0 0
02532 BUZZARDS BAY 73 2 0 0 0 0 0
02534 CATAUMET 2 0 0 0 0 0 0
02535 CHILMARK 0 0 0 0 0 0 0
02536 EAST FALMOUTH 163 14 1 0 3 1 0
02537 EAST SANDWICH 42 3 1 0 0 1 0
02538 EAST WAREHAM 138 16 1 0 3 1 0
02539 EDGARTOWN 0 0 0 0 0 0 0
02540 FALMOUTH 20 4 0 0 1 0 0
02541 FALMOUTH 0 0 0 0 0 0 0
02542 BUZZARDS BAY 0 0 0 0 0 0 0
02543 WOODS HOLE 1 0 0 0 0 0 0
02552 MENEMSHA 0 0 0 0 0 0 0
02553 MONUMENT BEACH 1 0 0 0 0 0 0
02554 NANTUCKET 0 1 0 0 0 0 0
02556 NORTH FALMOUTH 9 3 1 0 0 1 0
02557 OAK BLUFFS 0 0 0 0 0 0 0
02558 ONSET 5 0 0 0 0 0 0
02559 POCASSET 8 1 0 0 0 0 0
02561 SAGAMORE 2 0 0 0 0 0 0
02562 SAGAMORE BEACH 17 1 0 0 0 0 0
02563 SANDWICH 92 12 1 0 2 1 0
02564 SIASCONSET 0 0 0 0 0 0 0
02565 SILVER BEACH 0 0 0 0 0 0 0
02568 VINEYARD HAVEN 0 0 0 0 0 0 0
02571 WAREHAM 164 12 3 0 1 3 0
02573 WEST CHOP 0 0 0 0 0 0 0
149

Insurer Cancellation/Nonrenewal Report
Exhibit 8A
Page 59
Insurer-----Mapfre Insurance Group
Calendar Year---2015
Insurer
Insurer Initiated Insurer Initiated
Policies Insurer Initiated Cancellations Nonrenewals
Zip in Force* Total Initiated Cancellations Nonpay of Total** Co's Geographic
Code City/Town/Post Office as of 12/31/15 Cancellations Cancellations First 60 Days Premium Nonrenewals Withdrawal
02574 WEST FALMOUTH 2 0 0 0 0 0 0
02575 WEST TISBURY 0 0 0 0 0 0 0
02576 WEST WAREHAM 132 12 1 0 1 1 0
02584 NANTUCKET 0 0 0 0 0 0 0
02601 HYANNIS 64 16 1 0 5 1 0
02630 BARNSTABLE 29 3 0 0 1 0 0
02631 BREWSTER 234 10 0 0 2 0 0
02632 CENTERVILLE 146 13 1 0 3 1 0
02633 CHATHAM 72 3 0 0 0 0 0
02634 CENTERVILLE 0 0 0 0 0 0 0
02635 COTUIT 35 4 0 0 3 0 0
02636 CENTERVILLE 0 0 0 0 0 0 0
02637 CUMMAQUID 12 1 0 0 0 0 0
02638 DENNIS 91 4 1 0 0 1 0
02639 DENNISPORT 20 1 0 0 0 0 0
02641 EAST DENNIS 37 4 0 0 0 0 0
02642 EASTHAM 44 3 0 0 0 0 0
02643 EAST ORLEANS 0 0 0 0 0 0 0
02644 FORESTDALE 31 1 0 0 0 0 0
02645 HARWICH 209 23 3 0 1 3 0
02646 HARWICHPORT 5 1 0 0 0 0 0
02647 HYANNISPORT 0 0 0 0 0 0 0
02648 MARSTONS MILLS 123 7 0 0 0 0 0
02649 MASHPEE 153 12 0 0 1 0 0
02650 NORTH CHATHAM 6 0 0 0 0 0 0
02651 NORTH EASTHAM 0 0 0 0 0 0 0
02652 NORTH TRURO 0 0 0 0 0 0 0
02653 ORLEANS 48 4 0 0 1 0 0
02655 OSTERVILLE 33 5 1 0 0 1 0
02657 PROVINCETOWN 0 1 0 0 0 0 0
02659 SOUTH CHATHAM 4 2 0 0 1 0 0
02660 SOUTH DENNIS 185 15 0 0 1 0 0
02661 SOUTH HARWICH 2 1 0 0 0 0 0
02662 SOUTH ORLEANS 0 0 0 0 0 0 0
02663 SOUTH WELLFLEET 0 0 0 0 0 0 0
02664 SOUTH YARMOUTH 158 13 0 1 1 1 0
02666 TRURO 0 0 0 0 0 0 0
02667 WELLFLEET 0 0 0 0 0 0 0
02668 WEST BARNSTABLE 46 1 0 0 1 0 0
02669 WEST CHATHAM 5 0 0 0 0 0 0
02670 WEST DENNIS 10 0 0 0 0 0 0
02671 WEST HARWICH 3 0 0 0 0 0 0
02672 WEST HYANNISPORT 0 0 0 0 0 0 0
02673 WEST YARMOUTH 78 9 1 0 2 1 0
02675 YARMOUTHPORT 153 18 0 0 2 0 0
02713 CUTTYHUNK 0 0 0 0 0 0 0
02714 DARTMOUTH 0 0 0 0 0 0 0
02719 FAIRHAVEN 556 30 2 0 8 2 0
02720 FALL RIVER 1,451 154 6 0 18 6 0
02721 FALL RIVER 667 61 4 1 7 5 0
02722 FALL RIVER 5 0 0 0 0 0 0
02723 FALL RIVER 489 48 2 0 9 2 0
02724 FALL RIVER 359 28 1 0 4 1 0
02725 SOMERSET 150 19 3 0 0 3 0
02726 SOMERSET 1,099 91 4 0 14 4 0
02738 MARION 128 7 1 0 1 1 0
02739 MATTAPOISETT 156 10 1 0 2 1 0
02740 NEW BEDFORD 1,112 96 4 0 8 4 0
150

Insurer Cancellation/Nonrenewal Report
Exhibit 8A
Page 60
Insurer-----Mapfre Insurance Group
Calendar Year---2015
Insurer
Insurer Initiated Insurer Initiated
Policies Insurer Initiated Cancellations Nonrenewals
Zip in Force* Total Initiated Cancellations Nonpay of Total** Co's Geographic
Code City/Town/Post Office as of 12/31/15 Cancellations Cancellations First 60 Days Premium Nonrenewals Withdrawal
02741 NEW BEDFORD 1 0 0 0 0 0 0
02742 NEW BEDFORD 0 0 0 0 0 0 0
02743 ACUSHNET 942 71 4 0 8 4 0
02744 NEW BEDFORD 0 1 1 0 0 1 0
02745 NEW BEDFORD 2,075 162 14 0 18 14 0
02746 NEW BEDFORD 295 21 0 0 4 0 0
02747 NORTH DARTMOUTH 1,395 105 5 0 7 5 0
02748 SOUTH DARTMOUTH 206 22 3 0 1 3 0
02777 SWANSEA 813 84 2 0 4 2 0
02790 WESTPORT 1,349 87 9 0 4 9 0
02791 WESTPORT POINT 0 0 0 0 0 0 0
All Zip Codes Above Combined 49,311 5,449 353 8 891 361 0
Urban 37,831 4,484 294 7 789 301 0
Coastal 11,480 965 59 1 102 60 0
*The number of policies in force as of December 31 of the 2015 calendar year that were not originally issued in the 2015 calendar year.
** "Total Nonrenewals" does not include "Insurer Initiated Nonrenewals Co's Geographic Withdrawal" totals.
151

Insurer Cancellation/Nonrenewal Report
Exhibit 8A
Page 61
Insurer---Metropolitan Group
Calendar Year---2015Insurer
Insurer Initiated Insurer Initiated
Policies Insurer Initiated Cancellations Nonrenewals
Zip in Force* Total Initiated Cancellations Nonpay of Total** Co's Geographic
Code City/Town/Post Office as of 12/31/15 Cancellations Cancellations First 60 Days Premium Nonrenewals Withdrawal
01101 SPRINGFIELD 0 0 0 0 0 0 0
01102 SPRINGFIELD 0 0 0 0 0 0 0
01103 SPRINGFIELD 7 3 1 1 0 0 0
01104 SPRINGFIELD 125 18 6 5 2 1 0
01105 SPRINGFIELD 22 3 0 0 0 0 0
01107 SPRINGFIELD 30 3 0 0 0 0 0
01108 SPRINGFIELD 109 14 1 1 0 3 0
01109 SPRINGFIELD 164 15 1 1 1 1 0
01111 SPRINGFIELD 0 0 0 0 0 0 0
01114 SPRINGFIELD 0 0 0 0 0 0 0
01115 SPRINGFIELD 0 0 0 0 0 0 0
01118 SPRINGFIELD 108 14 6 6 2 2 0
01119 SPRINGFIELD 99 14 3 3 1 2 0
01128 SPRINGFIELD 28 3 1 1 1 0 0
01129 SPRINGFIELD 81 5 2 2 1 0 0
01133 SPRINGFIELD 0 0 0 0 0 0 0
01138 SPRINGFIELD 0 0 0 0 0 0 0
01139 SPRINGFIELD 0 0 0 0 0 0 0
01144 SPRINGFIELD 0 0 0 0 0 0 0
01151 INDIAN ORCHARD 44 12 4 4 4 0 0
01152 SPRINGFIELD 0 0 0 0 0 0 0
01199 SPRINGFIELD 0 0 0 0 0 0 0
01601 WORCESTER 0 0 0 0 0 0 0
01602 WORCESTER 175 32 11 10 8 0 0
01603 WORCESTER 144 13 5 5 3 0 0
01604 WORCESTER 311 48 7 7 3 1 0
01605 WORCESTER 179 21 2 2 2 0 0
01606 WORCESTER 213 11 1 0 1 1 0
01607 WORCESTER 58 16 5 4 1 0 0
01608 WORCESTER 6 0 0 0 0 0 0
01609 WORCESTER 103 17 1 1 1 1 0
01610 WORCESTER 49 5 0 0 0 0 0
01611 CHERRY VALLEY 21 5 2 2 1 0 0
01612 PAXTON 40 4 0 0 0 0 0
01613 WORCESTER 0 0 0 0 0 0 0
01614 WORCESTER 0 0 0 0 0 0 0
01615 WORCESTER 0 0 0 0 0 0 0
01653 WORCESTER 0 0 0 0 0 0 0
01654 WORCESTER 0 0 0 0 0 0 0
01655 WORCESTER 0 0 0 0 0 0 0
01840 LAWRENCE 8 1 0 0 0 0 0
01841 LAWRENCE 104 10 1 1 0 1 0
01842 LAWRENCE 0 0 0 0 0 0 0
01843 LAWRENCE 158 23 4 3 1 1 0
01850 LOWELL 129 12 3 3 1 1 0
01851 LOWELL 215 28 5 5 0 1 0
01852 LOWELL 396 41 11 10 6 0 0
01853 LOWELL 0 0 0 0 0 0 0
01854 LOWELL 251 33 8 7 2 2 0
01901 LYNN 8 1 0 0 0 0 0
01902 LYNN 120 14 2 2 0 3 0
01903 LYNN 0 0 0 0 0 0 0
01904 LYNN 117 6 2 2 1 0 0
01905 LYNN 94 8 2 2 1 0 0
01910 LYNN 0 0 0 0 0 0 0
02020 BRANT ROCK 1 0 0 0 0 0 0
02041 GREEN HARBOR 0 0 0 0 0 0 0
02045 HULL 71 7 1 1 0 0 0
152

Insurer Cancellation/Nonrenewal Report
Exhibit 8A
Page 62
Insurer---Metropolitan Group
Calendar Year---2015Insurer
Insurer Initiated Insurer Initiated
Policies Insurer Initiated Cancellations Nonrenewals
Zip in Force* Total Initiated Cancellations Nonpay of Total** Co's Geographic
Code City/Town/Post Office as of 12/31/15 Cancellations Cancellations First 60 Days Premium Nonrenewals Withdrawal
02047 HUMAROCK 4 2 1 1 0 0 0
02055 MINOT 0 0 0 0 0 0 0
02065 OCEAN BLUFF 1 0 0 0 0 0 0
02101 BOSTON 0 0 0 0 0 0 0
02102 BOSTON 0 0 0 0 0 0 0
02103 BOSTON 0 0 0 0 0 0 0
02104 BOSTON 0 0 0 0 0 0 0
02105 BOSTON 0 0 0 0 0 0 0
02106 BOSTON 0 0 0 0 0 0 0
02107 BOSTON 0 0 0 0 0 0 0
02108 BOSTON 28 9 3 3 0 0 0
02109 BOSTON 45 6 0 0 0 0 0
02110 BOSTON 29 6 2 2 1 0 0
02111 BOSTON 72 12 2 2 1 0 0
02112 BOSTON 0 0 0 0 0 0 0
02113 BOSTON 81 12 3 3 1 1 0
02114 BOSTON 132 21 1 1 0 1 0
02115 BOSTON 144 21 5 4 2 0 0
02116 BOSTON 242 37 4 4 0 0 0
02117 BOSTON 1 0 0 0 0 0 0
02118 BOSTON 310 46 9 9 3 0 0
02119 BOSTON 102 9 2 2 0 0 0
02120 BOSTON 48 5 1 1 0 1 0
02121 BOSTON 75 4 0 0 0 0 0
02122 BOSTON 98 15 2 2 0 0 0
02123 BOSTON 0 0 0 0 0 0 0
02124 BOSTON 190 22 2 2 0 0 0
02125 BOSTON 165 26 6 6 2 1 0
02126 MATTAPAN 99 3 1 1 0 0 0
02127 BOSTON 384 65 9 9 1 0 0
02128 BOSTON 124 19 4 4 0 0 0
02129 CHARLESTOWN 218 39 3 3 0 0 0
02130 JAMAICA PLAIN 313 36 8 8 2 1 0
02131 ROSLINDALE 193 17 2 2 0 0 0
02132 WEST ROXBURY 206 28 6 6 5 0 0
02133 BOSTON 0 0 0 0 0 0 0
02134 ALLSTON 140 12 1 1 0 0 0
02135 BRIGHTON 401 57 12 12 2 1 0
02136 HYDE PARK 179 13 0 0 0 2 0
02137 READVILLE 0 0 0 0 0 0 0
02138 CAMBRIDGE 294 35 7 7 1 0 0
02139 CAMBRIDGE 305 41 9 9 1 3 0
02140 CAMBRIDGE 192 34 8 8 3 0 0
02141 CAMBRIDGE 149 18 1 1 0 1 0
02142 CAMBRIDGE 17 5 0 0 0 0 0
02143 SOMERVILLE 255 55 6 6 1 1 0
02144 SOMERVILLE 271 53 7 7 1 0 0
02145 SOMERVILLE 177 26 3 3 0 1 0
02150 CHELSEA 133 18 3 3 1 1 0
02151 REVERE 195 27 4 4 3 0 0
02152 WINTHROP 85 14 2 2 1 0 0
02163 BOSTON 1 0 0 0 0 0 0
02196 BOSTON 0 0 0 0 0 0 0
02199 BOSTON 10 5 2 2 0 0 0
02201 BOSTON 0 0 0 0 0 0 0
02202 BOSTON 0 0 0 0 0 0 0
02203 BOSTON 0 0 0 0 0 0 0
02204 BOSTON 0 0 0 0 0 0 0
153

Insurer Cancellation/Nonrenewal Report
Exhibit 8A
Page 63
Insurer---Metropolitan Group
Calendar Year---2015Insurer
Insurer Initiated Insurer Initiated
Policies Insurer Initiated Cancellations Nonrenewals
Zip in Force* Total Initiated Cancellations Nonpay of Total** Co's Geographic
Code City/Town/Post Office as of 12/31/15 Cancellations Cancellations First 60 Days Premium Nonrenewals Withdrawal
02205 BOSTON 0 0 0 0 0 0 0
02206 BOSTON 0 0 0 0 0 0 0
02207 BOSTON 0 0 0 0 0 0 0
02208 BOSTON 0 0 0 0 0 0 0
02209 BOSTON 0 0 0 0 0 0 0
02210 BOSTON 63 5 0 0 0 0 0
02211 BOSTON 0 0 0 0 0 0 0
02212 BOSTON 0 0 0 0 0 0 0
02215 BOSTON 113 15 3 3 0 0 0
02216 BOSTON 0 0 0 0 0 0 0
02217 BOSTON 0 0 0 0 0 0 0
02222 BOSTON 0 0 0 0 0 0 0
02228 EAST BOSTON 0 0 0 0 0 0 0
02238 CAMBRIDGE 0 0 0 0 0 0 0
02239 CAMBRIDGE 0 0 0 0 0 0 0
02241 BOSTON 0 0 0 0 0 0 0
02266 BOSTON 0 0 0 0 0 0 0
02283 BOSTON 0 0 0 0 0 0 0
02284 BOSTON 0 0 0 0 0 0 0
02293 BOSTON 0 0 0 0 0 0 0
02295 BOSTON 0 0 0 0 0 0 0
02297 BOSTON 0 0 0 0 0 0 0
02298 BOSTON 0 0 0 0 0 0 0
02301 BROCKTON 304 30 10 9 3 2 0
02302 BROCKTON 261 29 8 8 6 2 0
02303 BROCKTON 0 0 0 0 0 0 0
02304 BROCKTON 0 0 0 0 0 0 0
02305 BROCKTON 0 0 0 0 0 0 0
02360 PLYMOUTH 400 47 5 5 1 0 0
02361 PLYMOUTH 0 0 0 0 0 0 0
02362 PLYMOUTH 0 0 0 0 0 0 0
02381 WHITE HORSE BEACH 2 0 0 0 0 0 0
02532 BUZZARDS BAY 67 9 1 1 1 0 0
02534 CATAUMET 7 0 0 0 0 0 0
02535 CHILMARK 8 0 0 0 0 0 0
02536 EAST FALMOUTH 169 13 2 2 1 2 0
02537 EAST SANDWICH 42 5 0 0 0 0 0
02538 EAST WAREHAM 16 2 0 0 0 0 0
02539 EDGARTOWN 39 2 1 1 0 0 0
02540 FALMOUTH 60 9 3 3 0 0 0
02541 FALMOUTH 0 0 0 0 0 0 0
02542 BUZZARDS BAY 0 0 0 0 0 0 0
02543 WOODS HOLE 1 0 0 0 0 0 0
02552 MENEMSHA 0 0 0 0 0 0 0
02553 MONUMENT BEACH 6 0 0 0 0 0 0
02554 NANTUCKET 63 9 2 2 2 0 0
02556 NORTH FALMOUTH 49 0 0 0 0 0 0
02557 OAK BLUFFS 30 3 0 0 0 0 0
02558 ONSET 15 1 0 0 0 0 0
02559 POCASSET 33 4 0 0 0 0 0
02561 SAGAMORE 5 1 0 0 0 0 0
02562 SAGAMORE BEACH 23 2 1 1 0 0 0
02563 SANDWICH 76 8 1 1 0 1 0
02564 SIASCONSET 1 0 0 0 0 0 0
02565 SILVER BEACH 0 0 0 0 0 0 0
02568 VINEYARD HAVEN 14 0 0 0 0 0 0
02571 WAREHAM 61 5 2 2 0 0 0
02573 WEST CHOP 0 0 0 0 0 0 0
154

Insurer Cancellation/Nonrenewal Report
Exhibit 8A
Page 64
Insurer---Metropolitan Group
Calendar Year---2015Insurer
Insurer Initiated Insurer Initiated
Policies Insurer Initiated Cancellations Nonrenewals
Zip in Force* Total Initiated Cancellations Nonpay of Total** Co's Geographic
Code City/Town/Post Office as of 12/31/15 Cancellations Cancellations First 60 Days Premium Nonrenewals Withdrawal
02574 WEST FALMOUTH 5 1 0 0 0 0 0
02575 WEST TISBURY 15 0 0 0 0 0 0
02576 WEST WAREHAM 15 1 0 0 0 0 0
02584 NANTUCKET 0 0 0 0 0 0 0
02601 HYANNIS 74 6 0 0 0 0 0
02630 BARNSTABLE 17 1 0 0 0 0 0
02631 BREWSTER 107 14 2 2 2 0 0
02632 CENTERVILLE 79 3 0 0 0 0 0
02633 CHATHAM 43 2 1 1 0 0 0
02634 CENTERVILLE 0 0 0 0 0 0 0
02635 COTUIT 31 2 0 0 0 0 0
02636 CENTERVILLE 0 0 0 0 0 0 0
02637 CUMMAQUID 2 1 0 0 0 0 0
02638 DENNIS 38 6 0 0 0 0 0
02639 DENNISPORT 44 1 0 0 0 1 0
02641 EAST DENNIS 17 0 0 0 0 0 0
02642 EASTHAM 57 0 0 0 0 0 0
02643 EAST ORLEANS 8 2 1 1 0 0 0
02644 FORESTDALE 17 4 1 1 0 0 0
02645 HARWICH 84 6 0 0 0 0 0
02646 HARWICHPORT 23 4 0 0 0 0 0
02647 HYANNISPORT 3 0 0 0 0 0 0
02648 MARSTONS MILLS 35 2 0 0 0 0 0
02649 MASHPEE 145 14 3 3 1 0 0
02650 NORTH CHATHAM 3 0 0 0 0 0 0
02651 NORTH EASTHAM 7 0 0 0 0 0 0
02652 NORTH TRURO 6 2 0 0 0 0 0
02653 ORLEANS 26 4 2 0 0 0 0
02655 OSTERVILLE 36 0 0 0 0 0 0
02657 PROVINCETOWN 39 6 1 1 1 0 0
02659 SOUTH CHATHAM 15 0 0 0 0 0 0
02660 SOUTH DENNIS 38 5 0 0 0 0 0
02661 SOUTH HARWICH 6 0 0 0 0 0 0
02662 SOUTH ORLEANS 2 0 0 0 0 0 0
02663 SOUTH WELLFLEET 0 0 0 0 0 0 0
02664 SOUTH YARMOUTH 79 7 3 3 1 1 0
02666 TRURO 14 0 0 0 0 0 0
02667 WELLFLEET 28 2 0 0 0 0 0
02668 WEST BARNSTABLE 12 1 0 0 0 0 0
02669 WEST CHATHAM 7 0 0 0 0 0 0
02670 WEST DENNIS 35 2 0 0 0 0 0
02671 WEST HARWICH 16 2 1 1 0 0 0
02672 WEST HYANNISPORT 3 0 0 0 0 0 0
02673 WEST YARMOUTH 74 10 4 4 0 0 0
02675 YARMOUTHPORT 51 1 0 0 0 0 0
02713 CUTTYHUNK 1 0 0 0 0 0 0
02714 DARTMOUTH 0 0 0 0 0 0 0
02719 FAIRHAVEN 48 6 1 1 0 0 0
02720 FALL RIVER 66 13 1 1 0 0 0
02721 FALL RIVER 30 8 0 0 0 0 0
02722 FALL RIVER 0 0 0 0 0 0 0
02723 FALL RIVER 28 6 1 1 0 0 0
02724 FALL RIVER 18 3 0 0 0 0 0
02725 SOMERSET 6 0 0 0 0 0 0
02726 SOMERSET 34 5 0 0 0 0 0
02738 MARION 33 6 1 0 0 0 0
02739 MATTAPOISETT 32 2 0 0 0 0 0
02740 NEW BEDFORD 52 15 2 2 0 0 0
155

Insurer Cancellation/Nonrenewal Report
Exhibit 8A
Page 65
Insurer---Metropolitan Group
Calendar Year---2015Insurer
Insurer Initiated Insurer Initiated
Policies Insurer Initiated Cancellations Nonrenewals
Zip in Force* Total Initiated Cancellations Nonpay of Total** Co's Geographic
Code City/Town/Post Office as of 12/31/15 Cancellations Cancellations First 60 Days Premium Nonrenewals Withdrawal
02741 NEW BEDFORD 0 0 0 0 0 0 0
02742 NEW BEDFORD 1 0 0 0 0 0 0
02743 ACUSHNET 29 3 1 1 1 1 0
02744 NEW BEDFORD 11 0 0 0 0 0 0
02745 NEW BEDFORD 41 4 0 0 0 0 0
02746 NEW BEDFORD 21 2 0 0 0 0 0
02747 NORTH DARTMOUTH 86 11 1 1 0 0 0
02748 SOUTH DARTMOUTH 68 8 0 0 0 0 0
02777 SWANSEA 67 4 0 0 0 0 0
02790 WESTPORT 61 13 1 1 1 1 0
02791 WESTPORT POINT 2 0 0 0 0 0 0
All Zip Codes Above Combined 13,915 1,753 306 294 97 47 0
Urban 10,828 1,454 262 253 85 40 0
Coastal 3,087 299 44 41 12 7 0
*The number of policies in force as of December 31 of the 2015 calendar year that were not originally issued in the 2015 calendar year.
** "Total Nonrenewals" does not include "Insurer Initiated Nonrenewals Co's Geographic Withdrawal" totals.
156

Insurer Cancellation/Nonrenewal Report
Exhibit 8A
Page 66
Insurer-----NBIC Holdings Group
Calendar Year---2015Insurer
Insurer Initiated Insurer Initiated
Policies Insurer Initiated Cancellations Nonrenewals
Zip in Force* Total Initiated Cancellations Nonpay of Total** Co's Geographic
Code City/Town/Post Office as of 12/31/15 Cancellations Cancellations First 60 Days Premium Nonrenewals Withdrawal
01101 SPRINGFIELD 0 0 0 0 0 0 0
01102 SPRINGFIELD 0 0 0 0 0 0 0
01103 SPRINGFIELD 2 0 0 0 0 0 0
01104 SPRINGFIELD 35 2 0 0 0 0 0
01105 SPRINGFIELD 5 0 0 0 0 0 0
01107 SPRINGFIELD 5 0 0 0 0 0 0
01108 SPRINGFIELD 22 2 0 0 1 0 0
01109 SPRINGFIELD 19 4 1 0 1 0 0
01111 SPRINGFIELD 0 0 0 0 0 0 0
01114 SPRINGFIELD 0 0 0 0 0 0 0
01115 SPRINGFIELD 0 0 0 0 0 0 0
01118 SPRINGFIELD 22 5 0 0 0 0 0
01119 SPRINGFIELD 22 2 0 0 1 0 0
01128 SPRINGFIELD 5 0 0 0 0 0 0
01129 SPRINGFIELD 13 1 0 0 0 1 0
01133 SPRINGFIELD 0 0 0 0 0 0 0
01138 SPRINGFIELD 0 0 0 0 0 0 0
01139 SPRINGFIELD 0 0 0 0 0 0 0
01144 SPRINGFIELD 0 0 0 0 0 0 0
01151 INDIAN ORCHARD 9 1 1 0 0 0 0
01152 SPRINGFIELD 0 0 0 0 0 0 0
01199 SPRINGFIELD 0 0 0 0 0 0 0
01601 WORCESTER 0 0 0 0 0 0 0
01602 WORCESTER 25 3 0 0 2 2 0
01603 WORCESTER 21 5 0 0 2 1 0
01604 WORCESTER 28 3 1 0 0 2 0
01605 WORCESTER 21 1 0 0 1 1 0
01606 WORCESTER 33 2 0 0 0 0 0
01607 WORCESTER 8 0 0 0 0 0 0
01608 WORCESTER 1 0 0 0 0 0 0
01609 WORCESTER 15 1 0 0 0 0 1
01610 WORCESTER 4 1 0 0 1 0 0
01611 CHERRY VALLEY 2 1 0 0 1 0 0
01612 PAXTON 3 2 0 0 1 0 0
01613 WORCESTER 0 0 0 0 0 0 0
01614 WORCESTER 0 0 0 0 0 0 0
01615 WORCESTER 0 0 0 0 0 0 0
01653 WORCESTER 0 0 0 0 0 0 0
01654 WORCESTER 0 0 0 0 0 0 0
01655 WORCESTER 0 0 0 0 0 0 0
01840 LAWRENCE 0 0 0 0 0 0 0
01841 LAWRENCE 46 16 4 1 2 0 0
01842 LAWRENCE 0 0 0 0 0 0 0
01843 LAWRENCE 46 11 4 1 2 1 0
01850 LOWELL 22 0 0 0 0 1 0
01851 LOWELL 16 1 0 0 1 0 0
01852 LOWELL 28 3 0 1 1 0 0
01853 LOWELL 0 0 0 0 0 0 0
01854 LOWELL 23 3 0 0 0 0 0
01901 LYNN 1 0 0 0 0 0 0
01902 LYNN 291 62 11 7 10 1 0
01903 LYNN 0 0 0 0 0 0 0
01904 LYNN 280 44 5 3 4 0 0
01905 LYNN 164 23 5 1 4 1 0
01910 LYNN 0 0 0 0 0 0 0
02020 BRANT ROCK 3 0 0 0 0 0 0
02041 GREEN HARBOR 1 0 0 0 0 0 0
02045 HULL 337 49 5 5 10 9 0
157

Insurer Cancellation/Nonrenewal Report
Exhibit 8A
Page 67
Insurer-----NBIC Holdings Group
Calendar Year---2015Insurer
Insurer Initiated Insurer Initiated
Policies Insurer Initiated Cancellations Nonrenewals
Zip in Force* Total Initiated Cancellations Nonpay of Total** Co's Geographic
Code City/Town/Post Office as of 12/31/15 Cancellations Cancellations First 60 Days Premium Nonrenewals Withdrawal
02047 HUMAROCK 15 0 0 0 0 0 0
02055 MINOT 0 0 0 0 0 0 0
02065 OCEAN BLUFF 2 0 0 0 0 0 0
02101 BOSTON 0 0 0 0 0 0 0
02102 BOSTON 0 0 0 0 0 0 0
02103 BOSTON 0 0 0 0 0 0 0
02104 BOSTON 0 0 0 0 0 0 0
02105 BOSTON 0 0 0 0 0 0 0
02106 BOSTON 0 0 0 0 0 0 0
02107 BOSTON 0 0 0 0 0 0 0
02108 BOSTON 6 1 0 0 1 0 0
02109 BOSTON 6 0 0 0 0 0 0
02110 BOSTON 6 1 0 0 0 0 0
02111 BOSTON 1 2 0 0 1 0 0
02112 BOSTON 0 0 0 0 0 0 0
02113 BOSTON 6 2 0 0 0 0 0
02114 BOSTON 6 4 0 0 1 0 0
02115 BOSTON 11 5 0 0 3 0 0
02116 BOSTON 23 9 0 0 3 1 0
02117 BOSTON 0 0 0 0 0 0 0
02118 BOSTON 34 12 0 0 4 0 0
02119 BOSTON 14 2 0 0 0 0 0
02120 BOSTON 9 0 0 0 0 0 0
02121 BOSTON 13 1 1 0 0 1 0
02122 BOSTON 27 3 1 0 0 0 0
02123 BOSTON 0 0 0 0 0 0 0
02124 BOSTON 49 15 6 3 3 0 0
02125 BOSTON 26 10 1 0 1 0 0
02126 MATTAPAN 18 2 0 0 1 0 0
02127 BOSTON 67 33 0 1 7 1 0
02128 BOSTON 47 16 1 1 3 0 0
02129 CHARLESTOWN 32 10 0 0 5 0 0
02130 JAMAICA PLAIN 58 14 1 0 3 0 0
02131 ROSLINDALE 55 12 1 0 3 0 0
02132 WEST ROXBURY 81 14 2 0 4 0 0
02133 BOSTON 0 0 0 0 0 0 0
02134 ALLSTON 9 3 0 0 1 0 0
02135 BRIGHTON 31 6 0 0 2 1 0
02136 HYDE PARK 56 13 3 0 3 0 0
02137 READVILLE 0 0 0 0 0 0 0
02138 CAMBRIDGE 13 7 0 0 3 0 0
02139 CAMBRIDGE 29 6 0 0 2 0 0
02140 CAMBRIDGE 16 1 0 0 0 0 0
02141 CAMBRIDGE 10 0 0 0 0 0 0
02142 CAMBRIDGE 1 1 0 0 0 0 0
02143 SOMERVILLE 20 5 0 0 0 1 0
02144 SOMERVILLE 24 3 0 0 1 0 0
02145 SOMERVILLE 25 6 0 0 1 0 0
02150 CHELSEA 43 5 1 0 2 4 0
02151 REVERE 305 67 4 2 8 0 0
02152 WINTHROP 249 35 3 1 4 1 0
02163 BOSTON 0 0 0 0 0 0 0
02196 BOSTON 0 0 0 0 0 0 0
02199 BOSTON 0 0 0 0 0 0 0
02201 BOSTON 0 0 0 0 0 0 0
02202 BOSTON 0 0 0 0 0 0 0
02203 BOSTON 0 0 0 0 0 0 0
02204 BOSTON 0 0 0 0 0 0 0
158
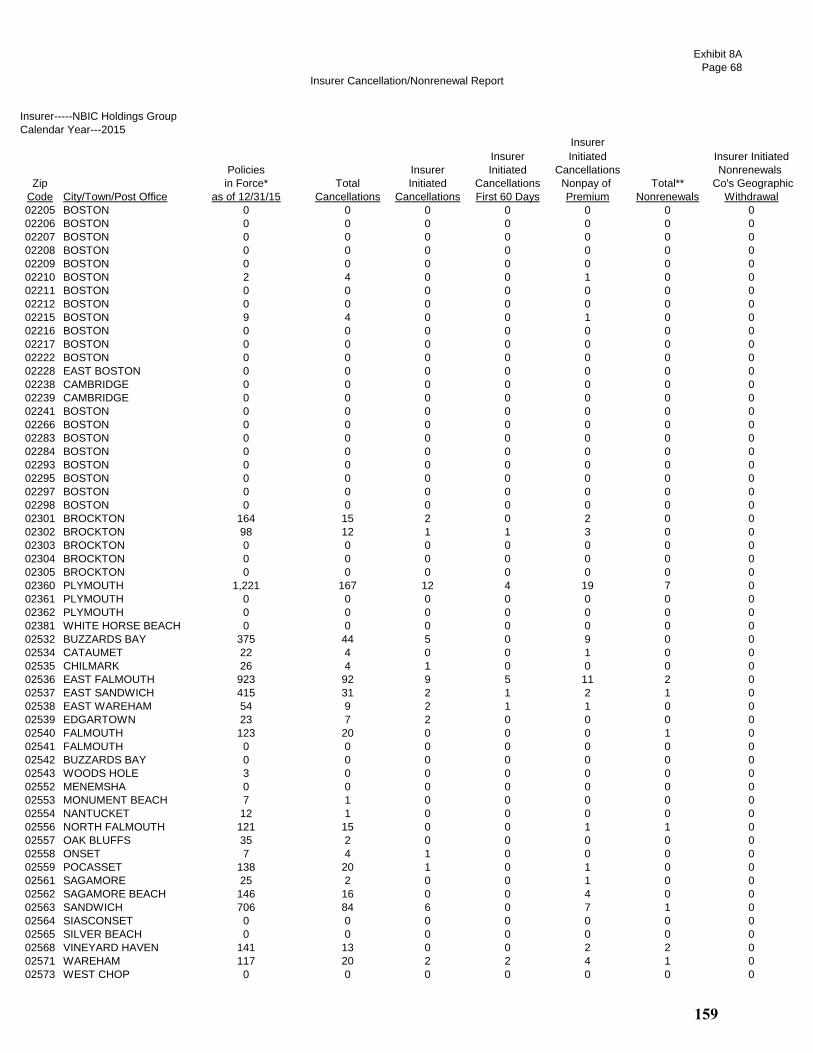
Insurer Cancellation/Nonrenewal Report
Exhibit 8A
Page 68
Insurer-----NBIC Holdings Group
Calendar Year---2015Insurer
Insurer Initiated Insurer Initiated
Policies Insurer Initiated Cancellations Nonrenewals
Zip in Force* Total Initiated Cancellations Nonpay of Total** Co's Geographic
Code City/Town/Post Office as of 12/31/15 Cancellations Cancellations First 60 Days Premium Nonrenewals Withdrawal
02205 BOSTON 0 0 0 0 0 0 0
02206 BOSTON 0 0 0 0 0 0 0
02207 BOSTON 0 0 0 0 0 0 0
02208 BOSTON 0 0 0 0 0 0 0
02209 BOSTON 0 0 0 0 0 0 0
02210 BOSTON 2 4 0 0 1 0 0
02211 BOSTON 0 0 0 0 0 0 0
02212 BOSTON 0 0 0 0 0 0 0
02215 BOSTON 9 4 0 0 1 0 0
02216 BOSTON 0 0 0 0 0 0 0
02217 BOSTON 0 0 0 0 0 0 0
02222 BOSTON 0 0 0 0 0 0 0
02228 EAST BOSTON 0 0 0 0 0 0 0
02238 CAMBRIDGE 0 0 0 0 0 0 0
02239 CAMBRIDGE 0 0 0 0 0 0 0
02241 BOSTON 0 0 0 0 0 0 0
02266 BOSTON 0 0 0 0 0 0 0
02283 BOSTON 0 0 0 0 0 0 0
02284 BOSTON 0 0 0 0 0 0 0
02293 BOSTON 0 0 0 0 0 0 0
02295 BOSTON 0 0 0 0 0 0 0
02297 BOSTON 0 0 0 0 0 0 0
02298 BOSTON 0 0 0 0 0 0 0
02301 BROCKTON 164 15 2 0 2 0 0
02302 BROCKTON 98 12 1 1 3 0 0
02303 BROCKTON 0 0 0 0 0 0 0
02304 BROCKTON 0 0 0 0 0 0 0
02305 BROCKTON 0 0 0 0 0 0 0
02360 PLYMOUTH 1,221 167 12 4 19 7 0
02361 PLYMOUTH 0 0 0 0 0 0 0
02362 PLYMOUTH 0 0 0 0 0 0 0
02381 WHITE HORSE BEACH 0 0 0 0 0 0 0
02532 BUZZARDS BAY 375 44 5 0 9 0 0
02534 CATAUMET 22 4 0 0 1 0 0
02535 CHILMARK 26 4 1 0 0 0 0
02536 EAST FALMOUTH 923 92 9 5 11 2 0
02537 EAST SANDWICH 415 31 2 1 2 1 0
02538 EAST WAREHAM 54 9 2 1 1 0 0
02539 EDGARTOWN 23 7 2 0 0 0 0
02540 FALMOUTH 123 20 0 0 0 1 0
02541 FALMOUTH 0 0 0 0 0 0 0
02542 BUZZARDS BAY 0 0 0 0 0 0 0
02543 WOODS HOLE 3 0 0 0 0 0 0
02552 MENEMSHA 0 0 0 0 0 0 0
02553 MONUMENT BEACH 7 1 0 0 0 0 0
02554 NANTUCKET 12 1 0 0 0 0 0
02556 NORTH FALMOUTH 121 15 0 0 1 1 0
02557 OAK BLUFFS 35 2 0 0 0 0 0
02558 ONSET 7 4 1 0 0 0 0
02559 POCASSET 138 20 1 0 1 0 0
02561 SAGAMORE 25 2 0 0 1 0 0
02562 SAGAMORE BEACH 146 16 0 0 4 0 0
02563 SANDWICH 706 84 6 0 7 1 0
02564 SIASCONSET 0 0 0 0 0 0 0
02565 SILVER BEACH 0 0 0 0 0 0 0
02568 VINEYARD HAVEN 141 13 0 0 2 2 0
02571 WAREHAM 117 20 2 2 4 1 0
02573 WEST CHOP 0 0 0 0 0 0 0
159
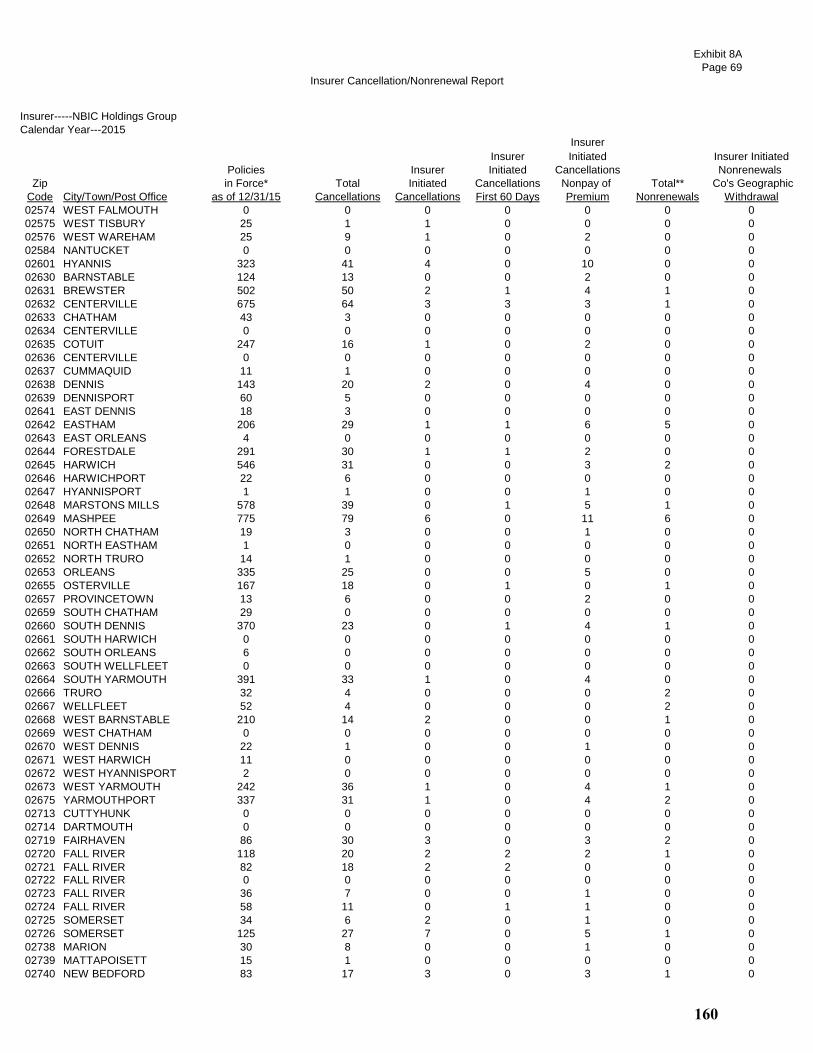
Insurer Cancellation/Nonrenewal Report
Exhibit 8A
Page 69
Insurer-----NBIC Holdings Group
Calendar Year---2015Insurer
Insurer Initiated Insurer Initiated
Policies Insurer Initiated Cancellations Nonrenewals
Zip in Force* Total Initiated Cancellations Nonpay of Total** Co's Geographic
Code City/Town/Post Office as of 12/31/15 Cancellations Cancellations First 60 Days Premium Nonrenewals Withdrawal
02574 WEST FALMOUTH 0 0 0 0 0 0 0
02575 WEST TISBURY 25 1 1 0 0 0 0
02576 WEST WAREHAM 25 9 1 0 2 0 0
02584 NANTUCKET 0 0 0 0 0 0 0
02601 HYANNIS 323 41 4 0 10 0 0
02630 BARNSTABLE 124 13 0 0 2 0 0
02631 BREWSTER 502 50 2 1 4 1 0
02632 CENTERVILLE 675 64 3 3 3 1 0
02633 CHATHAM 43 3 0 0 0 0 0
02634 CENTERVILLE 0 0 0 0 0 0 0
02635 COTUIT 247 16 1 0 2 0 0
02636 CENTERVILLE 0 0 0 0 0 0 0
02637 CUMMAQUID 11 1 0 0 0 0 0
02638 DENNIS 143 20 2 0 4 0 0
02639 DENNISPORT 60 5 0 0 0 0 0
02641 EAST DENNIS 18 3 0 0 0 0 0
02642 EASTHAM 206 29 1 1 6 5 0
02643 EAST ORLEANS 4 0 0 0 0 0 0
02644 FORESTDALE 291 30 1 1 2 0 0
02645 HARWICH 546 31 0 0 3 2 0
02646 HARWICHPORT 22 6 0 0 0 0 0
02647 HYANNISPORT 1 1 0 0 1 0 0
02648 MARSTONS MILLS 578 39 0 1 5 1 0
02649 MASHPEE 775 79 6 0 11 6 0
02650 NORTH CHATHAM 19 3 0 0 1 0 0
02651 NORTH EASTHAM 1 0 0 0 0 0 0
02652 NORTH TRURO 14 1 0 0 0 0 0
02653 ORLEANS 335 25 0 0 5 0 0
02655 OSTERVILLE 167 18 0 1 0 1 0
02657 PROVINCETOWN 13 6 0 0 2 0 0
02659 SOUTH CHATHAM 29 0 0 0 0 0 0
02660 SOUTH DENNIS 370 23 0 1 4 1 0
02661 SOUTH HARWICH 0 0 0 0 0 0 0
02662 SOUTH ORLEANS 6 0 0 0 0 0 0
02663 SOUTH WELLFLEET 0 0 0 0 0 0 0
02664 SOUTH YARMOUTH 391 33 1 0 4 0 0
02666 TRURO 32 4 0 0 0 2 0
02667 WELLFLEET 52 4 0 0 0 2 0
02668 WEST BARNSTABLE 210 14 2 0 0 1 0
02669 WEST CHATHAM 0 0 0 0 0 0 0
02670 WEST DENNIS 22 1 0 0 1 0 0
02671 WEST HARWICH 11 0 0 0 0 0 0
02672 WEST HYANNISPORT 2 0 0 0 0 0 0
02673 WEST YARMOUTH 242 36 1 0 4 1 0
02675 YARMOUTHPORT 337 31 1 0 4 2 0
02713 CUTTYHUNK 0 0 0 0 0 0 0
02714 DARTMOUTH 0 0 0 0 0 0 0
02719 FAIRHAVEN 86 30 3 0 3 2 0
02720 FALL RIVER 118 20 2 2 2 1 0
02721 FALL RIVER 82 18 2 2 0 0 0
02722 FALL RIVER 0 0 0 0 0 0 0
02723 FALL RIVER 36 7 0 0 1 0 0
02724 FALL RIVER 58 11 0 1 1 0 0
02725 SOMERSET 34 6 2 0 1 0 0
02726 SOMERSET 125 27 7 0 5 1 0
02738 MARION 30 8 0 0 1 0 0
02739 MATTAPOISETT 15 1 0 0 0 0 0
02740 NEW BEDFORD 83 17 3 0 3 1 0
160

Insurer Cancellation/Nonrenewal Report
Exhibit 8A
Page 70
Insurer-----NBIC Holdings Group
Calendar Year---2015Insurer
Insurer Initiated Insurer Initiated
Policies Insurer Initiated Cancellations Nonrenewals
Zip in Force* Total Initiated Cancellations Nonpay of Total** Co's Geographic
Code City/Town/Post Office as of 12/31/15 Cancellations Cancellations First 60 Days Premium Nonrenewals Withdrawal
02741 NEW BEDFORD 0 0 0 0 0 0 0
02742 NEW BEDFORD 0 0 0 0 0 0 0
02743 ACUSHNET 36 8 3 0 1 0 0
02744 NEW BEDFORD 4 1 0 1 0 0 0
02745 NEW BEDFORD 49 10 2 0 2 0 0
02746 NEW BEDFORD 9 3 1 0 0 0 0
02747 NORTH DARTMOUTH 82 25 1 0 1 0 0
02748 SOUTH DARTMOUTH 98 16 1 0 1 2 0
02777 SWANSEA 213 30 2 1 2 0 0
02790 WESTPORT 126 23 6 2 2 0 0
02791 WESTPORT POINT 2 0 0 0 0 0 0
All Zip Codes Above Combined 16,092 2,066 170 59 291 79 1
Urban 3,375 647 70 29 121 23 1
Coastal 12,717 1,419 100 30 170 56 0
*The number of policies in force as of December 31 of the 2015 calendar year that were not originally issued in the 2015 calendar year.
** "Total Nonrenewals" does not include "Insurer Initiated Nonrenewals Co's Geographic Withdrawal" totals.
161

Insurer Cancellation/Nonrenewal Report
Exhibit 8A
Page 71
Insurer----New London County Group
Calendar Year---2015
Insurer
Insurer Initiated Insurer Initiated
Policies Insurer Initiated Cancellations Nonrenewals
Zip in Force* Total Initiated Cancellations Nonpay of Total** Co's Geographic
Code City/Town/Post Office as of 12/31/15 Cancellations Cancellations First 60 Days Premium Nonrenewals Withdrawal
01101 SPRINGFIELD 5 0 0 0 0 0 0
01102 SPRINGFIELD 0 0 0 0 0 0 0
01103 SPRINGFIELD 2 0 0 0 0 0 0
01104 SPRINGFIELD 72 13 1 0 1 3 0
01105 SPRINGFIELD 5 2 1 0 0 1 0
01107 SPRINGFIELD 19 3 0 0 1 0 0
01108 SPRINGFIELD 56 17 2 1 4 4 0
01109 SPRINGFIELD 47 10 3 1 1 5 0
01111 SPRINGFIELD 0 0 0 0 0 0 0
01114 SPRINGFIELD 0 0 0 0 0 0 0
01115 SPRINGFIELD 0 0 0 0 0 0 0
01118 SPRINGFIELD 79 17 1 0 2 5 0
01119 SPRINGFIELD 59 11 0 0 2 2 0
01128 SPRINGFIELD 17 4 0 0 2 1 0
01129 SPRINGFIELD 35 9 1 1 0 2 0
01133 SPRINGFIELD 0 0 0 0 0 0 0
01138 SPRINGFIELD 0 0 0 0 0 0 0
01139 SPRINGFIELD 0 0 0 0 0 0 0
01144 SPRINGFIELD 0 0 0 0 0 0 0
01151 INDIAN ORCHARD 39 4 1 0 0 1 0
01152 SPRINGFIELD 0 0 0 0 0 0 0
01199 SPRINGFIELD 0 0 0 0 0 0 0
01601 WORCESTER 1 0 0 0 0 0 0
01602 WORCESTER 47 7 1 0 3 0 0
01603 WORCESTER 23 3 0 0 1 0 0
01604 WORCESTER 25 2 1 0 0 0 0
01605 WORCESTER 32 2 0 0 0 0 0
01606 WORCESTER 40 7 3 0 0 1 0
01607 WORCESTER 7 0 0 0 0 0 0
01608 WORCESTER 1 0 0 0 0 0 0
01609 WORCESTER 14 6 0 0 2 2 0
01610 WORCESTER 5 1 0 0 0 0 0
01611 CHERRY VALLEY 8 2 0 0 1 0 0
01612 PAXTON 11 1 0 0 0 1 0
01613 WORCESTER 0 0 0 0 0 0 0
01614 WORCESTER 0 0 0 0 0 0 0
01615 WORCESTER 0 0 0 0 0 0 0
01653 WORCESTER 0 0 0 0 0 0 0
01654 WORCESTER 0 0 0 0 0 0 0
01655 WORCESTER 0 0 0 0 0 0 0
01840 LAWRENCE 0 0 0 0 0 0 0
01841 LAWRENCE 22 8 0 0 4 1 0
01842 LAWRENCE 2 0 0 0 0 0 0
01843 LAWRENCE 39 16 1 1 1 0 0
01850 LOWELL 37 5 0 0 0 3 0
01851 LOWELL 48 9 0 0 3 1 0
01852 LOWELL 40 14 1 0 2 2 0
01853 LOWELL 4 0 0 0 0 0 0
01854 LOWELL 87 11 2 1 0 1 0
01901 LYNN 1 1 0 0 0 1 0
01902 LYNN 66 10 1 0 0 3 0
01903 LYNN 0 0 0 0 0 0 0
01904 LYNN 107 17 3 0 2 5 0
01905 LYNN 60 15 0 0 4 3 0
01910 LYNN 0 0 0 0 0 0 0
02020 BRANT ROCK 1 0 0 0 0 0 0
02041 GREEN HARBOR 2 0 0 0 0 0 0
02045 HULL 33 14 0 0 2 7 0
162
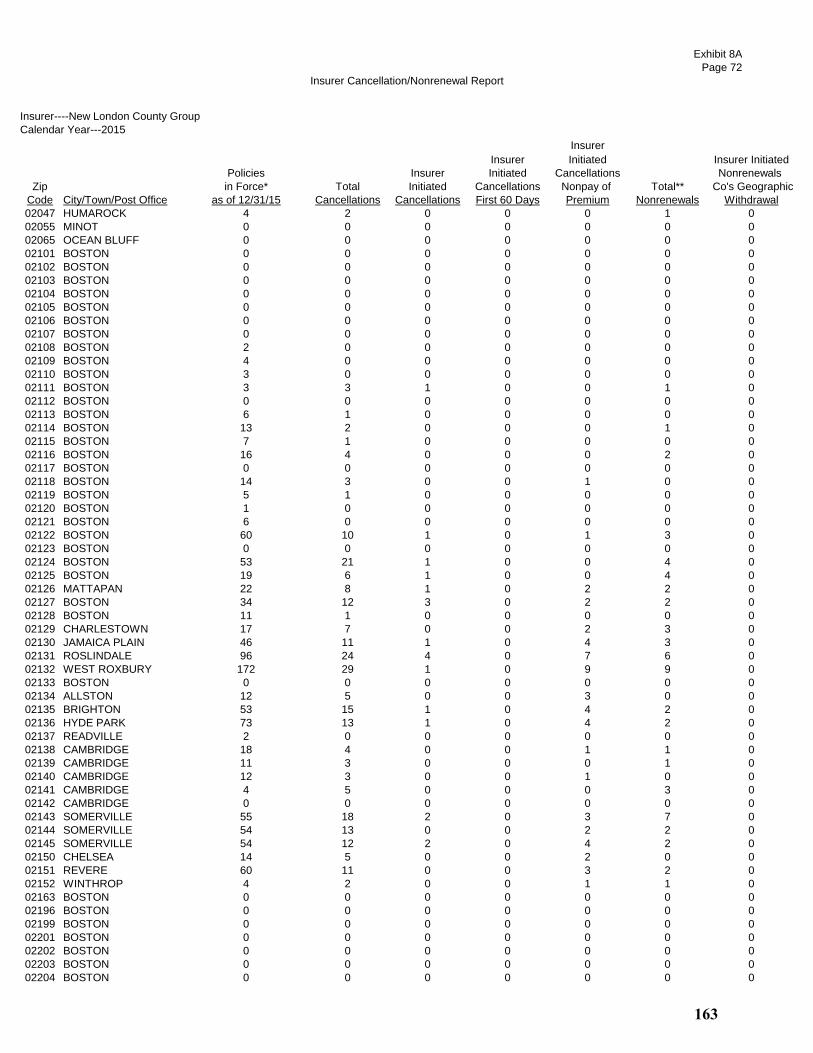
Insurer Cancellation/Nonrenewal Report
Exhibit 8A
Page 72
Insurer----New London County Group
Calendar Year---2015
Insurer
Insurer Initiated Insurer Initiated
Policies Insurer Initiated Cancellations Nonrenewals
Zip in Force* Total Initiated Cancellations Nonpay of Total** Co's Geographic
Code City/Town/Post Office as of 12/31/15 Cancellations Cancellations First 60 Days Premium Nonrenewals Withdrawal
02047 HUMAROCK 4 2 0 0 0 1 0
02055 MINOT 0 0 0 0 0 0 0
02065 OCEAN BLUFF 0 0 0 0 0 0 0
02101 BOSTON 0 0 0 0 0 0 0
02102 BOSTON 0 0 0 0 0 0 0
02103 BOSTON 0 0 0 0 0 0 0
02104 BOSTON 0 0 0 0 0 0 0
02105 BOSTON 0 0 0 0 0 0 0
02106 BOSTON 0 0 0 0 0 0 0
02107 BOSTON 0 0 0 0 0 0 0
02108 BOSTON 2 0 0 0 0 0 0
02109 BOSTON 4 0 0 0 0 0 0
02110 BOSTON 3 0 0 0 0 0 0
02111 BOSTON 3 3 1 0 0 1 0
02112 BOSTON 0 0 0 0 0 0 0
02113 BOSTON 6 1 0 0 0 0 0
02114 BOSTON 13 2 0 0 0 1 0
02115 BOSTON 7 1 0 0 0 0 0
02116 BOSTON 16 4 0 0 0 2 0
02117 BOSTON 0 0 0 0 0 0 0
02118 BOSTON 14 3 0 0 1 0 0
02119 BOSTON 5 1 0 0 0 0 0
02120 BOSTON 1 0 0 0 0 0 0
02121 BOSTON 6 0 0 0 0 0 0
02122 BOSTON 60 10 1 0 1 3 0
02123 BOSTON 0 0 0 0 0 0 0
02124 BOSTON 53 21 1 0 0 4 0
02125 BOSTON 19 6 1 0 0 4 0
02126 MATTAPAN 22 8 1 0 2 2 0
02127 BOSTON 34 12 3 0 2 2 0
02128 BOSTON 11 1 0 0 0 0 0
02129 CHARLESTOWN 17 7 0 0 2 3 0
02130 JAMAICA PLAIN 46 11 1 0 4 3 0
02131 ROSLINDALE 96 24 4 0 7 6 0
02132 WEST ROXBURY 172 29 1 0 9 9 0
02133 BOSTON 0 0 0 0 0 0 0
02134 ALLSTON 12 5 0 0 3 0 0
02135 BRIGHTON 53 15 1 0 4 2 0
02136 HYDE PARK 73 13 1 0 4 2 0
02137 READVILLE 2 0 0 0 0 0 0
02138 CAMBRIDGE 18 4 0 0 1 1 0
02139 CAMBRIDGE 11 3 0 0 0 1 0
02140 CAMBRIDGE 12 3 0 0 1 0 0
02141 CAMBRIDGE 4 5 0 0 0 3 0
02142 CAMBRIDGE 0 0 0 0 0 0 0
02143 SOMERVILLE 55 18 2 0 3 7 0
02144 SOMERVILLE 54 13 0 0 2 2 0
02145 SOMERVILLE 54 12 2 0 4 2 0
02150 CHELSEA 14 5 0 0 2 0 0
02151 REVERE 60 11 0 0 3 2 0
02152 WINTHROP 4 2 0 0 1 1 0
02163 BOSTON 0 0 0 0 0 0 0
02196 BOSTON 0 0 0 0 0 0 0
02199 BOSTON 0 0 0 0 0 0 0
02201 BOSTON 0 0 0 0 0 0 0
02202 BOSTON 0 0 0 0 0 0 0
02203 BOSTON 0 0 0 0 0 0 0
02204 BOSTON 0 0 0 0 0 0 0
163

Insurer Cancellation/Nonrenewal Report
Exhibit 8A
Page 73
Insurer----New London County Group
Calendar Year---2015
Insurer
Insurer Initiated Insurer Initiated
Policies Insurer Initiated Cancellations Nonrenewals
Zip in Force* Total Initiated Cancellations Nonpay of Total** Co's Geographic
Code City/Town/Post Office as of 12/31/15 Cancellations Cancellations First 60 Days Premium Nonrenewals Withdrawal
02205 BOSTON 0 0 0 0 0 0 0
02206 BOSTON 0 0 0 0 0 0 0
02207 BOSTON 0 0 0 0 0 0 0
02208 BOSTON 0 0 0 0 0 0 0
02209 BOSTON 0 0 0 0 0 0 0
02210 BOSTON 0 0 0 0 0 0 0
02211 BOSTON 0 0 0 0 0 0 0
02212 BOSTON 0 0 0 0 0 0 0
02215 BOSTON 12 2 0 0 1 0 0
02216 BOSTON 0 0 0 0 0 0 0
02217 BOSTON 0 0 0 0 0 0 0
02222 BOSTON 0 0 0 0 0 0 0
02228 EAST BOSTON 0 0 0 0 0 0 0
02238 CAMBRIDGE 0 0 0 0 0 0 0
02239 CAMBRIDGE 0 0 0 0 0 0 0
02241 BOSTON 0 0 0 0 0 0 0
02266 BOSTON 0 0 0 0 0 0 0
02283 BOSTON 0 0 0 0 0 0 0
02284 BOSTON 0 0 0 0 0 0 0
02293 BOSTON 0 0 0 0 0 0 0
02295 BOSTON 0 0 0 0 0 0 0
02297 BOSTON 0 0 0 0 0 0 0
02298 BOSTON 0 0 0 0 0 0 0
02301 BROCKTON 596 86 10 0 27 15 0
02302 BROCKTON 451 73 6 3 11 16 0
02303 BROCKTON 2 2 0 0 0 2 0
02304 BROCKTON 1 0 0 0 0 0 0
02305 BROCKTON 0 0 0 0 0 0 0
02360 PLYMOUTH 295 134 1 0 17 67 0
02361 PLYMOUTH 0 0 0 0 0 0 0
02362 PLYMOUTH 0 0 0 0 0 0 0
02381 WHITE HORSE BEACH 0 0 0 0 0 0 0
02532 BUZZARDS BAY 98 23 0 0 7 5 0
02534 CATAUMET 2 1 0 0 0 0 0
02535 CHILMARK 4 0 0 0 0 0 0
02536 EAST FALMOUTH 158 11 0 0 2 5 0
02537 EAST SANDWICH 36 4 1 0 1 1 0
02538 EAST WAREHAM 48 4 0 0 0 3 0
02539 EDGARTOWN 23 5 1 0 1 0 0
02540 FALMOUTH 15 0 0 0 0 0 0
02541 FALMOUTH 0 1 0 0 0 1 0
02542 BUZZARDS BAY 0 0 0 0 0 0 0
02543 WOODS HOLE 0 0 0 0 0 0 0
02552 MENEMSHA 0 0 0 0 0 0 0
02553 MONUMENT BEACH 13 2 0 0 0 0 0
02554 NANTUCKET 6 0 0 0 0 0 0
02556 NORTH FALMOUTH 17 2 0 0 0 1 0
02557 OAK BLUFFS 10 1 0 0 0 0 0
02558 ONSET 5 1 0 0 0 1 0
02559 POCASSET 42 4 1 0 0 0 0
02561 SAGAMORE 9 2 0 0 0 2 0
02562 SAGAMORE BEACH 19 5 0 0 1 2 0
02563 SANDWICH 88 13 0 0 0 3 0
02564 SIASCONSET 0 0 0 0 0 0 0
02565 SILVER BEACH 0 0 0 0 0 0 0
02568 VINEYARD HAVEN 45 6 1 0 1 2 0
02571 WAREHAM 69 16 0 0 0 6 0
02573 WEST CHOP 0 0 0 0 0 0 0
164

Insurer Cancellation/Nonrenewal Report
Exhibit 8A
Page 74
Insurer----New London County Group
Calendar Year---2015
Insurer
Insurer Initiated Insurer Initiated
Policies Insurer Initiated Cancellations Nonrenewals
Zip in Force* Total Initiated Cancellations Nonpay of Total** Co's Geographic
Code City/Town/Post Office as of 12/31/15 Cancellations Cancellations First 60 Days Premium Nonrenewals Withdrawal
02574 WEST FALMOUTH 1 1 0 0 0 0 0
02575 WEST TISBURY 36 5 0 0 0 2 0
02576 WEST WAREHAM 45 3 0 0 0 0 0
02584 NANTUCKET 0 0 0 0 0 0 0
02601 HYANNIS 78 7 0 0 1 0 0
02630 BARNSTABLE 14 1 0 0 0 0 0
02631 BREWSTER 80 7 0 0 0 0 0
02632 CENTERVILLE 101 8 1 0 0 1 0
02633 CHATHAM 5 0 0 0 0 0 0
02634 CENTERVILLE 0 0 0 0 0 0 0
02635 COTUIT 26 0 0 0 0 0 0
02636 CENTERVILLE 0 0 0 0 0 0 0
02637 CUMMAQUID 5 0 0 0 0 0 0
02638 DENNIS 34 8 1 0 0 5 0
02639 DENNISPORT 3 2 0 0 1 1 0
02641 EAST DENNIS 21 6 0 0 0 5 0
02642 EASTHAM 50 6 0 0 1 2 0
02643 EAST ORLEANS 0 0 0 0 0 0 0
02644 FORESTDALE 36 1 0 0 0 1 0
02645 HARWICH 49 5 0 0 0 1 0
02646 HARWICHPORT 0 1 0 0 0 1 0
02647 HYANNISPORT 1 0 0 0 0 0 0
02648 MARSTONS MILLS 99 7 0 0 2 1 0
02649 MASHPEE 99 8 2 0 0 4 0
02650 NORTH CHATHAM 0 1 0 0 0 0 0
02651 NORTH EASTHAM 17 2 0 0 1 0 0
02652 NORTH TRURO 6 1 0 0 1 0 0
02653 ORLEANS 23 1 0 0 1 0 0
02655 OSTERVILLE 12 2 0 0 1 0 0
02657 PROVINCETOWN 7 1 0 0 0 0 0
02659 SOUTH CHATHAM 0 0 0 0 0 0 0
02660 SOUTH DENNIS 34 8 2 0 1 3 0
02661 SOUTH HARWICH 0 0 0 0 0 0 0
02662 SOUTH ORLEANS 0 0 0 0 0 0 0
02663 SOUTH WELLFLEET 10 0 0 0 0 0 0
02664 SOUTH YARMOUTH 45 5 1 0 0 1 0
02666 TRURO 16 9 1 0 0 5 0
02667 WELLFLEET 26 5 1 0 0 2 0
02668 WEST BARNSTABLE 40 3 0 0 0 1 0
02669 WEST CHATHAM 0 0 0 0 0 0 0
02670 WEST DENNIS 3 0 0 0 0 0 0
02671 WEST HARWICH 0 0 0 0 0 0 0
02672 WEST HYANNISPORT 0 0 0 0 0 0 0
02673 WEST YARMOUTH 34 1 0 0 0 0 0
02675 YARMOUTHPORT 39 5 0 0 1 1 0
02713 CUTTYHUNK 0 0 0 0 0 0 0
02714 DARTMOUTH 0 0 0 0 0 0 0
02719 FAIRHAVEN 26 8 1 0 0 4 0
02720 FALL RIVER 61 20 0 0 2 6 0
02721 FALL RIVER 46 17 2 0 1 7 0
02722 FALL RIVER 2 3 0 0 0 2 0
02723 FALL RIVER 20 6 0 0 0 2 0
02724 FALL RIVER 19 11 1 0 0 5 0
02725 SOMERSET 14 1 0 0 0 0 0
02726 SOMERSET 114 25 2 0 1 9 0
02738 MARION 6 6 0 0 1 1 0
02739 MATTAPOISETT 27 6 0 0 0 2 0
02740 NEW BEDFORD 131 20 5 0 0 6 0
165
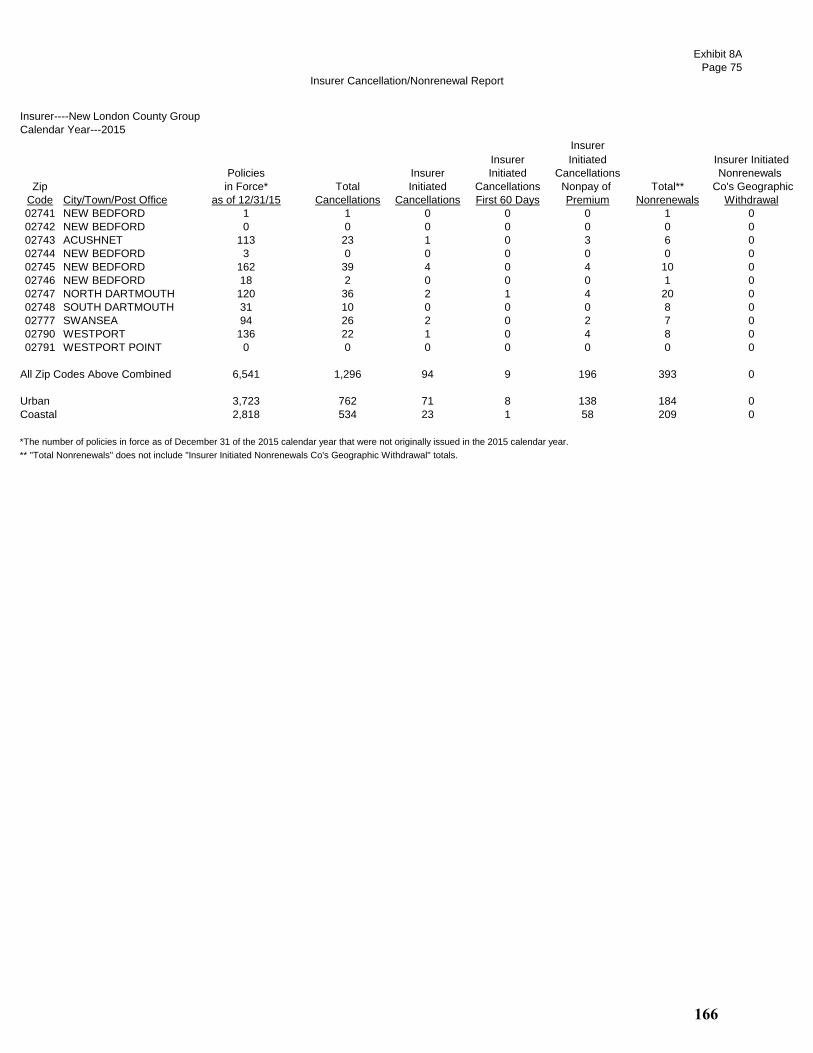
Insurer Cancellation/Nonrenewal Report
Exhibit 8A
Page 75
Insurer----New London County Group
Calendar Year---2015
Insurer
Insurer Initiated Insurer Initiated
Policies Insurer Initiated Cancellations Nonrenewals
Zip in Force* Total Initiated Cancellations Nonpay of Total** Co's Geographic
Code City/Town/Post Office as of 12/31/15 Cancellations Cancellations First 60 Days Premium Nonrenewals Withdrawal
02741 NEW BEDFORD 1 1 0 0 0 1 0
02742 NEW BEDFORD 0 0 0 0 0 0 0
02743 ACUSHNET 113 23 1 0 3 6 0
02744 NEW BEDFORD 3 0 0 0 0 0 0
02745 NEW BEDFORD 162 39 4 0 4 10 0
02746 NEW BEDFORD 18 2 0 0 0 1 0
02747 NORTH DARTMOUTH 120 36 2 1 4 20 0
02748 SOUTH DARTMOUTH 31 10 0 0 0 8 0
02777 SWANSEA 94 26 2 0 2 7 0
02790 WESTPORT 136 22 1 0 4 8 0
02791 WESTPORT POINT 0 0 0 0 0 0 0
All Zip Codes Above Combined 6,541 1,296 94 9 196 393 0
Urban 3,723 762 71 8 138 184 0
Coastal 2,818 534 23 1 58 209 0
*The number of policies in force as of December 31 of the 2015 calendar year that were not originally issued in the 2015 calendar year.
** "Total Nonrenewals" does not include "Insurer Initiated Nonrenewals Co's Geographic Withdrawal" totals.
166

Insurer Cancellation/Nonrenewal Report
Exhibit 8A
Page 76
Insurer---Norfolk & Dedham Group
Calendar Year---2015
Insurer
Insurer Initiated Insurer Initiated
Policies Insurer Initiated Cancellations Nonrenewals
Zip in Force* Total Initiated Cancellations Nonpay of Total** Co's Geographic
Code City/Town/Post Office as of 12/31/15 Cancellations Cancellations First 60 Days Premium Nonrenewals Withdrawal
01101 SPRINGFIELD 1 1 1 0 0 1 0
01102 SPRINGFIELD 0 0 0 0 0 0 0
01103 SPRINGFIELD 5 0 0 0 0 0 0
01104 SPRINGFIELD 46 5 3 0 1 3 0
01105 SPRINGFIELD 5 0 0 0 0 0 0
01107 SPRINGFIELD 2 1 0 0 0 0 0
01108 SPRINGFIELD 54 2 2 0 0 2 0
01109 SPRINGFIELD 36 2 1 0 0 1 0
01111 SPRINGFIELD 0 0 0 0 0 0 0
01114 SPRINGFIELD 0 0 0 0 0 0 0
01115 SPRINGFIELD 0 0 0 0 0 0 0
01118 SPRINGFIELD 76 7 0 1 2 0 0
01119 SPRINGFIELD 43 1 0 0 0 0 0
01128 SPRINGFIELD 15 1 0 0 0 0 0
01129 SPRINGFIELD 30 2 0 0 0 0 0
01133 SPRINGFIELD 0 0 0 0 0 0 0
01138 SPRINGFIELD 0 0 0 0 0 0 0
01139 SPRINGFIELD 0 0 0 0 0 0 0
01144 SPRINGFIELD 0 0 0 0 0 0 0
01151 INDIAN ORCHARD 13 0 0 0 0 0 0
01152 SPRINGFIELD 0 0 0 0 0 0 0
01199 SPRINGFIELD 0 0 0 0 0 0 0
01601 WORCESTER 0 0 0 0 0 0 0
01602 WORCESTER 61 17 11 0 2 11 0
01603 WORCESTER 19 8 5 0 1 5 0
01604 WORCESTER 46 10 6 0 0 6 0
01605 WORCESTER 34 7 2 0 2 2 0
01606 WORCESTER 44 13 7 0 2 7 0
01607 WORCESTER 15 3 3 0 0 3 0
01608 WORCESTER 3 1 1 0 0 1 0
01609 WORCESTER 23 1 0 0 0 0 0
01610 WORCESTER 8 2 1 0 1 1 0
01611 CHERRY VALLEY 22 1 0 0 0 0 0
01612 PAXTON 19 2 1 0 0 1 0
01613 WORCESTER 0 0 0 0 0 0 0
01614 WORCESTER 0 0 0 0 0 0 0
01615 WORCESTER 0 0 0 0 0 0 0
01653 WORCESTER 0 0 0 0 0 0 0
01654 WORCESTER 0 0 0 0 0 0 0
01655 WORCESTER 0 0 0 0 0 0 0
01840 LAWRENCE 3 6 5 0 0 5 0
01841 LAWRENCE 73 53 40 0 4 40 0
01842 LAWRENCE 1 0 0 0 0 0 0
01843 LAWRENCE 78 37 32 1 0 32 0
01850 LOWELL 46 10 6 0 1 6 0
01851 LOWELL 78 19 15 0 2 15 0
01852 LOWELL 95 29 21 0 1 21 0
01853 LOWELL 4 0 0 0 0 0 0
01854 LOWELL 66 28 22 0 0 22 0
01901 LYNN 10 0 0 0 0 0 0
01902 LYNN 88 13 1 1 4 1 0
01903 LYNN 1 0 0 0 0 0 0
01904 LYNN 64 11 3 0 3 3 0
01905 LYNN 58 12 3 0 0 3 0
01910 LYNN 0 0 0 0 0 0 0
02020 BRANT ROCK 4 0 0 0 0 0 0
02041 GREEN HARBOR 4 0 0 0 0 0 0
02045 HULL 125 19 4 0 2 4 0
167
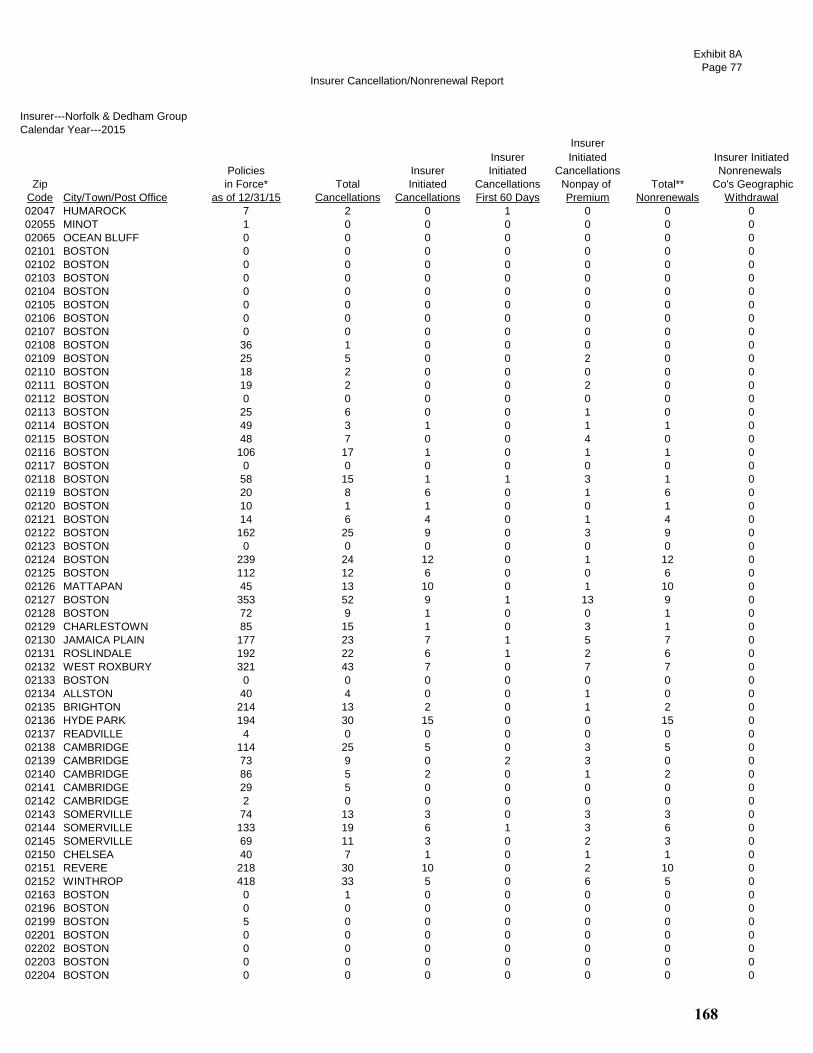
Insurer Cancellation/Nonrenewal Report
Exhibit 8A
Page 77
Insurer---Norfolk & Dedham Group
Calendar Year---2015
Insurer
Insurer Initiated Insurer Initiated
Policies Insurer Initiated Cancellations Nonrenewals
Zip in Force* Total Initiated Cancellations Nonpay of Total** Co's Geographic
Code City/Town/Post Office as of 12/31/15 Cancellations Cancellations First 60 Days Premium Nonrenewals Withdrawal
02047 HUMAROCK 7 2 0 1 0 0 0
02055 MINOT 1 0 0 0 0 0 0
02065 OCEAN BLUFF 0 0 0 0 0 0 0
02101 BOSTON 0 0 0 0 0 0 0
02102 BOSTON 0 0 0 0 0 0 0
02103 BOSTON 0 0 0 0 0 0 0
02104 BOSTON 0 0 0 0 0 0 0
02105 BOSTON 0 0 0 0 0 0 0
02106 BOSTON 0 0 0 0 0 0 0
02107 BOSTON 0 0 0 0 0 0 0
02108 BOSTON 36 1 0 0 0 0 0
02109 BOSTON 25 5 0 0 2 0 0
02110 BOSTON 18 2 0 0 0 0 0
02111 BOSTON 19 2 0 0 2 0 0
02112 BOSTON 0 0 0 0 0 0 0
02113 BOSTON 25 6 0 0 1 0 0
02114 BOSTON 49 3 1 0 1 1 0
02115 BOSTON 48 7 0 0 4 0 0
02116 BOSTON 106 17 1 0 1 1 0
02117 BOSTON 0 0 0 0 0 0 0
02118 BOSTON 58 15 1 1 3 1 0
02119 BOSTON 20 8 6 0 1 6 0
02120 BOSTON 10 1 1 0 0 1 0
02121 BOSTON 14 6 4 0 1 4 0
02122 BOSTON 162 25 9 0 3 9 0
02123 BOSTON 0 0 0 0 0 0 0
02124 BOSTON 239 24 12 0 1 12 0
02125 BOSTON 112 12 6 0 0 6 0
02126 MATTAPAN 45 13 10 0 1 10 0
02127 BOSTON 353 52 9 1 13 9 0
02128 BOSTON 72 9 1 0 0 1 0
02129 CHARLESTOWN 85 15 1 0 3 1 0
02130 JAMAICA PLAIN 177 23 7 1 5 7 0
02131 ROSLINDALE 192 22 6 1 2 6 0
02132 WEST ROXBURY 321 43 7 0 7 7 0
02133 BOSTON 0 0 0 0 0 0 0
02134 ALLSTON 40 4 0 0 1 0 0
02135 BRIGHTON 214 13 2 0 1 2 0
02136 HYDE PARK 194 30 15 0 0 15 0
02137 READVILLE 4 0 0 0 0 0 0
02138 CAMBRIDGE 114 25 5 0 3 5 0
02139 CAMBRIDGE 73 9 0 2 3 0 0
02140 CAMBRIDGE 86 5 2 0 1 2 0
02141 CAMBRIDGE 29 5 0 0 0 0 0
02142 CAMBRIDGE 2 0 0 0 0 0 0
02143 SOMERVILLE 74 13 3 0 3 3 0
02144 SOMERVILLE 133 19 6 1 3 6 0
02145 SOMERVILLE 69 11 3 0 2 3 0
02150 CHELSEA 40 7 1 0 1 1 0
02151 REVERE 218 30 10 0 2 10 0
02152 WINTHROP 418 33 5 0 6 5 0
02163 BOSTON 0 1 0 0 0 0 0
02196 BOSTON 0 0 0 0 0 0 0
02199 BOSTON 5 0 0 0 0 0 0
02201 BOSTON 0 0 0 0 0 0 0
02202 BOSTON 0 0 0 0 0 0 0
02203 BOSTON 0 0 0 0 0 0 0
02204 BOSTON 0 0 0 0 0 0 0
168
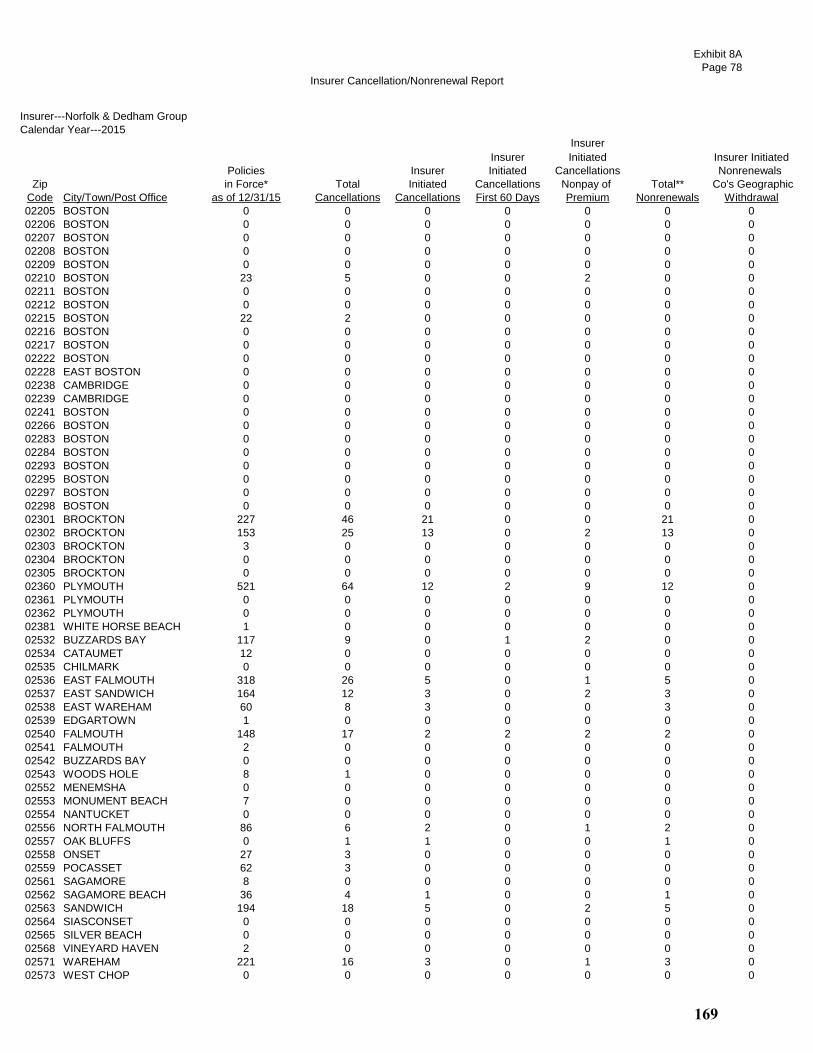
Insurer Cancellation/Nonrenewal Report
Exhibit 8A
Page 78
Insurer---Norfolk & Dedham Group
Calendar Year---2015
Insurer
Insurer Initiated Insurer Initiated
Policies Insurer Initiated Cancellations Nonrenewals
Zip in Force* Total Initiated Cancellations Nonpay of Total** Co's Geographic
Code City/Town/Post Office as of 12/31/15 Cancellations Cancellations First 60 Days Premium Nonrenewals Withdrawal
02205 BOSTON 0 0 0 0 0 0 0
02206 BOSTON 0 0 0 0 0 0 0
02207 BOSTON 0 0 0 0 0 0 0
02208 BOSTON 0 0 0 0 0 0 0
02209 BOSTON 0 0 0 0 0 0 0
02210 BOSTON 23 5 0 0 2 0 0
02211 BOSTON 0 0 0 0 0 0 0
02212 BOSTON 0 0 0 0 0 0 0
02215 BOSTON 22 2 0 0 0 0 0
02216 BOSTON 0 0 0 0 0 0 0
02217 BOSTON 0 0 0 0 0 0 0
02222 BOSTON 0 0 0 0 0 0 0
02228 EAST BOSTON 0 0 0 0 0 0 0
02238 CAMBRIDGE 0 0 0 0 0 0 0
02239 CAMBRIDGE 0 0 0 0 0 0 0
02241 BOSTON 0 0 0 0 0 0 0
02266 BOSTON 0 0 0 0 0 0 0
02283 BOSTON 0 0 0 0 0 0 0
02284 BOSTON 0 0 0 0 0 0 0
02293 BOSTON 0 0 0 0 0 0 0
02295 BOSTON 0 0 0 0 0 0 0
02297 BOSTON 0 0 0 0 0 0 0
02298 BOSTON 0 0 0 0 0 0 0
02301 BROCKTON 227 46 21 0 0 21 0
02302 BROCKTON 153 25 13 0 2 13 0
02303 BROCKTON 3 0 0 0 0 0 0
02304 BROCKTON 0 0 0 0 0 0 0
02305 BROCKTON 0 0 0 0 0 0 0
02360 PLYMOUTH 521 64 12 2 9 12 0
02361 PLYMOUTH 0 0 0 0 0 0 0
02362 PLYMOUTH 0 0 0 0 0 0 0
02381 WHITE HORSE BEACH 1 0 0 0 0 0 0
02532 BUZZARDS BAY 117 9 0 1 2 0 0
02534 CATAUMET 12 0 0 0 0 0 0
02535 CHILMARK 0 0 0 0 0 0 0
02536 EAST FALMOUTH 318 26 5 0 1 5 0
02537 EAST SANDWICH 164 12 3 0 2 3 0
02538 EAST WAREHAM 60 8 3 0 0 3 0
02539 EDGARTOWN 1 0 0 0 0 0 0
02540 FALMOUTH 148 17 2 2 2 2 0
02541 FALMOUTH 2 0 0 0 0 0 0
02542 BUZZARDS BAY 0 0 0 0 0 0 0
02543 WOODS HOLE 8 1 0 0 0 0 0
02552 MENEMSHA 0 0 0 0 0 0 0
02553 MONUMENT BEACH 7 0 0 0 0 0 0
02554 NANTUCKET 0 0 0 0 0 0 0
02556 NORTH FALMOUTH 86 6 2 0 1 2 0
02557 OAK BLUFFS 0 1 1 0 0 1 0
02558 ONSET 27 3 0 0 0 0 0
02559 POCASSET 62 3 0 0 0 0 0
02561 SAGAMORE 8 0 0 0 0 0 0
02562 SAGAMORE BEACH 36 4 1 0 0 1 0
02563 SANDWICH 194 18 5 0 2 5 0
02564 SIASCONSET 0 0 0 0 0 0 0
02565 SILVER BEACH 0 0 0 0 0 0 0
02568 VINEYARD HAVEN 2 0 0 0 0 0 0
02571 WAREHAM 221 16 3 0 1 3 0
02573 WEST CHOP 0 0 0 0 0 0 0
169
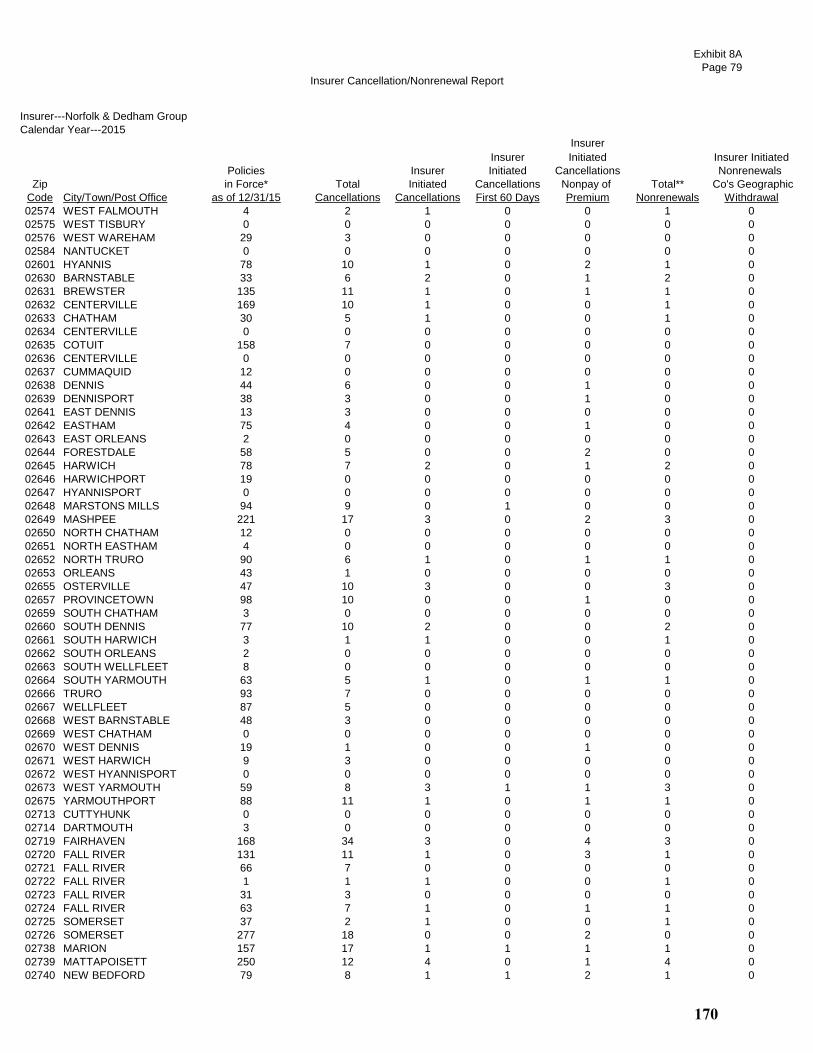
Insurer Cancellation/Nonrenewal Report
Exhibit 8A
Page 79
Insurer---Norfolk & Dedham Group
Calendar Year---2015
Insurer
Insurer Initiated Insurer Initiated
Policies Insurer Initiated Cancellations Nonrenewals
Zip in Force* Total Initiated Cancellations Nonpay of Total** Co's Geographic
Code City/Town/Post Office as of 12/31/15 Cancellations Cancellations First 60 Days Premium Nonrenewals Withdrawal
02574 WEST FALMOUTH 4 2 1 0 0 1 0
02575 WEST TISBURY 0 0 0 0 0 0 0
02576 WEST WAREHAM 29 3 0 0 0 0 0
02584 NANTUCKET 0 0 0 0 0 0 0
02601 HYANNIS 78 10 1 0 2 1 0
02630 BARNSTABLE 33 6 2 0 1 2 0
02631 BREWSTER 135 11 1 0 1 1 0
02632 CENTERVILLE 169 10 1 0 0 1 0
02633 CHATHAM 30 5 1 0 0 1 0
02634 CENTERVILLE 0 0 0 0 0 0 0
02635 COTUIT 158 7 0 0 0 0 0
02636 CENTERVILLE 0 0 0 0 0 0 0
02637 CUMMAQUID 12 0 0 0 0 0 0
02638 DENNIS 44 6 0 0 1 0 0
02639 DENNISPORT 38 3 0 0 1 0 0
02641 EAST DENNIS 13 3 0 0 0 0 0
02642 EASTHAM 75 4 0 0 1 0 0
02643 EAST ORLEANS 2 0 0 0 0 0 0
02644 FORESTDALE 58 5 0 0 2 0 0
02645 HARWICH 78 7 2 0 1 2 0
02646 HARWICHPORT 19 0 0 0 0 0 0
02647 HYANNISPORT 0 0 0 0 0 0 0
02648 MARSTONS MILLS 94 9 0 1 0 0 0
02649 MASHPEE 221 17 3 0 2 3 0
02650 NORTH CHATHAM 12 0 0 0 0 0 0
02651 NORTH EASTHAM 4 0 0 0 0 0 0
02652 NORTH TRURO 90 6 1 0 1 1 0
02653 ORLEANS 43 1 0 0 0 0 0
02655 OSTERVILLE 47 10 3 0 0 3 0
02657 PROVINCETOWN 98 10 0 0 1 0 0
02659 SOUTH CHATHAM 3 0 0 0 0 0 0
02660 SOUTH DENNIS 77 10 2 0 0 2 0
02661 SOUTH HARWICH 3 1 1 0 0 1 0
02662 SOUTH ORLEANS 2 0 0 0 0 0 0
02663 SOUTH WELLFLEET 8 0 0 0 0 0 0
02664 SOUTH YARMOUTH 63 5 1 0 1 1 0
02666 TRURO 93 7 0 0 0 0 0
02667 WELLFLEET 87 5 0 0 0 0 0
02668 WEST BARNSTABLE 48 3 0 0 0 0 0
02669 WEST CHATHAM 0 0 0 0 0 0 0
02670 WEST DENNIS 19 1 0 0 1 0 0
02671 WEST HARWICH 9 3 0 0 0 0 0
02672 WEST HYANNISPORT 0 0 0 0 0 0 0
02673 WEST YARMOUTH 59 8 3 1 1 3 0
02675 YARMOUTHPORT 88 11 1 0 1 1 0
02713 CUTTYHUNK 0 0 0 0 0 0 0
02714 DARTMOUTH 3 0 0 0 0 0 0
02719 FAIRHAVEN 168 34 3 0 4 3 0
02720 FALL RIVER 131 11 1 0 3 1 0
02721 FALL RIVER 66 7 0 0 0 0 0
02722 FALL RIVER 1 1 1 0 0 1 0
02723 FALL RIVER 31 3 0 0 0 0 0
02724 FALL RIVER 63 7 1 0 1 1 0
02725 SOMERSET 37 2 1 0 0 1 0
02726 SOMERSET 277 18 0 0 2 0 0
02738 MARION 157 17 1 1 1 1 0
02739 MATTAPOISETT 250 12 4 0 1 4 0
02740 NEW BEDFORD 79 8 1 1 2 1 0
170

Insurer Cancellation/Nonrenewal Report
Exhibit 8A
Page 80
Insurer---Norfolk & Dedham Group
Calendar Year---2015
Insurer
Insurer Initiated Insurer Initiated
Policies Insurer Initiated Cancellations Nonrenewals
Zip in Force* Total Initiated Cancellations Nonpay of Total** Co's Geographic
Code City/Town/Post Office as of 12/31/15 Cancellations Cancellations First 60 Days Premium Nonrenewals Withdrawal
02741 NEW BEDFORD 0 0 0 0 0 0 0
02742 NEW BEDFORD 0 0 0 0 0 0 0
02743 ACUSHNET 47 4 1 0 1 1 0
02744 NEW BEDFORD 8 1 0 0 0 0 0
02745 NEW BEDFORD 80 8 1 0 0 1 0
02746 NEW BEDFORD 13 2 0 0 0 0 0
02747 NORTH DARTMOUTH 73 10 1 0 2 1 0
02748 SOUTH DARTMOUTH 119 15 2 1 2 2 0
02777 SWANSEA 223 10 0 0 0 0 0
02790 WESTPORT 182 12 3 1 0 3 0
02791 WESTPORT POINT 3 2 0 0 0 0 0
All Zip Codes Above Combined 11,902 1,481 446 22 166 446 0
Urban 6,084 947 365 11 113 365 0
Coastal 5,818 534 81 11 53 81 0
*The number of policies in force as of December 31 of the 2015 calendar year that were not originally issued in the 2015 calendar year.
** "Total Nonrenewals" does not include "Insurer Initiated Nonrenewals Co's Geographic Withdrawal" totals.
171

Insurer Cancellation/Nonrenewal Report
Exhibit 8A
Page 81
Insurer-----Plymouth Rock Insurance Group
Calendar Year---2015Insurer
Insurer Initiated Insurer Initiated
Policies Insurer Initiated Cancellations Nonrenewals
Zip in Force* Total Initiated Cancellations Nonpay of Total** Co's Geographic
Code City/Town/Post Office as of 12/31/15 Cancellations Cancellations First 60 Days Premium Nonrenewals Withdrawal
01101 SPRINGFIELD 1 0 0 0 0 0 0
01102 SPRINGFIELD 0 0 0 0 0 0 0
01103 SPRINGFIELD 5 1 0 0 1 0 0
01104 SPRINGFIELD 148 30 0 0 3 3 0
01105 SPRINGFIELD 9 2 1 0 1 0 0
01107 SPRINGFIELD 14 2 0 0 0 0 0
01108 SPRINGFIELD 102 17 2 2 1 1 0
01109 SPRINGFIELD 61 10 0 0 2 0 0
01111 SPRINGFIELD 0 0 0 0 0 0 0
01114 SPRINGFIELD 0 0 0 0 0 0 0
01115 SPRINGFIELD 0 0 0 0 0 0 0
01118 SPRINGFIELD 115 22 2 2 2 0 0
01119 SPRINGFIELD 70 12 0 1 0 1 0
01128 SPRINGFIELD 24 4 2 0 2 1 0
01129 SPRINGFIELD 59 8 0 0 3 1 0
01133 SPRINGFIELD 0 0 0 0 0 0 0
01138 SPRINGFIELD 0 0 0 0 0 0 0
01139 SPRINGFIELD 0 0 0 0 0 0 0
01144 SPRINGFIELD 0 0 0 0 0 0 0
01151 INDIAN ORCHARD 19 6 0 0 0 1 0
01152 SPRINGFIELD 0 0 0 0 0 0 0
01199 SPRINGFIELD 0 0 0 0 0 0 0
01601 WORCESTER 0 1 0 0 0 0 0
01602 WORCESTER 134 32 1 2 3 1 0
01603 WORCESTER 79 18 0 3 2 0 0
01604 WORCESTER 177 41 2 3 8 2 0
01605 WORCESTER 76 20 1 0 1 0 0
01606 WORCESTER 147 26 3 3 2 0 0
01607 WORCESTER 38 8 0 0 1 2 0
01608 WORCESTER 4 3 1 0 0 0 0
01609 WORCESTER 46 16 0 1 4 0 0
01610 WORCESTER 27 9 0 0 1 0 0
01611 CHERRY VALLEY 14 1 0 0 1 0 0
01612 PAXTON 28 4 0 0 0 0 0
01613 WORCESTER 1 0 0 0 0 0 0
01614 WORCESTER 0 0 0 0 0 0 0
01615 WORCESTER 0 0 0 0 0 0 0
01653 WORCESTER 0 0 0 0 0 0 0
01654 WORCESTER 0 0 0 0 0 0 0
01655 WORCESTER 0 0 0 0 0 0 0
01840 LAWRENCE 0 0 0 0 0 0 0
01841 LAWRENCE 75 24 0 2 2 2 0
01842 LAWRENCE 0 0 0 0 0 0 0
01843 LAWRENCE 86 21 2 1 4 1 0
01850 LOWELL 99 15 0 1 2 0 0
01851 LOWELL 122 31 2 2 4 4 0
01852 LOWELL 165 28 1 2 1 2 0
01853 LOWELL 0 0 0 0 0 0 0
01854 LOWELL 98 16 2 0 2 1 0
01901 LYNN 3 1 0 0 1 0 0
01902 LYNN 229 40 3 2 7 1 0
01903 LYNN 0 0 0 0 0 0 0
01904 LYNN 250 50 3 2 3 6 0
01905 LYNN 154 30 2 3 2 1 0
01910 LYNN 0 0 0 0 0 0 0
02020 BRANT ROCK 0 0 0 0 0 0 0
02041 GREEN HARBOR 1 1 0 0 0 0 0
02045 HULL 3 2 0 1 0 0 0
172

Insurer Cancellation/Nonrenewal Report
Exhibit 8A
Page 82
Insurer-----Plymouth Rock Insurance Group
Calendar Year---2015Insurer
Insurer Initiated Insurer Initiated
Policies Insurer Initiated Cancellations Nonrenewals
Zip in Force* Total Initiated Cancellations Nonpay of Total** Co's Geographic
Code City/Town/Post Office as of 12/31/15 Cancellations Cancellations First 60 Days Premium Nonrenewals Withdrawal
02047 HUMAROCK 0 0 0 0 0 0 0
02055 MINOT 0 0 0 0 0 0 0
02065 OCEAN BLUFF 0 0 0 0 0 0 0
02101 BOSTON 0 0 0 0 0 0 0
02102 BOSTON 0 0 0 0 0 0 0
02103 BOSTON 0 0 0 0 0 0 0
02104 BOSTON 0 0 0 0 0 0 0
02105 BOSTON 0 0 0 0 0 0 0
02106 BOSTON 0 0 0 0 0 0 0
02107 BOSTON 0 0 0 0 0 0 0
02108 BOSTON 6 3 0 0 1 0 0
02109 BOSTON 8 6 0 0 1 0 0
02110 BOSTON 1 4 0 1 1 0 0
02111 BOSTON 5 9 0 0 4 0 0
02112 BOSTON 0 0 0 0 0 0 0
02113 BOSTON 15 6 1 0 2 0 0
02114 BOSTON 21 7 0 0 3 0 0
02115 BOSTON 31 10 1 0 4 0 0
02116 BOSTON 46 7 0 0 3 0 0
02117 BOSTON 0 0 0 0 0 0 0
02118 BOSTON 30 11 0 1 4 1 0
02119 BOSTON 15 11 0 0 2 0 0
02120 BOSTON 3 1 0 0 1 0 0
02121 BOSTON 13 4 0 1 2 0 0
02122 BOSTON 45 13 0 1 4 2 0
02123 BOSTON 0 0 0 0 0 0 0
02124 BOSTON 79 23 0 1 6 1 0
02125 BOSTON 50 16 1 2 4 1 0
02126 MATTAPAN 23 4 0 0 0 0 0
02127 BOSTON 112 41 0 4 4 1 0
02128 BOSTON 79 16 0 0 2 3 0
02129 CHARLESTOWN 83 21 1 0 5 0 0
02130 JAMAICA PLAIN 119 17 1 1 5 0 0
02131 ROSLINDALE 103 23 0 1 3 1 0
02132 WEST ROXBURY 121 19 1 0 1 0 0
02133 BOSTON 0 0 0 0 0 0 0
02134 ALLSTON 33 10 0 0 5 0 0
02135 BRIGHTON 103 28 0 0 9 1 0
02136 HYDE PARK 96 21 0 1 1 2 0
02137 READVILLE 0 0 0 0 0 0 0
02138 CAMBRIDGE 52 11 1 1 2 0 0
02139 CAMBRIDGE 49 12 0 0 1 2 0
02140 CAMBRIDGE 44 8 0 1 2 0 0
02141 CAMBRIDGE 31 5 0 1 2 0 0
02142 CAMBRIDGE 3 1 1 0 0 0 0
02143 SOMERVILLE 67 13 0 1 1 1 0
02144 SOMERVILLE 56 14 1 0 4 0 0
02145 SOMERVILLE 73 21 3 1 1 0 0
02150 CHELSEA 68 21 2 3 3 0 0
02151 REVERE 530 144 2 8 5 5 0
02152 WINTHROP 188 27 0 1 2 3 0
02163 BOSTON 0 0 0 0 0 0 0
02196 BOSTON 0 0 0 0 0 0 0
02199 BOSTON 2 1 0 0 0 0 0
02201 BOSTON 0 0 0 0 0 0 0
02202 BOSTON 0 0 0 0 0 0 0
02203 BOSTON 0 0 0 0 0 0 0
02204 BOSTON 0 0 0 0 0 0 0
173

Insurer Cancellation/Nonrenewal Report
Exhibit 8A
Page 83
Insurer-----Plymouth Rock Insurance Group
Calendar Year---2015Insurer
Insurer Initiated Insurer Initiated
Policies Insurer Initiated Cancellations Nonrenewals
Zip in Force* Total Initiated Cancellations Nonpay of Total** Co's Geographic
Code City/Town/Post Office as of 12/31/15 Cancellations Cancellations First 60 Days Premium Nonrenewals Withdrawal
02205 BOSTON 0 0 0 0 0 0 0
02206 BOSTON 0 0 0 0 0 0 0
02207 BOSTON 0 0 0 0 0 0 0
02208 BOSTON 0 0 0 0 0 0 0
02209 BOSTON 0 0 0 0 0 0 0
02210 BOSTON 9 7 0 0 1 0 0
02211 BOSTON 0 0 0 0 0 0 0
02212 BOSTON 0 0 0 0 0 0 0
02215 BOSTON 17 8 0 1 6 0 0
02216 BOSTON 0 0 0 0 0 0 0
02217 BOSTON 0 0 0 0 0 0 0
02222 BOSTON 0 0 0 0 0 0 0
02228 EAST BOSTON 0 0 0 0 0 0 0
02238 CAMBRIDGE 0 0 0 0 0 0 0
02239 CAMBRIDGE 0 0 0 0 0 0 0
02241 BOSTON 0 0 0 0 0 0 0
02266 BOSTON 0 0 0 0 0 0 0
02283 BOSTON 0 0 0 0 0 0 0
02284 BOSTON 0 0 0 0 0 0 0
02293 BOSTON 0 0 0 0 0 0 0
02295 BOSTON 0 0 0 0 0 0 0
02297 BOSTON 0 0 0 0 0 0 0
02298 BOSTON 0 0 0 0 0 0 0
02301 BROCKTON 377 73 4 2 6 2 0
02302 BROCKTON 188 42 1 0 3 5 0
02303 BROCKTON 0 0 0 0 0 0 0
02304 BROCKTON 0 0 0 0 0 0 0
02305 BROCKTON 0 0 0 0 0 0 0
02360 PLYMOUTH 267 50 3 1 4 1 0
02361 PLYMOUTH 0 0 0 0 0 0 0
02362 PLYMOUTH 0 0 0 0 0 0 0
02381 WHITE HORSE BEACH 0 0 0 0 0 0 0
02532 BUZZARDS BAY 7 2 0 0 0 0 0
02534 CATAUMET 1 0 0 0 0 0 0
02535 CHILMARK 4 0 0 0 0 0 0
02536 EAST FALMOUTH 16 4 0 0 1 0 0
02537 EAST SANDWICH 13 2 0 0 0 0 0
02538 EAST WAREHAM 11 4 1 0 0 0 0
02539 EDGARTOWN 26 4 0 0 0 0 0
02540 FALMOUTH 4 0 0 0 0 0 0
02541 FALMOUTH 0 0 0 0 0 0 0
02542 BUZZARDS BAY 0 0 0 0 0 0 0
02543 WOODS HOLE 0 0 0 0 0 0 0
02552 MENEMSHA 0 0 0 0 0 0 0
02553 MONUMENT BEACH 0 0 0 0 0 0 0
02554 NANTUCKET 0 0 0 0 0 0 0
02556 NORTH FALMOUTH 1 0 0 0 0 0 0
02557 OAK BLUFFS 21 6 0 0 1 0 0
02558 ONSET 2 1 0 0 0 0 0
02559 POCASSET 4 0 0 0 0 0 0
02561 SAGAMORE 2 0 0 0 0 0 0
02562 SAGAMORE BEACH 6 2 0 0 0 0 0
02563 SANDWICH 7 1 0 0 0 0 0
02564 SIASCONSET 0 0 0 0 0 0 0
02565 SILVER BEACH 0 0 0 0 0 0 0
02568 VINEYARD HAVEN 20 2 0 0 0 0 0
02571 WAREHAM 18 2 0 0 0 0 0
02573 WEST CHOP 0 0 0 0 0 0 0
174
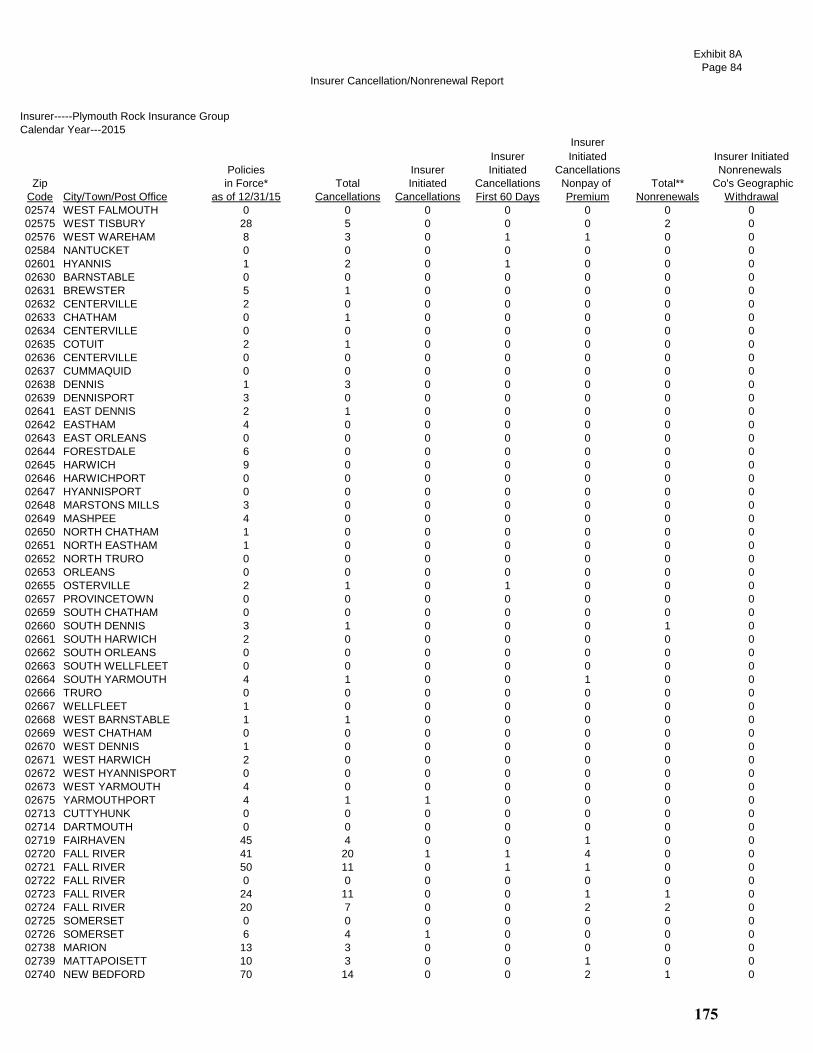
Insurer Cancellation/Nonrenewal Report
Exhibit 8A
Page 84
Insurer-----Plymouth Rock Insurance Group
Calendar Year---2015Insurer
Insurer Initiated Insurer Initiated
Policies Insurer Initiated Cancellations Nonrenewals
Zip in Force* Total Initiated Cancellations Nonpay of Total** Co's Geographic
Code City/Town/Post Office as of 12/31/15 Cancellations Cancellations First 60 Days Premium Nonrenewals Withdrawal
02574 WEST FALMOUTH 0 0 0 0 0 0 0
02575 WEST TISBURY 28 5 0 0 0 2 0
02576 WEST WAREHAM 8 3 0 1 1 0 0
02584 NANTUCKET 0 0 0 0 0 0 0
02601 HYANNIS 1 2 0 1 0 0 0
02630 BARNSTABLE 0 0 0 0 0 0 0
02631 BREWSTER 5 1 0 0 0 0 0
02632 CENTERVILLE 2 0 0 0 0 0 0
02633 CHATHAM 0 1 0 0 0 0 0
02634 CENTERVILLE 0 0 0 0 0 0 0
02635 COTUIT 2 1 0 0 0 0 0
02636 CENTERVILLE 0 0 0 0 0 0 0
02637 CUMMAQUID 0 0 0 0 0 0 0
02638 DENNIS 1 3 0 0 0 0 0
02639 DENNISPORT 3 0 0 0 0 0 0
02641 EAST DENNIS 2 1 0 0 0 0 0
02642 EASTHAM 4 0 0 0 0 0 0
02643 EAST ORLEANS 0 0 0 0 0 0 0
02644 FORESTDALE 6 0 0 0 0 0 0
02645 HARWICH 9 0 0 0 0 0 0
02646 HARWICHPORT 0 0 0 0 0 0 0
02647 HYANNISPORT 0 0 0 0 0 0 0
02648 MARSTONS MILLS 3 0 0 0 0 0 0
02649 MASHPEE 4 0 0 0 0 0 0
02650 NORTH CHATHAM 1 0 0 0 0 0 0
02651 NORTH EASTHAM 1 0 0 0 0 0 0
02652 NORTH TRURO 0 0 0 0 0 0 0
02653 ORLEANS 0 0 0 0 0 0 0
02655 OSTERVILLE 2 1 0 1 0 0 0
02657 PROVINCETOWN 0 0 0 0 0 0 0
02659 SOUTH CHATHAM 0 0 0 0 0 0 0
02660 SOUTH DENNIS 3 1 0 0 0 1 0
02661 SOUTH HARWICH 2 0 0 0 0 0 0
02662 SOUTH ORLEANS 0 0 0 0 0 0 0
02663 SOUTH WELLFLEET 0 0 0 0 0 0 0
02664 SOUTH YARMOUTH 4 1 0 0 1 0 0
02666 TRURO 0 0 0 0 0 0 0
02667 WELLFLEET 1 0 0 0 0 0 0
02668 WEST BARNSTABLE 1 1 0 0 0 0 0
02669 WEST CHATHAM 0 0 0 0 0 0 0
02670 WEST DENNIS 1 0 0 0 0 0 0
02671 WEST HARWICH 2 0 0 0 0 0 0
02672 WEST HYANNISPORT 0 0 0 0 0 0 0
02673 WEST YARMOUTH 4 0 0 0 0 0 0
02675 YARMOUTHPORT 4 1 1 0 0 0 0
02713 CUTTYHUNK 0 0 0 0 0 0 0
02714 DARTMOUTH 0 0 0 0 0 0 0
02719 FAIRHAVEN 45 4 0 0 1 0 0
02720 FALL RIVER 41 20 1 1 4 0 0
02721 FALL RIVER 50 11 0 1 1 0 0
02722 FALL RIVER 0 0 0 0 0 0 0
02723 FALL RIVER 24 11 0 0 1 1 0
02724 FALL RIVER 20 7 0 0 2 2 0
02725 SOMERSET 0 0 0 0 0 0 0
02726 SOMERSET 6 4 1 0 0 0 0
02738 MARION 13 3 0 0 0 0 0
02739 MATTAPOISETT 10 3 0 0 1 0 0
02740 NEW BEDFORD 70 14 0 0 2 1 0
175

Insurer Cancellation/Nonrenewal Report
Exhibit 8A
Page 85
Insurer-----Plymouth Rock Insurance Group
Calendar Year---2015Insurer
Insurer Initiated Insurer Initiated
Policies Insurer Initiated Cancellations Nonrenewals
Zip in Force* Total Initiated Cancellations Nonpay of Total** Co's Geographic
Code City/Town/Post Office as of 12/31/15 Cancellations Cancellations First 60 Days Premium Nonrenewals Withdrawal
02741 NEW BEDFORD 0 0 0 0 0 0 0
02742 NEW BEDFORD 0 0 0 0 0 0 0
02743 ACUSHNET 36 6 0 1 0 0 0
02744 NEW BEDFORD 4 0 0 0 0 1 0
02745 NEW BEDFORD 76 15 2 0 2 1 0
02746 NEW BEDFORD 16 3 0 0 0 0 0
02747 NORTH DARTMOUTH 60 5 1 0 0 1 0
02748 SOUTH DARTMOUTH 58 8 1 0 0 0 0
02777 SWANSEA 1 0 0 0 0 1 0
02790 WESTPORT 12 3 0 0 0 0 0
02791 WESTPORT POINT 0 0 0 0 0 0 0
All Zip Codes Above Combined 6,753 1,510 62 74 204 74 0
Urban 5,974 1,369 54 68 194 68 0
Coastal 779 141 8 6 10 6 0
*The number of policies in force as of December 31 of the 2015 calendar year that were not originally issued in the 2015 calendar year.
** "Total Nonrenewals" does not include "Insurer Initiated Nonrenewals Co's Geographic Withdrawal" totals.
176
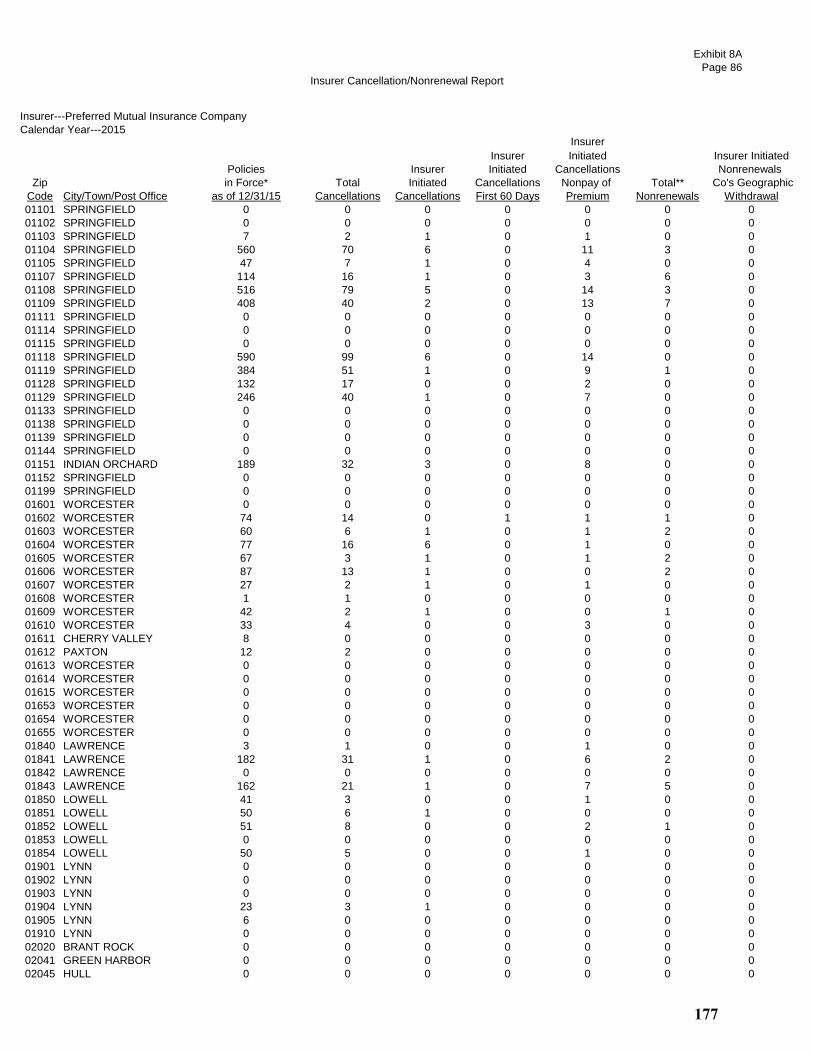
Insurer Cancellation/Nonrenewal Report
Exhibit 8A
Page 86
Insurer---Preferred Mutual Insurance Company
Calendar Year---2015Insurer
Insurer Initiated Insurer Initiated
Policies Insurer Initiated Cancellations Nonrenewals
Zip in Force* Total Initiated Cancellations Nonpay of Total** Co's Geographic
Code City/Town/Post Office as of 12/31/15 Cancellations Cancellations First 60 Days Premium Nonrenewals Withdrawal
01101 SPRINGFIELD 0 0 0 0 0 0 0
01102 SPRINGFIELD 0 0 0 0 0 0 0
01103 SPRINGFIELD 7 2 1 0 1 0 0
01104 SPRINGFIELD 560 70 6 0 11 3 0
01105 SPRINGFIELD 47 7 1 0 4 0 0
01107 SPRINGFIELD 114 16 1 0 3 6 0
01108 SPRINGFIELD 516 79 5 0 14 3 0
01109 SPRINGFIELD 408 40 2 0 13 7 0
01111 SPRINGFIELD 0 0 0 0 0 0 0
01114 SPRINGFIELD 0 0 0 0 0 0 0
01115 SPRINGFIELD 0 0 0 0 0 0 0
01118 SPRINGFIELD 590 99 6 0 14 0 0
01119 SPRINGFIELD 384 51 1 0 9 1 0
01128 SPRINGFIELD 132 17 0 0 2 0 0
01129 SPRINGFIELD 246 40 1 0 7 0 0
01133 SPRINGFIELD 0 0 0 0 0 0 0
01138 SPRINGFIELD 0 0 0 0 0 0 0
01139 SPRINGFIELD 0 0 0 0 0 0 0
01144 SPRINGFIELD 0 0 0 0 0 0 0
01151 INDIAN ORCHARD 189 32 3 0 8 0 0
01152 SPRINGFIELD 0 0 0 0 0 0 0
01199 SPRINGFIELD 0 0 0 0 0 0 0
01601 WORCESTER 0 0 0 0 0 0 0
01602 WORCESTER 74 14 0 1 1 1 0
01603 WORCESTER 60 6 1 0 1 2 0
01604 WORCESTER 77 16 6 0 1 0 0
01605 WORCESTER 67 3 1 0 1 2 0
01606 WORCESTER 87 13 1 0 0 2 0
01607 WORCESTER 27 2 1 0 1 0 0
01608 WORCESTER 1 1 0 0 0 0 0
01609 WORCESTER 42 2 1 0 0 1 0
01610 WORCESTER 33 4 0 0 3 0 0
01611 CHERRY VALLEY 8 0 0 0 0 0 0
01612 PAXTON 12 2 0 0 0 0 0
01613 WORCESTER 0 0 0 0 0 0 0
01614 WORCESTER 0 0 0 0 0 0 0
01615 WORCESTER 0 0 0 0 0 0 0
01653 WORCESTER 0 0 0 0 0 0 0
01654 WORCESTER 0 0 0 0 0 0 0
01655 WORCESTER 0 0 0 0 0 0 0
01840 LAWRENCE 3 1 0 0 1 0 0
01841 LAWRENCE 182 31 1 0 6 2 0
01842 LAWRENCE 0 0 0 0 0 0 0
01843 LAWRENCE 162 21 1 0 7 5 0
01850 LOWELL 41 3 0 0 1 0 0
01851 LOWELL 50 6 1 0 0 0 0
01852 LOWELL 51 8 0 0 2 1 0
01853 LOWELL 0 0 0 0 0 0 0
01854 LOWELL 50 5 0 0 1 0 0
01901 LYNN 0 0 0 0 0 0 0
01902 LYNN 0 0 0 0 0 0 0
01903 LYNN 0 0 0 0 0 0 0
01904 LYNN 23 3 1 0 0 0 0
01905 LYNN 6 0 0 0 0 0 0
01910 LYNN 0 0 0 0 0 0 0
02020 BRANT ROCK 0 0 0 0 0 0 0
02041 GREEN HARBOR 0 0 0 0 0 0 0
02045 HULL 0 0 0 0 0 0 0
177
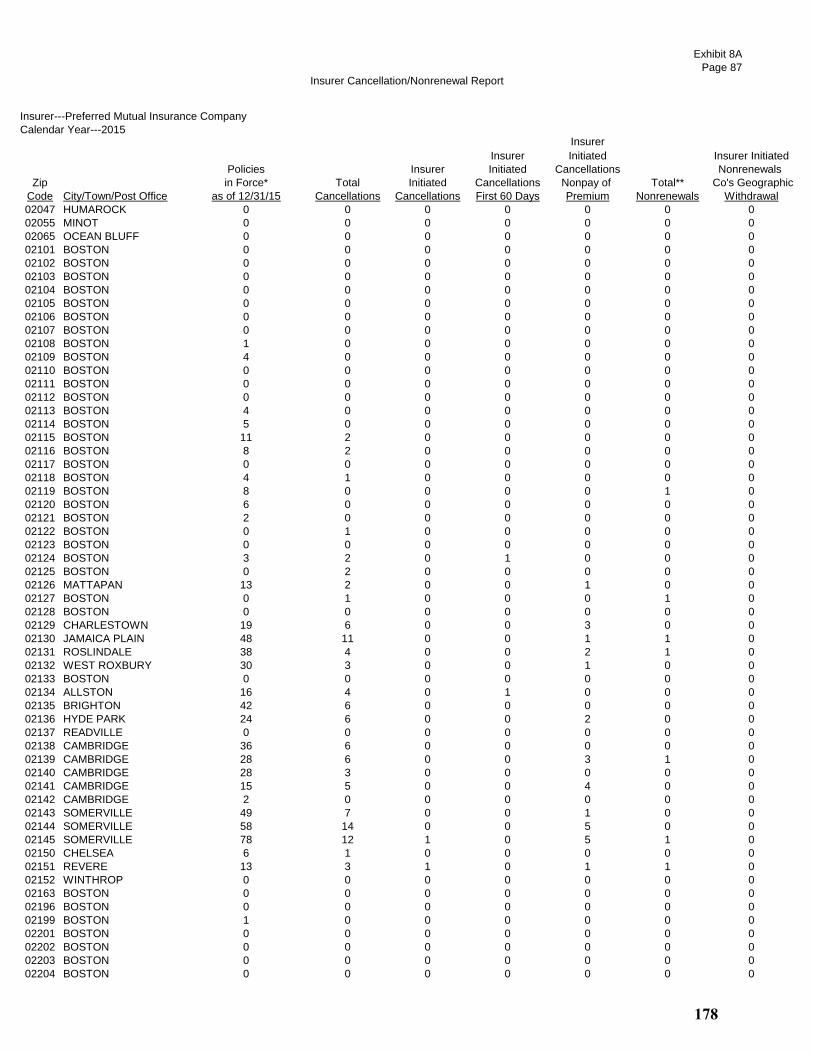
Insurer Cancellation/Nonrenewal Report
Exhibit 8A
Page 87
Insurer---Preferred Mutual Insurance Company
Calendar Year---2015Insurer
Insurer Initiated Insurer Initiated
Policies Insurer Initiated Cancellations Nonrenewals
Zip in Force* Total Initiated Cancellations Nonpay of Total** Co's Geographic
Code City/Town/Post Office as of 12/31/15 Cancellations Cancellations First 60 Days Premium Nonrenewals Withdrawal
02047 HUMAROCK 0 0 0 0 0 0 0
02055 MINOT 0 0 0 0 0 0 0
02065 OCEAN BLUFF 0 0 0 0 0 0 0
02101 BOSTON 0 0 0 0 0 0 0
02102 BOSTON 0 0 0 0 0 0 0
02103 BOSTON 0 0 0 0 0 0 0
02104 BOSTON 0 0 0 0 0 0 0
02105 BOSTON 0 0 0 0 0 0 0
02106 BOSTON 0 0 0 0 0 0 0
02107 BOSTON 0 0 0 0 0 0 0
02108 BOSTON 1 0 0 0 0 0 0
02109 BOSTON 4 0 0 0 0 0 0
02110 BOSTON 0 0 0 0 0 0 0
02111 BOSTON 0 0 0 0 0 0 0
02112 BOSTON 0 0 0 0 0 0 0
02113 BOSTON 4 0 0 0 0 0 0
02114 BOSTON 5 0 0 0 0 0 0
02115 BOSTON 11 2 0 0 0 0 0
02116 BOSTON 8 2 0 0 0 0 0
02117 BOSTON 0 0 0 0 0 0 0
02118 BOSTON 4 1 0 0 0 0 0
02119 BOSTON 8 0 0 0 0 1 0
02120 BOSTON 6 0 0 0 0 0 0
02121 BOSTON 2 0 0 0 0 0 0
02122 BOSTON 0 1 0 0 0 0 0
02123 BOSTON 0 0 0 0 0 0 0
02124 BOSTON 3 2 0 1 0 0 0
02125 BOSTON 0 2 0 0 0 0 0
02126 MATTAPAN 13 2 0 0 1 0 0
02127 BOSTON 0 1 0 0 0 1 0
02128 BOSTON 0 0 0 0 0 0 0
02129 CHARLESTOWN 19 6 0 0 3 0 0
02130 JAMAICA PLAIN 48 11 0 0 1 1 0
02131 ROSLINDALE 38 4 0 0 2 1 0
02132 WEST ROXBURY 30 3 0 0 1 0 0
02133 BOSTON 0 0 0 0 0 0 0
02134 ALLSTON 16 4 0 1 0 0 0
02135 BRIGHTON 42 6 0 0 0 0 0
02136 HYDE PARK 24 6 0 0 2 0 0
02137 READVILLE 0 0 0 0 0 0 0
02138 CAMBRIDGE 36 6 0 0 0 0 0
02139 CAMBRIDGE 28 6 0 0 3 1 0
02140 CAMBRIDGE 28 3 0 0 0 0 0
02141 CAMBRIDGE 15 5 0 0 4 0 0
02142 CAMBRIDGE 2 0 0 0 0 0 0
02143 SOMERVILLE 49 7 0 0 1 0 0
02144 SOMERVILLE 58 14 0 0 5 0 0
02145 SOMERVILLE 78 12 1 0 5 1 0
02150 CHELSEA 6 1 0 0 0 0 0
02151 REVERE 13 3 1 0 1 1 0
02152 WINTHROP 0 0 0 0 0 0 0
02163 BOSTON 0 0 0 0 0 0 0
02196 BOSTON 0 0 0 0 0 0 0
02199 BOSTON 1 0 0 0 0 0 0
02201 BOSTON 0 0 0 0 0 0 0
02202 BOSTON 0 0 0 0 0 0 0
02203 BOSTON 0 0 0 0 0 0 0
02204 BOSTON 0 0 0 0 0 0 0
178
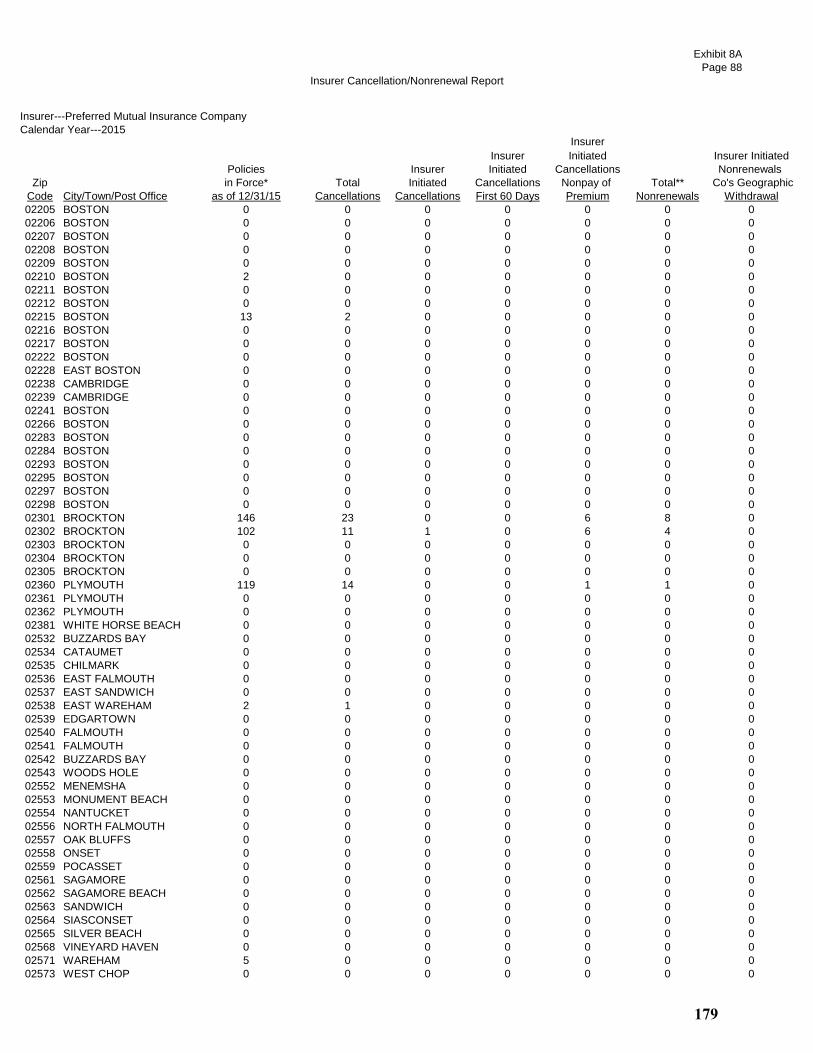
Insurer Cancellation/Nonrenewal Report
Exhibit 8A
Page 88
Insurer---Preferred Mutual Insurance Company
Calendar Year---2015Insurer
Insurer Initiated Insurer Initiated
Policies Insurer Initiated Cancellations Nonrenewals
Zip in Force* Total Initiated Cancellations Nonpay of Total** Co's Geographic
Code City/Town/Post Office as of 12/31/15 Cancellations Cancellations First 60 Days Premium Nonrenewals Withdrawal
02205 BOSTON 0 0 0 0 0 0 0
02206 BOSTON 0 0 0 0 0 0 0
02207 BOSTON 0 0 0 0 0 0 0
02208 BOSTON 0 0 0 0 0 0 0
02209 BOSTON 0 0 0 0 0 0 0
02210 BOSTON 2 0 0 0 0 0 0
02211 BOSTON 0 0 0 0 0 0 0
02212 BOSTON 0 0 0 0 0 0 0
02215 BOSTON 13 2 0 0 0 0 0
02216 BOSTON 0 0 0 0 0 0 0
02217 BOSTON 0 0 0 0 0 0 0
02222 BOSTON 0 0 0 0 0 0 0
02228 EAST BOSTON 0 0 0 0 0 0 0
02238 CAMBRIDGE 0 0 0 0 0 0 0
02239 CAMBRIDGE 0 0 0 0 0 0 0
02241 BOSTON 0 0 0 0 0 0 0
02266 BOSTON 0 0 0 0 0 0 0
02283 BOSTON 0 0 0 0 0 0 0
02284 BOSTON 0 0 0 0 0 0 0
02293 BOSTON 0 0 0 0 0 0 0
02295 BOSTON 0 0 0 0 0 0 0
02297 BOSTON 0 0 0 0 0 0 0
02298 BOSTON 0 0 0 0 0 0 0
02301 BROCKTON 146 23 0 0 6 8 0
02302 BROCKTON 102 11 1 0 6 4 0
02303 BROCKTON 0 0 0 0 0 0 0
02304 BROCKTON 0 0 0 0 0 0 0
02305 BROCKTON 0 0 0 0 0 0 0
02360 PLYMOUTH 119 14 0 0 1 1 0
02361 PLYMOUTH 0 0 0 0 0 0 0
02362 PLYMOUTH 0 0 0 0 0 0 0
02381 WHITE HORSE BEACH 0 0 0 0 0 0 0
02532 BUZZARDS BAY 0 0 0 0 0 0 0
02534 CATAUMET 0 0 0 0 0 0 0
02535 CHILMARK 0 0 0 0 0 0 0
02536 EAST FALMOUTH 0 0 0 0 0 0 0
02537 EAST SANDWICH 0 0 0 0 0 0 0
02538 EAST WAREHAM 2 1 0 0 0 0 0
02539 EDGARTOWN 0 0 0 0 0 0 0
02540 FALMOUTH 0 0 0 0 0 0 0
02541 FALMOUTH 0 0 0 0 0 0 0
02542 BUZZARDS BAY 0 0 0 0 0 0 0
02543 WOODS HOLE 0 0 0 0 0 0 0
02552 MENEMSHA 0 0 0 0 0 0 0
02553 MONUMENT BEACH 0 0 0 0 0 0 0
02554 NANTUCKET 0 0 0 0 0 0 0
02556 NORTH FALMOUTH 0 0 0 0 0 0 0
02557 OAK BLUFFS 0 0 0 0 0 0 0
02558 ONSET 0 0 0 0 0 0 0
02559 POCASSET 0 0 0 0 0 0 0
02561 SAGAMORE 0 0 0 0 0 0 0
02562 SAGAMORE BEACH 0 0 0 0 0 0 0
02563 SANDWICH 0 0 0 0 0 0 0
02564 SIASCONSET 0 0 0 0 0 0 0
02565 SILVER BEACH 0 0 0 0 0 0 0
02568 VINEYARD HAVEN 0 0 0 0 0 0 0
02571 WAREHAM 5 0 0 0 0 0 0
02573 WEST CHOP 0 0 0 0 0 0 0
179

Insurer Cancellation/Nonrenewal Report
Exhibit 8A
Page 89
Insurer---Preferred Mutual Insurance Company
Calendar Year---2015Insurer
Insurer Initiated Insurer Initiated
Policies Insurer Initiated Cancellations Nonrenewals
Zip in Force* Total Initiated Cancellations Nonpay of Total** Co's Geographic
Code City/Town/Post Office as of 12/31/15 Cancellations Cancellations First 60 Days Premium Nonrenewals Withdrawal
02574 WEST FALMOUTH 0 0 0 0 0 0 0
02575 WEST TISBURY 0 0 0 0 0 0 0
02576 WEST WAREHAM 6 2 0 0 0 0 0
02584 NANTUCKET 0 0 0 0 0 0 0
02601 HYANNIS 0 0 0 0 0 0 0
02630 BARNSTABLE 0 0 0 0 0 0 0
02631 BREWSTER 0 0 0 0 0 0 0
02632 CENTERVILLE 0 0 0 0 0 0 0
02633 CHATHAM 0 0 0 0 0 0 0
02634 CENTERVILLE 0 0 0 0 0 0 0
02635 COTUIT 0 0 0 0 0 0 0
02636 CENTERVILLE 0 0 0 0 0 0 0
02637 CUMMAQUID 0 0 0 0 0 0 0
02638 DENNIS 0 0 0 0 0 0 0
02639 DENNISPORT 0 0 0 0 0 0 0
02641 EAST DENNIS 0 0 0 0 0 0 0
02642 EASTHAM 0 0 0 0 0 0 0
02643 EAST ORLEANS 0 0 0 0 0 0 0
02644 FORESTDALE 0 0 0 0 0 0 0
02645 HARWICH 0 0 0 0 0 0 0
02646 HARWICHPORT 0 0 0 0 0 0 0
02647 HYANNISPORT 0 0 0 0 0 0 0
02648 MARSTONS MILLS 0 0 0 0 0 0 0
02649 MASHPEE 0 0 0 0 0 0 0
02650 NORTH CHATHAM 0 0 0 0 0 0 0
02651 NORTH EASTHAM 0 0 0 0 0 0 0
02652 NORTH TRURO 0 0 0 0 0 0 0
02653 ORLEANS 0 0 0 0 0 0 0
02655 OSTERVILLE 0 0 0 0 0 0 0
02657 PROVINCETOWN 0 0 0 0 0 0 0
02659 SOUTH CHATHAM 0 0 0 0 0 0 0
02660 SOUTH DENNIS 0 0 0 0 0 0 0
02661 SOUTH HARWICH 0 0 0 0 0 0 0
02662 SOUTH ORLEANS 0 0 0 0 0 0 0
02663 SOUTH WELLFLEET 0 0 0 0 0 0 0
02664 SOUTH YARMOUTH 0 0 0 0 0 0 0
02666 TRURO 0 0 0 0 0 0 0
02667 WELLFLEET 0 0 0 0 0 0 0
02668 WEST BARNSTABLE 0 0 0 0 0 0 0
02669 WEST CHATHAM 0 0 0 0 0 0 0
02670 WEST DENNIS 0 0 0 0 0 0 0
02671 WEST HARWICH 0 0 0 0 0 0 0
02672 WEST HYANNISPORT 0 0 0 0 0 0 0
02673 WEST YARMOUTH 0 0 0 0 0 0 0
02675 YARMOUTHPORT 0 0 0 0 0 0 0
02713 CUTTYHUNK 0 0 0 0 0 0 0
02714 DARTMOUTH 0 0 0 0 0 0 0
02719 FAIRHAVEN 1 0 0 0 0 0 0
02720 FALL RIVER 94 13 0 0 2 0 0
02721 FALL RIVER 84 12 1 0 2 0 0
02722 FALL RIVER 0 0 0 0 0 0 0
02723 FALL RIVER 39 13 0 0 3 0 0
02724 FALL RIVER 6 4 0 0 2 0 0
02725 SOMERSET 46 2 0 0 0 1 0
02726 SOMERSET 210 27 2 0 4 1 0
02738 MARION 0 0 0 0 0 0 0
02739 MATTAPOISETT 3 0 0 0 0 0 0
02740 NEW BEDFORD 13 2 0 0 0 0 0
180
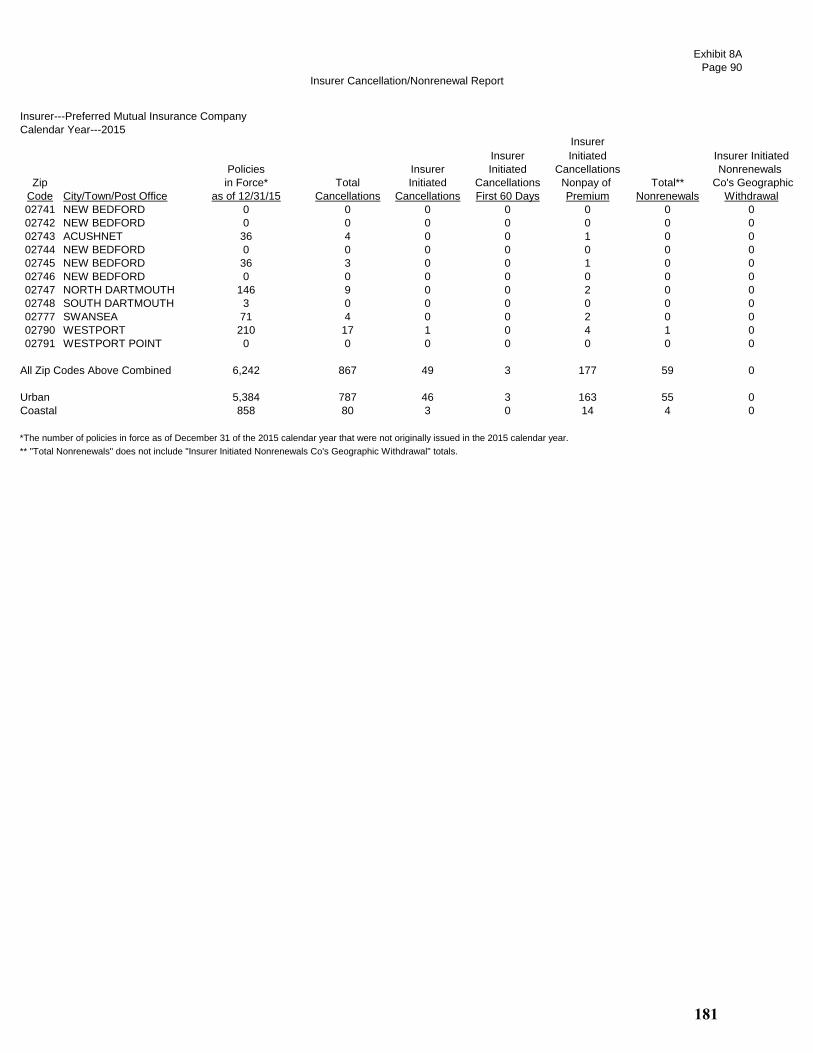
Insurer Cancellation/Nonrenewal Report
Exhibit 8A
Page 90
Insurer---Preferred Mutual Insurance Company
Calendar Year---2015Insurer
Insurer Initiated Insurer Initiated
Policies Insurer Initiated Cancellations Nonrenewals
Zip in Force* Total Initiated Cancellations Nonpay of Total** Co's Geographic
Code City/Town/Post Office as of 12/31/15 Cancellations Cancellations First 60 Days Premium Nonrenewals Withdrawal
02741 NEW BEDFORD 0 0 0 0 0 0 0
02742 NEW BEDFORD 0 0 0 0 0 0 0
02743 ACUSHNET 36 4 0 0 1 0 0
02744 NEW BEDFORD 0 0 0 0 0 0 0
02745 NEW BEDFORD 36 3 0 0 1 0 0
02746 NEW BEDFORD 0 0 0 0 0 0 0
02747 NORTH DARTMOUTH 146 9 0 0 2 0 0
02748 SOUTH DARTMOUTH 3 0 0 0 0 0 0
02777 SWANSEA 71 4 0 0 2 0 0
02790 WESTPORT 210 17 1 0 4 1 0
02791 WESTPORT POINT 0 0 0 0 0 0 0
All Zip Codes Above Combined 6,242 867 49 3 177 59 0
Urban 5,384 787 46 3 163 55 0
Coastal 858 80 3 0 14 4 0
*The number of policies in force as of December 31 of the 2015 calendar year that were not originally issued in the 2015 calendar year.
** "Total Nonrenewals" does not include "Insurer Initiated Nonrenewals Co's Geographic Withdrawal" totals.
181
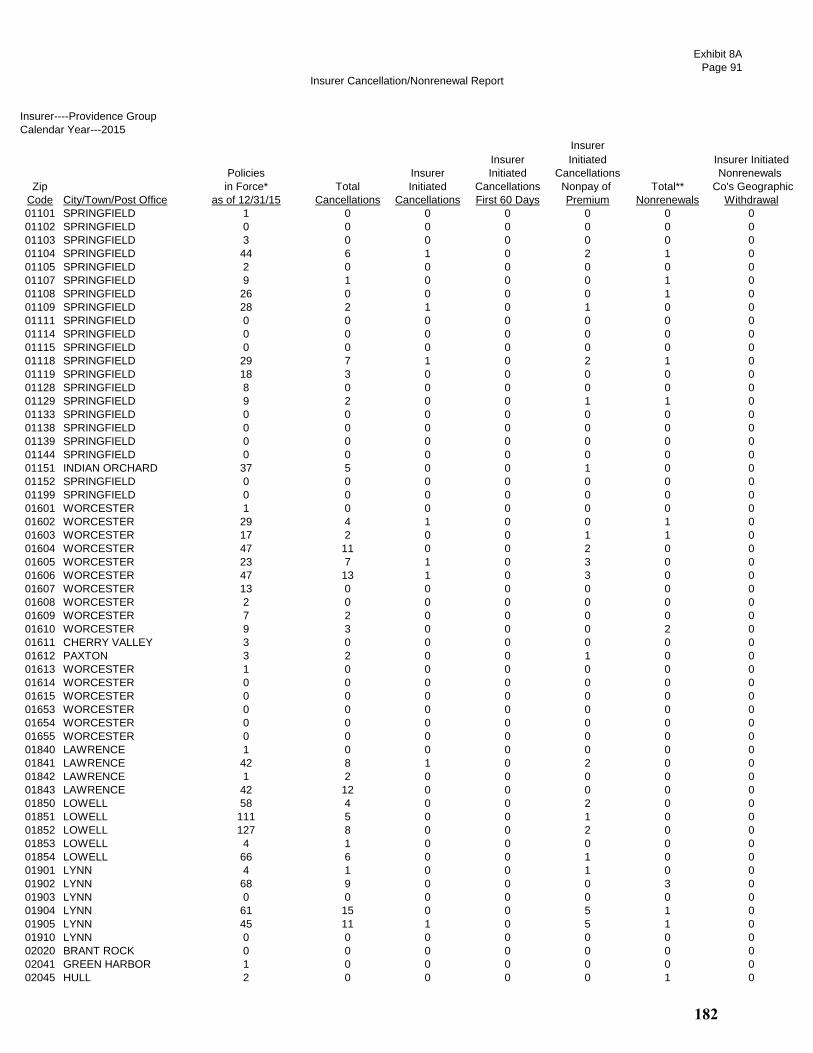
Insurer Cancellation/Nonrenewal Report
Exhibit 8A
Page 91
Insurer----Providence Group
Calendar Year---2015
Insurer
Insurer Initiated Insurer Initiated
Policies Insurer Initiated Cancellations Nonrenewals
Zip in Force* Total Initiated Cancellations Nonpay of Total** Co's Geographic
Code City/Town/Post Office as of 12/31/15 Cancellations Cancellations First 60 Days Premium Nonrenewals Withdrawal
01101 SPRINGFIELD 1 0 0 0 0 0 0
01102 SPRINGFIELD 0 0 0 0 0 0 0
01103 SPRINGFIELD 3 0 0 0 0 0 0
01104 SPRINGFIELD 44 6 1 0 2 1 0
01105 SPRINGFIELD 2 0 0 0 0 0 0
01107 SPRINGFIELD 9 1 0 0 0 1 0
01108 SPRINGFIELD 26 0 0 0 0 1 0
01109 SPRINGFIELD 28 2 1 0 1 0 0
01111 SPRINGFIELD 0 0 0 0 0 0 0
01114 SPRINGFIELD 0 0 0 0 0 0 0
01115 SPRINGFIELD 0 0 0 0 0 0 0
01118 SPRINGFIELD 29 7 1 0 2 1 0
01119 SPRINGFIELD 18 3 0 0 0 0 0
01128 SPRINGFIELD 8 0 0 0 0 0 0
01129 SPRINGFIELD 9 2 0 0 1 1 0
01133 SPRINGFIELD 0 0 0 0 0 0 0
01138 SPRINGFIELD 0 0 0 0 0 0 0
01139 SPRINGFIELD 0 0 0 0 0 0 0
01144 SPRINGFIELD 0 0 0 0 0 0 0
01151 INDIAN ORCHARD 37 5 0 0 1 0 0
01152 SPRINGFIELD 0 0 0 0 0 0 0
01199 SPRINGFIELD 0 0 0 0 0 0 0
01601 WORCESTER 1 0 0 0 0 0 0
01602 WORCESTER 29 4 1 0 0 1 0
01603 WORCESTER 17 2 0 0 1 1 0
01604 WORCESTER 47 11 0 0 2 0 0
01605 WORCESTER 23 7 1 0 3 0 0
01606 WORCESTER 47 13 1 0 3 0 0
01607 WORCESTER 13 0 0 0 0 0 0
01608 WORCESTER 2 0 0 0 0 0 0
01609 WORCESTER 7 2 0 0 0 0 0
01610 WORCESTER 9 3 0 0 0 2 0
01611 CHERRY VALLEY 3 0 0 0 0 0 0
01612 PAXTON 3 2 0 0 1 0 0
01613 WORCESTER 1 0 0 0 0 0 0
01614 WORCESTER 0 0 0 0 0 0 0
01615 WORCESTER 0 0 0 0 0 0 0
01653 WORCESTER 0 0 0 0 0 0 0
01654 WORCESTER 0 0 0 0 0 0 0
01655 WORCESTER 0 0 0 0 0 0 0
01840 LAWRENCE 1 0 0 0 0 0 0
01841 LAWRENCE 42 8 1 0 2 0 0
01842 LAWRENCE 1 2 0 0 0 0 0
01843 LAWRENCE 42 12 0 0 0 0 0
01850 LOWELL 58 4 0 0 2 0 0
01851 LOWELL 111 5 0 0 1 0 0
01852 LOWELL 127 8 0 0 2 0 0
01853 LOWELL 4 1 0 0 0 0 0
01854 LOWELL 66 6 0 0 1 0 0
01901 LYNN 4 1 0 0 1 0 0
01902 LYNN 68 9 0 0 0 3 0
01903 LYNN 0 0 0 0 0 0 0
01904 LYNN 61 15 0 0 5 1 0
01905 LYNN 45 11 1 0 5 1 0
01910 LYNN 0 0 0 0 0 0 0
02020 BRANT ROCK 0 0 0 0 0 0 0
02041 GREEN HARBOR 1 0 0 0 0 0 0
02045 HULL 2 0 0 0 0 1 0
182
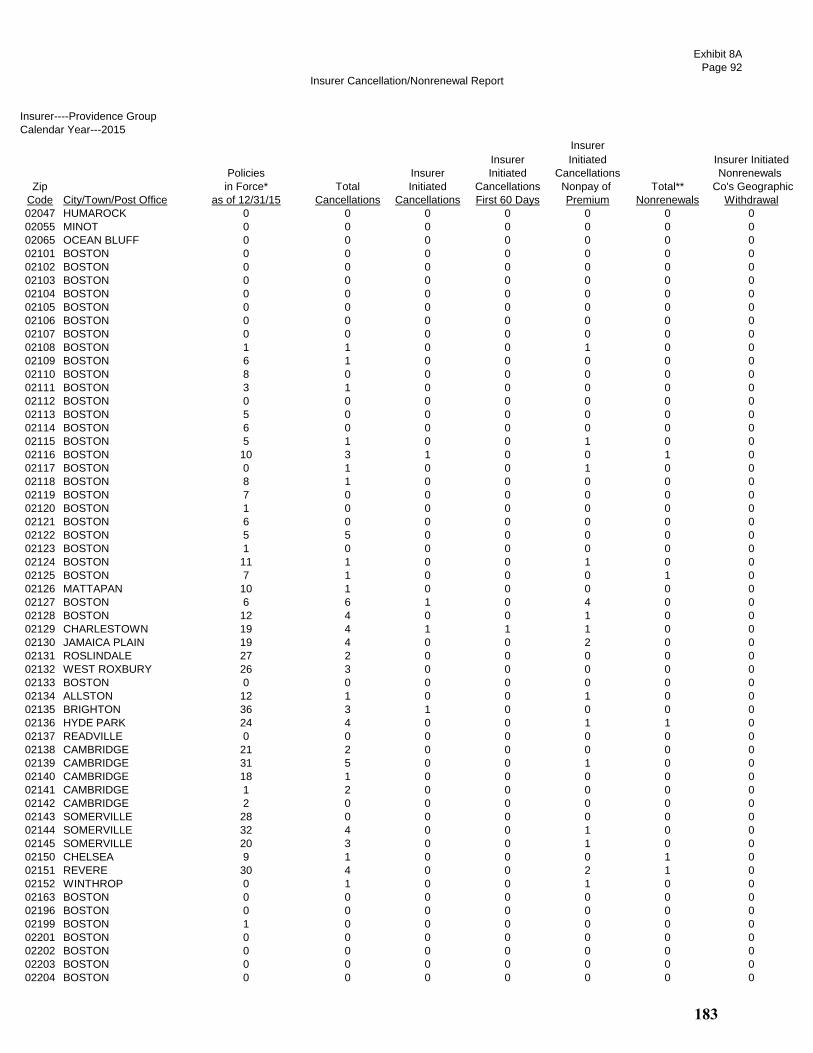
Insurer Cancellation/Nonrenewal Report
Exhibit 8A
Page 92
Insurer----Providence Group
Calendar Year---2015
Insurer
Insurer Initiated Insurer Initiated
Policies Insurer Initiated Cancellations Nonrenewals
Zip in Force* Total Initiated Cancellations Nonpay of Total** Co's Geographic
Code City/Town/Post Office as of 12/31/15 Cancellations Cancellations First 60 Days Premium Nonrenewals Withdrawal
02047 HUMAROCK 0 0 0 0 0 0 0
02055 MINOT 0 0 0 0 0 0 0
02065 OCEAN BLUFF 0 0 0 0 0 0 0
02101 BOSTON 0 0 0 0 0 0 0
02102 BOSTON 0 0 0 0 0 0 0
02103 BOSTON 0 0 0 0 0 0 0
02104 BOSTON 0 0 0 0 0 0 0
02105 BOSTON 0 0 0 0 0 0 0
02106 BOSTON 0 0 0 0 0 0 0
02107 BOSTON 0 0 0 0 0 0 0
02108 BOSTON 1 1 0 0 1 0 0
02109 BOSTON 6 1 0 0 0 0 0
02110 BOSTON 8 0 0 0 0 0 0
02111 BOSTON 3 1 0 0 0 0 0
02112 BOSTON 0 0 0 0 0 0 0
02113 BOSTON 5 0 0 0 0 0 0
02114 BOSTON 6 0 0 0 0 0 0
02115 BOSTON 5 1 0 0 1 0 0
02116 BOSTON 10 3 1 0 0 1 0
02117 BOSTON 0 1 0 0 1 0 0
02118 BOSTON 8 1 0 0 0 0 0
02119 BOSTON 7 0 0 0 0 0 0
02120 BOSTON 1 0 0 0 0 0 0
02121 BOSTON 6 0 0 0 0 0 0
02122 BOSTON 5 5 0 0 0 0 0
02123 BOSTON 1 0 0 0 0 0 0
02124 BOSTON 11 1 0 0 1 0 0
02125 BOSTON 7 1 0 0 0 1 0
02126 MATTAPAN 10 1 0 0 0 0 0
02127 BOSTON 6 6 1 0 4 0 0
02128 BOSTON 12 4 0 0 1 0 0
02129 CHARLESTOWN 19 4 1 1 1 0 0
02130 JAMAICA PLAIN 19 4 0 0 2 0 0
02131 ROSLINDALE 27 2 0 0 0 0 0
02132 WEST ROXBURY 26 3 0 0 0 0 0
02133 BOSTON 0 0 0 0 0 0 0
02134 ALLSTON 12 1 0 0 1 0 0
02135 BRIGHTON 36 3 1 0 0 0 0
02136 HYDE PARK 24 4 0 0 1 1 0
02137 READVILLE 0 0 0 0 0 0 0
02138 CAMBRIDGE 21 2 0 0 0 0 0
02139 CAMBRIDGE 31 5 0 0 1 0 0
02140 CAMBRIDGE 18 1 0 0 0 0 0
02141 CAMBRIDGE 1 2 0 0 0 0 0
02142 CAMBRIDGE 2 0 0 0 0 0 0
02143 SOMERVILLE 28 0 0 0 0 0 0
02144 SOMERVILLE 32 4 0 0 1 0 0
02145 SOMERVILLE 20 3 0 0 1 0 0
02150 CHELSEA 9 1 0 0 0 1 0
02151 REVERE 30 4 0 0 2 1 0
02152 WINTHROP 0 1 0 0 1 0 0
02163 BOSTON 0 0 0 0 0 0 0
02196 BOSTON 0 0 0 0 0 0 0
02199 BOSTON 1 0 0 0 0 0 0
02201 BOSTON 0 0 0 0 0 0 0
02202 BOSTON 0 0 0 0 0 0 0
02203 BOSTON 0 0 0 0 0 0 0
02204 BOSTON 0 0 0 0 0 0 0
183

Insurer Cancellation/Nonrenewal Report
Exhibit 8A
Page 93
Insurer----Providence Group
Calendar Year---2015
Insurer
Insurer Initiated Insurer Initiated
Policies Insurer Initiated Cancellations Nonrenewals
Zip in Force* Total Initiated Cancellations Nonpay of Total** Co's Geographic
Code City/Town/Post Office as of 12/31/15 Cancellations Cancellations First 60 Days Premium Nonrenewals Withdrawal
02205 BOSTON 0 0 0 0 0 0 0
02206 BOSTON 0 0 0 0 0 0 0
02207 BOSTON 0 0 0 0 0 0 0
02208 BOSTON 0 0 0 0 0 0 0
02209 BOSTON 0 0 0 0 0 0 0
02210 BOSTON 1 0 0 0 0 0 0
02211 BOSTON 0 0 0 0 0 0 0
02212 BOSTON 0 0 0 0 0 0 0
02215 BOSTON 2 0 0 0 0 0 0
02216 BOSTON 0 0 0 0 0 0 0
02217 BOSTON 0 0 0 0 0 0 0
02222 BOSTON 0 0 0 0 0 0 0
02228 EAST BOSTON 0 0 0 0 0 0 0
02238 CAMBRIDGE 0 0 0 0 0 0 0
02239 CAMBRIDGE 0 0 0 0 0 0 0
02241 BOSTON 0 0 0 0 0 0 0
02266 BOSTON 0 0 0 0 0 0 0
02283 BOSTON 0 0 0 0 0 0 0
02284 BOSTON 0 0 0 0 0 0 0
02293 BOSTON 0 0 0 0 0 0 0
02295 BOSTON 0 0 0 0 0 0 0
02297 BOSTON 0 0 0 0 0 0 0
02298 BOSTON 0 0 0 0 0 0 0
02301 BROCKTON 391 34 2 0 10 13 0
02302 BROCKTON 259 27 1 0 11 11 0
02303 BROCKTON 0 1 0 0 0 1 0
02304 BROCKTON 2 0 0 0 0 0 0
02305 BROCKTON 1 0 0 0 0 1 0
02360 PLYMOUTH 125 16 0 0 3 4 0
02361 PLYMOUTH 0 0 0 0 0 0 0
02362 PLYMOUTH 0 1 1 0 0 0 0
02381 WHITE HORSE BEACH 0 0 0 0 0 0 0
02532 BUZZARDS BAY 45 11 1 0 1 0 0
02534 CATAUMET 5 0 0 0 0 0 0
02535 CHILMARK 0 0 0 0 0 0 0
02536 EAST FALMOUTH 14 3 0 0 0 0 0
02537 EAST SANDWICH 7 1 0 0 0 0 0
02538 EAST WAREHAM 13 5 1 0 0 0 0
02539 EDGARTOWN 1 0 0 0 0 0 0
02540 FALMOUTH 5 0 0 0 0 0 0
02541 FALMOUTH 0 0 0 0 0 0 0
02542 BUZZARDS BAY 0 0 0 0 0 0 0
02543 WOODS HOLE 1 0 0 0 0 0 0
02552 MENEMSHA 0 0 0 0 0 0 0
02553 MONUMENT BEACH 1 1 0 0 0 0 0
02554 NANTUCKET 0 0 0 0 0 0 0
02556 NORTH FALMOUTH 6 2 0 0 0 0 0
02557 OAK BLUFFS 0 0 0 0 0 0 0
02558 ONSET 3 2 0 0 0 0 0
02559 POCASSET 9 3 0 0 0 0 0
02561 SAGAMORE 0 2 0 0 0 0 0
02562 SAGAMORE BEACH 8 2 0 0 0 0 0
02563 SANDWICH 15 2 0 0 0 1 0
02564 SIASCONSET 0 0 0 0 0 0 0
02565 SILVER BEACH 0 0 0 0 0 0 0
02568 VINEYARD HAVEN 0 0 0 0 0 0 0
02571 WAREHAM 19 1 0 0 1 2 0
02573 WEST CHOP 0 0 0 0 0 0 0
184

Insurer Cancellation/Nonrenewal Report
Exhibit 8A
Page 94
Insurer----Providence Group
Calendar Year---2015
Insurer
Insurer Initiated Insurer Initiated
Policies Insurer Initiated Cancellations Nonrenewals
Zip in Force* Total Initiated Cancellations Nonpay of Total** Co's Geographic
Code City/Town/Post Office as of 12/31/15 Cancellations Cancellations First 60 Days Premium Nonrenewals Withdrawal
02574 WEST FALMOUTH 0 0 0 0 0 0 0
02575 WEST TISBURY 0 0 0 0 0 0 0
02576 WEST WAREHAM 13 2 0 0 1 1 0
02584 NANTUCKET 0 0 0 0 0 0 0
02601 HYANNIS 12 0 0 0 0 2 0
02630 BARNSTABLE 2 0 0 0 0 0 0
02631 BREWSTER 12 1 0 0 0 0 0
02632 CENTERVILLE 13 4 0 0 0 1 0
02633 CHATHAM 2 0 0 0 0 0 0
02634 CENTERVILLE 0 0 0 0 0 0 0
02635 COTUIT 5 0 0 0 0 2 0
02636 CENTERVILLE 0 0 0 0 0 0 0
02637 CUMMAQUID 0 0 0 0 0 0 0
02638 DENNIS 2 0 0 0 0 0 0
02639 DENNISPORT 1 1 0 0 0 0 0
02641 EAST DENNIS 0 0 0 0 0 0 0
02642 EASTHAM 5 1 0 0 0 0 0
02643 EAST ORLEANS 0 0 0 0 0 0 0
02644 FORESTDALE 9 1 0 0 0 0 0
02645 HARWICH 4 2 1 0 0 1 0
02646 HARWICHPORT 1 0 0 0 0 0 0
02647 HYANNISPORT 0 0 0 0 0 0 0
02648 MARSTONS MILLS 16 3 0 0 1 0 0
02649 MASHPEE 21 7 0 0 4 1 0
02650 NORTH CHATHAM 0 0 0 0 0 0 0
02651 NORTH EASTHAM 0 0 0 0 0 0 0
02652 NORTH TRURO 2 0 0 0 0 0 0
02653 ORLEANS 2 2 0 0 0 0 0
02655 OSTERVILLE 2 1 1 0 0 1 0
02657 PROVINCETOWN 1 0 0 0 0 0 0
02659 SOUTH CHATHAM 1 1 0 0 0 0 0
02660 SOUTH DENNIS 3 4 0 0 1 0 0
02661 SOUTH HARWICH 0 0 0 0 0 0 0
02662 SOUTH ORLEANS 0 0 0 0 0 0 0
02663 SOUTH WELLFLEET 0 0 0 0 0 0 0
02664 SOUTH YARMOUTH 9 0 0 0 0 0 0
02666 TRURO 2 0 0 0 0 0 0
02667 WELLFLEET 4 1 0 0 0 0 0
02668 WEST BARNSTABLE 7 1 0 0 1 0 0
02669 WEST CHATHAM 0 0 0 0 0 0 0
02670 WEST DENNIS 1 0 0 0 0 0 0
02671 WEST HARWICH 1 0 0 0 0 0 0
02672 WEST HYANNISPORT 2 0 0 0 0 0 0
02673 WEST YARMOUTH 12 2 0 0 0 1 0
02675 YARMOUTHPORT 5 1 0 0 0 0 0
02713 CUTTYHUNK 0 0 0 0 0 0 0
02714 DARTMOUTH 0 0 0 0 0 0 0
02719 FAIRHAVEN 21 4 0 0 0 0 0
02720 FALL RIVER 34 4 0 0 0 2 0
02721 FALL RIVER 36 4 1 0 0 0 0
02722 FALL RIVER 5 0 0 0 0 0 0
02723 FALL RIVER 9 1 0 0 0 0 0
02724 FALL RIVER 22 2 1 1 0 0 0
02725 SOMERSET 4 1 0 0 0 0 0
02726 SOMERSET 18 2 0 0 0 0 0
02738 MARION 2 0 0 0 0 0 0
02739 MATTAPOISETT 14 6 0 0 2 1 0
02740 NEW BEDFORD 69 9 1 0 0 3 0
185

Insurer Cancellation/Nonrenewal Report
Exhibit 8A
Page 95
Insurer----Providence Group
Calendar Year---2015
Insurer
Insurer Initiated Insurer Initiated
Policies Insurer Initiated Cancellations Nonrenewals
Zip in Force* Total Initiated Cancellations Nonpay of Total** Co's Geographic
Code City/Town/Post Office as of 12/31/15 Cancellations Cancellations First 60 Days Premium Nonrenewals Withdrawal
02741 NEW BEDFORD 0 0 0 0 0 0 0
02742 NEW BEDFORD 1 0 0 0 0 1 0
02743 ACUSHNET 64 14 0 0 0 4 0
02744 NEW BEDFORD 2 1 0 0 1 0 0
02745 NEW BEDFORD 87 26 1 0 6 2 0
02746 NEW BEDFORD 19 4 1 1 1 0 0
02747 NORTH DARTMOUTH 125 26 0 0 7 3 0
02748 SOUTH DARTMOUTH 34 12 0 0 0 1 0
02777 SWANSEA 23 1 0 0 0 0 0
02790 WESTPORT 33 10 0 0 0 1 0
02791 WESTPORT POINT 0 0 0 0 0 0 0
All Zip Codes Above Combined 3,250 499 25 3 107 81 0
Urban 2,460 336 20 3 85 53 0
Coastal 790 163 5 0 22 28 0
*The number of policies in force as of December 31 of the 2015 calendar year that were not originally issued in the 2015 calendar year.
** "Total Nonrenewals" does not include "Insurer Initiated Nonrenewals Co's Geographic Withdrawal" totals.
186

Insurer Cancellation/Nonrenewal Report
Exhibit 8A
Page 96
Insurer-----Quincy Mutual Group
Calendar Year---2015
Insurer
Insurer Initiated Insurer Initiated
Policies Insurer Initiated Cancellations Nonrenewals
Zip in Force* Total Initiated Cancellations Nonpay of Total** Co's Geographic
Code City/Town/Post Office as of 12/31/15 Cancellations Cancellations First 60 Days Premium Nonrenewals Withdrawal
01101 SPRINGFIELD 4 0 0 0 0 0 0
01102 SPRINGFIELD 0 0 0 0 0 0 0
01103 SPRINGFIELD 2 0 0 0 0 0 0
01104 SPRINGFIELD 137 4 2 0 2 2 0
01105 SPRINGFIELD 5 1 0 0 1 1 0
01107 SPRINGFIELD 25 1 0 1 0 0 0
01108 SPRINGFIELD 76 1 0 1 0 1 0
01109 SPRINGFIELD 89 5 2 1 2 1 0
01111 SPRINGFIELD 0 0 0 0 0 0 0
01114 SPRINGFIELD 0 0 0 0 0 0 0
01115 SPRINGFIELD 0 0 0 0 0 0 0
01118 SPRINGFIELD 121 2 2 0 0 0 0
01119 SPRINGFIELD 105 3 0 1 2 1 0
01128 SPRINGFIELD 33 3 0 0 3 1 0
01129 SPRINGFIELD 75 4 2 1 1 1 0
01133 SPRINGFIELD 0 0 0 0 0 0 0
01138 SPRINGFIELD 0 0 0 0 0 0 0
01139 SPRINGFIELD 0 0 0 0 0 0 0
01144 SPRINGFIELD 0 0 0 0 0 0 0
01151 INDIAN ORCHARD 51 3 0 0 3 1 0
01152 SPRINGFIELD 0 0 0 0 0 0 0
01199 SPRINGFIELD 0 0 0 0 0 0 0
01601 WORCESTER 2 0 0 0 0 0 0
01602 WORCESTER 153 4 0 2 2 1 0
01603 WORCESTER 104 2 0 0 2 1 0
01604 WORCESTER 163 3 0 1 2 2 0
01605 WORCESTER 81 1 0 0 1 0 0
01606 WORCESTER 123 2 1 0 1 2 0
01607 WORCESTER 24 1 1 0 0 0 0
01608 WORCESTER 1 0 0 0 0 0 0
01609 WORCESTER 62 0 0 0 0 1 0
01610 WORCESTER 32 2 1 0 1 0 0
01611 CHERRY VALLEY 18 1 0 1 0 0 0
01612 PAXTON 25 0 0 0 0 0 0
01613 WORCESTER 1 0 0 0 0 0 0
01614 WORCESTER 0 0 0 0 0 0 0
01615 WORCESTER 0 0 0 0 0 0 0
01653 WORCESTER 0 0 0 0 0 0 0
01654 WORCESTER 0 0 0 0 0 0 0
01655 WORCESTER 0 0 0 0 0 0 0
01840 LAWRENCE 2 1 0 0 1 0 0
01841 LAWRENCE 16 2 1 1 0 2 0
01842 LAWRENCE 4 0 0 0 0 0 0
01843 LAWRENCE 28 1 0 1 0 0 0
01850 LOWELL 75 0 0 0 0 0 0
01851 LOWELL 248 14 3 4 7 1 0
01852 LOWELL 217 3 0 1 2 0 0
01853 LOWELL 0 0 0 0 0 0 0
01854 LOWELL 148 3 0 2 1 0 0
01901 LYNN 11 0 0 0 0 0 0
01902 LYNN 65 2 0 1 1 2 0
01903 LYNN 0 0 0 0 0 0 0
01904 LYNN 122 5 1 2 2 0 0
01905 LYNN 56 1 0 0 1 2 0
01910 LYNN 0 0 0 0 0 0 0
02020 BRANT ROCK 1 0 0 0 0 0 0
02041 GREEN HARBOR 0 0 0 0 0 0 0
02045 HULL 33 0 0 0 0 1 0
187
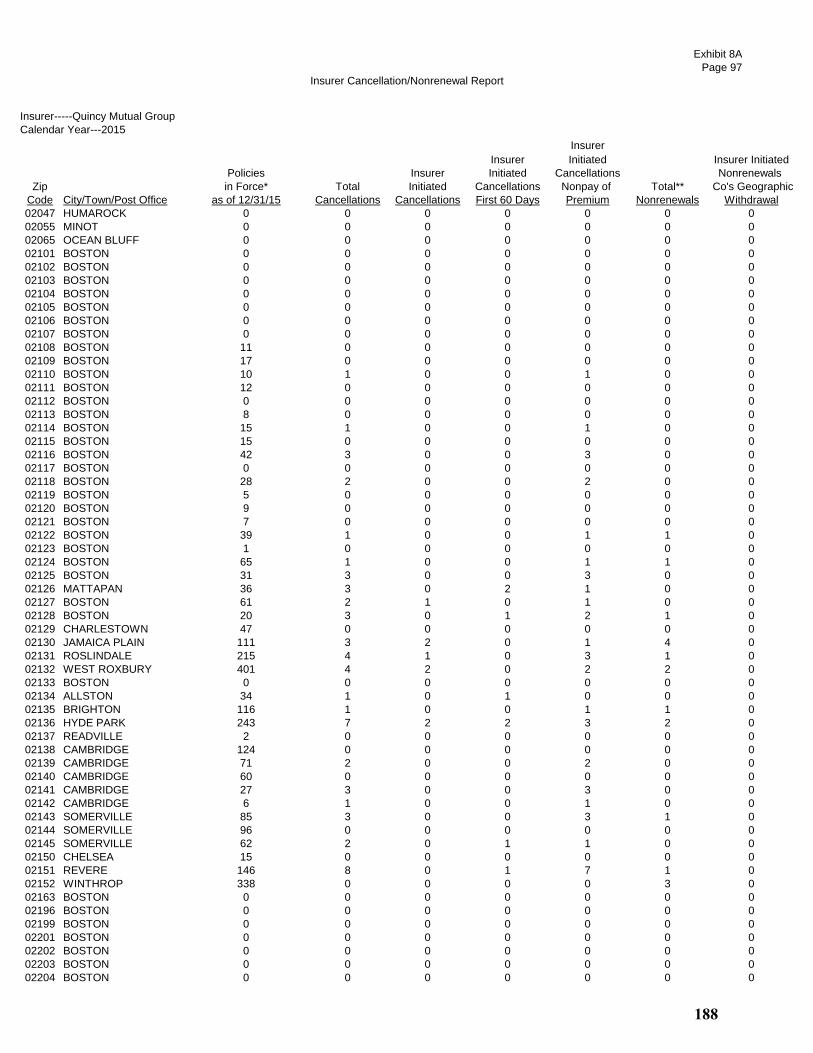
Insurer Cancellation/Nonrenewal Report
Exhibit 8A
Page 97
Insurer-----Quincy Mutual Group
Calendar Year---2015
Insurer
Insurer Initiated Insurer Initiated
Policies Insurer Initiated Cancellations Nonrenewals
Zip in Force* Total Initiated Cancellations Nonpay of Total** Co's Geographic
Code City/Town/Post Office as of 12/31/15 Cancellations Cancellations First 60 Days Premium Nonrenewals Withdrawal
02047 HUMAROCK 0 0 0 0 0 0 0
02055 MINOT 0 0 0 0 0 0 0
02065 OCEAN BLUFF 0 0 0 0 0 0 0
02101 BOSTON 0 0 0 0 0 0 0
02102 BOSTON 0 0 0 0 0 0 0
02103 BOSTON 0 0 0 0 0 0 0
02104 BOSTON 0 0 0 0 0 0 0
02105 BOSTON 0 0 0 0 0 0 0
02106 BOSTON 0 0 0 0 0 0 0
02107 BOSTON 0 0 0 0 0 0 0
02108 BOSTON 11 0 0 0 0 0 0
02109 BOSTON 17 0 0 0 0 0 0
02110 BOSTON 10 1 0 0 1 0 0
02111 BOSTON 12 0 0 0 0 0 0
02112 BOSTON 0 0 0 0 0 0 0
02113 BOSTON 8 0 0 0 0 0 0
02114 BOSTON 15 1 0 0 1 0 0
02115 BOSTON 15 0 0 0 0 0 0
02116 BOSTON 42 3 0 0 3 0 0
02117 BOSTON 0 0 0 0 0 0 0
02118 BOSTON 28 2 0 0 2 0 0
02119 BOSTON 5 0 0 0 0 0 0
02120 BOSTON 9 0 0 0 0 0 0
02121 BOSTON 7 0 0 0 0 0 0
02122 BOSTON 39 1 0 0 1 1 0
02123 BOSTON 1 0 0 0 0 0 0
02124 BOSTON 65 1 0 0 1 1 0
02125 BOSTON 31 3 0 0 3 0 0
02126 MATTAPAN 36 3 0 2 1 0 0
02127 BOSTON 61 2 1 0 1 0 0
02128 BOSTON 20 3 0 1 2 1 0
02129 CHARLESTOWN 47 0 0 0 0 0 0
02130 JAMAICA PLAIN 111 3 2 0 1 4 0
02131 ROSLINDALE 215 4 1 0 3 1 0
02132 WEST ROXBURY 401 4 2 0 2 2 0
02133 BOSTON 0 0 0 0 0 0 0
02134 ALLSTON 34 1 0 1 0 0 0
02135 BRIGHTON 116 1 0 0 1 1 0
02136 HYDE PARK 243 7 2 2 3 2 0
02137 READVILLE 2 0 0 0 0 0 0
02138 CAMBRIDGE 124 0 0 0 0 0 0
02139 CAMBRIDGE 71 2 0 0 2 0 0
02140 CAMBRIDGE 60 0 0 0 0 0 0
02141 CAMBRIDGE 27 3 0 0 3 0 0
02142 CAMBRIDGE 6 1 0 0 1 0 0
02143 SOMERVILLE 85 3 0 0 3 1 0
02144 SOMERVILLE 96 0 0 0 0 0 0
02145 SOMERVILLE 62 2 0 1 1 0 0
02150 CHELSEA 15 0 0 0 0 0 0
02151 REVERE 146 8 0 1 7 1 0
02152 WINTHROP 338 0 0 0 0 3 0
02163 BOSTON 0 0 0 0 0 0 0
02196 BOSTON 0 0 0 0 0 0 0
02199 BOSTON 0 0 0 0 0 0 0
02201 BOSTON 0 0 0 0 0 0 0
02202 BOSTON 0 0 0 0 0 0 0
02203 BOSTON 0 0 0 0 0 0 0
02204 BOSTON 0 0 0 0 0 0 0
188

Insurer Cancellation/Nonrenewal Report
Exhibit 8A
Page 98
Insurer-----Quincy Mutual Group
Calendar Year---2015
Insurer
Insurer Initiated Insurer Initiated
Policies Insurer Initiated Cancellations Nonrenewals
Zip in Force* Total Initiated Cancellations Nonpay of Total** Co's Geographic
Code City/Town/Post Office as of 12/31/15 Cancellations Cancellations First 60 Days Premium Nonrenewals Withdrawal
02205 BOSTON 0 0 0 0 0 0 0
02206 BOSTON 0 0 0 0 0 0 0
02207 BOSTON 0 0 0 0 0 0 0
02208 BOSTON 0 0 0 0 0 0 0
02209 BOSTON 0 0 0 0 0 0 0
02210 BOSTON 7 0 0 0 0 0 0
02211 BOSTON 0 0 0 0 0 0 0
02212 BOSTON 0 0 0 0 0 0 0
02215 BOSTON 7 0 0 0 0 0 0
02216 BOSTON 0 0 0 0 0 0 0
02217 BOSTON 0 0 0 0 0 0 0
02222 BOSTON 0 0 0 0 0 0 0
02228 EAST BOSTON 0 0 0 0 0 0 0
02238 CAMBRIDGE 0 0 0 0 0 0 0
02239 CAMBRIDGE 0 0 0 0 0 0 0
02241 BOSTON 0 0 0 0 0 0 0
02266 BOSTON 0 0 0 0 0 0 0
02283 BOSTON 0 0 0 0 0 0 0
02284 BOSTON 0 0 0 0 0 0 0
02293 BOSTON 0 0 0 0 0 0 0
02295 BOSTON 0 0 0 0 0 0 0
02297 BOSTON 0 0 0 0 0 0 0
02298 BOSTON 0 0 0 0 0 0 0
02301 BROCKTON 203 8 1 3 4 3 0
02302 BROCKTON 152 2 0 0 2 2 0
02303 BROCKTON 0 1 0 0 1 0 0
02304 BROCKTON 0 0 0 0 0 0 0
02305 BROCKTON 0 0 0 0 0 0 0
02360 PLYMOUTH 678 9 2 1 6 5 0
02361 PLYMOUTH 0 0 0 0 0 0 0
02362 PLYMOUTH 1 0 0 0 0 0 0
02381 WHITE HORSE BEACH 0 0 0 0 0 0 0
02532 BUZZARDS BAY 7 0 0 0 0 0 0
02534 CATAUMET 0 0 0 0 0 0 0
02535 CHILMARK 0 0 0 0 0 0 0
02536 EAST FALMOUTH 9 0 0 0 0 0 0
02537 EAST SANDWICH 5 0 0 0 0 0 0
02538 EAST WAREHAM 14 0 0 0 0 0 0
02539 EDGARTOWN 0 0 0 0 0 0 0
02540 FALMOUTH 4 0 0 0 0 0 0
02541 FALMOUTH 0 0 0 0 0 0 0
02542 BUZZARDS BAY 0 0 0 0 0 0 0
02543 WOODS HOLE 0 0 0 0 0 0 0
02552 MENEMSHA 0 0 0 0 0 0 0
02553 MONUMENT BEACH 0 0 0 0 0 0 0
02554 NANTUCKET 1 0 0 0 0 0 0
02556 NORTH FALMOUTH 4 0 0 0 0 0 0
02557 OAK BLUFFS 0 0 0 0 0 0 0
02558 ONSET 4 0 0 0 0 0 0
02559 POCASSET 1 0 0 0 0 0 0
02561 SAGAMORE 0 0 0 0 0 0 0
02562 SAGAMORE BEACH 2 0 0 0 0 0 0
02563 SANDWICH 10 0 0 0 0 0 0
02564 SIASCONSET 0 0 0 0 0 0 0
02565 SILVER BEACH 0 0 0 0 0 0 0
02568 VINEYARD HAVEN 0 0 0 0 0 0 0
02571 WAREHAM 11 0 0 0 0 0 0
02573 WEST CHOP 0 0 0 0 0 0 0
189

Insurer Cancellation/Nonrenewal Report
Exhibit 8A
Page 99
Insurer-----Quincy Mutual Group
Calendar Year---2015
Insurer
Insurer Initiated Insurer Initiated
Policies Insurer Initiated Cancellations Nonrenewals
Zip in Force* Total Initiated Cancellations Nonpay of Total** Co's Geographic
Code City/Town/Post Office as of 12/31/15 Cancellations Cancellations First 60 Days Premium Nonrenewals Withdrawal
02574 WEST FALMOUTH 1 0 0 0 0 0 0
02575 WEST TISBURY 0 0 0 0 0 0 0
02576 WEST WAREHAM 9 0 0 0 0 1 0
02584 NANTUCKET 0 0 0 0 0 0 0
02601 HYANNIS 2 0 0 0 0 0 0
02630 BARNSTABLE 1 0 0 0 0 1 0
02631 BREWSTER 11 0 0 0 0 0 0
02632 CENTERVILLE 3 0 0 0 0 0 0
02633 CHATHAM 3 0 0 0 0 0 0
02634 CENTERVILLE 0 0 0 0 0 0 0
02635 COTUIT 3 0 0 0 0 0 0
02636 CENTERVILLE 0 0 0 0 0 0 0
02637 CUMMAQUID 1 0 0 0 0 0 0
02638 DENNIS 5 0 0 0 0 0 0
02639 DENNISPORT 1 0 0 0 0 0 0
02641 EAST DENNIS 5 0 0 0 0 0 0
02642 EASTHAM 3 0 0 0 0 0 0
02643 EAST ORLEANS 0 0 0 0 0 0 0
02644 FORESTDALE 1 0 0 0 0 0 0
02645 HARWICH 10 0 0 0 0 0 0
02646 HARWICHPORT 2 0 0 0 0 0 0
02647 HYANNISPORT 0 0 0 0 0 0 0
02648 MARSTONS MILLS 3 1 1 0 0 0 0
02649 MASHPEE 13 2 0 1 1 0 0
02650 NORTH CHATHAM 1 0 0 0 0 0 0
02651 NORTH EASTHAM 2 0 0 0 0 0 0
02652 NORTH TRURO 0 0 0 0 0 0 0
02653 ORLEANS 4 0 0 0 0 0 0
02655 OSTERVILLE 3 0 0 0 0 0 0
02657 PROVINCETOWN 1 0 0 0 0 0 0
02659 SOUTH CHATHAM 0 0 0 0 0 0 0
02660 SOUTH DENNIS 1 0 0 0 0 0 0
02661 SOUTH HARWICH 0 0 0 0 0 0 0
02662 SOUTH ORLEANS 0 0 0 0 0 0 0
02663 SOUTH WELLFLEET 1 0 0 0 0 0 0
02664 SOUTH YARMOUTH 7 0 0 0 0 0 0
02666 TRURO 0 0 0 0 0 0 0
02667 WELLFLEET 4 0 0 0 0 0 0
02668 WEST BARNSTABLE 0 0 0 0 0 0 0
02669 WEST CHATHAM 0 0 0 0 0 0 0
02670 WEST DENNIS 3 0 0 0 0 0 0
02671 WEST HARWICH 2 0 0 0 0 0 0
02672 WEST HYANNISPORT 0 0 0 0 0 0 0
02673 WEST YARMOUTH 5 0 0 0 0 0 0
02675 YARMOUTHPORT 2 0 0 0 0 0 0
02713 CUTTYHUNK 0 0 0 0 0 0 0
02714 DARTMOUTH 0 0 0 0 0 0 0
02719 FAIRHAVEN 6 0 0 0 0 0 0
02720 FALL RIVER 10 0 0 0 0 0 0
02721 FALL RIVER 1 0 0 0 0 0 0
02722 FALL RIVER 0 0 0 0 0 0 0
02723 FALL RIVER 2 0 0 0 0 0 0
02724 FALL RIVER 0 0 0 0 0 0 0
02725 SOMERSET 0 0 0 0 0 0 0
02726 SOMERSET 10 0 0 0 0 0 0
02738 MARION 3 0 0 0 0 0 0
02739 MATTAPOISETT 7 0 0 0 0 0 0
02740 NEW BEDFORD 31 0 0 0 0 0 0
190

Insurer Cancellation/Nonrenewal Report
Exhibit 8A
Page 100
Insurer-----Quincy Mutual Group
Calendar Year---2015
Insurer
Insurer Initiated Insurer Initiated
Policies Insurer Initiated Cancellations Nonrenewals
Zip in Force* Total Initiated Cancellations Nonpay of Total** Co's Geographic
Code City/Town/Post Office as of 12/31/15 Cancellations Cancellations First 60 Days Premium Nonrenewals Withdrawal
02741 NEW BEDFORD 0 0 0 0 0 0 0
02742 NEW BEDFORD 0 0 0 0 0 0 0
02743 ACUSHNET 87 1 0 0 1 0 0
02744 NEW BEDFORD 3 0 0 0 0 0 0
02745 NEW BEDFORD 194 3 0 0 3 1 0
02746 NEW BEDFORD 11 0 0 0 0 0 0
02747 NORTH DARTMOUTH 49 0 0 0 0 0 0
02748 SOUTH DARTMOUTH 9 0 0 0 0 0 0
02777 SWANSEA 12 0 0 0 0 0 0
02790 WESTPORT 22 0 0 0 0 0 0
02791 WESTPORT POINT 0 0 0 0 0 0 0
All Zip Codes Above Combined 6,859 161 28 34 99 55 0
Urban 5,756 148 25 32 91 47 0
Coastal 1,103 13 3 2 8 8 0
*The number of policies in force as of December 31 of the 2015 calendar year that were not originally issued in the 2015 calendar year.
** "Total Nonrenewals" does not include "Insurer Initiated Nonrenewals Co's Geographic Withdrawal" totals.
191
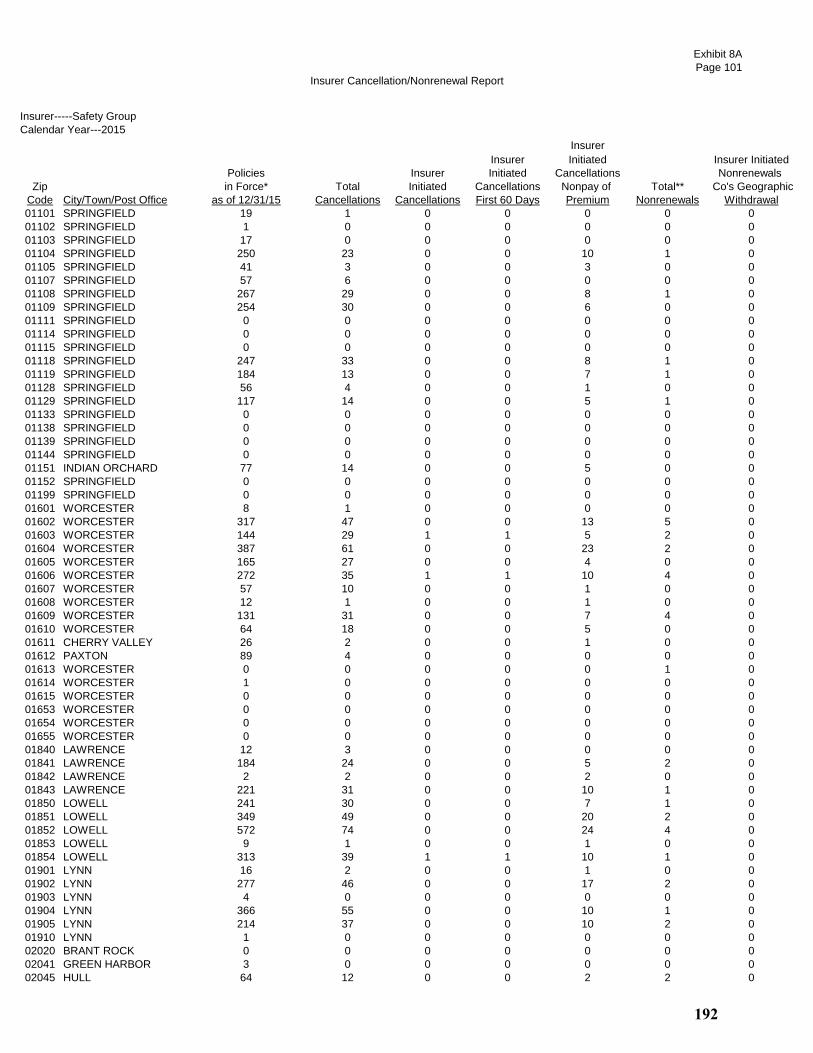
Insurer Cancellation/Nonrenewal Report
Exhibit 8A
Page 101
Insurer-----Safety Group
Calendar Year---2015
Insurer
Insurer Initiated Insurer Initiated
Policies Insurer Initiated Cancellations Nonrenewals
Zip in Force* Total Initiated Cancellations Nonpay of Total** Co's Geographic
Code City/Town/Post Office as of 12/31/15 Cancellations Cancellations First 60 Days Premium Nonrenewals Withdrawal
01101 SPRINGFIELD 19 1 0 0 0 0 0
01102 SPRINGFIELD 1 0 0 0 0 0 0
01103 SPRINGFIELD 17 0 0 0 0 0 0
01104 SPRINGFIELD 250 23 0 0 10 1 0
01105 SPRINGFIELD 41 3 0 0 3 0 0
01107 SPRINGFIELD 57 6 0 0 0 0 0
01108 SPRINGFIELD 267 29 0 0 8 1 0
01109 SPRINGFIELD 254 30 0 0 6 0 0
01111 SPRINGFIELD 0 0 0 0 0 0 0
01114 SPRINGFIELD 0 0 0 0 0 0 0
01115 SPRINGFIELD 0 0 0 0 0 0 0
01118 SPRINGFIELD 247 33 0 0 8 1 0
01119 SPRINGFIELD 184 13 0 0 7 1 0
01128 SPRINGFIELD 56 4 0 0 1 0 0
01129 SPRINGFIELD 117 14 0 0 5 1 0
01133 SPRINGFIELD 0 0 0 0 0 0 0
01138 SPRINGFIELD 0 0 0 0 0 0 0
01139 SPRINGFIELD 0 0 0 0 0 0 0
01144 SPRINGFIELD 0 0 0 0 0 0 0
01151 INDIAN ORCHARD 77 14 0 0 5 0 0
01152 SPRINGFIELD 0 0 0 0 0 0 0
01199 SPRINGFIELD 0 0 0 0 0 0 0
01601 WORCESTER 8 1 0 0 0 0 0
01602 WORCESTER 317 47 0 0 13 5 0
01603 WORCESTER 144 29 1 1 5 2 0
01604 WORCESTER 387 61 0 0 23 2 0
01605 WORCESTER 165 27 0 0 4 0 0
01606 WORCESTER 272 35 1 1 10 4 0
01607 WORCESTER 57 10 0 0 1 0 0
01608 WORCESTER 12 1 0 0 1 0 0
01609 WORCESTER 131 31 0 0 7 4 0
01610 WORCESTER 64 18 0 0 5 0 0
01611 CHERRY VALLEY 26 2 0 0 1 0 0
01612 PAXTON 89 4 0 0 0 0 0
01613 WORCESTER 0 0 0 0 0 1 0
01614 WORCESTER 1 0 0 0 0 0 0
01615 WORCESTER 0 0 0 0 0 0 0
01653 WORCESTER 0 0 0 0 0 0 0
01654 WORCESTER 0 0 0 0 0 0 0
01655 WORCESTER 0 0 0 0 0 0 0
01840 LAWRENCE 12 3 0 0 0 0 0
01841 LAWRENCE 184 24 0 0 5 2 0
01842 LAWRENCE 2 2 0 0 2 0 0
01843 LAWRENCE 221 31 0 0 10 1 0
01850 LOWELL 241 30 0 0 7 1 0
01851 LOWELL 349 49 0 0 20 2 0
01852 LOWELL 572 74 0 0 24 4 0
01853 LOWELL 9 1 0 0 1 0 0
01854 LOWELL 313 39 1 1 10 1 0
01901 LYNN 16 2 0 0 1 0 0
01902 LYNN 277 46 0 0 17 2 0
01903 LYNN 4 0 0 0 0 0 0
01904 LYNN 366 55 0 0 10 1 0
01905 LYNN 214 37 0 0 10 2 0
01910 LYNN 1 0 0 0 0 0 0
02020 BRANT ROCK 0 0 0 0 0 0 0
02041 GREEN HARBOR 3 0 0 0 0 0 0
02045 HULL 64 12 0 0 2 2 0
192
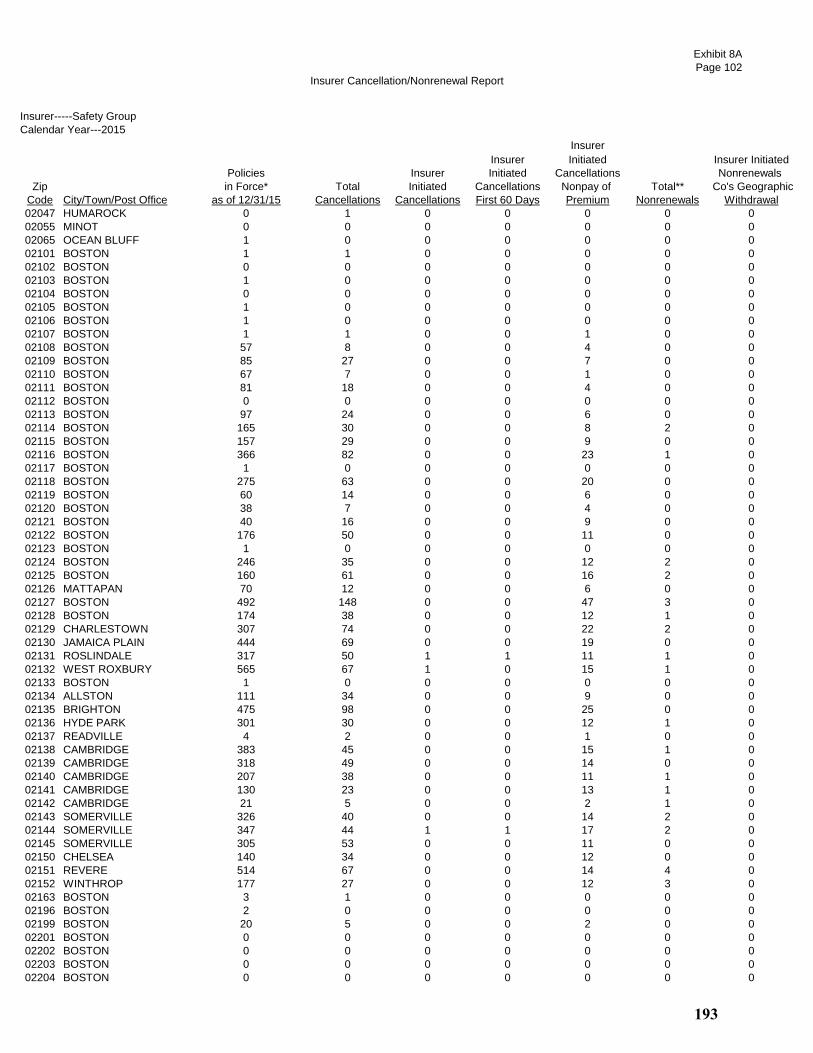
Insurer Cancellation/Nonrenewal Report
Exhibit 8A
Page 102
Insurer-----Safety Group
Calendar Year---2015
Insurer
Insurer Initiated Insurer Initiated
Policies Insurer Initiated Cancellations Nonrenewals
Zip in Force* Total Initiated Cancellations Nonpay of Total** Co's Geographic
Code City/Town/Post Office as of 12/31/15 Cancellations Cancellations First 60 Days Premium Nonrenewals Withdrawal
02047 HUMAROCK 0 1 0 0 0 0 0
02055 MINOT 0 0 0 0 0 0 0
02065 OCEAN BLUFF 1 0 0 0 0 0 0
02101 BOSTON 1 1 0 0 0 0 0
02102 BOSTON 0 0 0 0 0 0 0
02103 BOSTON 1 0 0 0 0 0 0
02104 BOSTON 0 0 0 0 0 0 0
02105 BOSTON 1 0 0 0 0 0 0
02106 BOSTON 1 0 0 0 0 0 0
02107 BOSTON 1 1 0 0 1 0 0
02108 BOSTON 57 8 0 0 4 0 0
02109 BOSTON 85 27 0 0 7 0 0
02110 BOSTON 67 7 0 0 1 0 0
02111 BOSTON 81 18 0 0 4 0 0
02112 BOSTON 0 0 0 0 0 0 0
02113 BOSTON 97 24 0 0 6 0 0
02114 BOSTON 165 30 0 0 8 2 0
02115 BOSTON 157 29 0 0 9 0 0
02116 BOSTON 366 82 0 0 23 1 0
02117 BOSTON 1 0 0 0 0 0 0
02118 BOSTON 275 63 0 0 20 0 0
02119 BOSTON 60 14 0 0 6 0 0
02120 BOSTON 38 7 0 0 4 0 0
02121 BOSTON 40 16 0 0 9 0 0
02122 BOSTON 176 50 0 0 11 0 0
02123 BOSTON 1 0 0 0 0 0 0
02124 BOSTON 246 35 0 0 12 2 0
02125 BOSTON 160 61 0 0 16 2 0
02126 MATTAPAN 70 12 0 0 6 0 0
02127 BOSTON 492 148 0 0 47 3 0
02128 BOSTON 174 38 0 0 12 1 0
02129 CHARLESTOWN 307 74 0 0 22 2 0
02130 JAMAICA PLAIN 444 69 0 0 19 0 0
02131 ROSLINDALE 317 50 1 1 11 1 0
02132 WEST ROXBURY 565 67 1 0 15 1 0
02133 BOSTON 1 0 0 0 0 0 0
02134 ALLSTON 111 34 0 0 9 0 0
02135 BRIGHTON 475 98 0 0 25 0 0
02136 HYDE PARK 301 30 0 0 12 1 0
02137 READVILLE 4 2 0 0 1 0 0
02138 CAMBRIDGE 383 45 0 0 15 1 0
02139 CAMBRIDGE 318 49 0 0 14 0 0
02140 CAMBRIDGE 207 38 0 0 11 1 0
02141 CAMBRIDGE 130 23 0 0 13 1 0
02142 CAMBRIDGE 21 5 0 0 2 1 0
02143 SOMERVILLE 326 40 0 0 14 2 0
02144 SOMERVILLE 347 44 1 1 17 2 0
02145 SOMERVILLE 305 53 0 0 11 0 0
02150 CHELSEA 140 34 0 0 12 0 0
02151 REVERE 514 67 0 0 14 4 0
02152 WINTHROP 177 27 0 0 12 3 0
02163 BOSTON 3 1 0 0 0 0 0
02196 BOSTON 2 0 0 0 0 0 0
02199 BOSTON 20 5 0 0 2 0 0
02201 BOSTON 0 0 0 0 0 0 0
02202 BOSTON 0 0 0 0 0 0 0
02203 BOSTON 0 0 0 0 0 0 0
02204 BOSTON 0 0 0 0 0 0 0
193
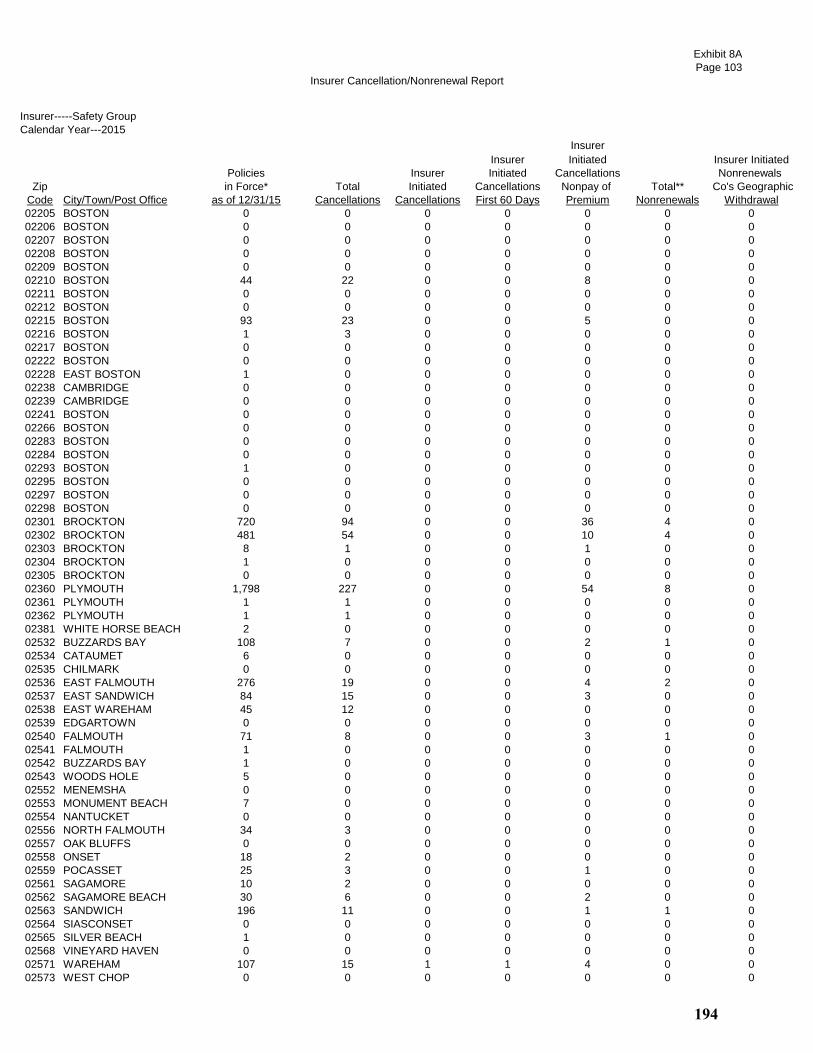
Insurer Cancellation/Nonrenewal Report
Exhibit 8A
Page 103
Insurer-----Safety Group
Calendar Year---2015
Insurer
Insurer Initiated Insurer Initiated
Policies Insurer Initiated Cancellations Nonrenewals
Zip in Force* Total Initiated Cancellations Nonpay of Total** Co's Geographic
Code City/Town/Post Office as of 12/31/15 Cancellations Cancellations First 60 Days Premium Nonrenewals Withdrawal
02205 BOSTON 0 0 0 0 0 0 0
02206 BOSTON 0 0 0 0 0 0 0
02207 BOSTON 0 0 0 0 0 0 0
02208 BOSTON 0 0 0 0 0 0 0
02209 BOSTON 0 0 0 0 0 0 0
02210 BOSTON 44 22 0 0 8 0 0
02211 BOSTON 0 0 0 0 0 0 0
02212 BOSTON 0 0 0 0 0 0 0
02215 BOSTON 93 23 0 0 5 0 0
02216 BOSTON 1 3 0 0 0 0 0
02217 BOSTON 0 0 0 0 0 0 0
02222 BOSTON 0 0 0 0 0 0 0
02228 EAST BOSTON 1 0 0 0 0 0 0
02238 CAMBRIDGE 0 0 0 0 0 0 0
02239 CAMBRIDGE 0 0 0 0 0 0 0
02241 BOSTON 0 0 0 0 0 0 0
02266 BOSTON 0 0 0 0 0 0 0
02283 BOSTON 0 0 0 0 0 0 0
02284 BOSTON 0 0 0 0 0 0 0
02293 BOSTON 1 0 0 0 0 0 0
02295 BOSTON 0 0 0 0 0 0 0
02297 BOSTON 0 0 0 0 0 0 0
02298 BOSTON 0 0 0 0 0 0 0
02301 BROCKTON 720 94 0 0 36 4 0
02302 BROCKTON 481 54 0 0 10 4 0
02303 BROCKTON 8 1 0 0 1 0 0
02304 BROCKTON 1 0 0 0 0 0 0
02305 BROCKTON 0 0 0 0 0 0 0
02360 PLYMOUTH 1,798 227 0 0 54 8 0
02361 PLYMOUTH 1 1 0 0 0 0 0
02362 PLYMOUTH 1 1 0 0 0 0 0
02381 WHITE HORSE BEACH 2 0 0 0 0 0 0
02532 BUZZARDS BAY 108 7 0 0 2 1 0
02534 CATAUMET 6 0 0 0 0 0 0
02535 CHILMARK 0 0 0 0 0 0 0
02536 EAST FALMOUTH 276 19 0 0 4 2 0
02537 EAST SANDWICH 84 15 0 0 3 0 0
02538 EAST WAREHAM 45 12 0 0 0 0 0
02539 EDGARTOWN 0 0 0 0 0 0 0
02540 FALMOUTH 71 8 0 0 3 1 0
02541 FALMOUTH 1 0 0 0 0 0 0
02542 BUZZARDS BAY 1 0 0 0 0 0 0
02543 WOODS HOLE 5 0 0 0 0 0 0
02552 MENEMSHA 0 0 0 0 0 0 0
02553 MONUMENT BEACH 7 0 0 0 0 0 0
02554 NANTUCKET 0 0 0 0 0 0 0
02556 NORTH FALMOUTH 34 3 0 0 0 0 0
02557 OAK BLUFFS 0 0 0 0 0 0 0
02558 ONSET 18 2 0 0 0 0 0
02559 POCASSET 25 3 0 0 1 0 0
02561 SAGAMORE 10 2 0 0 0 0 0
02562 SAGAMORE BEACH 30 6 0 0 2 0 0
02563 SANDWICH 196 11 0 0 1 1 0
02564 SIASCONSET 0 0 0 0 0 0 0
02565 SILVER BEACH 1 0 0 0 0 0 0
02568 VINEYARD HAVEN 0 0 0 0 0 0 0
02571 WAREHAM 107 15 1 1 4 0 0
02573 WEST CHOP 0 0 0 0 0 0 0
194
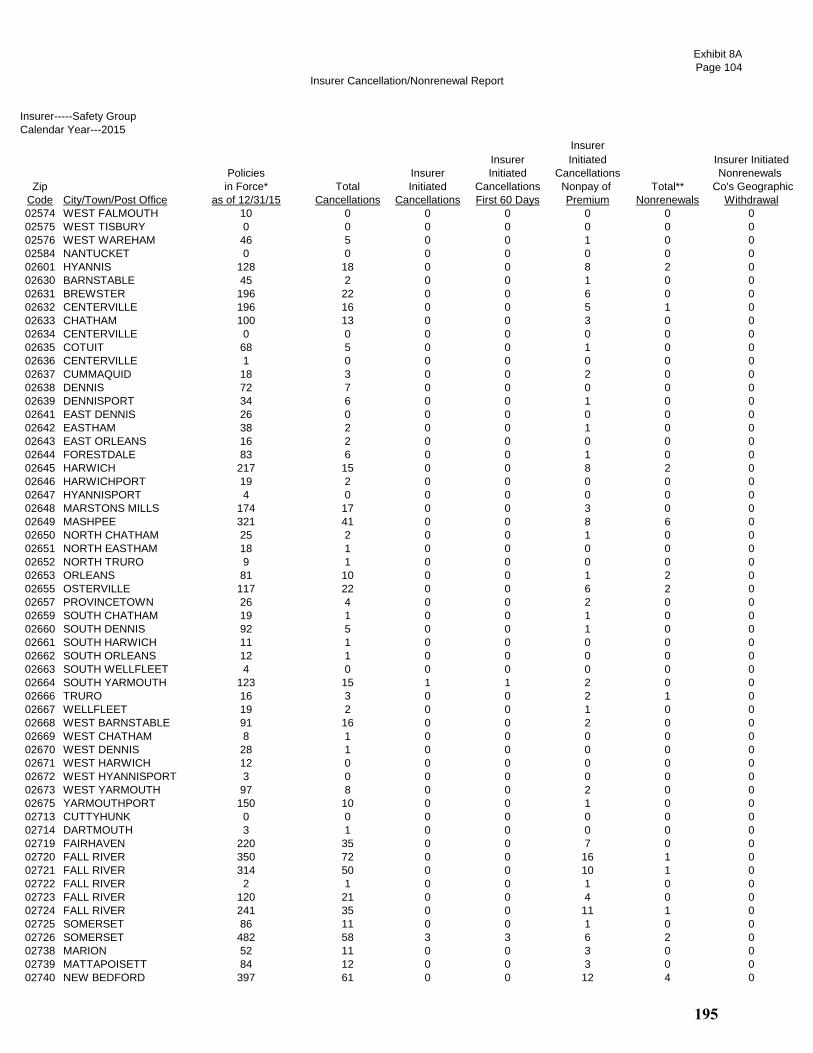
Insurer Cancellation/Nonrenewal Report
Exhibit 8A
Page 104
Insurer-----Safety Group
Calendar Year---2015
Insurer
Insurer Initiated Insurer Initiated
Policies Insurer Initiated Cancellations Nonrenewals
Zip in Force* Total Initiated Cancellations Nonpay of Total** Co's Geographic
Code City/Town/Post Office as of 12/31/15 Cancellations Cancellations First 60 Days Premium Nonrenewals Withdrawal
02574 WEST FALMOUTH 10 0 0 0 0 0 0
02575 WEST TISBURY 0 0 0 0 0 0 0
02576 WEST WAREHAM 46 5 0 0 1 0 0
02584 NANTUCKET 0 0 0 0 0 0 0
02601 HYANNIS 128 18 0 0 8 2 0
02630 BARNSTABLE 45 2 0 0 1 0 0
02631 BREWSTER 196 22 0 0 6 0 0
02632 CENTERVILLE 196 16 0 0 5 1 0
02633 CHATHAM 100 13 0 0 3 0 0
02634 CENTERVILLE 0 0 0 0 0 0 0
02635 COTUIT 68 5 0 0 1 0 0
02636 CENTERVILLE 1 0 0 0 0 0 0
02637 CUMMAQUID 18 3 0 0 2 0 0
02638 DENNIS 72 7 0 0 0 0 0
02639 DENNISPORT 34 6 0 0 1 0 0
02641 EAST DENNIS 26 0 0 0 0 0 0
02642 EASTHAM 38 2 0 0 1 0 0
02643 EAST ORLEANS 16 2 0 0 0 0 0
02644 FORESTDALE 83 6 0 0 1 0 0
02645 HARWICH 217 15 0 0 8 2 0
02646 HARWICHPORT 19 2 0 0 0 0 0
02647 HYANNISPORT 4 0 0 0 0 0 0
02648 MARSTONS MILLS 174 17 0 0 3 0 0
02649 MASHPEE 321 41 0 0 8 6 0
02650 NORTH CHATHAM 25 2 0 0 1 0 0
02651 NORTH EASTHAM 18 1 0 0 0 0 0
02652 NORTH TRURO 9 1 0 0 0 0 0
02653 ORLEANS 81 10 0 0 1 2 0
02655 OSTERVILLE 117 22 0 0 6 2 0
02657 PROVINCETOWN 26 4 0 0 2 0 0
02659 SOUTH CHATHAM 19 1 0 0 1 0 0
02660 SOUTH DENNIS 92 5 0 0 1 0 0
02661 SOUTH HARWICH 11 1 0 0 0 0 0
02662 SOUTH ORLEANS 12 1 0 0 0 0 0
02663 SOUTH WELLFLEET 4 0 0 0 0 0 0
02664 SOUTH YARMOUTH 123 15 1 1 2 0 0
02666 TRURO 16 3 0 0 2 1 0
02667 WELLFLEET 19 2 0 0 1 0 0
02668 WEST BARNSTABLE 91 16 0 0 2 0 0
02669 WEST CHATHAM 8 1 0 0 0 0 0
02670 WEST DENNIS 28 1 0 0 0 0 0
02671 WEST HARWICH 12 0 0 0 0 0 0
02672 WEST HYANNISPORT 3 0 0 0 0 0 0
02673 WEST YARMOUTH 97 8 0 0 2 0 0
02675 YARMOUTHPORT 150 10 0 0 1 0 0
02713 CUTTYHUNK 0 0 0 0 0 0 0
02714 DARTMOUTH 3 1 0 0 0 0 0
02719 FAIRHAVEN 220 35 0 0 7 0 0
02720 FALL RIVER 350 72 0 0 16 1 0
02721 FALL RIVER 314 50 0 0 10 1 0
02722 FALL RIVER 2 1 0 0 1 0 0
02723 FALL RIVER 120 21 0 0 4 0 0
02724 FALL RIVER 241 35 0 0 11 1 0
02725 SOMERSET 86 11 0 0 1 0 0
02726 SOMERSET 482 58 3 3 6 2 0
02738 MARION 52 11 0 0 3 0 0
02739 MATTAPOISETT 84 12 0 0 3 0 0
02740 NEW BEDFORD 397 61 0 0 12 4 0
195

Insurer Cancellation/Nonrenewal Report
Exhibit 8A
Page 105
Insurer-----Safety Group
Calendar Year---2015
Insurer
Insurer Initiated Insurer Initiated
Policies Insurer Initiated Cancellations Nonrenewals
Zip in Force* Total Initiated Cancellations Nonpay of Total** Co's Geographic
Code City/Town/Post Office as of 12/31/15 Cancellations Cancellations First 60 Days Premium Nonrenewals Withdrawal
02741 NEW BEDFORD 3 0 0 0 0 0 0
02742 NEW BEDFORD 1 0 0 0 0 0 0
02743 ACUSHNET 205 29 0 0 4 2 0
02744 NEW BEDFORD 13 3 0 0 1 0 0
02745 NEW BEDFORD 338 46 0 0 12 0 0
02746 NEW BEDFORD 57 4 0 0 2 1 0
02747 NORTH DARTMOUTH 466 78 0 0 17 0 0
02748 SOUTH DARTMOUTH 287 31 0 0 4 1 0
02777 SWANSEA 694 50 0 0 13 2 0
02790 WESTPORT 551 56 0 0 10 1 0
02791 WESTPORT POINT 18 3 0 0 0 0 0
All Zip Codes Above Combined 26,274 3,851 11 10 1,041 125 0
Urban 17,458 2,845 6 5 826 86 0
Coastal 8,816 1,006 5 5 215 39 0
*The number of policies in force as of December 31 of the 2015 calendar year that were not originally issued in the 2015 calendar year.
** "Total Nonrenewals" does not include "Insurer Initiated Nonrenewals Co's Geographic Withdrawal" totals.
196

Insurer Cancellation/Nonrenewal Report
Exhibit 8A
Page 106
Insurer-----Travelers Group
Calendar Year---2015
Insurer
Insurer Initiated Insurer Initiated
Policies Insurer Initiated Cancellations Nonrenewals
Zip in Force* Total Initiated Cancellations Nonpay of Total** Co's Geographic
Code City/Town/Post Office as of 12/31/15 Cancellations Cancellations First 60 Days Premium Nonrenewals Withdrawal
01101 SPRINGFIELD 3 0 0 0 0 0 0
01102 SPRINGFIELD 1 0 0 0 0 0 0
01103 SPRINGFIELD 14 5 0 0 3 0 0
01104 SPRINGFIELD 209 29 2 0 5 1 0
01105 SPRINGFIELD 50 10 0 0 3 0 0
01107 SPRINGFIELD 62 11 0 0 5 0 0
01108 SPRINGFIELD 275 42 2 0 10 2 0
01109 SPRINGFIELD 258 36 0 0 8 1 0
01111 SPRINGFIELD 0 0 0 0 0 0 0
01114 SPRINGFIELD 0 0 0 0 0 0 0
01115 SPRINGFIELD 1 0 0 0 0 0 0
01118 SPRINGFIELD 183 25 0 0 5 2 0
01119 SPRINGFIELD 132 22 0 0 6 0 0
01128 SPRINGFIELD 32 2 0 0 1 0 0
01129 SPRINGFIELD 110 22 2 0 3 0 0
01133 SPRINGFIELD 0 0 0 0 0 0 0
01138 SPRINGFIELD 0 0 0 0 0 0 0
01139 SPRINGFIELD 0 0 0 0 0 0 0
01144 SPRINGFIELD 0 0 0 0 0 0 0
01151 INDIAN ORCHARD 89 15 3 0 4 0 0
01152 SPRINGFIELD 0 0 0 0 0 0 0
01199 SPRINGFIELD 0 0 0 0 0 0 0
01601 WORCESTER 1 0 0 0 0 0 0
01602 WORCESTER 280 69 1 0 9 36 0
01603 WORCESTER 164 29 1 0 7 7 0
01604 WORCESTER 354 66 1 0 22 37 0
01605 WORCESTER 193 50 3 0 13 7 0
01606 WORCESTER 240 48 1 0 3 19 0
01607 WORCESTER 73 13 1 0 5 3 0
01608 WORCESTER 9 1 0 0 0 0 0
01609 WORCESTER 172 35 0 0 5 18 0
01610 WORCESTER 80 20 0 0 4 0 0
01611 CHERRY VALLEY 28 3 0 0 1 0 0
01612 PAXTON 60 13 1 0 1 5 0
01613 WORCESTER 0 1 0 0 0 0 0
01614 WORCESTER 0 0 0 0 0 0 0
01615 WORCESTER 0 0 0 0 0 0 0
01653 WORCESTER 0 0 0 0 0 0 0
01654 WORCESTER 0 0 0 0 0 0 0
01655 WORCESTER 0 0 0 0 0 0 0
01840 LAWRENCE 6 0 0 0 0 0 0
01841 LAWRENCE 101 20 1 0 6 0 0
01842 LAWRENCE 1 0 0 0 0 0 0
01843 LAWRENCE 92 19 1 0 7 1 0
01850 LOWELL 35 3 0 0 2 0 0
01851 LOWELL 58 14 0 0 5 0 0
01852 LOWELL 113 20 0 0 3 0 0
01853 LOWELL 4 0 0 0 0 0 0
01854 LOWELL 64 12 0 0 6 0 0
01901 LYNN 4 2 0 0 0 0 0
01902 LYNN 210 48 0 0 11 0 0
01903 LYNN 0 0 0 0 0 0 0
01904 LYNN 90 19 0 0 4 1 0
01905 LYNN 78 12 0 0 3 0 0
01910 LYNN 0 0 0 0 0 0 0
02020 BRANT ROCK 0 0 0 0 0 0 0
02041 GREEN HARBOR 0 0 0 0 0 0 0
02045 HULL 52 9 0 0 2 0 0
197

Insurer Cancellation/Nonrenewal Report
Exhibit 8A
Page 107
Insurer-----Travelers Group
Calendar Year---2015
Insurer
Insurer Initiated Insurer Initiated
Policies Insurer Initiated Cancellations Nonrenewals
Zip in Force* Total Initiated Cancellations Nonpay of Total** Co's Geographic
Code City/Town/Post Office as of 12/31/15 Cancellations Cancellations First 60 Days Premium Nonrenewals Withdrawal
02047 HUMAROCK 0 0 0 0 0 0 0
02055 MINOT 0 0 0 0 0 0 0
02065 OCEAN BLUFF 0 0 0 0 0 0 0
02101 BOSTON 1 0 0 0 0 0 0
02102 BOSTON 0 0 0 0 0 0 0
02103 BOSTON 0 0 0 0 0 0 0
02104 BOSTON 0 0 0 0 0 0 0
02105 BOSTON 0 0 0 0 0 0 0
02106 BOSTON 0 1 0 0 1 0 0
02107 BOSTON 1 0 0 0 0 0 0
02108 BOSTON 117 24 0 0 7 0 0
02109 BOSTON 111 28 1 0 6 1 0
02110 BOSTON 118 23 0 0 6 1 0
02111 BOSTON 180 33 0 0 6 2 0
02112 BOSTON 0 0 0 0 0 0 0
02113 BOSTON 159 43 0 0 10 0 0
02114 BOSTON 392 88 1 0 12 0 0
02115 BOSTON 273 80 1 0 22 0 0
02116 BOSTON 668 166 2 0 29 4 0
02117 BOSTON 0 0 0 0 0 0 0
02118 BOSTON 627 126 2 0 28 4 0
02119 BOSTON 87 12 0 0 5 0 0
02120 BOSTON 58 16 0 0 6 0 0
02121 BOSTON 42 3 0 0 2 0 0
02122 BOSTON 133 30 0 0 6 0 0
02123 BOSTON 0 0 0 0 0 0 0
02124 BOSTON 166 36 0 0 15 1 0
02125 BOSTON 171 37 0 0 5 1 0
02126 MATTAPAN 52 16 0 0 6 1 0
02127 BOSTON 634 154 1 0 34 2 0
02128 BOSTON 219 31 1 0 4 0 0
02129 CHARLESTOWN 428 106 0 0 12 0 0
02130 JAMAICA PLAIN 499 109 0 0 25 3 0
02131 ROSLINDALE 216 30 1 0 6 1 0
02132 WEST ROXBURY 216 39 0 0 7 0 0
02133 BOSTON 0 0 0 0 0 0 0
02134 ALLSTON 140 44 0 0 9 0 0
02135 BRIGHTON 577 160 1 1 42 0 0
02136 HYDE PARK 117 18 0 0 5 1 0
02137 READVILLE 0 1 0 0 1 0 0
02138 CAMBRIDGE 593 124 2 0 20 1 0
02139 CAMBRIDGE 529 114 2 0 31 1 0
02140 CAMBRIDGE 317 62 1 0 9 2 0
02141 CAMBRIDGE 228 53 1 0 8 1 0
02142 CAMBRIDGE 37 13 0 0 2 0 0
02143 SOMERVILLE 315 90 0 0 24 2 0
02144 SOMERVILLE 350 59 0 0 11 0 0
02145 SOMERVILLE 246 38 1 0 8 0 0
02150 CHELSEA 142 25 0 0 1 1 0
02151 REVERE 964 143 1 0 28 3 0
02152 WINTHROP 237 35 0 0 6 0 0
02163 BOSTON 5 6 0 0 2 0 0
02196 BOSTON 0 0 0 0 0 0 0
02199 BOSTON 43 9 0 0 5 0 0
02201 BOSTON 0 0 0 0 0 0 0
02202 BOSTON 0 0 0 0 0 0 0
02203 BOSTON 0 0 0 0 0 0 0
02204 BOSTON 0 0 0 0 0 0 0
198

Insurer Cancellation/Nonrenewal Report
Exhibit 8A
Page 108
Insurer-----Travelers Group
Calendar Year---2015
Insurer
Insurer Initiated Insurer Initiated
Policies Insurer Initiated Cancellations Nonrenewals
Zip in Force* Total Initiated Cancellations Nonpay of Total** Co's Geographic
Code City/Town/Post Office as of 12/31/15 Cancellations Cancellations First 60 Days Premium Nonrenewals Withdrawal
02205 BOSTON 0 0 0 0 0 0 0
02206 BOSTON 0 0 0 0 0 0 0
02207 BOSTON 0 0 0 0 0 0 0
02208 BOSTON 0 0 0 0 0 0 0
02209 BOSTON 0 0 0 0 0 0 0
02210 BOSTON 114 26 0 0 5 0 0
02211 BOSTON 0 0 0 0 0 0 0
02212 BOSTON 0 0 0 0 0 0 0
02215 BOSTON 210 37 1 0 9 1 0
02216 BOSTON 0 0 0 0 0 0 0
02217 BOSTON 0 0 0 0 0 0 0
02222 BOSTON 0 0 0 0 0 0 0
02228 EAST BOSTON 0 0 0 0 0 0 0
02238 CAMBRIDGE 0 0 0 0 0 0 0
02239 CAMBRIDGE 0 0 0 0 0 0 0
02241 BOSTON 0 0 0 0 0 0 0
02266 BOSTON 0 0 0 0 0 0 0
02283 BOSTON 0 0 0 0 0 0 0
02284 BOSTON 0 0 0 0 0 0 0
02293 BOSTON 0 0 0 0 0 0 0
02295 BOSTON 0 0 0 0 0 0 0
02297 BOSTON 0 0 0 0 0 0 0
02298 BOSTON 0 0 0 0 0 0 0
02301 BROCKTON 381 69 3 0 19 2 0
02302 BROCKTON 280 26 0 0 5 2 0
02303 BROCKTON 0 0 0 0 0 0 0
02304 BROCKTON 0 0 0 0 0 0 0
02305 BROCKTON 0 0 0 0 0 0 0
02360 PLYMOUTH 190 45 0 0 10 1 0
02361 PLYMOUTH 0 0 0 0 0 0 0
02362 PLYMOUTH 0 0 0 0 0 0 0
02381 WHITE HORSE BEACH 0 0 0 0 0 0 0
02532 BUZZARDS BAY 93 12 0 0 4 1 0
02534 CATAUMET 1 0 0 0 0 0 0
02535 CHILMARK 0 0 0 0 0 0 0
02536 EAST FALMOUTH 72 19 0 0 9 0 0
02537 EAST SANDWICH 17 7 0 0 2 0 0
02538 EAST WAREHAM 6 3 0 0 2 0 0
02539 EDGARTOWN 1 0 0 0 0 0 0
02540 FALMOUTH 71 6 0 0 0 0 0
02541 FALMOUTH 1 0 0 0 0 0 0
02542 BUZZARDS BAY 3 1 0 0 0 0 0
02543 WOODS HOLE 2 0 0 0 0 0 0
02552 MENEMSHA 0 0 0 0 0 0 0
02553 MONUMENT BEACH 1 0 0 0 0 0 0
02554 NANTUCKET 2 1 0 0 0 0 0
02556 NORTH FALMOUTH 8 5 0 0 0 0 0
02557 OAK BLUFFS 2 0 0 0 0 0 0
02558 ONSET 10 6 0 0 3 0 0
02559 POCASSET 11 4 0 0 2 0 0
02561 SAGAMORE 0 0 0 0 0 0 0
02562 SAGAMORE BEACH 9 1 0 0 0 0 0
02563 SANDWICH 59 11 0 0 1 0 0
02564 SIASCONSET 0 0 0 0 0 0 0
02565 SILVER BEACH 0 0 0 0 0 0 0
02568 VINEYARD HAVEN 2 0 0 0 0 0 0
02571 WAREHAM 33 10 0 0 3 0 0
02573 WEST CHOP 0 0 0 0 0 0 0
199
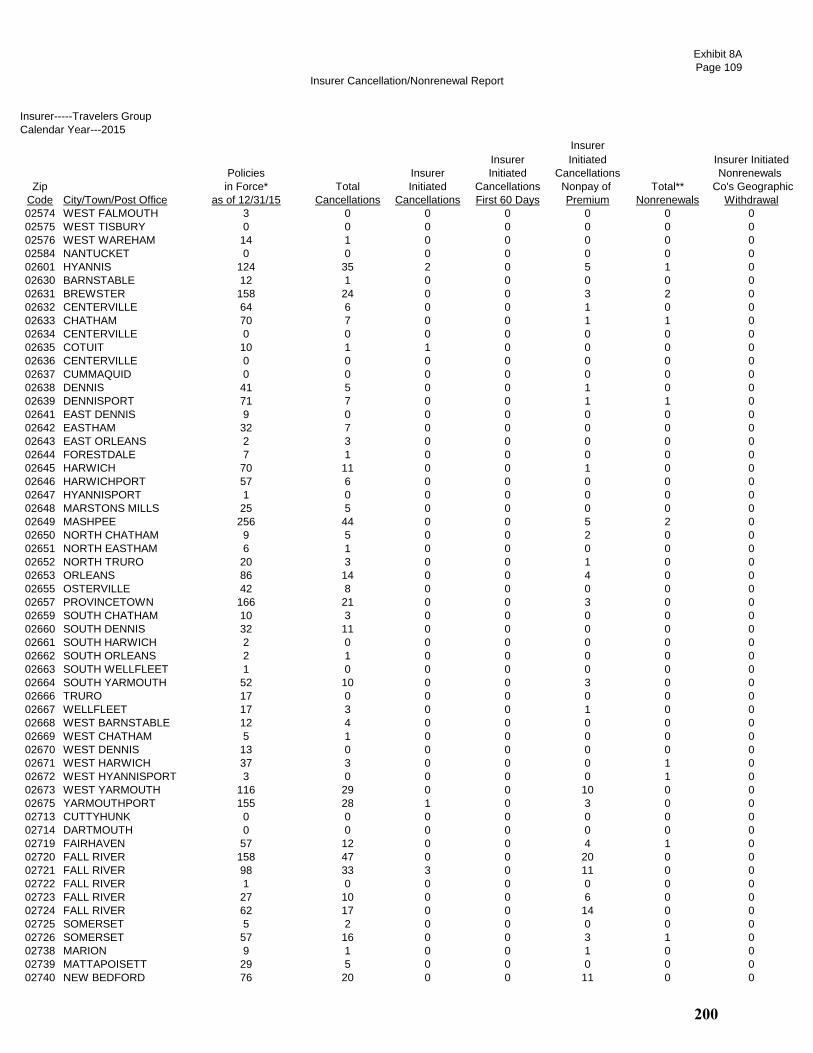
Insurer Cancellation/Nonrenewal Report
Exhibit 8A
Page 109
Insurer-----Travelers Group
Calendar Year---2015
Insurer
Insurer Initiated Insurer Initiated
Policies Insurer Initiated Cancellations Nonrenewals
Zip in Force* Total Initiated Cancellations Nonpay of Total** Co's Geographic
Code City/Town/Post Office as of 12/31/15 Cancellations Cancellations First 60 Days Premium Nonrenewals Withdrawal
02574 WEST FALMOUTH 3 0 0 0 0 0 0
02575 WEST TISBURY 0 0 0 0 0 0 0
02576 WEST WAREHAM 14 1 0 0 0 0 0
02584 NANTUCKET 0 0 0 0 0 0 0
02601 HYANNIS 124 35 2 0 5 1 0
02630 BARNSTABLE 12 1 0 0 0 0 0
02631 BREWSTER 158 24 0 0 3 2 0
02632 CENTERVILLE 64 6 0 0 1 0 0
02633 CHATHAM 70 7 0 0 1 1 0
02634 CENTERVILLE 0 0 0 0 0 0 0
02635 COTUIT 10 1 1 0 0 0 0
02636 CENTERVILLE 0 0 0 0 0 0 0
02637 CUMMAQUID 0 0 0 0 0 0 0
02638 DENNIS 41 5 0 0 1 0 0
02639 DENNISPORT 71 7 0 0 1 1 0
02641 EAST DENNIS 9 0 0 0 0 0 0
02642 EASTHAM 32 7 0 0 0 0 0
02643 EAST ORLEANS 2 3 0 0 0 0 0
02644 FORESTDALE 7 1 0 0 0 0 0
02645 HARWICH 70 11 0 0 1 0 0
02646 HARWICHPORT 57 6 0 0 0 0 0
02647 HYANNISPORT 1 0 0 0 0 0 0
02648 MARSTONS MILLS 25 5 0 0 0 0 0
02649 MASHPEE 256 44 0 0 5 2 0
02650 NORTH CHATHAM 9 5 0 0 2 0 0
02651 NORTH EASTHAM 6 1 0 0 0 0 0
02652 NORTH TRURO 20 3 0 0 1 0 0
02653 ORLEANS 86 14 0 0 4 0 0
02655 OSTERVILLE 42 8 0 0 0 0 0
02657 PROVINCETOWN 166 21 0 0 3 0 0
02659 SOUTH CHATHAM 10 3 0 0 0 0 0
02660 SOUTH DENNIS 32 11 0 0 0 0 0
02661 SOUTH HARWICH 2 0 0 0 0 0 0
02662 SOUTH ORLEANS 2 1 0 0 0 0 0
02663 SOUTH WELLFLEET 1 0 0 0 0 0 0
02664 SOUTH YARMOUTH 52 10 0 0 3 0 0
02666 TRURO 17 0 0 0 0 0 0
02667 WELLFLEET 17 3 0 0 1 0 0
02668 WEST BARNSTABLE 12 4 0 0 0 0 0
02669 WEST CHATHAM 5 1 0 0 0 0 0
02670 WEST DENNIS 13 0 0 0 0 0 0
02671 WEST HARWICH 37 3 0 0 0 1 0
02672 WEST HYANNISPORT 3 0 0 0 0 1 0
02673 WEST YARMOUTH 116 29 0 0 10 0 0
02675 YARMOUTHPORT 155 28 1 0 3 0 0
02713 CUTTYHUNK 0 0 0 0 0 0 0
02714 DARTMOUTH 0 0 0 0 0 0 0
02719 FAIRHAVEN 57 12 0 0 4 1 0
02720 FALL RIVER 158 47 0 0 20 0 0
02721 FALL RIVER 98 33 3 0 11 0 0
02722 FALL RIVER 1 0 0 0 0 0 0
02723 FALL RIVER 27 10 0 0 6 0 0
02724 FALL RIVER 62 17 0 0 14 0 0
02725 SOMERSET 5 2 0 0 0 0 0
02726 SOMERSET 57 16 0 0 3 1 0
02738 MARION 9 1 0 0 1 0 0
02739 MATTAPOISETT 29 5 0 0 0 0 0
02740 NEW BEDFORD 76 20 0 0 11 0 0
200
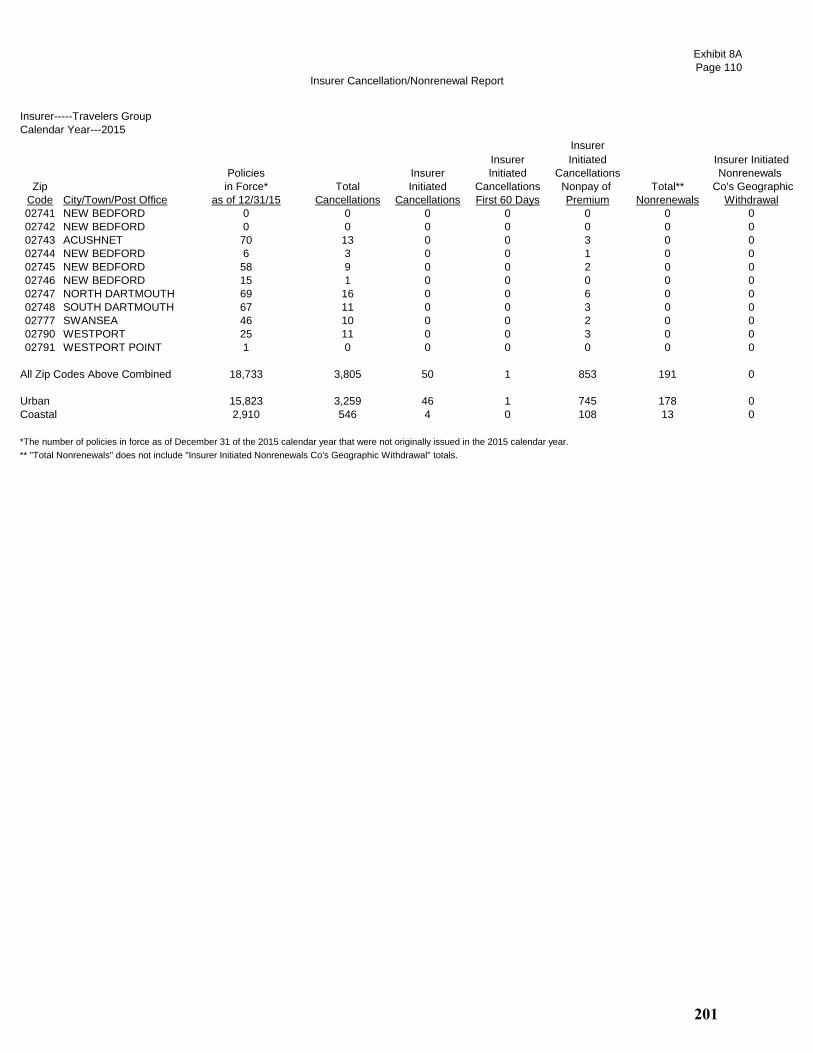
Insurer Cancellation/Nonrenewal Report
Exhibit 8A
Page 110
Insurer-----Travelers Group
Calendar Year---2015
Insurer
Insurer Initiated Insurer Initiated
Policies Insurer Initiated Cancellations Nonrenewals
Zip in Force* Total Initiated Cancellations Nonpay of Total** Co's Geographic
Code City/Town/Post Office as of 12/31/15 Cancellations Cancellations First 60 Days Premium Nonrenewals Withdrawal
02741 NEW BEDFORD 0 0 0 0 0 0 0
02742 NEW BEDFORD 0 0 0 0 0 0 0
02743 ACUSHNET 70 13 0 0 3 0 0
02744 NEW BEDFORD 6 3 0 0 1 0 0
02745 NEW BEDFORD 58 9 0 0 2 0 0
02746 NEW BEDFORD 15 1 0 0 0 0 0
02747 NORTH DARTMOUTH 69 16 0 0 6 0 0
02748 SOUTH DARTMOUTH 67 11 0 0 3 0 0
02777 SWANSEA 46 10 0 0 2 0 0
02790 WESTPORT 25 11 0 0 3 0 0
02791 WESTPORT POINT 1 0 0 0 0 0 0
All Zip Codes Above Combined 18,733 3,805 50 1 853 191 0
Urban 15,823 3,259 46 1 745 178 0
Coastal 2,910 546 4 0 108 13 0
*The number of policies in force as of December 31 of the 2015 calendar year that were not originally issued in the 2015 calendar year.
** "Total Nonrenewals" does not include "Insurer Initiated Nonrenewals Co's Geographic Withdrawal" totals.
201
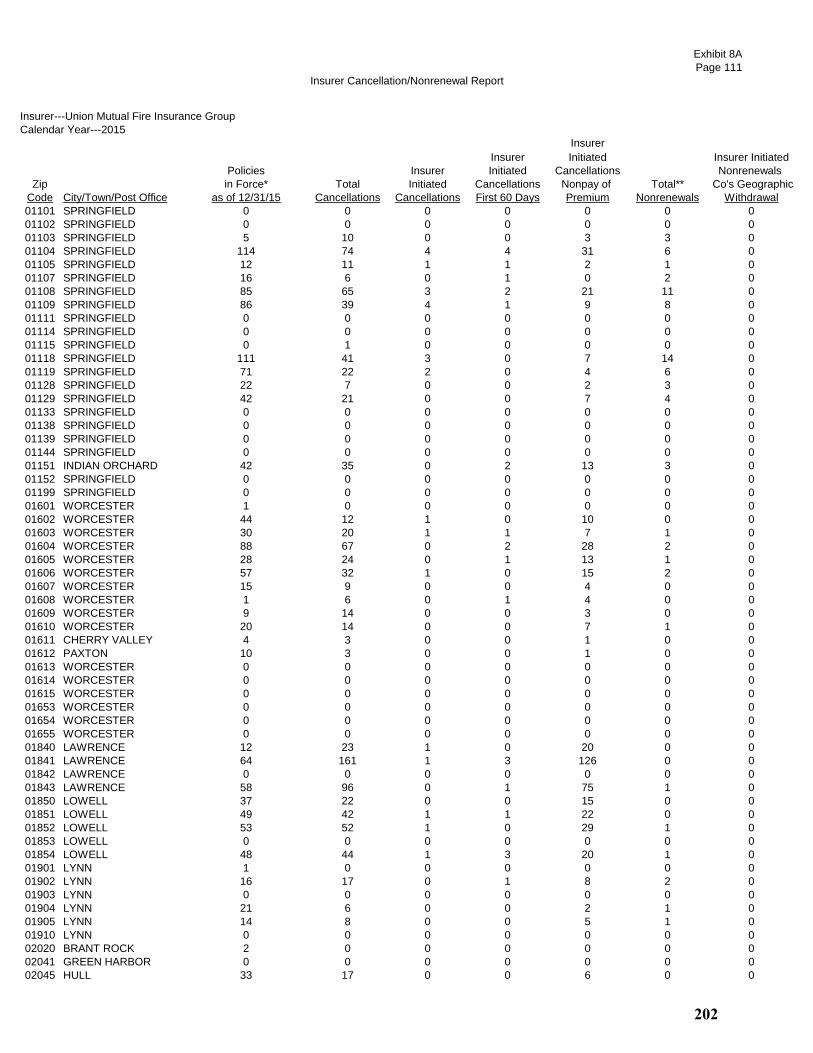
Insurer Cancellation/Nonrenewal Report
Exhibit 8A
Page 111
Insurer---Union Mutual Fire Insurance Group
Calendar Year---2015
Insurer
Insurer Initiated Insurer Initiated
Policies Insurer Initiated Cancellations Nonrenewals
Zip in Force* Total Initiated Cancellations Nonpay of Total** Co's Geographic
Code City/Town/Post Office as of 12/31/15 Cancellations Cancellations First 60 Days Premium Nonrenewals Withdrawal
01101 SPRINGFIELD 0 0 0 0 0 0 0
01102 SPRINGFIELD 0 0 0 0 0 0 0
01103 SPRINGFIELD 5 10 0 0 3 3 0
01104 SPRINGFIELD 114 74 4 4 31 6 0
01105 SPRINGFIELD 12 11 1 1 2 1 0
01107 SPRINGFIELD 16 6 0 1 0 2 0
01108 SPRINGFIELD 85 65 3 2 21 11 0
01109 SPRINGFIELD 86 39 4 1 9 8 0
01111 SPRINGFIELD 0 0 0 0 0 0 0
01114 SPRINGFIELD 0 0 0 0 0 0 0
01115 SPRINGFIELD 0 1 0 0 0 0 0
01118 SPRINGFIELD 111 41 3 0 7 14 0
01119 SPRINGFIELD 71 22 2 0 4 6 0
01128 SPRINGFIELD 22 7 0 0 2 3 0
01129 SPRINGFIELD 42 21 0 0 7 4 0
01133 SPRINGFIELD 0 0 0 0 0 0 0
01138 SPRINGFIELD 0 0 0 0 0 0 0
01139 SPRINGFIELD 0 0 0 0 0 0 0
01144 SPRINGFIELD 0 0 0 0 0 0 0
01151 INDIAN ORCHARD 42 35 0 2 13 3 0
01152 SPRINGFIELD 0 0 0 0 0 0 0
01199 SPRINGFIELD 0 0 0 0 0 0 0
01601 WORCESTER 1 0 0 0 0 0 0
01602 WORCESTER 44 12 1 0 10 0 0
01603 WORCESTER 30 20 1 1 7 1 0
01604 WORCESTER 88 67 0 2 28 2 0
01605 WORCESTER 28 24 0 1 13 1 0
01606 WORCESTER 57 32 1 0 15 2 0
01607 WORCESTER 15 9 0 0 4 0 0
01608 WORCESTER 1 6 0 1 4 0 0
01609 WORCESTER 9 14 0 0 3 0 0
01610 WORCESTER 20 14 0 0 7 1 0
01611 CHERRY VALLEY 4 3 0 0 1 0 0
01612 PAXTON 10 3 0 0 1 0 0
01613 WORCESTER 0 0 0 0 0 0 0
01614 WORCESTER 0 0 0 0 0 0 0
01615 WORCESTER 0 0 0 0 0 0 0
01653 WORCESTER 0 0 0 0 0 0 0
01654 WORCESTER 0 0 0 0 0 0 0
01655 WORCESTER 0 0 0 0 0 0 0
01840 LAWRENCE 12 23 1 0 20 0 0
01841 LAWRENCE 64 161 1 3 126 0 0
01842 LAWRENCE 0 0 0 0 0 0 0
01843 LAWRENCE 58 96 0 1 75 1 0
01850 LOWELL 37 22 0 0 15 0 0
01851 LOWELL 49 42 1 1 22 0 0
01852 LOWELL 53 52 1 0 29 1 0
01853 LOWELL 0 0 0 0 0 0 0
01854 LOWELL 48 44 1 3 20 1 0
01901 LYNN 1 0 0 0 0 0 0
01902 LYNN 16 17 0 1 8 2 0
01903 LYNN 0 0 0 0 0 0 0
01904 LYNN 21 6 0 0 2 1 0
01905 LYNN 14 8 0 0 5 1 0
01910 LYNN 0 0 0 0 0 0 0
02020 BRANT ROCK 2 0 0 0 0 0 0
02041 GREEN HARBOR 0 0 0 0 0 0 0
02045 HULL 33 17 0 0 6 0 0
202

Insurer Cancellation/Nonrenewal Report
Exhibit 8A
Page 112
Insurer---Union Mutual Fire Insurance Group
Calendar Year---2015
Insurer
Insurer Initiated Insurer Initiated
Policies Insurer Initiated Cancellations Nonrenewals
Zip in Force* Total Initiated Cancellations Nonpay of Total** Co's Geographic
Code City/Town/Post Office as of 12/31/15 Cancellations Cancellations First 60 Days Premium Nonrenewals Withdrawal
02047 HUMAROCK 2 1 0 0 0 0 0
02055 MINOT 0 0 0 0 0 0 0
02065 OCEAN BLUFF 0 0 0 0 0 0 0
02101 BOSTON 0 0 0 0 0 0 0
02102 BOSTON 0 0 0 0 0 0 0
02103 BOSTON 0 0 0 0 0 0 0
02104 BOSTON 0 0 0 0 0 0 0
02105 BOSTON 0 0 0 0 0 0 0
02106 BOSTON 0 0 0 0 0 0 0
02107 BOSTON 0 0 0 0 0 0 0
02108 BOSTON 2 5 0 0 1 0 0
02109 BOSTON 8 8 0 0 2 0 0
02110 BOSTON 2 5 0 1 1 1 0
02111 BOSTON 4 10 0 0 7 1 0
02112 BOSTON 0 0 0 0 0 0 0
02113 BOSTON 9 14 0 0 6 0 0
02114 BOSTON 25 16 0 1 7 0 0
02115 BOSTON 23 18 0 0 8 0 0
02116 BOSTON 28 25 0 1 9 3 0
02117 BOSTON 0 0 0 0 0 0 0
02118 BOSTON 22 25 0 2 11 4 0
02119 BOSTON 17 13 0 0 7 2 0
02120 BOSTON 10 10 0 0 7 1 0
02121 BOSTON 7 11 0 1 7 0 0
02122 BOSTON 15 30 0 0 16 8 0
02123 BOSTON 0 0 0 0 0 0 0
02124 BOSTON 22 33 0 0 22 2 0
02125 BOSTON 15 28 0 0 14 26 0
02126 MATTAPAN 8 12 0 0 9 2 0
02127 BOSTON 28 54 0 1 27 5 0
02128 BOSTON 16 20 0 0 9 0 0
02129 CHARLESTOWN 23 26 0 0 11 0 0
02130 JAMAICA PLAIN 69 58 0 1 19 2 0
02131 ROSLINDALE 41 38 0 0 17 2 0
02132 WEST ROXBURY 28 26 0 0 11 2 0
02133 BOSTON 0 0 0 0 0 0 0
02134 ALLSTON 27 24 0 0 9 3 0
02135 BRIGHTON 61 70 0 1 36 4 0
02136 HYDE PARK 30 23 0 0 15 4 0
02137 READVILLE 1 0 0 0 0 0 0
02138 CAMBRIDGE 38 28 0 0 14 3 0
02139 CAMBRIDGE 38 32 0 1 17 1 0
02140 CAMBRIDGE 21 16 0 0 6 2 0
02141 CAMBRIDGE 9 12 0 0 7 0 0
02142 CAMBRIDGE 0 5 0 0 2 0 0
02143 SOMERVILLE 46 44 0 1 27 3 0
02144 SOMERVILLE 61 35 0 0 16 3 0
02145 SOMERVILLE 46 32 0 0 18 2 0
02150 CHELSEA 11 26 0 0 10 3 0
02151 REVERE 46 23 0 2 10 4 0
02152 WINTHROP 13 15 0 0 5 0 0
02163 BOSTON 1 0 0 0 0 0 0
02196 BOSTON 0 0 0 0 0 0 0
02199 BOSTON 1 3 0 0 0 0 0
02201 BOSTON 0 0 0 0 0 0 0
02202 BOSTON 0 0 0 0 0 0 0
02203 BOSTON 0 0 0 0 0 0 0
02204 BOSTON 0 0 0 0 0 0 0
203

Insurer Cancellation/Nonrenewal Report
Exhibit 8A
Page 113
Insurer---Union Mutual Fire Insurance Group
Calendar Year---2015
Insurer
Insurer Initiated Insurer Initiated
Policies Insurer Initiated Cancellations Nonrenewals
Zip in Force* Total Initiated Cancellations Nonpay of Total** Co's Geographic
Code City/Town/Post Office as of 12/31/15 Cancellations Cancellations First 60 Days Premium Nonrenewals Withdrawal
02205 BOSTON 0 0 0 0 0 0 0
02206 BOSTON 0 0 0 0 0 0 0
02207 BOSTON 0 0 0 0 0 0 0
02208 BOSTON 0 0 0 0 0 0 0
02209 BOSTON 0 0 0 0 0 0 0
02210 BOSTON 8 6 0 0 3 0 0
02211 BOSTON 0 0 0 0 0 0 0
02212 BOSTON 0 0 0 0 0 0 0
02215 BOSTON 17 20 0 1 7 0 0
02216 BOSTON 0 0 0 0 0 0 0
02217 BOSTON 0 0 0 0 0 0 0
02222 BOSTON 0 0 0 0 0 0 0
02228 EAST BOSTON 0 0 0 0 0 0 0
02238 CAMBRIDGE 0 0 0 0 0 0 0
02239 CAMBRIDGE 0 0 0 0 0 0 0
02241 BOSTON 0 0 0 0 0 0 0
02266 BOSTON 0 0 0 0 0 0 0
02283 BOSTON 0 0 0 0 0 0 0
02284 BOSTON 0 0 0 0 0 0 0
02293 BOSTON 0 0 0 0 0 0 0
02295 BOSTON 0 0 0 0 0 0 0
02297 BOSTON 0 0 0 0 0 0 0
02298 BOSTON 0 0 0 0 0 0 0
02301 BROCKTON 79 42 1 0 15 5 0
02302 BROCKTON 34 17 2 1 4 2 0
02303 BROCKTON 0 0 0 0 0 0 0
02304 BROCKTON 0 0 0 0 0 0 0
02305 BROCKTON 0 0 0 0 0 0 0
02360 PLYMOUTH 195 168 1 5 57 63 0
02361 PLYMOUTH 1 0 0 0 0 0 0
02362 PLYMOUTH 1 0 0 0 0 1 0
02381 WHITE HORSE BEACH 0 0 0 0 0 0 0
02532 BUZZARDS BAY 14 9 0 0 3 2 0
02534 CATAUMET 1 0 0 0 0 0 0
02535 CHILMARK 1 1 0 0 0 0 0
02536 EAST FALMOUTH 11 2 0 0 1 0 0
02537 EAST SANDWICH 15 3 0 0 0 1 0
02538 EAST WAREHAM 28 5 0 1 2 0 0
02539 EDGARTOWN 1 1 0 0 0 0 0
02540 FALMOUTH 1 3 0 0 0 0 0
02541 FALMOUTH 0 0 0 0 0 0 0
02542 BUZZARDS BAY 0 0 0 0 0 0 0
02543 WOODS HOLE 0 1 0 0 0 0 0
02552 MENEMSHA 0 0 0 0 0 0 0
02553 MONUMENT BEACH 2 0 0 0 0 0 0
02554 NANTUCKET 1 0 0 0 0 0 0
02556 NORTH FALMOUTH 7 5 0 0 2 0 0
02557 OAK BLUFFS 0 1 0 0 0 0 0
02558 ONSET 6 4 0 0 2 0 0
02559 POCASSET 5 2 0 0 0 0 0
02561 SAGAMORE 1 0 0 0 0 0 0
02562 SAGAMORE BEACH 9 9 0 0 3 0 0
02563 SANDWICH 12 5 0 0 2 2 0
02564 SIASCONSET 0 0 0 0 0 0 0
02565 SILVER BEACH 0 0 0 0 0 0 0
02568 VINEYARD HAVEN 3 0 0 0 0 0 0
02571 WAREHAM 40 17 0 1 4 3 0
02573 WEST CHOP 1 0 0 0 0 0 0
204

Insurer Cancellation/Nonrenewal Report
Exhibit 8A
Page 114
Insurer---Union Mutual Fire Insurance Group
Calendar Year---2015
Insurer
Insurer Initiated Insurer Initiated
Policies Insurer Initiated Cancellations Nonrenewals
Zip in Force* Total Initiated Cancellations Nonpay of Total** Co's Geographic
Code City/Town/Post Office as of 12/31/15 Cancellations Cancellations First 60 Days Premium Nonrenewals Withdrawal
02574 WEST FALMOUTH 0 0 0 0 0 0 0
02575 WEST TISBURY 1 0 0 0 0 0 0
02576 WEST WAREHAM 20 7 0 0 2 1 0
02584 NANTUCKET 0 0 0 0 0 0 0
02601 HYANNIS 5 3 0 0 1 0 0
02630 BARNSTABLE 0 4 1 0 1 0 0
02631 BREWSTER 9 6 0 0 1 0 0
02632 CENTERVILLE 2 3 0 0 0 0 0
02633 CHATHAM 2 4 0 0 3 0 0
02634 CENTERVILLE 0 0 0 0 0 0 0
02635 COTUIT 2 1 0 0 0 0 0
02636 CENTERVILLE 0 0 0 0 0 0 0
02637 CUMMAQUID 0 0 0 0 0 0 0
02638 DENNIS 4 0 0 0 0 0 0
02639 DENNISPORT 2 1 0 0 0 0 0
02641 EAST DENNIS 1 1 0 0 0 0 0
02642 EASTHAM 1 2 0 0 1 0 0
02643 EAST ORLEANS 0 0 0 0 0 0 0
02644 FORESTDALE 5 2 0 0 1 0 0
02645 HARWICH 5 1 0 0 0 0 0
02646 HARWICHPORT 0 1 0 0 0 0 0
02647 HYANNISPORT 0 1 0 0 1 0 0
02648 MARSTONS MILLS 3 1 0 0 0 0 0
02649 MASHPEE 16 4 0 0 1 0 0
02650 NORTH CHATHAM 0 0 0 0 0 0 0
02651 NORTH EASTHAM 1 0 0 0 0 0 0
02652 NORTH TRURO 0 0 0 0 0 0 0
02653 ORLEANS 1 1 0 0 0 0 0
02655 OSTERVILLE 1 0 0 0 0 0 0
02657 PROVINCETOWN 3 4 0 0 0 1 0
02659 SOUTH CHATHAM 1 1 0 0 1 0 0
02660 SOUTH DENNIS 3 2 0 0 1 0 0
02661 SOUTH HARWICH 0 0 0 0 0 0 0
02662 SOUTH ORLEANS 0 0 0 0 0 0 0
02663 SOUTH WELLFLEET 0 0 0 0 0 0 0
02664 SOUTH YARMOUTH 3 1 0 0 0 0 0
02666 TRURO 2 2 0 0 0 1 0
02667 WELLFLEET 1 1 0 0 0 0 0
02668 WEST BARNSTABLE 3 0 0 0 0 0 0
02669 WEST CHATHAM 0 0 0 0 0 0 0
02670 WEST DENNIS 2 0 0 0 0 0 0
02671 WEST HARWICH 0 1 0 0 0 0 0
02672 WEST HYANNISPORT 0 0 0 0 0 0 0
02673 WEST YARMOUTH 6 4 0 0 2 0 0
02675 YARMOUTHPORT 3 2 0 0 1 0 0
02713 CUTTYHUNK 0 0 0 0 0 0 0
02714 DARTMOUTH 0 1 0 0 1 0 0
02719 FAIRHAVEN 76 53 0 1 10 1 0
02720 FALL RIVER 194 125 3 2 43 11 0
02721 FALL RIVER 157 124 0 1 33 4 0
02722 FALL RIVER 0 0 0 0 0 0 0
02723 FALL RIVER 74 66 0 2 20 4 0
02724 FALL RIVER 73 58 1 2 16 2 0
02725 SOMERSET 20 11 0 0 3 0 0
02726 SOMERSET 133 89 1 2 22 0 0
02738 MARION 15 9 0 1 4 0 0
02739 MATTAPOISETT 39 15 0 1 5 4 0
02740 NEW BEDFORD 107 63 2 4 19 4 0
205
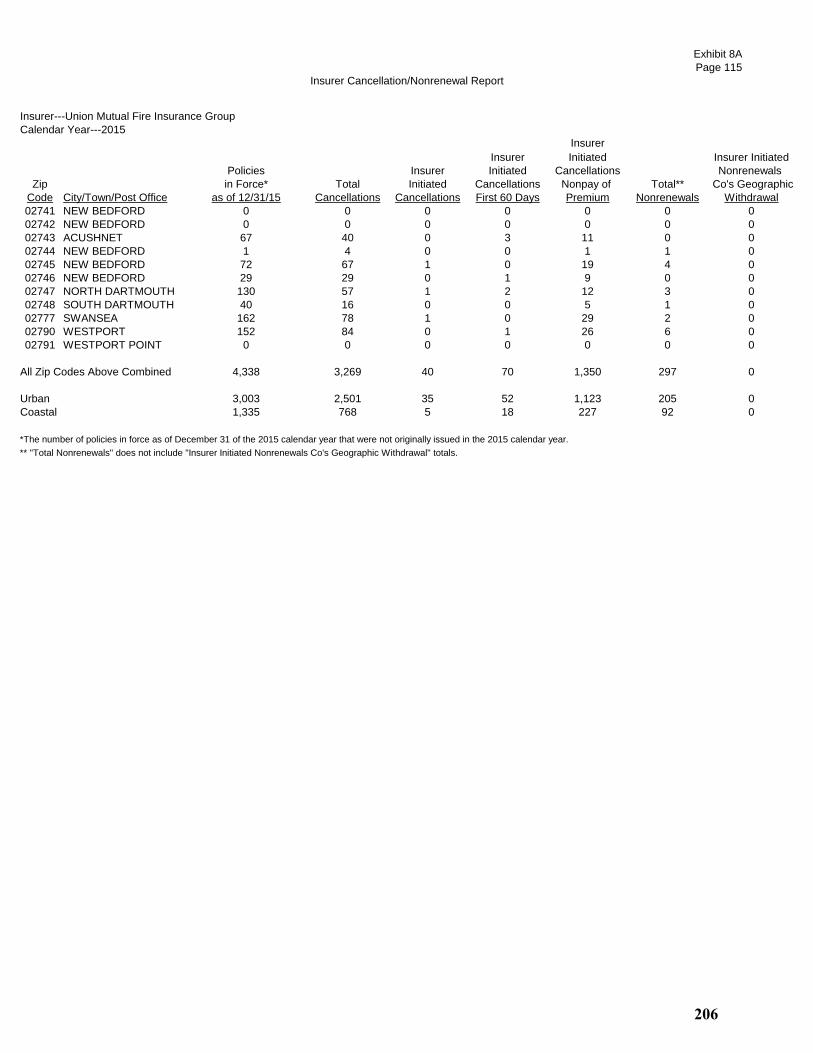
Insurer Cancellation/Nonrenewal Report
Exhibit 8A
Page 115
Insurer---Union Mutual Fire Insurance Group
Calendar Year---2015
Insurer
Insurer Initiated Insurer Initiated
Policies Insurer Initiated Cancellations Nonrenewals
Zip in Force* Total Initiated Cancellations Nonpay of Total** Co's Geographic
Code City/Town/Post Office as of 12/31/15 Cancellations Cancellations First 60 Days Premium Nonrenewals Withdrawal
02741 NEW BEDFORD 0 0 0 0 0 0 0
02742 NEW BEDFORD 0 0 0 0 0 0 0
02743 ACUSHNET 67 40 0 3 11 0 0
02744 NEW BEDFORD 1 4 0 0 1 1 0
02745 NEW BEDFORD 72 67 1 0 19 4 0
02746 NEW BEDFORD 29 29 0 1 9 0 0
02747 NORTH DARTMOUTH 130 57 1 2 12 3 0
02748 SOUTH DARTMOUTH 40 16 0 0 5 1 0
02777 SWANSEA 162 78 1 0 29 2 0
02790 WESTPORT 152 84 0 1 26 6 0
02791 WESTPORT POINT 0 0 0 0 0 0 0
All Zip Codes Above Combined 4,338 3,269 40 70 1,350 297 0
Urban 3,003 2,501 35 52 1,123 205 0
Coastal 1,335 768 5 18 227 92 0
*The number of policies in force as of December 31 of the 2015 calendar year that were not originally issued in the 2015 calendar year.
** "Total Nonrenewals" does not include "Insurer Initiated Nonrenewals Co's Geographic Withdrawal" totals.
206
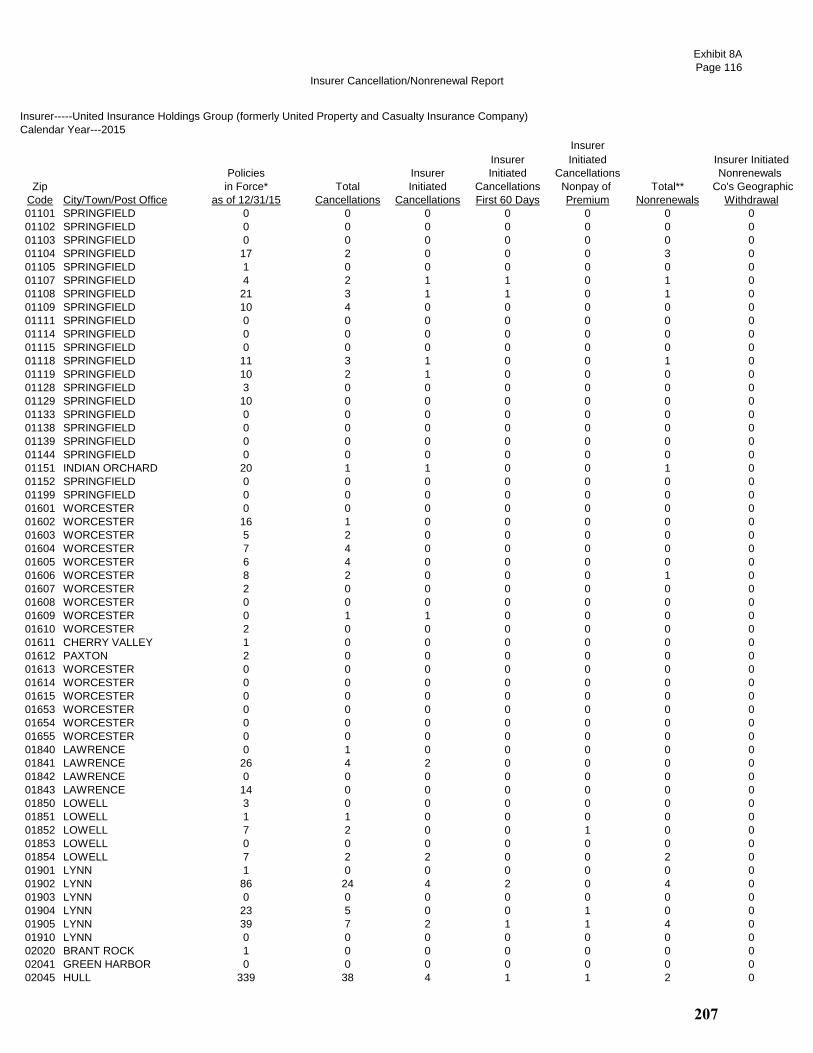
Insurer Cancellation/Nonrenewal Report
Exhibit 8A
Page 116
Insurer-----United Insurance Holdings Group (formerly United Property and Casualty Insurance Company)
Calendar Year---2015
Insurer
Insurer Initiated Insurer Initiated
Policies Insurer Initiated Cancellations Nonrenewals
Zip in Force* Total Initiated Cancellations Nonpay of Total** Co's Geographic
Code City/Town/Post Office as of 12/31/15 Cancellations Cancellations First 60 Days Premium Nonrenewals Withdrawal
01101 SPRINGFIELD 0 0 0 0 0 0 0
01102 SPRINGFIELD 0 0 0 0 0 0 0
01103 SPRINGFIELD 0 0 0 0 0 0 0
01104 SPRINGFIELD 17 2 0 0 0 3 0
01105 SPRINGFIELD 1 0 0 0 0 0 0
01107 SPRINGFIELD 4 2 1 1 0 1 0
01108 SPRINGFIELD 21 3 1 1 0 1 0
01109 SPRINGFIELD 10 4 0 0 0 0 0
01111 SPRINGFIELD 0 0 0 0 0 0 0
01114 SPRINGFIELD 0 0 0 0 0 0 0
01115 SPRINGFIELD 0 0 0 0 0 0 0
01118 SPRINGFIELD 11 3 1 0 0 1 0
01119 SPRINGFIELD 10 2 1 0 0 0 0
01128 SPRINGFIELD 3 0 0 0 0 0 0
01129 SPRINGFIELD 10 0 0 0 0 0 0
01133 SPRINGFIELD 0 0 0 0 0 0 0
01138 SPRINGFIELD 0 0 0 0 0 0 0
01139 SPRINGFIELD 0 0 0 0 0 0 0
01144 SPRINGFIELD 0 0 0 0 0 0 0
01151 INDIAN ORCHARD 20 1 1 0 0 1 0
01152 SPRINGFIELD 0 0 0 0 0 0 0
01199 SPRINGFIELD 0 0 0 0 0 0 0
01601 WORCESTER 0 0 0 0 0 0 0
01602 WORCESTER 16 1 0 0 0 0 0
01603 WORCESTER 5 2 0 0 0 0 0
01604 WORCESTER 7 4 0 0 0 0 0
01605 WORCESTER 6 4 0 0 0 0 0
01606 WORCESTER 8 2 0 0 0 1 0
01607 WORCESTER 2 0 0 0 0 0 0
01608 WORCESTER 0 0 0 0 0 0 0
01609 WORCESTER 0 1 1 0 0 0 0
01610 WORCESTER 2 0 0 0 0 0 0
01611 CHERRY VALLEY 1 0 0 0 0 0 0
01612 PAXTON 2 0 0 0 0 0 0
01613 WORCESTER 0 0 0 0 0 0 0
01614 WORCESTER 0 0 0 0 0 0 0
01615 WORCESTER 0 0 0 0 0 0 0
01653 WORCESTER 0 0 0 0 0 0 0
01654 WORCESTER 0 0 0 0 0 0 0
01655 WORCESTER 0 0 0 0 0 0 0
01840 LAWRENCE 0 1 0 0 0 0 0
01841 LAWRENCE 26 4 2 0 0 0 0
01842 LAWRENCE 0 0 0 0 0 0 0
01843 LAWRENCE 14 0 0 0 0 0 0
01850 LOWELL 3 0 0 0 0 0 0
01851 LOWELL 1 1 0 0 0 0 0
01852 LOWELL 7 2 0 0 1 0 0
01853 LOWELL 0 0 0 0 0 0 0
01854 LOWELL 7 2 2 0 0 2 0
01901 LYNN 1 0 0 0 0 0 0
01902 LYNN 86 24 4 2 0 4 0
01903 LYNN 0 0 0 0 0 0 0
01904 LYNN 23 5 0 0 1 0 0
01905 LYNN 39 7 2 1 1 4 0
01910 LYNN 0 0 0 0 0 0 0
02020 BRANT ROCK 1 0 0 0 0 0 0
02041 GREEN HARBOR 0 0 0 0 0 0 0
02045 HULL 339 38 4 1 1 2 0
207
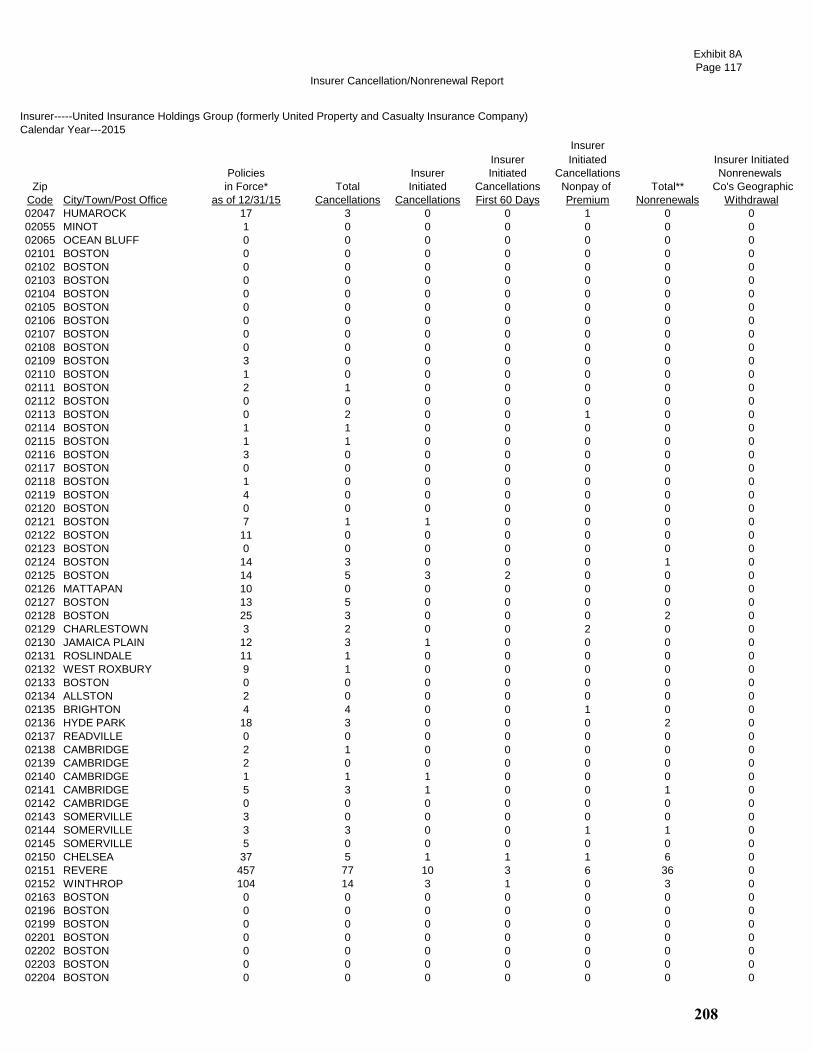
Insurer Cancellation/Nonrenewal Report
Exhibit 8A
Page 117
Insurer-----United Insurance Holdings Group (formerly United Property and Casualty Insurance Company)
Calendar Year---2015
Insurer
Insurer Initiated Insurer Initiated
Policies Insurer Initiated Cancellations Nonrenewals
Zip in Force* Total Initiated Cancellations Nonpay of Total** Co's Geographic
Code City/Town/Post Office as of 12/31/15 Cancellations Cancellations First 60 Days Premium Nonrenewals Withdrawal
02047 HUMAROCK 17 3 0 0 1 0 0
02055 MINOT 1 0 0 0 0 0 0
02065 OCEAN BLUFF 0 0 0 0 0 0 0
02101 BOSTON 0 0 0 0 0 0 0
02102 BOSTON 0 0 0 0 0 0 0
02103 BOSTON 0 0 0 0 0 0 0
02104 BOSTON 0 0 0 0 0 0 0
02105 BOSTON 0 0 0 0 0 0 0
02106 BOSTON 0 0 0 0 0 0 0
02107 BOSTON 0 0 0 0 0 0 0
02108 BOSTON 0 0 0 0 0 0 0
02109 BOSTON 3 0 0 0 0 0 0
02110 BOSTON 1 0 0 0 0 0 0
02111 BOSTON 2 1 0 0 0 0 0
02112 BOSTON 0 0 0 0 0 0 0
02113 BOSTON 0 2 0 0 1 0 0
02114 BOSTON 1 1 0 0 0 0 0
02115 BOSTON 1 1 0 0 0 0 0
02116 BOSTON 3 0 0 0 0 0 0
02117 BOSTON 0 0 0 0 0 0 0
02118 BOSTON 1 0 0 0 0 0 0
02119 BOSTON 4 0 0 0 0 0 0
02120 BOSTON 0 0 0 0 0 0 0
02121 BOSTON 7 1 1 0 0 0 0
02122 BOSTON 11 0 0 0 0 0 0
02123 BOSTON 0 0 0 0 0 0 0
02124 BOSTON 14 3 0 0 0 1 0
02125 BOSTON 14 5 3 2 0 0 0
02126 MATTAPAN 10 0 0 0 0 0 0
02127 BOSTON 13 5 0 0 0 0 0
02128 BOSTON 25 3 0 0 0 2 0
02129 CHARLESTOWN 3 2 0 0 2 0 0
02130 JAMAICA PLAIN 12 3 1 0 0 0 0
02131 ROSLINDALE 11 1 0 0 0 0 0
02132 WEST ROXBURY 9 1 0 0 0 0 0
02133 BOSTON 0 0 0 0 0 0 0
02134 ALLSTON 2 0 0 0 0 0 0
02135 BRIGHTON 4 4 0 0 1 0 0
02136 HYDE PARK 18 3 0 0 0 2 0
02137 READVILLE 0 0 0 0 0 0 0
02138 CAMBRIDGE 2 1 0 0 0 0 0
02139 CAMBRIDGE 2 0 0 0 0 0 0
02140 CAMBRIDGE 1 1 1 0 0 0 0
02141 CAMBRIDGE 5 3 1 0 0 1 0
02142 CAMBRIDGE 0 0 0 0 0 0 0
02143 SOMERVILLE 3 0 0 0 0 0 0
02144 SOMERVILLE 3 3 0 0 1 1 0
02145 SOMERVILLE 5 0 0 0 0 0 0
02150 CHELSEA 37 5 1 1 1 6 0
02151 REVERE 457 77 10 3 6 36 0
02152 WINTHROP 104 14 3 1 0 3 0
02163 BOSTON 0 0 0 0 0 0 0
02196 BOSTON 0 0 0 0 0 0 0
02199 BOSTON 0 0 0 0 0 0 0
02201 BOSTON 0 0 0 0 0 0 0
02202 BOSTON 0 0 0 0 0 0 0
02203 BOSTON 0 0 0 0 0 0 0
02204 BOSTON 0 0 0 0 0 0 0
208

Insurer Cancellation/Nonrenewal Report
Exhibit 8A
Page 118
Insurer-----United Insurance Holdings Group (formerly United Property and Casualty Insurance Company)
Calendar Year---2015
Insurer
Insurer Initiated Insurer Initiated
Policies Insurer Initiated Cancellations Nonrenewals
Zip in Force* Total Initiated Cancellations Nonpay of Total** Co's Geographic
Code City/Town/Post Office as of 12/31/15 Cancellations Cancellations First 60 Days Premium Nonrenewals Withdrawal
02205 BOSTON 0 0 0 0 0 0 0
02206 BOSTON 0 0 0 0 0 0 0
02207 BOSTON 0 0 0 0 0 0 0
02208 BOSTON 0 0 0 0 0 0 0
02209 BOSTON 0 0 0 0 0 0 0
02210 BOSTON 0 0 0 0 0 0 0
02211 BOSTON 0 0 0 0 0 0 0
02212 BOSTON 0 0 0 0 0 0 0
02215 BOSTON 1 0 0 0 0 0 0
02216 BOSTON 0 0 0 0 0 0 0
02217 BOSTON 0 0 0 0 0 0 0
02222 BOSTON 0 0 0 0 0 0 0
02228 EAST BOSTON 0 0 0 0 0 0 0
02238 CAMBRIDGE 0 0 0 0 0 0 0
02239 CAMBRIDGE 0 0 0 0 0 0 0
02241 BOSTON 0 0 0 0 0 0 0
02266 BOSTON 0 0 0 0 0 0 0
02283 BOSTON 0 0 0 0 0 0 0
02284 BOSTON 0 0 0 0 0 0 0
02293 BOSTON 0 0 0 0 0 0 0
02295 BOSTON 0 0 0 0 0 0 0
02297 BOSTON 0 0 0 0 0 0 0
02298 BOSTON 0 0 0 0 0 0 0
02301 BROCKTON 80 19 6 3 1 5 0
02302 BROCKTON 76 22 3 0 1 6 0
02303 BROCKTON 0 0 0 0 0 0 0
02304 BROCKTON 0 0 0 0 0 0 0
02305 BROCKTON 0 0 0 0 0 0 0
02360 PLYMOUTH 1,126 117 8 2 15 22 0
02361 PLYMOUTH 0 0 0 0 0 0 0
02362 PLYMOUTH 0 0 0 0 0 0 0
02381 WHITE HORSE BEACH 0 0 0 0 0 0 0
02532 BUZZARDS BAY 583 48 3 2 2 28 0
02534 CATAUMET 46 2 0 0 0 4 0
02535 CHILMARK 13 3 0 0 0 0 0
02536 EAST FALMOUTH 940 98 8 2 8 110 0
02537 EAST SANDWICH 335 21 0 0 1 10 0
02538 EAST WAREHAM 80 9 0 0 0 3 0
02539 EDGARTOWN 12 2 0 0 0 0 0
02540 FALMOUTH 241 17 1 0 1 48 0
02541 FALMOUTH 0 0 0 0 0 0 0
02542 BUZZARDS BAY 0 0 0 0 0 0 0
02543 WOODS HOLE 5 0 0 0 0 4 0
02552 MENEMSHA 0 0 0 0 0 0 0
02553 MONUMENT BEACH 13 2 1 0 0 0 0
02554 NANTUCKET 1 0 0 0 0 1 0
02556 NORTH FALMOUTH 197 21 2 1 2 34 0
02557 OAK BLUFFS 15 3 0 0 0 0 0
02558 ONSET 20 4 0 0 1 1 0
02559 POCASSET 216 19 0 0 2 24 0
02561 SAGAMORE 38 4 0 0 0 0 0
02562 SAGAMORE BEACH 200 20 1 0 1 3 0
02563 SANDWICH 535 38 2 1 2 13 0
02564 SIASCONSET 1 0 0 0 0 0 0
02565 SILVER BEACH 0 0 0 0 0 0 0
02568 VINEYARD HAVEN 50 9 0 0 0 1 0
02571 WAREHAM 161 20 1 0 1 6 0
02573 WEST CHOP 0 0 0 0 0 0 0
209

Insurer Cancellation/Nonrenewal Report
Exhibit 8A
Page 119
Insurer-----United Insurance Holdings Group (formerly United Property and Casualty Insurance Company)
Calendar Year---2015
Insurer
Insurer Initiated Insurer Initiated
Policies Insurer Initiated Cancellations Nonrenewals
Zip in Force* Total Initiated Cancellations Nonpay of Total** Co's Geographic
Code City/Town/Post Office as of 12/31/15 Cancellations Cancellations First 60 Days Premium Nonrenewals Withdrawal
02574 WEST FALMOUTH 15 2 0 0 1 0 0
02575 WEST TISBURY 6 1 0 0 1 0 0
02576 WEST WAREHAM 46 5 0 0 0 1 0
02584 NANTUCKET 0 0 0 0 0 0 0
02601 HYANNIS 323 32 1 0 2 9 0
02630 BARNSTABLE 91 12 2 0 1 1 0
02631 BREWSTER 445 50 1 1 0 3 0
02632 CENTERVILLE 436 45 1 0 2 19 0
02633 CHATHAM 21 3 0 0 0 0 0
02634 CENTERVILLE 0 0 0 0 0 0 0
02635 COTUIT 153 21 1 0 0 4 0
02636 CENTERVILLE 0 0 0 0 0 0 0
02637 CUMMAQUID 24 2 0 0 0 1 0
02638 DENNIS 231 10 0 0 1 2 0
02639 DENNISPORT 59 6 0 0 0 1 0
02641 EAST DENNIS 63 6 1 0 0 0 0
02642 EASTHAM 497 48 1 0 1 5 0
02643 EAST ORLEANS 5 0 0 0 0 0 0
02644 FORESTDALE 147 15 1 1 1 7 0
02645 HARWICH 281 28 0 0 1 7 0
02646 HARWICHPORT 18 3 0 0 0 1 0
02647 HYANNISPORT 2 0 0 0 0 0 0
02648 MARSTONS MILLS 275 27 0 0 0 6 0
02649 MASHPEE 550 52 2 0 0 29 0
02650 NORTH CHATHAM 4 0 0 0 0 0 0
02651 NORTH EASTHAM 7 0 0 0 0 1 0
02652 NORTH TRURO 42 3 1 0 0 1 0
02653 ORLEANS 357 31 1 0 0 5 0
02655 OSTERVILLE 136 24 1 0 0 3 0
02657 PROVINCETOWN 97 12 1 1 0 0 0
02659 SOUTH CHATHAM 15 2 0 0 0 0 0
02660 SOUTH DENNIS 293 19 0 0 0 5 0
02661 SOUTH HARWICH 0 0 0 0 0 0 0
02662 SOUTH ORLEANS 2 0 0 0 0 0 0
02663 SOUTH WELLFLEET 2 0 0 0 0 0 0
02664 SOUTH YARMOUTH 429 41 1 1 2 13 0
02666 TRURO 68 3 0 0 0 0 0
02667 WELLFLEET 115 8 0 0 0 2 0
02668 WEST BARNSTABLE 113 16 0 0 0 4 0
02669 WEST CHATHAM 1 0 0 0 0 0 0
02670 WEST DENNIS 36 2 0 0 0 0 0
02671 WEST HARWICH 7 2 0 0 0 2 0
02672 WEST HYANNISPORT 7 1 0 0 0 0 0
02673 WEST YARMOUTH 263 27 1 0 1 11 0
02675 YARMOUTHPORT 301 23 3 0 2 8 0
02713 CUTTYHUNK 1 0 0 0 0 0 0
02714 DARTMOUTH 0 0 0 0 0 0 0
02719 FAIRHAVEN 89 11 0 0 1 1 0
02720 FALL RIVER 90 9 1 1 1 5 0
02721 FALL RIVER 106 13 0 0 1 8 0
02722 FALL RIVER 0 0 0 0 0 0 0
02723 FALL RIVER 31 8 2 1 0 5 0
02724 FALL RIVER 109 11 0 0 0 7 0
02725 SOMERSET 19 4 0 0 1 1 0
02726 SOMERSET 95 8 1 0 0 2 0
02738 MARION 30 5 1 1 0 1 0
02739 MATTAPOISETT 11 7 0 0 1 0 0
02740 NEW BEDFORD 91 15 1 0 0 2 0
210
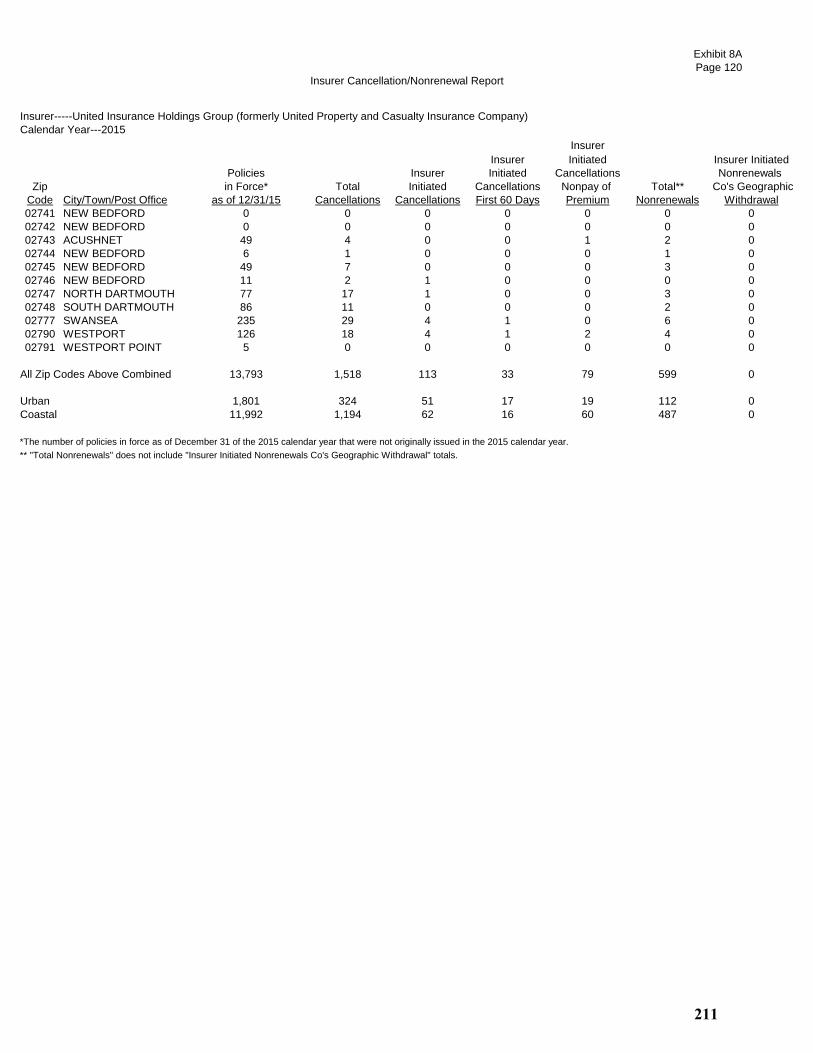
Insurer Cancellation/Nonrenewal Report
Exhibit 8A
Page 120
Insurer-----United Insurance Holdings Group (formerly United Property and Casualty Insurance Company)
Calendar Year---2015
Insurer
Insurer Initiated Insurer Initiated
Policies Insurer Initiated Cancellations Nonrenewals
Zip in Force* Total Initiated Cancellations Nonpay of Total** Co's Geographic
Code City/Town/Post Office as of 12/31/15 Cancellations Cancellations First 60 Days Premium Nonrenewals Withdrawal
02741 NEW BEDFORD 0 0 0 0 0 0 0
02742 NEW BEDFORD 0 0 0 0 0 0 0
02743 ACUSHNET 49 4 0 0 1 2 0
02744 NEW BEDFORD 6 1 0 0 0 1 0
02745 NEW BEDFORD 49 7 0 0 0 3 0
02746 NEW BEDFORD 11 2 1 0 0 0 0
02747 NORTH DARTMOUTH 77 17 1 0 0 3 0
02748 SOUTH DARTMOUTH 86 11 0 0 0 2 0
02777 SWANSEA 235 29 4 1 0 6 0
02790 WESTPORT 126 18 4 1 2 4 0
02791 WESTPORT POINT 5 0 0 0 0 0 0
All Zip Codes Above Combined 13,793 1,518 113 33 79 599 0
Urban 1,801 324 51 17 19 112 0
Coastal 11,992 1,194 62 16 60 487 0
*The number of policies in force as of December 31 of the 2015 calendar year that were not originally issued in the 2015 calendar year.
** "Total Nonrenewals" does not include "Insurer Initiated Nonrenewals Co's Geographic Withdrawal" totals.
211
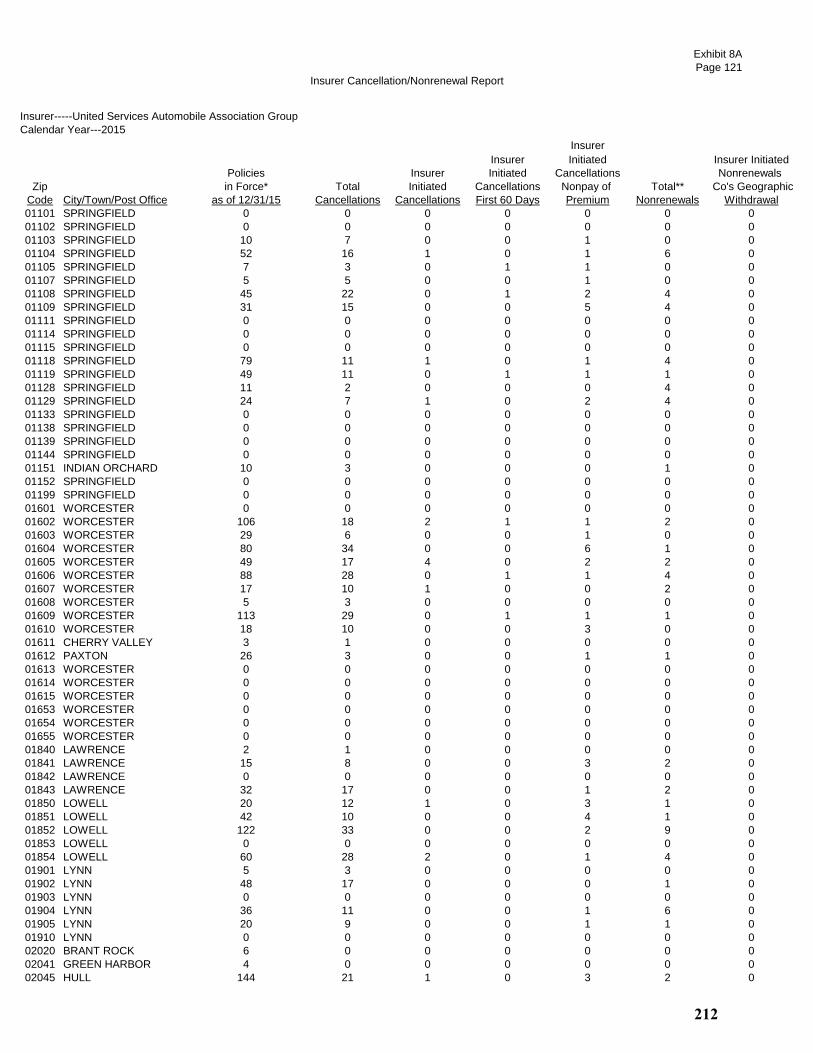
Insurer Cancellation/Nonrenewal Report
Exhibit 8A
Page 121
Insurer-----United Services Automobile Association Group
Calendar Year---2015
Insurer
Insurer Initiated Insurer Initiated
Policies Insurer Initiated Cancellations Nonrenewals
Zip in Force* Total Initiated Cancellations Nonpay of Total** Co's Geographic
Code City/Town/Post Office as of 12/31/15 Cancellations Cancellations First 60 Days Premium Nonrenewals Withdrawal
01101 SPRINGFIELD 0 0 0 0 0 0 0
01102 SPRINGFIELD 0 0 0 0 0 0 0
01103 SPRINGFIELD 10 7 0 0 1 0 0
01104 SPRINGFIELD 52 16 1 0 1 6 0
01105 SPRINGFIELD 7 3 0 1 1 0 0
01107 SPRINGFIELD 5 5 0 0 1 0 0
01108 SPRINGFIELD 45 22 0 1 2 4 0
01109 SPRINGFIELD 31 15 0 0 5 4 0
01111 SPRINGFIELD 0 0 0 0 0 0 0
01114 SPRINGFIELD 0 0 0 0 0 0 0
01115 SPRINGFIELD 0 0 0 0 0 0 0
01118 SPRINGFIELD 79 11 1 0 1 4 0
01119 SPRINGFIELD 49 11 0 1 1 1 0
01128 SPRINGFIELD 11 2 0 0 0 4 0
01129 SPRINGFIELD 24 7 1 0 2 4 0
01133 SPRINGFIELD 0 0 0 0 0 0 0
01138 SPRINGFIELD 0 0 0 0 0 0 0
01139 SPRINGFIELD 0 0 0 0 0 0 0
01144 SPRINGFIELD 0 0 0 0 0 0 0
01151 INDIAN ORCHARD 10 3 0 0 0 1 0
01152 SPRINGFIELD 0 0 0 0 0 0 0
01199 SPRINGFIELD 0 0 0 0 0 0 0
01601 WORCESTER 0 0 0 0 0 0 0
01602 WORCESTER 106 18 2 1 1 2 0
01603 WORCESTER 29 6 0 0 1 0 0
01604 WORCESTER 80 34 0 0 6 1 0
01605 WORCESTER 49 17 4 0 2 2 0
01606 WORCESTER 88 28 0 1 1 4 0
01607 WORCESTER 17 10 1 0 0 2 0
01608 WORCESTER 5 3 0 0 0 0 0
01609 WORCESTER 113 29 0 1 1 1 0
01610 WORCESTER 18 10 0 0 3 0 0
01611 CHERRY VALLEY 3 1 0 0 0 0 0
01612 PAXTON 26 3 0 0 1 1 0
01613 WORCESTER 0 0 0 0 0 0 0
01614 WORCESTER 0 0 0 0 0 0 0
01615 WORCESTER 0 0 0 0 0 0 0
01653 WORCESTER 0 0 0 0 0 0 0
01654 WORCESTER 0 0 0 0 0 0 0
01655 WORCESTER 0 0 0 0 0 0 0
01840 LAWRENCE 2 1 0 0 0 0 0
01841 LAWRENCE 15 8 0 0 3 2 0
01842 LAWRENCE 0 0 0 0 0 0 0
01843 LAWRENCE 32 17 0 0 1 2 0
01850 LOWELL 20 12 1 0 3 1 0
01851 LOWELL 42 10 0 0 4 1 0
01852 LOWELL 122 33 0 0 2 9 0
01853 LOWELL 0 0 0 0 0 0 0
01854 LOWELL 60 28 2 0 1 4 0
01901 LYNN 5 3 0 0 0 0 0
01902 LYNN 48 17 0 0 0 1 0
01903 LYNN 0 0 0 0 0 0 0
01904 LYNN 36 11 0 0 1 6 0
01905 LYNN 20 9 0 0 1 1 0
01910 LYNN 0 0 0 0 0 0 0
02020 BRANT ROCK 6 0 0 0 0 0 0
02041 GREEN HARBOR 4 0 0 0 0 0 0
02045 HULL 144 21 1 0 3 2 0
212
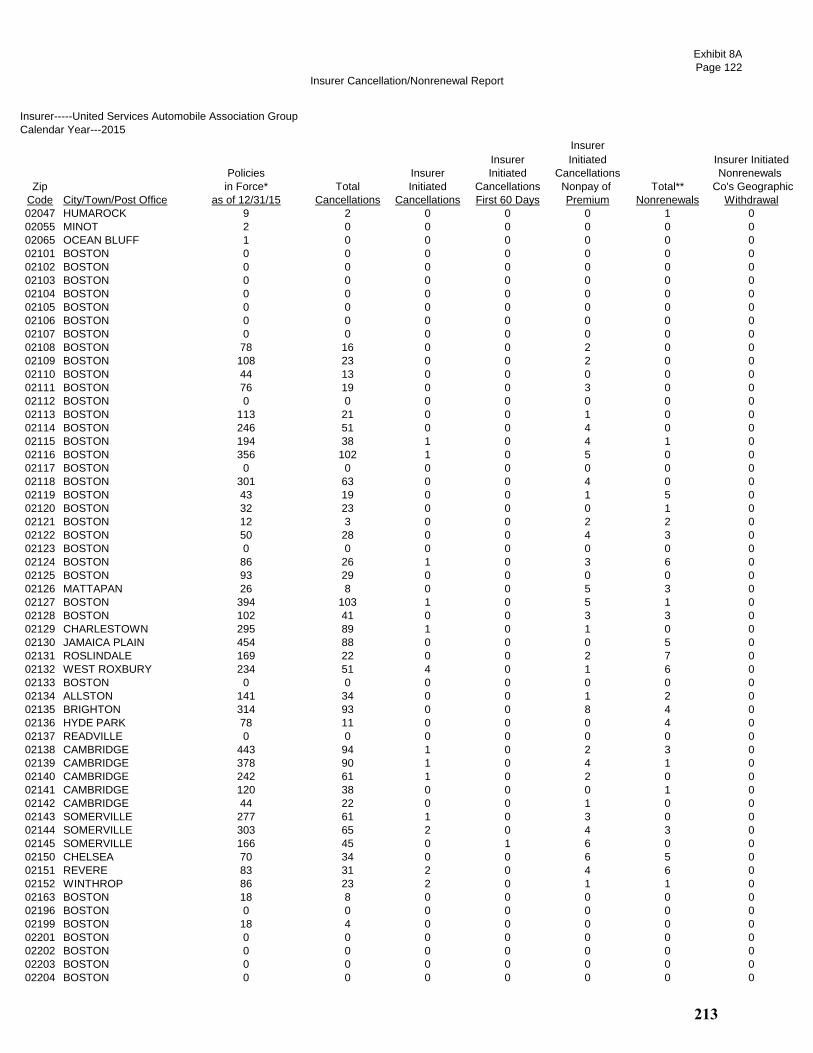
Insurer Cancellation/Nonrenewal Report
Exhibit 8A
Page 122
Insurer-----United Services Automobile Association Group
Calendar Year---2015
Insurer
Insurer Initiated Insurer Initiated
Policies Insurer Initiated Cancellations Nonrenewals
Zip in Force* Total Initiated Cancellations Nonpay of Total** Co's Geographic
Code City/Town/Post Office as of 12/31/15 Cancellations Cancellations First 60 Days Premium Nonrenewals Withdrawal
02047 HUMAROCK 9 2 0 0 0 1 0
02055 MINOT 2 0 0 0 0 0 0
02065 OCEAN BLUFF 1 0 0 0 0 0 0
02101 BOSTON 0 0 0 0 0 0 0
02102 BOSTON 0 0 0 0 0 0 0
02103 BOSTON 0 0 0 0 0 0 0
02104 BOSTON 0 0 0 0 0 0 0
02105 BOSTON 0 0 0 0 0 0 0
02106 BOSTON 0 0 0 0 0 0 0
02107 BOSTON 0 0 0 0 0 0 0
02108 BOSTON 78 16 0 0 2 0 0
02109 BOSTON 108 23 0 0 2 0 0
02110 BOSTON 44 13 0 0 0 0 0
02111 BOSTON 76 19 0 0 3 0 0
02112 BOSTON 0 0 0 0 0 0 0
02113 BOSTON 113 21 0 0 1 0 0
02114 BOSTON 246 51 0 0 4 0 0
02115 BOSTON 194 38 1 0 4 1 0
02116 BOSTON 356 102 1 0 5 0 0
02117 BOSTON 0 0 0 0 0 0 0
02118 BOSTON 301 63 0 0 4 0 0
02119 BOSTON 43 19 0 0 1 5 0
02120 BOSTON 32 23 0 0 0 1 0
02121 BOSTON 12 3 0 0 2 2 0
02122 BOSTON 50 28 0 0 4 3 0
02123 BOSTON 0 0 0 0 0 0 0
02124 BOSTON 86 26 1 0 3 6 0
02125 BOSTON 93 29 0 0 0 0 0
02126 MATTAPAN 26 8 0 0 5 3 0
02127 BOSTON 394 103 1 0 5 1 0
02128 BOSTON 102 41 0 0 3 3 0
02129 CHARLESTOWN 295 89 1 0 1 0 0
02130 JAMAICA PLAIN 454 88 0 0 0 5 0
02131 ROSLINDALE 169 22 0 0 2 7 0
02132 WEST ROXBURY 234 51 4 0 1 6 0
02133 BOSTON 0 0 0 0 0 0 0
02134 ALLSTON 141 34 0 0 1 2 0
02135 BRIGHTON 314 93 0 0 8 4 0
02136 HYDE PARK 78 11 0 0 0 4 0
02137 READVILLE 0 0 0 0 0 0 0
02138 CAMBRIDGE 443 94 1 0 2 3 0
02139 CAMBRIDGE 378 90 1 0 4 1 0
02140 CAMBRIDGE 242 61 1 0 2 0 0
02141 CAMBRIDGE 120 38 0 0 0 1 0
02142 CAMBRIDGE 44 22 0 0 1 0 0
02143 SOMERVILLE 277 61 1 0 3 0 0
02144 SOMERVILLE 303 65 2 0 4 3 0
02145 SOMERVILLE 166 45 0 1 6 0 0
02150 CHELSEA 70 34 0 0 6 5 0
02151 REVERE 83 31 2 0 4 6 0
02152 WINTHROP 86 23 2 0 1 1 0
02163 BOSTON 18 8 0 0 0 0 0
02196 BOSTON 0 0 0 0 0 0 0
02199 BOSTON 18 4 0 0 0 0 0
02201 BOSTON 0 0 0 0 0 0 0
02202 BOSTON 0 0 0 0 0 0 0
02203 BOSTON 0 0 0 0 0 0 0
02204 BOSTON 0 0 0 0 0 0 0
213

Insurer Cancellation/Nonrenewal Report
Exhibit 8A
Page 123
Insurer-----United Services Automobile Association Group
Calendar Year---2015
Insurer
Insurer Initiated Insurer Initiated
Policies Insurer Initiated Cancellations Nonrenewals
Zip in Force* Total Initiated Cancellations Nonpay of Total** Co's Geographic
Code City/Town/Post Office as of 12/31/15 Cancellations Cancellations First 60 Days Premium Nonrenewals Withdrawal
02205 BOSTON 0 0 0 0 0 0 0
02206 BOSTON 0 0 0 0 0 0 0
02207 BOSTON 0 0 0 0 0 0 0
02208 BOSTON 0 0 0 0 0 0 0
02209 BOSTON 0 0 0 0 0 0 0
02210 BOSTON 44 19 0 0 3 0 0
02211 BOSTON 0 0 0 0 0 0 0
02212 BOSTON 0 0 0 0 0 0 0
02215 BOSTON 157 40 0 0 5 1 0
02216 BOSTON 0 0 0 0 0 0 0
02217 BOSTON 0 0 0 0 0 0 0
02222 BOSTON 0 0 0 0 0 0 0
02228 EAST BOSTON 0 0 0 0 0 0 0
02238 CAMBRIDGE 0 0 0 0 0 0 0
02239 CAMBRIDGE 0 0 0 0 0 0 0
02241 BOSTON 0 0 0 0 0 0 0
02266 BOSTON 0 0 0 0 0 0 0
02283 BOSTON 0 0 0 0 0 0 0
02284 BOSTON 0 0 0 0 0 0 0
02293 BOSTON 0 0 0 0 0 0 0
02295 BOSTON 0 0 0 0 0 0 0
02297 BOSTON 0 0 0 0 0 0 0
02298 BOSTON 0 0 0 0 0 0 0
02301 BROCKTON 92 23 1 1 5 10 0
02302 BROCKTON 41 16 0 0 1 6 0
02303 BROCKTON 0 0 0 0 0 0 0
02304 BROCKTON 0 0 0 0 0 0 0
02305 BROCKTON 0 0 0 0 0 0 0
02360 PLYMOUTH 628 108 3 0 5 20 0
02361 PLYMOUTH 1 0 0 0 0 0 0
02362 PLYMOUTH 1 0 0 0 0 0 0
02381 WHITE HORSE BEACH 1 0 0 0 0 0 0
02532 BUZZARDS BAY 161 30 2 0 2 2 0
02534 CATAUMET 24 1 0 0 0 0 0
02535 CHILMARK 50 5 0 0 0 0 0
02536 EAST FALMOUTH 391 54 6 0 3 1 0
02537 EAST SANDWICH 130 14 1 0 0 1 0
02538 EAST WAREHAM 29 7 2 1 1 2 0
02539 EDGARTOWN 136 13 2 0 1 0 0
02540 FALMOUTH 241 39 2 0 4 1 0
02541 FALMOUTH 3 0 0 0 0 0 0
02542 BUZZARDS BAY 37 39 0 0 3 8 0
02543 WOODS HOLE 27 4 0 0 0 0 0
02552 MENEMSHA 0 0 0 0 0 0 0
02553 MONUMENT BEACH 16 1 1 0 0 0 0
02554 NANTUCKET 202 34 3 1 1 0 0
02556 NORTH FALMOUTH 108 10 0 0 0 1 0
02557 OAK BLUFFS 88 8 2 0 0 2 0
02558 ONSET 21 8 0 1 3 0 0
02559 POCASSET 115 15 1 0 0 1 0
02561 SAGAMORE 9 0 0 0 0 0 0
02562 SAGAMORE BEACH 52 0 0 0 0 0 0
02563 SANDWICH 182 22 3 2 1 2 0
02564 SIASCONSET 20 1 0 0 0 1 0
02565 SILVER BEACH 0 0 0 0 0 0 0
02568 VINEYARD HAVEN 199 19 0 0 0 0 0
02571 WAREHAM 94 9 0 0 1 2 0
02573 WEST CHOP 0 0 0 0 0 0 0
214
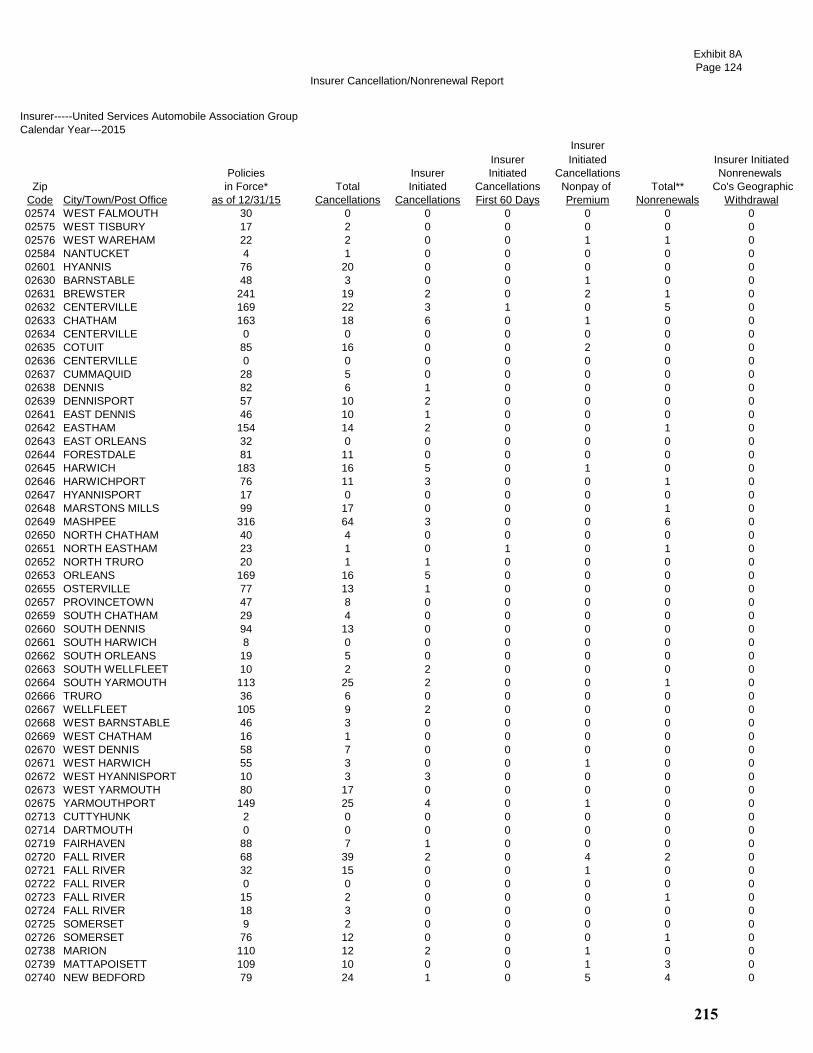
Insurer Cancellation/Nonrenewal Report
Exhibit 8A
Page 124
Insurer-----United Services Automobile Association Group
Calendar Year---2015
Insurer
Insurer Initiated Insurer Initiated
Policies Insurer Initiated Cancellations Nonrenewals
Zip in Force* Total Initiated Cancellations Nonpay of Total** Co's Geographic
Code City/Town/Post Office as of 12/31/15 Cancellations Cancellations First 60 Days Premium Nonrenewals Withdrawal
02574 WEST FALMOUTH 30 0 0 0 0 0 0
02575 WEST TISBURY 17 2 0 0 0 0 0
02576 WEST WAREHAM 22 2 0 0 1 1 0
02584 NANTUCKET 4 1 0 0 0 0 0
02601 HYANNIS 76 20 0 0 0 0 0
02630 BARNSTABLE 48 3 0 0 1 0 0
02631 BREWSTER 241 19 2 0 2 1 0
02632 CENTERVILLE 169 22 3 1 0 5 0
02633 CHATHAM 163 18 6 0 1 0 0
02634 CENTERVILLE 0 0 0 0 0 0 0
02635 COTUIT 85 16 0 0 2 0 0
02636 CENTERVILLE 0 0 0 0 0 0 0
02637 CUMMAQUID 28 5 0 0 0 0 0
02638 DENNIS 82 6 1 0 0 0 0
02639 DENNISPORT 57 10 2 0 0 0 0
02641 EAST DENNIS 46 10 1 0 0 0 0
02642 EASTHAM 154 14 2 0 0 1 0
02643 EAST ORLEANS 32 0 0 0 0 0 0
02644 FORESTDALE 81 11 0 0 0 0 0
02645 HARWICH 183 16 5 0 1 0 0
02646 HARWICHPORT 76 11 3 0 0 1 0
02647 HYANNISPORT 17 0 0 0 0 0 0
02648 MARSTONS MILLS 99 17 0 0 0 1 0
02649 MASHPEE 316 64 3 0 0 6 0
02650 NORTH CHATHAM 40 4 0 0 0 0 0
02651 NORTH EASTHAM 23 1 0 1 0 1 0
02652 NORTH TRURO 20 1 1 0 0 0 0
02653 ORLEANS 169 16 5 0 0 0 0
02655 OSTERVILLE 77 13 1 0 0 0 0
02657 PROVINCETOWN 47 8 0 0 0 0 0
02659 SOUTH CHATHAM 29 4 0 0 0 0 0
02660 SOUTH DENNIS 94 13 0 0 0 0 0
02661 SOUTH HARWICH 8 0 0 0 0 0 0
02662 SOUTH ORLEANS 19 5 0 0 0 0 0
02663 SOUTH WELLFLEET 10 2 2 0 0 0 0
02664 SOUTH YARMOUTH 113 25 2 0 0 1 0
02666 TRURO 36 6 0 0 0 0 0
02667 WELLFLEET 105 9 2 0 0 0 0
02668 WEST BARNSTABLE 46 3 0 0 0 0 0
02669 WEST CHATHAM 16 1 0 0 0 0 0
02670 WEST DENNIS 58 7 0 0 0 0 0
02671 WEST HARWICH 55 3 0 0 1 0 0
02672 WEST HYANNISPORT 10 3 3 0 0 0 0
02673 WEST YARMOUTH 80 17 0 0 0 0 0
02675 YARMOUTHPORT 149 25 4 0 1 0 0
02713 CUTTYHUNK 2 0 0 0 0 0 0
02714 DARTMOUTH 0 0 0 0 0 0 0
02719 FAIRHAVEN 88 7 1 0 0 0 0
02720 FALL RIVER 68 39 2 0 4 2 0
02721 FALL RIVER 32 15 0 0 1 0 0
02722 FALL RIVER 0 0 0 0 0 0 0
02723 FALL RIVER 15 2 0 0 0 1 0
02724 FALL RIVER 18 3 0 0 0 0 0
02725 SOMERSET 9 2 0 0 0 0 0
02726 SOMERSET 76 12 0 0 0 1 0
02738 MARION 110 12 2 0 1 0 0
02739 MATTAPOISETT 109 10 0 0 1 3 0
02740 NEW BEDFORD 79 24 1 0 5 4 0
215

Insurer Cancellation/Nonrenewal Report
Exhibit 8A
Page 125
Insurer-----United Services Automobile Association Group
Calendar Year---2015
Insurer
Insurer Initiated Insurer Initiated
Policies Insurer Initiated Cancellations Nonrenewals
Zip in Force* Total Initiated Cancellations Nonpay of Total** Co's Geographic
Code City/Town/Post Office as of 12/31/15 Cancellations Cancellations First 60 Days Premium Nonrenewals Withdrawal
02741 NEW BEDFORD 0 0 0 0 0 0 0
02742 NEW BEDFORD 0 0 0 0 0 0 0
02743 ACUSHNET 24 1 0 0 0 5 0
02744 NEW BEDFORD 14 3 0 0 1 0 0
02745 NEW BEDFORD 40 10 2 0 1 4 0
02746 NEW BEDFORD 7 5 0 0 0 2 0
02747 NORTH DARTMOUTH 101 10 0 0 1 1 0
02748 SOUTH DARTMOUTH 113 14 0 0 0 3 0
02777 SWANSEA 67 21 0 0 2 0 0
02790 WESTPORT 113 7 2 0 0 4 0
02791 WESTPORT POINT 15 4 2 0 0 0 0
All Zip Codes Above Combined 15,342 3,196 122 15 210 253 0
Urban 8,153 2,199 38 8 167 171 0
Coastal 7,189 997 84 7 43 82 0
*The number of policies in force as of December 31 of the 2015 calendar year that were not originally issued in the 2015 calendar year.
** "Total Nonrenewals" does not include "Insurer Initiated Nonrenewals Co's Geographic Withdrawal" totals.
216
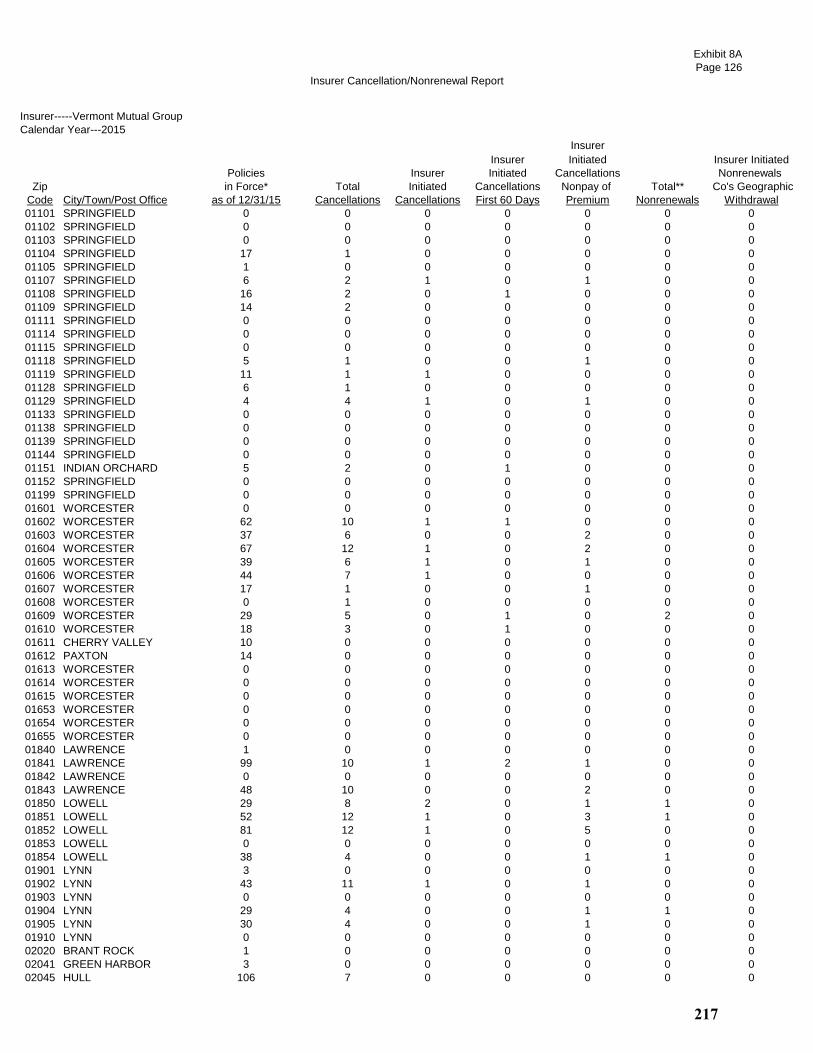
Insurer Cancellation/Nonrenewal Report
Exhibit 8A
Page 126
Insurer-----Vermont Mutual Group
Calendar Year---2015
Insurer
Insurer Initiated Insurer Initiated
Policies Insurer Initiated Cancellations Nonrenewals
Zip in Force* Total Initiated Cancellations Nonpay of Total** Co's Geographic
Code City/Town/Post Office as of 12/31/15 Cancellations Cancellations First 60 Days Premium Nonrenewals Withdrawal
01101 SPRINGFIELD 0 0 0 0 0 0 0
01102 SPRINGFIELD 0 0 0 0 0 0 0
01103 SPRINGFIELD 0 0 0 0 0 0 0
01104 SPRINGFIELD 17 1 0 0 0 0 0
01105 SPRINGFIELD 1 0 0 0 0 0 0
01107 SPRINGFIELD 6 2 1 0 1 0 0
01108 SPRINGFIELD 16 2 0 1 0 0 0
01109 SPRINGFIELD 14 2 0 0 0 0 0
01111 SPRINGFIELD 0 0 0 0 0 0 0
01114 SPRINGFIELD 0 0 0 0 0 0 0
01115 SPRINGFIELD 0 0 0 0 0 0 0
01118 SPRINGFIELD 5 1 0 0 1 0 0
01119 SPRINGFIELD 11 1 1 0 0 0 0
01128 SPRINGFIELD 6 1 0 0 0 0 0
01129 SPRINGFIELD 4 4 1 0 1 0 0
01133 SPRINGFIELD 0 0 0 0 0 0 0
01138 SPRINGFIELD 0 0 0 0 0 0 0
01139 SPRINGFIELD 0 0 0 0 0 0 0
01144 SPRINGFIELD 0 0 0 0 0 0 0
01151 INDIAN ORCHARD 5 2 0 1 0 0 0
01152 SPRINGFIELD 0 0 0 0 0 0 0
01199 SPRINGFIELD 0 0 0 0 0 0 0
01601 WORCESTER 0 0 0 0 0 0 0
01602 WORCESTER 62 10 1 1 0 0 0
01603 WORCESTER 37 6 0 0 2 0 0
01604 WORCESTER 67 12 1 0 2 0 0
01605 WORCESTER 39 6 1 0 1 0 0
01606 WORCESTER 44 7 1 0 0 0 0
01607 WORCESTER 17 1 0 0 1 0 0
01608 WORCESTER 0 1 0 0 0 0 0
01609 WORCESTER 29 5 0 1 0 2 0
01610 WORCESTER 18 3 0 1 0 0 0
01611 CHERRY VALLEY 10 0 0 0 0 0 0
01612 PAXTON 14 0 0 0 0 0 0
01613 WORCESTER 0 0 0 0 0 0 0
01614 WORCESTER 0 0 0 0 0 0 0
01615 WORCESTER 0 0 0 0 0 0 0
01653 WORCESTER 0 0 0 0 0 0 0
01654 WORCESTER 0 0 0 0 0 0 0
01655 WORCESTER 0 0 0 0 0 0 0
01840 LAWRENCE 1 0 0 0 0 0 0
01841 LAWRENCE 99 10 1 2 1 0 0
01842 LAWRENCE 0 0 0 0 0 0 0
01843 LAWRENCE 48 10 0 0 2 0 0
01850 LOWELL 29 8 2 0 1 1 0
01851 LOWELL 52 12 1 0 3 1 0
01852 LOWELL 81 12 1 0 5 0 0
01853 LOWELL 0 0 0 0 0 0 0
01854 LOWELL 38 4 0 0 1 1 0
01901 LYNN 3 0 0 0 0 0 0
01902 LYNN 43 11 1 0 1 0 0
01903 LYNN 0 0 0 0 0 0 0
01904 LYNN 29 4 0 0 1 1 0
01905 LYNN 30 4 0 0 1 0 0
01910 LYNN 0 0 0 0 0 0 0
02020 BRANT ROCK 1 0 0 0 0 0 0
02041 GREEN HARBOR 3 0 0 0 0 0 0
02045 HULL 106 7 0 0 0 0 0
217
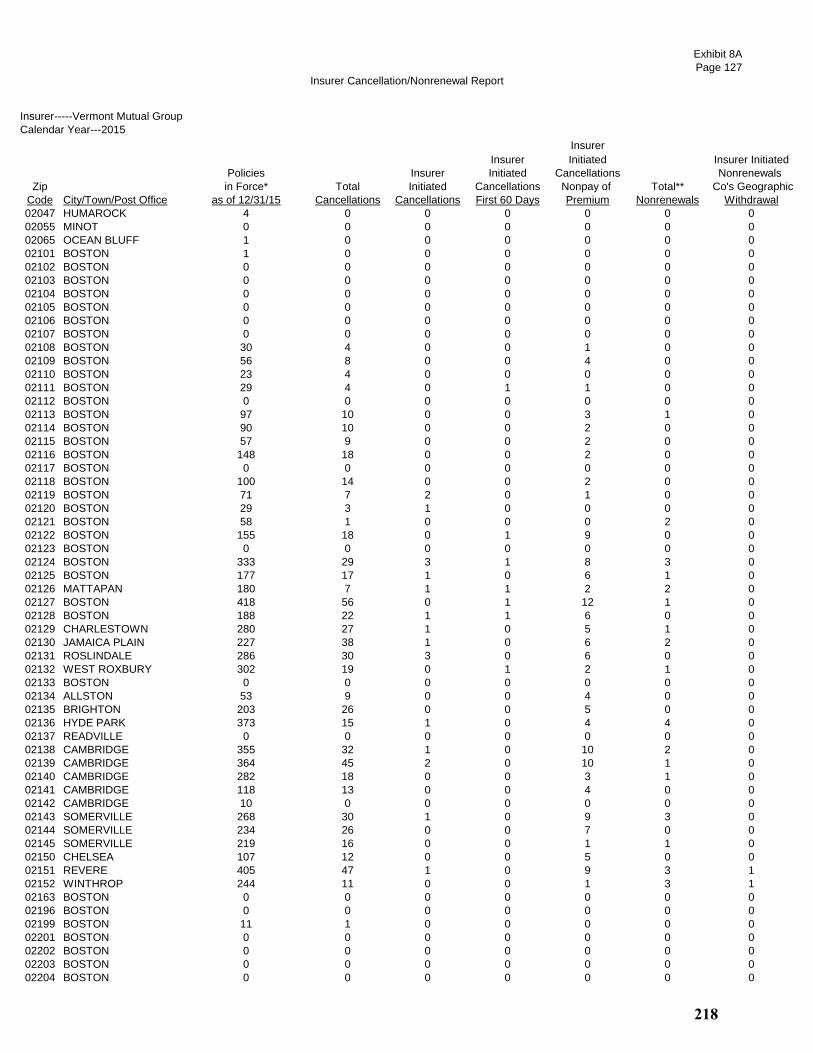
Insurer Cancellation/Nonrenewal Report
Exhibit 8A
Page 127
Insurer-----Vermont Mutual Group
Calendar Year---2015
Insurer
Insurer Initiated Insurer Initiated
Policies Insurer Initiated Cancellations Nonrenewals
Zip in Force* Total Initiated Cancellations Nonpay of Total** Co's Geographic
Code City/Town/Post Office as of 12/31/15 Cancellations Cancellations First 60 Days Premium Nonrenewals Withdrawal
02047 HUMAROCK 4 0 0 0 0 0 0
02055 MINOT 0 0 0 0 0 0 0
02065 OCEAN BLUFF 1 0 0 0 0 0 0
02101 BOSTON 1 0 0 0 0 0 0
02102 BOSTON 0 0 0 0 0 0 0
02103 BOSTON 0 0 0 0 0 0 0
02104 BOSTON 0 0 0 0 0 0 0
02105 BOSTON 0 0 0 0 0 0 0
02106 BOSTON 0 0 0 0 0 0 0
02107 BOSTON 0 0 0 0 0 0 0
02108 BOSTON 30 4 0 0 1 0 0
02109 BOSTON 56 8 0 0 4 0 0
02110 BOSTON 23 4 0 0 0 0 0
02111 BOSTON 29 4 0 1 1 0 0
02112 BOSTON 0 0 0 0 0 0 0
02113 BOSTON 97 10 0 0 3 1 0
02114 BOSTON 90 10 0 0 2 0 0
02115 BOSTON 57 9 0 0 2 0 0
02116 BOSTON 148 18 0 0 2 0 0
02117 BOSTON 0 0 0 0 0 0 0
02118 BOSTON 100 14 0 0 2 0 0
02119 BOSTON 71 7 2 0 1 0 0
02120 BOSTON 29 3 1 0 0 0 0
02121 BOSTON 58 1 0 0 0 2 0
02122 BOSTON 155 18 0 1 9 0 0
02123 BOSTON 0 0 0 0 0 0 0
02124 BOSTON 333 29 3 1 8 3 0
02125 BOSTON 177 17 1 0 6 1 0
02126 MATTAPAN 180 7 1 1 2 2 0
02127 BOSTON 418 56 0 1 12 1 0
02128 BOSTON 188 22 1 1 6 0 0
02129 CHARLESTOWN 280 27 1 0 5 1 0
02130 JAMAICA PLAIN 227 38 1 0 6 2 0
02131 ROSLINDALE 286 30 3 0 6 0 0
02132 WEST ROXBURY 302 19 0 1 2 1 0
02133 BOSTON 0 0 0 0 0 0 0
02134 ALLSTON 53 9 0 0 4 0 0
02135 BRIGHTON 203 26 0 0 5 0 0
02136 HYDE PARK 373 15 1 0 4 4 0
02137 READVILLE 0 0 0 0 0 0 0
02138 CAMBRIDGE 355 32 1 0 10 2 0
02139 CAMBRIDGE 364 45 2 0 10 1 0
02140 CAMBRIDGE 282 18 0 0 3 1 0
02141 CAMBRIDGE 118 13 0 0 4 0 0
02142 CAMBRIDGE 10 0 0 0 0 0 0
02143 SOMERVILLE 268 30 1 0 9 3 0
02144 SOMERVILLE 234 26 0 0 7 0 0
02145 SOMERVILLE 219 16 0 0 1 1 0
02150 CHELSEA 107 12 0 0 5 0 0
02151 REVERE 405 47 1 0 9 3 1
02152 WINTHROP 244 11 0 0 1 3 1
02163 BOSTON 0 0 0 0 0 0 0
02196 BOSTON 0 0 0 0 0 0 0
02199 BOSTON 11 1 0 0 0 0 0
02201 BOSTON 0 0 0 0 0 0 0
02202 BOSTON 0 0 0 0 0 0 0
02203 BOSTON 0 0 0 0 0 0 0
02204 BOSTON 0 0 0 0 0 0 0
218

Insurer Cancellation/Nonrenewal Report
Exhibit 8A
Page 128
Insurer-----Vermont Mutual Group
Calendar Year---2015
Insurer
Insurer Initiated Insurer Initiated
Policies Insurer Initiated Cancellations Nonrenewals
Zip in Force* Total Initiated Cancellations Nonpay of Total** Co's Geographic
Code City/Town/Post Office as of 12/31/15 Cancellations Cancellations First 60 Days Premium Nonrenewals Withdrawal
02205 BOSTON 0 0 0 0 0 0 0
02206 BOSTON 0 0 0 0 0 0 0
02207 BOSTON 0 0 0 0 0 0 0
02208 BOSTON 0 0 0 0 0 0 0
02209 BOSTON 0 0 0 0 0 0 0
02210 BOSTON 19 9 0 0 3 0 0
02211 BOSTON 0 0 0 0 0 0 0
02212 BOSTON 0 0 0 0 0 0 0
02215 BOSTON 42 10 0 0 4 0 0
02216 BOSTON 0 0 0 0 0 0 0
02217 BOSTON 0 1 1 0 0 0 0
02222 BOSTON 0 0 0 0 0 0 0
02228 EAST BOSTON 0 0 0 0 0 0 0
02238 CAMBRIDGE 0 0 0 0 0 0 0
02239 CAMBRIDGE 0 0 0 0 0 0 0
02241 BOSTON 0 0 0 0 0 0 0
02266 BOSTON 0 0 0 0 0 0 0
02283 BOSTON 0 0 0 0 0 0 0
02284 BOSTON 0 0 0 0 0 0 0
02293 BOSTON 0 0 0 0 0 0 0
02295 BOSTON 0 0 0 0 0 0 0
02297 BOSTON 0 0 0 0 0 0 0
02298 BOSTON 0 0 0 0 0 0 0
02301 BROCKTON 166 24 4 0 6 1 0
02302 BROCKTON 161 25 0 2 7 1 0
02303 BROCKTON 1 0 0 0 0 0 0
02304 BROCKTON 0 0 0 0 0 0 0
02305 BROCKTON 0 0 0 0 0 0 0
02360 PLYMOUTH 1,201 101 8 0 16 6 0
02361 PLYMOUTH 0 1 0 0 1 0 0
02362 PLYMOUTH 0 0 0 0 0 0 0
02381 WHITE HORSE BEACH 2 0 0 0 0 0 0
02532 BUZZARDS BAY 10 0 0 0 0 1 0
02534 CATAUMET 0 0 0 0 0 0 0
02535 CHILMARK 0 0 0 0 0 0 0
02536 EAST FALMOUTH 2 0 0 0 0 0 0
02537 EAST SANDWICH 1 0 0 0 0 0 0
02538 EAST WAREHAM 63 3 0 0 0 0 0
02539 EDGARTOWN 0 0 0 0 0 0 0
02540 FALMOUTH 2 0 0 0 0 0 0
02541 FALMOUTH 0 0 0 0 0 0 0
02542 BUZZARDS BAY 0 0 0 0 0 0 0
02543 WOODS HOLE 0 0 0 0 0 0 0
02552 MENEMSHA 0 0 0 0 0 0 0
02553 MONUMENT BEACH 0 0 0 0 0 0 0
02554 NANTUCKET 0 0 0 0 0 0 0
02556 NORTH FALMOUTH 2 0 0 0 0 0 0
02557 OAK BLUFFS 0 0 0 0 0 0 0
02558 ONSET 74 4 2 0 2 0 0
02559 POCASSET 0 1 0 0 0 0 0
02561 SAGAMORE 0 0 0 0 0 0 0
02562 SAGAMORE BEACH 0 0 0 0 0 0 0
02563 SANDWICH 2 2 0 0 0 0 0
02564 SIASCONSET 0 0 0 0 0 0 0
02565 SILVER BEACH 0 0 0 0 0 0 0
02568 VINEYARD HAVEN 0 0 0 0 0 0 0
02571 WAREHAM 284 22 2 0 3 2 0
02573 WEST CHOP 0 0 0 0 0 0 0
219

Insurer Cancellation/Nonrenewal Report
Exhibit 8A
Page 129
Insurer-----Vermont Mutual Group
Calendar Year---2015
Insurer
Insurer Initiated Insurer Initiated
Policies Insurer Initiated Cancellations Nonrenewals
Zip in Force* Total Initiated Cancellations Nonpay of Total** Co's Geographic
Code City/Town/Post Office as of 12/31/15 Cancellations Cancellations First 60 Days Premium Nonrenewals Withdrawal
02574 WEST FALMOUTH 0 0 0 0 0 0 0
02575 WEST TISBURY 0 1 0 0 0 0 0
02576 WEST WAREHAM 74 4 1 0 0 1 0
02584 NANTUCKET 0 0 0 0 0 0 0
02601 HYANNIS 4 0 0 0 0 0 0
02630 BARNSTABLE 0 0 0 0 0 0 0
02631 BREWSTER 4 0 0 0 0 0 0
02632 CENTERVILLE 0 1 0 0 0 0 0
02633 CHATHAM 4 0 0 0 0 0 0
02634 CENTERVILLE 0 0 0 0 0 0 0
02635 COTUIT 1 0 0 0 0 0 0
02636 CENTERVILLE 0 0 0 0 0 0 0
02637 CUMMAQUID 0 0 0 0 0 0 0
02638 DENNIS 2 0 0 0 0 0 0
02639 DENNISPORT 2 0 0 0 0 0 0
02641 EAST DENNIS 0 0 0 0 0 0 0
02642 EASTHAM 0 1 0 0 0 0 0
02643 EAST ORLEANS 0 0 0 0 0 0 0
02644 FORESTDALE 0 1 0 0 0 0 0
02645 HARWICH 0 0 0 0 0 0 0
02646 HARWICHPORT 1 0 0 0 0 0 0
02647 HYANNISPORT 0 0 0 0 0 0 0
02648 MARSTONS MILLS 1 0 0 0 0 0 0
02649 MASHPEE 13 3 0 0 1 0 0
02650 NORTH CHATHAM 0 0 0 0 0 0 0
02651 NORTH EASTHAM 1 0 0 0 0 0 0
02652 NORTH TRURO 0 0 0 0 0 0 0
02653 ORLEANS 0 0 0 0 0 0 0
02655 OSTERVILLE 0 0 0 0 0 0 0
02657 PROVINCETOWN 3 0 0 0 0 0 0
02659 SOUTH CHATHAM 0 0 0 0 0 0 0
02660 SOUTH DENNIS 1 0 0 0 0 0 0
02661 SOUTH HARWICH 0 0 0 0 0 0 0
02662 SOUTH ORLEANS 0 0 0 0 0 0 0
02663 SOUTH WELLFLEET 0 0 0 0 0 0 0
02664 SOUTH YARMOUTH 1 0 0 0 0 0 0
02666 TRURO 0 0 0 0 0 0 0
02667 WELLFLEET 0 0 0 0 0 0 0
02668 WEST BARNSTABLE 0 0 0 0 0 0 0
02669 WEST CHATHAM 0 0 0 0 0 0 0
02670 WEST DENNIS 0 0 0 0 0 0 0
02671 WEST HARWICH 1 1 0 0 0 0 0
02672 WEST HYANNISPORT 0 0 0 0 0 0 0
02673 WEST YARMOUTH 2 1 0 0 1 0 0
02675 YARMOUTHPORT 5 1 0 0 1 0 0
02713 CUTTYHUNK 0 0 0 0 0 0 0
02714 DARTMOUTH 0 0 0 0 0 0 0
02719 FAIRHAVEN 332 23 0 0 5 1 0
02720 FALL RIVER 172 12 2 0 3 2 0
02721 FALL RIVER 187 12 0 0 6 0 0
02722 FALL RIVER 1 0 0 0 0 0 0
02723 FALL RIVER 78 12 0 0 2 0 0
02724 FALL RIVER 160 8 0 0 2 0 0
02725 SOMERSET 17 3 1 0 0 0 0
02726 SOMERSET 180 25 0 0 5 1 0
02738 MARION 109 5 0 0 3 1 0
02739 MATTAPOISETT 221 18 4 0 2 0 0
02740 NEW BEDFORD 291 19 5 0 2 2 0
220

Insurer Cancellation/Nonrenewal Report
Exhibit 8A
Page 130
Insurer-----Vermont Mutual Group
Calendar Year---2015
Insurer
Insurer Initiated Insurer Initiated
Policies Insurer Initiated Cancellations Nonrenewals
Zip in Force* Total Initiated Cancellations Nonpay of Total** Co's Geographic
Code City/Town/Post Office as of 12/31/15 Cancellations Cancellations First 60 Days Premium Nonrenewals Withdrawal
02741 NEW BEDFORD 0 0 0 0 0 0 0
02742 NEW BEDFORD 0 0 0 0 0 0 0
02743 ACUSHNET 207 16 0 0 1 0 0
02744 NEW BEDFORD 72 5 0 0 1 1 0
02745 NEW BEDFORD 254 13 0 0 2 1 0
02746 NEW BEDFORD 64 4 0 0 1 0 0
02747 NORTH DARTMOUTH 237 12 1 0 1 2 0
02748 SOUTH DARTMOUTH 200 8 0 0 2 1 0
02777 SWANSEA 149 16 1 0 4 0 0
02790 WESTPORT 183 12 1 0 3 0 0
02791 WESTPORT POINT 3 0 0 0 0 0 0
All Zip Codes Above Combined 12,840 1,245 66 16 267 62 2
Urban 9,124 952 45 16 216 46 2
Coastal 3,716 293 21 0 51 16 0
*The number of policies in force as of December 31 of the 2015 calendar year that were not originally issued in the 2015 calendar year.
** "Total Nonrenewals" does not include "Insurer Initiated Nonrenewals Co's Geographic Withdrawal" totals.
221

Insurer Cancellation/Nonrenewal Report
Exhibit 8B
Page 1
Top Twenty-Five Insurers & FAIR Plan
Calendar Year---2015
Insurer
Insurer Initiated Insurer Initiated
Policies Insurer Initiated Cancellations Nonrenewals
Zip in Force* Total Initiated Cancellations Nonpay of Total** Co's Geographic
Code City/Town/Post Office as of 12/31/15 Cancellations Cancellations First 60 Days Premium Nonrenewals Withdrawal
01101 SPRINGFIELD 56 4 1 0 1 1 0
01102 SPRINGFIELD 5 0 0 0 0 0 0
01103 SPRINGFIELD 266 72 3 1 27 4 0
01104 SPRINGFIELD 4,157 615 52 21 158 69 0
01105 SPRINGFIELD 645 127 7 3 50 13 0
01107 SPRINGFIELD 1,014 157 12 3 33 18 0
01108 SPRINGFIELD 4,026 715 56 26 158 75 0
01109 SPRINGFIELD 4,341 608 64 20 158 91 0
01111 SPRINGFIELD 1 0 0 0 0 0 0
01114 SPRINGFIELD 0 0 0 0 0 0 0
01115 SPRINGFIELD 2 1 0 0 0 0 0
01118 SPRINGFIELD 3,959 577 32 15 107 46 0
01119 SPRINGFIELD 2,921 383 30 8 93 33 0
01128 SPRINGFIELD 848 95 5 7 18 14 0
01129 SPRINGFIELD 2,043 299 22 8 52 27 0
01133 SPRINGFIELD 0 0 0 0 0 0 0
01138 SPRINGFIELD 0 0 0 0 0 0 0
01139 SPRINGFIELD 2 0 0 0 0 0 0
01144 SPRINGFIELD 0 0 0 0 0 0 0
01151 INDIAN ORCHARD 1,376 276 20 10 82 15 0
01152 SPRINGFIELD 1 0 0 0 0 0 0
01199 SPRINGFIELD 0 0 0 0 0 0 0
01601 WORCESTER 42 3 0 0 0 2 0
01602 WORCESTER 5,189 846 71 23 142 99 0
01603 WORCESTER 3,131 497 32 20 112 43 0
01604 WORCESTER 6,534 1,159 71 21 242 96 0
01605 WORCESTER 3,654 648 36 8 144 45 0
01606 WORCESTER 4,898 685 45 10 96 73 0
01607 WORCESTER 1,317 203 20 8 38 20 0
01608 WORCESTER 201 58 5 2 17 3 0
01609 WORCESTER 2,832 505 22 7 71 52 1
01610 WORCESTER 1,609 351 13 3 86 36 0
01611 CHERRY VALLEY 513 70 9 3 15 5 0
01612 PAXTON 1,220 148 7 0 17 14 0
01613 WORCESTER 15 3 0 0 0 1 0
01614 WORCESTER 2 0 0 0 0 0 0
01615 WORCESTER 3 0 0 0 0 0 0
01653 WORCESTER 3 0 0 0 0 0 0
01654 WORCESTER 0 0 0 0 0 0 0
01655 WORCESTER 0 0 0 0 0 0 0
01840 LAWRENCE 208 80 8 3 36 8 0
01841 LAWRENCE 4,448 954 113 37 305 116 0
01842 LAWRENCE 50 5 0 0 2 0 0
01843 LAWRENCE 3,344 677 66 11 189 75 0
01850 LOWELL 2,482 327 29 10 78 30 0
01851 LOWELL 4,279 681 59 22 157 57 0
01852 LOWELL 6,171 822 58 19 182 76 0
01853 LOWELL 48 4 0 0 1 0 0
01854 LOWELL 3,873 562 60 16 125 59 0
01901 LYNN 248 42 2 1 13 3 0
01902 LYNN 5,806 901 76 37 195 157 0
01903 LYNN 25 1 0 0 0 1 0
01904 LYNN 4,560 597 39 15 87 80 0
01905 LYNN 3,597 493 40 18 114 81 0
01910 LYNN 1 0 0 0 0 0 0
02020 BRANT ROCK 87 9 0 1 0 2 0
02041 GREEN HARBOR 70 7 0 0 2 0 0
02045 HULL 3,823 496 34 10 82 51 0
222
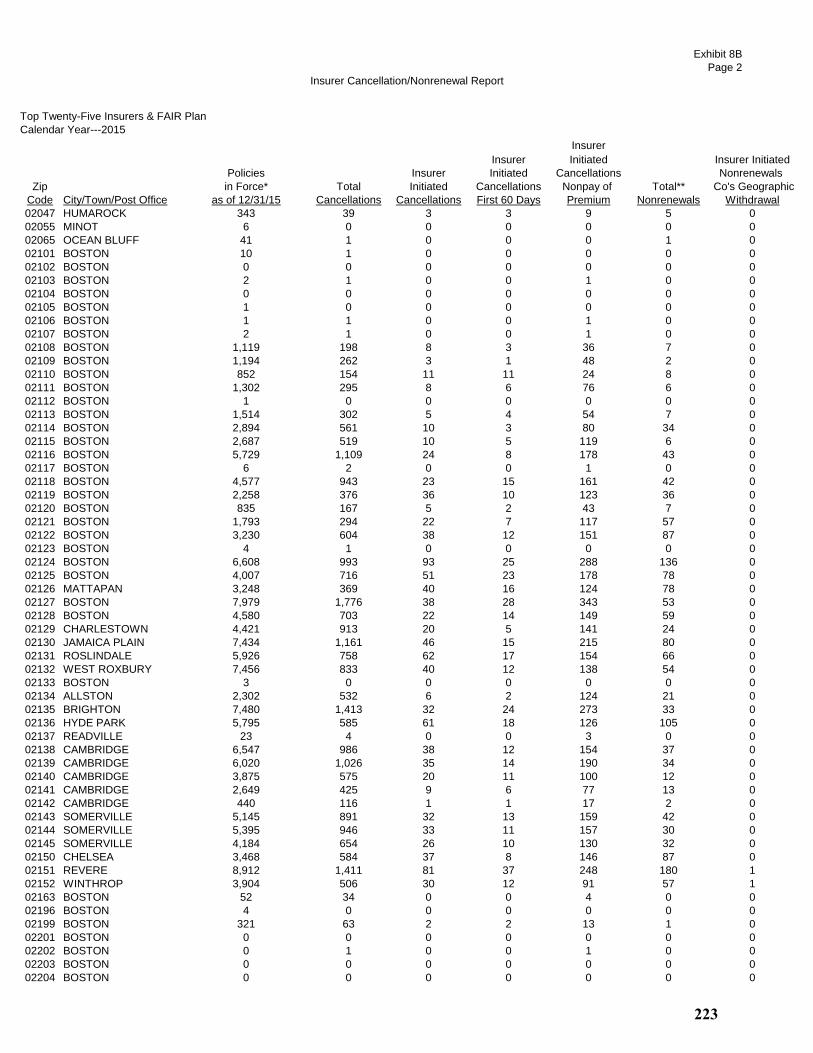
Insurer Cancellation/Nonrenewal Report
Exhibit 8B
Page 2
Top Twenty-Five Insurers & FAIR Plan
Calendar Year---2015
Insurer
Insurer Initiated Insurer Initiated
Policies Insurer Initiated Cancellations Nonrenewals
Zip in Force* Total Initiated Cancellations Nonpay of Total** Co's Geographic
Code City/Town/Post Office as of 12/31/15 Cancellations Cancellations First 60 Days Premium Nonrenewals Withdrawal
02047 HUMAROCK 343 39 3 3 9 5 0
02055 MINOT 6 0 0 0 0 0 0
02065 OCEAN BLUFF 41 1 0 0 0 1 0
02101 BOSTON 10 1 0 0 0 0 0
02102 BOSTON 0 0 0 0 0 0 0
02103 BOSTON 2 1 0 0 1 0 0
02104 BOSTON 0 0 0 0 0 0 0
02105 BOSTON 1 0 0 0 0 0 0
02106 BOSTON 1 1 0 0 1 0 0
02107 BOSTON 2 1 0 0 1 0 0
02108 BOSTON 1,119 198 8 3 36 7 0
02109 BOSTON 1,194 262 3 1 48 2 0
02110 BOSTON 852 154 11 11 24 8 0
02111 BOSTON 1,302 295 8 6 76 6 0
02112 BOSTON 1 0 0 0 0 0 0
02113 BOSTON 1,514 302 5 4 54 7 0
02114 BOSTON 2,894 561 10 3 80 34 0
02115 BOSTON 2,687 519 10 5 119 6 0
02116 BOSTON 5,729 1,109 24 8 178 43 0
02117 BOSTON 6 2 0 0 1 0 0
02118 BOSTON 4,577 943 23 15 161 42 0
02119 BOSTON 2,258 376 36 10 123 36 0
02120 BOSTON 835 167 5 2 43 7 0
02121 BOSTON 1,793 294 22 7 117 57 0
02122 BOSTON 3,230 604 38 12 151 87 0
02123 BOSTON 4 1 0 0 0 0 0
02124 BOSTON 6,608 993 93 25 288 136 0
02125 BOSTON 4,007 716 51 23 178 78 0
02126 MATTAPAN 3,248 369 40 16 124 78 0
02127 BOSTON 7,979 1,776 38 28 343 53 0
02128 BOSTON 4,580 703 22 14 149 59 0
02129 CHARLESTOWN 4,421 913 20 5 141 24 0
02130 JAMAICA PLAIN 7,434 1,161 46 15 215 80 0
02131 ROSLINDALE 5,926 758 62 17 154 66 0
02132 WEST ROXBURY 7,456 833 40 12 138 54 0
02133 BOSTON 3 0 0 0 0 0 0
02134 ALLSTON 2,302 532 6 2 124 21 0
02135 BRIGHTON 7,480 1,413 32 24 273 33 0
02136 HYDE PARK 5,795 585 61 18 126 105 0
02137 READVILLE 23 4 0 0 3 0 0
02138 CAMBRIDGE 6,547 986 38 12 154 37 0
02139 CAMBRIDGE 6,020 1,026 35 14 190 34 0
02140 CAMBRIDGE 3,875 575 20 11 100 12 0
02141 CAMBRIDGE 2,649 425 9 6 77 13 0
02142 CAMBRIDGE 440 116 1 1 17 2 0
02143 SOMERVILLE 5,145 891 32 13 159 42 0
02144 SOMERVILLE 5,395 946 33 11 157 30 0
02145 SOMERVILLE 4,184 654 26 10 130 32 0
02150 CHELSEA 3,468 584 37 8 146 87 0
02151 REVERE 8,912 1,411 81 37 248 180 1
02152 WINTHROP 3,904 506 30 12 91 57 1
02163 BOSTON 52 34 0 0 4 0 0
02196 BOSTON 4 0 0 0 0 0 0
02199 BOSTON 321 63 2 2 13 1 0
02201 BOSTON 0 0 0 0 0 0 0
02202 BOSTON 0 1 0 0 1 0 0
02203 BOSTON 0 0 0 0 0 0 0
02204 BOSTON 0 0 0 0 0 0 0
223

Insurer Cancellation/Nonrenewal Report
Exhibit 8B
Page 3
Top Twenty-Five Insurers & FAIR Plan
Calendar Year---2015
Insurer
Insurer Initiated Insurer Initiated
Policies Insurer Initiated Cancellations Nonrenewals
Zip in Force* Total Initiated Cancellations Nonpay of Total** Co's Geographic
Code City/Town/Post Office as of 12/31/15 Cancellations Cancellations First 60 Days Premium Nonrenewals Withdrawal
02205 BOSTON 0 1 0 0 0 0 0
02206 BOSTON 0 0 0 0 0 0 0
02207 BOSTON 0 0 0 0 0 0 0
02208 BOSTON 0 0 0 0 0 0 0
02209 BOSTON 0 0 0 0 0 0 0
02210 BOSTON 901 225 2 0 62 0 0
02211 BOSTON 1 0 0 0 0 0 0
02212 BOSTON 0 0 0 0 0 0 0
02215 BOSTON 1,964 414 14 9 81 11 0
02216 BOSTON 2 4 0 0 0 0 0
02217 BOSTON 0 2 1 0 1 0 0
02222 BOSTON 0 0 0 0 0 0 0
02228 EAST BOSTON 1 0 0 0 0 0 0
02238 CAMBRIDGE 2 0 0 0 0 0 0
02239 CAMBRIDGE 0 0 0 0 0 0 0
02241 BOSTON 0 0 0 0 0 0 0
02266 BOSTON 0 0 0 0 0 0 0
02283 BOSTON 0 0 0 0 0 0 0
02284 BOSTON 0 0 0 0 0 0 0
02293 BOSTON 1 0 0 0 0 0 0
02295 BOSTON 0 0 0 0 0 0 0
02297 BOSTON 0 0 0 0 0 0 0
02298 BOSTON 0 0 0 0 0 0 0
02301 BROCKTON 10,072 1,413 134 54 339 200 0
02302 BROCKTON 6,657 859 77 25 175 123 0
02303 BROCKTON 38 8 0 1 3 3 0
02304 BROCKTON 6 1 0 0 1 0 0
02305 BROCKTON 1 0 0 0 0 1 0
02360 PLYMOUTH 17,225 2,284 96 32 377 311 0
02361 PLYMOUTH 6 3 0 0 2 0 0
02362 PLYMOUTH 16 2 1 0 0 1 0
02381 WHITE HORSE BEACH 70 2 0 0 0 1 0
02532 BUZZARDS BAY 4,102 447 21 10 80 70 0
02534 CATAUMET 439 28 0 0 2 7 0
02535 CHILMARK 932 100 4 2 10 7 0
02536 EAST FALMOUTH 8,654 814 47 19 126 208 0
02537 EAST SANDWICH 2,364 229 10 3 29 35 0
02538 EAST WAREHAM 1,187 142 12 4 24 26 0
02539 EDGARTOWN 2,577 238 14 6 30 25 0
02540 FALMOUTH 4,178 412 14 13 63 81 0
02541 FALMOUTH 109 5 0 0 1 1 0
02542 BUZZARDS BAY 42 40 0 0 3 8 0
02543 WOODS HOLE 491 37 2 0 6 7 0
02552 MENEMSHA 3 0 0 0 0 0 0
02553 MONUMENT BEACH 317 26 3 2 5 3 0
02554 NANTUCKET 4,492 582 29 30 117 57 0
02556 NORTH FALMOUTH 1,916 169 13 4 25 51 0
02557 OAK BLUFFS 2,446 201 18 6 34 33 0
02558 ONSET 1,058 141 7 4 38 10 0
02559 POCASSET 1,768 163 8 4 21 40 0
02561 SAGAMORE 217 28 0 0 4 6 0
02562 SAGAMORE BEACH 1,060 119 4 1 21 8 0
02563 SANDWICH 3,863 413 27 7 43 51 0
02564 SIASCONSET 348 32 2 1 5 5 0
02565 SILVER BEACH 4 0 0 0 0 0 0
02568 VINEYARD HAVEN 1,871 175 4 5 19 30 0
02571 WAREHAM 4,269 423 34 11 79 58 0
02573 WEST CHOP 8 1 0 0 0 0 0
224

Insurer Cancellation/Nonrenewal Report
Exhibit 8B
Page 4
Top Twenty-Five Insurers & FAIR Plan
Calendar Year---2015
Insurer
Insurer Initiated Insurer Initiated
Policies Insurer Initiated Cancellations Nonrenewals
Zip in Force* Total Initiated Cancellations Nonpay of Total** Co's Geographic
Code City/Town/Post Office as of 12/31/15 Cancellations Cancellations First 60 Days Premium Nonrenewals Withdrawal
02574 WEST FALMOUTH 447 30 2 1 4 2 0
02575 WEST TISBURY 914 72 2 0 9 10 0
02576 WEST WAREHAM 879 110 6 2 23 14 0
02584 NANTUCKET 42 2 0 0 0 0 0
02601 HYANNIS 3,979 522 39 9 119 103 0
02630 BARNSTABLE 949 86 8 1 14 8 0
02631 BREWSTER 5,623 534 21 10 63 38 0
02632 CENTERVILLE 4,451 470 32 14 69 80 0
02633 CHATHAM 3,273 327 10 3 67 21 0
02634 CENTERVILLE 0 0 0 0 0 0 0
02635 COTUIT 1,729 152 8 1 16 24 0
02636 CENTERVILLE 14 0 0 0 0 1 0
02637 CUMMAQUID 256 28 1 0 7 2 0
02638 DENNIS 2,446 204 8 3 31 27 0
02639 DENNISPORT 3,391 241 8 16 49 35 0
02641 EAST DENNIS 973 82 4 0 6 14 0
02642 EASTHAM 3,613 322 8 4 50 44 0
02643 EAST ORLEANS 475 33 2 1 1 6 0
02644 FORESTDALE 1,169 121 9 3 17 11 0
02645 HARWICH 4,596 373 19 6 51 49 0
02646 HARWICHPORT 1,629 152 10 3 14 17 0
02647 HYANNISPORT 286 26 3 1 9 0 0
02648 MARSTONS MILLS 2,610 233 7 4 34 32 0
02649 MASHPEE 7,382 783 37 11 101 106 0
02650 NORTH CHATHAM 579 66 1 0 14 3 0
02651 NORTH EASTHAM 647 49 4 1 11 9 0
02652 NORTH TRURO 797 65 4 1 8 5 0
02653 ORLEANS 2,930 264 13 2 33 20 0
02655 OSTERVILLE 2,008 242 11 5 27 29 0
02657 PROVINCETOWN 2,483 246 9 6 36 12 0
02659 SOUTH CHATHAM 907 64 1 0 16 6 0
02660 SOUTH DENNIS 2,868 252 6 2 35 32 0
02661 SOUTH HARWICH 243 19 2 1 3 2 0
02662 SOUTH ORLEANS 234 22 0 1 3 0 0
02663 SOUTH WELLFLEET 393 25 4 0 1 2 0
02664 SOUTH YARMOUTH 4,576 462 25 13 74 53 0
02666 TRURO 1,249 108 4 4 19 18 0
02667 WELLFLEET 2,538 141 9 10 19 25 0
02668 WEST BARNSTABLE 1,100 117 5 1 12 20 0
02669 WEST CHATHAM 372 32 1 1 5 2 0
02670 WEST DENNIS 1,686 110 5 1 18 10 0
02671 WEST HARWICH 1,010 95 4 2 14 14 0
02672 WEST HYANNISPORT 335 35 7 1 3 5 0
02673 WEST YARMOUTH 4,376 482 27 14 87 64 0
02675 YARMOUTHPORT 3,068 318 19 2 32 21 0
02713 CUTTYHUNK 92 3 2 0 0 3 0
02714 DARTMOUTH 32 5 0 0 2 0 0
02719 FAIRHAVEN 4,330 608 30 8 113 50 0
02720 FALL RIVER 5,685 1,006 38 12 237 60 0
02721 FALL RIVER 3,759 671 24 9 176 47 0
02722 FALL RIVER 49 7 2 0 2 3 0
02723 FALL RIVER 1,962 384 14 5 113 22 0
02724 FALL RIVER 2,397 372 18 4 104 37 0
02725 SOMERSET 674 92 7 1 15 7 0
02726 SOMERSET 4,735 606 29 6 91 35 0
02738 MARION 1,787 223 21 3 45 16 0
02739 MATTAPOISETT 2,608 261 15 6 47 30 0
02740 NEW BEDFORD 7,162 914 81 26 224 117 0
225
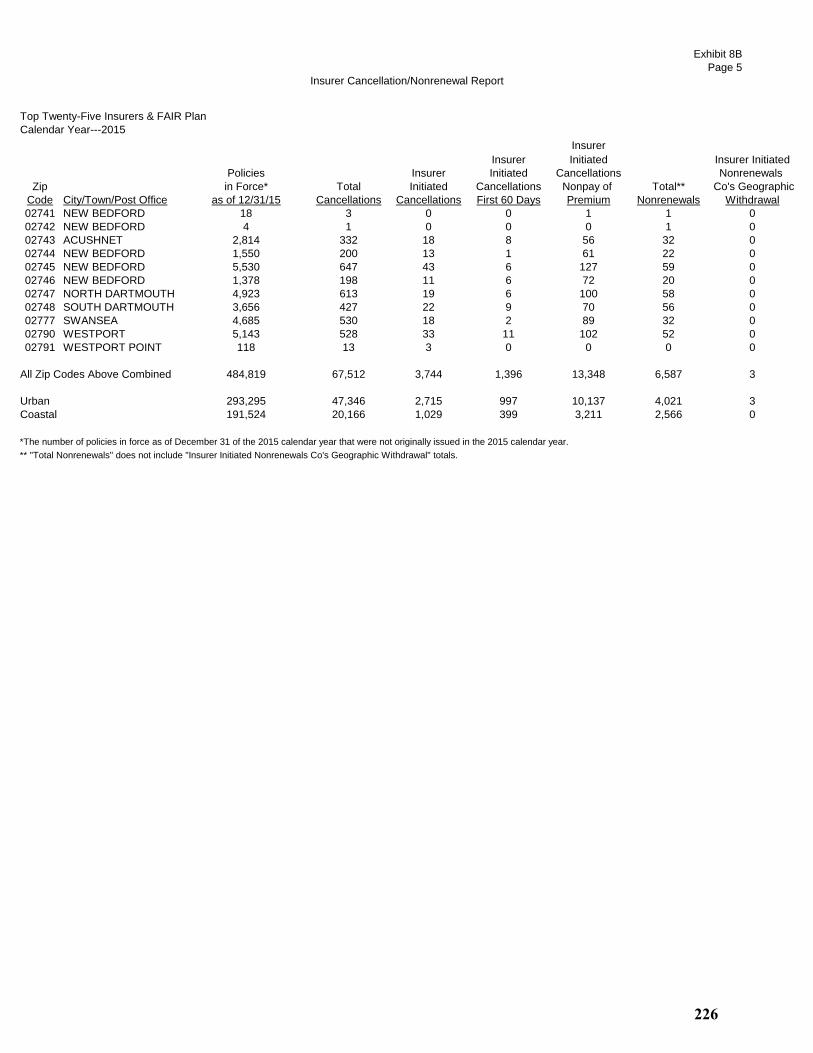
Insurer Cancellation/Nonrenewal Report
Exhibit 8B
Page 5
Top Twenty-Five Insurers & FAIR Plan
Calendar Year---2015
Insurer
Insurer Initiated Insurer Initiated
Policies Insurer Initiated Cancellations Nonrenewals
Zip in Force* Total Initiated Cancellations Nonpay of Total** Co's Geographic
Code City/Town/Post Office as of 12/31/15 Cancellations Cancellations First 60 Days Premium Nonrenewals Withdrawal
02741 NEW BEDFORD 18 3 0 0 1 1 0
02742 NEW BEDFORD 4 1 0 0 0 1 0
02743 ACUSHNET 2,814 332 18 8 56 32 0
02744 NEW BEDFORD 1,550 200 13 1 61 22 0
02745 NEW BEDFORD 5,530 647 43 6 127 59 0
02746 NEW BEDFORD 1,378 198 11 6 72 20 0
02747 NORTH DARTMOUTH 4,923 613 19 6 100 58 0
02748 SOUTH DARTMOUTH 3,656 427 22 9 70 56 0
02777 SWANSEA 4,685 530 18 2 89 32 0
02790 WESTPORT 5,143 528 33 11 102 52 0
02791 WESTPORT POINT 118 13 3 0 0 0 0
All Zip Codes Above Combined 484,819 67,512 3,744 1,396 13,348 6,587 3
Urban 293,295 47,346 2,715 997 10,137 4,021 3
Coastal 191,524 20,166 1,029 399 3,211 2,566 0
*The number of policies in force as of December 31 of the 2015 calendar year that were not originally issued in the 2015 calendar year.
** "Total Nonrenewals" does not include "Insurer Initiated Nonrenewals Co's Geographic Withdrawal" totals.
226

To
p 2
5 In
su
rer
an
d F
AIR
Pla
n
Can
cellati
on
s
Exhib
it 8
C
Top T
wenty
-Fiv
e Insure
rs a
nd F
AIR
Pla
n
Cale
ndar
Year-
--2015
Tota
lIn
sure
r-In
itia
ted C
ancella
tions
All
Oth
er
Tota
lE
stim
ate
d
Cancella
tions
During the F
irst 60 D
ays
Insure
r-In
itia
ted C
ancella
tions
Insure
r-In
itia
ted
Insure
r-In
itia
ted
Polic
yhold
er
During 2
015
Oth
er
than f
or
Nonpaym
ent
Due to N
onpaym
ent
Cancella
tions
2C
ancella
tions
2C
ancella
tions
Urb
an +
Coasta
l167,5
12
1,3
96
13,3
48
3,7
44
18,4
88
49,0
24
Urb
an
47,3
46
997
10,1
37
2,7
15
13,8
49
33,4
97
Coasta
l20,1
66
399
3,2
11
1,0
29
4,6
39
15,5
27
1E
xclu
de
s c
an
ce
llatio
ns o
n p
olic
ies w
ritte
n b
y to
p 2
5 v
olu
nta
ry w
rite
rs o
uts
ide
de
sig
na
ted
urb
an
an
d c
oa
sta
l zip
co
de
s.
2In
clu
de
s c
an
ce
llatio
ns b
y in
su
rer
du
e to
re
aso
ns p
erm
itte
d u
nd
er
Ma
ssa
ch
use
tts G
en
era
l L
aw
Ch
ap
ter
17
5, S
ectio
n 9
9,
an
d a
dm
inis
tra
tive
ca
nce
llatio
ns d
ue
to
tra
nsfe
r to
oth
er
po
licie
s.
227
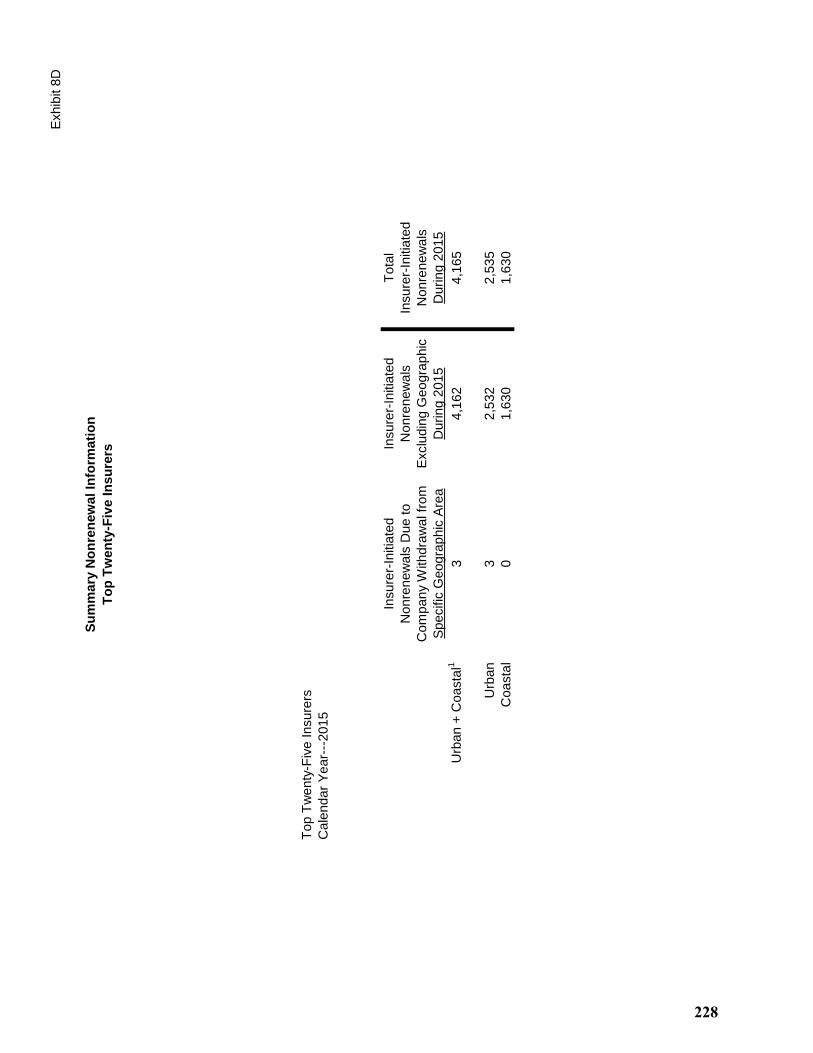
Su
mm
ary
No
nre
new
al In
form
ati
on
To
p T
wen
ty-F
ive In
su
rers
Exhib
it 8
D
Top T
wenty
-Fiv
e Insure
rs
Cale
ndar
Year-
--2015
Insure
r-In
itia
ted
Insure
r-In
itia
ted
Tota
l
Nonre
new
als
Due to
Nonre
new
als
Insure
r-In
itia
ted
Com
pany
Withdra
wal fr
om
Exclu
din
g G
eogra
phic
Nonre
new
als
Specific
Geogra
phic
Are
aD
uring 2
015
During 2
015
Urb
an +
Coasta
l13
4,1
62
4,1
65
Urb
an
32,5
32
2,5
35
Coasta
l0
1,6
30
1,6
30
228
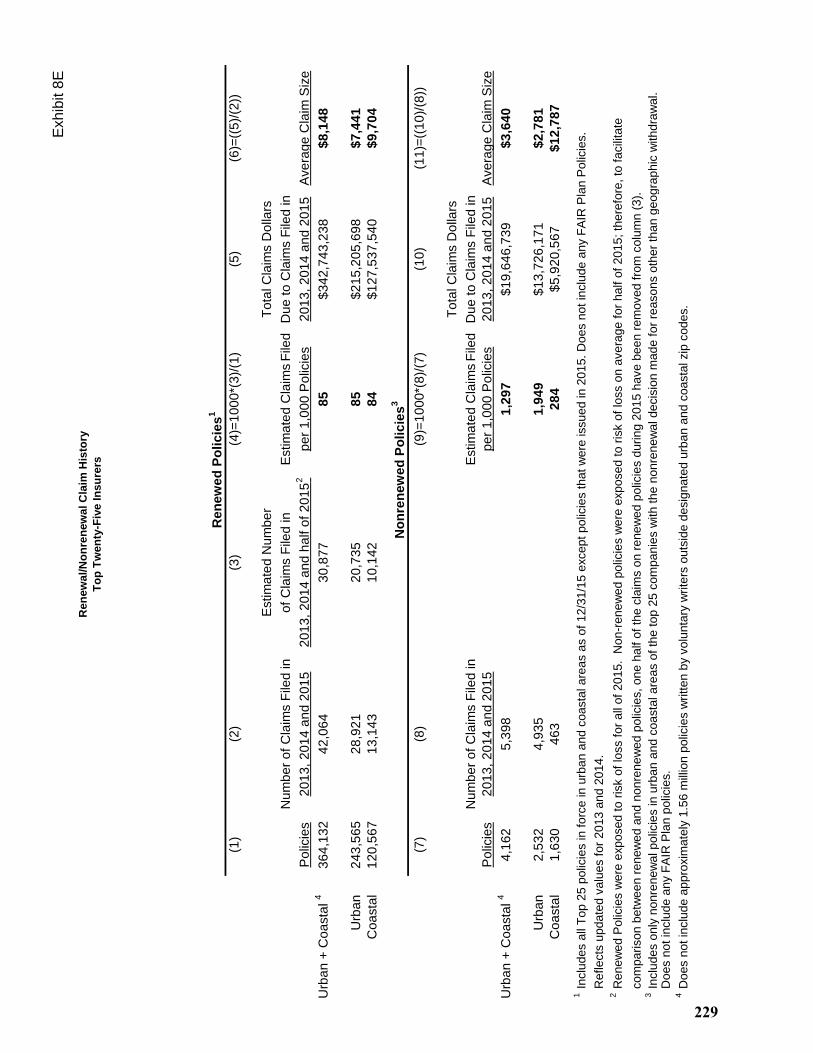
Re
ne
wa
l/N
on
ren
ew
al C
laim
His
tory
To
p T
we
nty
-Fiv
e In
su
rers
Exh
ibit 8
E
(1)
(2)
(3)
(4)=
10
00
*(3
)/(1
)(5
)(6
)=((
5)/
(2))
Estim
ate
d N
um
be
rT
ota
l C
laim
s D
olla
rs
Nu
mb
er
of
Cla
ims F
iled
in
of
Cla
ims F
iled
in
Estim
ate
d C
laim
s F
iled
Du
e t
o C
laim
s F
iled
in
Po
licie
s2
01
3,
20
14
an
d 2
01
52
01
3,
20
14
an
d h
alf o
f 2
01
52
pe
r 1
,00
0 P
olic
ies
20
13
, 2
01
4 a
nd
20
15
Ave
rage
Cla
im S
ize
Urb
an
+ C
oa
sta
l 4
36
4,1
32
42
,06
43
0,8
77
85
$3
42
,74
3,2
38
$8
,14
8
Urb
an
24
3,5
65
28
,92
12
0,7
35
85
$2
15
,20
5,6
98
$7
,44
1
Co
asta
l1
20
,56
71
3,1
43
10
,14
28
4$
12
7,5
37
,54
0$
9,7
04
(7)
(8)
(9)=
10
00
*(8
)/(7
)(1
0)
(11
)=((
10
)/(8
))
To
tal C
laim
s D
olla
rs
Nu
mb
er
of
Cla
ims F
iled
in
Estim
ate
d C
laim
s F
iled
Du
e t
o C
laim
s F
iled
in
Po
licie
s2
01
3,
20
14
an
d 2
01
5p
er
1,0
00
Po
licie
s2
01
3,
20
14
an
d 2
01
5A
ve
rage
Cla
im S
ize
Urb
an
+ C
oa
sta
l 4
4,1
62
5,3
98
1,2
97
$1
9,6
46
,73
9$
3,6
40
Urb
an
2,5
32
4,9
35
1,9
49
$1
3,7
26
,17
1$
2,7
81
Co
asta
l1
,63
04
63
28
4$
5,9
20
,56
7$
12
,78
7
1In
clu
des a
ll T
op 2
5 p
olic
ies in f
orc
e in u
rban a
nd c
oasta
l are
as a
s o
f 12/3
1/1
5 e
xcept polic
ies that w
ere
issued in 2
015. D
oes n
ot in
clu
de a
ny F
AIR
Pla
n P
olic
ies.
Reflects
update
d v
alu
es f
or
2013 a
nd 2
014.
2R
enew
ed P
olic
ies w
ere
exposed to r
isk o
f lo
ss f
or
all
of
2015. N
on-r
enew
ed p
olic
ies w
ere
exposed to r
isk o
f lo
ss o
n a
vera
ge f
or
half o
f 2015; th
ere
fore
, to
facili
tate
com
parison b
etw
een r
enew
ed a
nd n
onre
new
ed p
olic
ies, one h
alf o
f th
e c
laim
s o
n r
enew
ed p
olic
ies d
uring 2
015 h
ave b
een r
em
oved f
rom
colu
mn (
3).
3In
clu
des o
nly
nonre
new
al polic
ies in u
rban a
nd c
oasta
l are
as o
f th
e top 2
5 c
om
panie
s w
ith the n
onre
new
al decis
ion m
ade f
or
reasons o
ther
than g
eogra
phic
withdra
wal.
Does n
ot in
clu
de a
ny F
AIR
Pla
n p
olic
ies.
4D
oes n
ot in
clu
de a
ppro
xim
ate
ly 1
.56 m
illio
n p
olic
ies w
ritten b
y v
olu
nta
ry w
rite
rs o
uts
ide d
esig
nate
d u
rban a
nd c
oasta
l zip
codes.
Re
ne
we
d P
oli
cie
s1
No
nre
ne
we
d P
oli
cie
s3
229
Top Related
Copyright © 2022 FDOKUMEN

