


Bahasa
Halaman
Hukum

MARINE ECOLOGY PROGRESS SERIESMar Ecol Prog Ser
Vol. 470: 15–29, 2012doi: 10.3354/meps09907
Published December 6
INTRODUCTION
Calanipeda aquaedulcis Kritschagin, 1873 andArctodiaptomus salinus Daday, 1885 are typical representatives of holoplanktonic calanoid copepodsabundant in estuaries and shallow coastal marinewaters. Ephemeral and semi-permanent estuarineand coastal ecosystems are strongly affected by localenvironmental events (rain, evaporation, river flow,tides), resulting in frequent and unpredictable sal -inity changes (Ganning 1971, Ranta 1982, Devrekeret al. 2008). To survive in fluctuating environments,copepods require behavioural and physiologicaladaptations.
Copepods in oceanic and coastal waters are knownto be principally osmoconformers (Mauchline 1998),i.e. their body fluids are isotonic to the externalmedium. In osmoconformers, changes in environ-mental salinity lead to changes in internal osmolarity(Lance 1965), body density (McAllen et al. 1998,Knutsen et al. 2001), and behavior (Seuront 2006).
Some copepods may possess homeostatic mecha-nisms which permit physiological compensatory osmo -regulation. Osmoregulatory responses to salinityalterations in organic osmolyte content are found inthe marine copepod Eurytemora affinis (Roddie etal. 1984) and estuarine copepods Tigriopus californi-cus (Goolish & Burton 1989) and Temora longicornis
© Inter-Research 2012 · www.int-res.com*Email: [email protected]
Calanipeda aquaedulcis and Arctodiaptomus salinusare exceptionally euryhaline osmoconformers: evidence from mortality, oxygen consumption,
and mass density patterns
Leonid Svetlichny*, Elena Hubareva, Antonina Khanaychenko
Institute of Biology of the Southern Seas, Sevastopol 99011, Ukraine
ABSTRACT: Mortality, respiration rate, and body mass density of the estuarine copepods Cala-nipeda aquaedulcis and Arctodiaptomus salinus and their eggs were studied over a wide range ofsalinities. Empirical hydrodynamic modeling was applied to calculate body mass density using thesinking speed of the copepods. According to the index of median lethal salinity (LS50), the salinitytolerance ranges of C. aquaedulcis and A. salinus reared at 18 psu were 0.1 to 50 and 0.1 to 35 psu,respectively. No significant effect of salinity on the specific oxygen consumption rate was found inthe range from 0.1 to 40 psu in both species, while mean body mass density increased iso-osmoti-cally with water salinity from (mean ± SD) 1.053 ± 0.007 to 1.077 ± 0.005 g cm−3 in C. aquaedulcisand from 1.039 ± 0.004 to 1.062 ± 0.007 g cm−3 in A. salinus. However, body density contrast andsinking speed were stable in both species, allowing them to avoid buoyancy problems with changing salinity. The mean mass density of resting eggs in A. salinus gradually increased iso-osmotically following gradual changes in salinity. In contrast to resting eggs, the mass density ofsubitaneous eggs was not altered by changes in the surrounding salinity, suggesting a hysteresisresponse in these eggs.
KEY WORDS: Calanipeda aquaedulcis · Arctodiaptomus salinus · Salinity tolerance · Respirationrate · Body mass density
Resale or republication not permitted without written consent of the publisher
This authors' personal copy may not be publicly or systematically copied or distributed, or posted on the Open Web, except with written permission of the copyright holder(s). It may be distributed to interested individuals on request.
Mar Ecol Prog Ser 470: 15–29, 2012
(Tang et al. 2000). The ability to regulate the in -organic ion content of hemolymph is found in thebenthic copepod Tisbe reticulata (Battaglia & Bryan1964) and pelagic copepods Calanoides acutus andRhincalanus gigas (Sartoris et al. 2010). However, themaintenance of ionic content and body density asso-ciated with a decrease in salinity and density of sur-rounding fluid would pose problems for females ofspecies that carry eggs in an ovisac. The mass den-sity may directly influence the ability of adults andtheir eggs to maintain a vertical position in favorablewater layers.
Due to their ubiquitous distribution in brackish,marine, and hyper-saline environments, Calanipedaaquaedulcis and Arctodiaptomus salinus are appro-priate candidate species to investigate the mecha-nisms allowing copepods to compensate for salinitystress. Little is known about the salinity toleranceand capacity for osmoregulation in these species.The objective of this study was to investigate theeffects of gradual salinity changes on (1) mortality ofC. aquaedulcis and A. salinus, in order to estimatethe salinity tolerance range; and (2) respiration rate,body and egg mass density, and density contrast, inorder to evaluate the ability of these copepods toosmoregulate across a wide range of salinities.
MATERIALS AND METHODS
Experimental set-up and effect of salinity variationon mortality
The experiments were conducted on adult femalesand males of Calanipeda aquaedulcis and Arcto -diaptomus salinus from cultures. These copepod spe-cies have been in culture at the Institute of Biology ofthe Southern Seas (Sevastopol) since 2007. The cultures were originally generated from individualscollected from salt lakes (located near the Black Seacoast of the Kerch peninsula, Crimea), and are continuously cultivated in 0.45 µm filtered Black Seawater (FSW) of 18 psu at room temperature(20−22°C) and fed ad libitum a mixture of the micro-algae Isochrysis galbana, Prorocentrum minimum,and P. micans.
Laboratory studies of the effects of salinity on mortality, copepod body and egg mass density andoxygen consumption of both species were conductedfrom spring 2010 to spring 2011. To estimate thesalinity tolerance range (for survival), 20 to 30 ac -tively moving individuals of Calanipeda aquaedulcisor Arctodiaptomus salinus were placed in 100 ml
beakers (1 gender and species per beaker in 3 to5 replicates) containing FSW (18 psu) and then sub-jected to a gradual salinity decrease or increase overperiods ranging from 6 to 8 h, which conformed to theduration of tidal cycles in estuaries of the Medi -terranean region (Roddie et al. 1984, Devreker et al.2008) and the time needed for the regulation oforganic osmolyte concentration, body volume andoxygen consumption following osmotic stress incopepods (Goolish & Burton 1989).
To study the effect of salinity changes on copepodmortality, 3 treatments were used:
(1) Salinity was gradually increased at a rate ofabout 3 psu h−1 over 6 and 8 h, from 18 to 35 and40 psu for Arctodiaptomus salinus and Calanipedaaquaedulcis, respectively. A further increase in sal -inity at the same rate led to a pronounced de -crease in locomotor activity; therefore, the cope-pods were acclimated at these salinities for 5 dbefore further increasing the salinity above 35 and40 psu. After that, only actively swimming andfeeding individuals were exposed to further in -creases in salinity at a rate of 3 to 4 psu h−1 up totwo different final salinities of 50 and 60 psu inCalanipeda aquaedulcis, and up to 40 and 70 psuin Arctodiaptomus salinus.
(2) Salinity was gradually decreased over 6 h from18 to 1 psu at a rate of about 3 psu h−1. Preliminaryexperiments revealed that a decrease in salinity from18 to 0.2 psu in 1 d resulted in the loss of the majorityof the Calanipeda aquaedulcis specimens due tobody swelling; they were therefore kept for about20 h at 1 psu. Salinity was then gradually decreasedfurther to 0.1−0.2 psu during 5 h at a rate of about0.2 psu h−1.
(3) After long-term (up to 3 mo) maintenancein fresh water (0.2 psu), copepods were graduallyacclimated to 6, 14, 18, 22, 30 and 40 psu over 6 to 8 hat a rate of 1 to 5 psu h−1.
During all experiments, the copepods experiencedthe gradual salinity alteration by being transferredevery hour to the next salinity increment. Three to5 replicates were used for each salinity treatmentin both species. Low- and high-salinity waters wereprepared by stepwise addition (and steady inter -fusion) of distilled water or artificial sea salt to FSWof 18 psu. Water salinity (S, psu) was measured bya Hach conductivity meter (SensIon 5). Throughoutthe periods of acclimation to low or high salinity, thecopepods were fed with the microalga Haemoto -coccus pluvialis or a mixture of the microalgae Duna -liella tertiolecta, Monochrysis lutheri, and Proro -centrum micans, respectively.
16A
utho
r cop
y
Svetlichny et al.: Exceptionally euryhaline calanoid copepods
The number of live (actively swimming and con-taining food in the guts) and dead individuals wascounted during the gradual salinity changes andafter the salinity changes during long-term mainte-nance in water of increased or decreased salinity(5 to 10 d of maintenance at the final salinity). Cope-pod mortality (M, %) was calculated as: M = 100 D /(D + s), where D is the number of dead individuals,and s is the number of surviving individuals. Thesalinity tolerance range in Calanipeda aquaedulcisand Arctodiaptomus salinus was estimated takinginto account the lethal salinity values affecting 50%of the original number (LS50) (Hopper 1960, Parra etal. 2005, Chen et al. 2006) in 5 to 10 d. We chose thisperiod because the process of salinity acclimation incrustaceans usually takes at least 3 d (Lance 1963,Khlebovich 1981, Lee & Petersen 2003).
Oxygen consumption rate
Actively swimming adult females and males ofeach species (n = 200−300) were separated from theculture kept at 18 psu and divided into 2 groups,using a wide-mouth pipette. One group underwent agradual salinity decrease from 18 to 0.1−0.2 psu (as inTreatment 2), while the other group experienced agradual salinity increase from 18 to about 40 psu (asin Treatment 1). Thereafter, both groups were kept atthe final salinities for 1 wk and fed ad libitum. Priorto the experiments, the copepods were placed into100 ml beakers containing filtered (mesh size of0.45 µm) FSW and deprived of food for approxi-mately 2 h to allow emptying of the guts. Oxygenconsumption rate was measured separately for eachgender and species.
Respiration rate (R, µg O2 ind.−1 h−1) was deter-mined using the closed sealed chamber method, withexperimental and control syringes of 2.0 ml used asthe respirometers. Three to 5 females or 6 to 8 males(to equalize copepod weight per volume of respirom-eters because females are heavier than males) ofCalanipeda aquaedulcis and Arctodiaptomus salinusper 1 ml of FSW were gently transferred by a pipetteinto the experimental syringe, which was filled withFSW supplied through a protective sieve disc (meshsize 200 µm) at the confluent outlet.
To obtain identical oxygen, salinity, and sestoncontent, we connected the control and experimentalsyringes with a plastic tube and pumped the waterthrough it back and forth several times. The sy -ringes were then separated, closed by stoppers,and placed into a dark chamber at 20 ± 0.5°C. The
incubation period was ca. 2 h for Arctodiaptomussalinus and 3 h for Calanipeda aquaedulcis. At theend of the exposure, a water sample from the ex -perimental or control syringes was transferred to aflow chamber with a variable volume (up to 0.3 ml)created from a truncated all-glass syringe andjoined to a luminescent dissolved oxygen sensor(Hach LDO™). Details concerning the oxygen con-centration and respiration rate measurements aredescribed in Svetlichny & Hubareva (2005) andSvetlichny et al. (2010).
Body size, volume and wet weight
The total length (Ltot, mm) and length and width ofthe prosome (lpr and dpr, mm) of Calanipeda aqua e -dulcis and Arctodiaptomus salinus were measuredunder a light microscope fitted with an eyepiecemicrometer. Body volume (Vb, mm3) was calculatedusing the equation Vb = 0.47 Ltot
0.21 lpr0.93 dpr
1.86. Thisequation was based on the empirical relationshipbetween wet weight and body proportions deter-mined in 80 Copepoda species (Svetlichny 1983a) andapproximated to the cubic equation Vb = kLtot
3, wherek is the volume/size coefficient expressed in thepresent study by the function k ~ ƒ [lpr / Ltot (dpr / Ltot)2]as k = 0.47 (lpr dpr
2 / Ltot3)0.93 for both females and
males of calanoid and cyclopoid copepods (see Fig. S1in the supplement at www.int-res.com/ articles/ suppl/m470p015_supp.pdf) with body shapes varying fromspherical (e.g. Pachos punctatum) to elongated ellip-soid (e.g. Rhincalanus nasutus). Wet weight (WW, mg)was calculated as WW = Vb ρb, where ρb (mg mm−3) isthe mean body mass density.
Copepod sinking speed and body mass density
Sinking speed and body mass density were measured at 22 ± 0.5°C in females of Calanipedaaquaedulcis and Arctodiaptomus salinus from theculture kept at 18 psu: (1) after gradual salinitydecrease to 1−2 psu (Day 1) and 0.2−0.3 psu (Day 2)and (2) after gradual salinity increase to 30 psu(Day 1) and 40 psu (Day 2). Sinking speed and massdensity of copepods were also measured at the finalsalinities at the end of 1 wk. At least 15 individuals ofeach species and gender were studied at each salin-ity. The effect of 8 d of starvation on mass density ofC. aquaedulcis (the more susceptible species to foodlimitation in comparison with A. salinus) was studiedat 18 psu.
17A
utho
r cop
y
Mar Ecol Prog Ser 470: 15–29, 2012
To determine sinking speed, individuals wereanesthetized with 1:5000 MS-222 Sandoz until com-plete immobilization was achieved (not more than2 min) and were transferred into a 30 cm long, verti-cally oriented graduated tube (∅: 2 cm) filled withseawater of the given density and temperature(described in the previous paragraph). When intro-duced into the tube, the animals always assumed oneof their typical geometric positions: when the anten-nules were spread, the long axis of the body was horizontal or vertical (with the abdomen down), andwhen the antennules were folded along the body, thelong axis was vertical (with the head down).
To minimize the effect of water thermal convec-tion, the tube was completely submerged in a cylin-der (∅: 5 cm) with circulating water of a constanttemperature (21.5 to 22.5°C). The sinking speed ofeach individual was calculated as the mean (of 10replicates) time of sinking 20 cm down the tube,observed through a binocular microscope focusedon the central axis of the tube. Previous studies (e.g.Stepanov & Svetlichny 1981) have shown that thewall of a vessel affects the sinking speed of cope-pods only if the animals are located near the wall(closer than 10 body lengths). Therefore, we did nottake into consideration the result of the experimentwhen the distance between the copepod body (dia -meter of ca. 0.25 to 0.45 mm) and the wall of thevessel was <5 mm.
Body mass density was determined by ρb = ρw(1 +CD S U 2/2gVb), where ρw is the water density(g cm−3); S is the body cross-sectional area (cm2);U is the sinking speed (cm s−1); g is the accelerationdue to the gravity (cm s−2); and CD is the hydro -dynamic drag coefficient. S was expressed as S =πdpr
2/4, and CD was determined as CD = c/Ren, whereRe is the Reynolds number, n is the regression slope,and c is the hydrodynamic shape factor. Taking intoaccount that Re = dprU/ν, where ν is the kinematicmolecular viscosity (cm2 s−1), CD can be calculated asCD = c νn/dpr
nU n. Finally, the equation for calculationof body mass density in copepods can be expressedas ρb = ρw(1 + cπνndpr
2−nU 2−n/8gVb).To determine the hydrodynamic coefficients c and
n, previous data on the hydrodynamic characteristicsof passive sinking for 16 copepod species (Svetlichny1983b) were recalculated (see Table S1 in the sup-plement). Three types of copepod body orientationduring sinking were studied: sinking with the headdown and the antennules folded along the body (OI),sinking with the abdomen down and antennulesspread at an angle of 90° to the body axis (OII), andsinking dorsally in a horizontal position with spread
antennules (OIII). When Re < 1.0, n = 1.0 in every typeof body orientation, and when 1.0 < Re < 10.0, n =0.87 both for OI and OII and 0.82 for OIII.
The coefficient c was expressed as a function of theratio lan lpr : dpr
2, where lan is the length of 1 antenna.We found that for orientation OI, c = 2.27 lan lpr /dpr
2 +52.8; OII, c = 5.1 lan lpr /dpr
2 + 70.9; and OIII, c = 6.17 lan
lpr /dpr2 + 72.4 (Fig. S2 in the supplement).
The density of seawater was calculated taking intoaccount the temperature (measured with an accuracyof ±0.1°C) and salinity (determined by a conductivityprobe SensIon 5, accuracy of ±0.1 psu) using Ocean -ological Calculator 2.1 (V. S. Arkhipkin).
Egg sinking speed and mass density
All measurements of egg sinking speed and massdensity were performed at 22 ± 0.5°C. Subitaneouseggs of Calanipeda aquaedulcis were collected fromfemales cultivated at a constant salinity of 18 psu. Inaddition, subitaneous and resting eggs (coloredgrey just after laying and changing to pink colorafter several weeks of cold storage) were obtainedfrom 2 groups of Arctodiaptomus salinus femaleskept in fresh (0.2 psu) and brackish (18.2 psu) water.Sinking speed and density were measured in theeggs of A. salinus after gradual salinity increase ordecrease during 6 h in the range of 0.2 to 18.2 psuat a rate of 2 to 3 psu h−1. The ovisacs were carefullyseparated from anesthetized females via dissectingneedle, and the eggs were surgically removed fromthe ovisac and washed in filtered water of theexperimental salinity. Eggs (n = 1−3) from eachovisac (not less than 10 ovisacs were used) weretransported separately by a thin dropper to themeasuring tube. The measurements of egg sinkingspeed were carried out using the same method asthat for sinking adult females (see ‘Materials andmethods; Copepod sinking speed and body massdensity’) but with a measuring tube of a smallerdiameter (0.8 cm).
The eggs of the studied species were spherical,and the Reynolds number during their sinking waslow (maximum values of Re were 0.04 and 0.08 forCalanipeda aquaedulcis and Arctodiaptomus sali-nus, respectively). Consequently, the mass density ofthese copepod eggs (ρegg, g cm−3) was determinedfrom sinking speed following the Stokes equation(Happel & Brenner 1965): ρegg = (3νπdeggU+ρwgVegg)/gVegg, where degg is the egg diameter measured undera compound microscope at 400×. Egg volume wascalculated as Vegg = πdegg
3/6.
18A
utho
r cop
y

Svetlichny et al.: Exceptionally euryhaline calanoid copepods
Statistical analyses
Statistical evaluation of data was conducted by1-way analysis of variance and Student’s t-test. Values presented in the figures and tables are means± SD.
RESULTS
Long-term tolerance after gradual salinity changes
Mortality of males and females of Calanipeda aqua -edulcis reared at 18 psu did not exceed 5 % during10 d after gradual salinity decrease or increase in therange of 0.2 to 35 psu, whereas after the gradualsalinity increase from 18 to 40 psu and the sub -sequent increase to 50 psu (after 5 d exposure at40 psu), mortality significantly (p < 0.001) increasedto 32 ± 8 and 48 ± 14%, respectively (Fig. 1). Of theC. aquaedulcis individuals preliminarily ac climatedover 5 d to 35 psu, 87 ± 15% died during the 10 d(5 days of acclimation to 35 psu + 5 days of acclima-tion to final salinity) following the salinity increase to60 psu.
After 2 months of acclimation to fresh water (0.2 psu),10 ± 8 % of Calanipeda aquaedulcis that had beensubjected to a gradual salinity increase from 0.2 to18 psu at a rate of 4 psu h−1 died during the 10 dexposure at final salinity. After a salinity increasefrom 0.2 to 30 psu at the same rate, 39 ± 13 % of C.aquaedulcis died during the 8 d exposure, whilst an
increase in salinity from 0.2 to 40 psu at a rate of5 psu h−1 resulted in 100 % mortality on Day 1 of theexposure experiment.
In the experiment with the gradual salinity de -crease from 18 to 0.2 psu, the mortality of Arctodia -ptomus salinus was 10 ± 3% after 10 d of mainte-nance at the final salinity. We observed sharp in -creases in mortality, up to 42 ± 3 and 80 ± 15%, aftergradual (over 8 h) salinity increases from 18 to 35 psuand from 18 to 40 psu, respectively, during 5 to 10 dof maintenance at the final salinities. Few individualsof A. salinus acclimated to 40 psu during 10 d sur-vived in the hyper-saline water of 70 psu (not shownin Fig. 1).
In Arctodiaptomus salinus cultivated in fresh water(0.2 psu) for 3 mo, mortality was 18.9 ± 12% after agradual salinity increase from 0.2 to 14 psu at a rateof 2 psu h−1, whereas after a gradual salinity increasefrom 0.2 to 18 psu at the same rate, the mortality ofthis group reached 69 ± 6%. None of the copepodssurvived an abrupt salinity increase from 0.2 to22 psu during 8 h. No egg production was observedin A. salinus and Calanipeda aquaedulcis kept atsalinities higher than 40 and 50 psu, respectively.Moreover, nauplii did not hatch from the eggs offemales transferred to hyper-saline water with theovisacs.
Effect of salinity on adult respiration rate
While at 39.2 psu the respiration rate of femaleArctodiaptomus salinus (0.131 ± 0.018 µg O2 ind.−1
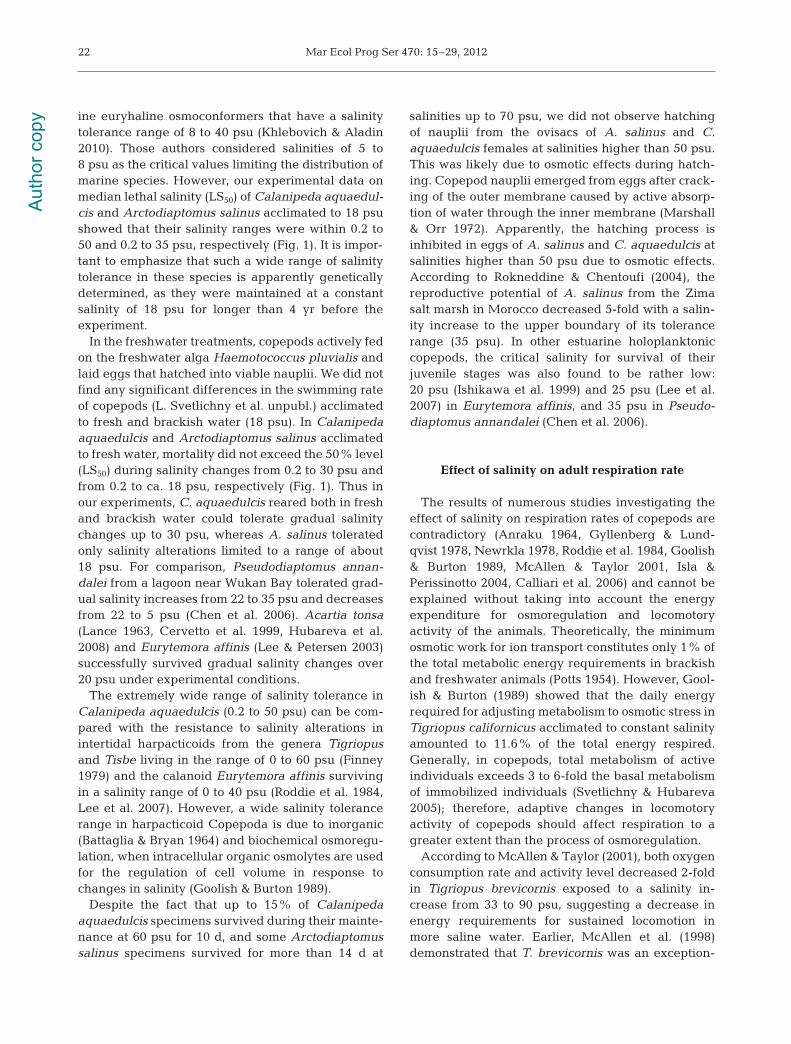
h−1) was 17% higher (p < 0.001) than that at 0.18 and18.7 psu (0.109 ± 0.019 µg O2 ind.−1 h−1), there were nostatistical differences (p > 0.05) in the weight-specificrespiration rates at all salinities studied (Table 1).
In females and males of Calanipeda aquaedulcis,respiration rates (0.079 ± 0.011 and 0.057 ± 0.009 µgO2 ind.−1 h−1, respectively) were significantly higher(30 and 40%; p < 0.001) at 0.1 psu than at 18 psu;however, there were no statistical differences (p >0.05) between the weight-specific respiration rates offemales and males of these species at 0.1, 18, and40 psu.
Effect of salinity on copepod sinking speed andbody mass density
At 18.3 psu, sinking speed of Arctodiaptomus sali-nus OII females (abdomen down and antennulesspread) was 0.23 ± 0.04 cm s−1 and did not differ sig-
19
0 10 20 30 40 50 60Salinity (psu)
0
20
40
60
80
100
Mor
talit
y (%
)
Fig. 1. Arctodiaptomus salinus and Calanipeda aquaedulcis.Salinity tolerance ranges of A. salinus (short-dashed lines)reared at 0.1 (Δ) and 18 (m) psu and C. aquaedulcis (solidlines) reared at 0.1 (s) and 18 (d) psu. The salinity tolerancerange in females and males of both species was between0.1 psu and the points denoting 50% mortality (horizontallong-dashed line) after 5 d of exposure to a given salinity.Solid and short-dashed lines are the polynomial regression
curves. Values are means ± SD
Aut
hor c
opy
Mar Ecol Prog Ser 470: 15–29, 2012
nificantly (p > 0.05) from the sinking speed of OII
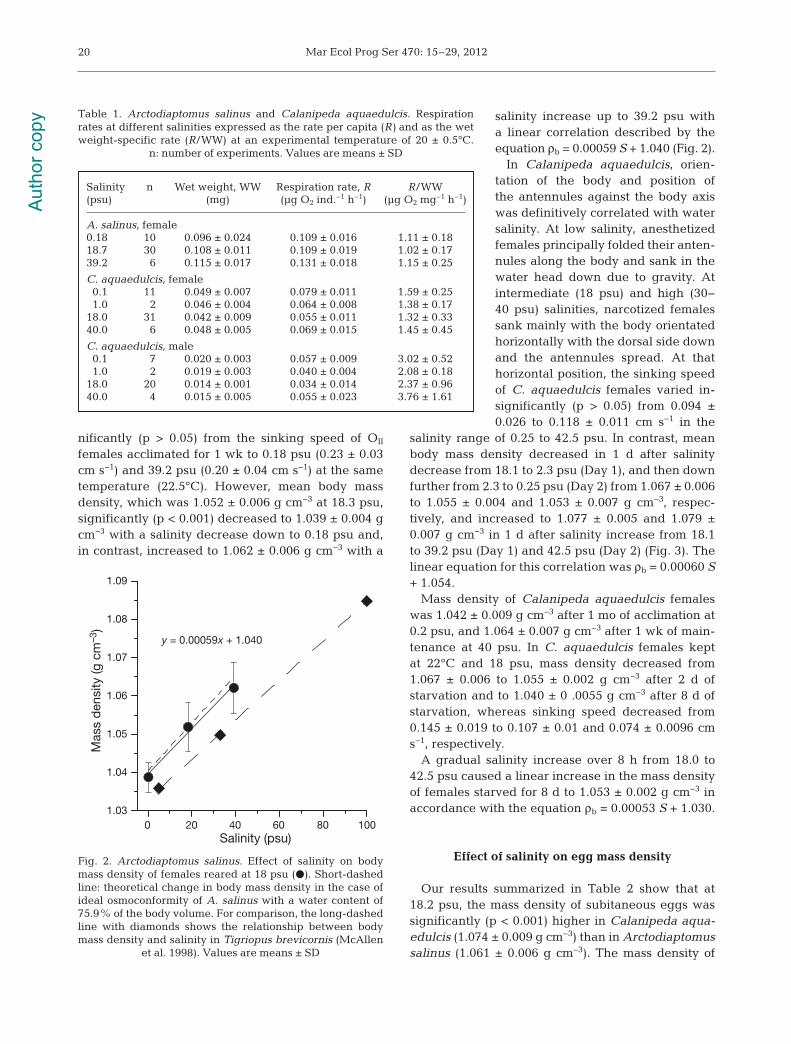
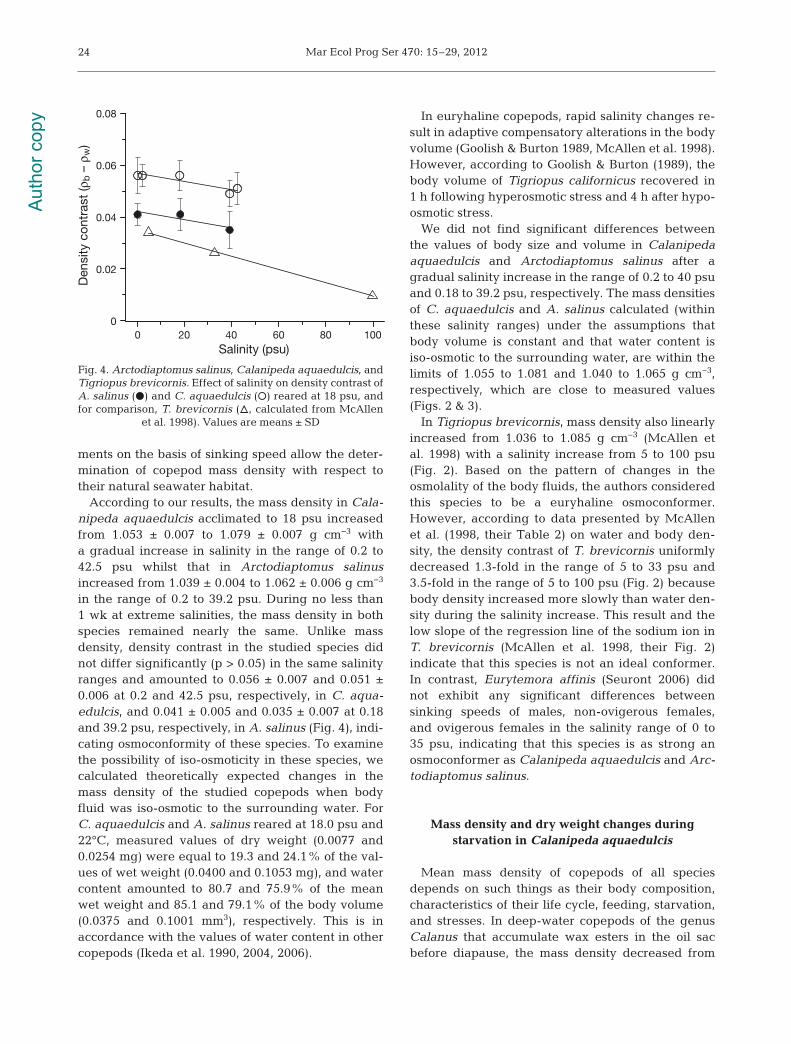
females acclimated for 1 wk to 0.18 psu (0.23 ± 0.03cm s−1) and 39.2 psu (0.20 ± 0.04 cm s−1) at the sametemperature (22.5°C). However, mean body massdensity, which was 1.052 ± 0.006 g cm−3 at 18.3 psu,significantly (p < 0.001) decreased to 1.039 ± 0.004 gcm−3 with a salinity decrease down to 0.18 psu and,in contrast, increased to 1.062 ± 0.006 g cm−3 with a
salinity increase up to 39.2 psu witha linear correlation described by theequa tion ρb = 0.00059 S + 1.040 (Fig. 2).
In Calanipeda aquaedulcis, orien -tation of the body and position ofthe antennules against the body axiswas definitively correlated with watersalinity. At low salinity, anesthetizedfemales principally folded their anten-nules along the body and sank in thewater head down due to gravity. Atintermediate (18 psu) and high (30−40 psu) salinities, narcotized femalessank mainly with the body orientatedhorizontally with the dorsal side downand the antennules spread. At thathorizontal position, the sinking speedof C. aquaedulcis females varied in -sig nificantly (p > 0.05) from 0.094 ±0.026 to 0.118 ± 0.011 cm s−1 in the
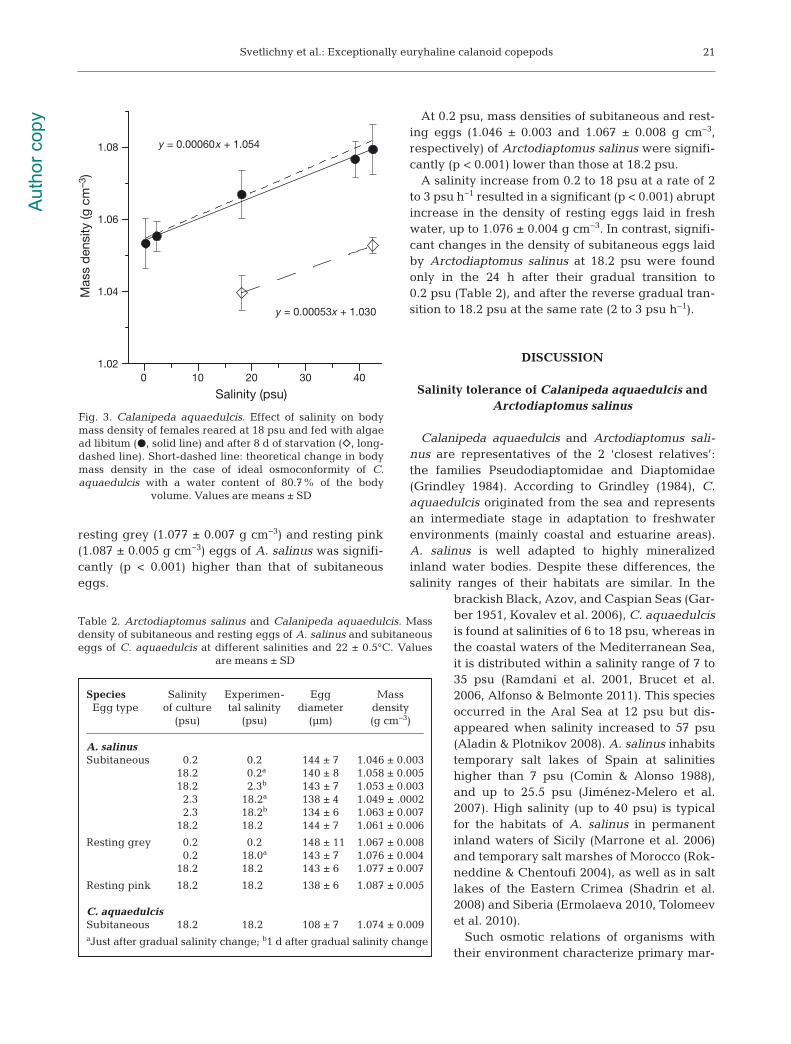
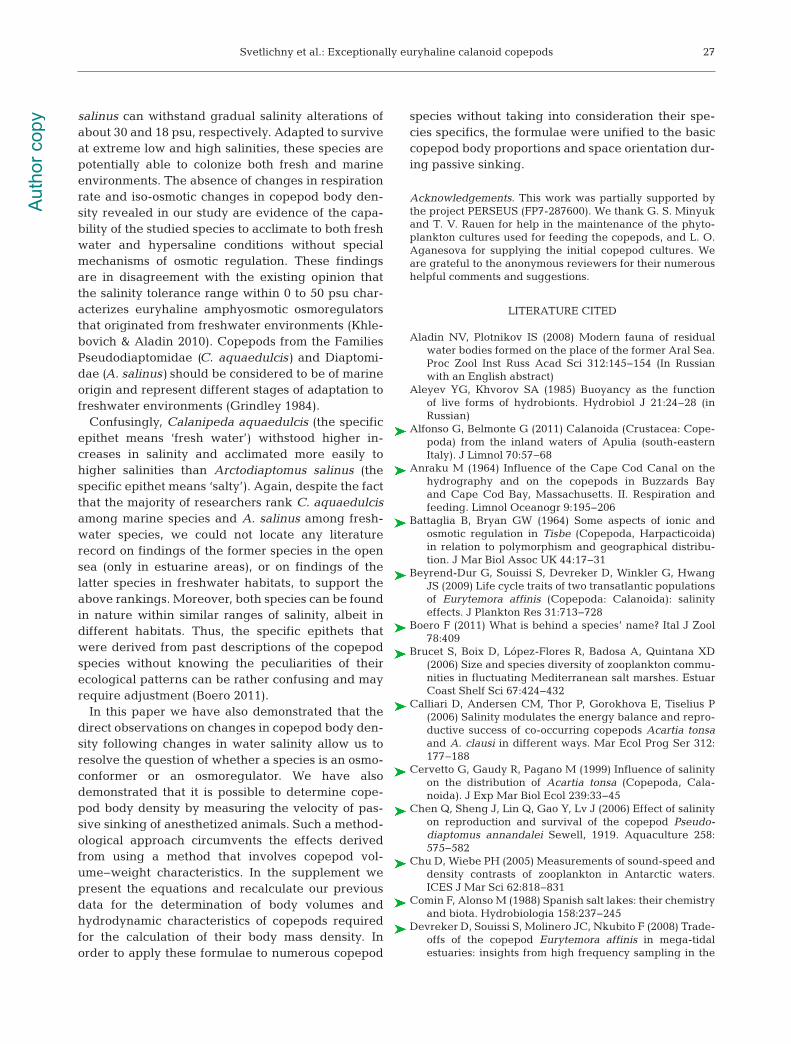
salinity range of 0.25 to 42.5 psu. In contrast, meanbody mass density decreased in 1 d after salinitydecrease from 18.1 to 2.3 psu (Day 1), and then downfurther from 2.3 to 0.25 psu (Day 2) from 1.067 ± 0.006to 1.055 ± 0.004 and 1.053 ± 0.007 g cm−3, respec-tively, and increased to 1.077 ± 0.005 and 1.079 ±0.007 g cm−3 in 1 d after salinity increase from 18.1to 39.2 psu (Day 1) and 42.5 psu (Day 2) (Fig. 3). Thelinear equation for this correlation was ρb = 0.00060 S+ 1.054.
Mass density of Calanipeda aquaedulcis femaleswas 1.042 ± 0.009 g cm−3 after 1 mo of acclimation at0.2 psu, and 1.064 ± 0.007 g cm−3 after 1 wk of main-tenance at 40 psu. In C. aquaedulcis females keptat 22°C and 18 psu, mass density decreased from1.067 ± 0.006 to 1.055 ± 0.002 g cm−3 after 2 d of starvation and to 1.040 ± 0 .0055 g cm−3 after 8 d ofstarvation, whereas sinking speed decreased from0.145 ± 0.019 to 0.107 ± 0.01 and 0.074 ± 0.0096 cms−1, respectively.
A gradual salinity increase over 8 h from 18.0 to42.5 psu caused a linear increase in the mass densityof females starved for 8 d to 1.053 ± 0.002 g cm−3 inaccordance with the equation ρb = 0.00053 S + 1.030.
Effect of salinity on egg mass density
Our results summarized in Table 2 show that at18.2 psu, the mass density of subitaneous eggs wassignificantly (p < 0.001) higher in Calanipeda aqua -edulcis (1.074 ± 0.009 g cm−3) than in Arctodiaptomussalinus (1.061 ± 0.006 g cm−3). The mass density of
20
0 20 40 60 80 1001.03
1.04
1.05
1.06
1.07
1.08
1.09
Mas
s d
ensi
ty (g
cm
–3)
y = 0.00059x + 1.040
Salinity (psu)
Fig. 2. Arctodiaptomus salinus. Effect of salinity on bodymass density of females reared at 18 psu (d). Short-dashedline: theoretical change in body mass density in the case ofideal osmoconformity of A. salinus with a water content of75.9% of the body volume. For comparison, the long-dashedline with diamonds shows the relationship between bodymass density and salinity in Tigriopus brevicornis (McAllen
et al. 1998). Values are means ± SD
Salinity n Wet weight, WW Respiration rate, R R/WW(psu) (mg) (µg O2 ind.−1 h−1) (µg O2 mg−1 h−1)
A. salinus, female0.18 10 0.096 ± 0.024 0.109 ± 0.016 1.11 ± 0.1818.7 30 0.108 ± 0.011 0.109 ± 0.019 1.02 ± 0.1739.2 6 0.115 ± 0.017 0.131 ± 0.018 1.15 ± 0.25
C. aquaedulcis, female0.1 11 0.049 ± 0.007 0.079 ± 0.011 1.59 ± 0.251.0 2 0.046 ± 0.004 0.064 ± 0.008 1.38 ± 0.17
18.0 31 0.042 ± 0.009 0.055 ± 0.011 1.32 ± 0.3340.0 6 0.048 ± 0.005 0.069 ± 0.015 1.45 ± 0.45
C. aquaedulcis, male0.1 7 0.020 ± 0.003 0.057 ± 0.009 3.02 ± 0.521.0 2 0.019 ± 0.003 0.040 ± 0.004 2.08 ± 0.18
18.0 20 0.014 ± 0.001 0.034 ± 0.014 2.37 ± 0.9640.0 4 0.015 ± 0.005 0.055 ± 0.023 3.76 ± 1.61
Table 1. Arctodiaptomus salinus and Calanipeda aquaedulcis. Respirationrates at different salinities expressed as the rate per capita (R) and as the wetweight-specific rate (R/WW) at an experimental temperature of 20 ± 0.5°C.
n: number of experiments. Values are means ± SD
Aut
hor c
opy
Svetlichny et al.: Exceptionally euryhaline calanoid copepods
resting grey (1.077 ± 0.007 g cm−3) and resting pink(1.087 ± 0.005 g cm−3) eggs of A. salinus was signifi-cantly (p < 0.001) higher than that of subitaneouseggs.
At 0.2 psu, mass densities of subitaneous and rest-ing eggs (1.046 ± 0.003 and 1.067 ± 0.008 g cm−3,respectively) of Arctodiaptomus salinus were signifi-cantly (p < 0.001) lower than those at 18.2 psu.
A salinity increase from 0.2 to 18 psu at a rate of 2to 3 psu h−1 resulted in a significant (p < 0.001) abruptincrease in the density of resting eggs laid in freshwater, up to 1.076 ± 0.004 g cm−3. In contrast, signifi-cant changes in the density of subitaneous eggs laidby Arctodiaptomus salinus at 18.2 psu were foundonly in the 24 h after their gradual transition to0.2 psu (Table 2), and after the reverse gradual tran-sition to 18.2 psu at the same rate (2 to 3 psu h−1).
DISCUSSION
Salinity tolerance of Calanipeda aquaedulcis andArctodiaptomus salinus
Calanipeda aquaedulcis and Arctodia ptomus sali-nus are representatives of the 2 ‘closest relatives’:the families Pseudodiaptomidae and Diaptomidae(Grindley 1984). According to Grindley (1984), C.aquaedulcis originated from the sea and representsan intermediate stage in adaptation to freshwaterenvironments (mainly coastal and estuarine areas).A. salinus is well adapted to highly mineralizedinland water bodies. Despite these differences, thesalinity ranges of their habitats are similar. In the
brackish Black, Azov, and Caspian Seas (Gar-ber 1951, Kovalev et al. 2006), C. aquaedulcisis found at salinities of 6 to 18 psu, whereas inthe coastal waters of the Mediterranean Sea,it is distributed within a salinity range of 7 to35 psu (Ramdani et al. 2001, Brucet et al.2006, Alfonso & Belmonte 2011). This speciesoccurred in the Aral Sea at 12 psu but dis -appeared when salinity increased to 57 psu(Aladin & Plotnikov 2008). A. salinus inhabitstemporary salt lakes of Spain at salinitieshigher than 7 psu (Comin & Alonso 1988),and up to 25.5 psu (Jiménez-Melero et al.2007). High salinity (up to 40 psu) is typicalfor the habitats of A. salinus in permanentinland waters of Sicily (Marrone et al. 2006)and temporary salt marshes of Morocco (Rok -neddine & Chentoufi 2004), as well as in saltlakes of the Eastern Crimea (Shadrin et al.2008) and Siberia (Ermolaeva 2010, Tolomeevet al. 2010).
Such osmotic relations of organisms withtheir en vironment characterize primary mar-
21
0 10 20 30 401.02
1.04
1.06
1.08
Salinity (psu)
Mas
s d
ensi
ty (g
cm
–3)
y = 0.00060x + 1.054
y = 0.00053x + 1.030
Fig. 3. Calanipeda aquaedulcis. Effect of salinity on bodymass density of females reared at 18 psu and fed with algaead libitum (d, solid line) and after 8 d of starvation (e, long-dashed line). Short-dashed line: theoretical change in bodymass density in the case of ideal osmoconformity of C.aquaedulcis with a water content of 80.7% of the body
volume. Values are means ± SD
Species Salinity Experimen- Egg Mass Egg type of culture tal salinity diameter density
(psu) (psu) (µm) (g cm−3)
A. salinusSubitaneous 0.2 0.2 144 ± 7 1.046 ± 0.003
18.2 0.2a 140 ± 8 1.058 ± 0.00518.2 2.3b 143 ± 7 1.053 ± 0.0032.3 18.2a 138 ± 4 1.049 ± .00022.3 18.2b 134 ± 6 1.063 ± 0.007
18.2 18.2 144 ± 7 1.061 ± 0.006
Resting grey 0.2 0.2 148 ± 11 1.067 ± 0.0080.2 18.0a 143 ± 7 1.076 ± 0.004
18.2 18.2 143 ± 6 1.077 ± 0.007
Resting pink 18.2 18.2 138 ± 6 1.087 ± 0.005
C. aquaedulcisSubitaneous 18.2 18.2 108 ± 7 1.074 ± 0.009aJust after gradual salinity change; b1 d after gradual salinity change
Table 2. Arctodiaptomus salinus and Calanipeda aquaedulcis. Massdensity of subitaneous and resting eggs of A. salinus and subitaneouseggs of C. aquaedulcis at different salinities and 22 ± 0.5°C. Values
are means ± SD
Aut
hor c
opy
Mar Ecol Prog Ser 470: 15–29, 2012
ine euryhaline osmoconformers that have a salinitytolerance range of 8 to 40 psu (Khlebovich & Aladin2010). Those authors considered salinities of 5 to8 psu as the critical values limiting the distribution ofmarine species. However, our experimental data onmedian lethal salinity (LS50) of Calanipeda aquaedul-cis and Arctodiaptomus salinus acclimated to 18 psushowed that their salinity ranges were within 0.2 to50 and 0.2 to 35 psu, respectively (Fig. 1). It is impor-tant to emphasize that such a wide range of salinitytolerance in these species is apparently geneticallydetermined, as they were maintained at a constantsalinity of 18 psu for longer than 4 yr before theexperiment.
In the freshwater treatments, copepods actively fedon the freshwater alga Haemotococcus pluvialis andlaid eggs that hatched into viable nauplii. We did notfind any significant differences in the swimming rateof copepods (L. Svetlichny et al. unpubl.) acclimatedto fresh and brackish water (18 psu). In Calanipedaaquaedulcis and Arctodiaptomus salinus acclimatedto fresh water, mortality did not exceed the 50% level(LS50) during salinity changes from 0.2 to 30 psu andfrom 0.2 to ca. 18 psu, respectively (Fig. 1). Thus inour experiments, C. aquaedulcis reared both in freshand brackish water could tolerate gradual salinitychanges up to 30 psu, whereas A. salinus toleratedonly salinity alterations limited to a range of about18 psu. For comparison, Pseudodiaptomus annan-dalei from a lagoon near Wukan Bay tolerated grad-ual salinity increases from 22 to 35 psu and decreasesfrom 22 to 5 psu (Chen et al. 2006). Acartia tonsa(Lance 1963, Cervetto et al. 1999, Hubareva et al.2008) and Eurytemora affinis (Lee & Petersen 2003)successfully survived gradual salinity changes over20 psu under experimental conditions.
The extremely wide range of salinity tolerance inCalanipeda aquaedulcis (0.2 to 50 psu) can be com-pared with the resistance to salinity alterations inintertidal harpacticoids from the genera Tigriopusand Tisbe living in the range of 0 to 60 psu (Finney1979) and the calanoid Eurytemora affinis survivingin a salinity range of 0 to 40 psu (Roddie et al. 1984,Lee et al. 2007). However, a wide salinity tolerancerange in harpacticoid Copepoda is due to inorganic(Battaglia & Bryan 1964) and biochemical osmoregu-lation, when intracellular organic osmolytes are usedfor the regulation of cell volume in response tochanges in salinity (Goolish & Burton 1989).
Despite the fact that up to 15% of Calanipedaaquaedulcis specimens survived during their mainte-nance at 60 psu for 10 d, and some Arctodiaptomussalinus specimens survived for more than 14 d at
salinities up to 70 psu, we did not observe hatchingof nauplii from the ovisacs of A. salinus and C.aquaedulcis females at salinities higher than 50 psu.This was likely due to osmotic effects during hatch-ing. Copepod nauplii emerged from eggs after crack-ing of the outer membrane caused by active absorp-tion of water through the inner membrane (Marshall& Orr 1972). Apparently, the hatching process isinhibited in eggs of A. salinus and C. aquaedulcis atsalinities higher than 50 psu due to osmotic effects.According to Rokneddine & Chentoufi (2004), thereproductive potential of A. salinus from the Zimasalt marsh in Morocco decreased 5-fold with a salin-ity increase to the upper boundary of its tolerancerange (35 psu). In other estuarine holoplanktoniccopepods, the critical salinity for survival of theirjuvenile stages was also found to be rather low:20 psu (Ishikawa et al. 1999) and 25 psu (Lee et al.2007) in Eurytemora affinis, and 35 psu in Pseudo -diaptomus annandalei (Chen et al. 2006).
Effect of salinity on adult respiration rate
The results of numerous studies investigating theeffect of salinity on respiration rates of copepods arecontradictory (Anraku 1964, Gyllenberg & Lund -qvist 1978, Newrkla 1978, Roddie et al. 1984, Goolish& Burton 1989, McAllen & Taylor 2001, Isla &Perissinotto 2004, Calliari et al. 2006) and cannot beexplained without taking into account the energyexpenditure for osmoregulation and locomotoryactivity of the animals. Theoretically, the minimumosmotic work for ion transport constitutes only 1% ofthe total metabolic energy requirements in brackishand freshwater animals (Potts 1954). However, Gool-ish & Burton (1989) showed that the daily energyrequired for adjusting metabolism to osmotic stress inTigriopus californicus acclimated to constant salinityamounted to 11.6% of the total energy respired.Generally, in copepods, total metabolism of activeindividuals exceeds 3 to 6-fold the basal metabolismof immobilized individuals (Svetlichny & Hubareva2005); therefore, adaptive changes in locomotoryactivity of copepods should affect respiration to agreater extent than the process of osmoregulation.
According to McAllen & Taylor (2001), both oxygenconsumption rate and activity level decreased 2-foldin Tigriopus brevicornis exposed to a salinity in -crease from 33 to 90 psu, suggesting a decrease inenergy requirements for sustained locomotion inmore saline water. Earlier, McAllen et al. (1998)demonstrated that T. brevicornis was an exception-
22A
utho
r cop
y
Svetlichny et al.: Exceptionally euryhaline calanoid copepods
ally euryhaline osmoconformer over the range of10 to 100 psu. However, McAllen & Taylor (2001)showed that there were signs of osmoregulation in T.brevicornis at the lowest salinities tolerated by thisspecies (5 psu).
Although in our experiments the respiration rate ofArctodiaptomus salinus females was 17% higher at39.2 psu than at 0.18 or 18.7 psu, weight-specific respiration rates showed no significant differences atall salinities in the range 0.18 to 39.2 psu. Also, therewas no evidence of salinity-associated differencesin weight-specific respiration rates of Calanipedaaquaedulcis females and males at 0.1, 18.7, and40 psu. The obtained accuracy of mean weight-specific oxygen consumption rates ranged from 16to 22% coefficient of variation (CV) in A. salinusfemales, 12 to 31% CV in C. aquaedulcis females,and 8 to 41% CV in C. aquaedulcis males. The last-mentioned accuracy (8 to 41% CV) seems to be toolow to claim an osmoregulatory capacity in the stud-ied copepods, as it is comparable with the cost of thisprocess (11.6% of the total energy respired) in Tigri-opus californicus (Goolish & Burton 1989), but it issufficient to conclude the absence of a salinity impacton their locomotory activities.
Effect of salinity on body mass density, sinkingspeed, and density contrast
Lowndes (1942) and Gross & Raymont (1942) werethe first to measure mass density of copepods. Forthis purpose, Lowndes (1942) weighed a batch ofadult copepods using ‘density bottles’ of 0.5 ml. Theresults obtained for 4 copepod species were con-verted to a ‘sinking factor,’ which is the same as thedensity contrast between the organisms and sea -water multiplied by 1000 (Knutsen et al. 2001). Gross& Raymont (1942) determined the mass density of asingle Calanus finmarchicus using the density bottlemethod, introducing the copepods to different mix-tures of gum arabic and seawater of given density.Usually, with the density bottle method, the organ-isms are killed or anesthetized, and then a liquid of acertain density where the organisms are neutrallybuoyant must be found (Aleyev & Khvorov 1985). Forthe measurement of copepod body mass density,McAllen et al. (1998) used a solution of sea salts anddeionized water. The density bottle method introduc-ing adult copepods to different mixtures of seawaterand glycerol was also used by Greenlaw (1977) andMatsukura et al. (2009). Køgeler et al. (1987) andVisser & Jonasdottir (1999) used the density gradient
column method with solutions of diluted seawaterand sugar. The density contrast of antarctic copepodswas measured using a dual-density method (Chu &Wiebe 2005), where the densities of 2 fluids (naturalseawater and distilled water) without copepods andmixtures of the fluids with copepods were deter-mined. However, using hyper- or hypo-osmotic solu-tions might force the water in the body of a copepodto be transported across the cell membranes, causingchanges in body weight and volume.
Lowndes (1942) raised the question of errors dueto osmotic imbalance between the solution and theorganism changing the relative water content of thebody tissues. To determine mass density of zooplank-ton, Greenlaw & Johnson (1982) proposed to use ahypotonic solution of distilled water and colloidal silica. They observed no apparent changes in thebuoyancy of live or preserved zooplankton organ-isms over time spans of seconds to minutes.
To exclude osmotic factors, Knutsen et al. (2001)used the Stokes hydrodynamic equation modified forthe sinking of an elongated ellipsoid in water to calculate the mass density of Calanus finmarchicusand C. glacialis. Prior to the measurement of sinkingspeed, the antennae of each anesthetized animalwere removed from the body to conform to the ellip-soidal shape. Previously, a similar method was usedto determine mass density in 16 copepod species(Svetlichny 1981) based on an empirical study of species-specific hydrodynamic drag coefficients (CD)determined during experiments with passive sinkingof immobilized individuals that had been weighed inseawater using a special microbalance (Svetlichny1983b).
In this study, we recalculated the hydrodynamicdata of Svetlichny (1983b) and expressed CD in theform of the power regression equation CD = c/Ren,where n is the regression slope and c is the hydro -dynamic shape factor depending on the ratio oflan lpr : dpr
2 and body position during sinking (see‘Materials and methods’ and the supplement at www.int-res. com/articles/suppl/m470p015_supp .pdf). UsingCD and body volume calculated from the relation Vb
~ L0.21 lpr0.93 dpr
1.86 (see ‘Materials and methods’ andthe supplement), we can determine mass density ofthe majority of calanoids or cyclopoids with bodyshapes varying from spherical with short antennulesto elongated ellipsoids with very long antennules,taking into account only the values of sinking speedin the water and L, lan, lpr, and dpr parameters.Despite the fact that the methods mentioned above(see ‘Discussion’ in Knutsen et al. 2001) should betreated as indicative rather than absolute, measure-
23A
utho
r cop
y
Mar Ecol Prog Ser 470: 15–29, 2012
ments on the basis of sinking speed allow the deter-mination of copepod mass density with respect totheir natural seawater habitat.
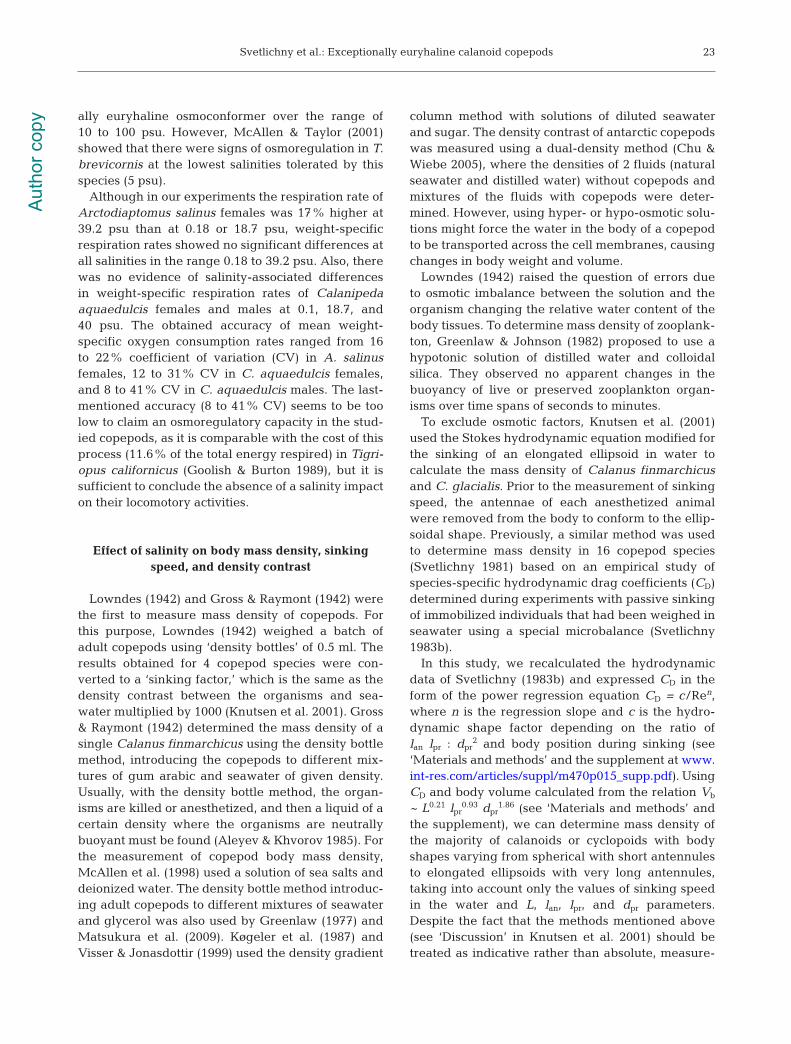
According to our results, the mass density in Cala-nipeda aquaedulcis acclimated to 18 psu increasedfrom 1.053 ± 0.007 to 1.079 ± 0.007 g cm−3 witha gradual increase in salinity in the range of 0.2 to42.5 psu whilst that in Arctodiaptomus salinusincreased from 1.039 ± 0.004 to 1.062 ± 0.006 g cm−3
in the range of 0.2 to 39.2 psu. During no less than1 wk at extreme salinities, the mass density in bothspecies remained nearly the same. Unlike mass density, density contrast in the studied species didnot differ significantly (p > 0.05) in the same salinityranges and amounted to 0.056 ± 0.007 and 0.051 ±0.006 at 0.2 and 42.5 psu, respectively, in C. aqua -edulcis, and 0.041 ± 0.005 and 0.035 ± 0.007 at 0.18and 39.2 psu, respectively, in A. salinus (Fig. 4), indi-cating osmoconformity of these species. To examinethe possibility of iso-osmoticity in these species, wecalculated theoretically expected changes in themass density of the studied copepods when bodyfluid was iso-osmotic to the surrounding water. ForC. aquaedulcis and A. salinus reared at 18.0 psu and22°C, measured values of dry weight (0.0077 and0.0254 mg) were equal to 19.3 and 24.1% of the val-ues of wet weight (0.0400 and 0.1053 mg), and watercontent amounted to 80.7 and 75.9% of the meanwet weight and 85.1 and 79.1% of the body volume(0.0375 and 0.1001 mm3), respectively. This is inaccordance with the values of water content in othercopepods (Ikeda et al. 1990, 2004, 2006).
In euryhaline copepods, rapid salinity changes re -sult in adaptive compensatory alterations in the bodyvolume (Goolish & Burton 1989, McAllen et al. 1998).However, according to Goolish & Burton (1989), thebody volume of Tigriopus californicus recovered in1 h following hyperosmotic stress and 4 h after hypo-osmotic stress.
We did not find significant differences betweenthe values of body size and volume in Calanipedaaquaedulcis and Arctodiaptomus salinus after agradual salinity increase in the range of 0.2 to 40 psuand 0.18 to 39.2 psu, respectively. The mass densitiesof C. aquaedulcis and A. salinus calculated (withinthese salinity ranges) under the assumptions thatbody volume is constant and that water content isiso-osmotic to the surrounding water, are within thelimits of 1.055 to 1.081 and 1.040 to 1.065 g cm−3,respectively, which are close to measured values(Figs. 2 & 3).
In Tigriopus brevicornis, mass density also linearlyincreased from 1.036 to 1.085 g cm−3 (McAllen etal. 1998) with a salinity increase from 5 to 100 psu(Fig. 2). Based on the pattern of changes in theosmolality of the body fluids, the authors consideredthis species to be a euryhaline osmoconformer.However, according to data presented by McAllenet al. (1998, their Table 2) on water and body den-sity, the density contrast of T. brevicornis uniformlydecreased 1.3-fold in the range of 5 to 33 psu and3.5-fold in the range of 5 to 100 psu (Fig. 2) becausebody density increased more slowly than water den-sity during the salinity increase. This result and thelow slope of the regression line of the sodium ion inT. brevicornis (McAllen et al. 1998, their Fig. 2)indicate that this species is not an ideal conformer.In contrast, Eurytemora affinis (Seuront 2006) didnot exhibit any significant differences between sinking speeds of males, non-ovigerous females,and ovigerous females in the salinity range of 0 to35 psu, indicating that this species is as strong anosmoconformer as Calanipeda aquaedulcis and Arc-todiaptomus salinus.
Mass density and dry weight changes duringstarvation in Calanipeda aquaedulcis
Mean mass density of copepods of all speciesdepends on such things as their body composition,characteristics of their life cycle, feeding, starvation,and stresses. In deep-water copepods of the genusCalanus that accumulate wax esters in the oil sacbefore diapause, the mass density decreased from
24
0
0.02
0.04
0.06
0.08
0 20 40 60 80 100
Den
sity
con
tras
t (ρ
b –
ρw
)
Salinity (psu)
Fig. 4. Arctodiaptomus salinus, Calanipeda aquaedulcis, andTigriopus brevicornis. Effect of salinity on density contrast ofA. salinus (d) and C. aquaedulcis (s) reared at 18 psu, andfor comparison, T. brevicornis (n, calculated from McAllen
et al. 1998). Values are means ± SD
Aut
hor c
opy

Svetlichny et al.: Exceptionally euryhaline calanoid copepods
1.06 to 0.99 g cm−3 with an increase in lipid contentat seawater density of 1.016 g cm−3 (Svetlichny et al.1998) and from 1.052 to 1.025 g cm−3 at seawater den-sity of about 1.022 g cm−3 (Visser & Jonasdottir 1999).Hence, individuals with a lipid content of 60% of dryweight in the Black Sea or 30% of dry weight in theNorwegian Sea may have neutral buoyancy. Waxesters are accumulated slowly and could be involvedin metabolic processes as a last energy resource,later than other lipids, probably allowing calanoidcopepods to keep positive buoyancy during long-term diapause. Estuarine and freshwater copepods(including Arctodiaptomus salinus and Calanipedaaquaedulcis) accumulate mainly triacylglycerols inthe form of droplets distributed in the body (Ventura& Catalan 2005, Guerrero et al. 2007, Tolomeev et al.2010). However, in contrast to wax esters, triacylglyc-erols can be rapidly synthesized during feeding andutilized at starvation, thus influencing the body massdensity. The pattern of changes in the mass densitydue to losses of low-density and high-density bodycomponents may indicate a metabolic path used during starvation.
According to our results, the mass density of Cala-nipeda aquaedulcis at 22°C decreased from 1.067 ±0.006 to 1.055 ± 0.002 g cm−3 after 2 d of starvationand to 1.040 ± 0.005 g cm−3 after 8 d of starvation.During the entire period of starvation, sinking speed
and density contrast decreased about 2-fold from0.145 to 0.074 cm s−1 and from 0.0555 to 0.0283 gcm−3, respectively (Fig. 5), while body volume did notchange significantly. Consequently, if during starva-tion only low-density lipids were utilized, the massdensity would increase due to uptake of water. Thus,the decrease in mass density could occur as a resultof utilization of high-density body components suchas proteins with densities > 1.35 g cm−3.
We estimated the dry weight (DW) losses in Cala-nipeda aquaedulcis (corresponding to changes in themass density during starvation) by accepting theirinitial DW as 0.0077 mg (19.3% of WW, see above,this section) and body volume of 0.038 mm3. DWwas equal to 0.0062 mg after 2 d of starvation and0.0039 mg after 8 d of starvation. To examine esti-mated DW losses, we calculated the expected lossesin DW during starvation of C. aquaedulcis in accor-dance with their respired energy. The mean respira-tion rate in C. aquaedulcis (our results) at 20°C was0.055 µg O2 ind.−1 h−1 (or 0.041 µmol O2 ind.−1 d−1). So,according to the temperature coefficient for cope-pods (Q10 = 2.0) formulated by Ikeda et al. (2001),mean respiration rate in C. aquaedulcis at 22°Cwould be 0.048 µmol O2 ind.−1 h−1.
To convert the daily consumed oxygen into energyunits, we can use the oxyenthalpic equivalent of480 kJ mol−1 O2 (Gnaiger & Forstner 1983), assumingthat the combusted substrate was a mixture of lipids,proteins, and carbohydrates. To convert energy dis -sipation rate to DW losses, we used the copepodmean DW energy content of 26 J mg−1 DW (Ikedaet al. 2006). Changes in respiration rate due to adecrease in DW were estimated according to theequation: Rt−1 /Rt = (DWt−1 /DWt)0.8, where t is time(d). Calculated this way, DW of starved Calanipedaaquaedulcis decreased during 8 d of starvation from0.0077 to 0.0027 mg with a higher regression slopethan that calculated in accordance with changes inthe body mass density (Fig. 5). This may be due tothe fact that in starving animals, the respiration ratedecreases more quickly than body weight.
Consequently, the indirect method of determiningmass density based on sinking speed gives the op -portunity to conduct long-term observations of livecopepods and may be improved using video record-ings of the behavior of intact individuals. For exam-ple, studies on changes in the mass density of deadcopepods based on the sinking speed of carcassesallowed us to determine the decomposition rate inintact individuals inside conical tubes with constantlyascending seawater flows (Stepanov & Svetlichny1981).
25
0 2 4 6 8
0.01
0.02
0.04
0.06
0.008
0.006
0.004
0.002
Den
sity
con
tras
t (ρ
b –
ρw
)D
ry w
eigh
t (m
g)
Day
Fig. 5. Calanipeda aquaedulcis. Changes in density contrast(e, long-dashed line) and body dry weight calculated on thebasis of body mass density (d, solid line) and respired en-ergy losses converted to dry weight (s, dashed line) during
starvation
Aut
hor c
opy

Mar Ecol Prog Ser 470: 15–29, 201226
Effects of salinity on egg mass density
At 18 psu, the mass density of subitaneous eggs inCalanipeda aquaedulcis (1.074 ± 0.009 g cm−3) wassignificantly (p < 0.001) higher than in Arctodiapto-mus salinus subitaneous eggs (1.061 ± 0.006 g cm−3),and the density contrast in C. aquaedulcis eggsexceeded by 27% that in A. salinus subitaneouseggs. The same tendency was observed in females ofthese species (1.067 ± 0.006 and 1.0529 ± 0.006 gcm−3, respectively), probably due to higher lipid con-tent in eggs and females of A. salinus. In comparisonwith the mass density of subitaneous eggs, mass den-sity of resting eggs of A. salinus was significantly (p <0.001) higher: 1.077 ± 0.007 and 1.087 ± 0.005 g cm−3
in grey and pink eggs, respectively. According to our data, the mass density of eggs
was higher than the mass density of females and sea-water. It is important to estimate the energy cost ofbearing eggs in sac-spawning copepods. At 22.5°Cand 18.3 psu, the sinking speed of non-ovigerousArctodiaptomus salinus females was 0.23 ± 0.04 cms−1, whereas that of females with 12−14 and 20 eggsin the ovisac was 0.286 ± 0.021 and 0.335 ± 0.011 cms−1, respectively, i.e. 1.46-fold higher. At a low Rey -nolds number, the hydrodynamic power F is pro -portional to U 2, hence the cost of sustained locomo-tion in the heaviest A. salinus females due to a largeegg sac will be approximately 2-fold higher than thatin non-egg-carrying females.
According to Seuront (2006), the sinking speed ofovigerous females of Eurytemora affinis was approx-imately 1.7-fold higher than that of non-ovigerousfemales at the same water salinity. The clutch size inthis species reaches 75 eggs clutch−1 (Beyrend-Dur etal. 2009), which explains the stronger (compared toour data) difference between sinking speeds of non-ovigerous and brooding females. Hence, the cost ofthe egg-brooding strategy in comparison with thebroadcast strategy is likely to be increased due toenergy demands for sustained locomotion and in -creased predation on adult females, since the largeegg masses can cause a decrease in swimming speed(Seuront 2006).
To study the osmoregulatory ability in eggs ofArcto diaptomus salinus, we estimated changes in themass density of resting and subitaneous eggs in therange of 0.2 to 18.2 psu. The mean mass density inresting eggs of A. salinus reared at 0.2 psu increasedfrom 1.067 to 1.076 g cm−3 just after 6 h of a gradualsalinity increase to 18.0 psu, while the density con-trast (0.069 and 0.065 g cm−3 at 0.2 and 18.2 psu,respectively) was nearly stable and similar to the
density contrast in resting eggs of females reared at18.2 psu (Table 2). To examine whether the changesin egg mass density conformed to the changes in theinner water mass density, we calculated the watercontent and density of dry mass of A. salinus restingeggs and compared the obtained values to the litera-ture data. The water content (Cw) as a share of theegg volume can be determined by solving the follow-ing linear equations:
ρb1 = [ρDMVegg(1 − Cw)+ ρw1VeggCw]/Vegg
ρb2 = [ρDMVegg(1 − Cw)+ ρw2VeggCw]/Vegg
where ρDM is the density of dry mass, ρw is the waterdensity, and Vegg is the egg volume, which is constantbefore and after salinity changes (see Table 2). Thesolution for Cw can be obtained as:
Cw = (ρb1 − ρb2)/(ρw1 − ρw2)
The estimated value of Cw for resting eggs ofArcto diaptomus salinus was 0.67, and therefore ρDM
was calculated as 1.207 g cm−3. In accordance withthe obtained constant values of Cw and ρDM, eggmass density at 0.2 and 18 psu should be 1.067 and1.076 g cm−3, respectively, as it had been calculatedfrom measured sinking speeds. For comparison, themass density of resting eggs in the closely relatedCentropages tenuiremis at a salinity of 28 psu wasequal to 1.1486 g cm−3 (Wang et al. 2005), while Cw
and ρDM calculated from the values of DW (165 ngegg−1) and egg diameter (79.69 µm) were 0.52 and1.285 g cm−3, respectively.
The mean mass densities in subitaneous eggs ofArctodiaptomus salinus obtained from females rearedat 0.2 and 18.2 psu were also different (1.046 and1.061 g cm−3, respectively, Table 2), whereas the values of density contrast showed no essential dif -ference (0.048 and 0.049 g cm−3, respectively), as inresting eggs. However, in contrast to resting eggs,the changes in mass density of subitaneous eggs didnot occur immediately after the changes in salinityof the surrounding water, suggesting a hysteresisresponse to salinity in this type of eggs.
CONCLUSIONS
According to our experimental results, the range ofsalinity tolerance (conditions under which the speci-mens survive and reproduce over a long period oftime) is within 0.2 to 50 psu for Calanipeda aquaedul-cis and within 0.2 to 35 psu for Arctodia ptomus sali-nus. Over a time period of about 8 h, correspondingto the duration of tidal cycles, C. aquaedulcis and A.
�
Aut
hor c
opy
Svetlichny et al.: Exceptionally euryhaline calanoid copepods
salinus can withstand gradual salinity alterations ofabout 30 and 18 psu, respectively. Adapted to surviveat extreme low and high salinities, these species arepotentially able to colonize both fresh and marineenvironments. The absence of changes in respirationrate and iso-osmotic changes in copepod body den-sity revealed in our study are evidence of the capa -bility of the studied species to acclimate to both freshwater and hypersaline conditions without specialmechanisms of osmotic regulation. These findingsare in disagreement with the existing opinion thatthe salinity tolerance range within 0 to 50 psu char -acterizes euryhaline amphyosmotic osmoregulatorsthat originated from freshwater environments (Khle-bovich & Aladin 2010). Copepods from the FamiliesPseudodiaptomidae (C. aquaedulcis) and Diaptomi-dae (A. salinus) should be considered to be of marineorigin and represent different stages of adaptation tofresh water environments (Grindley 1984).
Confusingly, Calanipeda aquaedulcis (the specificepithet means ‘fresh water’) withstood higher in -creases in salinity and acclimated more easily tohigher salinities than Arctodiaptomus salinus (thespecific epithet means ‘salty’). Again, despite the factthat the majority of researchers rank C. aquaedulcisamong marine species and A. salinus among fresh-water species, we could not locate any literaturerecord on findings of the former species in the opensea (only in estuarine areas), or on findings of the latter species in freshwater habitats, to support theabove rankings. Moreover, both species can be foundin nature within similar ranges of salinity, albeit indifferent habitats. Thus, the specific epithets thatwere derived from past descriptions of the copepodspecies without knowing the peculiarities of theirecological patterns can be rather confusing and mayrequire adjustment (Boero 2011).
In this paper we have also demonstrated that thedirect observations on changes in copepod body den-sity following changes in water salinity allow us toresolve the question of whether a species is an osmo-conformer or an osmoregulator. We have alsodemonstrated that it is possible to determine cope-pod body density by measuring the velocity of pas-sive sinking of anesthetized animals. Such a method-ological approach circumvents the effects derivedfrom using a method that involves copepod vol-ume−weight characteristics. In the supplement wepresent the equations and recalculate our previousdata for the determination of body volumes andhydrodynamic characteristics of copepods requiredfor the calculation of their body mass density. Inorder to apply these formulae to numerous copepod
species without taking into consideration their spe-cies specifics, the formulae were unified to the basiccopepod body proportions and space orientation dur-ing passive sinking.
Acknowledgements. This work was partially supported bythe project PERSEUS (FP7-287600). We thank G. S. Minyukand T. V. Rauen for help in the maintenance of the phyto-plankton cultures used for feeding the copepods, and L. O.Aganesova for supplying the initial copepod cultures. Weare grateful to the anonymous reviewers for their numeroushelpful comments and suggestions.
LITERATURE CITED
Aladin NV, Plotnikov IS (2008) Modern fauna of residualwater bodies formed on the place of the former Aral Sea.Proc Zool Inst Russ Acad Sci 312:145−154 (In Russianwith an English abstract)
Aleyev YG, Khvorov SA (1985) Buoyancy as the functionof live forms of hydrobionts. Hydrobiol J 21: 24−28 (inRussian)
Alfonso G, Belmonte G (2011) Calanoida (Crustacea: Cope-poda) from the inland waters of Apulia (south-easternItaly). J Limnol 70: 57−68
Anraku M (1964) Influence of the Cape Cod Canal on thehydrography and on the copepods in Buzzards Bayand Cape Cod Bay, Massachusetts. II. Respiration andfeeding. Limnol Oceanogr 9: 195−206
Battaglia B, Bryan GW (1964) Some aspects of ionic andosmotic regulation in Tisbe (Copepoda, Harpacticoida)in relation to polymorphism and geographical distribu-tion. J Mar Biol Assoc UK 44: 17−31
Beyrend-Dur G, Souissi S, Devreker D, Winkler G, HwangJS (2009) Life cycle traits of two transatlantic populationsof Eurytemora affinis (Copepoda: Calanoida): salinityeffects. J Plankton Res 31: 713−728
Boero F (2011) What is behind a species’ name? Ital J Zool78: 409
Brucet S, Boix D, López-Flores R, Badosa A, Quintana XD(2006) Size and species diversity of zooplankton commu-nities in fluctuating Mediterranean salt marshes. EstuarCoast Shelf Sci 67: 424−432
Calliari D, Andersen CM, Thor P, Gorokhova E, Tiselius P(2006) Salinity modulates the energy balance and repro-ductive success of co-occurring copepods Acartia tonsaand A. clausi in different ways. Mar Ecol Prog Ser 312: 177−188
Cervetto G, Gaudy R, Pagano M (1999) Influence of salinityon the distribution of Acartia tonsa (Copepoda, Cala -noida). J Exp Mar Biol Ecol 239: 33−45
Chen Q, Sheng J, Lin Q, Gao Y, Lv J (2006) Effect of salinityon reproduction and survival of the copepod Pseudo -diaptomus annandalei Sewell, 1919. Aquaculture 258: 575−582
Chu D, Wiebe PH (2005) Measurements of sound-speed anddensity contrasts of zooplankton in Antarctic waters.ICES J Mar Sci 62: 818−831
Comin F, Alonso M (1988) Spanish salt lakes: their chemistryand biota. Hydrobiologia 158: 237−245
Devreker D, Souissi S, Molinero JC, Nkubito F (2008) Trade-offs of the copepod Eurytemora affinis in mega-tidalestuaries: insights from high frequency sampling in the
27A
utho
r cop
y
Mar Ecol Prog Ser 470: 15–29, 2012
Seine estuary. J Plankton Res 30: 1329−1342Ermolaeva NI (2010) Characteristics of distribution of zoo-
plankton in the lakes with different mineralization ofBarabinsko-Kulundinskoi lake province (the south ofWestern Siberia). Ecology of aquatic invertebrates.Materials of the International Conference devoted to FDMordukhai-Boltovskoi Centenary. Institute of InlandWater Biology of the Russian Academy of Sciences,Borok, p 90−92 (in Russian)
Finney CM (1979) Salinity stress in harpacticoid copepods.Estuaries 2: 132−135
Ganning B (1971) Studies on the chemical, physical, andbiological conditions in Swedish rockpool ecosystems.Ophelia 9: 51−105
Garber BN (1951) Observation on development and repro-duction of Calanipeda aquaedulcis Kritsch (Copepods,Calanoida). Proc Karadag Biol Stn 11: 3−55 (in Russian)
Gnaiger E, Forstner H (eds) (1983) Polarographic oxygensensors. Aquatic and physiological applications. Springer,Berlin
Goolish EM, Burton RS (1989) Energetics of osmoregulationin an intertidal copepod: effects of anoxia and lipidreserves on the pattern of free amino acid accumulation.Funct Ecol 3: 81−89
Greenlaw CF (1977) Backscattering spectra of preservedzooplankton. J Acoust Soc Am 62: 44−52
Greenlaw CF, Johnson RK (1982) Physical and acousticalproperties of zooplankton. J Acoust Soc Am 72: 1706−1710
Grindley JR (1984) The zoogeography of the Pseudodiapto-midae. Crustac Suppl 7: 217−228
Gross F, Raymont JEG (1942) The specific gravity of Calanusfinmarchicus. Proc R Soc Edinb 61B: 288−296
Guerrero F, Jimenez-Melero R, Parra G, de la Torre MDL,Melguizo M (2007) Lipid composition of Arctodiaptomussalinus (Copepoda: Calanoida). J Freshw Ecol 22: 147−150
Gyllenberg G, Lundqvist G (1978) Oxygen consumption ofEurytemora hirundoides nauplii and adults as a functionof salinity. Ann Zool Fenn 15: 328−330
Happel J, Brenner H (1965) Low Reynolds number hydro -dynamics. Prentice-Hall, Englewood Cliffs, NJ
Hopper AF (1960) The resistance of marine zooplankton ofthe Caribbean and South Atlantic to changes in salinity.Limnol Oceanogr 5: 43−47
Hubareva ES, Svetlichny LS, Kideys AE, Isinibilir M (2008)Fate of the Black Sea Acartia clausi and Acartia tonsa(Copepoda) penetrating into the Marmara Sea throughthe Bosphorus. Estuar Coast Shelf Sci 76: 131−140
Ikeda T, Hirakava K, Kajihara N (1990) Some characteristicsof a coldwater copepod Calanus cristatus from regions ofthe Japan Sea covered by Tsushima Warm Current. BullJpn Sea Natl Fish Res Inst 40: 51−65
Ikeda T, Kanno Y, Ozaki K, Shinada A (2001) Metabolicrates of epipelagic marine copepods as a function of bodymass and temperature. Mar Biol 139: 587−596
Ikeda T, Sano F, Yamaguchi A (2004) Metabolism and bodycomposition of a copepod (Neocalanus cristatus: Crus-tacea) from the bathypelagic zone of the Oyashio region,western subarctic Pacific. Mar Biol 145: 1181−1190
Ikeda T, Atsushi Y, Takashi M (2006) Chemical compositionand energy content of deep-sea calanoid copepods inthe Western North Pacific Ocean. Deep-Sea Res I 53: 791−1809
Ishikawa A, Sychei B, Shiga N (1999) Effects of salinity onsurvival, and embryonic and postembryonic developmentof Eurytemora affinis from a freshwater lake. Plankton
Biol Ecol 46: 113−119Isla JA, Perissinotto R (2004) Effects of temperature, salinity
and sex on the basal metabolic rate of the estuarine cope-pod Pseudodiaptomus hessei. J Plankton Res 26: 579−583
Jiménez-Melero R, Parra G, Souissi S, Guerrero F (2007)Post-embryonic developmental plasticity of Arctodiapto-mus salinus (Copepoda: Calanoida) at different tempera-tures. J Plankton Res 29: 553−567
Khlebovich VV (1981) Acclimation of animals. Nauka, Lenin -grad (in Russian)
Khlebovich VV, Aladin NV (2010) Salinity factor in animallife. Herald of the Russian Academy of Sciences 80: 299–304
Knutsen T, Melle W, Calise L (2001) Determining the massdensity of marine copepods and their eggs with a criti-cal focus on some of the previously used methods.J Plankton Res 23: 859−873
Køgeler JW, Falk-Petersen S, Kristensen Å, Pettersen F,Dalen J (1987) Density- and sound speed contrast in sub-Arctic zooplankton. Polar Biol 7: 231−235
Kovalev AV, Mazzocchi MG, Kideys AE, Skryabin VA (2006)Neritization of the plankton fauna in the Mediterraneanbasin. Mar Ecol J 1: 5−15 (In Russian with an Englishabstract)
Lance J (1963) The salinity tolerance of some estuarineplanktonic copepods. Limnol Oceanogr 8: 440−449
Lance J (1965) Respiration and osmotic behaviour of thecopepod Acartia tonsa in diluted sea water. CompBiochem Physiol 14: 155−165
Lee CE, Petersen CH (2003) Effects of developmental accli-mation on adult salinity tolerance in the freshwater-invading copepod Eurytemora affinis. Physiol BiochemZool 76: 296−301
Lee CE, Remfert JL, Chang YM (2007) Response to selectionand evolvability of invasive populations. Genetica 129: 179−192
Lowndes AG (1942) The displacement method of weighingliving aquatic organisms. J Mar Biol Assoc UK 25: 555−574
Marrone F, Castelli G, Barone R, Naselli-Flores L (2006)Ecology and distribution of calanoid copepods in Sicilianinland waters (Italy). Verh Int Ver Limnol 29: 2150−2156
Marshall SM, Orr AP (1972) The biology of a marine cope-pod. Springer-Verlag, New York, NY
Matsukura R, Yasuma H, Murase H, Yonezaki S, FunamotoT, Honda S, Miyashita K (2009) Measurements of densitycontrast and sound-speed contrast for target strengthestimation of Neocalanus copepods (Neocalanus crista-tus and Neocalanus plumchrus) in the North PacificOcean. Fish Sci 75: 1377−1387
Mauchline J (1998) The biology of calanoid copepods. In: Blaxter JHS, Southward AJ, Tyler PA (eds) Advances inmarine biology, Vol 33. Academic Press, San Diego, CA
McAllen R, Taylor A (2001) The effect of salinity changeon the oxygen consumption and swimming activity ofthe high-shore rockpool copepod Tigriopus brevicornis.J Exp Mar Biol Ecol 263: 227−240
McAllen R, Taylor AC, Davenport J (1998) Osmotic andbody density response in the harpacticoid copepod Tigri-opus brevicornis in supralittoral rockpools. J Mar BiolAssoc UK 78: 1143−1153
Newrkla P (1978) The influence of ionic concentration onpopulation parameters, development time, activity, andrespiration rate of Arctodiaptomus spinosus (Daday)(Calanoida, Copepoda). Oecologia 33: 87−99
Parra G, Jiménez-Melero R, Guerrero F (2005) Agricultural
28A
utho
r cop
y
Svetlichny et al.: Exceptionally euryhaline calanoid copepods
impacts on Mediterranean wetlands: the effect of pesti-cides on survival and hatching rates in copepods. AnnLimnol 41: 161−167
Potts WTW (1954) The energetics of osmoregulation inbrackish and freshwater animals. J Exp Biol 31: 618−630
Ramdani M, Elkhiati N, Flower RJ, Birks HH, Kraïem MM,Fathi AA, Patrick ST (2001) Open water zooplanktoncommunities in North African wetland lakes: the CAS-SARINA Project. Aquat Ecol 35: 319−333
Ranta E (1982) Animal communities in rock pools. Ann ZoolFenn 19: 337−347
Roddie BD, Leakey RJG, Berry AJ (1984) Salinity-tempera-ture tolerance and osmoregulation in Eurytemora affinis(Poppe) (Copepoda: Calanoida) in relation to its distribu-tion in the zooplankton of the upper reaches of the Forthestuary. J Exp Mar Biol Ecol 79: 191−211
Rokneddine A, Chentoufi M (2004) Study of salinity andtemperature tolerance limits regarding four crustaceanspecies in a temporary salt water swamp (Lake Zima,Morocco). Anim Biol 54: 237−253
Sartoris FJ, Thomas DN, Cornils A, Schnack-Schiela SB(2010) Buoyancy and diapause in Antarctic copepods: the role of ammonium accumulation. Limnol Oceanogr55: 1860−1864
Seuront L (2006) Effect of salinity on the swimming be -haviour of the estuarine calanoid copepod Eurytemoraaffinis. J Plankton Res 28: 805−813
Shadrin NV, Batogova EA, Kopeyka AV (2008) Arctodiapto-mus salinus (Daday, 1885) (Copepoda, Diaptomidae),rare species in the northwestern Black Sea was found asa common one in the Crimea coastal zone. Mar Ecol J 7: 86 (in Russian)
Stepanov VN, Svetlichny LS (1981) The studies on hydro -mechanical characteristics of planktonic copepods. Nau -kova Dumka, Kiev (in Russian)
Svetlichny LS (1981) Body density of planktonic copepods.Ecology of marine organisms. Proceedings of the UnionScientific Technical Conference, Kiev, p 12−24 (in Russian)
Svetlichny LS (1983a) Calculation of the biomass of plank-tonic copepods using the coefficients of proportionalitybetween volume and linear dimensions of the body. EcolMorya 15: 46−58 (In Russian with an English abstract)
Svetlichny LS (1983b) Hydrodynamic resistance of motion-less copepods during their passive sinking in water.Oceanology 23: 104−108
Svetlichny LS, Hubareva ES (2005) The energetics ofCalanus euxinus: locomotion, filtration of food and specific dynamic action. J Plankton Res 27: 671−682
Svetlichny LS, Hubareva ES, Arashkevich EG (1998) Physi-ological and behavioural response to hypoxia in activeand diapausing copepodites Stage V Calanus euxinus.Arch Hydrobiol Spec Issues Advanc Limnol 52: 507−519
Svetlichny LS, Hubareva ES, Isinibilir M, Kideys AE, Bel-monte G, Giangrande E (2010) Salinity tolerance ofCalanus euxinus in the Black and Marmara Seas. MarEcol Prog Ser 404: 127−138
Tang KW, Fenn TD, Visscher PT, Dam HG (2000) Regulationof body dimethylsulfoniopropionate (DMSP) content bythe copepod Temora longicornis: a test of four mecha-nisms. Mar Biol 136: 749−757
Tolomeev AP, Sushchik NN, Gulati RD, Makhutova ON,Kalacheva GS, Zotina TA (2010) Feeding spectra of Arctodiaptomus salinus (Calanoida, Copepoda) usingfatty acid trophic markers in seston food in two salt lakesin South Siberia (Khakasia, Russia). Aquat Ecol 44: 513−530
Ventura M, Catalan J (2005) Reproduction as one of themain causes of temporal variability in the elemental com-position of zooplankton. Limnol Oceanogr 50: 2043−2056
Visser AW, Jonasdottir SH (1999) Lipids, buoyancy and theseasonal vertical migration of Calanus finmarchicus. FishOceanogr 8: 100−106
Wang G, Jiang X, Wu L, Li S (2005) Differences in the den-sity, sinking rate and biochemical composition of Cen-tropages tenuiremis (Copepoda: Calanoida) subitaneousand diapause eggs. Mar Ecol Prog Ser 288: 165−171
29
Editorial responsibility: Anna Pasternak, Moscow, Russian Federation
Submitted: December 14, 2011; Accepted: June 26, 2012Proofs received from author(s): November 28, 2012
Aut
hor c
opy
Copyright © 2022 FDOKUMEN

