


Bahasa
Halaman
Hukum


Remote Sens. 2014, 6, 2408-2434; doi:10.3390/rs6032408OPEN ACCESS
remote sensingISSN 2072-4292
www.mdpi.com/journal/remotesensing
Article
Local Vegetation Trends in the Sahel of Mali and SenegalUsing Long Time Series FAPAR Satellite Products and FieldMeasurement (1982–2010)Martin Brandt 1,*, Aleixandre Verger 2,4, Abdoul Aziz Diouf 3, Frederic Baret 4
and Cyrus Samimi 1,5
1 Institute of Geography, University of Bayreuth, D-95440 Bayreuth , Germany;E-Mail: [email protected]
2 CREAF, Cerdanyola del Valles, E-08193 Catalonia, Spain; E-Mail: [email protected] Centre de Suivi Ecologique, Dakar-Fann BP 13532, Senegal; E-Mail: [email protected] INRA-EMMAH, UMR 1114, Site Agroparc, F-84914 Avignon, France;
E-Mail: [email protected] BayCEER, University of Bayreuth, D-95440 Bayreuth, Germany
* Author to whom correspondence should be addressed; E-Mail: martin [email protected];Tel: +49-1769-8269-998.
Received: 17 January 2014; in revised form: 27 February 2014 / Accepted: 3 March 2014 /Published: 19 March 2014
Abstract: Local vegetation trends in the Sahel of Mali and Senegal from Geoland Version 1(GEOV1) (5 km) and the third generation Global Inventory Modeling and Mapping Studies(GIMMS3g) (8 km) Fraction of Absorbed Photosynthetically Active Radiation (FAPAR)time series are studied over 29 years. For validation and interpretation of observed greennesstrends, two methods are applied: (1) a qualitative approach using in-depth knowledge ofthe study areas and (2) a quantitative approach by time series of biomass observations andrainfall data. Significant greening trends from 1982 to 2010 are consistently observed in bothGEOV1 and GIMMS3g FAPAR datasets. Annual rainfall increased significantly during theobserved time period, explaining large parts of FAPAR variations at a regional scale. Locally,GEOV1 data reveals a heterogeneous pattern of vegetation change, which is confirmed bylong-term ground data and site visits. The spatial variability in the observed vegetation trendsin the Sahel area are mainly caused by varying tree- and land-cover, which are controlled byhuman impact, soil and drought resilience. A large proportion of the positive trends arecaused by the increment in leaf biomass of woody species that has almost doubled since the1980s due to a tree cover regeneration after a dry-period. This confirms the re-greening of the

Remote Sens. 2014, 6 2409
Sahel, however, degradation is also present and sometimes obscured by greening. GEOV1as compared to GIMMS3g made it possible to better characterize the spatial pattern of trendsand identify the degraded areas in the study region.
Keywords: land degradation; greening; drought; Sahel; FAPAR time series; GIMMS3g;Geoland; biomass observations; Senegal; Mali
1. Introduction
The West African Sahel is an area that has experienced recent climatic and environmental changes(e.g., [1,2]). After severe droughts in the 1970s and 1980s, large areas were branded as degraded land(e.g., [3]). However, satellite time series starting in 1981 revealed a significant greening trend, whichcan only be partly explained by increasing rainfall [4]. Thus, a new re-greening debate largely replacedthe previous degradation paradigm (e.g., [5,6]), although evidence of actual greening and increasing treedensities does not always correlate with greening trends derived from satellite time series [7]. Recently,Brandt et al. [8] and Herrmann & Tappan [7] highlighted how diverse processes on a local scale canbe, and that a positive vegetation trend does not necessarily mean an environmental improvement, as aremarkable species impoverishment was detected in both studies.
Time series analyses based on moderate and coarse resolution satellite data are widely used formonitoring vegetation. In regions with high intra- and inter-seasonal vegetation dynamics, mainlycaused by rainfall variability, traditional change detection methods fail to succeed, making continuousdata over a long time period irreplaceable. Remote sensing products have been tested against eachother and found to be highly consistent for the entire Sahel [9,10]. Recent studies are scaled fromglobal [11] to local [7] dimensions. Short term trends at a moderate scale (250 m–1 km) are studiedwith SPOT VEGETATION (VGT) (starting 1998) and Moderate Resolution Imaging Spectroradiometer(MODIS) (starting 2000) [12,13]. In Africa, continuous moderate resolution data of years prior to 1998are only regionally available at 1.1 km from LAC (Local Area Coverage) AVHRR (Advanced Very HighResolution Radiometer) receiving stations [14–16]. However, poor quality, difficulties in data processingand availability hampers the use in the West African Sahel. Alternatively, the Normalized DifferenceVegetation Index (NDVI) Global Inventory Modeling and Mapping Studies (GIMMS) time series startingin the year 1981 with 8 km spatial resolution derived from the AVHRR global GAC (Global AreaCoverage) dataset [17] has been widely used for long-term trends [4,18–20]. The latest version, termedthe third generation GIMMS3g dataset has been recently produced for the period July 1981 to December2011 with AVHRR sensor data from NOAA (National Oceanic and Atmospheric Administration)7–18 satellites with an improved calibration. In addition to the NDVI, Fraction of AbsorbedPhotosynthetically Active Radiation (FAPAR) and Leaf Area Index (LAI) products have been derivedfrom GIMMS3g dataset to provide quantitative information of the state of earth’s vegetation at 8 kmresolution and 15-day intervals [21]. The recently delivered Geoland Version 1 (GEOV1) time series ofFAPAR, LAI and Fraction of Vegetation Cover (FCOVER) based on AVHRR LTDR (Long Term DataRecord) dataset combined with SPOT VGT offer a spatial resolution of approximately 5 km for the period

Remote Sens. 2014, 6 2410
1981–1998 and 1 km from 1999 to present [22,23]. Although the main problem of these long-term timeseries is their very coarse resolution, merging heterogeneous processes and characteristics on the groundinto one single pixel, the higher spatial resolution of the GEOV1 dataset as compared to GIMMS3g maycontribute to improve local trend analysis. In the Sahel, long term vegetation trend studies using GEOV1have not been conducted so far. GIMMS3g is mostly used at a global scale [24–26] and studies are rarelylocated in the Sahel [9,27].
Ground-truthing of vegetation trends in the Sahel can be extremely difficult, as landscapes and humanactivities are not uniform and even if the region is well known, (1) the actual causes of trends remainunclear and (2) degradation or greening can be obscured or neutralized by mixed spectral informationfrom changes of adjacent objects. So far, ground-truthing has rarely been linked to long-term trendstudies in the Sahel. Only few studies go beyond hypothetical interpretations of the trends. Herrmann &Tappan [7] use botanic inventory sites over 27 years, while Brandt et al. [8] present an interdisciplinaryand descriptive approach. Begue et al. [18] related greening trends to land-cover changes, finding somecorrelations in the Sahel. Dardel et al. [9] compared long-term field observations with GIMMS3g NDVIdata, finding a good consistency of positive vegetation trends in Mali (R2 = 0.59) and negative trends inNiger (R2 = 0.38).
This study uses FAPAR time series instead of NDVI. FAPAR is defined as the fraction of radiationabsorbed by the canopy in the 400–700 nm spectral domain under specified illumination conditions [28].It is directly related to the photosynthesis and it is used as an input in light use efficiency models. Therelationship between NDVI and FAPAR has been found to be linear for green vegetation, particularly inthe semi-arid environment of the Sahel. A number of satellite-related (including atmospheric effects andview-sun angle geometry) and canopy-related (including leaf angle distribution, canopy heterogeneity,brown elements and soil color) factors are found to influence the parameters of this linear relation whichis site-specific and often only valid when calibrated for a given soil type [13]. Compared with NDVI,the FAPAR satellite products mitigate the impact of soil background for low vegetated canopies and thesaturation effects for high vegetation amount [29].
The purpose of this study is to assess local vegetation trends in the Sahel of Mali and Senegal inthe period 1982–2010 by combining long-term FAPAR satellite datasets with ground based data. Thepotential of GEOV1 and GIMMS3g time series for trend detection is assessed and validated with biomassobservations, rainfall data and site visits. This study is designed to better understand the processesresponsible for satellite derived trends and, thus, to shed more light on the re-greening debate of theSahel area.
2. Materials and Methods
Our study uses coarse scale GEOV1 and GIMMS3g FAPAR satellite time series to examine localvegetation trend patterns in two Sahelian study areas. Validation and interpretation of the spatial patternand magnitude of observed vegetation trends is based on two methodologies: (1) a qualitative approachusing in-depth knowledge of the regions and (2) a quantitative approach through the comparison withbiomass field measurements and rainfall data.
Remote Sens. 2014, 6 2411
2.1. Study Areas
The study areas are located in the Sahel of Mali and Senegal, an area with evidence of significantenvironmental changes over the studied time period. Greening and degradation have both been observedin the study areas, offering a heterogeneous pattern of vegetation change [2,8,30,31]. Human impact,morpho-pedology as well as rainfall variability have shaped a diversified landscape. Six test sites withoppositional land-cover trends were chosen for further analysis (MALdeg, MALpos, C3L5, C2L5, C2L4,Ldeg, shown in Table 1 and illustrated in Figure 1). The two study areas and the location of the six testsites are shown in Figure 2.
Table 1. Location and site characteristics for the Sahelian test sites presented in this study.
Sites Location Coordinates (Long./Lat.) Site Characteristics
MALdeg Mali, DogonPlateau
−3.8738 14.4276 Tree-, shrub savanna, degraded bushland,crops, ferruginous, shallow soils
MALpos Mali, DogonPlateau
−3.5312 14.3253 Tree-, shrub savanna, cropping and onionplantations line the valleys, dams andirrigation structures
C3L5 Senegal,ferruginous Ferlo
−14.5815 15.2463 Shrub-, tree savanna, dense bushland, ferruginous,spots of bare soil, shallow soils, pasture
C2L5 Senegal,southern sandyFerlo
−15.2032 15.2309 Tree-, shrub savanna, sandy, intersected byclayey depressions, pasture and small scale cropping
C2L4 Senegal.northern Ferlo
−15.2857 15.6035 Open tree-, shrub savanna, sandy, pasture andsmall scale cropping, fallow fields
Ldeg Senegal,ferruginousFerlo
−14.9444 15.4718 Tree-, shrub savanna, ferruginous, laterite,shallow soils, degraded, intersected withwoody depressions
2.1.1. Bandiagara (Sahel of Mali)
In Mali, the focus is on the Dogon Plateau around Bandiagara, east of Mopti. Around 10% of therocky and ferruginous plateau are not suitable for agriculture, while most of the remaining portion is usedfor rainfed cropping by Dogon farmers and livestock herding by Fulani pastoralists. In the past 50 years,droughts and human expansion have caused a considerable loss of natural woody vegetation, resultingin degraded land and an increase of cultivated areas [31]. Prevailing woody species are Balanitesaegyptiaca, Combretum glutinosum, Guiera senegalensis, and especially on fields Faidherbia albida.The plateau is represented by two case study sites (see Figure 1, [32] and Table 1): large portions ofthe area around MALdeg are highly degraded with exposed laterite and only scattered spots of grass andwoody vegetation remaining (Figure 1a). On the contrary, MALpos represents an area with large scaleonion plantations and fertile fields (Figure 1b), surrounded by a dense shrubby vegetation on rocks.
Remote Sens. 2014, 6 2412
Figure 1. Study sites in Mali (a,b) and Senegal (c–f); illustrated by RapidEye images [32](bands 532, December 2010) and photos, taken in December 2011 ( a,b); March 2012 (d) andSeptember 2012 (c,e,f). Site (a) is located on the lateritic Dogon Plateau with small spots ofbushland left, visible as red spots in RapidEye. Degradation (dark color) fills up most parts ofthe image. Onion plantations (bright red) are present at (b) and stay green into the dry seasondue to irrigation. The rocky surroundings are covered by Combretum micranthum shrubs.Site (c) illustrates the ferruginous Ferlo with a dense shrubby vegetation dominated byPterocarpus lucens, Guiera senegalensis and Boscia senegalensis but also unvegetated spots;(d) represents the southern sandy Ferlo, intersected by forested depressions. Sclerocaryabirrea and Balanites aegyptiaca are seen on the dry season photo; Site (e) is located in thenorthern sandy Ferlo with an open tree and shrub savanna. Small Combretum glutinosumand Balanites aegyptiaca, severely cut by humans can be seen on the photo; Site (f) revealsdifferent details in different resolutions: while the GIMMS pixel (blue grid) mixes thedegraded area with peanut-fields further north, the GEOV1 (red grid) pixel captures thelargely degraded area.
(a) MALdeg (b) MALpos
(c) C3L5 (d) C2L5 (e) C2L4 (f) Ldeg

Remote Sens. 2014, 6 2413
Figure 2. Accumulated FAPAR for mean rainy season (August-October) of GEOV1 FAPAR(left) and GIMMS3g FAPAR (right) from 1982 to 2010. Banidgara (a,b) and Linguere(c,d) regions both show a good agreement between the two datasets with more details inGEOV1. Sandy areas can be distinguished from lateritic sections (Dogon Plateau in Maliand ferruginous Ferlo in Senegal). In Mali, the Bandiagara escarpment separates the DogonPlateau from the Seno Plain around Bankass. All rasters were interpolated to a spatialresolution of 1 km by a bicubic interpolation method for a better visual inspection andinterpretation. No quantitative information is lost nor added by applying this method.
- 15.6° - 15.2° - 14.8° - 14.4°
C2L4
C3L5
C2L5
LinguèreLdeg
14.8°
15.2°
15.6°
- 15.6° - 15.2° - 14.8° - 14.4°
C2L4
C3L5
C2L5
LinguèreLdeg
- 4° - 3.8° - 3.6°
14°
14.2°
14.4°
- 4° - 3.8° - 3.6°
Fiko
MALdeg
BandiagaraMALpos
Bankass
Fiko
MALdeg
BandiagaraMALpos
Bankass
(c) GEOV1 (d) GIMMS3g
(b) GIMMS3g(a) GEOV1
20 km
20 km
0.3 0.5 0.7 1
0.4 0.8 1.2 1.5
Seno Plain
Dogon Plateau Dogon Plateau
Seno Plain
Sandy Ferlo Ferruginous Ferlo
Sandy Ferlo Ferruginous Ferlo
Escarpment
Escarpment
Int. mean FAPAR (Aug-Oct)
Int. mean FAPAR (Aug-Oct)
South-east of the Bandiagara escarpment, the Seno Plain represents a different morphological zone(Figure 2). In the absence of rocks and laterite, Dogon and Fulani farmers cultivate almost 90% of itsdeep sandy soils. In 1967, about 40% were still covered by dense bushland, which was cleared due tohuman expansion and the need for cropping land [31].
Remote Sens. 2014, 6 2414
2.1.2. Linguere (Sahel of Senegal)
The Ferlo region around the Senegalese city Linguere forms our second study area. The ferruginouspart lies east of Linguere and was severely affected by droughts in the 1970s and 1980s with a remarkablereduction of tree density [2]. Especially in the past 10 years, the vegetation has been recovering withincreasing rainfall, but deforestation and degradation are also apparent, mainly along ancient valleys andin proximity to wells and villages [8]. The region has shallow and unfertile soils with laterite exposedat many sites. It belongs to the silvo-pastoral zone and therefore agriculture and settlements are rarein the whole area, which is used by Fulani herders for livestock grazing. Much of the dense bushlandhas never been cleared and woody vegetation is a shrub and tree savanna with Pterocarpus lucens,Guiera senegalensis and Boscia senegalensis prevailing. Test sites C3L5 and Ldeg both lie within thisarea, representing oppositional stages of degradation. While C3L5 consists of a relatively dense woodyvegetation (Figure 1c), Ldeg is seriously degraded (Figure 1f). As most of the trees were felled or diedduring droughts, soil erosion caused a loss of upper soil and remaining vegetation can only be found insmall clayey depressions.
The sandy Ferlo west, south and north of Linguere is infrequently used for cropping and stronglyinfluenced by human activities. It consists of sandy fossil dune soils, of which approximately 15% arecultivated by Wolof farmers. Most of the bushland has been cleared in the 20th century and the currentwoody vegetation is an open tree and shrub savanna dominated by Balanites aegyptiaca, Acacia raddianaand Combretum glutinosum. Drought resilience of these species growing on sandy soils is good, thusoverall tree mortality was moderate during the dry period (1970s–1990s). Test sites C2L5 and C2L4 areboth situated within this area. South of Linguere, C2L5 represents the southern part of the sandy Ferlo,which is dissected with clayey and forested depressions and mainly used for pasture purposes and smallscale cropping (Figure 1c, Table 1). C2L4 is located north of Linguere. Parts of the region used to becultivated but recently lie fallow due to a lack of rain. Trees and shrubs in this area are severely affectedby human impact (Figure 1d, Table 1).
2.2. FAPAR Time Series
Global GEOV1 FAPAR time series derived from AVHRR LTDR (1981–2000) and from VGT(1999-present) data have been recently delivered within the Geoland2 project. Products are freelyavailable at 10-day time intervals and approximately 5 km (1 km) for AVHRR (VGT). The GEOV1VGT FAPAR product is based on a combination of already existing products to take advantage of theirspecific performances while limiting the situations where products show deficiencies. In line with thepublished literature on products validation, the MODIS and CYCLOPES [28] products are selected sincethey provide higher level of consistency [33]. The selected products are combined and eventually scaledto compute the fused product that is expected to provide the best performances globally. Neural networksare then calibrated to relate the fused products to the corresponding VGT L3a top of canopy directionallynormalized reflectances [34]. The GEOV1 AVHRR algorithm aims to ensure robustness and consistencyof the derived FAPAR product with GEOV1 VGT. The approach is based on the use of neural networksto mimic the GEOV1 VGT product using AVHRR LTDR reflectances and dedicated temporal smoothing

Remote Sens. 2014, 6 2415
and gap filing techniques to improve the consistency and continuity of the derived time series. Furtherinformation are available in Baret et al. [22] and Verger et al. [23].
Similarly as in GEOV1, the principles used for the generation of GIMMS3g FAPAR are based onthe use of neural networks to mimic an existing product, in this case, the MODIS FAPAR [21,34]. Aneural network algorithm is first trained using both the NDVI GIMMS3g and MODIS FAPAR productsover the overlapping period 2000–2009. The trained neural network algorithm is then applied usingthe land-cover class, pixel-center latitude, pixel-center longitude, and NDVI3g as inputs to generatetime series of FAPAR from July 1981 to December 2011 at 15-day temporal steps and 1/12 degree(about 8 km) spatial resolution over the globe. For further information, we refer to Zhu et al. [21].
For this study, monthly MVCs (Maximum Value Composites) were produced for both FAPARdatasets to derive temporally identical time series and to further eliminate contamination by clouds andatmospheric disturbances. With the assumption that exceptional low values are contaminated, the highestvalue of each month was selected. Figure 2 presents the accumulated GEOV1 FAPAR and GIMMS3gFAPAR over the period 1982 to 2010 for the mean rainy season (August-October) in the Bandiagara andLinguere regions. Here, the spatial pattern and range of values for both products show a good agreementfor both study areas. Ferruginous zones (Dogon Plateau in Mali and ferruginous Ferlo in Senegal, seeFigure 2) can be distinguished from sandy zones, which are more productive and thus have a higherFAPAR. GEOV1 reveals more details and illustrates more spatial heterogeneity within these zones.
2.3. Time Series Analysis
Prior to the trend analysis, a pixel-wise Durbin-Watson test was carried out, which revealed significantautocorrelation in the monthly time series of both FAPAR datasets (values between 0.5 and 0.8(p ≤ 0.05)). Therefore, in order to correct for autocorrelation and to filter out remaining noise, weapplied a Seasonal Trend decomposition based on Loess (STL) to the monthly MVCs [35]. Here, a localregression was used to decompose a times series into seasonal, yearly and noise components. For everypixel and each year, the yearly component was extracted and further processed. Using the de-noisedyearly component has the additional advantage that singular seasonal effects are not overestimated andadds focus on the evergreen woody layer [36]. This produces trends that are more significant and detectssubtle gradual changes. A linear regression was applied for each pixel to the preprocessed datasets withthe yearly components for the period 1982–2010. The slope of the yearly components was derived toquantify the direction and magnitude of the overall trend. Slope values were recalculated to FAPARunits by multiplication with the number of years to express the total change over time. Only pixels witha confidence level of 95% (p ≤ 0.05) were further processed.
For reasons of comparability and to avoid unit inconsistencies, annual anomalies in percent werecalculated for rainfall, integrated FAPAR and biomass data for the period 1987 to 2010 by dividingeach individual year through the long-term mean. Here, annually integrated FAPAR is used instead ofdecomposed components to obtain comparable results with previous studies [37].
Remote Sens. 2014, 6 2416
2.4. Validation and Interpretation Data and Methods
2.4.1. Qualitative Information
Fieldwork was conducted during the dry seasons 2011 and 2012 (February–April) and the rainyseason 2012 (September, October). In close collaboration with local scholars, several natural scientistsvisited the two study areas and collected qualitative and quantitative information on woody coverageand species composition [38], soil erosion and degradation processes [39] as well as impact of humansand livestock on soil and vegetation. In addition, several social scientists conducted interviews in nearbyvillages to gather information on people’s perception on the local climate, environment in general, woodycover and species, crop yields and capacities of pasture. Local people were questioned regarding recentconditions as well as environmental change over the past 30 and 50 years. Within the present study,this qualitative information strengthened the knowledge about the study areas and offered explanationson the causative factors for vegetation trends. More details on interview techniques and the appliedfield-methods can be found in Brandt et al. [8].
2.4.2. Quantitative Information
Biomass Observations
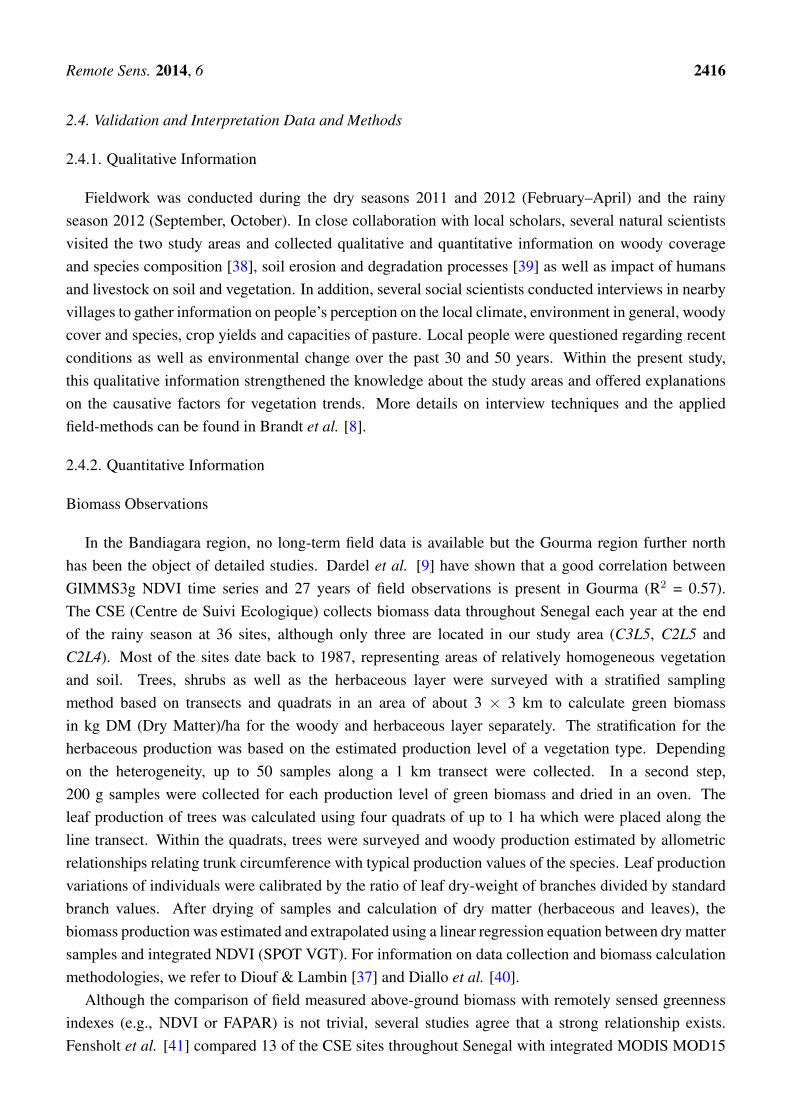
In the Bandiagara region, no long-term field data is available but the Gourma region further northhas been the object of detailed studies. Dardel et al. [9] have shown that a good correlation betweenGIMMS3g NDVI time series and 27 years of field observations is present in Gourma (R2 = 0.57).The CSE (Centre de Suivi Ecologique) collects biomass data throughout Senegal each year at the endof the rainy season at 36 sites, although only three are located in our study area (C3L5, C2L5 andC2L4). Most of the sites date back to 1987, representing areas of relatively homogeneous vegetationand soil. Trees, shrubs as well as the herbaceous layer were surveyed with a stratified samplingmethod based on transects and quadrats in an area of about 3 × 3 km to calculate green biomassin kg DM (Dry Matter)/ha for the woody and herbaceous layer separately. The stratification for theherbaceous production was based on the estimated production level of a vegetation type. Dependingon the heterogeneity, up to 50 samples along a 1 km transect were collected. In a second step,200 g samples were collected for each production level of green biomass and dried in an oven. Theleaf production of trees was calculated using four quadrats of up to 1 ha which were placed along theline transect. Within the quadrats, trees were surveyed and woody production estimated by allometricrelationships relating trunk circumference with typical production values of the species. Leaf productionvariations of individuals were calibrated by the ratio of leaf dry-weight of branches divided by standardbranch values. After drying of samples and calculation of dry matter (herbaceous and leaves), thebiomass production was estimated and extrapolated using a linear regression equation between dry mattersamples and integrated NDVI (SPOT VGT). For information on data collection and biomass calculationmethodologies, we refer to Diouf & Lambin [37] and Diallo et al. [40].
Although the comparison of field measured above-ground biomass with remotely sensed greennessindexes (e.g., NDVI or FAPAR) is not trivial, several studies agree that a strong relationship exists.Fensholt et al. [41] compared 13 of the CSE sites throughout Senegal with integrated MODIS MOD15

Remote Sens. 2014, 6 2417
FAPAR for the year 2001, finding a good consistency (R2 = 0.72). Diouf & Lambin [37] correlatedintegrated NDVI from a local AVHRR receiving station with 12 CSE biomass monitoring sites between1987 and 1997. They conclude that a strong relationship exists (R2 = 0.68 in average), however, withlarge inter-annual variations, making NDVI a reasonable but not a robust proxy for biomass estimationin the Senegalese Sahel. Mbow et al. [42] discovered that species composition has a significant effect onthe relationship between NDVI and biomass at a test site near Dahra, west of Linguere. The spatial unitsize differences between ground sample areas and AVHRR pixels constitutes another source of error. Thescope of this study is not a 1:1 comparison but to find investigate if (1) the direction; (2) the magnitudeand (3) spatial discrepancies of long-term FAPAR trends correspond with ground data.
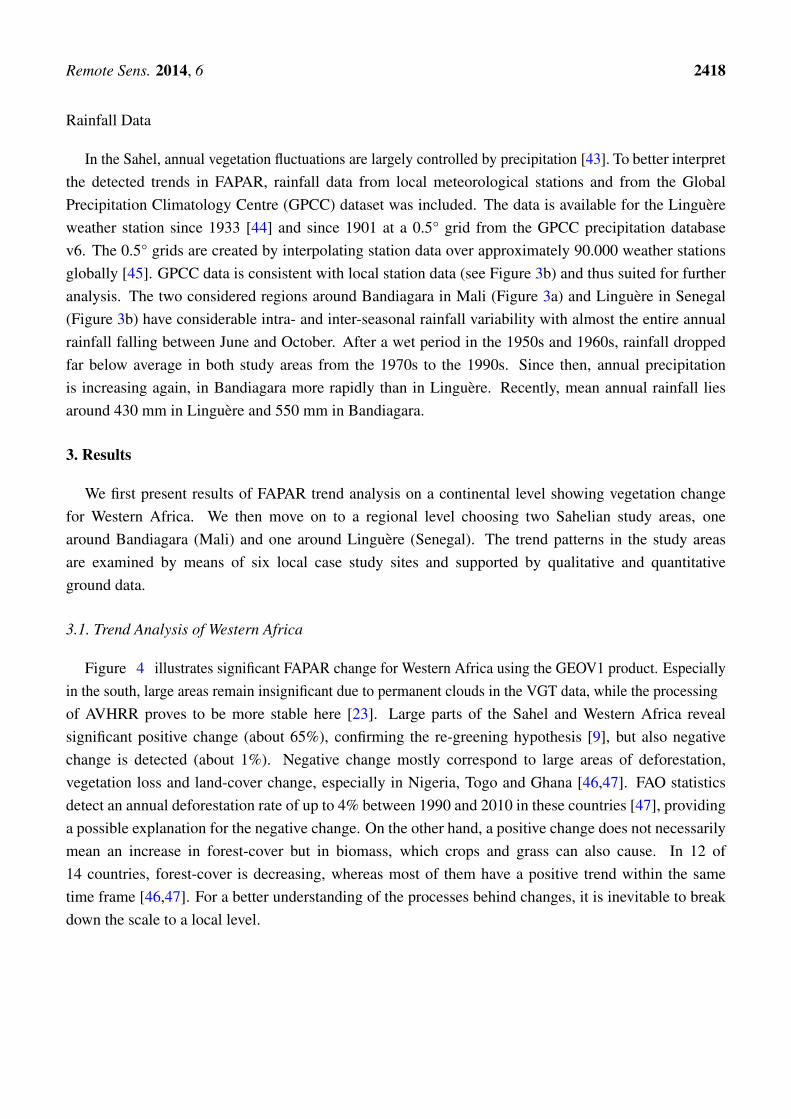
Figure 3. GPCC annual rainfall anomalies in percent for the period 1940–2010 averagedover the study areas of (a) Mali and (b) Senegal. Linguere weather-station data is includedin (b), indicating that gridded GPCC data corresponds well with ground-measured stationdata (grey columns). Note the extraordinary dry period in the 1970s and 1980s. Data afterSchneider et al. [45].
1940 1960 1980 2000
80
40
0
-40
Ano
mal
y %
(a)
80
40
0
-40
-80
Ano
mal
y %
1940 1960 1980 2000
(b)
Remote Sens. 2014, 6 2418
Rainfall Data
In the Sahel, annual vegetation fluctuations are largely controlled by precipitation [43]. To better interpretthe detected trends in FAPAR, rainfall data from local meteorological stations and from the GlobalPrecipitation Climatology Centre (GPCC) dataset was included. The data is available for the Linguereweather station since 1933 [44] and since 1901 at a 0.5° grid from the GPCC precipitation databasev6. The 0.5° grids are created by interpolating station data over approximately 90.000 weather stationsglobally [45]. GPCC data is consistent with local station data (see Figure 3b) and thus suited for furtheranalysis. The two considered regions around Bandiagara in Mali (Figure 3a) and Linguere in Senegal(Figure 3b) have considerable intra- and inter-seasonal rainfall variability with almost the entire annualrainfall falling between June and October. After a wet period in the 1950s and 1960s, rainfall droppedfar below average in both study areas from the 1970s to the 1990s. Since then, annual precipitationis increasing again, in Bandiagara more rapidly than in Linguere. Recently, mean annual rainfall liesaround 430 mm in Linguere and 550 mm in Bandiagara.
3. Results
We first present results of FAPAR trend analysis on a continental level showing vegetation changefor Western Africa. We then move on to a regional level choosing two Sahelian study areas, onearound Bandiagara (Mali) and one around Linguere (Senegal). The trend patterns in the study areasare examined by means of six local case study sites and supported by qualitative and quantitativeground data.
3.1. Trend Analysis of Western Africa
Figure 4 illustrates significant FAPAR change for Western Africa using the GEOV1 product. Especiallyin the south, large areas remain insignificant due to permanent clouds in the VGT data, while the processingof AVHRR proves to be more stable here [23]. Large parts of the Sahel and Western Africa revealsignificant positive change (about 65%), confirming the re-greening hypothesis [9], but also negativechange is detected (about 1%). Negative change mostly correspond to large areas of deforestation,vegetation loss and land-cover change, especially in Nigeria, Togo and Ghana [46,47]. FAO statisticsdetect an annual deforestation rate of up to 4% between 1990 and 2010 in these countries [47], providinga possible explanation for the negative change. On the other hand, a positive change does not necessarilymean an increase in forest-cover but in biomass, which crops and grass can also cause. In 12 of14 countries, forest-cover is decreasing, whereas most of them have a positive trend within the sametime frame [46,47]. For a better understanding of the processes behind changes, it is inevitable to breakdown the scale to a local level.

Remote Sens. 2014, 6 2419
Figure 4. GEOV1 FAPAR change map of Western Africa (1982–2010). The map shows theslope of a linear regression with monthly MVCs multiplied by their number. Study areas arelocated around Linguere and Bandiagara.
0 200 400 km
−20 −15 −10 −5 0 5
4
8
12
16
20
Dakar
A t
l a n
t i c
O
c e
a n
G u l f o f G u i n e a
Niger
Linguère
Bamako
Bandiagara
-0.3 0 0.15 0.3 not significant (95%)
3.2. Local Trend Patterns
3.2.1. Bandiagara (Sahel of Mali)
Corresponding to increasing rainfall (Figure 3a), the Malian study area has a general positivegreenness trend with major spatial discrepancies seen in Figure 5a,b. The magnitude and spatialdistribution of changes differ between the two FAPAR data products. However, both GIMMS3gand GEOV1 FAPAR agree that (1) stronger positive areas are present on the Dogon Plateau aroundBandiagara (Figure 5a,b); and (2) neutral or slightly positive trends indicating less productive areas arelocated in a large area south of Fiko (marked with MALdeg in Figure 5a,b). Around MALdeg, most partsof the formerly dense tiger-bush were cleared by human expansions and the need for cropping land in the1960s but abandoned few decades later becoming bush-fallows again [30]. Beyond the currently activefields, bush-fallows are used for tree cutting with and without permits. This increased in times of droughtand little rainfall, as selling trees is an established compensation for harvest losses. In combinationwith droughts, dry periods, floods and large livestock numbers, MALdeg has turned into a desert-likevast-land (see Figure 1a), which is recognized in the trend maps but spatially overestimated in GIMMS3g
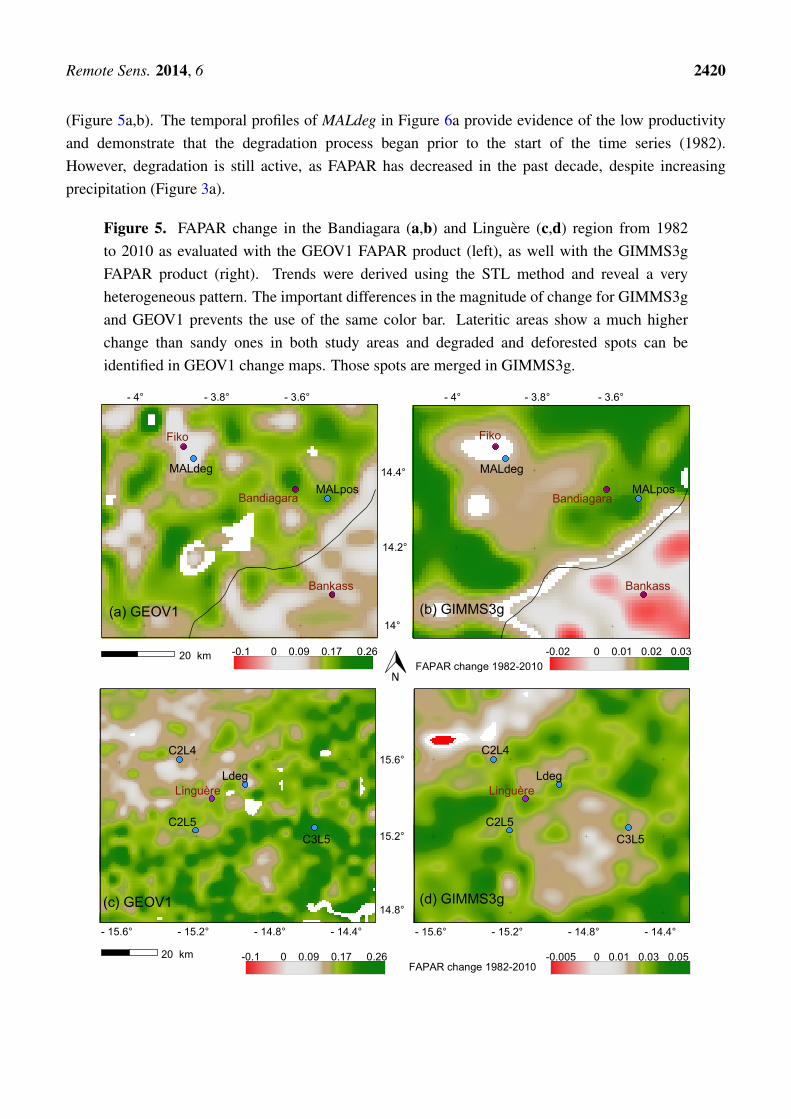
Remote Sens. 2014, 6 2420
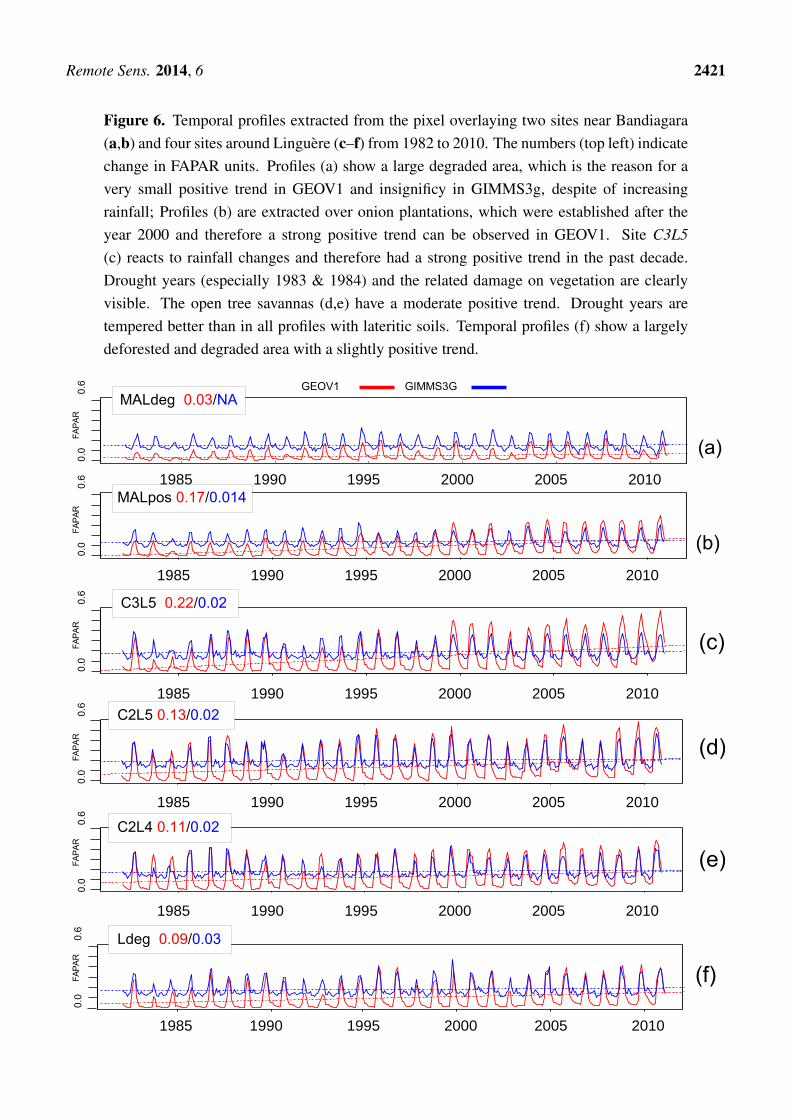
(Figure 5a,b). The temporal profiles of MALdeg in Figure 6a provide evidence of the low productivityand demonstrate that the degradation process began prior to the start of the time series (1982).However, degradation is still active, as FAPAR has decreased in the past decade, despite increasingprecipitation (Figure 3a).
Figure 5. FAPAR change in the Bandiagara (a,b) and Linguere (c,d) region from 1982to 2010 as evaluated with the GEOV1 FAPAR product (left), as well with the GIMMS3gFAPAR product (right). Trends were derived using the STL method and reveal a veryheterogeneous pattern. The important differences in the magnitude of change for GIMMS3gand GEOV1 prevents the use of the same color bar. Lateritic areas show a much higherchange than sandy ones in both study areas and degraded and deforested spots can beidentified in GEOV1 change maps. Those spots are merged in GIMMS3g.
- 15.6° - 15.2° - 14.8° - 14.4°
C2L4
C3L5
C2L5
LinguèreLdeg
14.8°
15.2°
15.6°
- 15.6° - 15.2° - 14.8° - 14.4°
C2L4
C3L5
C2L5
LinguèreLdeg
- 4° - 3.8° - 3.6°
14°
14.2°
14.4°
- 4° - 3.8° - 3.6°
Fiko
MALdeg
BandiagaraMALpos
Bankass
Fiko
MALdeg
BandiagaraMALpos
Bankass
(c) GEOV1 (d) GIMMS3g
(b) GIMMS3g(a) GEOV1
20 km
20 km
-0.1 0 0.09 0.17 0.26 -0.02 0 0.01 0.02 0.03
-0.005 0 0.01 0.03 0.05-0.1 0 0.09 0.17 0.26FAPAR change 1982-2010
FAPAR change 1982-2010
Remote Sens. 2014, 6 2421
Figure 6. Temporal profiles extracted from the pixel overlaying two sites near Bandiagara(a,b) and four sites around Linguere (c–f) from 1982 to 2010. The numbers (top left) indicatechange in FAPAR units. Profiles (a) show a large degraded area, which is the reason for avery small positive trend in GEOV1 and insignificy in GIMMS3g, despite of increasingrainfall; Profiles (b) are extracted over onion plantations, which were established after theyear 2000 and therefore a strong positive trend can be observed in GEOV1. Site C3L5(c) reacts to rainfall changes and therefore had a strong positive trend in the past decade.Drought years (especially 1983 & 1984) and the related damage on vegetation are clearlyvisible. The open tree savannas (d,e) have a moderate positive trend. Drought years aretempered better than in all profiles with lateritic soils. Temporal profiles (f) show a largelydeforested and degraded area with a slightly positive trend.
1985 1990 1995 2000 2005 2010
(f)
(d)
1985 1990 1995 2000 2005 2010
0.0
0
.6
C3L5 0.22/0.02
0.0
0.
6
Ldeg 0.09/0.03
1985 1990 1995 2000 2005 2010
0.0
0
.60.
0
0.6
1985 1990 1995 2000 2005 2010
(e)
(c)
C2L5 0.13/0.02
C2L4 0.11/0.02
FA
PA
RF
AP
AR
FA
PA
RF
AP
AR
1985 1990 1995 2000 2005 2010
1985 1990 1995 2000 2005 2010
(b)
(a)
GEOV1 GIMMS3G
0.0
0
.6F
AP
AR
0.0
0
.6F
AP
AR
MALdeg 0.03/NA
MALpos 0.17/0.014
Remote Sens. 2014, 6 2422
As an example of positive change on the plateau, an area east of Bandiagara was chosen. Onionplantations were established around MALpos after the year 2000 (see Figures 1b and 6b). Thesefields stay green long into the dry season due to irrigation. Cultivation activities in combination withdrought-regeneration of semi-natural bushland, agro-forestry on fields, reforestation and tree protectionlaws, strongly influence the overlaying FAPAR pixels causing positive changes and prevailing greeningareas on the entire Dogon Plateau. However, a share of almost 10% are deforested and seriouslydegraded [31], not following the greening trend. GEOV1 (Figure 4a) reveals more spatial discrepanciesand details than GIMMS3g FAPAR, showing a variety of adjacent degraded and greening areas northeastof the escarpment (Figure 5a). According to the prevailing trend, those heterogeneous areas are mergedin GIMMS3g to large areas of greening, irrespective of the degradation (Figure 5b).
On the Seno Plain around Bankass, droughts caused less damage to the woody vegetation on deepsandy soils as compared to the rocky plateau around Bandiagara. Nevertheless, human expansion andimpact has been much greater. Thus, natural regeneration and greening is generally lower in the SenoPlain as observed in Figure 5a,b. However, trends of GIMMS3g and GEOV1 FAPAR show differentdirections of change with a slightly positive trend in GEOV1 and a negative trend in GIMMS3g data. Asmost clearing of the dense bushland ended prior to the start of the time series, a positive trend is expectedhere as supported by several studies reporting large scale plantings, regeneration after droughts and anoverall increase of tree cover in the last decade [8,31,48].
3.2.2. Linguere (Sahel of Senegal)
Depending on soil, morphology, land-cover, human impact and drought resilience, areas reactdifferently to rainfall changes, causing different magnitudes of trends (see Figure 5c,d). As rainfallis increasing over the past years (see Figure 3b), negative trends are almost not observed in both timeseries products. Clear differences in changes between the lateritic eastern and the sandy western areasexist. Droughts and dry years in the 1980s but also 1990s caused considerable damage to trees andshrubs on shallow lateritic soils in the east, visible in the temporal profiles of Figure 6c,f. The sandysoils in the west have a larger water storage capacity helping to temper the effects of droughts [2]. Thiscan also be seen in the profiles of Figure 6d,e. Regeneration and therefore trends are thus much higheron lateritic soils (Figure 5c,d).
Despite the overall regeneration, the GIMMS3g FAPAR trend map shows that areas of less positivetrends exist in the eastern region (see Figure 5d). GEOV1 FAPAR has a clearer spatial pattern thanGIMMS3g, better differentiating between deforested and densely vegetated zones east of Linguere(Figure 5c). Thus the spatial pattern between the GIMMS3g and GEOV1 products is similar, but stillcritical disagreements are found at local scale.
Two oppositional test sites were chosen, one with an obvious positive woody vegetation trend (C3L5),and one with a large share of degraded land (Ldeg). The temporal profiles in Figure 6f confirm thatsince 1982 the trend at Ldeg is slightly positive due to small forested depressions which react toincreasing rainfall. The monitored area is small (around 5 × 5 km) and surrounded by dense bushlandin the east and peanut fields in the north and west. The RapidEye image in Figure 1f shows thatan 8 km grid is incapable of capturing this area correctly. In a pixel of 8 km spatial resolution thedegraded area is mixed with adjacent land cover which explains the positive pattern around Ldeg in

Remote Sens. 2014, 6 2423
Figure 5d (GIMMS3g). Site visits showed that site Ldeg is an example for a degraded area wherewoody coverage is now only found in small clayey depressions. In the year 1965 the area was stillcovered by dense bushland [8] but nowadays most of the shallow soil is washed away and woody andherbaceous vegetation is very scarce here (see Figure 1f). Along with the unfavorable morphopedologicalcharacteristics and the proximity to several larger villages (e.g., Kol Kol, Kadji, Dodji), excessivebrowsing, cutting of living trees and livestock grazing are responsible for this development.
On the contrary, C3L5 has a positive trend (Figure 6c), caused by a denser woody vegetation.GIMMS3g does not capture this area correctly, as it is merged with a degraded area south of Barkedji,which is spatially overestimated in GIMMS3g. Information gathered in interviews confirm that treemortality was high during the droughts in the 1980s and 1990s, also seen in Figure 6c. Additionally, theproximity to the national road makes this site vulnerable to the exploitation of woody products and thusthis site was reported as degraded with a massive reduction in tree cover in the 1990s [37]. However,temporal profiles in Figure 6c and site visits (Figure 1c) reveal a dense woody vegetation and positivetrend for the past decade.
3.3. Validation and Interpretation of Trends by Ground Observations
3.3.1. Validation and Interpretation by Biomass Data
CSE biomass data at C3L5 provides evidence of increasing leaf biomass between 1987 and 2010(see Figure 7a) and thus proves that the GEOV1 trend (Figure 5c) and temporal profile (Figure 6c)are realistic. Inter-annual variability is very high, but after low values in the 1990s, leaf productionis increasing rapidly (see Table 2), especially in the past decade, and corresponds well with integratedGEOV1 FAPAR (Figure 7a and Table 2). This phenomenon can not only be observed at the ferruginoustest site C3L5 but also at the sandy sites C2L5 (Figure 7b) and C2L4 (Figure 7c) with significant leafbiomass increases. Again, this can be confirmed by GEOV1 FAPAR with similar increases at C2L5and C2L4 (Table 2). Since leaf biomass of woody species has almost doubled at our test sites, this is aclear sign of regeneration after an extraordinary dry period and its related consequences, beginning inthe 1970s until the late 1990s (see Figure 7 and Table 2).
In contrast to the steep positive trend of the woody layer, a significant trend cannot be detectedregarding the herbaceous biomass at all three test sites (see Figure 7a–c). Instead, major inter-annualfluctuations are observed, with a negative tendency at all three sites (see Table 2). This is obscured bythe woody layer, which causes an overall positive trend. This is particularly true for C3L5, with a strongpositive trend in total biomass and FAPAR, but an insignificant negative trend in herbaceous biomass,in spite of increasing rainfall (see Figure 7a and Table 2). This is explained by soil erosion causedby water and livestock, leading to a spreading of bare soil at this site. Currently, it only affects theherbaceous layer. This phenomenon is hidden in our time series by a dense woody canopy cover and isan example for erosion and degradation obscured by greening. At the sandy test sites C2L5 and C2L4, thenegative trends in herbaceous biomass are mainly caused by extraordinary high values at the end of the1980s (Figure 7b,c). Those herbaceous biomass peaks often occur after drought years and are caused by(1) the absence of livestock after severe drought years and the subsequent accumulation of biomass;

Remote Sens. 2014, 6 2424
(2) fertilization by dead-wood and (3) accumulation of seeds. Moreover, a change in the herbaceousspecies composition could be responsible for inter-annual biomass fluctuations [42].
Figure 7. Anomalies of CSE biomass at monitoring sites C3L5 (a); C2L5 (b) and C2L4(c) and integrated GEOV1 FAPAR from 1987 to 2010. Note that biomass data is not availablefor each year. The plots give evidence of important conclusions: (1) large inter-annualdiscrepancies between biomass and FAPAR are not an exception; (2) the leaf biomass showsa strongly positive trend at all three sites and thus supports the FAPAR trend. Most leafbiomass and FAPAR anomalies before 2000 are negative, whereas they are mostly positiveafter 2000. This is an obvious sign for drought recovery; (3) No clear trends can be observedconcerning the herbaceous biomass. Rather degradation is observed, especially at C3L5, asit does not increase with rainfall.
1986 1991 1996 2001 2006 2011
(a)C3L5
(b)C2L5
herbaceous biomass leaf biomass int. GEOV1 FAPAR
1986 1991 1996 2001 2006 2011
1986 1991 1996 2001 2006 2011
0
50
100
-50
-100
0
50
100
-50
-100
0
50
100
-50
Ano
mal
y %
Ano
ma
ly %
Ano
ma
ly %
-100
(c)C2L4

Remote Sens. 2014, 6 2425
Table 2. The first four rows show vegetation change derived from linear regression for sitesaround Linguere (Senegal) for the period 1987–2010. ** = significant at 95%; * = significantat 90% confidence level. Units are FAPAR and DM kg/ha. The change is calculated as theslope of annual values and multiplied by the number of years. It is further divided by thelong-term mean to derive change in percent, shown in brackets. Note that a relationshipbetween GEOV1 FAPAR and biomass trends is present and that FAPAR change increaseswith mean leaf biomass present.
C3L5 C2L5 C2L4 Ldeg
GEOV1 FAPAR change +0.22 [104%] ** +0.12 [55%] ** +0.11 [38%] ** +0.09 [8%] **GIMMS3g FAPAR change +0.011 [7%] +0.012 [3%] +0.012 [4%] ** +0.017 [10%] *total biomass change +1025 [59%] * +149 [10%] +140 [13%]leaf biomass change +1172 [93%] ** +462 [101%] ** +174 [78%] *herb. biomass change −147 [−30%] −313 [−28%] −34 [−4%]mean leaf biomass 1254 457 222mean herb. biomass 485 1085 865
By correlating integrated FAPAR with the total biomass for the monitoring sites C3L5, C2L5 andC2L4, a highly significant relationship (p ≤ 0.01) for both FAPAR products (Figure 8) is obtained.For these sites, GEOV1 proves to be somewhat more reliable (Figure 8a; R2 = 0.34) than GIMMS3g(Figure 8b; R2 = 0.19). However, even if a relationship between both FAPAR products and above-groundbiomass observations is given, neither GEOV1 nor GIMMS3g prove to be robust proxies for biomassestimation in this area.
Figure 8. Scatterplots between ground based biomass (sites C3L5, C2L5, C2L4) andGEOV1(a)/GIMMS3g (b) pixel values obtained over the monitoring sites from 1987 to 2010.The relationships are not strong, but highly significant (p ≤ 0.01). Inter-annual discrepanciesbetween observed biomass and satellite derived FAPAR are high, thus neither GEOV1 norGIMMS3g FAPAR are robust proxies for biomass estimation.
-50 0 50biomass anomaly in %
GE
OV
1 F
AP
AR
ano
mal
y in
%
500
-50
y= 0.04 + 0.59x R²=0.34; n=47
-50 0 50biomass anomaly in %
GIM
MS
3g
FA
PA
R a
nom
aly
in %
500
-50
y= 4.26 + 0.14x R²=0.19; n=47
(a) (b)
Remote Sens. 2014, 6 2426
3.3.2. Validation and Interpretation by Rainfall Data
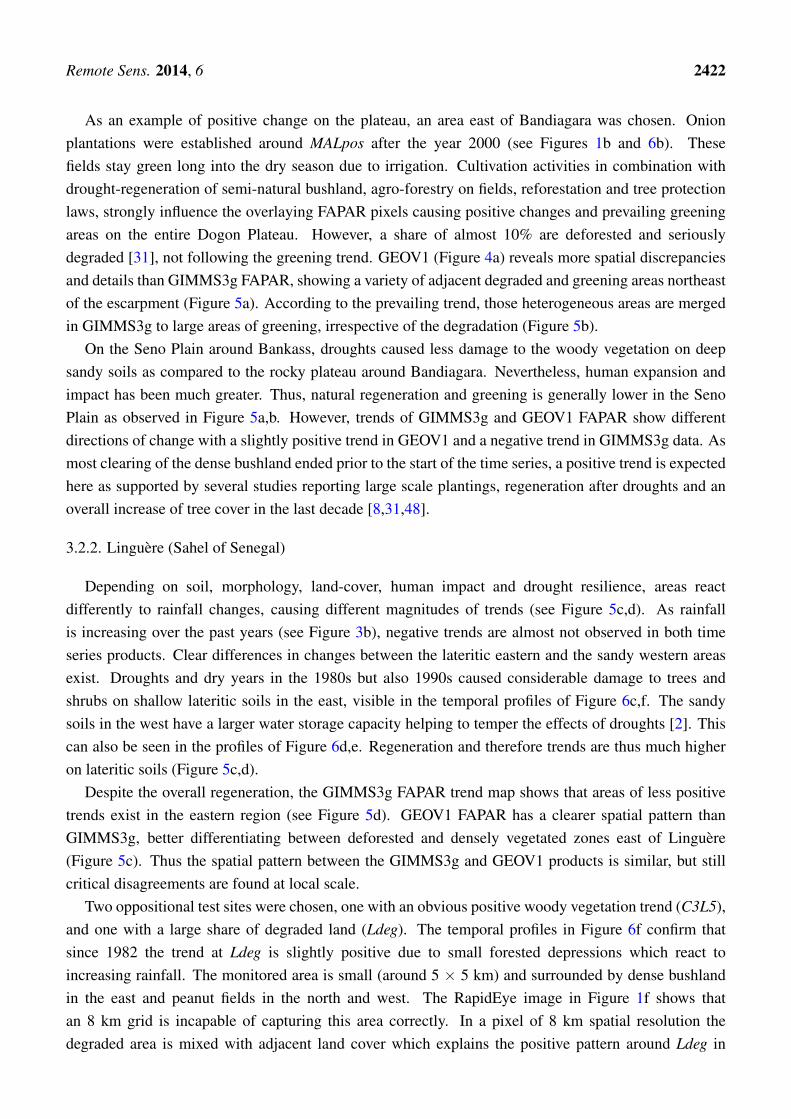
In the period 1982–2010, rainfall around Bandiagara shows a considerable increase which issignificant at the 99% confidence level (+281 mm; 54%; p ≤ 0.01). According to Figure 9a,b,a relationship between annual rainfall and annual FAPAR exists over the entire Malian study area,explaining 58% (GEOV1) and 30% (GIMMS3g) of the variability. This is confirmed by the secondstudy area around Linguere, where rainfall increased by +142 mm (34%; p ≤ 0.1) over the sametime period with 38% (GEOV1) and 48% (GIMMS3g) of annual FAPAR anomalies being explainedby annual rainfall fluctuations (Figure 9c,d respectively). These numbers give evidence that at regionalscale precipitation explains much of the FAPAR variations.
Figure 9. Scatterplots showing relationships between annual rainfall (GPCC) and annualFAPAR anomalies averaged over the study areas around Bandiagara (a,b) and Linguere (c,d)for the period 1982–2010 (29 years).
y= −6.08e−15 + 1.31x:R²=0.58; n=29
y= 2.29e−16 + 0.10x;R²=0.3; n=29
y=−1.53e−16 + 2.13x;R²=0.48; n=29
y=−0.04 + 0.98x;R²=0.38; n=29
GE
OV
1 F
AP
AR
an
omal
y in
%G
EO
V1
FA
PA
R a
nom
aly
in %
GPCC rainfall anomaly in % GPCC rainfall anomaly in %
GPCC rainfall anomaly in %GPCC rainfall anomaly in %
GIM
MS
3g
FA
PA
R a
nom
aly
in %
GIM
MS
3g F
AP
AR
ano
ma
ly in
%
-50 0 50 -50 0 50
-50 0 50-50 0 50 -50 0 50
500
-50
500
-50
500
-50
500
-50
(b)(a)
(c) (d)
Remote Sens. 2014, 6 2427
Correlating yearly CSE biomass vs. annual precipitation anomalies (1987–2010) verifies that rainfallis a causative factor for local vegetation change and variations (R2 = 0.22; p ≤ 0.01) at the sites C3L5,C2L5 and C2L4. Exactly the same result is obtained when correlating integrated GEOV1 FAPARpixel values from the same sites against annual precipitation (R2 = 0.22; p ≤ 0.01), confirming theweak but highly significant relation. The weak correlation can be partly explained by local rainfallvariations and the distance to the weather station. Moreover, Diouf & Lambin [37] state that locallythe response to rainfall is controlled by soil type, terrain, presence of plant seeds, variations in rain-useefficiency, species composition, the intra-annual distribution of rainfall as well as land-use practices.If the three biomass monitoring sites are averaged, the correlation is much stronger (R2 = 0.55;p ≤ 0.01).
4. Discussion
The spatial pattern of trend analysis of GEOV1 and GIMMS3g FAPAR shows significantdiscrepancies in our Sahelian study areas. Initially it is not clear if trends realistically reflect patternson the ground or are caused/accentuated by sensor-, processing- or scale issues. A combination of gooddata-sources, ground-truthing and local knowledge of the area are important factors that facilitate a soundinterpretation and explanation of satellite derived trend maps.
Annual rainfall has significantly increased over the studied time period in both study areas, followingthe overall upward trend of Sahelian rainfall [49,50]. At a regional scale, this explains large parts of theobserved positive vegetation trends [43] in the entire Sahel [9,27]. However, at a local scale, numerousvariations exist, forming a heterogeneous pattern of vegetation trends [8]. A higher resolution clearlyimproves the capability to assess these discrepancies.
Our results show that the spatial pattern seen in satellite trend maps show regional differences thatcan partly be explained by soil and land-cover differences [9,51]. The sandy Seno Plain in Mali canbe distinguished from the rocky Dogon Plateau. The same applies for the ferrugieous and the sandyFerlo in Senegal (see Figure 5). Considering our Senegalese case studies, most of the positive trendsare caused by leaf biomass, which has almost doubled at the three monitoring sites (C3L5, C2L5 andC2L4) since 1987. Local trend variations, i.e., areas of non-change or only weak change, are mostlycaused by deforested and degraded areas. The droughts in the 1970s and 1980s caused considerableharm to trees. Additionally, people increasingly cut living trees in times of droughts as an alternativesource for income and fodder. Trees and shrubs on sandy soils withstood the stress much better thanthose on shallow lateritic soils [2]. Although recovery of trees and shrubs from droughts is obvious inthe biomass observations in Figure 9, Brandt et al. [8] state that strict laws, farmer managed protection,reforestation programs and the dispersion of robust species (especially Balanites aegyptiaca and Acaciaraddiana) contribute to a large scale greening and increase in leaf biomass in both study areas in Maliand Senegal.
Our examples further demonstrate that both greening and degradation are present at a local scale inthe West African Sahel, supporting the findings of Dardel et al. [9], Spiekermann [30], Nutini et al. [52]and Martinez et al. [12]. Neither greening nor desertification can be generalized. Our study detecteddegraded areas not following the greening trend, which is invoked by rainfall increases. However, neither

Remote Sens. 2014, 6 2428
is degradation irreversible, nor is greening an always positive phenomenon. In Mali, farmers wereobserved using traditional methods like stonewalls or holes with manure to recapture degraded soilsnear Fiko. Tree planting programs and farmer managed agro-forestry were observed all over the studyareas in Mali and Senegal, confirming reports by Allen [48] and Reij et al. [53]. In addition, greening canmask degradation, as in both regions a remarkable species impoverishment was detected despite positivewoody vegetation trends [8], a fact that coincides with other Sahelian studies [7,54]. In addition, areasseriously affected by soil erosion and spreading of bare soils can be concealed behind a greening trendcaused by the woody layer (see C3L5).
The moderate correlation and major inter-annual discrepancies between biomass and satellite derivedgreenness data (Figures 7 and 8) confirm the findings of Diouf & Lambin [37] and Diallo et al. [40].As this study uses only three monitoring sites, the obtained relationships are weaker (see Figure 8a,b).Furthermore, the spatial resolution is much coarser (about 5 km compared to 1.1 km). However, thebiomass data at the observed sites gives clear evidence that the direction, the spatial discrepancies aswell as the magnitude of FAPAR trend maps are largely realistic in this area. It further shows that woodyvegetation is the main driver of positive FAPAR trends seen in Figure 5.
Although the two data products show good spatial consistency at an annual and regional scale (seeFigure 2), the local pattern and magnitude of trends strongly differs. Degrading GEOV1 to 8 kmresolution (results not shown for brevity) reduces the details but keeps the spatial pattern with apparentdifferences to GIMMS3g trend maps. Both datasets are created by sampled 1.1 km AVHRR data whichare resampled to a 8 km (5 km) grid cell by selecting subsets, while omitting other subsets [13]. The wholeprocessing line of the FAPAR data causes significant variations and the choice of the dataset may havesignificant effects on the results [33,55–57]. In GEOV1 FAPAR data, the values of the VGT period aresometimes higher in densely vegetated areas than the AVHRR period, causing trends to be overestimated.On the contrary, trends in GIMMS3g FAPAR are too weak and significantly underestimated. The baselevels of GIMMS3g FAPAR are much higher than those of GEOV1 FAPAR. Our comparison with grounddata showed that the reality lies in between the two products, but closer to GEOV1. These differences inthe processing line may influence the magnitude of trend analysis and bias the significance test, but thespatial pattern of GEOV1 trends shows agreement with ground observations (Table 3).
Table 3. This table presents significant (p ≤ 0.01) changes (see Table 2 for methodology)for the period 1987–2010. ++50%–105%, +10%–50%, o <10%.
Sites GEOV1 GIMMS3g Leaf Biomass Observations Rainfall
MALdeg o not significant NA active degradation ++MALpos ++ o NA new plantations ++
C3L5 ++ not significant ++ drought recovery +C2L5 ++ not significant ++ drought recovery +C2L4 + o ++ drought recovery +Ldeg o + NA degradation +
Remote Sens. 2014, 6 2429
5. Conclusions
This study focused on the local vegetation trends in drylands of Western Africa (Sahel of Maliand Senegal) over the 1982–2010 period. Two long-term satellite datasets of Fraction of AbsorbedPhotosynthetically Active Radiation (FAPAR) derived from Advanced Very High Resolution Radiometer(AVHRR) data were considered: Geoland Version 1 (GEOV1) and the third generation GlobalInventory Modeling and Mapping Studies (GIMMS3g). Biomass ground measurements and rainfall datasupported a quantitative validation of detected trends in satellite products. Auxiliary information andexpert knowledge of the study areas allowed a qualitative validation and interpretation of the localobserved trends.
Our results show that the choice of the dataset has significant impact on the results. The study seems toindicate that, compared to GIMMS3g, the spatial pattern of GEOV1 trends show a better agreement withground data, rainfall pattern, land-cover, land management of the two study areas in the Sahel of Maliand Senegal. The differences in the processing lines (input reflectances and retrieval algorithms) seemto play a role in the observed differences rather beside the differences in their spatial resolution. Notehowever that our conclusions on the accuracy of GEOV1 and GIMMS3g time series for trend detectionanalysis are limited to the study areas. An extensive validation and comparison of both datasets at globalscale should be addressed in a forthcoming study. This study shows the potential of GEOV1 for localtrend detection. However, some inconsistencies have been detected in the GEOV1 dataset and are beingto be corrected. Correction will be achieved through a second version of Geoland Version 2 (GEOV2)products from VEGETATION (VGT) and AVHRR sensors which is expected to contribute to globalclimate monitoring and earth science modelling applications.
The inter-annual correlation between FAPAR and annual rainfall is significant over the study areas,explaining around 50% of the variability in vegetation changes. Spatial discrepancies are mainly causedby land- and tree-cover, which are controlled by soil, human and drought resilience. As precipitation inthe Sahel was very low when the time series started in 1982 and gradually increased, a positive greeningtrend is mostly observed in the study area. However, deforested and degraded areas clearly stand outin GEOV1 trend maps while they are hardly visible in GIMMS3g. The positive trends of the threecase study sites in Senegal (C3L5, C2L5 and C2L4) are caused by the woody layer recovering fromdroughts/dry periods and its consequences.
These local patterns have shown that both greening and degradation are present in the Sahel of Maliand Senegal, but also greening can hide degradation. Neither the re-greening nor the desertificationparadigm can be generalized as both are present at a local level.
Acknowledgments
The authors thank the colleagues from the CSE, especially Moussa Sall for a great collaborationand for collecting and sharing biomass data for such a long time period. The research is part of theBMBF funded project micle, which aims to find linkages between climate, environment and migration.We would like to thank all the guides, drivers and translators in the field (mainly Mohammed Lecorand Yaya Koetioumbe) as well as the project colleagues, especially Clemens Romankiewicz, RaphaelSpiekermann and Tobias Grau. Further thank goes to Z. Zhu for providing GIMMS3g data, Geoland2
Remote Sens. 2014, 6 2430
for GEOV1 data and the DLR/RESA for RapidEye imagery. Aleixandre Verger is recipient of a Juande la Cierva postdoctoral fellowship from the Spanish Ministry of Science and Innovation. The authorsthank the anonymous referees for significantly improving the manuscript. This publication was fundedby the German Research Foundation (DFG) and the University of Bayreuth in the funding programmeOpen Access Publishing.
Author Contributions
The conception of the research approach and development of the methods was done by M. Brandt,A. Verger and C. Samimi. The data was collected and prepared by A. Diouf (CSE), F. Baret, A. Verger(both Geoland2) and M. Brandt. The research was conducted by M. Brandt. Analysis and interpretationwas done by M. Brandt and A. Verger and discussed with all authors. The manuscript was written byM. Brandt and A. Verger with contributions from all authors.
Conflicts of Interest
The authors declare no conflicts of interest.
References
1. Ali, A.; Lebel, T. The Sahelian standardized rainfall index revisited. Int. J. Climatol. 2009,29, 1705–1714.
2. Tappan, G.; Sall, M.; Wood, E.; Cushing, M. Ecoregions and land cover trends in Senegal.J. Arid Environ. 2004, 59, 427–462.
3. Oldeman, L.R.; Hakkeling, R.T.A.; Sombroek, W.G. World Map of the Status of Human-Induced Soil Degradation: An Explanatory Note; ISRIC: Wageningen, The Netherlands,1990. Avaliable online: http://www.isric.org/isric/webdocs/docs/ExplanNote.pdf (accessed on 15December 2013).
4. Herrmann, S.M.; Anyamba, A.; Tucker, C.J. Recent trends in vegetation dynamics in the AfricanSahel and their relationship to climate. Glob. Environ. Chang. 2005, 15, 394–404.
5. Hutchinson, C.; Herrmann, S.; Maukonen, T.; Weber, J. Introduction: The “Greening” of theSahel. J. Arid Environ. 2005, 63, 535–537.
6. Olsson, L.; Eklundh, L.; Ardo, J. A recent greening of the Saheltrends, patterns and potentialcauses. J. Arid Environ. 2005, 63, 556–566.
7. Herrmann, S.; Tappan, G. Vegetation impoverishment despite greening: A case study from centralSenegal. J. Arid Environ. 2013, 90, 55–66.
8. Brandt, M.; Romankiewicz, C.; Spiekermann, R.; Samimi, C. Environmental change in timeseries—An interdisciplinary study in the Sahel of Mali and Senegal. J. Arid Environ. 2014,in press.
9. Dardel, C.; Kergoat, L.; Hiernaux, P.; Mougin, E.; Grippa, M.; Tucker, C. Re-greening Sahel:30 years of remote sensing data and field observations (Mali, Niger). Remote Sens. Environ.2014, 140, 350–364.

Remote Sens. 2014, 6 2431
10. Fensholt, R.; Rasmussen, K.; Nielsen, T.T.; Mbow, C. Evaluation of earth observation basedlong term vegetation trendsIntercomparing NDVI time series trend analysis consistency of Sahelfrom AVHRR GIMMS, Terra MODIS and SPOT VGT data. Remote Sens. Environ. 2009,113, 1886–1898.
11. Fensholt, R.; Proud, S.R. Evaluation of earth observation based global long term vegetationtrends Comparing GIMMS and MODIS global NDVI time series. Remote Sens. Environ. 2012,119, 131–147.
12. Martinez, B.; Gilabert, M.; Garca-Haro, F.; Faye, A.; Meli, J. Characterizing land conditionvariability in Ferlo, Senegal (2001–2009) using multi-temporal 1-km Apparent Green Cover(AGC) SPOT Vegetation data. Glob. Planet. Chang. 2011, 76, 152–165.
13. Fensholt, R.; Sandholt, I.; Rasmussen, M.S. Evaluation of MODIS LAI, fAPAR and the relationbetween fAPAR and NDVI in a semi-arid environment using in situ measurements. Remote Sens.Environ. 2004, 91, 490–507.
14. Wagenseil, H.; Samimi, C. Assessing spatio-Temporal variations in plant phenology using Fourieranalysis on NDVI time series: Results from a dry savannah environment in Namibia. Int. J.Remote Sens. 2006, 27, 3455–3471.
15. Wessels, K.J.; Prince, S.D.; Frost, P.E.; van Zyl, D. Assessing the effects of human-inducedland degradation in the former homelands of northern South Africa with a 1 km AVHRR NDVItime-series. Remote Sens. Environ. 2004, 91, 47–67.
16. Dybkjaer, G.; Nielsen, T.T.; Rasmussen, K.; Schultz-Rasmussen, M.; Lars Boye, H.; Tour, A.Documentation and evaluation of the CSE NOAA AVHRR data set. Geografisk Tidsskrift. 2003,103, 125–135.
17. Tucker, C.; Pinzon, J.; Brown, M.; Slayback, D.; Pak, E.; Mahoney, R.; Vermote, E.;El Saleous, N. An extended AVHRR 8-km NDVI dataset compatible with MODIS and SPOTvegetation NDVI data. Int. J. Remote Sens. 2005, 26, 4485–4498.
18. Begue, A.; Vintrou, E.; Ruelland, D.; Claden, M.; Dessay, N. Can a 25-year trend inSoudano-Sahelian vegetation dynamics be interpreted in terms of land use change? A remotesensing approach. Glob. Environ. Chang. 2011, 21, 413–420.
19. Heumann, B.W.; Seaquist, J.W.; Eklundh, L.; Jonsson, P. AVHRR derived phenological changein the Sahel and Soudan, Africa, 1982–2005. Remote Sens. Environ. 2007, 108, 385–392.
20. Anyamba, A.; Tucker, C. Analysis of Sahelian vegetation dynamics using NOAA-AVHRR NDVIdata from 1981–2003. J. Arid Environ. 2005, 63, 596–614.
21. Zhu, Z.; Bi, J.; Pan, Y.; Ganguly, S.; Anav, A.; Xu, L.; Samanta, A.; Piao, S.; Nemani, R.;Myneni, R. Global data sets of vegetation Leaf Area Index (LAI)3g and Fraction ofPhotosynthetically Active Radiation (FPAR)3g ferived from global Inventory Modeling andMapping Studies (GIMMS) Normalized Difference Vegetation Index (NDVI3g) for the period1981 to 2011. Remote Sens. 2013, 5, 927–948.
22. Baret, F.; Weiss, M.; Lacaze, R.; Camacho, F.; Makhmara, H.; Pacholcyzk, P.; Smets, B. GEOV1:LAI and FAPAR essential climate variables and FCOVER global time series capitalizing overexisting products. Part1: Principles of development and production. Remote Sens. Environ. 2013,137, 299–309.

Remote Sens. 2014, 6 2432
23. Verger, A.; Baret, F.; Weiss, M.; Lacaze, R.; Makhmara, H.; Vermote, E. Long TermConsistent Global GEOV1 AVHRR Biophysical Products. In Proceedings of the 1st EARSeLWorkshop on Temporal Analysis of Satellite Images, Mykonos, Greece, 23–25 May 2012;pp. 28–33.
24. Vrieling, A.; de Leeuw, J.; Said, M.Y. Length of growing period over Africa: Variability andtrends from 30 years of NDVI time series. Remote Sens. 2013, 5, 982–1000.
25. De Jong, R.; Verbesselt, J.; Zeileis, A.; Schaepman, M.E. Shifts in global vegetation activitytrends. Remote Sens. 2013, 5, 1117–1133.
26. Cook, B.I.; Pau, S. Aglobal assessment of long-term greening and browning trends in pasturelands using the GIMMS LAI3g dataset. Remote Sens. 2013, 5, 2492–2512.
27. Fensholt, R.; Rasmussen, K.; Kaspersen, P.; Huber, S.; Horion, S.; Swinnen, E. Assessingland degradation/recovery in the african sahel from long-term earth observation based primaryproductivity and precipitation relationships. Remote Sens. 2013, 5, 664–686.
28. Baret, F.; Weiss, M.; Verger, A.; Kandasamy, S. BioPar Methods Compendium-LAI, FAPAR andFCOVER from LTDR AVHRR Series; Technical Report; INRA-EMMAH: Avignon, France, 2011.
29. Myneni, R.B.; Williams, D.L. On the relationship between FAPAR and NDVI. Remote Sens.Environ. 1994, 49, 200–211.
30. Spiekermann, R.; Brandt, M.; Samimi, C. Using High Resolution Imagery to Detect WoodyVegetation and Land-Cover Change over 50 Years in the Sahel of Mali. In Proceedings of theEGU General Assembly Conference Abstracts, Vienna, Austria, 7–12 April 2013; Volume 15,p. 11937.
31. Spiekermann, R. Change of Woody Vegetation and Land Cover Using High Resolution Imageson the Dogon Plateau and Sno Plains (Mali). M.Sc. Thesis, University of Vienna, Vienna,Austria, 2013.
32. RapidEye. Satellite Imagery Product Specifications; 2013. Available online:http://blackbridge.com/rapideye/upload/RE Product Specifications ENG.pdf (accessed on 25February 2014).
33. Weiss, M.; Baret, F.; Garrigues, S.; Lacaze, R. LAI and fAPAR CYCLOPES global productsderived from VEGETATION. Part 2: Validation and comparison with MODIS collection 4products. Remote Sens. Environ. 2007, 110, 317–331.
34. Verger, A.; Baret, F.; Weiss, M. Performances of neural networks for deriving LAI estimates fromexisting CYCLOPES and MODIS products. Remote Sens. Environ. 2008, 112, 2789–2803.
35. Cleveland, R.B.; Cleveland, W.S.; McRae, J.E.; Terpenning, I. STL: A seasonal-trenddecomposition procedure based on loess. J. Off. Stat. 1990, 6, 3–73.
36. Roderick, M.L.; Noble, I.R.; Cridland, S.W. Estimating woody and herbaceous vegetation coverfrom time series satellite observations. Glob. Ecol. Biogeogr. 1999, 8, 501–508.
37. Diouf, A.; Lambin, E.F. Monitoring land-cover changes in semi-arid regions: Remote sensingdata and field observations in the Ferlo, Senegal. J. Arid Environ. 2001, 48, 129–148.
38. Maydell, H.J.V. Trees and Shrubs of the Sahel: Their Characteristics and Uses; Verlag JosefMargraf: Weikersheim, Germany, 1990.

Remote Sens. 2014, 6 2433
39. Stocking, M.A.; Murnaghan, N. A Handbook for the Field Assessment of Land Degradation;Routledge: London, UK, 2001.
40. Diallo, O.; Diouf, A.; Hanan, N.P.; Ndiaye, A.; Prevost, Y. AVHRR monitoring of savannaprimary production in Senegal, West Africa: 1987–1988. Int. J. Remote Sens. 1991, 12,1259–1279.
41. Fensholt, R.; Sandholt, I.; Rasmussen, M.S.; Stisen, S.; Diouf, A. Evaluation of satellite basedprimary production modelling in the semi-arid Sahel. Remote Sens. Environ. 2006, 105, 173–188.
42. Mbow, C.; Fensholt, R.; Rasmussen, K.; Diop, D. Can vegetation productivity be derived fromgreenness in a semi-arid environment? Evidence from ground-based measurements. J. AridEnviron. 2013, 97, 56–65.
43. Hickler, T.; Eklundh, L.; Seaquist, J.; Smith, B.; Ard, J.; Olsson, L.; Sykes, M.; Sjstrm, M.Precipitation controls Sahel greening trend. Geophys. Res. Lett. 2005, 32, L21415.
44. Strommer, G.; Brandt, M.; Diongue-Niang, A.; Samimi, C. Analysis of Daily Rainfall of theSahelian Weather-Station Linguere (Senegal)-Trends and its Impacts on the Local Population. InProceedings of the EGU General Assembly Conference Abstracts, Vienna, Austria, 7–12 April2013; Volume 15, p. 12716.
45. Schneider, U.; Becker, A.; Finger, P.; Meyer-Christoffer, A.; Ziese, M.; Rudolf, B. GPCC’snew land surface precipitation climatology based on quality-controlled in situ data and its role inquantifying the global water cycle. Theor. Appl. Climatol. 2014, 115, 15–40.
46. Brandt, M.; Paeth, H.; Samimi, C. Vegetations veraenderungen in Westafrika-Spiegel vonKlimawandel und Landnutzung. Geogr. Rundschau 2013, 65, 36–42.
47. FAO. Global Forest Resources Assessment 2010, Global Tables; TechnicalReport; FAO: Rome, Italy, 2010. Available online: http://foris.fao.org/static/data/fra2010/FRA2010GlobaltablesEnJune29.xls (accessed on 23 October 2013.)
48. Allen, M. International Tree Foundation Narrative Report-MA295 Sahel ECO; Technical Report;Sahel ECO: Bamako, Mali, 2009.
49. Nicholson, S.E. The West African Sahel: A review of recent studies on the rainfall regime and itsinterannual variability. ISRN Meteorol. 2013, 2013, 1–32.
50. Giannini, A.; Salack, S.; Lodoun, T.; Ali, A.; Gaye, A.T.; Ndiaye, O. A unifying view of climatechange in the Sahel linking intra-seasonal, interannual and longer time scales. Environ. Res. Lett.2013, 8, doi:10.1088/1748-9326/8/2/0240100.
51. Bobee, C.; Ottle, C.; Maignan, F.; de Noblet-Ducoudre, N.; Maugis, P.; Lezine, A.M.; Ndiaye, M.Analysis of vegetation seasonality in Sahelian environments using MODIS LAI, in associationwith land cover and rainfall. J. Arid Environ. 2012, 84, 38–50.
52. Nutini, F.; Boschetti, M.; Brivio, P.; Bocchi, S.; Antoninetti, M. Land-use and land-cover changedetection in a semi-arid area of Niger using multi-temporal analysis of Landsat images. Int. J.Remote Sens. 2013, 34, 4769–4790.
53. Reij, C.; Tappan, G.; Smale, M. Agroenvironmental Transformation in the Sahel: AnotherKind of “Green Revolution”; Technical Report; International Food Policy Research Institute:Washington, DC, USA, 2009.
Remote Sens. 2014, 6 2434
54. Gonzalez, P. Desertification and a shift of forest species in the West African Sahel. Clim. Res.2001, 17, 217–228.
55. Pickett-Heaps, C.A.; Canadell, J.G.; Briggs, P.R.; Gobron, N.; Haverd, V.; Paget, M.J.; Pinty, B.;Raupach, M.R. Evaluation of six satellite-derived Fraction of Absorbed Photosynthetic ActiveRadiation (FAPAR) products across the Australian continent. Remote Sens. Environ. 2014,140, 241–256.
56. Meroni, M.; Atzberger, C.; Vancutsem, C.; Gobron, N.; Baret, F.; Lacaze, R.; Eerens, H.; Leo, O.Evaluation ofagreement between space remote sensing SPOT-VEGETATION fAPAR time series.IEEE Trans. Geosci. Remote Sens. 2013, 51, 1951–1962.
57. McCallum, I.; Wagner, W.; Schmullius, C.; Shvidenko, A.; Obersteiner, M.; Fritz, S.; Nilsson, S.Comparison of four global FAPAR datasets over Northern Eurasia for the year 2000. RemoteSens. Environ. 2010, 114, 941–949.
© 2014 by the authors; licensee MDPI, Basel, Switzerland. This article is an open access articledistributed under the terms and conditions of the Creative Commons Attribution license(http://creativecommons.org/licenses/by/3.0/).
Top Related
Copyright © 2022 FDOKUMEN

