

![Batteries In A Portable Wold [captured website] WW.pdf](https://static.fdokumen.com/doc/165x107/631bc4c07051d371800f2b67/batteries-in-a-portable-wold-captured-website-wwpdf.jpg)


Bahasa
Halaman
Hukum


LiMn2O4/CNTs and LiNi0.5Mn1.5O4/CNTs Nanocompositesas High-Performance Cathode Materials for Lithium-IonBatteries
Thang Van Le • Ha Tran Nguyen • Anh Tuan Luu • Man Van Tran • Phung Loan My Le
Received: 12 February 2014 / Revised: 24 August 2014
� The Chinese Society for Metals and Springer-Verlag Berlin Heidelberg 2014
Abstract The demand of higher energy density and higher power capacity of lithium (Li)-ion secondary batteries has led
to the search for electrode materials whose capacities and performance are better than those available today. Carbon
nanotubes (CNTs), with their unique properties such as 1D tubular structure, high electrical and thermal conductivities, and
extremely large surface area, have been used as materials to prepare cathodes for Li-ion batteries. The structure and
morphology of CNTs were analyzed by X-ray diffraction (XRD), scanning electron microscopy (SEM), and transmission
electron microscopy (TEM). The functional groups on the purified CNT surface such as –COOH, –OH were characterized
by Fourier Transform infrared spectroscopy. The electrode materials were fabricated from LiMn2O4 (LMO), doped spinel
LiNi0.5Mn1.5O4, and purified CNTs via solid-state reaction. The structure and morphology of the electrode were charac-
terized using XRD, SEM, and TEM. Finally, the efficiency of the electrode materials using CNTs was evaluated by cyclic
voltammetry and electrochemical impedance spectroscopy.
KEY WORDS: Nanocomposites; Carbon nanotubes (CNTs); Spinel materials; Lithium-ion batteries (LIBs)
1 Introduction
Today, mobile society provides the energy storage media
for powering increasingly diverse applications which is
highly efficient, low cost, and environmentally friendly [1,
2]. Among various energy and power technologies,
rechargeable Li-ion batteries (LIBs) are one of the most
efficient energy storage devices based on electrochemical
energy storage and conversion [3–8]. Commonly, a typical
LIB includes an anode made from graphite, and a positive
electrode (cathode) made from LiCoO2, and a Li-ion
conducting electrolyte. When the cell is charged, Li ions
are extracted from the cathode, pass through the electro-
lyte, and are inserted into the anode. Upon discharging, the
Li ions are released by the anode and move back to the
cathode. The electrons pass around the external circuits in
opposite directions. Compared to traditional rechargeable
batteries such as lead–acid and Ni–Cd batteries, recharge-
able LIBs provide many advantages including high voltage,
high energy-to-weight ratio, i.e., high energy density, long
cyclic life, no memory effect, and slow loss of charge [1–
3]. For these advantages, LIBs are currently the most
popular battery type of powering portable electronic devi-
ces. Although LIBs have shown remarkably commercial
success, the electrodes and their component materials are
still the target of interesting research for enhancement of
electrochemical performance of battery devices. The main
disadvantages of LIBs are low power density as well as low
Available online at http://link.springer.com/journal/40195
T. Van Le (&) � H. T. Nguyen � A. T. Luu
Faculty of Materials Technology, Ho Chi Minh University of
Technology, 268 Ly Thuong Kiet, Ward 14, District 10, Ho Chi
Minh City, Vietnam
e-mail: [email protected]
M. Van Tran � P. L. M. Le
Department of Physical Chemistry, University of Science, VNU-
HCM, 227 Nguyen Van Cu Street, District 5, Ho Chi Minh City,
Vietnam
123
Acta Metall. Sin. (Engl. Lett.)
DOI 10.1007/s40195-014-0181-9
ion diffusion and charge transfer during the process of
charge–discharge at high rates as a consequence of high
polarization [9–11]. Therefore, the development of new
electrodes having a large surface area, a short diffusion,
and high electric/thermal conductions, is necessary to
overcome the disadvantages of conventional materials.
Carbon nanotubes (CNTs), having high electronic con-
ductivity, good lithium permeability, and electrochemical
stability, are particularly attractive for LIB applications
[12–14]. The hybrid nanostructures obtained by incorpo-
rating CNTs into Li-storage compounds as novel electrode
materials have been developed utilizing the aforemen-
tioned attractive properties of CNTs [15–19]. The use of
CNTs in electrodes results in many advantages because of
their high-specific surface area as well as mechanical and
transport properties. Recently, there have been many
reports presenting the structures combining CNTs and
nanoparticles such as V2O5 and SnO2 [20] via a hydro-
thermal process. Such obtained V2O5–SnO2/CNT com-
posites display fast Li? transformation and high electronic
conductivity. More recently, Zhu et al. has reported Cu-
CrO2–CNT nanocomposites, which were fabricated by an
in situ hydrothermal method. This material exhibits
excellent reversible specific capacity and cyclic perfor-
mance. Even at high charge/discharge rates (1 C), the
specific capacity retention was still as high as 530 mAh/g
after 40 cycles [21].
In this study, the LMO, doped spinel LNMO, and CNT
nanocomposite materials were successfully prepared via a
mixing method. The structure and morphology of these
nanocomposites were analyzed by X-ray diffraction (XRD)
and scanning electron microscopy (SEM). These nano-
composites were obtained as cathode materials having high
diffusion of lithium ions compared to LMO (LNMO)/
Vulcan-carbon composites materials.
2 Experimental
2.1 CNTs Purification
150 mg of CNTs was immersed in 100 mL of the mixture
of H2SO4 (95%) and HNO3 (65%). The reaction was per-
formed in sonication bath for 4 h. The CNTs were washed
with deionized (DI) water several times, filtered and then
dried to constant weight.
2.2 Synthesis of Spinel LiMn2O4 (LMO)
and LiNi0.5Mn1.5O4 (LNMO) Materials
Li2CO3 (2.5 g, 67.6 mmol) and MnO2 (5.8 g, 67.6 mmol)
were mixed together and annealed at 600 �C for 24 h. The
mixture was made as pellets, which were annealed at
830 �C for 24 h to obtain LMO.
Li2CO3 (2.5 g, 67.6 mmol), MnCO3 (23.32 g, 0.202 mol),
and Ni(NO3)2�6H2O (19.65 g, 67.6 mmol) were prepared by
mixing and decomposed at 600 �C for 24 h. Then, the mixture
was grounded and made into pellets, which were heated at
900 �C for 24 h to obtain LNMO.
2.3 Synthesis of LMO (LNMO)/CNT Nanocomposites
Spinel of LMO (LNMO) (9.8 g) materials and purified
CNTs (0.2 g) were mixed together. Then, the binder of
60% PTFE dispersed in water (1 g) and 15 mL of absolute
ethanol were added to the mixture. The mixture was stirred
for 15 min, and the solvent was evaporated at 80 �C for
24 h. Then, the mixture was coated on aluminum substrates
of about 0.1 mm in thickness as cathode materials, which
were dried at 130 �C under vacuum for 24 h.
2.4 Structure and Morphology Analysis
FTIR (thermo fisher scientific-model Nicolet 6700, fre-
quency range of 4000–500 cm-1). spectra were recorded
using BIO-RAD Excalibur spectrometer equipped with an
ATR Harrick Split PeaTM. Wide-angle powder X-ray
diffraction (XRD) patterns were recorded at room tem-
perature on a Bruker AXS D8 Advance diffractometer
using CuKa radiation (k = 0.15406 nm), at a scanning rate
of 0.05�/s. SEM images were acquired using a field-emis-
sion scanning electron microscope (NOVA NANO-
SEM450, FEI) equipped with an Oxford energy dispersive
X-ray (EDX) analysis system. TEM images were per-
formed on a FEI Tecnai F20 microscope equipped with an
Oxford EDX analysis system and with an acceleration
voltage of 200 kV.
2.5 Electrochemical Characterization
Cyclic voltammetry (CV) was performed on MGP2 (Bio-
logic, France) using ECLab software. The electrochemical
cell including three electrode cells: a platinum electrode
covered with a composite material as a working electrode
(WE), an Ag/0.1 mol/L AgNO3/0.01 mol/L TBAP in aceto-
nitrile as reference electrode (RE), and a Pt wire as counter
electrode (CE). The electrolyte solution consists of 0.75 mol/
L lithium bis(trifluoromethanesulfonyl)imide (LiTFSI) dis-
solved in 1:1 mixture of ethylene carbonate (EC) and dime-
thyl carbonate (DMC) [22, 23, 24]. The standard voltage of
the reference electrode is 0.542 V versus SHE at 25 �C.
The impedance measurement (EIS) was performed in
Swagelok-type batteries at room temperature. The cell
consisting of two electrode films as positive and negative
electrodes was assembled. The electrolyte was a 1 mol/L
T. Van Le et al.: Acta Metall. Sin. (Engl. Lett.)
123

solution of LiClO4 in EC-DMC (1:1). The EIS was carried
out using an Autolab 302 N (MetroOhm).
3 Results and Discussion
Purified CNTs were first treated with a mixture of H2SO4
(95%)/HNO3 (65%) to clean the surface. Moreover, this
treatment process also functionalized reacting groups such
as hydroxyl, carboxyl, and carbonyl groups on the surface
of CNTs. These functional groups not only facilitated the
dispersion of the CNTs in water but also acted as centers
for incorporation of metal-oxide particles. The structures
and morphologies of CNTs were characterized by SEM.
Figure 1 shows the SEM images of CNTs before (a) and
after (b) the purification process using H2SO4 (95%)/HNO3
(65%). Moreover, the morphology of CNTs was confirmed
by TEM. Figure 2 shows the TEM images of purified
CNTs (Fig. 2b), which are much clearer compared with the
as-prepared one (Fig. 2a). These results suggest that the
CNTs were successfully purified using the acid treatment
process. It is observed that the acid treatment process
causes the peeling of graphite layers on surface of
untreated CNTs, and therefore, the diameter of purified
CNTs is quite smaller than the diameter of untreated CNTs.
The functional groups such as hydroxyl and carboxyl
groups of CNTs were characterized by FTIR. The presence
of hydroxyl groups and carbonyl groups corresponds to the
appearance of broad peaks at 3425 and 1736 cm-1,
respectively. It should be noted that the presence of
hydroxyl and carbonyl groups can enhance the dispersion
of CNTs in media such as polar solvents. Spinels of
LiMn2O4 (LMO) and LiNi0.5Mn1.5O4 (LNMO) were syn-
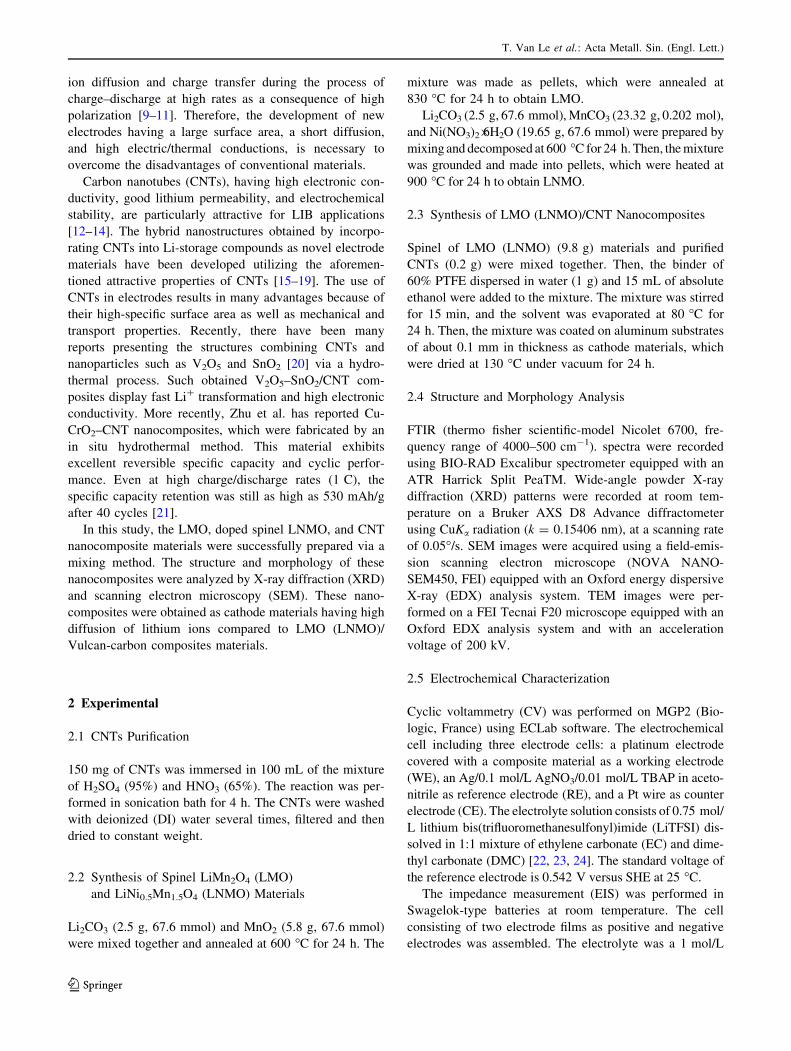
thesized by solid-state reaction. The morphology of the
LMO particles shows a well-faceted octahedral structure,
while the morphology of the LNMO particles exhibits
Fig. 1 SEM images of CNTs before a, after b acid treatment
Fig. 2 TEM images of CNTs before a, after b acid treatment
T. Van Le et al.: Acta Metall. Sin. (Engl. Lett.)
123
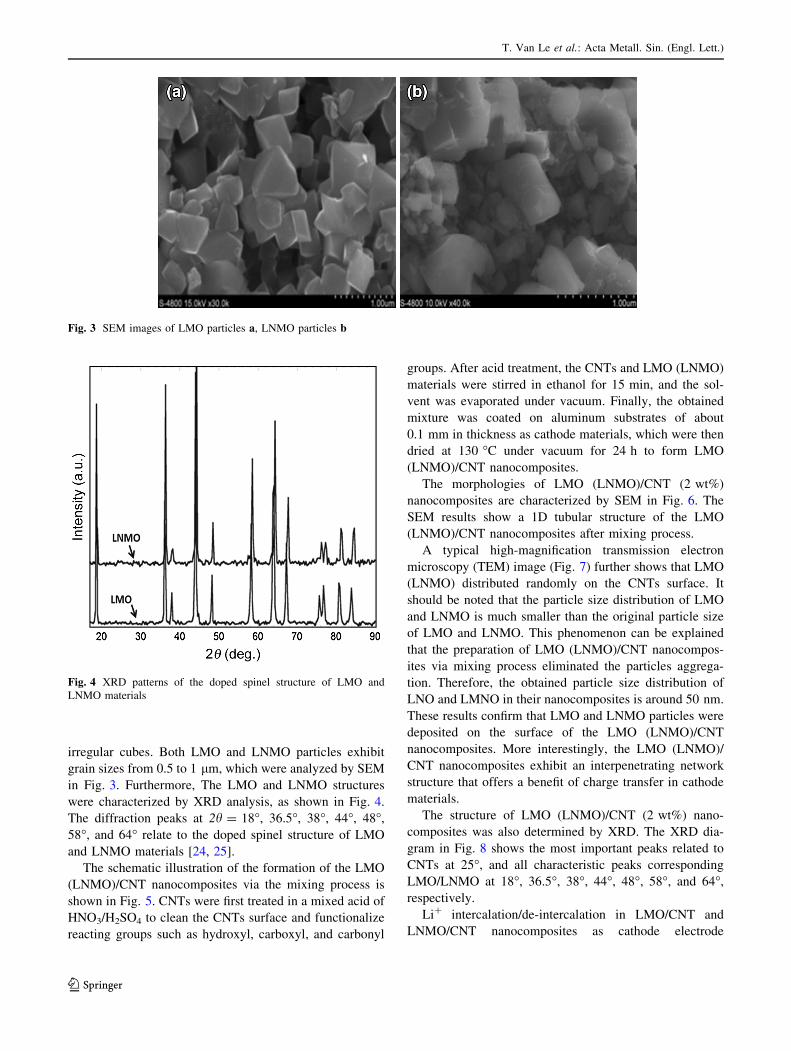
irregular cubes. Both LMO and LNMO particles exhibit
grain sizes from 0.5 to 1 lm, which were analyzed by SEM
in Fig. 3. Furthermore, The LMO and LNMO structures
were characterized by XRD analysis, as shown in Fig. 4.
The diffraction peaks at 2h = 18�, 36.5�, 38�, 44�, 48�,
58�, and 64� relate to the doped spinel structure of LMO
and LNMO materials [24, 25].
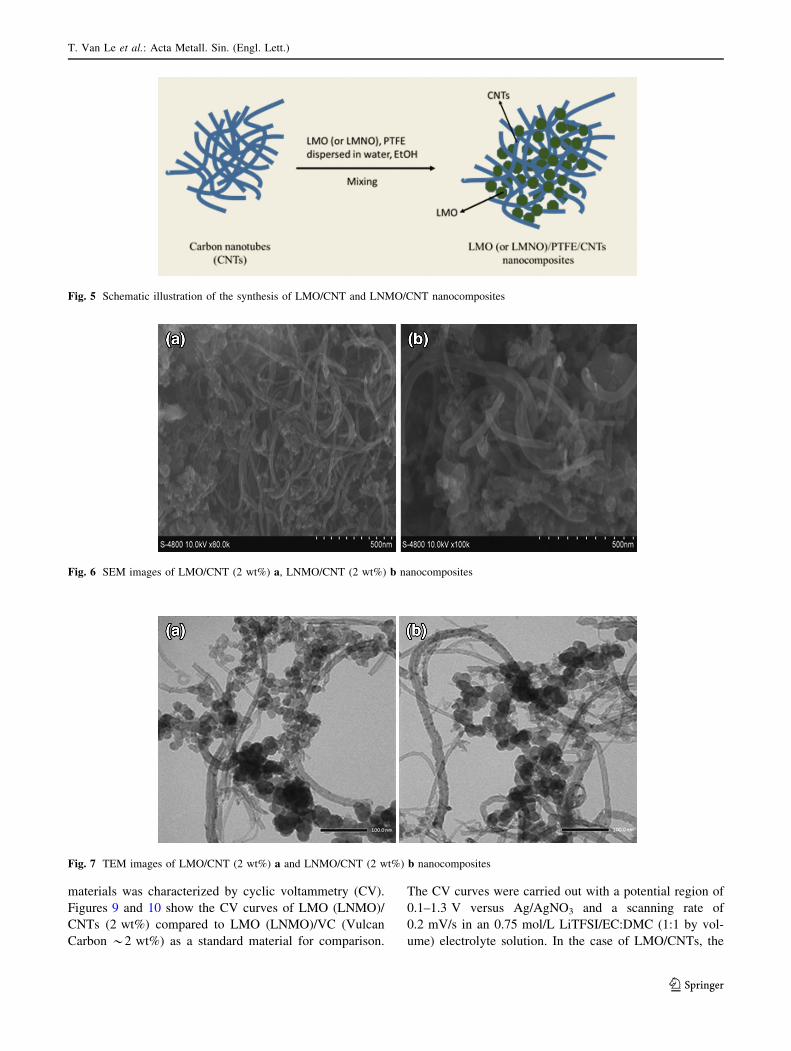
The schematic illustration of the formation of the LMO
(LNMO)/CNT nanocomposites via the mixing process is
shown in Fig. 5. CNTs were first treated in a mixed acid of
HNO3/H2SO4 to clean the CNTs surface and functionalize
reacting groups such as hydroxyl, carboxyl, and carbonyl
groups. After acid treatment, the CNTs and LMO (LNMO)
materials were stirred in ethanol for 15 min, and the sol-
vent was evaporated under vacuum. Finally, the obtained
mixture was coated on aluminum substrates of about
0.1 mm in thickness as cathode materials, which were then
dried at 130 �C under vacuum for 24 h to form LMO
(LNMO)/CNT nanocomposites.
The morphologies of LMO (LNMO)/CNT (2 wt%)
nanocomposites are characterized by SEM in Fig. 6. The
SEM results show a 1D tubular structure of the LMO
(LNMO)/CNT nanocomposites after mixing process.
A typical high-magnification transmission electron
microscopy (TEM) image (Fig. 7) further shows that LMO
(LNMO) distributed randomly on the CNTs surface. It
should be noted that the particle size distribution of LMO
and LNMO is much smaller than the original particle size
of LMO and LNMO. This phenomenon can be explained
that the preparation of LMO (LNMO)/CNT nanocompos-
ites via mixing process eliminated the particles aggrega-
tion. Therefore, the obtained particle size distribution of
LNO and LMNO in their nanocomposites is around 50 nm.
These results confirm that LMO and LNMO particles were
deposited on the surface of the LMO (LNMO)/CNT
nanocomposites. More interestingly, the LMO (LNMO)/
CNT nanocomposites exhibit an interpenetrating network
structure that offers a benefit of charge transfer in cathode
materials.
The structure of LMO (LNMO)/CNT (2 wt%) nano-
composites was also determined by XRD. The XRD dia-
gram in Fig. 8 shows the most important peaks related to
CNTs at 25�, and all characteristic peaks corresponding
LMO/LNMO at 18�, 36.5�, 38�, 44�, 48�, 58�, and 64�,
respectively.
Li? intercalation/de-intercalation in LMO/CNT and
LNMO/CNT nanocomposites as cathode electrode
Fig. 3 SEM images of LMO particles a, LNMO particles b
Fig. 4 XRD patterns of the doped spinel structure of LMO and
LNMO materials
T. Van Le et al.: Acta Metall. Sin. (Engl. Lett.)
123
materials was characterized by cyclic voltammetry (CV).
Figures 9 and 10 show the CV curves of LMO (LNMO)/
CNTs (2 wt%) compared to LMO (LNMO)/VC (Vulcan
Carbon *2 wt%) as a standard material for comparison.
The CV curves were carried out with a potential region of
0.1–1.3 V versus Ag/AgNO3 and a scanning rate of
0.2 mV/s in an 0.75 mol/L LiTFSI/EC:DMC (1:1 by vol-
ume) electrolyte solution. In the case of LMO/CNTs, the
Fig. 5 Schematic illustration of the synthesis of LMO/CNT and LNMO/CNT nanocomposites
Fig. 7 TEM images of LMO/CNT (2 wt%) a and LNMO/CNT (2 wt%) b nanocomposites
Fig. 6 SEM images of LMO/CNT (2 wt%) a, LNMO/CNT (2 wt%) b nanocomposites
T. Van Le et al.: Acta Metall. Sin. (Engl. Lett.)
123
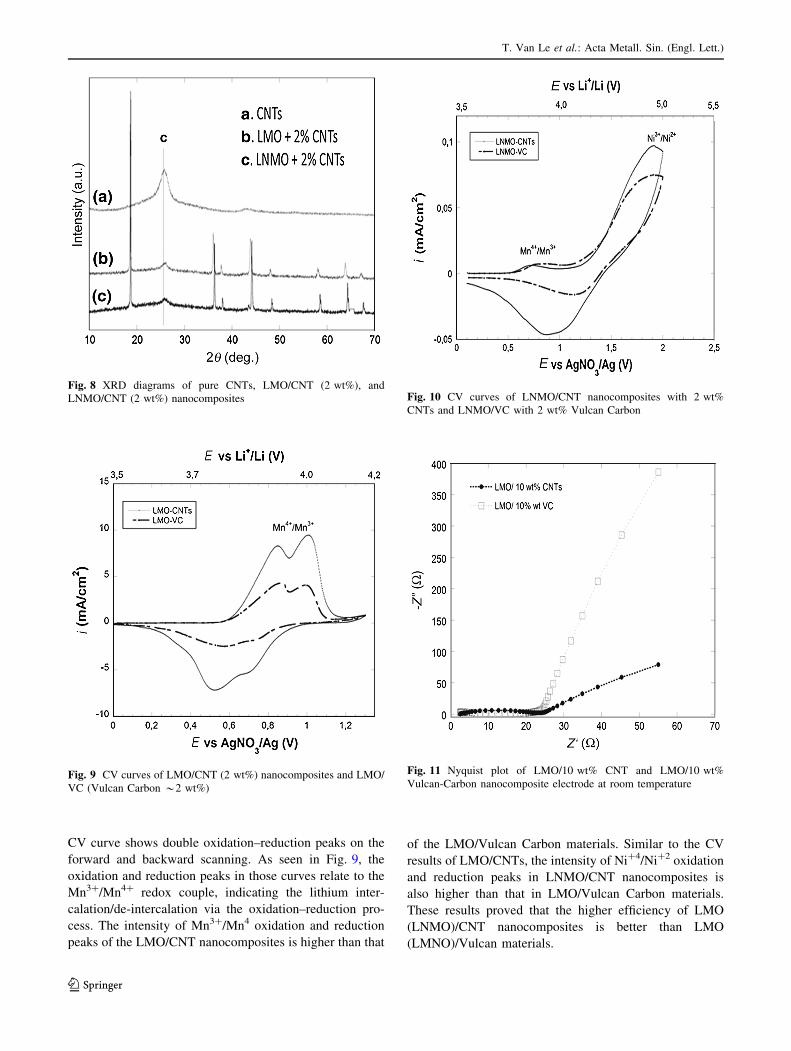
CV curve shows double oxidation–reduction peaks on the
forward and backward scanning. As seen in Fig. 9, the
oxidation and reduction peaks in those curves relate to the
Mn3?/Mn4? redox couple, indicating the lithium inter-
calation/de-intercalation via the oxidation–reduction pro-
cess. The intensity of Mn3?/Mn4 oxidation and reduction
peaks of the LMO/CNT nanocomposites is higher than that
of the LMO/Vulcan Carbon materials. Similar to the CV
results of LMO/CNTs, the intensity of Ni?4/Ni?2 oxidation
and reduction peaks in LNMO/CNT nanocomposites is
also higher than that in LMO/Vulcan Carbon materials.
These results proved that the higher efficiency of LMO
(LNMO)/CNT nanocomposites is better than LMO
(LMNO)/Vulcan materials.
Fig. 8 XRD diagrams of pure CNTs, LMO/CNT (2 wt%), and
LNMO/CNT (2 wt%) nanocomposites
Fig. 9 CV curves of LMO/CNT (2 wt%) nanocomposites and LMO/
VC (Vulcan Carbon *2 wt%)
Fig. 10 CV curves of LNMO/CNT nanocomposites with 2 wt%
CNTs and LNMO/VC with 2 wt% Vulcan Carbon
Fig. 11 Nyquist plot of LMO/10 wt% CNT and LMO/10 wt%
Vulcan-Carbon nanocomposite electrode at room temperature
T. Van Le et al.: Acta Metall. Sin. (Engl. Lett.)
123
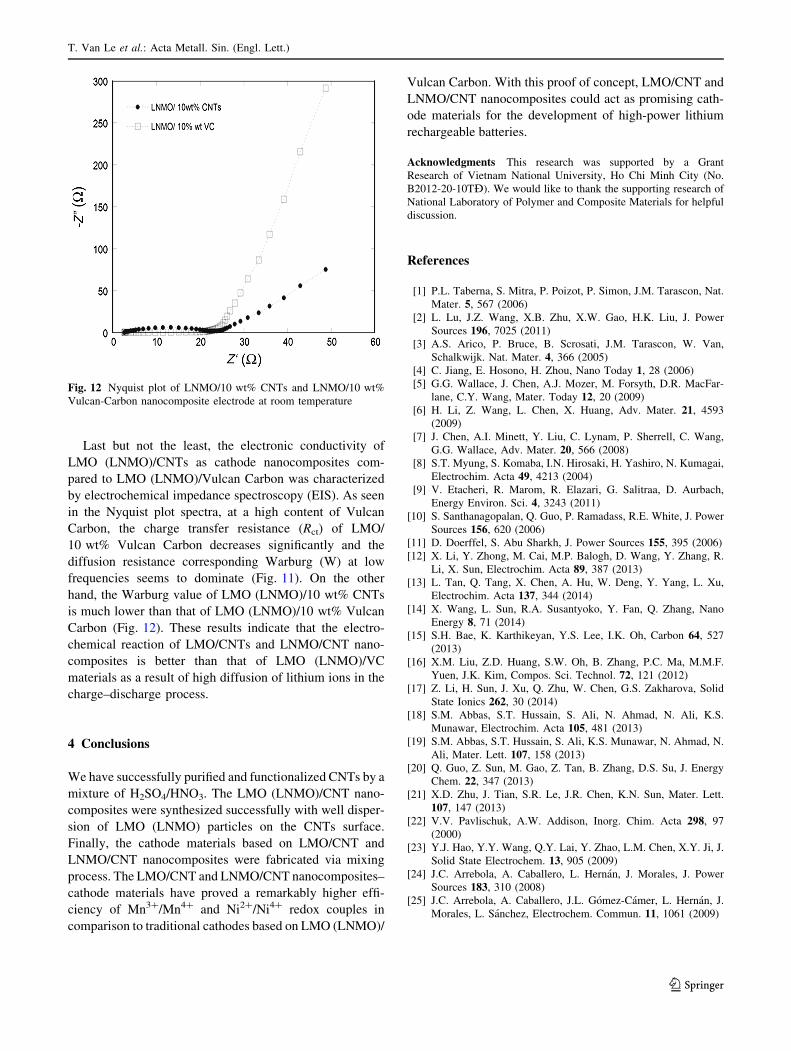
Last but not the least, the electronic conductivity of
LMO (LNMO)/CNTs as cathode nanocomposites com-
pared to LMO (LNMO)/Vulcan Carbon was characterized
by electrochemical impedance spectroscopy (EIS). As seen
in the Nyquist plot spectra, at a high content of Vulcan
Carbon, the charge transfer resistance (Rct) of LMO/
10 wt% Vulcan Carbon decreases significantly and the
diffusion resistance corresponding Warburg (W) at low
frequencies seems to dominate (Fig. 11). On the other
hand, the Warburg value of LMO (LNMO)/10 wt% CNTs
is much lower than that of LMO (LNMO)/10 wt% Vulcan
Carbon (Fig. 12). These results indicate that the electro-
chemical reaction of LMO/CNTs and LNMO/CNT nano-
composites is better than that of LMO (LNMO)/VC
materials as a result of high diffusion of lithium ions in the
charge–discharge process.
4 Conclusions
We have successfully purified and functionalized CNTs by a
mixture of H2SO4/HNO3. The LMO (LNMO)/CNT nano-
composites were synthesized successfully with well disper-
sion of LMO (LNMO) particles on the CNTs surface.
Finally, the cathode materials based on LMO/CNT and
LNMO/CNT nanocomposites were fabricated via mixing
process. The LMO/CNT and LNMO/CNT nanocomposites–
cathode materials have proved a remarkably higher effi-
ciency of Mn3?/Mn4? and Ni2?/Ni4? redox couples in
comparison to traditional cathodes based on LMO (LNMO)/
Vulcan Carbon. With this proof of concept, LMO/CNT and
LNMO/CNT nanocomposites could act as promising cath-
ode materials for the development of high-power lithium
rechargeable batteries.
Acknowledgments This research was supported by a Grant
Research of Vietnam National University, Ho Chi Minh City (No.
B2012-20-10TÐ). We would like to thank the supporting research of
National Laboratory of Polymer and Composite Materials for helpful
discussion.
References
[1] P.L. Taberna, S. Mitra, P. Poizot, P. Simon, J.M. Tarascon, Nat.
Mater. 5, 567 (2006)
[2] L. Lu, J.Z. Wang, X.B. Zhu, X.W. Gao, H.K. Liu, J. Power
Sources 196, 7025 (2011)
[3] A.S. Arico, P. Bruce, B. Scrosati, J.M. Tarascon, W. Van,
Schalkwijk. Nat. Mater. 4, 366 (2005)
[4] C. Jiang, E. Hosono, H. Zhou, Nano Today 1, 28 (2006)
[5] G.G. Wallace, J. Chen, A.J. Mozer, M. Forsyth, D.R. MacFar-
lane, C.Y. Wang, Mater. Today 12, 20 (2009)
[6] H. Li, Z. Wang, L. Chen, X. Huang, Adv. Mater. 21, 4593
(2009)
[7] J. Chen, A.I. Minett, Y. Liu, C. Lynam, P. Sherrell, C. Wang,
G.G. Wallace, Adv. Mater. 20, 566 (2008)
[8] S.T. Myung, S. Komaba, I.N. Hirosaki, H. Yashiro, N. Kumagai,
Electrochim. Acta 49, 4213 (2004)
[9] V. Etacheri, R. Marom, R. Elazari, G. Salitraa, D. Aurbach,
Energy Environ. Sci. 4, 3243 (2011)
[10] S. Santhanagopalan, Q. Guo, P. Ramadass, R.E. White, J. Power
Sources 156, 620 (2006)
[11] D. Doerffel, S. Abu Sharkh, J. Power Sources 155, 395 (2006)
[12] X. Li, Y. Zhong, M. Cai, M.P. Balogh, D. Wang, Y. Zhang, R.
Li, X. Sun, Electrochim. Acta 89, 387 (2013)
[13] L. Tan, Q. Tang, X. Chen, A. Hu, W. Deng, Y. Yang, L. Xu,
Electrochim. Acta 137, 344 (2014)
[14] X. Wang, L. Sun, R.A. Susantyoko, Y. Fan, Q. Zhang, Nano
Energy 8, 71 (2014)
[15] S.H. Bae, K. Karthikeyan, Y.S. Lee, I.K. Oh, Carbon 64, 527
(2013)
[16] X.M. Liu, Z.D. Huang, S.W. Oh, B. Zhang, P.C. Ma, M.M.F.
Yuen, J.K. Kim, Compos. Sci. Technol. 72, 121 (2012)
[17] Z. Li, H. Sun, J. Xu, Q. Zhu, W. Chen, G.S. Zakharova, Solid
State Ionics 262, 30 (2014)
[18] S.M. Abbas, S.T. Hussain, S. Ali, N. Ahmad, N. Ali, K.S.
Munawar, Electrochim. Acta 105, 481 (2013)
[19] S.M. Abbas, S.T. Hussain, S. Ali, K.S. Munawar, N. Ahmad, N.
Ali, Mater. Lett. 107, 158 (2013)
[20] Q. Guo, Z. Sun, M. Gao, Z. Tan, B. Zhang, D.S. Su, J. Energy
Chem. 22, 347 (2013)
[21] X.D. Zhu, J. Tian, S.R. Le, J.R. Chen, K.N. Sun, Mater. Lett.
107, 147 (2013)
[22] V.V. Pavlischuk, A.W. Addison, Inorg. Chim. Acta 298, 97
(2000)
[23] Y.J. Hao, Y.Y. Wang, Q.Y. Lai, Y. Zhao, L.M. Chen, X.Y. Ji, J.
Solid State Electrochem. 13, 905 (2009)
[24] J.C. Arrebola, A. Caballero, L. Hernan, J. Morales, J. Power
Sources 183, 310 (2008)
[25] J.C. Arrebola, A. Caballero, J.L. Gomez-Camer, L. Hernan, J.
Morales, L. Sanchez, Electrochem. Commun. 11, 1061 (2009)
Fig. 12 Nyquist plot of LNMO/10 wt% CNTs and LNMO/10 wt%
Vulcan-Carbon nanocomposite electrode at room temperature
T. Van Le et al.: Acta Metall. Sin. (Engl. Lett.)
123
Top Related
Copyright © 2022 FDOKUMEN

