


Bahasa
Halaman
Hukum


Estuarine, Coastal and Shelf Science 61 (2004) 1e13
www.elsevier.com/locate/ECSS
Large-scale spatial patterns of benthic assemblagesin the SW Atlantic: the Rıo de la Plata
estuary and adjacent shelf waters
D.A. Gibertoa,b,), C.S. Bremeca,b, E.M. Achab,c, H. Mianzana,b
aConsejo Nacional de Investigaciones Cientıficas y Tecnicas (CONICET), ArgentinabInstituto Nacional de Investigacion y Desarrollo Pesquero (INIDEP), Po. V. Ocampo no. 1,
B7602HSA Mar del Plata, ArgentinacUniversidad Nacional de Mar del Plata, Mar del Plata, Argentina
Received 18 July 2003; accepted 4 March 2004
Abstract
This study deals with the spatial distribution of macrobenthic communities (biomass and abundance) in the Rıo de la Plata
estuary, ArgentinaeUruguay, and the adjacent shelf waters. The benthic invertebrates were caught with an epibenthic dredge (41samples). Multivariate analysis (cluster, MDS), SIMPER and BIO-ENV analyses were applied to analyze benthic communitystructure and their relationships with environmental variables. A consistent large-scale diversity pattern was found: a distinctive
estuarine zone could be distinguished, with muddy sediments and a wide range of salinity, characterized by higher abundance offauna and lower diversity, dominated by the deposit-feeding bivalve Mactra isabelleana; and a marine zone, with sandy-shell debrissediments and higher and less variable salinity values, with higher values of diversity. Major presence of deposit feeders was relatedto higher particulate organic matter in the estuarine area. Bottom type, salinity and the presence of a turbidity front are considered
the main physical variables in structuring benthic communities of the Rıo de la Plata estuary.� 2004 Elsevier Ltd. All rights reserved.
Keywords: macrobenthos; spatial scale; diversity; estuarine; marine; SW Atlantic
1. Introduction
Benthic estuarine animals are commonly thought tobe distributed along gradients of physiological stressaccording to their environmental tolerance (Remaneand Schlieper, 1971). Spatial differences in the compo-sition of the benthic communities along estuarinegradients have been related mainly to changes insalinity, depth, sediment grain size, and organic content(Day et al., 1989). These environmental variables restrictthe range of organisms that are able to survive with theconsequence that estuaries are considered areas of low
) Corresponding author. Present address: Benthos Laboratory,
Instituto Nacional de Investigacion y Desarrollo Pesquero (INIDEP),
V. Ocampo no. 1, B7602HSA Mar del Plata, Argentina.
E-mail address: [email protected] (D.A. Giberto).
0272-7714/$ - see front matter � 2004 Elsevier Ltd. All rights reserved.
doi:10.1016/j.ecss.2004.03.015
diversity, with high abundances, when compared withbordering marine systems (Day et al., 1989; Atrill et al.,1996; Constable, 1999).
The Rıo de la Plata is an extensive and shallowcoastal plain estuary on the western South Atlantic,between Argentina and Uruguay (35e36(S) (Fig. 1).The main characteristics of the estuary are its largegeographic extent and the occurrence of a quasi-permanent salt wedge, which generates bottom andsurface salinity fronts, important in fish reproductiveprocesses and where high concentrations of zooplanktonoccur (Mianzan et al., 2001). A turbidity front is presentin the inner estuary (Mianzan et al., 2001).
While there is mounting evidence that factors drivingecological forces could be affected by ecosystem size(Post, 2002), available information on benthic assemb-lages generally comes from studies covering small areas(see Remane and Schlieper, 1971; Day et al., 1989; Atrill

2 D.A. Giberto et al. / Estuarine, Coastal and Shelf Science 61 (2004) 1e13
Fig. 1. The Rıo de la Plata estuary and adjacent shelf waters, with location of sampling sites (n ¼ 41) (C) and isobaths (m).
et al., 1996; Platell and Potter, 1996; Constable, 1999).A similar situation is found in studies about benthicdiversity, where data over different spatial scales areneeded worldwide (Gray, 2001). It is the case of ourstudy area, where the present knowledge about subtidalbenthos comes from scarce studies with limited spatialcoverage (see references in Mianzan et al., 2001).
This contribution provides information about thebenthic assemblages from a large system, includingestuarine and marine regions, from temperate Southernlatitudes. The aims of this work are to characterize thebenthic assemblages of the Rıo de la Plata estuary andadjacent shelf waters, and to assess their relationshipwith the gradient of environmental variables (salinity,depth, temperature, bottom type and turbidity frontposition).
2. Study area
The Rıo de la Plata estuary extends for over 280 kmfrom the head (25 km wide) to the 230-km-wide mouthbetween Punta Rasa and Punta del Este, with a mixoha-line area of 38,000 km2 (Fig. 1). Depth in the estuaryranges from 5 to 25 m and salinity values between 0 and30 PSU, while in the adjacent marine zone depth ranges
from 25 to 40 m and salinity between 30 and 34 PSU.The freshwater discharge (annual mean 22,000 m3 s�1)from the Parana and Uruguay rivers into the estuaryexhibits little seasonality. Also significant horizontaltemperature gradients are absent (Mianzan et al., 2001).
The average annual suspended sediment load fromParana and Uruguay rivers, 79.8! 106 tons yr�1, con-tains 75% coarse to medium silt, 15% fine to very finesilt, and 10% clay. Muddy sediments ( predominance ofsilt and clay, modal diameter= 44 mme3.9 mm) coverthe mixohaline zone. Most of the river discharge flowsout through the northern channel bordering theUruguayan coast. This channel extends out of theestuary onto the marine continental shelf. The marineenvironment, except for the channel zone, is character-ized by a large sand body very uniform in grain size(modal diameter= 250 mme125 mm) and composition,extending from the continental shelf into the mouth ofthe estuary. The contact of the sands with the muddysediments makes a transitional zone of sandy silt andsandy clay textures. A coarse sedimentary texture isfound in the inner shelf (Urien, 1972).
A variable particularly considered in this study is thepresence of the turbidity front, a region of locallyelevated suspended matter concentrations, which occurnear the bottom salinity front (see Framinan et al.,
3D.A. Giberto et al. / Estuarine, Coastal and Shelf Science 61 (2004) 1e13
1999). The mean distribution of the turbidity front hasa high degree of variability at the northern coast of theestuary. In this region, the frontal position variesbetween 57(00# and 54(12#W, a distance of approxi-mately 200 km (Framinan et al., 1999). At the southerncoast the modal position of the front coincides with the5 m isobath, although great variations also occur. Thedistribution has three areas with maximum values offrontal density: the southern and northern area of theSamborombon Bay (centered in 36(13#S, 56(50#W and35(40#S, 57(00#W, respectively) and the coastal areasouth of Montevideo (35(00#S, 56(20#W) (Framinanet al., 1999).
3. Materials and methods
3.1. Sampling
Benthos samples and environmental data came from41 stations sampled in spring 1993, by the R/V ‘‘EduardoL. Holmberg’’ (INIDEP) (Fig. 1). Faunal samples weretaken with an epibenthic dredge (see Rothlisberg andPearcy, 1977; one trawling at each station, frameZ200 cm! 50 cm, mesh sizeZ 1 cm, mean ship speedZ1.8 knots, duration of haulsZ 10 min, mean areasampledZ 1.5 km2). The dredge remained open whenit was lowered to the bottom and brought to the surface.Samples were sieved through a 1 mm screen on boardthe ship and preserved for analysis in 5% formalin. In thelaboratory, all invertebrates were sorted out from thesamples, identified and counted under a stereo micro-scope; wet weight was measured in grams for each taxonwith an analytical balance (accuracy 0.01 g). Samplingwas considered semi quantitative: we estimated the sweptarea of every sample using the ship speed, frame size andduration of every tow. This procedure permitted toestimate densities in order to compare the data of thewhole sampling area. The abundance and biomass werestandardized to km2.
Oceanographic sampling was performed with a SeaBird-19 CTD (ConductivityeTemperatureeDepth pro-filer). The salinity is reported following the PracticalSalinity Scale. Information of the sediment type at eachstation was taken from local sediment maps (Urien,1972; Giberto, 2001) and assigned to the following mainfraction found in the different sectors of the estuary:mud, mudesand, fine medium sand, and shell debris(predominance of shells, calcareous fragments andpebbles). Density values (using pixel values) of theturbidity front were assigned to the sampling stationsfrom Framinan and Brown (1996), who used a four-yearspan of NOAA-AVHRR daily images to estimate thedistribution of the frontal density, a probabilisticmeasure of frontal occurrence in a given area.
3.2. Data analysis
3.2.1. Benthic assemblagesA non-parametric multivariate analysis (Field et al.,
1982; Clarke, 1993; Clarke and Warwick, 2001) basedon community structure were performed to definebiological grouping of sampling sites. Classification(group average sorting of the BrayeCurtis similaritymeasures based on 4th root transformed abundance andbiomass data) and ordination (multi-dimensional scal-ing (MDS) on the above similarity matrices) methodswere used. In the analysis among species the referreddata matrix was used, considering species with abun-dance or biomass O1% of the total of any sample inorder to have any chance of an interpretative clusteringand ordination analysis. The composition of theassemblages was analyzed at two levels: taxonomicidentity and feeding guilds. Feeding type includeddeposit feeders (DF), filter and suspension feeders(F/S), carnivores and/or scavengers (C/S), omnivores(OM) and herbivores (HE). Macrobenthic taxa wereassigned to trophic groups based on data documented inthe literature (Fauchald and Jumars, 1979; Wolff, 1992;Barnes and Morton, 1997 and references included inMianzan et al., 2001).
The samples that showed a marked tendency tocluster (similarity O20% in the abundance and biomassclassification analysis) were used to perform a SIMPERanalysis (‘‘similarity percentages’’) in order to identifythose species which contributed most to similaritieswithin groups (‘‘typical’’ and ‘‘discriminating’’ species,Clarke, 1993).
Based on these biological patterns, distinct areas withdifferent species composition were established. Differ-ences in abundance and biomass (standardized to meanpercentage per station) among areas (defined in themultivariate analysis) and group composition (usingtaxonomic identity and feeding guilds) were analyzed bya two-way ANOVA followed by a Tukey test modifiedfor unequal n (Zar, 1984). An arcsine or log-trans-formation was applied when data displayed significantdepartures from homoscedasticity (detected with theBarlett’s test) (Zar, 1984).
Following Hill (1973) and Gray (2000), we analyzedfor each site: (a) the species richness (Margalef’s indexd ¼ S� 1=log N, where S= total number of species andN= total number of individuals); (b) the diversity bythe index Hill N1 ¼ expðH#Þ, were H# is the commonlyused index ShannoneWiener; (c) the Pielou’s index ofevenness J# ¼ H#=log S; and (d) the index of polydo-minance Hill N2 ¼ 1=ð p21Cp22/Cp2nÞ, where p1 is theproportional abundance of the first species compared tothe total number of individuals in the n samples. Toexplore differences between mean values of richness,diversity, evenness, and dominance among stations theManneWhitney U test was used (Zar, 1984).

4 D.A. Giberto et al. / Estuarine, Coastal and Shelf Science 61 (2004) 1e13
3.2.2. Interactions between environmental variablesand benthic patterns
Differences between the environmental characteristics(depth, salinity, temperature and frontal density) of thedefined zones were assessed using the ManneWhitney Utest (Zar, 1984). Spearman’s correlation coefficients wereused to examine the relationships between the biologicalvariables (diversity, dominant species, abundance andbiomass of the total macrobenthic fauna) and depth,bottom salinity, bottom temperature and frontal density.However, since it would not be expected that a singleenvironmental variable would provide the best explana-tion of biological patterns, the BIO-ENV procedure wasused to determine which set of variables (salinity, depth,temperature, frontal density, similarity calculated withthe Euclidean distance coefficient) best explains thebiological matrices (diversity and abundanceebiomassdata, using BrayeCurtis similarity measure) (Clarke andAinsworth, 1993; Clarke and Warwick, 2001). Salinity,temperature and frontal density were transformed withthe logðxC1Þ. In line with recommendations of Clarkeand Warwick (2001), prior to this analysis a draftsmanplot (scatter plots between pairs of environmentalvariables) was used to assess the linearity of the dataand the inter-correlation between variables, in orderto remove from the analysis all subsets of variableswhich have mutual Spearman’s correlation coefficientsaveraging more than about 0.90.
4. Results
4.1. Composition of the macrobenthos
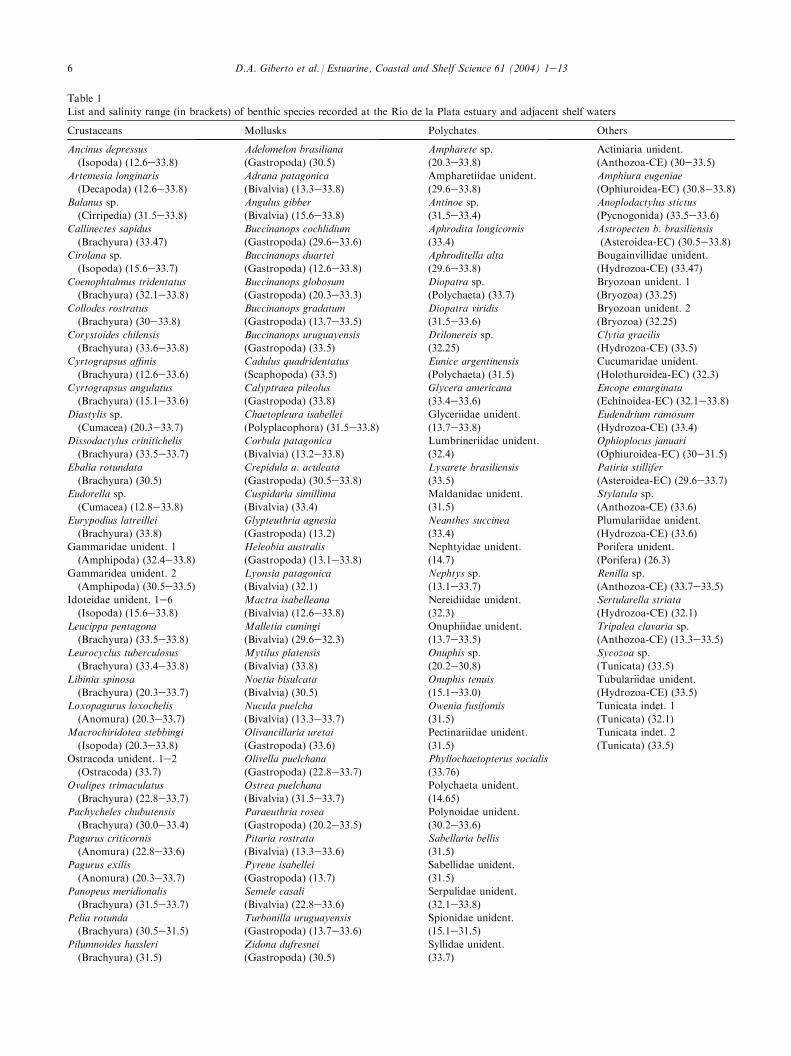
We recorded a total of 134 species (most from marinewaters) (Table 1). Thirty-four species were recorded inmixohaline waters (!30) and only seven (Glypteuthriaagnesia, Idoteidae unident. 1e2, Nepthyidae unident.,Polychaeta unident., Pyrene isabellei and Travisia sp.)were exclusively found at low salinity conditions(salinities !15). The highest densities (station 25;1931 ind. km�2) and biomass (station 21; 2291.7 g km�2)were found in front of the Uruguayan coast; the lowestvalues were obtained at station 14 (19 ind. km�2) andstation 36 (23.32 g km�2) (Fig. 1).
Crustaceans were most diverse with 48 species,followed by polychaetes with 33 species and molluskswith 31 species. Mollusks, on the other hand, occurredin highest number and biomass (65.59% and 65.90% ofthe total respectively) throughout the study area (Table2). Fifteen species contributed O90% of the totalabundance and biomass, with the bivalve Mactraisabelleana (Mactridae) being most numerous, followedby the red shrimp Artemesia longinaris and the sanddollar Encope emarginata (Table 2).
4.2. Benthic assemblages and environmental conditions
Classification and ordination analysis separatedsampling stations into two main groups, correspondingto inner (hereafter referred to as the ‘‘Area 1’’) and outer(hereafter ‘‘Area 2’’) stations. Based on this two plots,Area 1 included 16 sampling sites (13, 18, 20e31, 33 and34) and 37 species, while Area 2 included 25 sites (1e17,19, 32, 35e41) and 125 species. Fig. 2 shows the MDSordination of sites clustered at a similarity of 25%,according to (a) abundance and (b) biomass of species.The biomass plot separated Area 2 into two sub-groups,one corresponding to the Argentinean coast (character-ized mainly by the presence of Encope emarginata) andanother to the Uruguayan coast (characterized by manyspecies) (Fig. 2b).
Area 1 included stations with salinity ranging from12.6 to 32.9, depths between 8 and 23 m, frontaldensities ranging from 0 to 8.5, temperatures between9.2 and 11.4 (C, and with 85.71% of sites correspondingto muddy bottoms. Area 2 included stations withsalinity ranging between 30.2 and 33.8, depths between10 and 27, frontal densities ranging from 0 to 5,temperatures between 9 and 11.8 (C, and with stationsin front of the Uruguayan coast characterized by theshell debris fraction (48% of sites) and mudesandfraction (28%), while the Argentinean coast wascharacterized by the sand medium fraction (24%).
The species that typified Area 1 were the bivalveMactra isabelleana, the decapod Artemesia longinarisand the gastropod Buccinanops duartei (SIMPERanalysis, Table 3). Area 2 was typified by A. longinaris,the bivalve Corbula patagonica, and the serolid Serolismarplatensis (Table 3). The red shrimp A. longinaris wastypical in both regions, but with higher densities in Area2. Therefore, together with M. isabelleana, they were themain discriminating species (Table 3). Classification andordination analysis among taxa separated species ofArea 1 and Area 2. Dominant taxa (those species thatcontributed more than 10% of similarity at any site),both in abundance and biomass are displayed in Fig. 3.
Area 1 had higher values of total invertebrates abun-dance (10,024 ind. km�2 vs. 3829 ind. km�2) and bio-mass (8349.4 g km�2 vs. 6257.6 g km�2) than Area 2.Mean abundance (2131.75G 1614.65 ind. km�2 vs.534.39G 572.8 ind. km�2) and biomass (1849.24G2088.7 g km�2 vs. 841.80G 793.8 g km�2) values dis-played highly significant (p! 0:001) and significant(p! 0:05) differences, respectively, always highest forArea 1. The lowest values of diversity and richness, withunevenly represented species, characterized Area 1(Table 4). Diversity reached the highest value in Area2 at station 5 (Hill N1 ¼ 22:7).
A two-way ANOVA based on abundance andbiomass data (see Fig. 4) showed that the meanpercentage per site was significantly different among

5D.A. Giberto et al. / Estuarine, Coastal and Shelf Science 61 (2004) 1e13
Fig. 2. MDS ordination of stations using data of (a) abundance and (b) biomass of species. Groups (Area 1=C, Area 2=6) are stations delimited
from classification analysis (group average sorting of the BrayeCurtis similarity measure) at a similarity level of 25%.
areas and taxonomic composition, both for abundance(F ¼ 5:478, p ¼ 0:02, and F ¼ 67:597, p! 0:001) andbiomass (F ¼ 8:524, p ¼ 0:004, and F ¼ 46:17, p!0:001), with also a significant interaction term area!
taxonomic composition for abundance (F ¼ 8:571,p ¼ 0:0002) and biomass (F ¼ 20:23, p! 0:0001). Re-sults of the Tukey test showed that the mollusks weredominants in terms of biomass in Area 1 (p! 0:001),
6 D.A. Giberto et al. / Estuarine, Coastal and Shelf Science 61 (2004) 1e13
Table 1
List and salinity range (in brackets) of benthic species recorded at the Rıo de la Plata estuary and adjacent shelf waters
Crustaceans Mollusks Polychates Others
Ancinus depressus
(Isopoda) (12.6e33.8)
Adelomelon brasiliana
(Gastropoda) (30.5)
Ampharete sp.
(20.3e33.8)
Actiniaria unident.
(Anthozoa-CE) (30e33.5)
Artemesia longinaris
(Decapoda) (12.6e33.8)
Adrana patagonica
(Bivalvia) (13.3e33.8)
Ampharetiidae unident.
(29.6e33.8)
Amphiura eugeniae
(Ophiuroidea-EC) (30.8e33.8)Balanus sp.
(Cirripedia) (31.5e33.8)
Angulus gibber
(Bivalvia) (15.6e33.8)
Antinoe sp.
(31.5e33.4)
Anoplodactylus stictus
(Pycnogonida) (33.5e33.6)
Callinectes sapidus
(Brachyura) (33.47)
Buccinanops cochlidium
(Gastropoda) (29.6e33.6)Aphrodita longicornis
(33.4)
Astropecten b. brasiliensis
(Asteroidea-EC) (30.5e33.8)
Cirolana sp.
(Isopoda) (15.6e33.7)
Buccinanops duartei
(Gastropoda) (12.6e33.8)
Aphroditella alta
(29.6e33.8)
Bougainvillidae unident.
(Hydrozoa-CE) (33.47)
Coenophtalmus tridentatus
(Brachyura) (32.1e33.8)Buccinanops globosum
(Gastropoda) (20.3e33.3)Diopatra sp.
(Polychaeta) (33.7)
Bryozoan unident. 1
(Bryozoa) (33.25)
Collodes rostratus
(Brachyura) (30e33.8)
Buccinanops gradatum
(Gastropoda) (13.7e33.5)
Diopatra viridis
(31.5e33.6)
Bryozoan unident. 2
(Bryozoa) (32.25)
Corystoides chilensis
(Brachyura) (33.6e33.8)Buccinanops uruguayensis
(Gastropoda) (33.5)
Drilonereis sp.
(32.25)
Clytia gracilis
(Hydrozoa-CE) (33.5)
Cyrtograpsus affinis
(Brachyura) (12.6e33.6)
Cadulus quadridentatus
(Scaphopoda) (33.5)
Eunice argentinensis
(Polychaeta) (31.5)
Cucumaridae unident.
(Holothuroidea-EC) (32.3)
Cyrtograpsus angulatus
(Brachyura) (15.1e33.6)
Calyptraea pileolus
(Gastropoda) (33.8)
Glycera americana
(33.4e33.6)
Encope emarginata
(Echinoidea-EC) (32.1e33.8)
Diastylis sp.
(Cumacea) (20.3e33.7)
Chaetopleura isabellei
(Polyplacophora) (31.5e33.8)
Glyceriidae unident.
(13.7e33.8)
Eudendrium ramosum
(Hydrozoa-CE) (33.4)
Dissodactylus crinitichelis
(Brachyura) (33.5e33.7)
Corbula patagonica
(Bivalvia) (13.2e33.8)
Lumbrineriidae unident.
(32.4)
Ophioplocus januari
(Ophiuroidea-EC) (30e31.5)
Ebalia rotundata
(Brachyura) (30.5)
Crepidula a. aculeata
(Gastropoda) (30.5e33.8)
Lysarete brasiliensis
(33.5)
Patiria stillifer
(Asteroidea-EC) (29.6e33.7)Eudorella sp.
(Cumacea) (12.8e33.8)
Cuspidaria simillima
(Bivalvia) (33.4)
Maldanidae unident.
(31.5)
Stylatula sp.
(Anthozoa-CE) (33.6)
Eurypodius latreillei
(Brachyura) (33.8)
Glypteuthria agnesia
(Gastropoda) (13.2)
Neanthes succinea
(33.4)
Plumulariidae unident.
(Hydrozoa-CE) (33.6)
Gammaridae unident. 1
(Amphipoda) (32.4e33.8)
Heleobia australis
(Gastropoda) (13.1e33.8)
Nephtyidae unident.
(14.7)
Porifera unident.
(Porifera) (26.3)
Gammaridea unident. 2
(Amphipoda) (30.5e33.5)
Lyonsia patagonica
(Bivalvia) (32.1)
Nephtys sp.
(13.1e33.7)Renilla sp.
(Anthozoa-CE) (33.7e33.5)
Idoteidae unident. 1e6
(Isopoda) (15.6e33.8)
Mactra isabelleana
(Bivalvia) (12.6e33.8)
Nereidiidae unident.
(32.3)
Sertularella striata
(Hydrozoa-CE) (32.1)
Leucippa pentagona
(Brachyura) (33.5e33.8)Malletia cumingi
(Bivalvia) (29.6e32.3)Onuphiidae unident.
(13.7e33.5)Tripalea clavaria sp.
(Anthozoa-CE) (13.3e33.5)
Leurocyclus tuberculosus
(Brachyura) (33.4e33.8)
Mytilus platensis
(Bivalvia) (33.8)
Onuphis sp.
(20.2e30.8)
Sycozoa sp.
(Tunicata) (33.5)
Libinia spinosa
(Brachyura) (20.3e33.7)Noetia bisulcata
(Bivalvia) (30.5)
Onuphis tenuis
(15.1e33.0)Tubulariidae unident.
(Hydrozoa-CE) (33.5)
Loxopagurus loxochelis
(Anomura) (20.3e33.7)
Nucula puelcha
(Bivalvia) (13.3e33.7)
Owenia fusifomis
(31.5)
Tunicata indet. 1
(Tunicata) (32.1)
Macrochiridotea stebbingi
(Isopoda) (20.3e33.8)
Olivancillaria uretai
(Gastropoda) (33.6)
Pectinariidae unident.
(31.5)
Tunicata indet. 2
(Tunicata) (33.5)
Ostracoda unident. 1e2
(Ostracoda) (33.7)
Olivella puelchana
(Gastropoda) (22.8e33.7)
Phyllochaetopterus socialis
(33.76)
Ovalipes trimaculatus
(Brachyura) (22.8e33.7)
Ostrea puelchana
(Bivalvia) (31.5e33.7)
Polychaeta unident.
(14.65)
Pachycheles chubutensis
(Brachyura) (30.0e33.4)
Paraeuthria rosea
(Gastropoda) (20.2e33.5)
Polynoidae unident.
(30.2e33.6)Pagurus criticornis
(Anomura) (22.8e33.6)
Pitaria rostrata
(Bivalvia) (13.3e33.6)
Sabellaria bellis
(31.5)
Pagurus exilis
(Anomura) (20.3e33.7)
Pyrene isabellei
(Gastropoda) (13.7)
Sabellidae unident.
(31.5)
Panopeus meridionalis
(Brachyura) (31.5e33.7)
Semele casali
(Bivalvia) (22.8e33.6)
Serpulidae unident.
(32.1e33.8)
Pelia rotunda
(Brachyura) (30.5e31.5)Turbonilla uruguayensis
(Gastropoda) (13.7e33.6)Spionidae unident.
(15.1e31.5)
Pilumnoides hassleri
(Brachyura) (31.5)
Zidona dufresnei
(Gastropoda) (30.5)
Syllidae unident.
(33.7)

7D.A. Giberto et al. / Estuarine, Coastal and Shelf Science 61 (2004) 1e13
Table 1 (continued )
Crustaceans Mollusks Polychates Others
Pilumnus reticulatus
(Brachyura) (31.5)
Terebellides lanai
(32.3)
Pinnixa brevipollex
(Brachyura) (13.7e33.8)
Travisia sp.
(15.1)
Pinnixa patagoniensis
(Brachyura) (20.3e32.4)
Pinnotheres garthi
(Brachyura) (33.3)
Pontocaris boschii
(Decapoda) (32.4e33.8)
Scalpellum sp.
(Cirripedia) (33.8)
Serolis bonaerensis
(Isopoda) (33.8)
Serolis gaudichaudi
(Isopoda) (33.8)
Serolis marplatensis
(Isopoda) (22.8e33.7)
Serolis polaris
(Isopoda) (31.5e33.8)
Sphaeroma sp.
(Isopoda) (33.6)
Tanaidacea unident.
(Tanaidacea) (32.4)
CEZCoelenterata, ECZEchinodermata.
while higher values of mean biomass of echinodermswere found in Area 2 (p! 0:001) (Fig. 4). Mollusks andcrustaceans were dominants in terms of abundancewithin each area (p! 0:001).
The two-way ANOVA also showed significant differ-ences among feeding guilds (see Fig. 5), both in abun-dance (F ¼ 33:158, p ¼ 0:004) and biomass (F ¼ 26:419,p! 0:001), but not for areas (F ¼ 2:967, p ¼ 0:087, and
Table 2
Total abundance (ind. km�2) and biomass (g km�2) of species that comprise the 90% of the total abundance or biomass at the Rıo de la Plata estuary
and adjacent shelf waters
Identified taxa Abundance Biomass % Abundance % Biomass
Crustacea 48 4136 1899.12 29.85 13
Artemesia longinaris 3237 1091.91 23.37 7.48
Serolis marplatensis 256 14.45 1.85 0.10
Libinia spinosa 52 641.56 0.38 4.39
Annelida (Polychaeta) 33 326 89.72 2.35 0.61
Onuphis tenuis 141 0.96 1.02 0.01
Mollusca 31 9087 9626.10 65.59 65.9
Mactra isabelleana 425 6624.71 30.71 45.35
Buccinanops duartei 1077 1025.72 7.78 7.02
Corbula patagonica 1673 480.38 12.08 3.29
Pitaria rostrata 145 420.33 1.04 2.88
Buccinanops cochlidium 10 223.86 0.07 1.53
Nucula puelcha 361 142.84 2.61 0.98
Heleobia australis 1155 4.89 8.34 0.03
Cnidaria 10 70 291.71 0.51 2.00
Renilla sp.* 64 243.96 0.46 1.67
Echinodermata 6 232 2691.04 1.68 18.42
Encope emarginata 100 1654.11 0.72 11.32
Patiria stilifer 46 825.29 0.34 5.65
Astropecten b. brasiliensis 31 187.77 0.22 1.29
Tunicata 2 0 8.69 e 0.06
Bryozoa 2 0 0.04 e !0.01
Porifera 1 0 0.35 e !0.01
Pycnogonida 1 2 0.24 0.01 !0.01
Total 134 13,853 14,607.0 100 100
Number of taxa per main groups is also given. *Each main colony considered as one individual.

8 D.A. Giberto et al. / Estuarine, Coastal and Shelf Science 61 (2004) 1e13
F ¼ 1:353, p ¼ 0:246), and with also a significant inter-action term area! feeding guild for abundance (F ¼9:295, p! 0:0001) and biomass (F ¼ 11:495, p! 0:0001)(Fig. 5). Area 1 was characterized by larger mean bio-mass of deposit feeders (Tukey test, p! 0:001), whilemean abundance values between both areas weremarginally significant (p ¼ 0:07). Filter and suspensionfeeders (FS) were more abundant at Area 2 (p ¼ 0:002).
4.3. Influence of environmental gradients
Results of the ManneWhitney U test (p! 0:001)confirmed that stations of Area 1 were characterized bylower depths (13.5G 4.38 m vs. 22.52G 7.20 m) andsalinity (7.36G 7.25 vs. 19.53G 3.38) values, and withhigher frontal densities (3.7G 3.04 vs. 0.51G 1.22) thanthe stations of Area 2. Temperature was similar(p ¼ 0:12) between both areas (10.3G 0.67 (C vs.10.8G 1.21 (C).
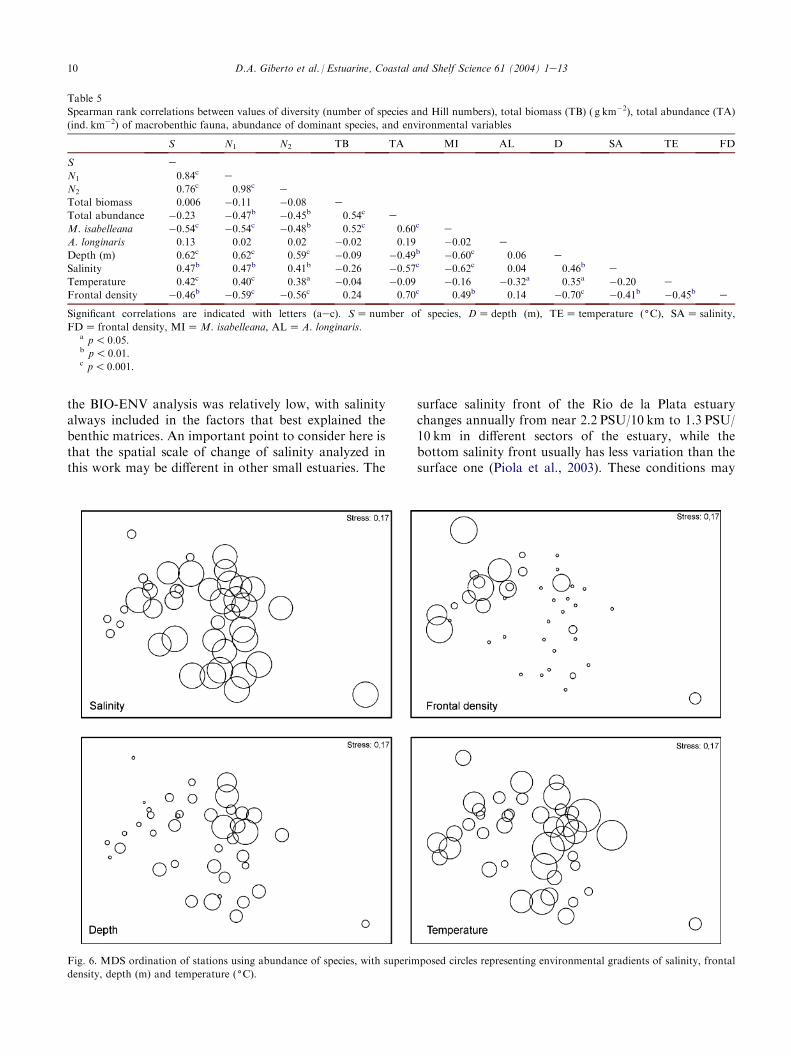
Total abundances of invertebrate taxa and Mactraisabelleana were positively correlated with frontaldensity and negatively correlated with depth and salinity(Table 5). Higher values of biomass are correlated with
Table 3
Discriminating species determined using the SIMPER (‘‘similarity
percentages’’) analysis
Species Area 1 Area 2 Area 1 vs. Area 2
Mactra isabelleana 45.70 e 30.60
Artemesia longinaris 36.72 59.86 21.35
Buccinanops duartei 8.50 e 9.76
Corbula patagonica 6.27 8.22 13.04
Heleobia australis 1.33 e 5.72
Serolis marplatensis e 9.43 2.04
Nucula puelcha e 3.58 2.31
Total 98.52 84.16 84.83
Species % contribution to average similarity within groups (Area 1 and
Area 2), and average dissimilarity between groups (Area 1 vs. Area 2)
are given. Total is the % contribution to similarity accumulated for
each group and % contribution to dissimilarity between groups.
the presence of M. isabelleana (Table 5). Measures ofdiversity (species richness, N1 and N2) were positivelycorrelated with depth, salinity and temperature, andnegatively correlated with frontal density (Table 5).
Gradients of environmental variables were clearlyobserved when they were superimposed in turn on theabundance matrix ordination (Fig. 6). The matching ofthe environmental and faunal matrices (BIO-ENVanalysis) is outlined in Table 6. Correlation valuesbetween variables and biotic matrices are generally low,and no single variable provided the best correlation withbiotic patterns. The single abiotic variable which bestexplained the abundances patterns was frontal density,while the best combination included three variables:salinity, temperature and frontal density (Table 6).Similar results were obtained for diversity patterns. Inthe case of biomass, the best combinations of variablesincluded salinity and temperature, while the variablesthat best explained the abundances of Mactra isabellea-na and Artemesia longinaris always included salinity(Table 6).
5. Discussion
Some methodological constraints of our data need tobe considered before discussing them.
Table 4
Mean values of stations (s.d. in brackets) and significance levels for
ManneWhitney U Test of diversity measures from Area 1 and Area 2
(nZ number of stations)
Variable Area 1 (n ¼ 16) Area 2 (n ¼ 25)
Richness: Margalef’s index*** 0.87 (0.36) 2.68 (1.28)
Diversity: Hill N1*** 2.66 (1.04) 7.86 (4.74)
Evenness: Pielou’s index J#** 0.47 (0.21) 0.67 (0.19)
Dominance: Hill N2*** 2.13 (0.76) 5.36 (3.34)
ManneWhitney U testZ **p! 0:01, ***p! 0:001.
Fig. 3. MDS ordination of dominant species (O10% at any site) using data of abundance (a) and biomass (b). Typical species defined in the SIMPER
analysis for Area 1 ( ) and Area 2 ( ) are also given.

9D.A. Giberto et al. / Estuarine, Coastal and Shelf Science 61 (2004) 1e13
Fig. 4. Abundance and biomass mean percentages per site (s.d. in brackets) according to areas and taxonomic identity. Asterisks indicate the average
values of taxonomic groups that were significantly different between areas (p! 0:001, two-way ANOVAdarea and taxonomic identity as classification
factorsdfollowed by a Tukey test). MOLZmollusks, POLZ polychaetes, CRUZ crustaceans, ECHZ echinoderms, CNZ cnidarians.
The gear used to sample macrobenthos does not pro-vide estimates of absolute densities. However, we calcu-lated the swept area of every sample using the shipspeed, gear frame size and duration of every haul. Theabundance and biomass values found at the study areawere markedly lower than those reported for other tem-perate estuaries using box corers and grabs (Atrill et al.,1996; Platell and Potter, 1996). The lower estimates ofboth density and biomass are possibly a consequence ofthe procedure used to obtain these values (calculatedwithout the correction of the average gear efficiency)and a gear-bias (see Huberdeau and Brunel, 1982). How-ever, results obtained by this procedure are useful tocompare estimates of abundance and biomass of thewhole sampling area.
Estuarine benthic communities have been studied ata variety of scales, although most studies to date aregenerally from small to medium size estuarine systems(!500 km2) (Day et al., 1989; Atrill et al., 1996; Platelland Potter, 1996; Constable, 1999). This work is the firstattempt to present a comparative analysis of spatialpatterns of benthic assemblages from this large SouthAmerican estuarine system (32,000 km2). Despite great-er differences in the scale of change, the overall diversity
trends observed in the present work are in coincidence(at least qualitative) with the early predictions ofRemane and Schlieper (1971). These authors, based ondata from estuaries of the Baltic area and the North Sea,considered salinity itself, or changes in the salinity, themain factor responsible for the lower diversity of mix-ohaline waters. The benthic assemblages of the Rıo de laPlata estuary (sites of ‘‘Area 1’’, see Fig. 2) were lessdiverse than adjacent marine areas and had highestdensities and biomass. This reflects a characteristic pat-tern found in most investigations that describe, despitethe fact that more factors are involved, the macro-benthic communities like gradual changes along a salin-ity gradient (Gaston et al., 1998). In contrast to marinewaters, the estuarine sites were characterized by lowersalinity values and depth, higher frontal densities andhomogeneous muddy bottoms. Similar results were ob-tained in smaller estuaries of temperate areas, in whichthe influence of the depth, salinity and bottom type hadan important effect in the spatial distribution anddiversity of the fauna (Aller and Stupakoff, 1996; Atrillet al., 1996; Platell and Potter, 1996; Brown et al.,2000). However, the correlation between environ-mental variables and the biotic patterns observed in
Fig. 5. Abundance and biomass mean percentages (s.d. in brackets) according to areas and feeding guilds. Asterisks indicate the average values of
feeding guilds that were significantly different between areas (p! 0:001, two-way ANOVAdarea and feeding guilds as classification
factorsdfollowed by a Tukey test). DFZ deposit feeders, F/SZ filter or suspension-feeders, C/SZ carnivores-scavengers, OMZ omnivores and
HEZ herbivores.
10 D.A. Giberto et al. / Estuarine, Coastal and Shelf Science 61 (2004) 1e13
Table 5
Spearman rank correlations between values of diversity (number of species and Hill numbers), total biomass (TB) ( g km�2), total abundance (TA)
(ind. km�2) of macrobenthic fauna, abundance of dominant species, and environmental variables
S N1 N2 TB TA MI AL D SA TE FD
S e
N1 0.84c e
N2 0.76c 0.98c eTotal biomass 0.006 �0.11 �0.08 e
Total abundance �0.23 �0.47b �0.45b 0.54c e
M. isabelleana �0.54c �0.54c �0.48b 0.52c 0.60c eA. longinaris 0.13 0.02 0.02 �0.02 0.19 �0.02 e
Depth (m) 0.62c 0.62c 0.59c �0.09 �0.49b �0.60c 0.06 e
Salinity 0.47b 0.47b 0.41b �0.26 �0.57c �0.62c 0.04 0.46b e
Temperature 0.42c 0.40c 0.38a �0.04 �0.09 �0.16 �0.32a 0.35a �0.20 eFrontal density �0.46b �0.59c �0.56c 0.24 0.70c 0.49b 0.14 �0.70c �0.41b �0.45b e
Significant correlations are indicated with letters (aec). SZ number of species, DZ depth (m), TEZ temperature ((C), SAZ salinity,
FDZ frontal density, MIZM. isabelleana, ALZA. longinaris.a p! 0:05.b p! 0:01.c p! 0:001.
the BIO-ENV analysis was relatively low, with salinityalways included in the factors that best explained thebenthic matrices. An important point to consider here isthat the spatial scale of change of salinity analyzed inthis work may be different in other small estuaries. The
surface salinity front of the Rıo de la Plata estuarychanges annually from near 2.2 PSU/10 km to 1.3 PSU/10 km in different sectors of the estuary, while thebottom salinity front usually has less variation than thesurface one (Piola et al., 2003). These conditions may
Fig. 6. MDS ordination of stations using abundance of species, with superimposed circles representing environmental gradients of salinity, frontal
density, depth (m) and temperature ((C).

11D.A. Giberto et al. / Estuarine, Coastal and Shelf Science 61 (2004) 1e13
indicate lower salinity stress compared to smallerestuaries, where extreme salinity fluctuations in shorterdistances could be found. Also, the low correlationsfound in the BIO-ENV analysis may be indicating thatother variables are affecting benthic assemblages, e.g.organic matter, oxygen or sediment grain size. Thechanges in diversity and spatial distribution of benthicfauna, between both marine and estuarine waters, mayreflect differences in ecosystem processes, such asproductivity, pathways of energy and material flow,disturbance regime and biological interactions (Brownet al., 2001).
The results of this study are in concordance withGaston et al. (1998), who found that generally, trophic
Table 6
Combinations of n variables giving the largest rank Spearman
correlations between biotic (abundanceebiomass data, BrayeCurtis
similarity), diversity ((Hill number N1, BrayeCurtis similarity),
abundance of Mactra isabelleana and Artemisia longinaris (Braye
Curtis similarity) and environmental (Euclidean distance) similarity
matrices (BIO-ENV analysis)
Data n Spearman’s
correlation
coefficient (rw)
Variables
Abundance 1 0.29 Frontal density
0.26 Salinity
0.22 Depth
0.06 Temperature
2 0.35 Salinity, frontal density
0.30 Temperature, frontal density
3 0.36 Salinity, temperature,
frontal density
0.23 Depth, salinity,
frontal density
Biomass 1 0.30 Salinity
0.22 Depth
0.17 Frontal density
0.13 Temperature
2 0.35 Salinity, temperature
0.26 Salinity, frontal density
3 0.27 Salinity, temperature,
frontal density
0.24 Depth, salinity, temperature
Diversity (N1) 1 0.22 Frontal density
0.21 Depth
2 0.26 Salinity, frontal density
3 0.28 Salinity, temperature,
frontal density
M. isabelleana 1 0.38 Salinity
2 0.40 Salinity, temperature
3 0.25 Salinity, temperature,
frontal density
A. longinaris 1 0.23 Frontal density
2 0.24 Salinity, frontal density
3 0.24 Salinity, temperature,
frontal density
Salinity, temperature ((C), and frontal density were logðxC1Þtransformed. Bold type indicates overall optimum. Lower correlations
are omitted from the table.
diversity increased with salinity, meaning that a moreeven distribution of trophic structure is found at highersalinities. Higher biomass values of deposit feeders, likeMactra isabelleana, and carnivore gastropods likeBuccinanops duartei characterized the estuarine area.In contrast, species of the marine area presented variousfeeding types, such as filter feeders (Corbula patagonica,Nucula puelcha), carnivores (Astropecten b. brasiliensis,Serolis marplatensis), herbivores (Chaetopleura isabellei)or suspension feeders (Pagurus exilis, Pagurus criticor-nis). Artemesia longinaris, an omnivorous decapod, waswidely distributed along the study area. In this study,suspension feeders were confined to sandy or compactbottoms at the marine area, while deposit feedersattained high densities and biomass on soft shallowmuddy substrata at the estuarine area, in a similar wayto that suggested by Rhoads and Young (1970). Thisdominance of different trophic groups suggests differ-ences in the availability of resources and in theinteractions of food webs (Brown et al., 2000).
Soft-sediment communities containing high densitiesof deposit-feeding species, that support predatory andscavenging species, are sustained by high deposition oforganic carbon (Lenihan and Micheli, 2001). The majorfood source for most soft-sediments deposit feeders isthe organic matter, in the form of phytoplankton orresidual material (e.g., zooplankton feces, bacteria)generated by zooplankton grazing, decomposition, andother processes in the water column (Lenihan andMitcheli, 2001). Reduced light availability owing tohigh-suspended sediments limits phytoplankton primaryproduction in the Rıo de la Plata estuary (Boschi, 1988).The reduction in the primary production by highfreshwater input and suspension sediment load has beenobserved in other microtidal and turbid estuaries(Monbet, 1992; Bianchi et al., 1997; Eyre and Balls,1999). Carbon inputs reaching bottom sediments of suchestuaries are mainly derived from allochthonous sour-ces, since phytoplanktonic production is constrained(Bianchi et al., 1997). Contrary to other similar tropicaland subtropical ecosystems, no mangroves, sea grassesor benthic macroalgae are present in the Rıo de la Plataestuarine ecosystem (Boschi, 1988). Therefore, possiblefood supplies for higher benthic biomasses found at theestuarine area are organic matter of detritus producedby salt-marsh grasses and other halophytic plantspresented along the coast (Boschi, 1988), other terres-trial sources transported by river waters, and from highaggregations of zooplankton found below the haloclineat the head of the salt wedge, represented mainly by thecopepod Acartia tonsa (up to 8000 ind. m�3). Highconcentrations of detritus biomass, tintinnids, andbacteria seem to constitute the main energy supply forthis omnivorous copepod (Mianzan et al., 2001).
The high frontal density values of the turbidity frontfound at the estuary probably affect the number of

12 D.A. Giberto et al. / Estuarine, Coastal and Shelf Science 61 (2004) 1e13
species capable of surviving in the estuarine waters,lowering the biodiversity. Particle trapping in anestuarine turbidity maximum provides suspended par-ticulate matter concentrations 10e100 times as large asin adjacent regions (Fain et al., 2001). This high load ofsediments in suspension may explain the dominance ofdeposit feeders in the estuarine zone. Ellis et al. (2002)demonstrated that distribution of a suspension-feedingbivalve was negatively controlled by suspended sedimentconcentration.
Modifications in ctenidia, labial palpes, alimentarycanal and other morphological features are uniquecharacters that have evolved in the representatives ofthe Mactridae to exploit the deposit-feeding lifestyle,both intertidaly and subtidally, worldwide (Barnes andMorton, 1997). The spatial distribution of the dominantspecies, the Mactridae Mactra isabelleana, coincideswith the location of the maximum turbidity zone,reaching high densities and biomass near higher valuesof frontal density. This bivalve probably takes advan-tage of the high-suspended matter deposition at theturbidity front. In a similar way, M. isabelleana ispresent in Lagoa dos Patos (a large coastal lagoon inSouthern Brazil, 32(S), in an environment characterizedby a high degree of organic matter in suspension andwith slime-sandy bottoms in areas of high physicalinstability, forming associations of low diversity andhigh biomass (Capitoli, 1997; Garcia and Gianuca,1997).
Differing from the surrounding marine waters, thelow diverse areas of the estuary support importantbiomass of a few species of benthophagous fishes, likethe whitemouth croaker that preys on bivalves, poly-chaetes and shrimps (Puig, 1986; Sanchez et al., 1991;Giberto et al., submitted for publication). In this study,the presence of the turbidity front and salinity fluctua-tions, throughout high sediment deposition and floccu-lation areas, may be the main factors responsible for thephysical variables acting on the benthic communities ofthe Rıo de la Plata estuary. Anthropogenic factors, notassessed yet, that may also affect community structure inthe study area are bottom trawling fisheries, debris andagricultural and industrial wastes (see Mianzan et al.,2001; Acha et al., 2003).
Acknowledgements
This work was partially supported by FundacionAntorchas no. 13817-5 and Agencia Nacional dePromocion Cientıfica y Tecnologica PICT 2000 no.8424 to HWM. The authors greatly appreciate thecritical comments of Natalia Murillo, Andres Jauregui-zar and Agustın Schiariti that improved the manuscript.This is INIDEP contribution No. 1331.
References
Acha, E.M., Mianzan, H.W., Iribarne, O., Gagliardini, D.A., Lasta,
C., Daleo, P., 2003. The role of the Rıo de la Plata bottom salinity
front in accumulating debris. Marine Pollution Bulletin 46 (2),
197e202.
Aller, J.Y., Stupakoff, I., 1996. The distribution and seasonal
characteristics of benthic communities on the Amazon shelf as
indicators of physical processes. Continental Shelf Research 16
(5/6), 717e751.Atrill, M., Ramsay, P., Thomas Myles, R., Trett, M., 1996. An
estuarine biodiversity hot-spot. Journal of Marine Biology
Association of the United Kingdom 76, 161e175.
Barnes, P.A.G., Morton, B., 1997. The functional morphology of
Mactrinula reevesii (Bivalvia: Mactroidea) in Hong Kong: adapta-
tions for a deposit-feeding lifestyle. Journal of Zoology 241 (1),
13e34.
Bianchi, T.S., Baskaran, M., Delord, J., Ravichandran, M., 1997.
Carbon cycling in a shallow turbid estuary of southeast Texas: the
use of plant pigment biomarkers and water quality parameters.
Estuaries 20 (2), 404e415.Boschi, E.E., 1988. El ecosistema estuarial del Rıo de la Plata
(Argentina y Uruguay). Anales del Instituto de Ciencias del Mar y
Limnologıa de la Universidad Nacional Autonoma de Mexico 15
(2), 159e182.Brown, S., Gaston, G., Rakocinski, C., Heard, R., 2000. Effects of
sediment contaminants and environmental gradients on macro-
benthic community trophic structure in Gulf of Mexico estuaries.
Estuaries 23 (3), 411e424.Brown, J.H., Morgan Ernest, S.K., Parody, J.M., Haskell, J.P., 2001.
Regulation of diversity: maintenance of species richness in
changing environments. Oecologia 126, 321e332.
Capitoli, R., 1997. Continental shelf benthos. In: Seeliger, U.,
Odebrecht, C., Castello, J.P. (Eds.), Subtropical Convergence
Environments: the Coast and Sea in the Southwestern Atlantic.
Springer-Verlag, Berlin, pp. 117e120.Clarke, K.R., 1993. Non-parametric multivariate analysis of changes
in community structure. Australian Journal of Ecology 18,
117e143.
Clarke, K.R., Ainsworth, M., 1993. A method of linking multivariate
community structure to environmental variables. Marine Ecology
Progress Series 92, 205e219.
Clarke, K.R., Warwick, R.M., 2001. Change in marine communities:
an approach to statistical analysis and interpretation, second ed.
PRIMER-E, Plymouth.
Constable, A.J., 1999. Ecology of benthic macro-invertebrates in
soft-sediment environments: a review of progress towards quanti-
tative models and predictions. Australian Journal of Ecology 24,
452e476.
Day Jr., J.W., Hall, C.A.S., Kemp, W.M., Yanez-Arancibia, A., 1989.
Estuarine Ecology. John Wiley and Sons, New York, 558 pp.
Eyre, B., Balls, P., 1999. A comparative study of nutrient behavior
along the salinity gradient of tropical and temperate estuaries.
Estuaries 22 (2A), 313e326.
Ellis, J., Cummings, V., Hewitt, J., Thrush, S., Norkko, A., 2002.
Determining effects of suspended sediment on condition of
a suspension feeding bivalve (Atrina zelandica): results of a survey,
a laboratory experiment and a field transplant experiment. Journal
of Experimental Marine Biology and Ecology 267, 147e174.Fain, A.M.V., Jay, D.A., Wilson, D.J., Orton, P.M., Baptista, A.M.,
2001. Seasonal and tidal monthly patterns of particulate matter
dynamics in the Columbia River estuary. Estuaries 24 (5),
770e786.
Fauchald, K., Jumars, P., 1979. The diet of worms: a study of
polychaete feeding guilds. Oceanography and Marine Biological
Annual Review 17, 193e284.
13D.A. Giberto et al. / Estuarine, Coastal and Shelf Science 61 (2004) 1e13
Field, J.G., Clarke, K.R., Warwick, R.M., 1982. A practical strategy
for analyzing multispecies distribution patterns. Marine Ecological
Progress Series 8, 37e52.
Framinan, M.B., Brown, O.B., 1996. Study of the Rıo de la Plata
turbidity front, Part I: spatial and temporal distribution. Conti-
nental Shelf Research 16, 1259e1282.
Framinan, M.B., Etala, P., Acha, E.M., Guerrero, R.A., Lasta, C.A.,
Brown, O.B., 1999. Physical characteristics and processes of the
Rıo de la Plata estuary. In: Perillo, G., Piccolo, M., Pino, M.
(Eds.), Estuaries of South America: their Geomorphology and
Dynamics. Springer-Verlag, Berlin, pp. 161e194.
Garcia, V., Gianuca, N., 1997. The beach and surf zone. In: Seeliger,
U., Odebrecht, C., Castello, J.P. (Eds.), Subtropical Convergence
Environments: the Coast and Sea in the Southwestern Atlantic.
Springer-Verlag, Berlin, pp. 166e170.
Gaston, G., Rakocinski, C., Brown, S., Cleveland, C., 1998. Trophic
function in estuaries: response of macrobenthos to natural and
contaminant gradients. Marine and Freshwater Research 49,
833e846.Giberto, D.A., 2001. Fondos de alimentacion de la corvina rubia en el
estuario del Rıo de la Plata. M.Sc. Thesis, Universidad Nacional de
Mar del Plata, 83 pp.
Giberto, D.A., Bremec, C.S., Acha, E.M., Mianzan, H.W. Feeding
ecology of the whitemouth croaker Micropogonias furnieri (Pisces:
Sciaenidae) in the Rıo de la Plata estuary. Marine and Freshwater
Research, submitted for publication.
Gray, J.S., 2000. The measurement of marine species diversity, with an
application to the benthic fauna of the Norwegian continental shelf.
Journal of Experimental Marine Biology and Ecology 250, 23e49.
Gray, J.S., 2001. Antartic marine benthic biodiversity in a world-wide
latitudinal context. Polar Biology 24, 633e641.
Hill, M.O., 1973. Diversity and evenness: a unifying notation and its
consequences. Ecology 54 (2), 427e432.
Huberdeau, L., Brunel, P., 1982. Efficacite et selectivite faunistique
comparee de quatre appareils de prelevements endo-, epi- et supra-
benthiques sur deux types de fonds. Marine Biology 69, 331e343.
Lenihan, H.S., Micheli, F., 2001. Soft-sediment communities. In:
Bertness, M.D., Gaines, S.D., Hay, M.E. (Eds.), Marine Commu-
nity Ecology. Sinauer Associates, Inc., pp. 253e287.
Mianzan,H., Lasta, C., Acha, E., Guerrero,R.,Macchi,G., Bremec, C.,
2001. The Rıo de la Plata estuary, ArgentinaeUruguay. In: Seeliger,
U., de Lacerda, L.D., Kjerve, B. (Eds.), Coastal Marine Ecosystems
of Latin America. Springer-Verlag, Berlin, pp. 185e204.
Monbet, Y., 1992. Control of phytoplankton biomass in estuaries:
a comparative analysis of microtidal and macrotidal estuaries.
Estuaries 15 (4), 563e571.
Piola, A.R., Guerrero, R., Osiroff, A.P., Molinari, G., 2003.
Climatologıa de frentes y estratificacion del Rıo de la Plata. Vo.
Jornadas Nacionales de Ciencias del Mar, Mar del Plata,
Argentina, 8e12 December (extended abstract).
Platell, M., Potter, I., 1996. Influence of water depth, season, habitat
and estuary location on the macrobenthic fauna of a seasonally
closed estuary. Journal of the Marine Biological Association of the
United Kingdom 76, 1e21.
Post, D.M., 2002. The long and short of food chain length. Trends in
Ecology and Evolution 17 (6), 269e277.
Puig, P., 1986. Analisis de contenidos estomacales de corvina blanca
(Micropogon opercularis) Sciaenidae, Perciformes). Verano 1984.
Publicacion de la Comision Tecnica Mixta del Frente Marıtimo
1 (2), 333e340.
Remane, A., Schlieper, C., 1971. Biology of Brackish Water. John
Wiley and Sons, New York, 372 pp.
Rhoads, D.C., Young, D.K., 1970. The influence of deposit-feeding
organisms on sediment stability and community trophic structure.
Journal of Marine Research 28 (2), 151e178.
Rothlisberg, P.C., Pearcy, W.C., 1977. An epibenthic sampler used to
study the ontogeny of vertical migration of Pandalus jordani
(Decapoda, Caridea). Fisheries Bulletin 74, 994e997.
Sanchez, M.F., Mari, N., Lasta, C., Giangiobbe, A., 1991. Alimenta-
cion de la Corvina Rubia (Micropogonias furnieri) en la Bahıa
Samborombon. Frente Marıtimo 8, 43e50.
Urien, C.M., 1972. Rıo de la plata estuarine environment. The
Geological Society of America Memoir 133, 213e233.Wolff, W.J., 1992. Estuarine benthos. In: Ketchum, B.H. (Ed.),
Estuaries and enclosed seas. Ecosystems of the World, 26, Elsevier
Science Publishers, pp. 151e77.
Zar, J.H., 1984. Biostatistical Analysis, second ed. Prentice-Hall Inc.,
Englewood Cliffs.
Top Related
Copyright © 2022 FDOKUMEN

