


Bahasa
Halaman
Hukum


Large Expression Differences in Genes for Iron and ZincHomeostasis, Stress Response, and Lignin BiosynthesisDistinguish Roots of Arabidopsis thaliana and theRelated Metal Hyperaccumulator Thlaspi caerulescens1[W]
Judith E. van de Mortel, Laia Almar Villanueva, Henk Schat, Jeroen Kwekkeboom, Sean Coughlan,Perry D. Moerland, Emiel Ver Loren van Themaat, Maarten Koornneef, and Mark G.M. Aarts*
Laboratory of Genetics, Wageningen University, 6703 BD Wageningen, The Netherlands (J.E.v.d.M., L.A.V.,M.K., M.G.M.A.); Institute of Ecological Sciences, Faculty of Earth and Life Sciences, Vrije Universiteit,1081 HV Amsterdam, The Netherlands (H.S.); ServiceXS BV, 2333 AL Leiden, The Netherlands (J.K.);Agilent Technologies, Little Falls Site, Wilmington, Delaware 19808–1644 (S.C.); and BioinformaticsLaboratory, Department of Clinical Epidemiology, Biostatistics and Bioinformatics, Academic MedicalCenter, University of Amsterdam, 1100 DD Amsterdam, The Netherlands (P.D.M., E.V.L.v.T.)
The micronutrient zinc has an essential role in physiological and metabolic processes in plants as a cofactor or structuralelement in 300 catalytic and noncatalytic proteins, but it is very toxic when available in elevated amounts. Plants tightlyregulate their internal zinc concentrations in a process called zinc homeostasis. The exceptional zinc hyperaccumulator speciesThlaspi caerulescens can accumulate up to 3% of zinc, but also high amounts of nickel and cadmium, without any sign of toxicity.This should have drastic effects on the zinc homeostasis mechanism. We examined in detail the transcription profiles of roots ofArabidopsis thaliana and T. caerulescens plants grown under deficient, sufficient, and excess supply of zinc. A total of 608 zinc-responsive genes with at least a 3-fold difference in expression level were detected in A. thaliana and 352 in T. caerulescens inresponse to changes in zinc supply. Only 14% of these genes were also zinc responsive in A. thaliana. When comparingA. thaliana with T. caerulescens at each zinc exposure, more than 2,200 genes were significantly differentially expressed ($5-foldand false discovery rate , 0.05). While a large fraction of these genes are of yet unknown function, many genes with a differentexpression between A. thaliana and T. caerulescens appear to function in metal homeostasis, in abiotic stress response, and inlignin biosynthesis. The high expression of lignin biosynthesis genes corresponds to the deposition of lignin in the endodermis,of which there are two layers in T. caerulescens roots and only one in A. thaliana.
Micronutrients are essential for humans, plants, andanimals. The micronutrient zinc plays an importantrole in physiological and metabolic processes ofplants (Ramesh et al., 2004). Zinc serves as a cofactorfor more than 300 enzymes, including RNA polymer-ase, alcohol dehydrogenase, copper/zinc superoxidedismutase, and carbonic anhydrase (Guerinot andEide, 1999). Zinc is essential but is toxic when availableto the plant in elevated amounts; therefore, plantsneed to keep very tight control over the internalconcentrations of zinc in a process called zinc homeo-stasis.
Although the zinc homeostasis mechanism is sup-posed to be universal within plants, there are speciesthat can accumulate large amounts of zinc withoutany sign of toxicity. Species accumulating more than10,000 mg zinc g21 dry weight (DW; 1% [w/w]) are calledzinc hyperaccumulators (Baker and Brooks, 1989). As acomparison, most plants contain between 30 and100 mg zinc g21 DW and concentrations above 300 mgzinc g21 DW are generally toxic (Marschner, 1995).More than 400 metal hyperaccumulator species from awide range of unrelated families have been described.About 15 of these are zinc hyperaccumulators (Bakeret al., 1992; Brooks, 1994). They are mainly, though notexclusively, found to grow on calamine soils contam-inated with lead, zinc, or cadmium (Meerts and VanIsacker, 1997; Schat et al., 2000; Bert et al., 2002). Thlaspicaerulescens J. & C. Presl (Brassicaceae) is one of thesenatural zinc hyperaccumulator species. In additionto zinc, it can also hyperaccumulate cadmium andnickel. It is a self-compatible species, showing variablerates of outcrossing in nature. T. caerulescens is closelyrelated to Arabidopsis thaliana L. Heynh., with on average88.5% DNA identity in coding regions (Rigola et al.,2006) and 87% DNA identity in the intergenic tran-scribed spacer regions (Peer et al., 2003). As in most metal
1 This work was supported by the NWO (Programma Genomicsgrant no. 050–10–166 to J.E.v.d.M.), the European Union PHYTACproject (QLRT–2001–00429), and the European Union RTN-Metalhomeproject (HPRN–CT–2002–00243; H.S. and M.G.M.A.).
* Corresponding author; e-mail [email protected]; fax 31–317–483146.
The author responsible for distribution of materials integral to thefindings presented in this article in accordance with the policydescribed in the Instructions for Authors (www.plantphysiol.org) is:Mark G.M. Aarts ([email protected]).
[W] The online version of this article contains Web-only data.www.plantphysiol.org/cgi/doi/10.1104/pp.106.082073
Plant Physiology, November 2006, Vol. 142, pp. 1127–1147, www.plantphysiol.org � 2006 American Society of Plant Biologists 1127

hyperaccumulators, the zinc concentration in shoot tissueof T. caerulescens is often higher than in root tissue (Lasatet al., 1996; Shen et al., 1997; Schat et al., 2000).
The complex network of homeostatic mechanismsthat evolved in plants to control the uptake, accumu-lation, trafficking, and detoxification of metals (Clemens,2001) also applies for metal hyperaccumulators. Ingeneral, this network involves three major compo-nents: transport, chelation, and sequestration. Whilethe physiology of metal hyperaccumulation is alreadyunderstood fairly well (Clemens et al., 2002), the under-lying molecular genetics is still not explored in fulldetail. Previously published transcript-profiling studieson copper, zinc, and iron deficiency in A. thaliana (Wintzet al., 2003) and comparative analysis of A. thaliana withthe zinc- and cadmium-hyperaccumulating Arabidopsishalleri (Becher et al., 2004; Weber et al., 2004) using firstgeneration Affymetrix chips representing a subset ofonly 8,300 of the approximately 30,000 Arabidopsisgenes already identified several genes to respond tozinc deficiency in A. thaliana. These analyses also re-vealed that the transcriptional regulation of many genesis strikingly different in A. halleri compared to A. thaliana.
In this report, we describe the analysis of threetranscript-profiling experiments, with the main aim ofestablishing which genes are most likely to be relevantfor adaptation to high zinc exposure in T. caerulescens.Therefore, we examined not only the response of rootsof both plant species to zinc deficiency, but also toexcess of zinc. We used an Agilent whole-transcriptome,60-mer oligo DNA microarray representing all anno-tated genes for A. thaliana (further referred to asArabidopsis) and some 10,000 nonannotated genomicregions with known transcriptional activity, thus cov-ering nearly the complete Arabidopsis transcriptome.In the intraspecific comparison, we identified theArabidopsis and T. caerulescens genes that are differen-tially expressed a week after transferring the plants tolow or high zinc supply. These are relevant in deter-mining differences in the zinc homeostasis networkbetween the two species. We also compared the differ-ences in transcription between the two species at zincdeficiency, sufficiency, and excess supply conditions toidentify the genes that are significantly more highlyexpressed in the hyperaccumulating species comparedto Arabidopsis. We finally examined all analyses toidentify any particular processes, biochemical path-ways, or gene classes that could play a particular role inthe adaptation to high zinc accumulation.
RESULTS
Experimental Design
To analyze the response of Arabidopsis and T.caerulescens to different zinc exposures, we aimed tocompare the transcript profile of plants grown undersufficient zinc supply with plants grown under zincdeficient conditions and excess zinc conditions. To
minimize variation in the bioavailability of zinc orother micronutrients, we used a hydroponic ratherthan soil-based culturing system. For both excess anddeficient zinc conditions, the induction of severe stressto the plants was avoided by exposing them for only1 week to these conditions. Arabidopsis plants (acces-sion Columbia) were established to grow on a nutrientsolution containing 2 mM ZnSO4, which is sufficient toyield healthy and robust plants with normal seed seteven after prolonged cultivation. After 3 weeks, theplants were transferred to fresh solutions for exposureto zinc deficiency (0 mM ZnSO4) and excess zinc (25 mM
ZnSO4). One-third of the plants remained at sufficientzinc (2 mM ZnSO4) as a control. From previous exper-iments (data not shown), we learned that plants con-tinue to grow in zinc deficient media, while deficiencysymptoms (chlorosis and necrosis) or toxicity symp-toms become obvious only after about 3 weeks. Uponharvesting root tissue, the plants growing on zincdeficient and sufficient medium did not show anyvisible phenotypic differences, whereas plants grow-ing on excess zinc showed a slight growth inhibition inthe roots (data not shown). At this stage, plants werenot flowering yet.
For T. caerulescens, a similar approach was taken.However, to properly compare the results between thetwo species, we aimed at maintaining comparablephysiological conditions. T. caerulescens accession LaCalamine is zinc tolerant as well as zinc hyperaccu-mulating and requires more zinc than Arabidopsis fornormal growth. Therefore, a hydroponic solutioncontaining 100 rather than 2 mM ZnSO4 was used togrow seedlings under zinc sufficient conditions. Toavoid any problems with possible precipitation of zincor other minerals, 1 mM ZnSO4 was used as the excesszinc exposure concentration, although we learnedfrom previous experiments that T. caerulescens LaCalamine is well able to withstand this exposure forseveral weeks. When root tissues were harvested after1-week exposure, the T. caerulescens plants showed noaltered phenotype that could be attributed to exposureto excess zinc or zinc deficiency.
Mineral Content in Arabidopsis and T. caerulescens
Zinc, iron, and manganese concentrations were de-termined in root and shoots of hydroponically grownArabidopsis and T. caerulescens plants grown at defi-cient, sufficient, and excess zinc. Comparison of themetal concentration levels between these two speciesalready displayed the typical difference between ametal hyperaccumulator and a metal nonaccumulator(Fig. 1). At low zinc supply (zinc deficiency), thedifference is not very pronounced, and although T.caerulescens clearly contains more zinc in the leaves,the concentration in the roots for both species isbetween 1.2 to 1.7 mmol g21 DW (Fig. 1A). At sufficientzinc supply, T. caerulescens accumulates about 3 timesmore zinc in the roots than Arabidopsis, and theconcentration in shoots is much higher (approximately
van de Mortel et al.
1128 Plant Physiol. Vol. 142, 2006

70-fold) than in Arabidopsis. At excess zinc, the zinc-exclusion strategy of Arabidopsis roots has collapsedand their zinc concentration is now about 4.5-foldhigher than in T. caerulescens; this is approximately15-fold higher compared to sufficient conditions inArabidopsis. At this high zinc supply, Arabidopsis isstill able to exclude zinc accumulation in the leaves,with a concentration about 9-fold lower than in T.caerulescens. For T. caerulescens, there is not muchdifference in both root and shoot concentrations ofplants growing at sufficient or excess zinc.
Since we expected that differences in zinc supplywould also affect the concentration of other metals, wemeasured the iron (Fig. 1B) and manganese (Fig. 1C)concentrations in the same material. Similar to zinc,
the iron concentration in the roots of both speciesincreases upon increase in zinc supply (Fig. 1BI). Atdeficient and sufficient zinc supply, the iron concen-tration in T. caerulescens is about 2- to 3-fold higherthan in Arabidopsis. At excess zinc supply, the rootiron concentrations are similar for both species. Gen-erally, the iron concentrations are much lower in leavesthan in roots. The iron concentration in leaves is similarfor the three T. caerulescens treatments, and this is onlymarginally higher in Arabidopsis under sufficientzinc supply (Fig. 1BII). In Arabidopsis leaves, the ironconcentration decreases marginally with increasingzinc supply.
For manganese, the situation is the opposite in roots.In T. caerulescens, the manganese concentration decreases
Figure 1. Zinc (A), iron (BI: roots; BII:leaves), and manganese (C) concentra-tions (mmol g21; mean 6 SE) in Arabi-dopsis and T. caerulescens roots (whitebars) and leaves (black bars). Plantswere grown for 3 weeks on nutrientsolution containing sufficient zinc be-fore exposure to zinc deficiency (0 mM
ZnSO4: Zn0), zinc sufficiency (2 or100 mM ZnSO4: Zn2/Zn100), and excesszinc (25 or 1,000 mM ZnSO4: Zn25/Zn1000).
Comparative Transcript Profiling of Thlaspi caerulescens
Plant Physiol. Vol. 142, 2006 1129

with increasing zinc supply and in Arabidopsis thisonly occurs upon excess zinc supply. The manganeseconcentration in T. caerulescens roots is about 5-foldhigher under zinc deficiency than in Arabidopsis, butat sufficient zinc supply there is hardly any differencebetween the species. There are only few differencesfor the manganese concentration in leaves betweenthe two species. Only at excess zinc, the manganeseconcentration in T. caerulescens decreases drasticallyby about 4-fold. Both T. caerulescens and Arabidopsisaccumulate manganese to a higher concentration inleaves than in roots, with the exception of T. caerules-cens grown under zinc deficiency.
Zinc Response in Arabidopsis
Genes responding to changes in zinc exposure con-ditions in Arabidopsis were identified using AgilentArabidopsis 3 60-mer oligonucleotide microarrays con-taining 37,683 probes representing more than 27,000annotated genes and more than 10,000 nonannotatedgenomic regions for which there is transcriptionalevidence. When analyzing the data, we only consid-ered the hybridization data of probes with P , 0.05.Only expression differences of $3-fold (between anyof the three treatments) were considered to be relevant,even though lower expression differences were statis-tically significant at P , 0.05. According to thesecriteria, we identified 608 zinc-responsive genes whencomparing the deficient, sufficient, and excess zinctreatments. As expected, most differences were foundbetween the most distant conditions, zinc deficiencyand excess zinc. Many genes that were differentiallyexpressed between zinc deficiency and sufficiency orbetween zinc sufficiency and excess zinc were alsodifferentially expressed between deficiency and excesszinc, whereas few genes were found to be only differ-entially expressed between both zinc deficiency andsufficiency, and sufficiency and excess zinc.
After hierarchical clustering (average linkage hier-archical clustering with uncentered correlation; Eisenet al., 1998) of all differentially expressed genes, fourmajor clusters were distinguished. Cluster I (Supple-mental Table S1) consists of 98 genes that are morelowly expressed under zinc deficiency compared tosufficient and excess zinc. Within this group, we findmany genes with a function related to stress responseand also several with metabolism-associated func-tions. Among the 10 genes most differentially ex-pressed between the zinc deficiency and sufficiencyexposures are three genes encoding small heat shockproteins. Other genes found in this cluster are genesencoding copper/zinc superoxide dismutases, a nodulin-like protein, a nitrate-responsive protein, an expansin-like protein, and a universal stress protein. The last oneis the most highly expressed gene at sufficient zincfound in this cluster. Fifteen genes in this cluster encodeproteins with an unknown function. Twenty probescorrespond to transcripts that were not annotated assuch in the Arabidopsis genome.
Cluster II (Table I; Supplemental Table S2) is a largecluster consisting of 128 genes. These genes are gen-erally more highly expressed under excess zinc con-ditions when compared to sufficient or deficient zincsupply. This cluster contains several metal homeostasis-related genes associated with iron rather than with zinchomeostasis. These genes encode metal transporters(IRT1, IRT2, ZIP8, MTP3, MTP8, NRAMP4, and IREG2),a nicotianamine (NA) synthase (NAS) gene (NAS1), aYS-like oligopeptide transporter (OPT3), and ferric-chelate reductases (FRO1, 2, and 3). Not only are metalhomeostasis genes found in this cluster, but also somestress response genes like a disease resistance gene. Inaddition, metabolic genes like PAL2 (which encodes akey enzyme acting early in the phenylpropanoid bio-synthesis pathway leading to flavonoids, anthocyanins,and lignins) and genes belonging to the cytochromeP450 family (CYP98A3, CYP82C2, CYP82C3, CYP82C4,CYP71B5, and CYP71B38) are found in this cluster.This cluster also contains a small set of genes encodingtranscription factors of the basic helix-loop-helix (bHLH),myb, and zinc-finger families.
Cluster III (Table II; Supplemental Table S3) consistsof 347 genes that are more highly expressed under zincdeficiency compared to the other two treatments.Many genes in this cluster, especially the ones thatshow the largest difference in expression between zincdeficiency and excess zinc, belong to metal homeosta-sis gene families encoding ZIP metal transporters, acation diffusion facilitator (MTP gene family), a PIB-type ATPase transporter (HMA gene family), two NASproteins (NAS), a MATE efflux protein (FRD3), twoferric-chelate reductase-like proteins (FRO4 and 5),ferritin (FER1), and two Yellow Stripe1-like proteins(YSL2 and 3). A surprisingly large fraction of 164 genesencodes proteins without a known function (83) orrepresent nonannotated transcripts (81). Three of thelatter are among the 10 most differentially expressedgenes when comparing the three zinc exposure con-ditions. Other genes identified in this cluster encodeproteins involved in protein stability (F-box proteins),signal transduction (calcineurin-like phosphoesterase,auxin response factor, calmodulin-binding proteins,calcium-binding protein, protein kinase), transcrip-tional regulation (MADS-box, zinc-finger, and bHLHproteins), and metabolism. Among the 10 genes withthe highest expression (at sufficient zinc), five encodeproteins with an unknown function (At5g19380,At5g16870, At2g16990, At3g15630, and At4g29905),one encodes a nonannotated transcript, and three areinvolved in transcriptional regulation (At1g72220,At3g01970, and At3g51080). Of the 10 most differen-tially expressed genes, FRO5, MTP2, NAS4, and IRT3have a supposed role in metal homeostasis based ontheir predicted function or their similarity to othergenes previously implicated in metal homeostasis.Only the superoxide dismutase is remarkably differ-entially expressed between all three treatments, de-creasing in expression upon increase of the zincconcentration in the medium.
van de Mortel et al.
1130 Plant Physiol. Vol. 142, 2006

Cluster IV (Supplemental Table S4) consists of 35genes that show a lower expression under excess zincexposure compared to deficient and sufficient zincexposures. Genes in this cluster are involved in (second-ary) metabolism, (a)biotic stress response, and transcrip-tion. Five genes in this cluster encode proteins with anunknown function. Nine genes were not annotated.
When comparing all three zinc exposure conditions,only genes encoding ferric-chelate reductases (FRO1and 5), two ZIP metal transporters (ZIP3 and 9),iron superoxide dismutase (FSD1), an oxidoreductase(At3g12900), an iron-sulfur cluster assembly complexprotein (At2g36260), cytochrome P450 CYP82C4, andan expressed protein (At3g59930) are differentially
Table I. Arabidopsis genes more highly expressed under excess (Zn25) zinc conditions when compared to sufficient (Zn2) or deficient(Zn0) zinc supply
Name Codea Putative Function GO Annotationb Zn0/Zn2c Zn0/Zn25c Zn2/Zn25c Intensityd
SAM1 At1g02500 S-Adenosylmethioninesynthetase 1
Other cellular, metabolic,physiological processes
0.98 0.31 0.31 62,719
GLP5 At1g09560 Germin-like protein Biological processunknown
0.64 0.11 0.18 27,296
At1g73120 Expressed protein Biological processunknown
0.85 0.30 0.35 13,274
FRO2 At1g01580 Ferric-chelate reductase Transport 0.27 0.02 0.06 12,522PAL2 At3g53260 Phenylalanine
ammonia-lyase 2Response to abiotic or
biotic stimulus1.00 0.28 0.28 12,379
At1g74760 Zinc-finger (C3HC4-typeRING finger) familyprotein
Protein metabolism 0.70 0.20 0.29 10,028
At4g13860 Gly-rich RNA-bindingprotein
Biological processunknown
0.39 0.15 0.38 7,988
At1g63090 F-box family protein Protein metabolism 0.39 0.11 0.30 7,941At5g45080 Disease resistance protein
relatedResponse to abiotic or
biotic stimulus0.62 0.24 0.39 7,650
At3g53480 ABC transporter familyprotein
Biological processunknown
0.74 0.28 0.38 7,391
NAS1 At5g04950 Nicotianamine synthase Other cellular, metabolic,physiological processes
2.63 0.62 0.24 4,791
IREG2 At5g03570 Iron-responsive transporter Biological processunknown
1.25 0.27 0.22 3,592
MTP3 At3g58810 Zinc transporter Transport 0.68 0.04 0.06 3,178ATNRAMP4 At5g67330 NRAMP metal ion
transporter 4Transport 0.69 0.32 0.46 2,644
FRO3 At1g23020 Ferric-chelate reductase Electron transport or energypathways
0.87 0.18 0.21 2,559
ZIP8 At5g45105 Metal transporter Transport 0.33 0.02 0.06 2,099At3g12900 Oxidoreductase, 2OG-Fe(II)
oxygenase family proteinBiological process
unknown0.09 0.00 0.04 1,937
FRO1 At1g01590 Ferric-chelate reductase Electron transport or energypathways
0.23 0.04 0.16 1,659
IRT1 At4g19690 Iron-responsive transporter Transport 0.35 0.02 0.06 1,530OPT3 At4g16370 Oligopeptide transporter
OPT family proteinTransport 0.39 0.12 0.31 931
IRT2 At4g19680 Iron-responsive transporter Transport 0.38 0.01 0.04 832bHLH100 At2g41240 bHLH family protein Transcription 0.21 1.00 0.02 572CYP82C3 At4g31950 Cytochrome P450 family
proteinElectron transport or energy
pathways0.18 0.01 0.08 527
CYP82C2 At4g31970 Cytochrome P450 familyprotein
Electron transport or energypathways
0.21 0.01 0.05 476
CYP82C4 At4g31940 Cytochrome P450 familyprotein
Electron transport or energypathways
0.14 0.00 0.03 389
MYB72 At1g56160 Myb family transcriptionfactor
Transcription 0.37 0.01 0.03 99
MTP8 At3g58060 Cation efflux family protein Transport 0.45 0.05 0.11 87
aAGI gene code (At.). bGO annotations according to biological process. cRatio of significant (FDR P , 0.05) differential ($3) expressedgenes between two zinc exposure conditions. Zn0 5 0 mM ZnSO4; Zn2 5 2 mM ZnSO4; Zn25 5 25 mM ZnSO4.
dNormalized spot intensity at 2 mM
ZnSO4. Genes are ordered according to decreasing spot intensity. The 10 probes with highest hybridization intensity at 2 mM ZnSO4 are in italic. Tenprobes with highest ratios for Zn0/Zn25 and Zn2/Zn25 comparisons are in bold.
Comparative Transcript Profiling of Thlaspi caerulescens
Plant Physiol. Vol. 142, 2006 1131

Table II. Arabidopsis genes more highly expressed under zinc deficiency (Zn0) compared to sufficient (Zn2) and excess (Zn25) zinc supply
Name Codea Putative Function GO Annotationb Zn0/Zn2c Zn0/Zn25c Zn2/Zn25c Intensityd
At1g72220 Zinc-finger (C3HC4-type RINGfinger) family protein
Protein metabolism 1.36 3.35 2.46 83,438
At5g19380 Expressed protein Biological process unknown 2.41 3.23 1.34 48,547At5g16870 Expressed protein Biological process unknown 2.36 4.44 1.88 37,115At2g16990 Expressed protein Biological process unknown 2.46 3.21 1.30 34,791At1g72500 Inter-a-trypsin inhibitor
heavy chain relatedBiological process unknown 2.73 3.33 1.22 30,230
At3g15630 Expressed protein Biological process unknown 3.05 4.46 1.46 30,117At4g29905 Expressed protein Biological process unknown 3.98 7.83 1.97 29,854
WRKY45 At3g01970 WRKY family transcription factor Transcription 2.22 3.30 1.49 26,487At3g51080 Zinc-finger (GATA-type)
family proteinTranscription 3.31 2.70 0.82 26,114
CHR5:20218751–20219267
Unknown Biological process unknown 2.93 3.43 1.17 25,354
FSD1 At4g25100 Superoxide dismutase(iron)
Response to abiotic orbiotic stimulus
5.31 76.80 14.47 22,269
ATFER1 At5g01600 Ferritin 1 Response to abiotic or bioticstimulus, transport
1.82 5.18 2.85 14,350
ZIP3 At2g32270 Zinc transporter Transport 6.10 31.45 5.16 7,477ZIP2 At5g59520 Zinc transporter Transport 1.23 13.45 10.95 6,366NAS2 At5g56080 Nicotianamine synthase Other cellular, metabolic,
physiological processes4.56 1.77 0.39 4,994
At5g50400 Calcineurin-like phosphoesterasefamily protein
Biological process unknown 10.45 13.83 1.32 4,460
FRO4 At5g23980 Ferric-chelate reductase Electron transport or energypathways
3.02 14.47 4.79 4,331
YSL3 At5g53550 Transporter Transport 1.88 4.10 2.18 3,633CHR2:15208700–
15208384Unknown Biological process unknown 75.17 616.09 8.19 2,897
ZIP5 At1g05300 Metal transporter Transport 5.75 22.53 3.92 1,484At1g20380 Prolyl oligopeptidase Protein metabolism 42.64 106.37 2.49 1,368
ZIP4 At1g10970 Metal transporter Transport 15.03 36.71 2.44 1,263FRO5 At5g23990 Ferric-chelate reductase Electron transport or
energy pathways9.75 105.49 10.82 867
ZIP11 At1g55910 Metal transporter Transport 3.61 4.00 1.11 717CHR4:6931720–
6932736Unknown Biological process unknown 135.58 917.14 6.76 702
ZIP1 At3g12750 Zinc transporter Transport 9.37 15.64 1.67 681YSL2 At5g24380 Transporter Transport, response to abiotic
or biotic stimulus1.95 3.35 1.72 635
NAS4 At1g56430 Nicotianamine synthase Other cellular, metabolic,physiological processes
44.32 18.11 0.41 630
HMA2 At4g30110 ATPase E1-E2-typefamily protein
Transport 6.48 7.44 1.15 628
ZIP9 At4g33020 Metal transporter Transport 35.88 8.94 0.25 617At2g36260 Iron-sulfur cluster assembly
complex proteinBiological process unknown 22.63 117.05 5.17 533
FRD3 At3g08040 MATE efflux family protein Other cellular, metabolic,physiological processes
5.63 7.71 1.37 483
IRT3 At1g60960 Metal transporter Transport 22.71 90.01 3.96 435At1g71200 bHLH family protein Transcription 4.37 8.60 1.97 431
MTP2 At3g61940 Zinc transporter Transport 175.34 214.38 1.22 152ZIP10 At1g31260 Metal transporter Transport 7.46 9.47 1.27 136
CHR2:15209769–15208753
Unknown Biological process unknown 92.35 157.48 1.70 66
ZIP12 At5g62160 Metal transporter Transport 9.23 12.48 1.35 58
aAGI gene code (At.) or chromosome position of nonannotated transcript (CHRX:.). bGO annotations according to biologicalprocess. cRatio of significant (FDR P , 0.05) differential ($3) expressed genes between two zinc exposure conditions. Zn0 5 0 mM ZnSO4;Zn2 5 2 mM ZnSO4; Zn25 5 25 mM ZnSO4.
dNormalized spot intensity at 2 mM ZnSO4. Genes are ordered according to decreasing spot intensity.The 10 probes with highest hybridization intensity at 2 mM ZnSO4 are in italic. Ten probes with highest ratios in Zn0/Zn2 and Zn0/Zn25 comparisonsare in bold.
van de Mortel et al.
1132 Plant Physiol. Vol. 142, 2006

expressed between all conditions (Tables I and II;Supplemental Table S3).
Heterologous Microarray Hybridization
We used the same Arabidopsis array platform forheterologous hybridization with labeled T. caerulescenscDNA. From analysis of approximately 3,500 expressedsequence tags (ESTs), we previously determined thatT. caerulescens shares about 85% to 90% DNA identity incoding regions with Arabidopsis (Rigola et al., 2006).However, since most probes present on the arrayswere designed to fit less conserved regions of theArabidopsis transcripts, we verified the suitability ofcross-species hybridization of these arrays. First, Agi-lent Arabidopsis 1 oligonucleotide arrays, representingaround 13,500 putative genes, were hybridized withlabeled cDNA from Arabidopsis and T. caerulescensroots grown under sufficient zinc conditions. The spotintensities of the T. caerulescens hybridizations were onaverage only 1.7-fold lower than the spot intensities ofArabidopsis hybridizations, which is sufficient for reli-able expression analysis. In addition, genomic DNAhybridization of T. caerulescens to the Agilent Arabi-dopsis 3 oligonucleotide array showed average 2.0-foldlower signal intensity for T. caerulescens compared to theArabidopsis signal intensities. Overall, only probescorresponding to 220 genes did not hybridize with
T. caerulescens genomic DNA (less than 3-fold less signalintensity). These 220 genes were excluded from thedataset.
Zinc Response in T. caerulescens
When comparing the expression of genes in roots ofT. caerulescens plants grown on deficient, sufficient,and excess zinc media, we identified 350 genes thatwere significantly (false discovery rate [FDR] P , 0.05)differentially expressed ($3-fold) in any of the threepossible comparisons. Only 50 of these were also dif-ferentially expressed in response to different zinc ex-posures in Arabidopsis. Six clusters were identified inthis set upon cluster analysis (average linkage hierar-chical clustering with uncentered correlation). Clus-ters I and II (Table III; Supplemental Table S5) consistof 38 genes that are more highly expressed at zincdeficiency compared to sufficient or excess zinc treat-ments. ZIP-like genes ZIP3, ZIP4, and ZIP9 are coex-pressed, showing higher expression at sufficient zinccompared to excess zinc. This in contrast to the ZIP1and ZIP2 genes, which are expressed at similar levelsunder zinc sufficiency and excess zinc. Other knownmetal homeostasis genes found in this cluster are theNAS4 and FRO5 genes. These were also found to bemore highly expressed in zinc deficient Arabidopsisroots. The FSD1 iron superoxide dismutase, which
Table III. T. caerulescens genes more highly expressed under deficient (Zn0) compared to sufficient (Zn100) and excess (Zn1000) zinc supply
Cluster Name Codea Putative Function GO Annotationb Zn0/Zn100c Zn0/Zn1000c Zn100/Zn1000c Intensityd
I ZIP4 AT1G10970.1 Metal transporter Transport 2.47 4.73 1.91 47,323FSD1 AT4G25100.1 Iron superoxide
dismutaseCircadian rhythm 5.89 30.04 5.10 6,430
ZIP3 AT2G32270.1 Zinc transporter Transport 2.22 5.38 2.43 2,151ZIP9 AT4G33020.1 Metal transporter Transport 1.95 4.43 2.27 1,472
II CYP83A1 AT4G13770.1 Cytochrome P450family protein
Response to abiotic orbiotic stimulus
6.70 4.33 0.65 7,900
AT1G20380.1 Prolyl oligopeptidase,putative
Protein metabolism 7.63 4.95 0.65 4,007
ZIP1 AT3G12750.1 Zinc transporter Transport 9.33 10.11 1.08 1,569ZIP2 AT5G59520.1 Zinc transporter Transport 4.48 3.49 0.78 1,539NAS4 AT1G56430.1 Nicotianamine
synthaseOther cellular, metabolic,
physiological processes4.99 3.55 0.71 1,432
ERD9 AT1G10370.1 GlutathioneS-transferase
Other cellular, metabolic,physiological processes
18.83 8.17 0.43 902
FRO5 AT5G23990.1 Ferric-chelatereductase
Electron transport orenergy pathways
8.47 7.10 0.84 391
AT1G75260.1 Isoflavone reductasefamily protein
Biological processunknown
9.42 4.53 0.48 278
AT5G06730.1 Peroxidase Response to abiotic orbiotic stimulus
8.69 5.41 0.62 276
CA2 AT5G14740.1 Carbonic anhydrase 2 Other metabolic processes 50.67 40.39 0.80 93DIR5 AT1G64160.1 Disease resistance-
responsive familyprotein
Response to abiotic orbiotic stimulus
124.24 67.00 0.54 82
aAGI gene code (At.). bGO annotations according to biological process. cRatio of significant (FDR P , 0.05) differential ($3) expressedgenes between two zinc exposure conditions. Zn0 5 0 mM ZnSO4; Zn100 5 100 mM ZnSO4; Zn1000 5 1,000 mM ZnSO4.
dNormalized spotintensity at 100 mM ZnSO4. Genes are ordered according to decreasing spot intensity at 100 mM ZnSO4. Ten probes with highest ratios for Zn0/Zn100and Zn0/Zn1000 comparisons are presented in bold.
Comparative Transcript Profiling of Thlaspi caerulescens
Plant Physiol. Vol. 142, 2006 1133

was also found to be differentially expressed inArabidopsis, is found in this cluster. The most differ-entially expressed gene encodes a Dirigent protein(DIR5), involved in lignin biosynthesis. This gene ishardly expressed under sufficient zinc conditions, whichexplains the strong differential expression.
Clusters IIIA and IIIB (Supplemental Table S6) con-sist of 74 and 16 genes, respectively, more highly ex-pressed under deficient and excess zinc conditionscompared to sufficient zinc. Genes in cluster IIIA arepredominantly more highly expressed under zincdeficiency; genes in cluster IIIB are predominantlymore highly expressed under excess zinc. Many genesassociated with oxidative stress response, senescence,ethylene biosynthesis, and plant defense are found inthese clusters, including genes encoding peroxidasesand four plant defensin fusion genes (PDF1.1,PDF1.2b, PDF1.2c, and PDF1.3). There are 11 geneswith an unknown function in this cluster, of which oneis not annotated.
Clusters IVA and IVB (Supplemental Table S7) con-sist of 19 and 14 genes, respectively, all most highlyexpressed under excess zinc compared to the othertwo conditions. Two of these genes (At5g05250 andAt2g41240) are also found in a similar cluster forArabidopsis roots (Table I; Supplemental Table S2).Compared to Arabidopsis, the Thlaspi cluster is muchsmaller and lacks all of the iron homeostasis genes.
The remaining 189 genes fall into two additionalclusters, generally more highly expressed under suf-ficient than under deficient conditions (Supplemen-tal Tables S8 and S9). Almost half of these encodeproteins with an unknown function. Many of the othergenes are involved in general metabolism and stressresponse.
Difference in Zinc Response between Arabidopsis
and T. caerulescens
To identify genes that may be crucial for the adap-tive differences between Arabidopsis and T. caerulescens,we compared the gene expression profiles between thetwo species for each of the tested physiological con-ditions. Taking into account that we performed a heter-ologous hybridization and that probes generally didnot hybridize as efficiently to T. caerulescens cDNA asto Arabidopsis cDNA, we only considered significantprobes with a more than 5-fold higher normalized hy-bridization signal in T. caerulescens compared to Arabi-dopsis in any of the three comparisons to be of biologicalrelevance.
According to these criteria, in total 2,272 genes werefound to be at least 5 times significantly more highly(FDR P , 0.05) expressed in T. caerulescens comparedto Arabidopsis (Supplemental Table S10). Of thesegenes, 420 (18.5%) were not found to be expressed inroots of Arabidopsis under comparable conditions(Supplemental Table S11). A large class of 1,147 of the2,272 differentially expressed genes has an unknownbiological function. Other classes represent genes en-
coding proteins involved in cellular processes, transportprocesses, stress response, and transcription. A total of929 genes showed little variation in expression underthe three tested conditions, suggesting a constitutivelyhigher expression in T. caerulescens roots. To test ifthis expression is anyhow functionally related to metalstress adaptation, the functional distribution of thisgroup was compared to that of all 2,272 differentiallyexpressed genes, but this did not show specific geneclasses to be overrepresented or underrepresented (datanot shown). Only 121 of the 2,272 genes are differen-tially expressed in T. caerulescens in response to differ-ent zinc exposures. The most highly expressed genesamong these are the ZIP4 and IRT3 metal transporters(Tables III and IV). Remarkable is the large differencein expression between T. caerulescens and Arabidopsisof four members of the PDF gene family (Table IV;Supplemental Table S12). These genes are especiallyhighly expressed in T. caerulescens under deficient andexcess zinc conditions compared to Arabidopsis. Tofacilitate the further analysis of this large class ofgenes, a selection was made of 235 genes, includingthe 50 most differentially expressed genes under zincdeficiency and genes of which the proposed functioncould be relevant in explaining the metal adaptationdifferences between both species (Table IV; Supple-mental Table S12).
Next to putative metal homeostasis genes and stressresponse genes, several genes suggested to be involvedin lignin biosynthesis (Ehlting et al., 2005) also weremuch more highly expressed in T. caerulescens com-pared to Arabidopsis. In addition to the higher expres-sion of the lignin biosynthesis genes, genes potentiallyinvolved in suberin biosynthesis (CER3, CER6, and 11LTP-genes) also were more highly expressed in T.caerulescens, though not as high as the lignin biosyn-thesis genes (Table IV; Supplemental Table S12). Out of24 genes putatively involved in lignin biosynthesis, 11were generally more than 10-fold higher differentiallyexpressed and four were among the 15 highest ex-pressors when absolute expression levels at sufficientzinc were considered (Table IV; Supplemental TableS12). This higher expression was expected to causevisible differences in lignification between T. caerules-cens and Arabidopsis roots. To identify such differ-ences, transverse sections of 4-, 6-, and 9-week-oldroots from T. caerulescens and 4- and 6-week-old rootsfrom Arabidopsis plants grown hydroponically atsufficient zinc supply were made and examined byUV microscopy at wavelengths that induce lignin andsuberin autofluorescence. After 4 weeks, Arabidopsisroots only showed autofluorescence of the xylem andthe outer wall of epidermis cells in sections taken 2 cmfrom the root tip (Fig. 2A). At this age, T. caerulescensroots also showed autofluorescence of the xylem ves-sels, and the inner wall of the endodermis cells alsolighted up (Fig. 2, D and E). Epidermal fluorescencewas not seen in T. caerulescens. Sections of older T.caerulescens root parts, more distant from the tip, showedstronger fluorescence of, especially, the endodermis
van de Mortel et al.
1134 Plant Physiol. Vol. 142, 2006

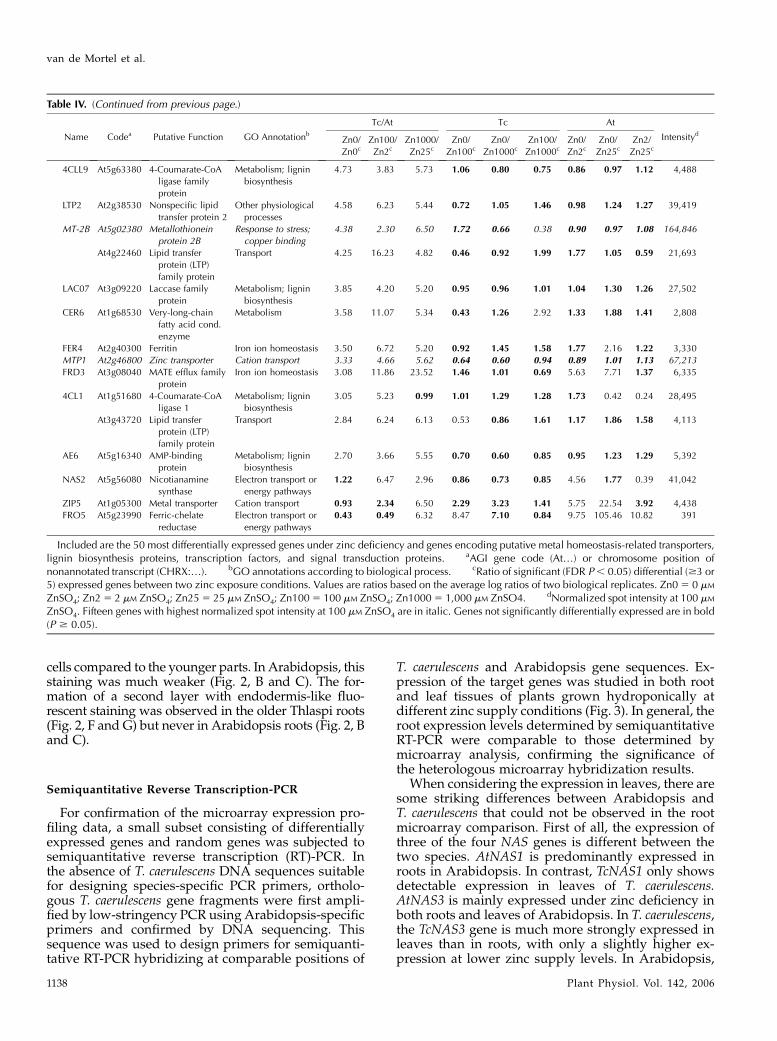
Table IV. A selection of 109 genes more highly expressed in T. caerulescens (Tc) compared to Arabidopsis (At)
Name Codea Putative Function GO Annotationb
Tc/At Tc At
IntensitydZn0/
Zn0cZn100/
Zn2cZn1000/
Zn25cZn0/
Zn100cZn0/
Zn1000cZn100/
Zn1000cZn0/
Zn2cZn0/
Zn25cZn2/
Zn25c
PDF1.1 At1g75830 Plant defensin-
fusion protein
Response to stress 948.50 10.17 717.66 8.38 0.65 0.08 0.09 0.49 5.49 12,363
At4g02280 Suc synthase Metabolism; Suc
biosynthesis
597.18 131.02 1,369.28 2.48 0.46 0.18 0.54 1.05 1.93 20,639
RPL13C At3g48960 60S ribosomal
protein L13
Protein biosynthesis 365.86 167.78 202.29 1.04 0.99 0.96 0.47 0.55 1.16 47,849
At5g43935 Flavonol
synthase
Metabolism;
flavonol synthesis
330.48 112.84 211.01 1.38 1.31 0.95 0.47 0.84 1.78 5,242
At4g28005 Expressed
protein
Electron transport;
iron ion binding
280.19 123.06 216.14 1.01 1.07 1.05 0.45 0.82 1.84 10,503
PDF1.2b At2g26020 Plant defensin-
fusion protein
Response to stress 260.94 18.41 522.12 7.22 0.59 0.08 0.51 1.19 2.33 3,264
At5g28510 Ferredoxin
hydrogenase
protein
Carbohydrate
metabolism
219.05 103.40 180.24 1.19 1.34 1.13 0.56 1.10 1.97 60,950
CHR4:11881512–
11882528
Unknown Biological process
unknown
201.76 144.61 315.46 0.56 0.43 0.76 0.40 0.67 1.66 25,676
At1g17710 Expressed protein Metabolism;
thiamine
biosynthesis
180.12 26.33 115.19 2.99 0.71 0.24 0.44 0.46 1.04 1,583
PDF1.3 At2g26010 Plant defensin-fusion
protein
Response to stress 166.01 7.64 284.86 6.34 0.50 0.08 0.29 0.86 2.95 11,977
At2g16200 Hypothetical protein Biological process
unknown
161.28 87.95 178.28 1.07 1.23 1.15 0.58 1.35 2.33 10,725
At3g50270 Transferase family
protein
Response to stress 153.69 30.87 113.21 2.83 2.07 0.73 0.57 1.53 2.69 3,598
DIR13 At4g11190 dis. res.-responsive
family protein
Metabolism; lignin
biosynthesis
149.04 114.62 124.81 1.16 1.16 1.00 0.89 0.97 1.09 135,715
PDF1.2c At5g44430 Plant defensin-fusion
protein
Response to stress 139.17 8.83 323.60 6.48 0.50 0.08 0.41 1.17 2.85 11,917
APX2 At3g09640 L-Ascorbate
peroxidase 1b
Response to stress 137.11 54.53 169.21 1.42 0.87 0.61 0.57 1.08 1.91 33,325
HAK5 At4g13420 Potassium transporter Cation transport 121.37 36.31 124.20 1.16 0.83 0.72 0.35 0.85 2.47 14,613
CHR4:9566304–
9565288
Unknown Biological process
unknown
121.07 138.45 117.38 0.52 0.50 0.95 0.60 0.48 0.81 4,470
At5g41820 Geranylgeranyl
transferase
Protein metabolism 120.48 104.47 72.61 0.51 0.45 0.88 0.44 0.27 0.61 9,054
At5g55430 Hypothetical protein Biological process
unknown
116.78 52.60 27.51 1.52 1.32 0.87 0.68 0.31 0.45 7,203
At1g26360 Hypothetical protein Metabolism; biotin
biosynthesis
111.19 98.83 166.66 1.13 1.04 0.92 1.00 1.56 1.55 5,549
At3g13784 b-Fructosidase Metabolism;
carbohydrate
metabolism
104.90 84.25 31.02 1.18 1.06 0.89 0.95 0.31 0.33 2,545
CHR2:5739298–
5739397
Unknown Biological process
unknown
103.32 111.21 176.21 0.58 0.44 0.76 0.62 0.75 1.21 22,083
At1g06030 pfkB-type
carbohydrate
kin. prot.
D-Rib metabolism 101.24 46.43 129.15 1.42 0.95 0.67 0.65 1.22 1.87 26,682
At1g14960 Major latex protein
related
Unknown; defense
related
98.69 66.29 71.91 1.06 1.08 1.02 0.71 0.78 1.11 89,031
At4g21950 Hypothetical protein Biological process
unknown
98.10 50.35 30.94 1.12 0.79 0.71 0.57 0.25 0.43 1,744
At3g59590 Jacalin lectin family
protein
Biological process
unknown
96.47 76.25 48.03 0.88 1.12 1.27 0.70 0.56 0.80 14,688
At2g16490 XH domain-containing
protein
Biological process
unknown
96.25 98.11 220.05 0.47 0.38 0.80 0.48 0.86 1.80 20,789
At4g23150 Protein kinase family
protein
Protein metabolism 94.01 88.21 220.21 0.53 0.46 0.87 0.50 1.08 2.17 8,278
PHT3 At5g43360 Inorganic phosphate
transporter
Phosphate transport 93.26 38.32 78.99 1.77 1.23 0.70 0.73 1.04 1.44 19,836
At1g49250 ATP-dependent DNA
ligase protein
DNA repair 91.87 50.56 31.91 1.34 1.19 0.89 0.74 0.41 0.56 2,284
CHR5:19326437–
19325921
Unknown Biological process
unknown
91.69 106.55 132.71 0.48 0.41 0.84 0.56 0.59 1.05 10,162
(Table continues on following page.)
Comparative Transcript Profiling of Thlaspi caerulescens
Plant Physiol. Vol. 142, 2006 1135

Table IV. (Continued from previous page.)
Name Codea Putative Function GO Annotationb
Tc/At Tc At
IntensitydZn0/
Zn0cZn100/
Zn2cZn1000/
Zn25cZn0/
Zn100cZn0/
Zn1000cZn100/
Zn1000cZn0/
Zn2cZn0/
Zn25cZn2/
Zn25c
CHR5:26539519–
26539835
Unknown Biological process
unknown
91.58 128.49 148.44 0.51 0.42 0.82 0.71 0.67 0.95 15,584
At1g62690 Expressed protein Biological process
unknown
91.31 46.75 68.49 1.01 0.89 0.89 0.51 0.67 1.30 2,325
CHR3:23273840–
23274356
Unknown Biological process
unknown
87.80 96.98 208.78 0.60 0.43 0.71 0.66 1.01 1.53 14,196
At1g40087 Hypothetical protein Biological process
unknown
87.50 41.06 56.51 1.41 1.20 0.85 0.66 0.77 1.17 1,915
CHR2:7453552–
7452536
Unknown Biological process
unknown
87.17 84.55 441.91 0.52 0.40 0.76 0.51 2.01 3.97 28,488
At2g38250 DNA-binding protein Transcription 84.05 57.36 120.09 0.54 0.40 0.76 0.37 0.58 1.58 23,033
At2g21330 Fru-bisphosphate
aldolase
Metabolism 78.66 32.23 73.24 1.77 1.04 0.59 0.72 0.96 1.33 91,786
At5g58330 Malate
dehydrogenase
Metabolism 77.13 54.94 107.84 0.62 0.48 0.77 0.44 0.67 1.52 7,882
At2g35740 Sugar transporter
family protein
Transport 75.23 81.52 143.47 0.56 0.43 0.76 0.60 0.81 1.34 11,976
CHR4:6561567–
6560402
Unknown Biological process
unknown
73.91 119.35 209.56 0.51 0.42 0.83 0.83 1.20 1.45 7,686
At2g30830 2-Oxoglutarate-
dependent
dioxygenase
Metabolism 71.27 17.04 19.01 2.49 2.14 0.86 0.60 0.57 0.96 5,756
CHR1:13243304–
13243548
Unknown Biological process
unknown
70.40 35.47 141.84 1.61 0.41 0.26 0.81 0.83 1.02 1,853
CHR1:11026453–
11026996
Unknown Biological process
unknown
70.20 101.45 231.20 1.29 1.31 1.02 1.38 2.50 1.81 199
At4g28750 PSI reaction center
subunit IV
Photosynthesis 69.01 41.98 227.92 0.55 0.42 0.77 0.33 1.39 4.19 15,894
CHR3:7075276–
7075592
Unknown Biological process
unknown
68.68 66.19 26.01 0.95 1.07 1.12 0.92 0.40 0.44 2,637
4CLL8 At5g38120 4-Coumarate-CoA
ligase family
protein
Metabolism; lignin
biosynthesis
68.48 60.18 53.69 0.69 0.96 1.39 0.61 0.75 1.24 5,574
At5g37980 NADP-dependent
oxidoreductase
Response to abiotic
or biotic stimulus
68.30 63.11 71.61 0.68 0.55 0.81 0.63 0.58 0.92 12,423
GA4H At1g80340 GA 3-b-dioxygenase Metabolism; GA
biosynthesis
67.35 16.56 23.69 4.79 4.08 0.85 1.18 1.44 1.22 1,155
At3g50940 AAA-type ATPase
family protein
Biological process
unknown
66.42 46.58 54.31 1.01 0.83 0.82 0.71 0.68 0.95 2,803
LTP4 At5g59310 Lipid transfer protein 4 Transport 47.97 48.95 52.56 0.51 1.02 1.98 0.52 1.12 2.13 5,979
4CLL3 At1g20500 4-Coumarate-CoA
ligase family
Metabolism; lignin
biosynthesis
47.67 45.86 53.39 0.65 0.90 1.39 0.62 1.01 1.62 3,956
MTP8 At3g58060 Cation efflux family
protein
Cation transport 43.33 29.35 3.05 0.67 0.71 1.06 0.45 0.05 0.11 2,693
KAT1 At5g46240 Inward-rectifying
potassium channel
Cation transport 40.06 34.09 40.41 1.10 1.15 1.05 0.93 1.16 1.24 4,106
MT2A At3g09390 Metallothionein
protein
Response to stress;
copper binding
32.47 20.25 84.39 1.40 0.51 0.37 0.87 1.33 1.52 131,218
4CLL2 At1g20490 AMP-dependent
synthetase/ligase
Metabolism; lignin
biosynthesis
27.24 37.52 26.07 0.79 0.94 1.19 1.08 0.90 0.83 15,214
At1g73550 Lipid transfer protein
(LTP) family protein
Transport 24.68 13.12 10.12 1.09 0.96 0.88 0.58 0.39 0.68 13,278
NRAMP3 At2g23150 NRAMP metal ion
transporter 3
Cation transport 23.97 7.86 18.56 2.07 0.89 0.43 0.68 0.69 1.02 18,082
DIR11 At1g22900 Disease resistance-
responsive
fam. prot.
Metabolism; lignin
biosynthesis
23.47 17.99 14.33 1.10 1.44 1.31 0.84 0.88 1.04 3,974
CCR2 At1g80820 Cinnamyl-CoA
reductase
Metabolism; lignin
biosynthesis
22.03 10.81 10.86 1.24 1.60 1.29 0.61 0.79 1.30 22,963
DIR23 At3g13660 dis. res.-response
protein related
Metabolism; lignin
biosynthesis
17.36 52.11 16.87 0.52 1.32 2.56 1.55 1.29 0.83 2,860
CCRL14 At5g19440 Cinnamyl-alcohol
dehydrogenase
Metabolism; lignin
biosynthesis
17.20 9.07 11.55 1.03 1.07 1.04 0.54 0.72 1.32 98,965
HMA4 At2g19110 ATPase E1-E2-type
family protein
Cation transport 16.41 11.15 15.36 1.73 0.96 0.56 1.18 0.90 0.77 105,390
(Table continues on following page.)
van de Mortel et al.
1136 Plant Physiol. Vol. 142, 2006

Table IV. (Continued from previous page.)
Name Codea Putative Function GO Annotationb
Tc/At Tc At
IntensitydZn0/
Zn0cZn100/
Zn2cZn1000/
Zn25cZn0/
Zn100cZn0/
Zn1000cZn100/
Zn1000cZn0/
Zn2cZn0/
Zn25cZn2/
Zn25c
IRT3 At1g60960 Metal transporter Cation transport 13.82 123.65 281.56 2.54 4.42 1.74 22.71 90.04 3.96 42,981
bHLH100 At2g41240 bHLH fam. prot. Transcription 13.62 3.24 0.59 0.89 0.09 0.10 0.21 0.00 0.02 2,195
CAX7 At5g17860 Cation exchanger Cation transport 12.79 7.33 13.12 1.69 0.90 0.53 0.97 0.92 0.95 850
DIR20 At1g58170 dis. res.-responsive
protein related
Metabolism; lignin
biosynthesis
11.93 7.22 6.05 2.15 2.30 1.07 1.30 1.17 0.90 2,774
At1g62500 Lipid transfer
protein (LTP)
family protein
Transport 11.85 6.77 12.80 1.22 1.13 0.93 0.70 1.22 1.75 7,639
CADL5 At4g39330 Mannitol
dehydrogenase
Metabolism; lignin
biosynthesis
10.12 15.81 11.44 0.46 0.82 1.79 0.72 0.93 1.30 14,903
KUP3 At3g02050 Potassium transporter Cation transport 9.69 9.38 9.58 1.12 1.11 0.99 1.08 1.09 1.01 3,395
CER3 At5g02310 Eceriferum3 protein Transcription; zinc
binding
9.54 9.31 11.15 1.20 1.03 0.86 1.17 1.20 1.03 5,275
FAH1 At4g36220 Cyt. P450 84A1
ferulate-5
hydroxylase
Metabolism; lignin
biosynthesis
9.27 22.78 18.70 0.63 0.77 1.23 1.54 1.56 1.01 95,951
CCRL3 At1g09500 Cinnamyl-alcohol
dehydrogenase
family
Metabolism; lignin
biosynthesis
8.79 3.65 8.81 2.60 1.25 0.48 1.08 1.25 1.15 1,147
GLP11c At3g04180 Germin-like protein Metabolism; lignin
biosynthesis
8.78 6.75 8.16 1.13 0.51 0.46 0.87 0.48 0.55 355
COMTL8 At1g63140 O-Methyltransferase Metabolism; lignin
biosynthesis
8.15 14.35 6.42 0.62 1.05 1.71 1.09 0.83 0.76 636
CAX9 At3g14070 Cation exchanger Cation transport 8.03 3.53 4.89 1.17 0.96 0.83 0.51 0.59 1.15 1,454
ZIP10 At1g31260 Metal transporter Cation transport 7.66 33.02 17.24 1.73 4.20 2.43 7.46 9.47 1.27 5,104
CCRL13 At5g14700 Cinnamyl-CoA
reductase related
Metabolism; lignin
biosynthesis
7.63 1.33 1.15 4.84 5.01 1.04 0.84 0.75 0.89 531
At3g22120 Lipid transfer
protein (LTP)
family prot.
Transport 7.17 6.07 8.20 1.02 1.59 1.56 0.86 1.82 2.11 16,632
CCOMTL1 At1g67980 Caffeoyl-CoA 3-O-
methyltransferase
Metabolism; lignin
biosynthesis
7.10 0.83 8.45 3.64 1.01 0.28 0.42 1.20 2.83 1,191
LTP3 At5g59320 Lipid transfer
protein 3
Other physiological
processes
7.01 18.79 15.18 0.52 1.08 2.09 1.39 2.35 1.69 11,235
At4g00165 Lipid transfer
protein (LTP)
family protein
Transport 6.98 13.36 7.89 0.50 0.93 1.86 0.95 1.05 1.10 9,474
At5g48490 Lipid transfer
protein (LTP)
family protein
Transport 6.31 4.75 7.23 1.29 0.93 0.72 0.97 1.07 1.10 108,087
CAD1 At4g34230 Cinnamyl-alcohol
dehydrogenase
Metabolism; lignin
biosynthesis
6.22 5.96 5.05 1.27 1.19 0.94 1.22 0.97 0.79 64,332
HMA3 At4g30120 ATPase E1-E2-type
family protein
Cation transport 6.05 5.70 1.98 0.98 1.20 1.23 0.92 0.39 0.43 5,882
CADL1 At1g72680 Cinnamyl-alcohol
dehydrogenase
Metabolism; lignin
biosynthesis
5.85 5.17 6.06 0.82 0.79 0.97 0.72 0.82 1.14 13,341
COMTL4 At1g21130 O-Methyltransferase Metabolism; lignin
biosynthesis
5.79 3.27 8.12 1.76 1.36 0.78 0.99 1.91 1.93 7,465
YSL7 At1g65730 Oligopeptide
transporter OPT
fam. prot.
Cation transport 5.76 3.43 6.95 1.43 0.81 0.57 0.85 0.98 1.15 1,121
IRT2 At4g19680 Iron-responsive
transporter
Cation transport 5.72 1.17 0.06 1.83 1.37 0.75 0.38 0.01 0.04 962
CLA3 At2g27250 CLAVATA3
CLAVATA3/ESR
related
Signal transduction;
development
5.56 14.73 6.84 0.40 1.27 3.20 1.05 1.56 1.49 48,437
At1g73780 Lipid transfer
protein (LTP)
family protein
Transport 5.48 7.98 4.49 0.65 1.31 2.00 0.95 1.07 1.12 14,883
ZIP4 At1g10970 Metal transporter Cation transport 4.88 29.66 37.86 2.47 4.73 1.91 15.03 36.71 2.44 47,323
CER3 At5g02300 Eceriferum3 protein Transcription; zinc
binding
4.87 15.64 24.65 0.57 0.40 0.70 1.83 2.02 1.10 29,407
CCRL9 At2g23910 Cinnamyl-CoA
reductase related
Metabolism; lignin
biosynthesis
4.83 6.46 5.13 0.53 0.71 1.34 0.71 0.76 1.07 2,244
(Table continues on following page.)
Comparative Transcript Profiling of Thlaspi caerulescens
Plant Physiol. Vol. 142, 2006 1137
cells compared to the younger parts. In Arabidopsis, thisstaining was much weaker (Fig. 2, B and C). The for-mation of a second layer with endodermis-like fluo-rescent staining was observed in the older Thlaspi roots(Fig. 2, F and G) but never in Arabidopsis roots (Fig. 2, Band C).
Semiquantitative Reverse Transcription-PCR
For confirmation of the microarray expression pro-filing data, a small subset consisting of differentiallyexpressed genes and random genes was subjected tosemiquantitative reverse transcription (RT)-PCR. Inthe absence of T. caerulescens DNA sequences suitablefor designing species-specific PCR primers, ortholo-gous T. caerulescens gene fragments were first ampli-fied by low-stringency PCR using Arabidopsis-specificprimers and confirmed by DNA sequencing. Thissequence was used to design primers for semiquanti-tative RT-PCR hybridizing at comparable positions of
T. caerulescens and Arabidopsis gene sequences. Ex-pression of the target genes was studied in both rootand leaf tissues of plants grown hydroponically atdifferent zinc supply conditions (Fig. 3). In general, theroot expression levels determined by semiquantitativeRT-PCR were comparable to those determined bymicroarray analysis, confirming the significance ofthe heterologous microarray hybridization results.
When considering the expression in leaves, there aresome striking differences between Arabidopsis andT. caerulescens that could not be observed in the rootmicroarray comparison. First of all, the expression ofthree of the four NAS genes is different between thetwo species. AtNAS1 is predominantly expressed inroots in Arabidopsis. In contrast, TcNAS1 only showsdetectable expression in leaves of T. caerulescens.AtNAS3 is mainly expressed under zinc deficiency inboth roots and leaves of Arabidopsis. In T. caerulescens,the TcNAS3 gene is much more strongly expressed inleaves than in roots, with only a slightly higher ex-pression at lower zinc supply levels. In Arabidopsis,
Table IV. (Continued from previous page.)
Name Codea Putative Function GO Annotationb
Tc/At Tc At
IntensitydZn0/
Zn0cZn100/
Zn2cZn1000/
Zn25cZn0/
Zn100cZn0/
Zn1000cZn100/
Zn1000cZn0/
Zn2cZn0/
Zn25cZn2/
Zn25c
4CLL9 At5g63380 4-Coumarate-CoA
ligase family
protein
Metabolism; lignin
biosynthesis
4.73 3.83 5.73 1.06 0.80 0.75 0.86 0.97 1.12 4,488
LTP2 At2g38530 Nonspecific lipid
transfer protein 2
Other physiological
processes
4.58 6.23 5.44 0.72 1.05 1.46 0.98 1.24 1.27 39,419
MT-2B At5g02380 Metallothionein
protein 2B
Response to stress;
copper binding
4.38 2.30 6.50 1.72 0.66 0.38 0.90 0.97 1.08 164,846
At4g22460 Lipid transfer
protein (LTP)
family protein
Transport 4.25 16.23 4.82 0.46 0.92 1.99 1.77 1.05 0.59 21,693
LAC07 At3g09220 Laccase family
protein
Metabolism; lignin
biosynthesis
3.85 4.20 5.20 0.95 0.96 1.01 1.04 1.30 1.26 27,502
CER6 At1g68530 Very-long-chain
fatty acid cond.
enzyme
Metabolism 3.58 11.07 5.34 0.43 1.26 2.92 1.33 1.88 1.41 2,808
FER4 At2g40300 Ferritin Iron ion homeostasis 3.50 6.72 5.20 0.92 1.45 1.58 1.77 2.16 1.22 3,330
MTP1 At2g46800 Zinc transporter Cation transport 3.33 4.66 5.62 0.64 0.60 0.94 0.89 1.01 1.13 67,213
FRD3 At3g08040 MATE efflux family
protein
Iron ion homeostasis 3.08 11.86 23.52 1.46 1.01 0.69 5.63 7.71 1.37 6,335
4CL1 At1g51680 4-Coumarate-CoA
ligase 1
Metabolism; lignin
biosynthesis
3.05 5.23 0.99 1.01 1.29 1.28 1.73 0.42 0.24 28,495
At3g43720 Lipid transfer
protein (LTP)
family protein
Transport 2.84 6.24 6.13 0.53 0.86 1.61 1.17 1.86 1.58 4,113
AE6 At5g16340 AMP-binding
protein
Metabolism; lignin
biosynthesis
2.70 3.66 5.55 0.70 0.60 0.85 0.95 1.23 1.29 5,392
NAS2 At5g56080 Nicotianamine
synthase
Electron transport or
energy pathways
1.22 6.47 2.96 0.86 0.73 0.85 4.56 1.77 0.39 41,042
ZIP5 At1g05300 Metal transporter Cation transport 0.93 2.34 6.50 2.29 3.23 1.41 5.75 22.54 3.92 4,438
FRO5 At5g23990 Ferric-chelate
reductase
Electron transport or
energy pathways
0.43 0.49 6.32 8.47 7.10 0.84 9.75 105.46 10.82 391
Included are the 50 most differentially expressed genes under zinc deficiency and genes encoding putative metal homeostasis-related transporters,lignin biosynthesis proteins, transcription factors, and signal transduction proteins. aAGI gene code (At.) or chromosome position ofnonannotated transcript (CHRX:.). bGO annotations according to biological process. cRatio of significant (FDR P , 0.05) differential ($3 or5) expressed genes between two zinc exposure conditions. Values are ratios based on the average log ratios of two biological replicates. Zn0 5 0 mM
ZnSO4; Zn2 5 2 mM ZnSO4; Zn25 5 25 mM ZnSO4; Zn100 5 100 mM ZnSO4; Zn1000 5 1,000 mM ZnSO4. dNormalized spot intensity at 100 mM
ZnSO4. Fifteen genes with highest normalized spot intensity at 100 mM ZnSO4 are in italic. Genes not significantly differentially expressed are in bold(P $ 0.05).
van de Mortel et al.
1138 Plant Physiol. Vol. 142, 2006

AtNAS4 is induced by zinc deficiency in roots and zincexcess in leaves. The TcNAS4 in T. caerulescens does notshow zinc-responsive expression and is constitutivelyexpressed in the roots and leaves. Of four NAS genes,only AtNAS2 and TcNAS2 show comparable expres-sion in both species.
When comparing the other differentially expressedgenes, TcAPX2, TcHMA4, and TcZIP4 (ZNT1) are allconstitutively expressed in T. caerulescens leaves. Ex-pression of these genes was either not detected inArabidopsis leaves (APX2 and HMA4) or only de-tected at zinc deficiency conditions (ZIP4). Also, theexpression of FER1 and FRO4 in leaves differs betweenthe two species: TcFER1 is induced under zinc excessconditions while AtFER1 is induced under low zincconcentrations, and TcFRO4 is not expressed in theleaves while AtFRO4 is slightly induced at sufficientand excess zinc conditions. The HAK5 potassium
transporter and the CSD1 copper/zinc superoxidedismutase genes show similar expression in leavesand roots of both species. In Arabidopsis, the At1g20380gene (encoding a putative prolyl oligopeptidase) isstrongly induced at low zinc conditions, whereas theT. caerulescens ortholog is more or less constitutivelyexpressed at low levels in roots and leaves. ZIP1 is alsoconstitutively lowly expressed in T. caerulescens rootsand leaves, but induced in Arabidopsis roots at zincdeficiency. Furthermore, we found the IRT1 iron trans-porter gene to be very differently expressed in Arabi-dopsis compared to T. caerulescens. AtIRT1 is inducedby excess zinc in Arabidopsis roots. For TcIRT1, thisinduction is much weaker in T. caerulescens roots, andthe overall expression levels also are much lower thanfor the AtIRT1 gene, confirming the observed absenceof this gene from Thlaspi cluster IV (SupplementalTable S7).
Figure 2. UV autofluorescence of lignin and suberin deposition in comparable cross sections of roots of hydroponically grownArabidopsis (A, B, and C) and T. caerulescens (D, E, F, and G). A, Cross section made 2 cm from the tip of a 4-week-oldArabidopsis root showing blue UV fluorescence of the xylem vessels and the epidermis outer cell walls. B, Cross section made2 cm from the root tip of a 6-week-old Arabidopsis root showing strong UV fluorescence of the xylem vessels and lightfluorescence of the inner wall of endodermis cells. C, Cross section made 6 cm from the root tip of a 6-week-old Arabidopsis rootshowing strong UV fluorescence of the xylem and faint fluorescence of the inner wall of the endodermis cells. D, Cross sectionmade 2 cm from the tip of a 4-week-old T. caerulescens root showing strong UV fluorescence of the xylem vessels and the innerwalls of the endodermis cells. E, Close-up of a cross section made 1 cm from the root tip of a 4-week-old T. caerulescens rootshowing the UV fluorescence of the xylem vessels and the inner walls of the endodermis cells. F, Cross section made 6 cm fromthe root tip of a 6-week-old T. caerulescens root showing UV fluorescence of the xylem vessels and the inner or outer walls ofendodermis cells. Remarkable is the apparent formation of a second layer of endodermis cells, of which the inner walls are alsofluorescent. G, Cross section of a 9-week-old T. caerulescens root made 6 cm from the root tip showing two layers ofendodermis, both of which show UV fluorescence. cx, Cortex; en, endodermis; x, xylem. Bar 5 20 mm.
Comparative Transcript Profiling of Thlaspi caerulescens
Plant Physiol. Vol. 142, 2006 1139

DISCUSSION
In this study, we investigated the expression ofgenes in roots of the nonaccumulator species Arabi-dopsis in response to exposure to three very differentzinc concentrations in hydroponic culture. We postu-late that genes that show differential expression underdifferent zinc exposures are most likely to be involvedin metal homeostasis. Most of these will be differ-entially expressed as a consequence of downstreamchanges in the physiological status of plants due tochanges in metal homeostasis, but a few genes will bedirectly involved in regulating metal homeostasis. Intrying to identify the latter ones, we also examined thedifferential expression of genes in the zinc hyperaccu-mulator T. caerulescens. Of the three metals we tested,only zinc homeostasis is clearly different between thetwo species. While Arabidopsis is not able to maintain
nontoxic zinc levels in roots upon exposure to excesszinc levels in the nutrient solution (Fig. 1A; Becheret al., 2004; Talke et al., 2006), T. caerulescens is perfectlyable to do this even while translocating high amountsof zinc to the leaves (Fig. 1A; Assuncxao et al., 2003b).After only 1 week, the zinc content in T. caerulescens isnot as high as previously found by Assuncxao et al.(2003a), who measured after several weeks of expo-sure. Unexpectedly, iron accumulates in the roots ofboth T. caerulescens and Arabidopsis at increasing zincconcentrations (Fig. 1BI). Based on absence of an effectof iron status on zinc uptake in T. caerulescens (Lombiet al., 2002) and the antagonistic effect found forArabidopsis seedlings (Thomine et al., 2003), we ex-pected no effect or an antagonistic effect of the zincstatus on iron uptake. The synergistic effect we foundsuggests that both species may increase their iron up-take as a response to a possible risk of iron deficiency
Figure 3. Comparative semiquantitativeRT-PCR of selected putative metal ho-meostasis-related differentially expressedgenes (APX2 to At1g20380) and threerandomly picked genes (At1g27950 toAt5g50400) in Arabidopsis (At) and T.caerulescens (Tc). For amplification, spe-cies-specific primers were designed atcomparable locations in each ortholo-gous gene pair. Roots and leaves wereharvested separately after 1 week of ex-posure of 3-week-old plants to 0, 2, and25mM ZnSO4 forArabidopsisand0,2,10,100, and 1,000 mM ZnSO4 for T. caeru-lescens. APX2, L-ascorbate peroxidase,At3g09640; FER1, ferritin, At5g01600;FRO4, ferric chelate reductase-like,At5g23980;HAK5,potassiumtransporter,At4g13420; HMA4, zinc ATPase E1-E2type, At2g19110; IRT1, Fe(II) transporter,At4g19690; NAS1, nicotianamine syn-thase, At5g04950; NAS2, nicotianaminesynthase, At5g56080; NAS3, nicotiana-mine synthase, At1g09240; NAS4, nico-tianamine synthase, At1g56430; ZIP1,zinc transporter, At3g12750; ZIP4, zinctransporter, At1g10970; bHLH100,bHLH transcription factor, At2g41240;CSD1, copper/zinc superoxide dismu-tase, At1g08830; putative prolyl oligo-peptidase, At1g20380; lipid transferprotein related, At1g27950; Suc synthase,At4g02280; calcineurin-like phosphoes-terase, At5g50400. Tubulin (At1g04820)wasusedasacontrol for equal cDNAuse.
van de Mortel et al.
1140 Plant Physiol. Vol. 142, 2006

in leaves. If so, this strategy is effective since no actualdecrease is seen in iron concentration in T. caerulescensleaves and only a slight decrease is observed in Arabi-dopsis leaves (Fig. 1BII). For manganese, there is anantagonistic response of decreased uptake upon in-creased zinc uptake in the roots (Fig. 1C).
When examining gene expression in the same ma-terial of both species, we expected that genes that aredifferentially expressed between the two species, andespecially those that show a difference in response tochanges in the external zinc concentration, may becrucial to the adaptive difference between a zincaccumulator and a nonaccumulator. Previously, as-pects of the metal accumulator versus nonaccumulatorgene expression comparison have been studied forArabidopsis and A. halleri (Becher et al., 2004; Weberet al., 2004; Talke et al., 2006). In addition to thosestudies, we compared and verified root gene expres-sion under three different zinc exposure conditions(deficient, sufficient, and excess zinc) that clearly leadto different zinc concentrations in roots and leaves ofboth species. Another important addition to previousstudies is that the Agilent 3 oligo microarray we usedcontains approximately 40,000 probes representingmore than 27,000 annotated genes and more than10,000 nonannotated transcripts (http://www.chem.agilent.com) and is thus an almost complete represen-tation of the Arabidopsis transcriptome. We proposethat genes that are induced in expression upon trans-fer to zinc deficiency or upon transfer to excess zinc aremost interesting for further understanding of zinchomeostasis in Arabidopsis. Among the first classare some genes already known to be involved in zinchomeostasis, such as ZIP2, 4, 5, and 9, NAS2, andHMA2 genes (Grotz et al., 1998; Wintz et al., 2003;Talke et al., 2006). In addition, we confirmed previoussuggestions of genes to be involved in zinc homeosta-sis, such as ZIP1, 3, and 10, IRT3, MTP2, and NAS4, tobe more highly expressed under zinc deficiency. ZIP1,NAS2, and NAS4 were also induced in A. halleri inresponse to low zinc supply (Becher et al., 2004). Ourresults now suggest there are at least 10 differentmembers of the ZIP gene family (Guerinot and Eide,1999) that play a role in zinc uptake in roots (ZIP1, 2, 3,4, 5, 9, 10, 11, and 12, and IRT3). Hypothesizing thatthese transporters are involved in transport of cationsacross the plasma membrane, it is unlikely that all ofthem are involved in the uptake of zinc in the sametissue. Most likely, these transporters exert a similarfunction in different parts of the root or are located inintracellular membranes.
Of the other two known zinc transporters inducedby zinc deficiency, HMA2 has been implicated intransport of zinc into the vasculature, either to pro-mote zinc export from root to shoot via the xylem orfrom shoot to root via the phloem (Eren and Arguello,2004; Hussain et al., 2004). In the first case, higherexpression under zinc deficiency could be a responseto a higher zinc demand from the shoot; in the latter, itcould be to accommodate the higher zinc demand of
the root by remobilizing zinc from the shoot. The verystrong induction of MTP2 is remarkable. Rather thanMTP1 (previously known as ZAT), which is constitu-tively expressed in Arabidopsis (van der Zaal et al.,1999; Kobae et al., 2004), the induction of MTP2 by zincdeficiency suggests a specific role of this transporter incounteracting the effect of zinc deficiency.
Metals are often chelated in planta to NA. Theabsence of NA has severe effects on metal homeo-stasis, as was observed in the chloronerva mutant oftomato (Lycopersicon esculentum; Ling et al., 1999) or inNA metabolizing NAAT-overexpressing tobacco (Ni-cotiana tabacum) plants (Takahashi et al., 2003). NA isformed by trimerization of S-adenosylmethionine cat-alyzed by the enzyme NAS. Arabidopsis contains fourNAS genes, at least three of which are able to catalyzethe last step in the synthesis of NA (Suzuki et al., 1999;Becher et al., 2004; Weber et al., 2004). Only NAS2 andNAS4 are more highly expressed in roots under zincdeficiency compared to sufficiency (Fig. 3A), but thepresence of several, apparently paralogous NAS geneswith different overlapping gene expression profilessuggests complementary and possibly redundant func-tions.
In addition to the higher expression of NAS genes,some YSL genes also are induced by zinc deficiency.These genes are implicated in transport of metal-NAchelates within the plant (Curie et al., 2001; Waterset al., 2006) and possibly the entry of metals into thephloem or xylem (DiDonato et al., 2004). We find ex-pression of YSL2 and YSL3 to be only slightly affectedby different zinc treatments, and contrary to the ob-servations by Schaaf et al. (2005), we find the genes tobe slightly induced by lower zinc concentrations.Recently, Waters et al. (2006) also showed there is aninduction of YSL3 in Arabidopsis grown under zincdeficiency conditions. Unexpected was the high zincdeficiency-induced expression of FRD3, FRO4, andFRO5. Although the frd3 mutant has a zinc accumu-lation phenotype, FRD3 has been mainly implicatedin iron homeostasis (Lahner et al., 2003; Green andRogers, 2004). FRO4 and FRO5 resemble the ferricchelate reductase gene FRO2 (Robinson et al., 1999),but, in contrast to FRO2, their expression is not in-duced in Arabidopsis roots upon iron deficiency(Mukherjee et al., 2005; Wu et al., 2005). The currentresults suggest a much broader role in general metalhomeostasis of these genes than previously thought.
In addition to these genes, we identified 328 otherprobes with a similar differential transcription profile(Table II; Supplemental Table S3), indicating a similarinvolvement in zinc homeostasis for the correspond-ing genes (Eisen et al., 1998). For some of these probes,the only indication of a corresponding gene came frommassive parallel sequence signature analysis (Meyerset al., 2004), as no Arabidopsis gene was annotated atthat position. Three of these are among the 10 mostdifferentially expressed when comparing zinc defi-cient and sufficient conditions. So far we have notidentified the corresponding genes. For three other
Comparative Transcript Profiling of Thlaspi caerulescens
Plant Physiol. Vol. 142, 2006 1141

genes in this cluster, a prolyl oligopeptidase (At1g20380),a calcineurin-like phosphoesterase (At5g50400), and abHLH family protein (At1g71200), knockout (KO)mutants were examined but not found to displayany aberrant phenotype under differential zinc ex-posure (data not shown). Prolyl oligopeptidase andcalcineurin-like phosphoesterase need metals, possi-bly also zinc, to function properly. The same holds forthe iron-sulfur cluster assembly protein and carbonicanhydrase 1. This can explain their zinc-responsiveexpression profile.
Another large cluster of 128 differentially expressedgenes is more highly expressed upon exposure to zincexcess. Expression of many of these appears to beassociated with the defense against oxidative stresscaused by this treatment (e.g. peroxidase, respiratoryburst oxidase proteins). This cluster also comprisesgenes of families that are associated with iron defi-ciency response, such as ZIP genes (IRT1, IRT2, ZIP8),FRO genes (FRO1, 2, 3), MTPs (MTP3, 8), a NAS gene(NAS1), an oligopeptide transporter (OPT3), andIREG2. A large fraction of these was also found to bedifferentially expressed in the comparison betweenwild-type Arabidopsis and the fit1 mutant (Colangeloand Guerinot, 2004). The fit1 mutant is defective in abHLH transcription factor controlling several genesinvolved in iron deficiency response. When comparingthe list of 72 genes of which the expression is (partially)dependent on FIT1 (Colangelo and Guerinot, 2004) withthe zinc excess-induced cluster (Table I; SupplementalTable S2), there are 30 genes in common. This apparentinteraction between zinc and iron homeostasis in Arab-idopsis, with zinc excess leading to iron deficiency, isnot supported by a clear decrease in iron concentrationin Arabidopsis leaves (Fig. 1), suggesting that thischange in gene expression is indeed effective in avoid-ing actual iron deficiency in leaves.
For T. caerulescens, the zinc deficiency and zincexcess response is slightly different from Arabidopsis.This does not seem to be due to technical hybridizationdifferences. The expression of the T. caerulescens genesconfirmed by RT-PCR corresponded very well withthe results obtained from the microarray analysis (Fig.3; Supplemental Table S13). One cluster of coregulatedgenes is clearly differently expressed in T. caerulescenscompared to Arabidopsis (Table III; SupplementalTable S5). Whereas in Arabidopsis the three ZIP familymembers ZIP3, ZIP4, and ZIP9 are only more highlyexpressed under zinc deficiency, their T. caerulescensorthologs are also relatively highly expressed undersufficient zinc conditions. Based on sequence similar-ity, the T. caerulescens ZNT1 and ZNT2 genes appear tobe the orthologs of the Arabidopsis ZIP4 and IRT3genes. Both were previously found to be very highlyexpressed in T. caerulescens, almost regardless of thezinc concentration in the medium (Pence et al., 2000;Assuncxao et al., 2001). Also, under zinc deficient con-ditions, these two T. caerulescens genes are much morehighly expressed than their Arabidopsis orthologs(Table IV; Supplemental Table S12).
Comparable to Arabidopsis, T. caerulescens expressesa cluster of genes in response to zinc deficient condi-tions (Table III; Supplemental Table S5), although thiscluster is much smaller than in Arabidopsis. Suchmight be caused by differences in hybridization effi-ciency, but this is probably not the case, as the T.caerulescens orthologs of FRD3, ZIP10, and HMA4are not significantly differentially expressed withinT. caerulescens, even though they are much more highlyexpressed in T. caerulescens than in Arabidopsis (TableIV; Supplemental Table S12). In a recent microarraystudy, FRD3 and HMA4 also appeared to be constitu-tively more highly expressed in A. halleri compared toArabidopsis (Talke et al., 2006). Similarly, the expres-sion of the NAS2 and FER1 orthologs in T. caerulescensis more or less constitutive rather than zinc deficiencyinduced as in Arabidopsis (Fig. 3).
The strong expression of NAS2 in A. halleri com-pared to Arabidopsis (Weber et al., 2004; Talke et al.,2006) was not found in T. caerulescens. The differentexpression profiles between Arabidopsis and T. caer-ulescens of the other three NAS genes (Fig. 3) suggest amajor function for these genes in the metal adaptationof T. caerulescens. The presence of at least four NASgene copies in both species, which are apparently allfunctional and highly redundant (no visible pheno-types are observed in soil-grown single and doubleKO Arabidopsis mutants; data not shown), will haveprovided ample flexibility to sustain adaptive changesin NAS gene expression. Also, in view of the observedeffect on, especially, nickel tolerance upon NAS over-expression in nonaccumulating, nontolerant species(Douchkov et al., 2005; Kim et al., 2005; Pianelli et al.,2005), the NAS genes may be crucial to metal tolerancein T. caerulescens.
Most interesting for the identification of genes thatcontribute to the adaptation of T. caerulescens to highzinc exposure are the genes that are differentially ex-pressed when comparing T. caerulescens and Arabidopsisat comparable zinc exposures (Table IV; SupplementalTable S10). More than 2,200 genes are significantly(P , 0.05) differentially expressed ($5-fold) at any ofthe three zinc exposure treatments. This compareswell with the recent transcript profile comparison ofT. caerulescens and Thlaspi arvense shoot tissue, in whichclose to 3,500 genes were found to be more than 2-folddifferentially expressed at P , 0.05 (Hammond et al.,2006). More than 50% of the genes we find more highlyexpressed in T. caerulescens are of unknown function. Ina recent T. caerulescens EST analysis (Rigola et al., 2006),especially genes of unknown function were overrepre-sented while genes involved in general and proteinmetabolism were underrepresented when comparedto Arabidopsis. Even though the fraction of genesinvolved in (a) biotic stress response is comparable inboth species, the stress response genes expressed inT. caerulescens are generally different from those ex-pressed in Arabidopsis.
We further analyzed this large set of species-specificdifferentially expressed genes in different ways. When
van de Mortel et al.
1142 Plant Physiol. Vol. 142, 2006

sorting them according to the highest differentialexpression under zinc deficiency, which we considerto be most informative, there are several genes that aremore than 100-fold higher expressed in T. caerulescens.Among the 15 most differentially expressed genes arefour PDF or defensin genes, of which PDF1.1 is closeto 1,000-fold higher expressed under zinc deficientand excess conditions. The biological role of defensinsis not very clear. These small Cys-rich peptides aregenerally induced by fungal infections and implicatedin pathogen defense, hence their name (Thomma et al.,2002). Mirouze et al. (2006) recently showed that theA. halleri PDF family confers zinc tolerance, and theyhypothesized that defensins interfere with divalentmetal cation trafficking to confer the zinc tolerancephenotype. In Arabidopsis, expression of PDF1.2 isinduced by the stress hormone jasmonic acid (JA;Penninckx et al., 1998). Maksymiec et al. (2005) re-cently showed that heavy metal stress also induces JAaccumulation in plants. Armengaud et al. (2004) foundthat PDF1.2a, PDF1.2b, PDF1.2c, and PDF1.3 are alsoamong the most induced genes upon potassium star-vation in Arabidopsis, and they suggested a relationbetween potassium starvation and JA signaling. Ofthe total 415 genes they found to be differentiallyexpressed under potassium starvation, we found 46genes to be more highly expressed in T. caerulescenscompared to Arabidopsis. How or if JA, potassiumstarvation, and zinc response are correlated remainselusive. However, in this context it is also interesting tonote that HAK5, KUP3, and KAT, three potassiumtransporter genes, are much more highly expressed inT. caerulescens roots compared to Arabidopsis.
Zinc hyperaccumulation is a constitutive trait in T.caerulescens and, thus, we expect it requires a consti-tutive expression of metal hyperaccumulation genesand no specific induction at zinc deficiency or excess.It is complicated to identify such zinc accumulationgenes from the large set of more or less constitutivelyhigher expressed T. caerulescens genes, as many genesin this large set will be involved in general speciesdifferences. However, when considering the 16 mosthighly expressed genes at 100 mM ZnSO4, already sixmetal homeostasis genes are among them, four ofwhich are known zinc transporters: HMA4, MTP1, andthe already discussed ZIP4 and IRT3. HMA4 waspreviously identified by Papoyan and Kochian (2004)as a zinc-transporting, P-type ATPase possibly in-volved in zinc hyperaccumulation, particularly inloading of zinc into the xylem. The T. caerulescensortholog of the Arabidopsis MTP1 gene was previ-ously described as the ZTP1 gene (Assuncxao et al.,2001) and has been suggested to play a role in metaltolerance of T. caerulescens (Assuncxao et al., 2001) andThlaspi goesingense (Persans et al., 2001; Kim et al.,2004). Paralogs of the AtMTP1 gene in A. halleri alsocosegregate with zinc tolerance in a segregating pop-ulation (Drager et al., 2004). Other zinc transportergenes that are more highly expressed in T. caerulescensare HMA3, MTP8, and NRAMP3. HMA3 is a P-type
ATPase similar to HMA4. When expressed in yeast, itis able to transport cadmium, but zinc transport couldnot be proven and in Arabidopsis the expression of thegene is not affected by exposure to zinc (Gravot et al.,2004). The MTP8 gene is another member of the cationdiffusion facilitator family. Especially at zinc deficientand sufficient conditions, the gene is more highlyexpressed in T. caerulescens compared to Arabidopsis,suggesting a function in zinc uptake, although theregulation in Arabidopsis by FIT1 (Colangelo andGuerinot, 2004) also indicates a role in iron homeosta-sis. An mtp8 KO mutant was examined but not foundto display any aberrant phenotype under differentialzinc exposure (data not shown). AtNRAMP3 is avacuolar transporter that is able to transport iron andcadmium but not zinc (Thomine et al., 2000). Thespecific induction of TcNRAMP3 gene expression byzinc deficiency and excess zinc suggests it plays animportant role in mobilization of zinc and iron inT. caerulescens as in Arabidopsis (Lanquar et al., 2005).
Unexpected was that, in contrast to Arabidopsis,expression of the iron homeostasis genes IRT1, IRT2,and FRO2 is not induced in T. caerulescens upon excesszinc treatment. When we tested with RT-PCR, wecould not detect the expression of TcIRT1 except inroots at lower zinc exposure levels (Fig. 3B; Supple-mental Table S13). This suggests that T. caerulescens iseither able to regulate zinc and iron homeostasisindependently, unlike Arabidopsis, or that the contin-ued expression of zinc transporters at high zinc expo-sure levels ensures low-efficiency, but sufficient, ironuptake in T. caerulescens. The IRT1 gene plays aninteresting role in metal homeostasis in T. caerulescens,since it is very highly expressed upon iron deficiencyin the cadmium-hyperaccumulating accession Gangesbut much lower in the cadmium-excluding accessionPrayon (Lombi et al., 2002). The latter is physiologi-cally and geographically very close to La Calamine.
Two metallothionein genes, MT2B and especiallyMT2A, are very highly expressed in T. caerulescens.MT2 expression is generally associated with copperstress tolerance (Zhou and Goldsbrough, 1995; vanHoof et al., 2001), but overexpression in Vicea faba alsoinduced cadmium tolerance (Lee et al., 2004). Whythese two, more copper-associated genes are so highlyexpressed in T. caerulescens is unclear. High zinc up-take due to high expression of zinc transporters with alow affinity for copper could of course cause somecopper stress, but high copper levels have not beenreported for T. caerulescens. It is more likely that thesegenes have a function in general stress response or,alternatively, serve to maintain copper homeostasis, aswas also suggested for the MT3 gene of T. caerulescens(Roosens et al., 2004).
Very surprising was the relatively high expression of24 genes with a suggested function in lignin biosyn-thesis (Ehlting et al., 2005) and 13 genes implicated insuberin biosynthesis (CER3, CER6, and 11 LTP genes;Costaglioli et al., 2005) in T. caerulescens (Table IV).CER3 is known to be expressed in Arabidopsis roots,
Comparative Transcript Profiling of Thlaspi caerulescens
Plant Physiol. Vol. 142, 2006 1143

but the expression of CER6 in T. caerulescens roots isvery different from the expression in Arabidopsis(Hannoufa et al., 1996; Hooker et al., 2002). The highexpression of lignin/suberin biosynthesis genes coin-cides well with the progressed U-shaped lignification/suberinization of the endodermis cells and the occa-sional presence of a second endodermis layer found inT. caerulescens roots, but not in Arabidopsis roots (Fig.2). Casparian strip development and lignification incortical cells also was recently observed by Zelko et al.(2005) in T. caerulescens but not in the closely relatednonaccumulator T. arvense. Comparable endodermiswall thickenings were also observed in the salt-adapted crucifer Thelungiella halophila (Inan et al.,2004). Strong deposition of lignin and suberin on theradial and inner tangential walls resulting in a U-likeappearance of the endodermal cells is not uncommonfor plants (Zeier and Schreiber, 1998). Since this cellwall deposition occurs most prominently at olderparts of the root where root hairs are no longer active,we hypothesize that this layer acts to prevent excessefflux of metals from the vascular cylinder rather thanto prevent uncontrolled influx.
With so many genes differentially expressed, onealso expects alterations in the transcript levels oftranscription factors. In the T. caerulescens-Arabidopsiscomparison, we found 131 transcriptional regulatorswith more than 5-fold higher expression (FRD P ,0.05) in T. caerulescens (Supplemental Table S14). Of 19genes that are more than 10-fold higher expressedunder zinc sufficient conditions, two genes (INO andSPL) are associated with flower development in Arabi-dopsis (Villanueva et al., 1999; Yang et al., 1999) andexpression is very atypical. However, in line with thisatypical expression, we also found the FIS2 gene morehighly expressed in T. caerulescens roots. In Arabidopsis,this gene is predominantly expressed in developingseeds (Luo et al., 2000), but also in A. halleri andArabidopsis lyrata this gene is induced in roots in re-sponse to zinc exposure (www.genevestigator.ethz.ch).
In conclusion, the comparative transcriptional anal-ysis of the hyperaccumulator T. caerulescens and thenonaccumulator Arabidopsis emphasizes the role ofpreviously implicated zinc homeostasis genes in ad-aptation to high zinc exposure, but also suggests asimilar role for many more, as yet uncharacterizedgenes, often without any known function. While someof these genes were also differentially expressed whencomparing A. halleri with Arabidopsis, many morewere not or at very different levels, suggesting thatthere will be overlap in the mechanisms of metalaccumulation and metal tolerance but also many dif-ferences between metal hyperaccumulator species.
MATERIALS AND METHODS
Plant Material and Growth Conditions
Arabidopsis thaliana Columbia-0 (Arabidopsis) and Thlaspi caerulescens J. &
C. Presl accession La Calamine seeds were germinated on garden peat soil
(Jongkind BV). Three-week-old seedlings were transferred to 600-mL poly-
ethylene pots (three plants per pot) containing a modified half-strength
Hoagland nutrient solution (Schat et al., 1996): 3 mM KNO3, 2 mM Ca(NO3)2,
1 mM NH4H2PO4, 0.5 mM MgSO4, 1 mM KCl, 25 mM H3BO3, 2 mM ZnSO4, 2 mM
MnSO4, 0.1 mM CuSO4, 0.1 mM (NH4)6Mo7O24, and 20 mM Fe(Na)EDTA. The pH
buffer MES was added at 2 mM concentration and the pH was set at 5.5 using
KOH. Each polyethylene pot contained three seedlings of T. caerulescens or
Arabidopsis. Three weeks after growing on this solution, the T. caerulescens
plants were transferred for 7 d to the same modified half-strength Hoagland
nutrient solution with a deficient (0 mM), sufficient (100 mM), or excess
(1,000 mM) ZnSO4 concentration. The Arabidopsis plants were transferred to
the same nutrient solution with deficient (0 mM), sufficient (2 mM), or excess
(25 mM) ZnSO4. During the first 3 weeks, the nutrient solution was replaced
once a week and thereafter twice a week. Germination and plant culture were
performed in a climate chamber (20�C/15�C day/night temperatures;
250 mmol light m22 s21 at plant level during 14 h/d [T. caerulescens] or 12 h/d
[Arabidopsis]; 75% relative humidity; Assuncxao et al., 2001).
Root and Shoot Metal Accumulation Assay
Two pools of three plants, grown as described before, were used per
treatment. After 4 weeks of growth, the plants were harvested, after desorbing
the root system with ice-cold 5 mM PbNO3 for 30 min. Roots and shoots were
dried overnight at 65�C, wet-ashed in a 4:1 mixture of HNO3 (65%) and HCl
(37%) in Teflon bombs at 140�C for 7 h, and analyzed for zinc, iron, and
manganese using flame atomic absorption spectrometry (Perkin-Elmer 1100B).
Metal concentrations in roots and shoots were calculated as mmol per g DW.
Microarray Experiment
A common reference model was used to design the microarray experiment
(Yang and Speed, 2002), in which cDNA from T. caerulescens roots exposed to
100 mM (sufficient) zinc was used as the common reference. Every slide was
always hybridized with the common reference sample and with a sample
from one of the treatments (Arabidopsis or T. caerulescens exposed to deficient,
sufficient, or excess zinc). The common reference was labeled with the
fluorescent dye Cyanine 3 and the treatment samples were labeled with
Cyanine 5. As a quality-control step, we performed a dye-swap hybridization
for one sample (from T. caerulescens roots exposed to sufficient zinc).
Roots of one pot containing three Arabidopsis or three T. caerulescens plants
per treatment were pooled and homogenized in liquid nitrogen. Each pool
was considered as one biological replicate and two biological replicates were
used. Total RNA was extracted with Trizol (Invitrogen). Approximately
300 mg tissue was used for the RNA extraction performed according to the
manufacturer’s instructions. After the RNA extraction, total RNA was puri-
fied with RNeasy spin columns (Qiagen Benelux B.V.) and genomic DNA was
digested with the RNase-free DNase set (Qiagen Benelux B.V.). Ten micro-
grams of total RNA was used to synthesize cDNA with MMLV reverse
transcriptase and DNA primer. The cDNA was labeled with Cyanine 3-dCTP
or Cyanine 5-dCTP and hybridized to Agilent Arabidopsis 3 60-mer oligonu-
cleotide microarrays (Agilent Technologies) representing approximately
40,000 putative genes. The microarrays contain all Arabidopsis genes of
known function and genes with a high degree of similarity to genes of known
function from heterologous organisms. This includes more than 27,000 anno-
tated genes and more than 10,000 nonannotated transcripts based on massive
parallel sequence signature data (http://www.chem.agilent.com) and is thus
an almost complete representation of the Arabidopsis transcriptome.
After hybridization, the slides were scanned, analyzed, and normalized
with the Agilent Feature Extraction software (Agilent Technologies). The
arrays were first normalized using Agilent’s standard normalization within
each array. The remaining statistical analysis was done using the limma
package (Smyth, 2005a) in R/BioConductor (Gentleman et al., 2004). Between-
array quantile normalization was performed on the common reference chan-
nel while leaving the log ratios unchanged (Yang and Thorne, 2003). To find
differentially expressed genes, we performed a separate channel analysis
(Smyth, 2005b) between the pairs of interest using a moderated t test (Smyth,
2004). This test is similar to a standard t test for each probe except that the SEs
are moderated across genes to ensure more stable inference for each gene. This
prevents a gene from being judged as differentially expressed with a very
small fold change merely because of an accidentally small residual SD. The
resulting P values were corrected for multiple testing using the Benjamini-
Hochberg FDR adjustment (Benjamini and Hochberg, 1995). Genes were
van de Mortel et al.
1144 Plant Physiol. Vol. 142, 2006

considered to be significantly differentially expressed if both the FDR P values
were ,0.05 (controlling the expected FDR to no more than 5%) and the fold
change was $3 (within species) or $5 (between species). Genes found to be
significantly differentially expressed were clustered using Cluster/Treeview
(Eisen et al., 1998). Average linkage hierarchical clustering with uncentered
correlation was used within Cluster to perform the clustering analysis.
Primary microarray data are available in ArrayExpress E-MEXP-877.
Genomic DNA hybridizations were performed using 1 mg random primed
genomic DNA. As a quality-control step, we performed a dye-swap hybrid-
ization. After hybridization, the slides were scanned, analyzed, and normal-
ized with the Agilent Feature Extraction software (Agilent Technologies). The
arrays were further normalized using linear Lowess analysis. The features that
hybridized with Arabidopsis genomic DNA (both polarities of the dye swap)
and did not hybridize with T. caerulescens genomic DNA were extracted from
the dataset by Spotfire using a fold change $3 as the cutoff value.
Semiquantitative RT-PCR
Total RNA of leaves and roots of a third Arabidopsis or T. caerulescens
biological replica was extracted with Trizol (Invitrogen). Selected T. caerulescens
genomic and cDNA fragments were PCR amplified using primers designed for
the orthologous Arabidopsis gene and cloned into the pGEM-T Easy vector
(Promega). Clones were sequenced and new primers were designed for
semiquantitative RT-PCR to ensure amplification of the correct T. caerulescens
gene. Five micrograms of total RNA was used to synthesize cDNA with MMLV
reverse transcriptase (Invitrogen) and oligo(dT) as a primer (Invitrogen). The
PCR amplification was performed with a cDNA aliquot (1 mL) and gene-
specific primers (Supplemental Table S13). Care was taken to design Arabi-
dopsis primers at comparable positions and with comparable length and Tm as
for T. caerulescens primers to allow proper comparison of the expression data.
Primers for Tubulin (Supplemental Table S13) were used as a control for similar
cDNA quantity between the samples. Between 25 to 35 PCR cycles (30 s at 94�C,
30 s at 50�C, and 60 s at 68�C) were performed in a 50-mL volume, preferably
with the same number of cycles for Arabidopsis and T. caerulescens samples.
Twenty microliters of the reaction was separated on an ethidium bromide-
stained 1% agarose gel. Gel-image analysis using QuantityOne software (Bio-
Rad) was used to quantify the DNA fragment intensities (Supplemental Table
S13). The DNA fragment intensities were corrected for background signal and
corrected for cDNA quantity using the intensities of Tubulin.
Microscopic Analysis of Lignification in T. caerulescens
T. caerulescens La Calamine seeds were germinated and plants were grown
as described before on sufficient zinc medium. After 4, 6, and 9 weeks, roots of
two plants were collected and hand sections were made by repeatedly
chopping roots on a microscope slide using a razorblade. These sections
were analyzed with a Nikon Labophot bright-field microscope.
T. caerulescens sequences used for semiquantitative RT-PCR analysis have
been deposited with the EMBL/GenBank data libraries under accession
numbers DQ384055 (TcAPX2), DQ384057 (TcbHLH100), DQ923700 (TcCSD1),
DQ384056 (TcFER1), DQ384058 (TcFRO4), DQ923702 (TcHAK5), DQ384059
(TcIRT1), DQ384060 (TcZIP1), DQ384061 (T. caerulescens ortholog of prolyl
oligopeptidase; At1g20380), DQ923699 (T. caerulescens ortholog of lipid trans-
fer protein related; At1g27950), DQ923701 (T. caerulescens ortholog of Suc
synthase; At4g02280), and DQ923703 (T. caerulescens ortholog of calcineurin-
like phosphoesterase; At5g50400).
Supplemental Data
The following materials are available in the online version of this article.
Supplemental Table S1. Arabidopsis genes more lowly expressed under
zinc deficient conditions compared to sufficient and excess zinc.
Supplemental Table S2. Arabidopsis genes more highly expressed under
excess zinc conditions compared to sufficient or deficient zinc supply.
Supplemental Table S3. Arabidopsis genes more highly expressed under
zinc deficiency compared to sufficient and excess zinc supply.
Supplemental Table S4. Arabidopsis genes more lowly expressed under
excess zinc compared to deficient and sufficient zinc conditions.
Supplemental Table S5. T. caerulescens genes more highly expressed
under deficient compared to sufficient and excess zinc supply.
Supplemental Table S6. T. caerulescens genes more highly expressed
under deficient and excess zinc conditions compared to sufficient zinc.
Supplemental Table S7. T. caerulescens genes more highly expressed
under excess zinc conditions compared to deficient and sufficient zinc.
Supplemental Table S8. T. caerulescens genes more lowly expressed under
zinc deficient conditions compared to sufficient and excess zinc.
Supplemental Table S9. T. caerulescens genes more lowly expressed under
deficient and excess zinc conditions compared to sufficient zinc.
Supplemental Table S10. T. caerulescens genes more highly expressed
under zinc deficiency, sufficiency, or excess compared to Arabidopsis.
Supplemental Table S11. Expressed genes in T. caerulescens for which no
expression was detected in the roots of Arabidopsis under all three
conditions tested.
Supplemental Table S12. A selection of genes more highly expressed in
T. caerulescens compared to Arabidopsis.
Supplemental Table S13. Differentially expressed genes verified by
semiquantitative RT-PCR.
Supplemental Table S14. Transcription factor genes more highly ex-
pressed in T. caerulescens compared to Arabidopsis.
ACKNOWLEDGMENTS
We thank Andre van Lammeren for his assistance in the lignification
analysis; Wu Jian for preparing the TcNAS gene sequences; Diana Rigola for
sharing the T. caerulescens EST library information prior to publication; Viivi
Hassinen for providing the primer sequences of the T. caerulescens Tubulin
gene; ABRC, NASC, and GABI-Kat for providing the seeds of the T-DNA
lines; and Lisa Gilhuijs-Pederson and Antoine van Kampen for their input in
the microarray design.
Received April 17, 2006; accepted September 8, 2006; published September 22,
2006.
LITERATURE CITED
Armengaud P, Breitling R, Amtmann A (2004) The potassium-dependent
transcriptome of Arabidopsis reveals a prominent role of jasmonic acid
in nutrient signaling. Plant Physiol 136: 2556–2576
Assuncxao AGL, Bookum WM, Nelissen HJM, Vooijs R, Schat H, Ernst
WHO (2003a) Differential metal-specific tolerance and accumulation
patterns among Thlaspi caerulescens populations originating from dif-
ferent soil types. New Phytol 159: 411–419
Assuncxao AGL, da Costa Martins C, de Folter S, Vooijs R, Schat H, Aarts
MGM (2001) Elevated expression of metal transporter genes in three
accessions of the metal hyperaccumulator Thlaspi caerulescens. Plant Cell
Environ 24: 217–226
Assuncxao AGL, Schat H, Aarts MGM (2003b) Thlaspi caerulescens, an
attractive model species to study heavy metal hyperaccumulation in
plants. New Phytol 159: 351–360
Baker AJM, Brooks RR (1989) Terrestrial higher plants which hyperaccu-
mulate metallic elements—a review of their distribution, ecology and
phytochemistry. Biorecovery 1: 81–126
Baker AJM, Proctor J, van Balgooy MMJ, Reeves RD (1992) Hyperaccu-
mulation of nickel by the flora of the ultramafics of Palawan, Republic of
the Philippines. In AJM Baker, J Proctor, RD Reeves, eds, The Vegetation
of Ultramafic (Serpentine) Soils. Proceedings of the First International
Conference on Serpentine Ecology. Intercept, Andover, Hampshire, UK,
pp 291–304
Becher M, Talke IN, Krall L, Kramer U (2004) Cross-species microarray
transcript profiling reveals high constitutive expression of metal ho-
meostasis genes in shoots of the zinc hyperaccumulator Arabidopsis
halleri. Plant J 37: 251–268
Benjamini Y, Hochberg Y (1995) Controlling the false discovery rate: a
practical and powerful approach to multiple testing. J Roy Statist Soc Ser
B Methodological 57: 289–300
Bert V, Bonnin I, Saumitou-Laprade P, de Laguerie P, Petit D (2002) Do
Arabidopsis halleri from nonmetallicolous populations accumulate zinc
Comparative Transcript Profiling of Thlaspi caerulescens
Plant Physiol. Vol. 142, 2006 1145

and cadmium more effectively than those from metallicolous popula-
tions? New Phytol 155: 47–57
Brooks R (1994) Plants that hyperaccumulate heavy metals. In ME Ed
Farago, ed, Plants and the Chemical Elements. Wiley-VCH, Weinheim,
Germany, pp 87–105
Clemens S (2001) Molecular mechanisms of plant metal tolerance and
homeostasis. Planta 212: 475–486
Clemens S, Palmgren MG, Kramer U (2002) A long way ahead: under-
standing and engineering plant metal accumulation. Trends Plant Sci 7:
309–315
Colangelo EP, Guerinot ML (2004) The essential basic helix-loop-helix
protein FIT1 is required for the iron deficiency response. Plant Cell 16:
3400–3412
Costaglioli P, Joubes J, Garcia C, Stef M, Arveiler B, Lessire R, Garbay B
(2005) Profiling candidate genes involved in wax biosynthesis in
Arabidopsis thaliana by microarray analysis. Biochim Biophys Acta
1734: 247–258
Curie C, Panaviene Z, Loulergue C, Dellaporta SL, Briat JF, Walker EL
(2001) Maize yellow stripe1 encodes a membrane protein directly in-
volved in Fe(III) uptake. Nature 409: 346–349
DiDonato RJ Jr, Roberts LA, Sanderson T, Eisley RB, Walker EL (2004)
Arabidopsis Yellow Stripe-Like2 (YSL2): a metal-regulated gene encoding
a plasma membrane transporter of nicotianamine-metal complexes.
Plant J 39: 403–414
Douchkov D, Gryczka C, Stephan UW, Hell R, Baumlein H (2005) Ectopic
expression of nicotianamine synthase genes results in improved iron
accumulation and increased nickel tolerance in transgenic tobacco.
Plant Cell Environ 28: 365–374
Drager DB, Desbrosses-Fonrouge AG, Krach C, Chardonnens AN, Meyer
RC, Saumitou-Laprade P, Kramer U (2004) Two genes encoding
Arabidopsis halleri MTP1 metal transport proteins co-segregate with
zinc tolerance and account for high MTP1 transcript levels. Plant J 39:
425–439
Ehlting J, Mattheus N, Aeschliman DS, Li E, Hamberger B, Cullis IF,
Zhuang J, Kaneda M, Mansfield SD, Samuels L, et al (2005) Global
transcript profiling of primary stems from Arabidopsis thaliana identifies
candidate genes for missing links in lignin biosynthesis and transcrip-
tional regulators of fiber differentiation. Plant J 42: 618–640
Eisen MB, Spellman PT, Brown PO, Botstein D (1998) Cluster analysis and
display of genome-wide expression patterns. Proc Natl Acad Sci USA
95: 14863–14868
Eren E, Arguello JM (2004) Arabidopsis HMA2, a divalent heavy metal-
transporting P(IB)-type ATPase, is involved in cytoplasmic Zn21 ho-
meostasis. Plant Physiol 136: 3712–3723
Gentleman RC, Carey VJ, Bates DM, Bolstad B, Dettling M, Dudoit S,
Ellis B, Gautier L, Ge Y, Gentry J, et al (2004) Bioconductor: open
software development for computational biology and bioinformatics.
Genome Biol 5: R80
Gravot A, Lieutaud A, Verret F, Auroy P, Vavasseur A, Richaud P (2004)
AtHMA3, a plant P1B-ATPase, functions as a Cd/Pb transporter in
yeast. FEBS Lett 561: 22–28
Green LS, Rogers EE (2004) FRD3 controls iron localization in Arabidopsis.
Plant Physiol 136: 2523–2531
Grotz N, Fox T, Connolly E, Park W, Guerinot ML, Eide D (1998)
Identification of a family of zinc transporter genes from Arabidopsis
that respond to zinc deficiency. Proc Natl Acad Sci USA 95: 7220–7224
Guerinot ML, Eide D (1999) Zeroing in on zinc uptake in yeast and plants.
Curr Opin Plant Biol 2: 244–249
Hammond JP, Bowen HC, White PJ, Mills V, Pyke KA, Baker AJM,
Whiting SN, May ST, Broadley MR (2006) A comparison of the Thlaspi
caerulescens and T. arvense shoot transcriptomes. New Phytol 170:
239–260
Hannoufa A, Negruk V, Eisner G, Lemieux B (1996) The CER3 gene of
Arabidopsis thaliana is expressed in leaves, stems, roots, flowers and
apical meristems. Plant J 10: 459–467
Hooker TS, Millar AA, Kunst L (2002) Significance of the expression of the
CER6 condensing enzyme for cuticular wax production in Arabidopsis.
Plant Physiol 129: 1568–1580
Hussain D, Haydon MJ, Wang Y, Wong E, Sherson SM, Young J,
Camakaris J, Harper JF, Cobbett CS (2004) P-type ATPase heavy metal
transporters with roles in essential zinc homeostasis in Arabidopsis.
Plant Cell 16: 1327–1339
Inan G, Zhang Q, Li P, Wang Z, Cao Z, Zhang H, Zhang C, Quist TM,
Goodwin SM, Zhu J, et al (2004) Salt cress. A halophyte and cryophyte
Arabidopsis relative model system and its applicability to molecular
genetic analyses of growth and development of extremophiles. Plant
Physiol 135: 1718–1737
Kim D, Gustin JL, Lahner B, Persans MW, Baek D, Yun D, Salt DE (2004)
The plant CDF family TgMTP1 from the Ni/Zn hyperaccumulator
Thlaspi goesingense acts to enhance efflux of Zn at the plasma membrane
when expressed in Saccharomyces cerevisiae. Plant J 39: 237–251
Kim S, Takahashi M, Higuchi K, Tsunoda K, Nakanishi H, Yoshimura E,
Mori S, Nishizawa NK (2005) Increased nicotianamine biosynthesis
confers enhanced tolerance to high levels of metals, in particular nickel,
to plants. Plant Cell Physiol 46: 1809–1818
Kobae Y, Uemura T, Sato MH, Ohnishi M, Mimura T, Nakagawa T,
Maeshima M (2004) Zinc transporter of Arabidopsis thaliana AtMTP1 is
localized to vacuolar membranes and implicated in zinc homeostasis.
Plant Cell Physiol 45: 1749–1758
Lahner B, Gong J, Mahmoudian M, Smith EL, Abid KB, Rogers EE,
Guerinot ML, Harper JF, Ward JM, McIntyre L, et al (2003) Genomic
scale profiling of nutrient and trace elements in Arabidopsis thaliana. Nat
Biotechnol 21: 1215–1221
Lanquar V, Lelievre F, Bolte S, Hames C, Alcon C, Neumann D, Vansuyt
G, Curie C, Schroder A, Kramer U, et al (2005) Mobilization of vacuolar
iron by AtNRAMP3 and AtNRAMP4 is essential for seed germination
on low iron. EMBO J 24: 4041–4051
Lasat MM, Baker A, Kochian LV (1996) Physiological characterization of root
Zn21 absorption and translocation to shoots in Zn hyperaccumulator
and nonaccumulator species of Thlaspi. Plant Physiol 112: 1715–1722
Lee J, Shim D, Song WY, Hwang I, Lee Y (2004) Arabidopsis metallothi-
oneins 2a and 3 enhance resistance to cadmium when expressed in Vicia
faba guard cells. Plant Mol Biol 54: 805–815
Ling HQ, Koch G, Baumlein H, Ganal MW (1999) Map-based cloning of
chloronerva, a gene involved in iron uptake of higher plants encoding
nicotianamine synthase. Proc Natl Acad Sci USA 96: 7098–7103
Lombi E, Tearall KL, Howarth JR, Zhao FJ, Hawkesford MJ, McGrath SP
(2002) Influence of iron status on cadmium and zinc uptake by different
ecotypes of the hyperaccumulator Thlaspi caerulescens. Plant Physiol 128:
1359–1367
Luo M, Bilodeau P, Dennis ES, Peacock WJ, Chaudhury A (2000) Expres-
sion and parent-of-origin effects for FIS2, MEA, and FIE in the endo-
sperm and embryo of developing Arabidopsis seeds. Proc Natl Acad Sci
USA 97: 10637–10642
Maksymiec W, Wianowska D, Dawidowicz AL, Radkiewicz S,
Mardarowicz M, Krupa Z (2005) The level of jasmonic acid in Arabi-
dopsis thaliana and Phaseolus coccineus plants under heavy metal stress.
J Plant Physiol 162: 1338–1346
Marschner H (1995) Mineral Nutrition of Higher Plants, Ed 2. Academic
Press, London
Meerts P, Van Isacker N (1997) Heavy metal tolerance and accumulation in
metallicolous and non-metallicolous populations of Thlaspi caerulescens
from continental Europe. Plant Ecol 133: 221–231
Meyers BC, Tej SS, Vu TH, Haudenschild CD, Agrawal V, Edberg SB,
Ghazal H, Decola S (2004) The use of MPSS for whole-genome tran-
scriptional analysis in Arabidopsis. Genome Res 14: 1641–1653
Mirouze M, Sels J, Richard O, Czernic P, Loubet S, Jacquier A,
Francois IEJA, Cammue BPA, Lebrun M, Berthomieu P, et al (2006) A
putative novel role for plant defensins: a defensin from the zinc hyper-
accumulating plant, Arabidopsis halleri, confers zinc tolerance. Plant J 47:
329–342
Mukherjee I, Campbell NH, Ash JS, Connolly EL (2005) Expression
profiling of the Arabidopsis ferric chelate reductase (FRO) gene family
reveals differential regulation by iron and copper. Planta 14: 1–13
Papoyan A, Kochian LV (2004) Identification of Thlaspi caerulescens genes
that may be involved in heavy metal hyperaccumulation and tolerance.
Characterization of a novel heavy metal transporting ATPase. Plant
Physiol 136: 3814–3823
Peer WA, Mamoudian M, Lahner BZ, Reeves RD, Murphy AS, Salt DE
(2003) Identifying model metal hyperaccumulator plants: germplasm
analysis of 20 Brassicaceae accessions from a wide geographical area.
New Phytol 159: 421–430
Pence NS, Larsen PB, Ebbs SD, Letham DL, Lasat MM, Garvin DF, Eide
D, Kochian LV (2000) The molecular physiology of heavy metal trans-
port in the Zn/Cd hyperaccumulator Thlaspi caerulescens. Proc Natl
Acad Sci USA 97: 4956–4960
van de Mortel et al.
1146 Plant Physiol. Vol. 142, 2006

Penninckx IAMA, Thomma BPHJ, Buchala A, Metraux JP, Broekaert WF
(1998) Concomitant activation of jasmonate and ethylene response
pathways is required for induction of a plant defensin gene in Arabi-
dopsis. Plant Cell 10: 2103–2113
Persans MW, Nieman K, Salt DE (2001) Functional activity and role of
cation-efflux family members in Ni hyperaccumulation in Thlaspi
goesingense. Proc Natl Acad Sci USA 98: 9995–10000
Pianelli K, Stephane M, Marques L, Lebrun M, Czernic P (2005) Nicotian-
amine over-accumulation confers resistance to nickel in Arabidopsis
thaliana. Transgenic Res 14: 739–748
Ramesh SA, Choimes S, Schachtman DP (2004) Over-expression of an
Arabidopsis zinc transporter in hordeum vulgare increases short-term
zinc uptake after zinc deprivation and seed zinc content. Plant Mol Biol
54: 373–385
Rigola D, Fiers M, Vurro E, Aarts MGM (2006) The heavy metal hyper-
accumulator Thlaspi caerulescens expresses many species-specific genes
as identified by comparative EST analysis. New Phytol 170: 753–766
Robinson NJ, Procter CM, Connolly EL, Guerinot ML (1999) A ferric-
chelate reductase for iron uptake from soils. Nature 397: 694–697
Roosens NH, Bernard C, Leplae R, Verbruggen N (2004) Evidence for
copper homeostasis function of metallothionein (MT3) in the hyper-
accumulator Thlaspi caerulescens. FEBS Lett 577: 9–16
Schaaf G, Schikora A, Haberle J, Vert G, Ludewig U, Briat JF, Curie C,
von Wiren N (2005) A putative function for the Arabidopsis Fe-
phytosiderophore transporter homolog AtYSL2 in Fe and Zn homeo-
stasis. Plant Cell Physiol 46: 762–774
Schat H, Llugany M, Bernhard R (2000) Metal-Specific Patterns of Toler-
ance, Uptake, and Transport of Heavy Metals in Hyperaccumulating
and Non-hyperaccumulating Metallophytes. CRC Press, Boca Raton, FL
Schat H, Vooijs R, Kuiper E (1996) Identical major gene loci for heavy
metal tolerances that have independently evolved in different local
populations and subspecies of Silene vulgaris. Evolution Int J Org
Evolution 50: 1888–1895
Shen ZG, Zhao FJ, McGrath SP (1997) Uptake and transport of zinc in the
hyperaccumulator Thlaspi caerulescens and the non-hyperaccumulator
Thlaspi ochroleucum. Plant Soil 188: 153–159
Smyth GK (2004) Linear models and empirical Bayes methods for assess-
ing differential expression in microarray experiments. Stat Appl Genet
Mol Biol 3: Article 3
Smyth GK (2005a) Limma: linear models for microarray data. In R Gen-
tleman, V Carey, S Dudoit, R Irizarry, W Huber, eds, Bioinformatics and
Computational Biology Solutions Using R and Bioconductor. Springer,
New York, pp 397–420
Smyth GK (2005b) Individual channel analysis of two-colour microarray
data (CD Paper 116). In Invited Session IPM 11: Computational Tools
For Microarray Analysis, 55th Session of the International Statistics
Institute, April 5–12, 2005, Sydney Convention and Exhibition Centre,
Sydney, Australia
Suzuki K, Higuchi K, Nakanishi H, Nishizawa NK, Mori S (1999) Cloning
of nicotianamine synthase genes from Arabidopsis. Soil Sci Plant Nutr
45: 993–1002
Takahashi M, Terada Y, Nakai I, Nakanishi H, Yoshimura E, Mori S,
Nishizawa NK (2003) Role of nicotianamine in the intracellular delivery
of metals and plant reproductive development. Plant Cell 15: 1263–1280
Talke IN, Hanikenne M, Kramer U (2006) Zn-dependent global transcrip-
tional control, transcriptional de-regulation and higher gene copy
number genes in metal homeostasis of the hyperaccumulator Arabidop-
sis halleri. Plant Physiol 142: 148–167
Thomine S, Lelievre F, Debarbieux E, Schroeder JI, Barbier-Brygoo H
(2003) AtNRAMP3, a multispecific vacuolar metal transporter involved
in plant responses to iron deficiency. Plant J 34: 685–695
Thomine S, Wang R, Ward JM, Crawford NM, Schroeder JI (2000)
Cadmium and iron transport by members of a plant metal transporter
family in Arabidopsis with homology to Nramp genes. Proc Natl Acad
Sci USA 97: 4991–4996
Thomma BP, Cammue BP, Thevissen K (2002) Plant defensins. Planta 216:
193–202
van der Zaal BJ, Neuteboom LW, Pinas JE, Chardonnens AN, Schat H,
Verkleij JA, Hooykaas PJ (1999) Overexpression of a novel Arabidopsis
gene related to putative zinc-transporter genes from animals can lead
to enhanced zinc resistance and accumulation. Plant Physiol 119:
1047–1055
van Hoof NA, Koevoets PL, Hakvoort HW, ten Bookum WM, Schat H,
Verkleij JA, Ernst WH (2001) Enhanced ATP-dependent copper efflux
across the root cell plasma membrane in copper-tolerant Silene vulgaris.
Physiol Plant 113: 225–232
Villanueva JM, Broadhvest J, Hauser BA, Meister RJ, Schneitz K, Gasser
CS (1999) INNER NO OUTER regulates abaxial-adaxial patterning in
Arabidopsis ovules. Genes Dev 13: 3160–3169
Waters BM, Chu H, Didonato RJ, Roberts LA, Eisley RB, Lahner B,
Salt DE, Walker EL (2006) Mutations in Arabidopsis Yellow-
Stripe-Like1 and Yellow Stripe-Like3 reveal their roles in metal ion
homeostasis and loading of metal ions in seeds. Plant Physiol 141:
1446–1458
Weber M, Harada E, Vess C, Roepenack-Lahaye E, Clemens S (2004)
Comparative microarray analysis of Arabidopsis thaliana and Arabi-
dopsis halleri roots identifies nicotianamine synthase, a ZIP transporter
and other genes as potential metal hyperaccumulation factors. Plant J
37: 269–281
Wintz H, Fox T, Wu YY, Feng V, Chen W, Chang HS, Zhu T, Vulpe C (2003)
Expression profiles of Arabidopsis thaliana in mineral deficiencies reveal
novel transporters involved in metal homeostasis. J Biol Chem 278:
47644–47653
Wu H, Li L, Yuan Y, Cheng X, Ling H-Q (2005) Molecular and biochemical
characterization of the Fe(III) chelate reductase gene family in Arabi-
dopsis thaliana. Plant Cell Physiol 46: 1505–1514
Yang WC, Ye D, Xu J, Sundaresan V (1999) The SPOROCYTELESS gene of
Arabidopsis is required for initiation of sporogenesis and encodes a
novel nuclear protein. Genes Dev 13: 2108–2117
Yang YH, Speed T (2002) Design issues for cDNA microarray experiments.
Nat Rev Genet 3: 579–588
Yang YH, Thorne NP (2003) Normalization for two-color cDNA microarray
data. In DR Goldstein, ed, Science and Statistics. IMS Lecture Notes, Vol
40. Institute of Mathematical Statistics, Bethesda, MD, pp 403–418
Zeier J, Schreiber L (1998) Comparative investigation of primary and
tertiary endodermal cell walls isolated from the roots of five mono-
cotyledoneous species: chemical composition in relation to fine struc-
ture. Planta 206: 349–361
Zelko I, Lux A, Czibula K (2005) What is so special about root of T.
caerulescens? A comparative study of root anatomy. In 1st Scientific
Workshop and Management Committee Meeting. Phytotechnologies to
Promote Sustainable Land Use and Improve Food Safety. COST Action
859. http://www.gre.ac.uk/cost859/documents/Pisaabstractbook.pdf
Zhou J, Goldsbrough PB (1995) Structure, organization and expression of
the metallothionein gene family in Arabidopsis. Mol Gen Genet 248:
318–328
Comparative Transcript Profiling of Thlaspi caerulescens
Plant Physiol. Vol. 142, 2006 1147
Top Related
Copyright © 2022 FDOKUMEN

