


Bahasa
Halaman
Hukum

http://jom.sagepub.com/Journal of Management
http://jom.sagepub.com/content/early/2014/05/28/0149206314535442The online version of this article can be found at:
DOI: 10.1177/0149206314535442
published online 28 May 2014Journal of ManagementAntonio Capaldo, Dovev Lavie and Antonio Messeni Petruzzelli
Knowledge Distance and AdoptionKnowledge Maturity and the Scientific Value of Innovations: The Roles of
Published by:
http://www.sagepublications.com
On behalf of:
Southern Management Association
can be found at:Journal of ManagementAdditional services and information for
http://jom.sagepub.com/cgi/alertsEmail Alerts:
http://jom.sagepub.com/subscriptionsSubscriptions:
http://www.sagepub.com/journalsReprints.navReprints:
http://www.sagepub.com/journalsPermissions.navPermissions:
What is This?
- May 28, 2014OnlineFirst Version of Record >>
by guest on May 29, 2014jom.sagepub.comDownloaded from by guest on May 29, 2014jom.sagepub.comDownloaded from

Journal of ManagementVol. XX No. X, Month XXXX 1 –31
DOI: 10.1177/0149206314535442© The Author(s) 2014
Reprints and permissions:sagepub.com/journalsPermissions.nav
1
Knowledge Maturity and the Scientific Value of Innovations: The Roles of Knowledge Distance
and Adoption
Antonio CapaldoCatholic University of the Sacred Heart
Dovev LavieTechnion–Israel Institute of Technology
Antonio Messeni PetruzzelliPolitecnico di Bari
How does the scientific value of innovations vary with the maturity of the knowledge that underlies them? We reconcile conflicting views in the innovation literature by introducing a contingency perspective that underscores the role of knowledge distance along technological and geographical domains. We predict an inverted U-shaped effect of knowledge maturity on the scientific value of new innovations. We further suggest that incorporating geographically distant knowledge can enhance the value contribution of knowledge maturity, whereas incorporating technologically distant knowledge or waiting for the adoption of knowledge in the industry mitigates this value. Our analysis of 5,575 biotechnology patented innovations offers support for our conjectures. We thus advance research on knowledge management and innovation by underscoring the temporal aspect of innovation and its interplay with technological and geographical distances.
Keywords: innovation; knowledge maturity; technological distance; geographical distance; knowledge adoption
Acknowledgments: The authors thank Gino Cattani, J. P. Eggers, Gianvito Lanzolla, Hart Posen, Richard Tee, and participants in seminars at Cass Business School in London, Politecnico di Milano in Milan, and Catholic Univer-sity of the Sacred Heart in Rome (“Second Tuesday” Seminar Series) for useful feedback on earlier versions of this article. We also thank Angelo Natalicchio and Tommaso Savino for their research assistance. An earlier version of this article was presented at the 2011 DRUID Summer Conference in Copenhagen and included in the 2012 Best Paper Proceedings of the Academy of Management Conference in Boston (abbreviated version). The article was also presented at the 2012 Israel Strategy Conference in Tel Aviv and at the 2013 Strategic Management Society Conference in Atlanta. The first author acknowledges financial support from the Catholic University of the Sacred Heart (research line D.3.1 – 2014).
Corresponding author: Dovev Lavie, Technion–Israel Institute of Technology, Haifa 32000, Israel.
E-mail: [email protected]
535442 JOMXXX10.1177/0149206314535442Journal of Management / Month XXXXCapaldo et al. / Knowledge Maturity and the Value of Innovationsresearch-article2014
by guest on May 29, 2014jom.sagepub.comDownloaded from
2 Journal of Management / Month XXXX
He took the paper and held it over the wastebasket and said, “what do you want me to do with it?” Then he dropped it in. That was 20 years ago, and ever since, Dr. Bissell and a few others have struggled for acceptance of what seemed a radical idea: Gene mutations are part of the process of cancer, but mutations alone are not enough. Cancer involves an interaction between rogue cells and surrounding tissue. The idea seemed messy and unduly complicated, and cancer genes seemed comparatively clear-cut. So it was often ignored or dismissed. Now, though, more and more researchers are plunging into those murky depths. Some researchers are taking a fresh look at ideas that were dismissed.
—International Herald Tribune (2009: 7)
Introduction
Management research on knowledge management and innovation has underscored the conditions that facilitate technological innovation and the factors that enable firms to appro-priate value from it, such as firms’ complementary assets (e.g., James, Leiblein, & Lu, 2013; Teece, 1986). Whereas early research considered the implications for firms’ innovative out-put (e.g., Henderson & Cockburn, 1994), more recent work has paid attention to the value of innovations (Hess & Rothaermel, 2011; Phene, Fladmoe-Lindquist, & Marsh, 2006). A dis-tinction can be made between the financial returns that a firm can derive from its commer-cialized innovations and the scientific value of these innovations, which relates to their impact on subsequent innovations. The scientific value of an innovation depends on industry conditions, such as the institutional environment (Mueller, Rosenbusch, & Bausch, 2013), the innovative efforts of competitors (Katila & Chen, 2008), and the geographic proximity of inventors (Audretsch & Feldman, 1996; Jaffe, Trajtenberg, & Henderson, 1993). This value is further driven by organizational characteristics, such as the firm’s absorptive capacity (Cohen & Levinthal, 1990) and combinative capability (Kogut & Zander, 1992), as well as by the behavior of individual inventors (Felin & Hesterly, 2007; Zucker, Darby, & Brewer, 1998).
Besides environmental, organizational, and individual mechanisms, the value of an inno-vation for the scientific community is associated with the attributes of knowledge elements that underlie the innovation. The knowledge management literature has underscored the organizational processes and capabilities that support the integration, transfer, and combina-tion of knowledge elements (Grant, 1996), but has paid less attention to the properties of knowledge that drive the value of particular innovations. One exception has been research on the tacit versus explicit nature of knowledge (Kogut & Zander, 1992). Here we focus on the maturity of knowledge elements that can shape the scientific value of innovations.
Studying the knowledge elements incorporated in particular innovations calls for shifting the unit of analysis from the firm to the single innovation. In an effort to shed light on the association between the scientific value of an innovation and its underlying knowledge ele-ments, we study how the maturity of the knowledge embedded in that innovation drives its scientific value. Nevertheless, because we study innovations in the context of commercial firms, we also account for relevant organizational aspects that can affect the innovations’ scientific value.
We advance management research that has underscored the importance of the temporal dimension in knowledge recombination (Katila, 2002; Liebowitz & Margolis, 1995; Nelson
by guest on May 29, 2014jom.sagepub.comDownloaded from
Capaldo et al. / Knowledge Maturity and the Value of Innovations 3
& Winter, 1982). This research has debated the merits of relying on mature versus recent knowledge and has offered conflicting perspectives on the innovative implications of knowl-edge maturity. More recent research calls for a contingency approach to uncover the circum-stances under which knowledge maturity enhances the scientific value of innovations (Nerkar, 2003). We contribute to this stream of research by demonstrating that the complex implications of knowledge maturity are contingent on distinct types of knowledge distance and on the extent to which this knowledge has been adopted in the industry. In light of these contingencies, inventors can improve their approaches to incorporating prior knowledge ele-ments in their innovations, and enhance the scientific value of those innovations.
An innovation can be defined as “a new idea, which may be a recombination of old ideas, a scheme that challenges the present order, a formula, or a unique approach” (Van de Ven, 1986: 591). Accordingly, an innovation often embeds knowledge elements that have been developed in the past (Arthur, 2009; Kogut & Zander, 1992; Nelson & Winter, 1982). To capture knowledge maturity, we examine the time elapsed between the original discovery of knowledge and when it is incorporated in an innovation.
Scholars have debated the merits of relying on recent versus mature knowledge in devel-oping innovations. Some have argued that building on recent knowledge enables a firm to adapt its innovations to changing requirements (Eisenhardt, 1989; Sørensen & Stuart, 2000) and introduce novel innovations. Thus, mature knowledge tends to become obsolete, since it is subject to core rigidities that limit adaptation (Leonard-Barton, 1992). Accordingly, this research suggests that the value of knowledge for the scientific community appreciates with its recency. Others have instead suggested that successful innovations often incorporate mature knowledge that has been already tested in use, which can eliminate some costly errors in the innovation process (Nerkar, 2003) and enhance the reliability of the firm’s new prod-ucts (Katila, 2002). Mature knowledge can also support radical innovation, as demonstrated in Corning’s development of fiber optics, which is considered a new application for a mature technology (Cattani, 2006). Hence, an inventor can successfully employ mature knowledge in certain niches where that knowledge had not been used in the past (Abernathy & Clark, 1985; Adner & Snow, 2010). In addition, the benefits of incorporating new knowledge can be offset by technological uncertainty and limited application experience (Heeley & Jacobson, 2008). In sum, prior research has offered inconsistent arguments and evidence about the implications of knowledge maturity for the scientific value of innovations.
Few studies have attempted to reconcile these opposing views. Katila’s (2002) study of the robotics industry revealed that mature intraindustry knowledge undermines product development, whereas mature extraindustry knowledge promotes it. However, her study examined the effect of knowledge maturity on how many new products a firm produced, rather than on the scientific value of innovations. In addition, Nerkar (2003) reported that mature knowledge may be fruitful, especially if the inventor combines it with more recent knowledge, so that the value of an innovation increases in decreasing rates with knowledge maturity. But although his study contributes to the understanding of knowledge maturity, it did not consider contingencies that can shape its effects. Finally, Heeley and Jacobson (2008) revealed an S-shaped association between knowledge recency and a firm’s stock market performance. They concluded that intermediate levels of knowledge maturity can both improve and undermine performance. But because their study focused on firm-level perfor-mance rather than on the value of particular innovations, it disregarded the heterogeneity of knowledge maturity across the firm’s various innovations. Studying the implications of
by guest on May 29, 2014jom.sagepub.comDownloaded from
4 Journal of Management / Month XXXX
knowledge maturity for a firm’s productivity and economic return limits understanding of the mechanisms that drive the innovation process and the conditions under which knowledge maturity enhances the scientific value of innovations. In sum, prior research has offered mixed views and evidence on the implications of knowledge maturity, thus leaving open the question of how knowledge maturity affects the scientific value of a particular innovation. Such an effect may be nonlinear and contingent on various characteristics of the underlying knowledge elements.
To better understand the implications of knowledge maturity, we shift attention from the firm to the innovation as the unit of analysis. We seek to reconcile the conflicting perspec-tives on knowledge maturity by studying its curvilinear effect on innovation value. We fur-ther examine the interplay of knowledge maturity with contingencies relating to technological and geographical distances from the inventor’s knowledge base as well as to the extent to which this knowledge has been adopted in the industry. These domains of knowledge dis-tance and the mechanism of knowledge adoption have been central to research on innovation (e.g., Phene et al., 2006; Rothaermel & Alexandre, 2009), yet their interplay with knowledge maturity has been thus far ignored.
We contribute to innovation research by revealing the curvilinear effect of knowledge maturity on innovation value and positing that it is contingent on different types of knowl-edge distance. We contend that inventors can enhance the value of an innovation to the extent that they incorporate moderately recent knowledge. As knowledge begins to mature, it becomes more reliable and applicable, thus enhancing the scientific value of innovations. Yet, beyond a certain threshold, overly mature knowledge may become obsolete or at least more difficult to retrieve, understand, and apply, characteristics that undermine the value of innovations. We further advance management research by elucidating the contingent value of knowledge maturity. Specifically, we argue that technological distance attenuates the bene-fits of knowledge maturity, since limited familiarity undermines the reliable use of mature knowledge while making it more difficult to retrieve and apply. In turn, geographical dis-tance reinforces the benefits of mature knowledge by contributing to its novelty and delaying its obsolescence. Finally, we claim that the broader the adoption of mature knowledge in the firm’s industry the more its value contribution is undermined.
Our analysis of 5,575 patents issued to 283 biotechnology firms between 1985 and 2002 grants support for the inverted U-shaped effect of knowledge maturity on innovation value as well as for the knowledge adoption contingency and the disparate effects of knowledge dis-tance. By examining knowledge distance along temporal, technological, and geographical domains, and by studying the implications of knowledge adoption in the industry, we offer insights into the mechanisms underlying the scientific value of innovations. Hence, we con-tribute to the literature on knowledge management and innovation by underscoring the tem-poral dimension of knowledge search, revealing the contingent value of knowledge maturity, and shifting focus from the commercial to the scientific value of innovations.
Theory and Hypotheses
Knowledge Maturity and the Scientific Value of Innovations
Innovation often entails searching for and combining knowledge elements that have been developed in the past. Some innovations integrate knowledge elements that were developed
by guest on May 29, 2014jom.sagepub.comDownloaded from

Capaldo et al. / Knowledge Maturity and the Value of Innovations 5
at different periods (Fleming, 2001). For instance, mechatronics emerged in the late 1970s from the fusion of mature mechanical technologies with the embryonic electronics technolo-gies (Freddi, 2009). The maturity of knowledge refers to the time elapsed between the origi-nal discovery of that knowledge and its incorporation in a new innovation. This time interval can affect the scientific value of the innovation. We focus on the value of an innovation with respect to its quality and its potential impact on subsequent innovation efforts of the scientific community (Phene et al., 2006; Sorenson, Rivkin, & Fleming, 2006) rather than on its com-mercial value for the firm. This allows us to leave out considerations of value appropriation and commercialization. We conjecture an inverted U-shaped association between knowledge maturity and the scientific value of an innovation, so that moderately mature knowledge is expected to be the most valuable.
Although the most recent knowledge tends to be novel, embedding it in innovations may limit their scientific value because of inexperience in use and limited technological applica-bility. As knowledge begins to mature, it enhances the scientific value of innovations that embed it by increasing their reliability and applicability.
First, an innovation relying on increasingly mature knowledge is more reliable, since that knowledge is likely to have already been put into practice. Even if an inventor is not familiar with that knowledge, greater information on its nature and usage is available in the industry, which makes it easier for the inventor to learn it. By incorporating sufficiently mature knowl-edge, the inventor can generate temporally consistent patterns of innovation that enhance subsequent innovation ability (Turner, Mitchell, & Bettis, 2013). Since knowledge maturity initially facilitates the knowledge’s codification and experience in use, the inventor can bet-ter understand it. Relying on relatively mature knowledge enables the inventor to more effec-tively assess the merits of knowledge and thus produce useful and more reliable innovations that rely only on knowledge that has been tested and proved useful in the past. Furthermore, sufficiently mature knowledge can be subjected to validation over time, so incorporating it in an innovation enables the inventor to reduce the likelihood of errors and improper applica-tion. For example, despite the numerous benefits arising from adopting the diesel engine in the rail industry, its use presented a number of technical problems in the first few years after its introduction; engines incorporating this technology experienced low power output den-sity, reduced maximum rotating speed, and high combustion noise. The reliability of an inno-vation is likely to increase with the maturity of knowledge in decreasing rates (Nerkar, 2003), since after inventors gain sufficient experience with particular knowledge, the innovation’s reliability can be only marginally improved.
Second, an innovation incorporating the most recent knowledge is likely to suffer from limited technological applicability, especially when the industry is nascent and users of the innovation need to be educated about the technology before they can apply it. As knowledge begins to mature, innovations that embed it are likely to have been applied in various ways. For example, the scientific value of the touch-screen technology used in the iPhone smart-phone increases with the number of touch-screen applications that software firms develop over time. Therefore, as inventors retrieve increasingly mature knowledge, the more likely their innovations are to generate valuable applications (Nerkar, 2003). This is also typical when industry conditions have changed since the original knowledge was developed—for instance, if complementary assets or enabling technologies gradually become available and support the innovation. In the example of common rail technology, 60% of the performance of the diesel engine depends on the injection system, which reached maturity only in 1994
by guest on May 29, 2014jom.sagepub.comDownloaded from
6 Journal of Management / Month XXXX
following the shift from mechanical to electronic components. This complementary technol-ogy helped maintain a consistent injection pressure that reduces exhaust emissions, makes fuel cleaner, lessens engine combustion noise, and enables higher-power output density. Until that time, electronics were considered unsafe and unreliable. Furthermore, as knowl-edge begins to mature, new applications may emerge that can enable firms to leverage an innovation in ways unknown before. Accordingly, a successful innovation may result from the redeployment of mature knowledge in different domains (Adner & Levinthal, 2002; Cattani, 2005). Hence, as knowledge begins to mature, it is likely to initially enhance the value of an innovation. Yet, eventually, as it continues to mature, its marginal contribution diminishes, because its reliability has been already established and most of its technological applications have been already explored, thus constraining the discovery of new applications for the innovation.
Beyond a certain threshold, relying on increasingly mature knowledge can be detrimental to the value of an innovation because of its possible obsolescence and impediments associ-ated with its retrieval and application. Specifically, the novelty of knowledge is likely to diminish over time as new discoveries advance the knowledge frontier, so that overly mature knowledge can become obsolete (Tushman & Anderson, 1986). Thus, an innovation embed-ding overly mature knowledge may fail to meet current user requirements if it incorporates knowledge that is no longer relevant or is subject to historical problems that transpire in new ways (Leonard-Barton, 1992). Consequently, as knowledge becomes overly mature, its obso-lescence can limit an innovation’s scientific value.
Besides its obsolescence, overly mature knowledge may be difficult to retrieve and apply. As knowledge becomes overly mature, forgotten practices, lost records, and turnover of R&D personnel (Argote, 1999) may facilitate memory decay, which in turn reduces the inventor’s ability to correctly recall, retrieve, and apply overly mature knowledge in an inno-vation. Consequently, the innovation may necessitate increasing effort to retrieve overly mature knowledge. Moreover, inventors are likely to lack the training and expertise needed to apply overly mature knowledge, since the personnel involved in the innovation process may be better trained with recent, more commonly used technologies than with outdated ones. Thus, memory decay may lead the inventor to misapply overly mature knowledge or to experience impediments with its application (Sørensen & Stuart, 2000). Incorporating overly mature knowledge can therefore result in less valuable innovation.
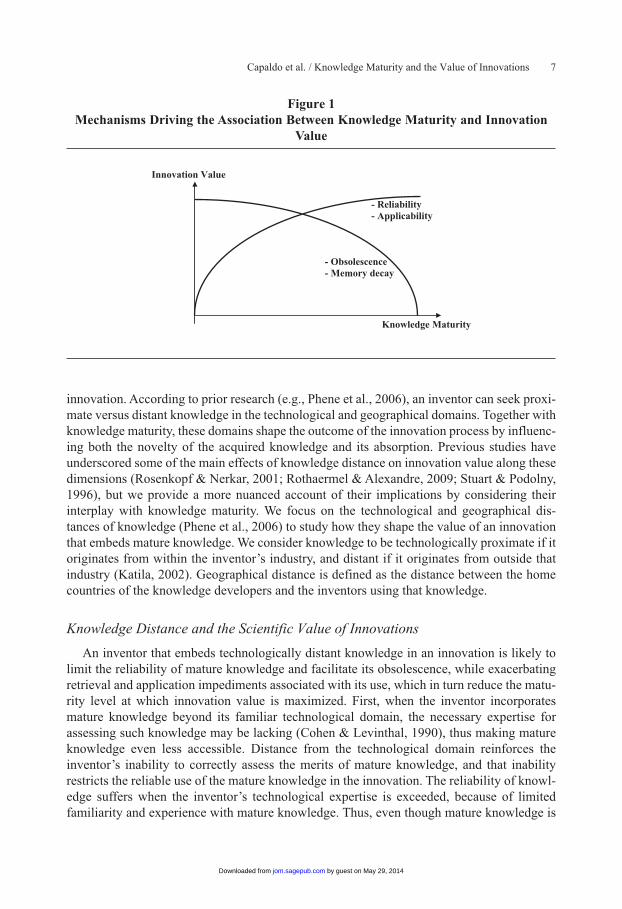
Overall, the reliability and applicability of knowledge are likely to enhance the value of an innovation at decreasing rates as the knowledge begins to mature. In turn, knowledge obsolescence and impediments associated with memory decay are likely to diminish the value of the innovation at increasing rates as knowledge further matures (Figure 1). Moderately mature knowledge is thus likely to contribute the most to the value of the innova-tion. The scientific value of the innovation is likely to initially increase, but beyond a certain threshold, we expect it to decline as a result of the maturation of knowledge incorporated in that innovation.
Hypothesis 1: Knowledge maturity will exhibit an inverted U-shaped effect on the scientific value of the resulting innovation, so that this value first increases and then decreases as its underlying knowledge base matures.
The distance between the inventor’s knowledge base and the knowledge incorporated in the new innovation can shape the effect of knowledge maturity on the scientific value of that
by guest on May 29, 2014jom.sagepub.comDownloaded from
Capaldo et al. / Knowledge Maturity and the Value of Innovations 7
innovation. According to prior research (e.g., Phene et al., 2006), an inventor can seek proxi-mate versus distant knowledge in the technological and geographical domains. Together with knowledge maturity, these domains shape the outcome of the innovation process by influenc-ing both the novelty of the acquired knowledge and its absorption. Previous studies have underscored some of the main effects of knowledge distance on innovation value along these dimensions (Rosenkopf & Nerkar, 2001; Rothaermel & Alexandre, 2009; Stuart & Podolny, 1996), but we provide a more nuanced account of their implications by considering their interplay with knowledge maturity. We focus on the technological and geographical dis-tances of knowledge (Phene et al., 2006) to study how they shape the value of an innovation that embeds mature knowledge. We consider knowledge to be technologically proximate if it originates from within the inventor’s industry, and distant if it originates from outside that industry (Katila, 2002). Geographical distance is defined as the distance between the home countries of the knowledge developers and the inventors using that knowledge.
Knowledge Distance and the Scientific Value of Innovations
An inventor that embeds technologically distant knowledge in an innovation is likely to limit the reliability of mature knowledge and facilitate its obsolescence, while exacerbating retrieval and application impediments associated with its use, which in turn reduce the matu-rity level at which innovation value is maximized. First, when the inventor incorporates mature knowledge beyond its familiar technological domain, the necessary expertise for assessing such knowledge may be lacking (Cohen & Levinthal, 1990), thus making mature knowledge even less accessible. Distance from the technological domain reinforces the inventor’s inability to correctly assess the merits of mature knowledge, and that inability restricts the reliable use of the mature knowledge in the innovation. The reliability of knowl-edge suffers when the inventor’s technological expertise is exceeded, because of limited familiarity and experience with mature knowledge. Thus, even though mature knowledge is
Figure 1Mechanisms Driving the Association Between Knowledge Maturity and Innovation
Value
Knowledge Maturity
Innovation Value
- Reliability- Applicability
- Obsolescence- Memory decay
by guest on May 29, 2014jom.sagepub.comDownloaded from
8 Journal of Management / Month XXXX
typically reliable, the extension of technological distance makes it difficult to ensure the reli-able use of that knowledge, thus further reducing the scientific value of the innovation that relies on it.
Second, embedding knowledge that rests beyond the current technological domain exac-erbates the challenges of retrieving, interpreting, and applying mature knowledge in the inno-vation, given that such knowledge becomes distant both temporally and technologically. As a result, it becomes more difficult, costly, and time-consuming for the inventor to recognize, evaluate, and retrieve mature knowledge that is also technologically distant (Cohen & Levinthal, 1990; Wang & Li, 2008). In addition, the complementary expertise needed to leverage such mature knowledge is likely to be lacking, which hinders its successful applica-tion in the innovation. Acquiring unrelated knowledge elements may cause information over-load, confusion, and diseconomies of scope (Ahuja & Lampert, 2001), since the innovation entails both noncurrent and heterogeneous knowledge. This lack of coherence may prevent the inventor from leveraging a restricted bundle of close-knit skills, thus undermining the use of mature knowledge in the innovation (Nesta & Saviotti, 2005; Perez & Soete, 1988). Developing such competencies entails restricting knowledge exploration so that it remains in proximity to the current knowledge base. Relying on technologically distant knowledge for which the inventor’s available knowledge base is insufficient may thus further limit experi-ence and familiarity with mature knowledge. Limited expertise and possible misapplication of mature knowledge can in turn impair the scientific value of the innovation.
Finally, technological distance exacerbates the risk of obsolescence inherent in the use of mature knowledge in the innovation. Lack of familiarity with knowledge that is distant from the current technological domain makes it more difficult to identify possible alternative com-binations and uses for mature knowledge in the innovation (Kogut & Zander, 1992). Consequently, it may be impossible to extend the productive lifespan of an innovation that relies on such knowledge. In sum, the technological distance of knowledge is expected to limit the scientific value of the innovation incorporating mature knowledge, so that maxi-mum innovation value is reached for more recent knowledge elements.
Hypothesis 2: Reliance on more technologically distant knowledge will decrease the linear effect of knowledge maturity on the scientific value of the innovation resulting from that knowledge.
Technological distance can undermine the relevance and usefulness of mature knowledge because of limits to absorptive capacity and the need for technological compatibility or even complementarity with the current knowledge base. In contrast, geographical distance does not preclude successful recombination of knowledge and is less likely to impose impedi-ments on knowledge transfer and internalization. In fact, whereas technological distance can limit the contribution of knowledge maturity to the value of an innovation, we expect geo-graphical distance to improve that contribution, thus extending the maturity of knowledge at which innovation value is maximized. By incorporating geographically distant knowledge, the inventor can enhance the novelty of an innovation that relies on mature knowledge and reduce the likelihood of its obsolescence.
Because of the localized nature of knowledge and the ensuing geographically bounded nature of knowledge externalities that are reinforced by cross-national institutional and cul-tural differences (Audretsch & Feldman, 1996; Jaffe et al., 1993; Mueller et al., 2013; Phene & Tallman, 2002), geographical distance can limit the accessibility of knowledge (Freel,
by guest on May 29, 2014jom.sagepub.comDownloaded from
Capaldo et al. / Knowledge Maturity and the Value of Innovations 9
2003; Oerlemans & Meeus, 2005). Hence, knowledge that is common in its country of origin may be perceived as novel when applied in an innovation that is introduced in a distant coun-try (Cantwell, 1989). Increasing geographical distance of embedded knowledge can thus enable the inventor to revitalize mature knowledge and enhance the scientific value of the innovation.
The fact that mature knowledge is newly applied in a certain geographical region contrib-utes to its novelty in that region under the assumption that knowledge originating from a different country is likely to be distinctive. Indeed, research on national innovation systems has demonstrated that different nations develop distinctive technological competencies by leveraging unique knowledge bases. Consequently, the geographical distance of knowledge is often associated with its distinctiveness (Frost, 2001). Cross-national differences in knowl-edge characteristics have been ascribed to distinctive national cultures (Hofstede, 1980), different regulatory systems, country-specific practices and rules, unique national resource endowments, and distinctive industry structures that direct innovation in unique paths (Porter, 1990). Such cross-national differences can influence both the type of knowledge created and the process by which it is created. For instance, cross-national differences may explain a tendency to expand abroad in search of knowledge that is not available in the home country (Florida, 1997; Serapio & Dalton, 1999). Therefore, by seeking geographically distant knowledge, the inventor can enhance the perceived uniqueness of mature knowledge that is incorporated in the innovation.
Moreover, incorporating mature knowledge in an innovation that is developed in distant locations reduces the likelihood that it will become obsolete in its country of application even if it has already been overexploited in its country of origin. Therefore, seeking geographi-cally distant knowledge reduces the hazard of mature knowledge becoming obsolete (Leonard-Barton, 1992). Overall, geographical distance is expected to enhance the value of an innovation incorporating mature knowledge, so that maximum innovation value is reached for more mature knowledge elements.
Hypothesis 3: Reliance on more geographically distant knowledge will increase the linear effect of knowledge maturity on the scientific value of the innovation resulting from that knowledge.
Industry Adoption of Knowledge and the Scientific Value of Innovations
The scientific value of an innovation relying on mature knowledge derives in part from the relative novelty of such knowledge, which in turn depends on the extent to which it has been adopted in the industry. Scholars have considered the prior use of knowledge (e.g., Katila & Ahuja, 2002), but have paid less attention to the extent to which such knowledge has been used in various innovations. We contend that the use of mature knowledge in multiple innovations can limit the prospects of new applications while facilitating knowledge obsoles-cence and undermining the novelty of an innovation that relies on that knowledge.
Whereas knowledge maturity increases the applicability of innovations that leverage that knowledge, the adoption of mature knowledge in the industry counters this process by limit-ing the number of remaining applications. An innovation that incorporates well-received industry knowledge can support related innovations (Marinova, 2004) and contribute to the emergence of industry standards (Gawer & Cusumano, 2002). However, the adoption of knowledge in the industry may limit the value of any innovation whose perceived value is
by guest on May 29, 2014jom.sagepub.comDownloaded from

10 Journal of Management / Month XXXX
already reduced as a result of its reliance on mature knowledge. The availability of possible applications for an innovation is eventually exhausted not only because of the prolonged time that has passed since the corresponding knowledge was first introduced, but also because of the popular use of that knowledge by multiple firms, which limits the potential for discover-ing novel applications that leverage that knowledge. Thus, the adoption of mature knowledge in the industry reduces the scientific value of the corresponding innovation.
As knowledge is adopted and becomes widely available in the industry, its distinctiveness is limited (Ahuja & Katila, 2004; Rothaermel & Boeker, 2008), and its potential contribution to the value of the innovation incorporating it is reduced (James et al., 2013). The value of a particular innovation may decline over time as the inventor faces greater challenges in gen-erating novel combinations of adopted knowledge elements (Kogut & Zander, 1992; Messeni Petruzzelli & Savino, 2012). Assuming a limited number of possible knowledge recombina-tions, the adoption of knowledge in the industry facilitates exploitation. Hence, the wide adoption of mature knowledge diminishes the value of an innovation relying on that knowl-edge more rapidly as it becomes outdated. Moreover, because the knowledge dissemination is time-consuming, as mature knowledge is adopted by many firms in the industry it becomes susceptible to the hazard of leaking to competing innovations. To the extent that it is com-monly used in a large number of innovations, over time, the adopted knowledge becomes more transparent and codified (Zander & Kogut, 1995), thus progressing on the learning cycle associated with established knowledge (Zollo & Winter, 2002). Specifically, the increased codification of mature knowledge that becomes widely adopted in the industry facilitates imitation, thus limiting the uniqueness of any innovation that incorporates mature knowledge. As the number of innovations using mature knowledge increases, the scientific value of an innovation that incorporates such knowledge diminishes because of potential substitution by related innovations. In sum, the adoption of mature knowledge in the industry limits its uniqueness while facilitating its obsolescence, so that maximum innovation value is reached for more recent knowledge elements.
Hypothesis 4: Reliance on widely adopted knowledge will decrease the linear effect of knowledge maturity on the scientific value of the innovation resulting from that knowledge.
Research Method
Research Setting and Data
The U.S. biotechnology industry serves as the setting for testing our hypotheses. This set-ting is suitable for several reasons. First, biotechnology has revolutionized the process by which drugs are discovered and developed, so that it leverages a combination of mature and recent knowledge and expertise (Rothaermel & Boeker, 2008). Second, this industry relies on multiple technologies, involving molecular biology, immunology, genetics, combinatorial chemistry, and bioinformatics (Sørensen & Stuart, 2000), underscoring the need to search for knowledge across technological domains (Phene et al., 2006). Third, besides its technologi-cal diversity, the biotechnology industry exhibits geographical diversity, as shown by differ-ences across national systems of biotechnology innovation (Bartholomew, 1997). Fourth, because patents are an effective means for protecting intellectual property in the biotechnol-ogy industry (Albert, Avery, Narin, & McAllister, 1991; Hoang & Rothaermel, 2010; Phene
by guest on May 29, 2014jom.sagepub.comDownloaded from
Capaldo et al. / Knowledge Maturity and the Value of Innovations 11
et al., 2006; Rothaermel & Boeker, 2008), prior research supports our reliance on patent-based measures for studying the scientific value of innovations in this setting (Somaya, 2012). Finally, because the biotechnology industry originated in the United States and since U.S. firms typically file for domestic patents (Phene & Almeida, 2008), our focus on U.S. firms ensures the representativeness of our sample.
Our sample corresponds to the innovations of 283 U.S. firms, both public and private, listed in the BioScan database, that filed for at least one biotechnology patent with the U.S. Patent and Trademark Office (USPTO) between 1985 and 2002.1 The cited patents cover the full history of modern biotechnology since Cohen and Boyer’s invention involving recombi-nant DNA in 1973. We focused on patents issued in the United States because it is almost compulsory to first patent there, in the largest market for biotechnology. The final sample included 5,575 patents (focal patents) filed by the 283 firms. For this set of focal patents, we identified 51,151 cited patents (previously issued patents cited by the focal patents) that served for assessing the knowledge incorporated in innovations. We also collected data on the 57,503 subsequent patents that cite the focal patents, to measure the value of the resulting innovation. We gathered firm-level data from multiple sources, including SEC filings for publicly traded firms, press releases, and corporate websites. Missing values (0.2% of the observations) were treated with listwise deletion (Allison, 2000).
Variables
Dependent variable. The scientific value of an innovation refers to its quality (Phene et al., 2006), impact (Nerkar, 2003), and potential contribution to further technology develop-ment from the standpoint of the scientific community (e.g., Albert et al., 1991; Sorenson et al., 2006; Trajtenberg, 1990). Thus, the value of an innovation (InnovationValue) was mea-sured by the number of forward citations received by a focal patent until 2009 (e.g., Cattani, 2005; Singh, 2008). Forward citations to a patent serve as an appropriate proxy for the value of an innovation as captured by industry awards, as perceived by technology experts, and with respect to its social value (Trajtenberg, 1990). Patent citations are assumed to furnish essential technological and economic information. First, patented innovations are for the most part the result of costly R&D conducted by profit-seeking firms. Thus, when they invest in an innovation disclosed in a prior patent, the resulting (citing) patents signify that the cited innovation is valuable. Second, citations often occur over an extended period, which allows for dissipation of the uncertainty regarding the cited patent’s technological viability and com-mercial use. Therefore, citations that are observed years after the cited patent was granted indicate the impact of the patented innovation (Nerkar, 2003).2 To capture the value of an innovation, we incorporated information on all citing patents, including non-biotechnology patent classes. Since patents from different years have different “windows of opportunity” to be cited in our data set, directly comparing patent citations across patents from different years would be inappropriate. To overcome this, we include year fixed effects and patent age in our models, so that systematic intertemporal differences are accounted for (Jaffe & Trajtenberg, 2002).
Independent variable. Following prior research (Katila, 2002; Rosenkopf & Nerkar, 2001; Sørensen & Stuart, 2000), for each focal patent we measured the average maturity of patents cited by that patent. The maturity of knowledge (KnowMaturity) was measured as
by guest on May 29, 2014jom.sagepub.comDownloaded from

12 Journal of Management / Month XXXX
the average number of years elapsed since the filing date of patents cited in the focal patent document. The maximum value of knowledge maturity observed for a single cited patent was 34 years. Backward citations to patents describe technical information relating to the knowledge upon which the focal patent is based (Walker, 1995). Prior research has validated the use of patent citations for capturing knowledge search activities (e.g., Albert et al., 1991; Trajtenberg, 1990). Hence, patent citations can serve for measuring the maturity of knowl-edge elements incorporated by the focal patent.
Moderating variables. We operationalized moderating variables based on information on backward citations listed in each patent document. Information on patent classes served for determining technological distance. The assignee’s country of origin served for calculat-ing geographical distance, and the number of cited patents served for calculating knowl-edge adoption. Specifically, for each focal patent, the technological distance of knowledge (TechDist) was measured as the ratio of the number of backward citations assigned to pat-ent classes that are not associated with the biotechnology industry to the total number of backward citations (Phene et al., 2006). For each focal patent, the geographical distance (GeoDist) of knowledge was measured as the distance in thousands of miles from the home country of the focal patent’s assignee to the home countries of the inventors associated with the cited patents. To calculate this measure, we considered the firm’s subsidiary in which the innovation took place rather than its headquarters location and averaged the distance across all inventors listed for a patent. The resultant value was further averaged across all patents cited by the focal patent. This approach is preferable to relying only on the location of the first inventor (e.g., Phene et al., 2006; Singh, 2005) since, unlike in scientific publications, where the first author typically takes the lead in conducting the research, in patent applica-tions the first inventor listed often plays a formal role as principal investigator or owner of the research center or laboratory that conducts the research. Finally, for each focal pat-ent, we followed Huang and Murray (2009) and Ziedonis (2004) in measuring the adoption
of knowledge in the industry (KnowAdoption) as 1
1n
NASSCITED
NCITEDi
ii
n
=∑ , where NASSCITEDi
indicates the number of different firms that have previously cited patent i, which is cited by the focal patent, while NCITEDi indicates the count of all patents that have previously cited that patent. This measure takes into account the relative concentration of the citing patents, thus capturing the number of distinctive innovations relying on a particular knowledge ele-ment. Knowledge adoption and the technological and geographical distances of knowledge search served as moderators of the relationship between the scientific value of an innovation and knowledge maturity.
Control variables. The main effects of our moderators served as control variables. In addition, we incorporated several control variables considered by prior research that may affect the value of innovations. For each focal patent, we controlled for the age of patent (PatentAge) by counting the number of years elapsed since the filing date of a focal patent until the year 2009, thus accounting for right censoring, that is, the risk that an older patent may receive a greater number of forward citations because it can accumulate citations for a longer time. We also took into account the diversity of knowledge maturity (KnowMatu-rityDiversity), measured by the standard deviation in the number of years elapsed since the
by guest on May 29, 2014jom.sagepub.comDownloaded from
Capaldo et al. / Knowledge Maturity and the Value of Innovations 13
filing date of patents cited by the focal patent (Katila, 2002). As this time spread increases, knowledge recombination may become more challenging yet fruitful (Nerkar, 2003). Next, we controlled for interorganizational collaboration (InterOrgCollab) in the innovation pro-cess by counting the number of applicants to which the patent was assigned. In addition, we considered the effects exerted by the different dimensions of search. Following Capaldo and Messeni Petruzzelli (2011), we measured search span (SearchSpan) as the number of differ-ent three-digit patent classes assigned to a patent by the USPTO. Search depth and search scope were evaluated based on the measures proposed by Katila and Ahuja (2002). Specifi-cally, search depth (SearchDepth) was measured for each focal patent as the average number of times a patent was repeatedly cited during the past 5 years. In turn, search scope (Search-Scope) was measured for each patent as the share of citations that could not be found in the list of patents cited in the prior 5 years. In addition, we controlled for the number of claims per patent (Claims) (Lanjouw & Schankerman, 2004), references to scientific knowledge (SciKnowledge) measured by the number of nonpatent references each focal patent cited (Narin, Hamilton, & Olivastro, 1997), and number of forward self-citations (SelfCitations).
Besides controls at the innovation level, we controlled for relevant organizational attri-butes by considering the firm’s patent stock (PatentStock) as a proxy for its expertise, capa-bility, or propensity to innovate (e.g., Hall, Jaffe, & Trajtenberg, 2005). Firms with greater patent stocks are more likely to successfully finalize the patenting process, so this variable controls for possible survivor bias (see also Nooteboom, Vanhaverbeke, Duysters, Gilsing, & van den Oord, 2007). The firm’s patent stock was measured as the natural logarithm of the number of patents that the firm filed with the USPTO during the 5 years preceding the filing date of a focal patent. We also controlled for the firm’s innovation performance (Ahuja & Lampert, 2001; Nerkar, 2003) by counting the number of thousands of forward citations received by the firm prior to the filing of the focal patent (InnovationPerformance). We fur-ther accounted for such performance by measuring the firm’s proportion of patent applica-tions that were not approved by the USPTO (InnovationFailure). High values of this measure indicate inability to innovate successfully. In addition, we controlled for the firm’s size, which may affect its innovation ability, by computing the natural logarithm of the average number of firm employees during the 5 years prior to the filing date of each sampled patent (FirmSize). This proxy is suitable for measuring firm size in the biotechnology industry, because many of these firms do not yet generate revenue, while their assets are mainly intan-gible (e.g., Rothaermel & Boeker, 2008). Moreover, the size of the team involved in knowl-edge development may affect the value of the resulting innovation as a result of economies of specialization. In fact, large teams may have access to a wide pool of knowledge (Singh, 2008). Therefore, we controlled for team size (TeamSize), measured as the number of inven-tors associated with each patent. We also controlled for the firm’s public status (PublicFirm) using a dummy variable that receives a value of one if the firm is publicly traded at the filing date of its focal patents, and zero otherwise. Also, we controlled for business diversification (BusDiversification), which may affect innovation (Hitt, Hoskisson, & Kim, 1997), by count-ing the number of different SIC codes assigned to the firm.
Next, we controlled for the firm’s age (FirmAge) by computing the difference between a firm’s year of incorporation and the filing year of a focal patent. The firm’s age reflects expe-rience with organizational routines that may enhance the efficiency of innovation. However, in rapidly changing environments, such experience may undermine the firm’s ability to adapt using innovative capabilities (Sørensen & Stuart, 2000). Furthermore, the firm’s strategies
by guest on May 29, 2014jom.sagepub.comDownloaded from
14 Journal of Management / Month XXXX
for knowledge search may also vary with its particular biotechnology domain, so we included dummies to control for assigned patent classes 424 (drug, bio-affecting, and body treating compositions), 435 (chemistry: molecular biology and microbiology), 514 (drug, bio-affect-ing and body treating compositions others), 530 (chemistry: natural resins or derivatives; peptides or proteins; lignins or reaction products thereof), and 800 (multicellular living organisms and unmodified parts thereof and related processes), with remaining classes that together account for less than 10% of the total number of patents serving as the omitted cat-egory. We also controlled for government support (GovInterest), using a dummy variable that receives a value of one if the patent has been funded by the U.S. government, and zero oth-erwise. This variable indicates whether the innovation is socially relevant. In addition, we controlled for the technological evolution of the industry (Audretsch, 1995; Klepper, 1997), using the natural logarithm of the accumulated number of USPTO patents issued in biotech-nology patent classes at the time of the focal patent’s filing (IndustryEvolution). Thus, our findings cannot be simply ascribed to the trajectory of evolution of the biotechnology indus-try. Finally, we incorporated year dummies (Year) to capture temporal trends. Overall, our extensive battery of controls can effectively limit unobserved heterogeneity at the innovation and firm levels.
Analysis
The focal patent served as the unit of analysis. Since the dependent variable is a nonnega-tive integer count variable, the negative binomial model is appropriate for estimating it. The Poisson model assumes equity between the mean and the variance. But patent data typically feature overdispersion, as evident by the coefficient of variation (standard deviation/mean) that equals 2.11 in our case. The negative binomial model that corrects for such overdisper-sion is more suitable, since it allows for the variance to differ from the mean (Gourieroux, Monfort, & Trognon, 1984; Hausman, Hall, & Griliches, 1984). We used hierarchical mod-els, with Model 1 serving as the baseline model that includes only the control variables, Models 2 to 5 serving as partial models that introduce the independent variable and each of the moderating variables, and Model 6 serving as the full model that incorporates all vari-ables. We relied on the partial models for testing our hypotheses, since tests for potential multicollinearity indicated that the maximum variance inflation factor (VIF) index in the full model exceeds the critical value of 10 (Kleinbaum, Lawrence, Muller, & Nizam, 1998). The high VIF values can be ascribed to the multiple inclusions of the main effects in the interac-tion terms. No symptoms of multicollinearity were observed, as coefficients and levels of significance remain consistent across models.
Results
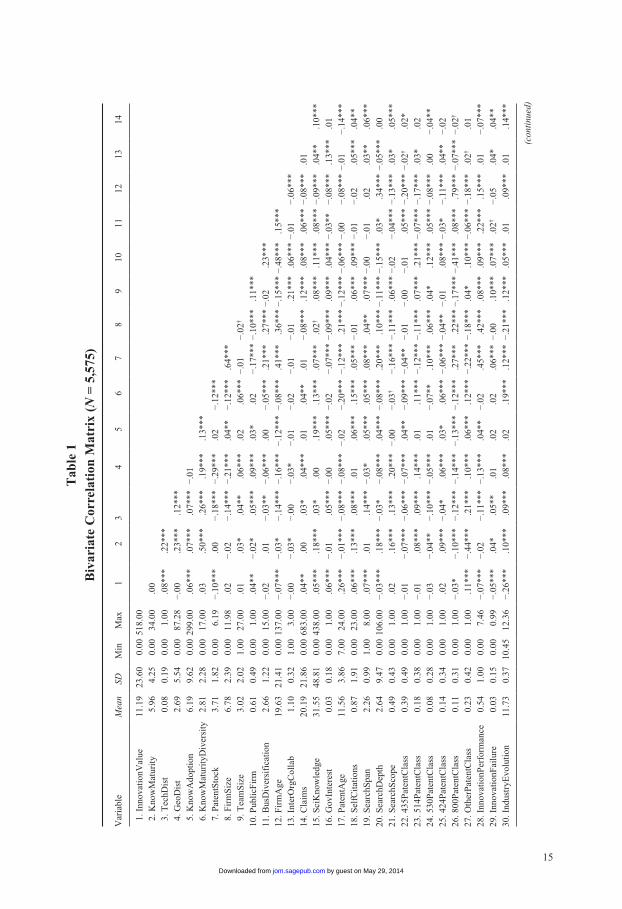
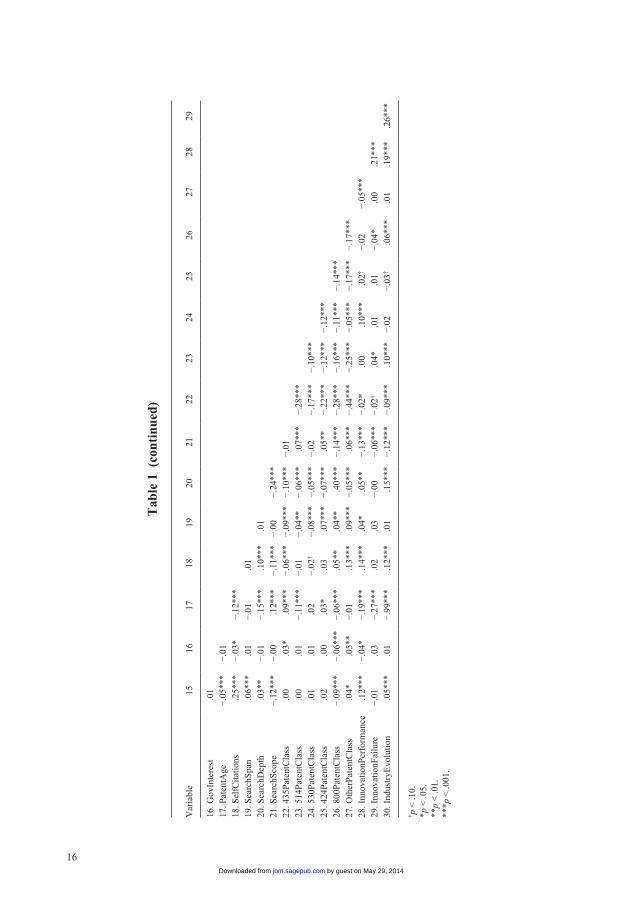
Table 1 reports descriptive statistics and pairwise correlations, showing relatively low correlations except for those measured across PatentStock and FirmSize, and PatentAge and IndustryEvolution. To avoid concerns about multicollinearity, we excluded the controls for firm size and industry evolution from our reported models. The results of the negative bino-mial models are reported in Table 2, showing a good statistical fit to the data. Consistent with prior research, Model 1 reveals that while controlling for self-citations to the firm’s patents (ß = 0.10, p < .001), innovation value improves with the firm’s public status (ß = 0.10, p <
by guest on May 29, 2014jom.sagepub.comDownloaded from
15
Tab
le 1
Biv
aria
te C
orre
lati
on M
atri
x (N
= 5
,575
)
Var
iabl
eM
ean
SDM
inM
ax1
23
45
67
89
1011
1213
14
1. I
nnov
atio
nVal
ue11
.19
23.6
00.
0051
8.00
2.
Kno
wM
atur
ity
5.96
4.25
0.00
34.0
0.0
0
3. T
echD
ist
0.08
0.19
0.00
1.00
.08*
**.2
2***
4.
Geo
Dis
t2.
695.
540.
0087
.28
−.0
0.2
3***
.12*
**
5. K
now
Ado
ptio
n6.
199.
620.
0029
9.00
.06*
**.0
7***
.07*
**−
.01
6.
Kno
wM
atur
ityD
iver
sity
2.81
2.28
0.00
17.0
0.0
3.5
0***
.26*
**.1
9***
.13*
**
7. P
aten
tSto
ck3.
711.
820.
006.
19−
.10*
**.0
0−
.18*
**−
.29*
**.0
2−
.12*
**
8. F
irm
Siz
e6.
782.
390.
0011
.98
.02
−.0
2−
.14*
**−
.21*
**.0
4**
−.1
2***
.64*
**
9. T
eam
Siz
e3.
022.
021.
0027
.00
.01
.03*
.04*
*.0
6***
.02
.06*
**−
.01
−.0
2†
10. P
ubli
cFir
m0.
610.
490.
001.
00.0
4**
−.0
2*.0
5***
.09*
**.0
3*.0
2−
.17*
**−
.10*
**.1
1***
11
. Bus
Div
ersi
fica
tion
2.66
1.22
0.00
15.0
0−
.02
.01
−.0
3**
−.0
6***
.00
−.0
5***
.21*
**.2
7***
−.0
2.2
3***
12
. Fir
mA
ge19
.63
21.4
10.
0013
7.00
−.0
7***
−.0
3*−
.14*
**−
.16*
**−
.12*
**−
.08*
**.4
1***
.36*
**−
.15*
**−
.48*
**.1
5***
13
. Int
erO
rgC
olla
b1.
100.
321.
003.
00−
.00
−.0
3*−
.00
−.0
3*−
.01
−.0
2−
.01
−.0
1.2
1***
.06*
**−
.01
−.0
6***
14
. Cla
ims
20.1
921
.86
0.00
683.
00.0
4**
.00
.03*
.04*
**.0
1.0
4**
.01
−.0
8***
.12*
**.0
8***
.06*
**−
.08*
**.0
1
15. S
ciK
now
ledg
e31
.55
48.8
10.
0043
8.00
.05*
**.1
8***
.03*
.00
.19*
**.1
3***
.07*
**.0
2†.0
8***
.11*
**.0
8***
−.0
9***
.04*
*.1
0***
16. G
ovIn
tere
st0.
030.
180.
001.
00.0
6***
−.0
1.0
5***
−.0
0.0
5***
−.0
2−
.07*
**−
.09*
**.0
9***
.04*
**−
.03*
*−
.08*
**.1
3***
.01
17. P
aten
tAge
11.5
63.
867.
0024
.00
.26*
**−
.01*
**−
.08*
**−
.08*
**−
.02
−.2
0***
−.1
2***
.21*
**−
.12*
**−
.06*
**−
.00
−.0
8***
−.0
1−
.14*
**18
. Sel
fCit
atio
ns0.
871.
910.
0023
.00
.06*
**.1
3***
.08*
**.0
1.0
6***
.15*
**.0
5***
−.0
1.0
6***
.09*
**−
.01
−.0
2.0
5***
.04*
*19
. Sea
rchS
pan
2.26
0.99
1.00
8.00
.07*
**.0
1.1
4***
−.0
3*.0
5***
.05*
**.0
8***
.04*
*.0
7***
−.0
0−
.01
.02
.03*
*.0
6***
20. S
earc
hDep
th2.
649.
470.
0010
6.00
−.0
3***
.18*
**−
.03*
−.0
8***
.04*
**−
.08*
**.2
0***
.10*
**−
.11*
**−
.15*
**.0
3*.3
4***
−.0
5***
.00
21. S
earc
hSco
pe0.
490.
430.
001.
00.0
2.1
6***
.13*
**.2
0***
−.0
0−
.03†
−.1
6***
−.1
1***
.06*
**−
.02
−.0
4***
−.1
3***
.03*
.05*
**22
. 435
Pat
entC
lass
0.39
0.49
0.00
1.00
−.0
1−
.07*
**−
.06*
**−
.07*
**.0
4**
−.0
9***
−.0
4**
−.0
1−
.00
−.0
1.0
5***
−.2
0***
−.0
2†.0
2*23
. 514
Pat
entC
lass
0.18
0.38
0.00
1.00
−.0
1.0
8***
.09*
**.1
4***
.01
.11*
**−
.12*
**−
.11*
**.0
7***
.21*
**−
.07*
**−
.17*
**.0
3*.0
224
. 530
Pat
entC
lass
0.08
0.28
0.00
1.00
−.0
3−
.04*
*−
.10*
**−
.05*
**.0
1−
.07*
*.1
0***
.06*
**.0
4*.1
2***
.05*
**−
.08*
**.0
0−
.04*
*25
. 424
Pat
entC
lass
0.14
0.34
0.00
1.00
.02
.09*
**−
.04*
.06*
**.0
3*.0
6***
−.0
6***
−.0
4**
−.0
1.0
8***
−.0
3*−
.11*
**.0
4**
−.0
226
. 800
Pat
entC
lass
0.11
0.31
0.00
1.00
−.0
3*−
.10*
**−
.12*
**−
.14*
**−
.13*
**−
.12*
**.2
7***
.22*
**−
.17*
**−
.41*
**.0
8***
.79*
**−
.07*
**−
.02†
27. O
ther
Pat
entC
lass
0.23
0.42
0.00
1.00
.11*
**−
.44*
**.2
1***
.10*
**.0
6***
.12*
**−
.22*
**−
.18*
**.0
4*.1
0***
−.0
6***
−.1
8***
.02†
.01
28. I
nnov
atio
nPer
form
ance
0.54
1.00
0.00
7.46
−.0
7***
−.0
2−
.11*
**−
.13*
**.0
4**
−.0
2.4
5***
.42*
**.0
8***
.09*
**.2
2***
.15*
**.0
1−
.07*
**29
. Inn
ovat
ionF
ailu
re0.
030.
150.
000.
99−
.05*
**.0
4*.0
5**
.01
.02
.02
.06*
**−
.00
.10*
**.0
7***
.02†
−.0
5.0
4*.0
4**
30. I
ndus
tryE
volu
tion
11.7
30.
3710
.45
12.3
6−
.26*
**.1
0***
.09*
**.0
8***
.02
.19*
**.1
2***
−.2
1***
.12*
**.0
5***
.01
.09*
**.0
1.1
4***
(con
tinu
ed)
by guest on May 29, 2014jom.sagepub.comDownloaded from
16
Var
iabl
e15
1617
1819
2021
2223
2425
2627
2829
16. G
ovIn
tere
st.0
1
17. P
aten
tAge
−.0
5***
−.0
1
18. S
elfC
itat
ions
.25*
**−
.03*
−.1
2***
19
. Sea
rchS
pan
.06*
**.0
1−
.01
.01
20
. Sea
rchD
epth
.03*
*−
.01
−.1
5***
.10*
**.0
1
21. S
earc
hSco
pe−
.12*
**−
.00
.12*
**−
.11*
**−
.00
−.2
4***
22
. 435
Pat
entC
lass
.00
.03*
.09*
**−
.06*
**−
.09*
**−
.10*
**−
.01
23
. 514
Pat
entC
lass
.00
.01
−.1
1***
−.0
1−
.04*
*−
.06*
**.0
7***
−.2
8***
24
. 530
Pat
entC
lass
.01
.01
.02
−.0
2†−
.08*
**−
.05*
**−
.02
−.1
7***
−.1
0***
25
. 424
Pat
entC
lass
.02
.00
.03*
.03
.07*
**−
.07*
**.0
5**
−.2
2***
−.1
2***
−.1
2***
26
. 800
Pat
entC
lass
−.0
9***
−.0
6***
−.0
6***
.05*
*.0
4**
.40*
**−
.14*
**−
.28*
**−
.16*
**−
.11*
**−
.14*
**
27. O
ther
Pat
entC
lass
.04*
.05*
*−
.01
.13*
**.0
9***
−.0
5***
.06*
**−
.44*
**−
.25*
**−
.05*
**−
.17*
**−
.17*
**
28. I
nnov
atio
nPer
form
ance
.12*
**−
.04*
−.1
9***
.14*
**.0
4*.0
5**
−.1
3***
−.0
2*.0
0.1
0***
.02†
−.0
2−
.05*
**
29. I
nnov
atio
nFai
lure
−.0
1.0
3−
.27*
**.0
2.0
3−
.00
−.0
6***
−.0
2†.0
4*.0
1.0
1−
.04*
.00
.21*
**
30. I
ndus
tryE
volu
tion
.05*
**.0
1−
.99*
**.1
2***
.01
.15*
**−
.12*
**−
.09*
**.1
0***
−.0
2−
.03†
.06*
**.0
1.1
9***
.26*
**
† p <
.10.
*p <
.05.
**p
< .0
1.**
*p <
.001
.
Tab
le 1
(co
nti
nu
ed)
by guest on May 29, 2014jom.sagepub.comDownloaded from
17
Tab
le 2
Neg
ativ
e B
inom
ial R
egre
ssio
n M
odel
s
Dep
ende
nt V
aria
ble:
Inn
ovat
ionV
alue
Mod
el 1
Mod
el 2
Mod
el 3
Mod
el 4
Mod
el 5
Mod
el 6
Kno
wM
atur
ity
0.03
***
(0.0
1)0.
03**
* (0
.01)
0.04
***
(0.0
1)0.
03**
* (0
.01)
0.04
***
(0.0
1)K
now
Mat
urit
y2−
0.00
3***
(0.
00)
−0.
003*
** (
0.00
)−
0.00
4***
(0.
00)
−0.
002*
** (
0.00
)−
0.00
4***
(0.
00)
Kno
wM
atur
ity
× T
echD
ist
−0.
05**
(0.
02)
−0.
06**
(0.
02)
Kno
wM
atur
ity
× G
eoD
ist
0.00
3***
(0.
00)
0.00
3***
(0.
00)
Kno
wM
atur
ity
× K
now
Ado
ptio
n−
0.00
1**
(0.0
0)−
0.00
04**
(0.
00)
Tec
hDis
t1.
01**
* (0
.10)
1.01
***
(0.1
0)1.
43**
* (0
.23)
1.01
***
(0.1
0)0.
99**
* (0
.10)
1.43
***
(0.2
3)G
eoD
ist
−0.
02**
(0.
01)
−0.
01**
(0.
00)
−0.
01**
(0.
00)
−0.
02**
(0.
01)
−0.
01**
(0.
00)
−0.
02**
(0.
01)
Kno
wA
dopt
ion
0.01
***
(0.0
0)0.
01**
* (0
.00)
0.01
***
(0.0
0)0.
01**
* (0
.00)
0.03
***
(0.0
1)0.
02**
* (0
.000
)K
now
Mat
urit
yDiv
ersi
ty0.
04**
* (0
.00)
0.03
***
(0.0
0)0.
03**
* (0
.00)
0.04
***
(0.0
0)0.
03**
* (0
.00)
0.03
***
(0.0
0)S
elfC
itat
ions
0.10
***
(0.0
1)0.
10**
* (0
.01)
0.10
***
(0.0
1)0.
10**
* (0
.01)
0.10
***
(0.0
1)0.
10**
* (0
.01)
Cla
ims
0.01
***
(0.0
0)0.
01**
* (0
.00)
0.01
***
(0.0
0)0.
01**
* (0
.00)
0.01
***
(0.0
0)0.
01**
* (0
.00)
Gov
Inte
rest
0.48
***
(0.0
9)0.
47**
* (0
.09)
0.46
***
(0.0
9)0.
47**
* (0
.09)
0.45
***
(0.0
9)0.
45**
* (0
.09)
Sci
Kno
wle
dge
0.00
1***
(0.
00)
0.00
1***
(0.
00)
0.00
1***
(0.
00)
0.00
1***
(0.
00)
0.00
1***
(0.
00)
0.00
1***
(0.
00)
Inte
rOrg
Col
lab
−0.
12†
(0.0
5)−
0.12
† (0
.05)
−0.
10†
(0.0
5)−
0.12
† (0
.05)
−0.
11†
(0.0
5)−
0.09
† (0
.05)
Tea
mS
ize
0.04
***(
0.01
)0.
04**
*(0.
01)
0.04
***(
0.01
)0.
04**
*(0.
01)
0.04
***
(0.0
1)0.
04**
*(0.
01)
Pat
entA
ge0.
15**
* (0
.02)
0.15
***
(0.0
2)0.
15**
* (0
.02)
0.14
***
(0.0
2)0.
15**
* (0
.02)
0.14
** (
0.02
)P
ubli
cFir
m0.
10**
(0.
04)
0.10
** (
0.04
)0.
10**
(0.
04)
0.10
** (
0.04
)0.
10**
(0.
04)
0.10
***
(0.0
4)B
usD
iver
sifi
cati
on−
0.01
† (0
.01)
−0.
02†
(0.0
1)−
0.02
† (0
.01)
−0.
01†
(0.0
1)−
0.01
† (0
.01)
−0.
02†
(0.0
1)F
irm
Age
−0.
01**
* (0
.00)
−0.
01**
* (.
000)
−0.
01**
* (0
.00)
−0.
01**
* (0
.00)
−0.
01**
* (0
.00)
−0.
01**
* (0
.00)
Pat
entS
tock
−0.
07**
* (0
.01)
−0.
07**
* (0
.01)
−0.
07**
* (0
.01)
−0.
07**
* (0
.01)
−0.
07**
* (0
.01)
−0.
07**
* (0
.01)
Sea
rchS
pan
0.06
** (
0.02
)0.
06**
(0.
02)
0.04
** (
0.02
)0.
05**
(0.
02)
0.05
** (
0.02
)0.
04**
(0.
02)
Sea
rchD
epth
0.01
** (
0.00
)0.
01**
(0.
00)
0.01
** (
0.00
)0.
01**
(0.
00)
0.01
** (
0.01
)0.
01**
(0.
06)
Sea
rchD
epth
2−
0.00
03**
(0.
00)
−0.
0002
** (
0.00
)−
0.00
02**
(0.
00)
−0.
0002
** (
0.00
)−
0.00
02**
(0.
00)
−0.
0002
** (
0.00
)S
earc
hSco
pe−
0.15
* (0
.06)
−0.
14*
(0.0
6)−
0.12
* (0
.06)
−0.
14*
(0.0
6)−
0.14
* (0
.06)
−0.
10*
(0.0
5)In
nova
tion
Per
form
ance
0.05
** (
0.02
)0.
05**
(0.
02)
0.06
** (
0.02
)0.
05**
(0.
02)
0.05
** (
0.02
)0.
06**
(0.
02)
Inno
vati
onF
ailu
re−
0.09
(0.
17)
−0.
09 (
0.17
)−
0.07
(0.
17)
−0.
02 (
0.17
)−
0.09
(0.
17)
−0.
13 (
0.12
)42
4Pat
entC
lass
0.08
† (0
.05)
0.08
† (0
.05)
0.09
† (0
.05)
0.07
† (0
.05)
0.08
† (0
.05)
0.08
† (0
.05)
435P
aten
tCla
ss−
0.09
* (0
.04)
−0.
10*
(0.0
4)−
0.10
* (0
.04)
−0.
10*
(0.0
4)−
0.10
* (0
.04)
−0.
10*
(0.0
4)51
4Pat
entC
lass
0.05
(0.
04)
0.05
(0.
05)
0.05
(0.
05)
0.05
(0.
05)
0.04
(0.
05)
0.05
(0.
05)
530P
aten
tCla
ss−
0.07
(0.
06)
−0.
07 (
0.07
)−
0.05
(0.
07)
−0.
08 (
0.07
)−
0.07
(0.
07)
−0.
06 (
0.06
)80
0Pat
entC
lass
0.48
***
(0.1
0)0.
48**
* (0
.11)
0.55
***
(0.1
1)0.
46**
* (0
.11)
0.48
***
(0.1
1)0.
56**
* (0
.11)
Yea
r du
mm
ies
Incl
uded
Incl
uded
Incl
uded
Incl
uded
Incl
uded
Incl
uded
Lik
elih
ood
rati
o te
st (
χ2 )−
1670
0.17
***
−16
692.
02**
*−
1668
9.76
***
−16
684.
95**
*−
1669
0.84
***
−16
682.
16**
*Im
prov
emen
t in
fit o
ver
base
mod
el (
Δχ2 )
8.15
10.4
115
.22
9.33
18.0
1O
bser
vati
ons
5,57
55,
575
5,57
55,
575
5,57
55,
575
Not
e: H
uber
–Whi
te r
obus
t sta
ndar
d er
rors
are
rep
orte
d in
par
enth
eses
.† p
< .1
0.*p
< .0
5.**
p <
.01.
***p
< .0
01.
by guest on May 29, 2014jom.sagepub.comDownloaded from
18 Journal of Management / Month XXXX
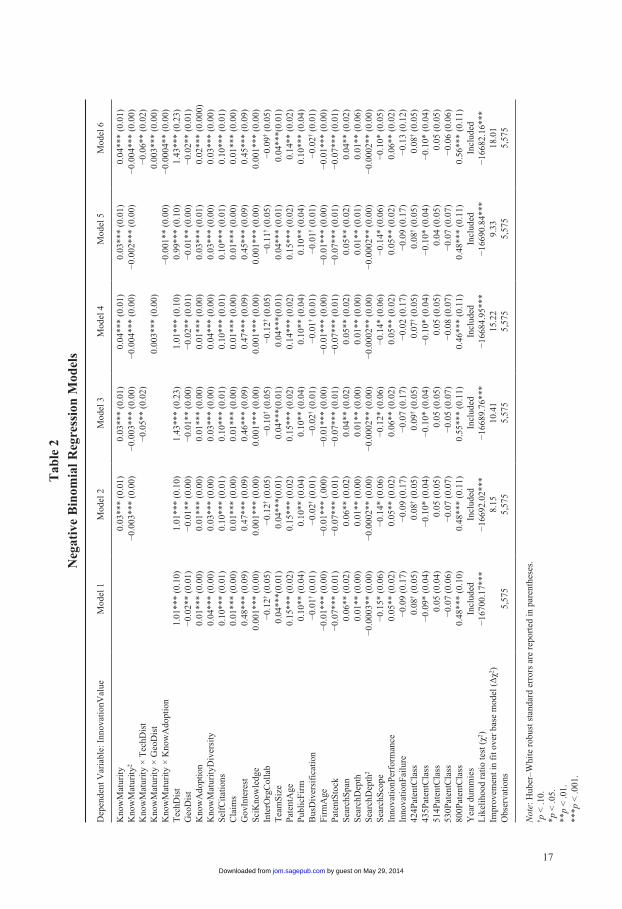
.01) (Cohen & Levin, 1989), the size of the inventor team (ß = 0.04, p < .001) (Singh, 2008), the number of patent claims (ß = 0.01, p < .001) (Lanjouw & Schankerman, 2004), the sup-port of the U.S. government (ß = 0.48, p < .001), the age of the patent (ß = 0.15, p < .001) (Reitzig, 2004), the scientific knowledge referred to by the patent (ß = 0.001, p < .001) (Fleming & Sorenson, 2004), and the firm’s innovation performance as captured by its accu-mulated number of patent citations (ß = 0.05, p < .01) (Ahuja & Lampert, 2001). In turn, increases in firm age (ß = −0.01, p < .001) (Sørensen & Stuart, 2000), interorganizational collaborations (ß = −0.12, p < .1) (Koput, 1997), business diversification (ß = −0.01, p < .1) (Hitt et al., 1997), and patent stock (ß = −0.07, p < .001) (Arora, Gambardella, Magazzini, & Pammolli, 2009) negatively affect the development of valuable innovations.
The time spread captured by the diversity of knowledge maturity (ß = 0.04, p < .001) indicates the merits of combining old knowledge with new knowledge (Nerkar, 2003). Search depth generates an inverted U-shaped effect on the value of innovations (ß1 = 0.01, ß2 = −0.0003, p < .01) (Katila & Ahuja, 2002), and search span produces a positive effect (ß = 0.06, p < .01) (Capaldo & Messeni Petruzzelli, 2011), while the effect of search scope (ß = −0.15, p < .05) is negative (Laursen & Salter, 2006). We tested the nonlinear effects of both search span and search scope, finding no significant effects of their quadratic terms on the value of innovations. Finally, innovations are less valuable in the molecular biology and microbiology field (ß = −0.09, p < .05) as defined by patent class 435, with higher value observed in the fields of bio-affecting and body treating compositions (ß = 0.08, p < .1) and multicellular living organisms (ß = 0.48, p < .001), as indicated by patent classes 424 and 800, respectively. In addition, technological distance enhances innovation (ß = 1.01, p < .001), whereas geographical distance is detrimental to innovation (ß = −0.02, p < .01). Hence, the value of an innovation improves when the inventor spans technological boundaries while also restricting the geographical scope of knowledge search (Phene et al., 2006). Finally, the adoption of knowledge in the industry contributes to the value of an innovation (ß = 0.01, p < .001), probably by enhancing its legitimacy and applicability.
Per Model 2, knowledge maturity generates an inverted U-shaped effect on innovation value, in support of Hypothesis 1. Specifically, the linear term of KnowMaturity is positive (ß = 0.03, p < .001), whereas its squared term is negative (ß = −0.003, p < .001). Thus, beyond a certain threshold, knowledge maturity becomes detrimental to the value of innova-tions. According to Model 3, Hypothesis 2 gains support, as evidenced by the negative inter-action effect of knowledge maturity and technological distance (ß = −0.05, p < .01). Similarly, Hypothesis 3 gains support in Model 4, based on the significant positive interaction of knowledge maturity and geographical distance (ß = 0.003, p < .001). Finally, per Model 5, Hypothesis 4 gains support, as indicated by the negative interaction effect of knowledge maturity and knowledge adoption (ß = −0.001, p < .01). These effects persist in the full model (Model 6), to which they are introduced simultaneously.
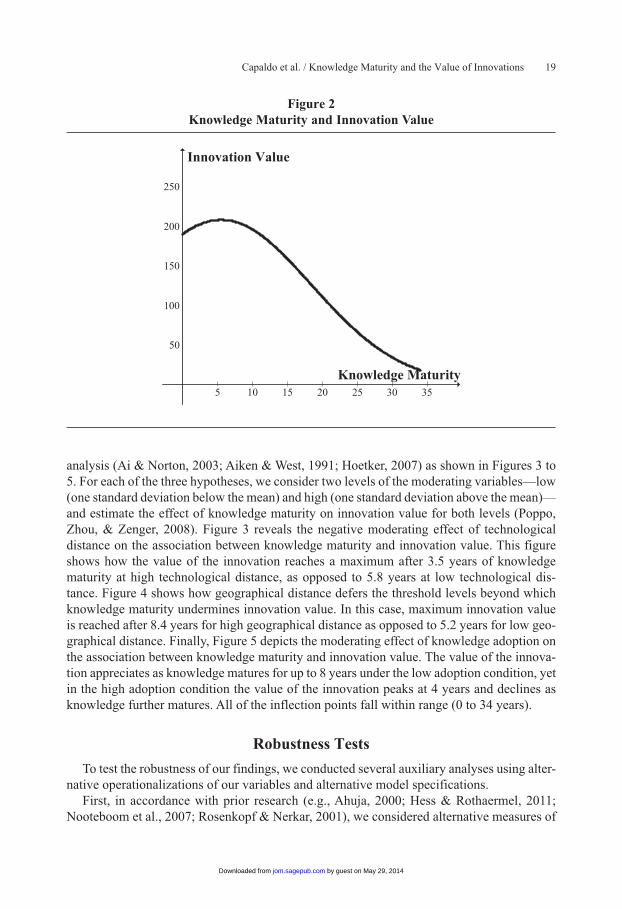
Figure 2 depicts the predicted value of an innovation as a function of knowledge maturity, showing that when knowledge matures beyond 5.5 years, the costs of its maturity outweigh the benefits. Hence, there is a relatively short period during which the value of the innovation increases, followed by an extended period of substantial decline in value. This inverted U-shaped pattern suggests that the effect of knowledge maturity on the scientific value of an innovation is not merely increasing at decreasing rates (Nerkar, 2003), but in fact declines after a certain threshold. To gain further insight into the interaction effects predicted by Hypotheses 2, 3, and 4, we decompose the interaction terms and conduct simple slope
by guest on May 29, 2014jom.sagepub.comDownloaded from
Capaldo et al. / Knowledge Maturity and the Value of Innovations 19
analysis (Ai & Norton, 2003; Aiken & West, 1991; Hoetker, 2007) as shown in Figures 3 to 5. For each of the three hypotheses, we consider two levels of the moderating variables—low (one standard deviation below the mean) and high (one standard deviation above the mean)—and estimate the effect of knowledge maturity on innovation value for both levels (Poppo, Zhou, & Zenger, 2008). Figure 3 reveals the negative moderating effect of technological distance on the association between knowledge maturity and innovation value. This figure shows how the value of the innovation reaches a maximum after 3.5 years of knowledge maturity at high technological distance, as opposed to 5.8 years at low technological dis-tance. Figure 4 shows how geographical distance defers the threshold levels beyond which knowledge maturity undermines innovation value. In this case, maximum innovation value is reached after 8.4 years for high geographical distance as opposed to 5.2 years for low geo-graphical distance. Finally, Figure 5 depicts the moderating effect of knowledge adoption on the association between knowledge maturity and innovation value. The value of the innova-tion appreciates as knowledge matures for up to 8 years under the low adoption condition, yet in the high adoption condition the value of the innovation peaks at 4 years and declines as knowledge further matures. All of the inflection points fall within range (0 to 34 years).
Robustness Tests
To test the robustness of our findings, we conducted several auxiliary analyses using alter-native operationalizations of our variables and alternative model specifications.
First, in accordance with prior research (e.g., Ahuja, 2000; Hess & Rothaermel, 2011; Nooteboom et al., 2007; Rosenkopf & Nerkar, 2001), we considered alternative measures of
Figure 2Knowledge Maturity and Innovation Value
5 10 15 20 25 30 35
50
100
150
200
250
Knowledge Maturity
Innovation Value
by guest on May 29, 2014jom.sagepub.comDownloaded from
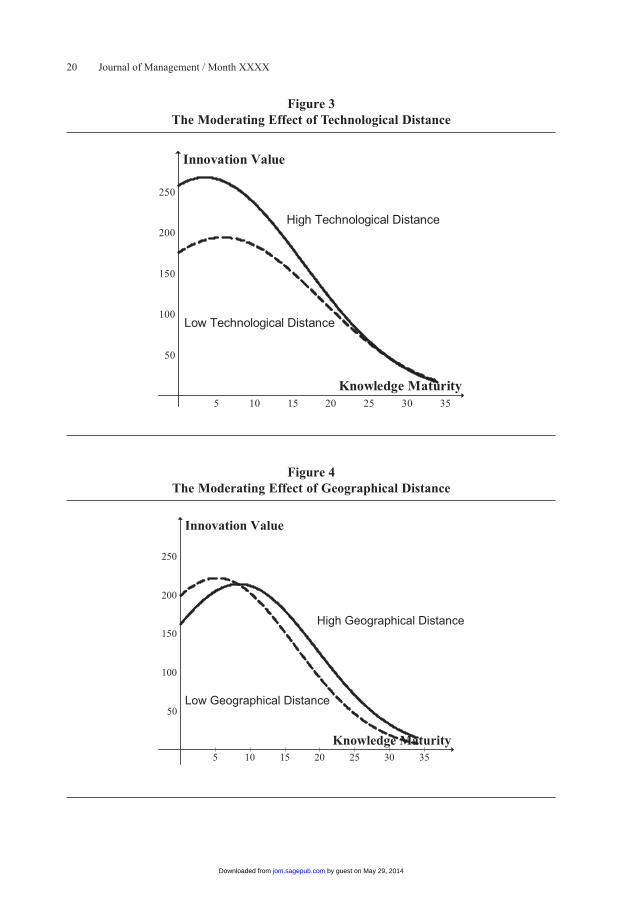
20 Journal of Management / Month XXXX
Figure 4The Moderating Effect of Geographical Distance
5 10 15 20 25 30 35
50
100
150
200
250
Knowledge Maturity
Innovation Value
Low Geographical Distance
High Geographical Distance
Figure 3The Moderating Effect of Technological Distance
5 10 15 20 25 30 35
50
100
150
200
250
Knowledge Maturity
Innovation Value
Low Technological Distance
High Technological Distance
by guest on May 29, 2014jom.sagepub.comDownloaded from
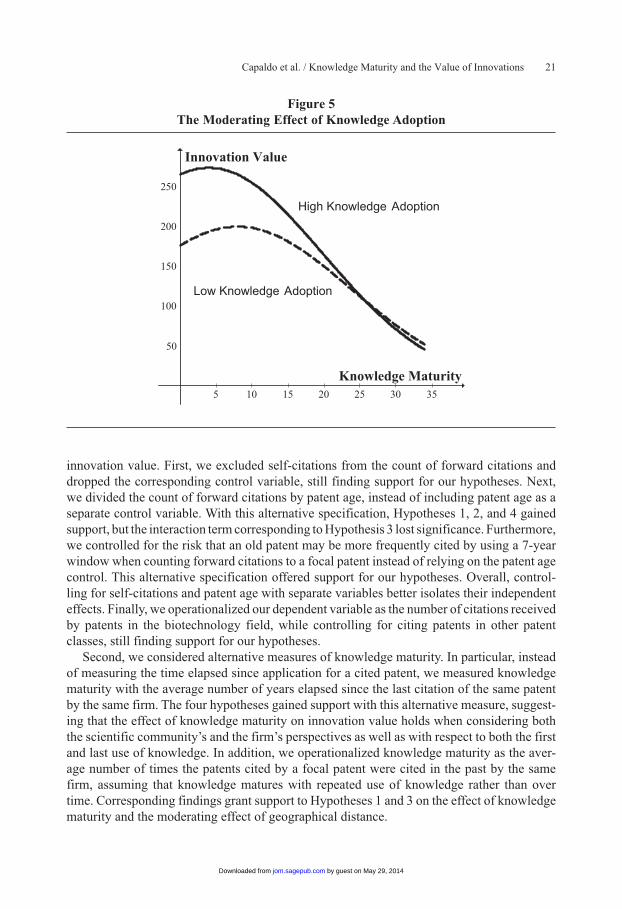
Capaldo et al. / Knowledge Maturity and the Value of Innovations 21
innovation value. First, we excluded self-citations from the count of forward citations and dropped the corresponding control variable, still finding support for our hypotheses. Next, we divided the count of forward citations by patent age, instead of including patent age as a separate control variable. With this alternative specification, Hypotheses 1, 2, and 4 gained support, but the interaction term corresponding to Hypothesis 3 lost significance. Furthermore, we controlled for the risk that an old patent may be more frequently cited by using a 7-year window when counting forward citations to a focal patent instead of relying on the patent age control. This alternative specification offered support for our hypotheses. Overall, control-ling for self-citations and patent age with separate variables better isolates their independent effects. Finally, we operationalized our dependent variable as the number of citations received by patents in the biotechnology field, while controlling for citing patents in other patent classes, still finding support for our hypotheses.
Second, we considered alternative measures of knowledge maturity. In particular, instead of measuring the time elapsed since application for a cited patent, we measured knowledge maturity with the average number of years elapsed since the last citation of the same patent by the same firm. The four hypotheses gained support with this alternative measure, suggest-ing that the effect of knowledge maturity on innovation value holds when considering both the scientific community’s and the firm’s perspectives as well as with respect to both the first and last use of knowledge. In addition, we operationalized knowledge maturity as the aver-age number of times the patents cited by a focal patent were cited in the past by the same firm, assuming that knowledge matures with repeated use of knowledge rather than over time. Corresponding findings grant support to Hypotheses 1 and 3 on the effect of knowledge maturity and the moderating effect of geographical distance.
Figure 5The Moderating Effect of Knowledge Adoption
5 10 15 20 25 30 35
50
100
150
200
250
Knowledge Maturity
Innovation Value
High Knowledge Adoption
Low Knowledge Adoption
by guest on May 29, 2014jom.sagepub.comDownloaded from
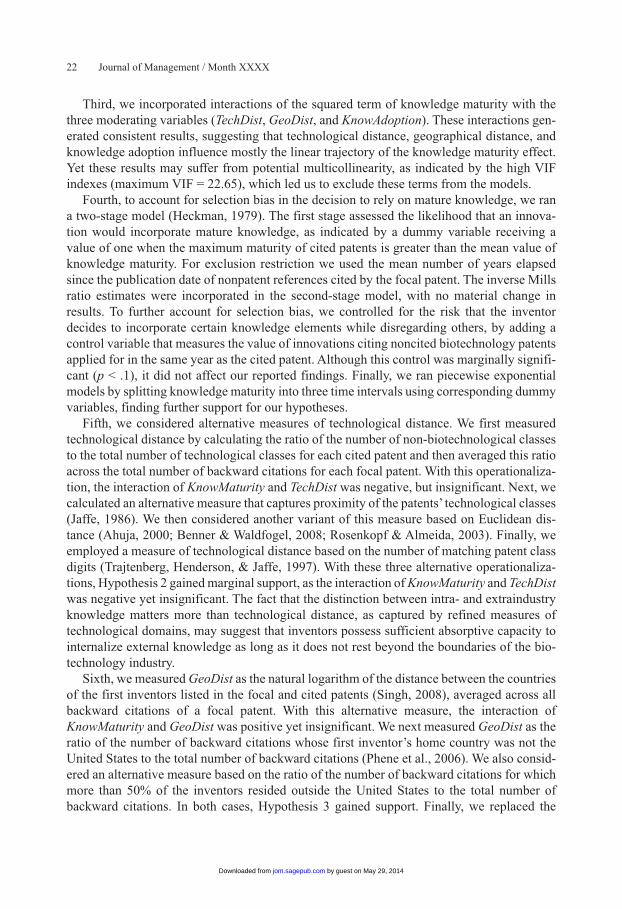
22 Journal of Management / Month XXXX
Third, we incorporated interactions of the squared term of knowledge maturity with the three moderating variables (TechDist, GeoDist, and KnowAdoption). These interactions gen-erated consistent results, suggesting that technological distance, geographical distance, and knowledge adoption influence mostly the linear trajectory of the knowledge maturity effect. Yet these results may suffer from potential multicollinearity, as indicated by the high VIF indexes (maximum VIF = 22.65), which led us to exclude these terms from the models.
Fourth, to account for selection bias in the decision to rely on mature knowledge, we ran a two-stage model (Heckman, 1979). The first stage assessed the likelihood that an innova-tion would incorporate mature knowledge, as indicated by a dummy variable receiving a value of one when the maximum maturity of cited patents is greater than the mean value of knowledge maturity. For exclusion restriction we used the mean number of years elapsed since the publication date of nonpatent references cited by the focal patent. The inverse Mills ratio estimates were incorporated in the second-stage model, with no material change in results. To further account for selection bias, we controlled for the risk that the inventor decides to incorporate certain knowledge elements while disregarding others, by adding a control variable that measures the value of innovations citing noncited biotechnology patents applied for in the same year as the cited patent. Although this control was marginally signifi-cant (p < .1), it did not affect our reported findings. Finally, we ran piecewise exponential models by splitting knowledge maturity into three time intervals using corresponding dummy variables, finding further support for our hypotheses.
Fifth, we considered alternative measures of technological distance. We first measured technological distance by calculating the ratio of the number of non-biotechnological classes to the total number of technological classes for each cited patent and then averaged this ratio across the total number of backward citations for each focal patent. With this operationaliza-tion, the interaction of KnowMaturity and TechDist was negative, but insignificant. Next, we calculated an alternative measure that captures proximity of the patents’ technological classes (Jaffe, 1986). We then considered another variant of this measure based on Euclidean dis-tance (Ahuja, 2000; Benner & Waldfogel, 2008; Rosenkopf & Almeida, 2003). Finally, we employed a measure of technological distance based on the number of matching patent class digits (Trajtenberg, Henderson, & Jaffe, 1997). With these three alternative operationaliza-tions, Hypothesis 2 gained marginal support, as the interaction of KnowMaturity and TechDist was negative yet insignificant. The fact that the distinction between intra- and extraindustry knowledge matters more than technological distance, as captured by refined measures of technological domains, may suggest that inventors possess sufficient absorptive capacity to internalize external knowledge as long as it does not rest beyond the boundaries of the bio-technology industry.
Sixth, we measured GeoDist as the natural logarithm of the distance between the countries of the first inventors listed in the focal and cited patents (Singh, 2008), averaged across all backward citations of a focal patent. With this alternative measure, the interaction of KnowMaturity and GeoDist was positive yet insignificant. We next measured GeoDist as the ratio of the number of backward citations whose first inventor’s home country was not the United States to the total number of backward citations (Phene et al., 2006). We also consid-ered an alternative measure based on the ratio of the number of backward citations for which more than 50% of the inventors resided outside the United States to the total number of backward citations. In both cases, Hypothesis 3 gained support. Finally, we replaced the
by guest on May 29, 2014jom.sagepub.comDownloaded from
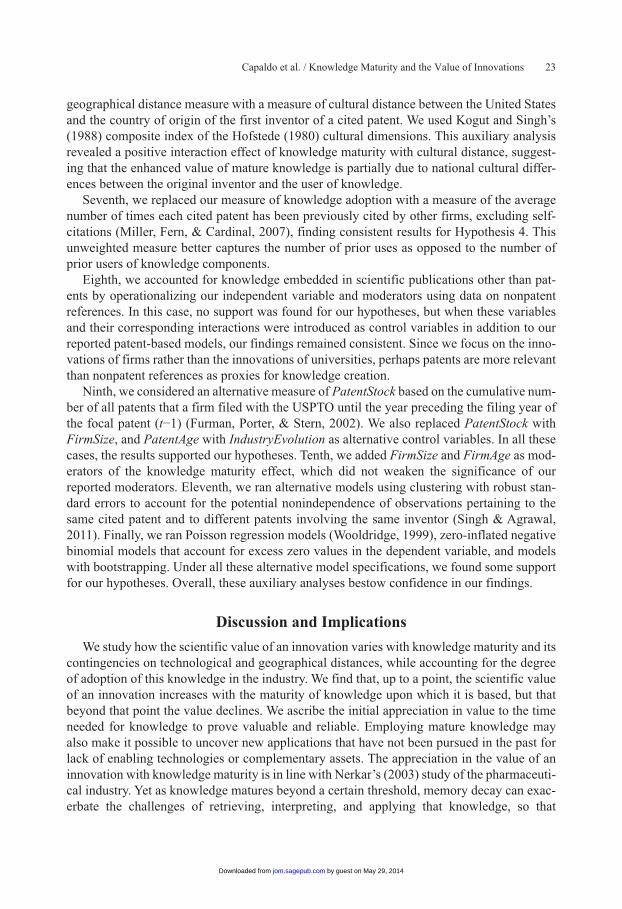
Capaldo et al. / Knowledge Maturity and the Value of Innovations 23
geographical distance measure with a measure of cultural distance between the United States and the country of origin of the first inventor of a cited patent. We used Kogut and Singh’s (1988) composite index of the Hofstede (1980) cultural dimensions. This auxiliary analysis revealed a positive interaction effect of knowledge maturity with cultural distance, suggest-ing that the enhanced value of mature knowledge is partially due to national cultural differ-ences between the original inventor and the user of knowledge.
Seventh, we replaced our measure of knowledge adoption with a measure of the average number of times each cited patent has been previously cited by other firms, excluding self-citations (Miller, Fern, & Cardinal, 2007), finding consistent results for Hypothesis 4. This unweighted measure better captures the number of prior uses as opposed to the number of prior users of knowledge components.
Eighth, we accounted for knowledge embedded in scientific publications other than pat-ents by operationalizing our independent variable and moderators using data on nonpatent references. In this case, no support was found for our hypotheses, but when these variables and their corresponding interactions were introduced as control variables in addition to our reported patent-based models, our findings remained consistent. Since we focus on the inno-vations of firms rather than the innovations of universities, perhaps patents are more relevant than nonpatent references as proxies for knowledge creation.
Ninth, we considered an alternative measure of PatentStock based on the cumulative num-ber of all patents that a firm filed with the USPTO until the year preceding the filing year of the focal patent (t−1) (Furman, Porter, & Stern, 2002). We also replaced PatentStock with FirmSize, and PatentAge with IndustryEvolution as alternative control variables. In all these cases, the results supported our hypotheses. Tenth, we added FirmSize and FirmAge as mod-erators of the knowledge maturity effect, which did not weaken the significance of our reported moderators. Eleventh, we ran alternative models using clustering with robust stan-dard errors to account for the potential nonindependence of observations pertaining to the same cited patent and to different patents involving the same inventor (Singh & Agrawal, 2011). Finally, we ran Poisson regression models (Wooldridge, 1999), zero-inflated negative binomial models that account for excess zero values in the dependent variable, and models with bootstrapping. Under all these alternative model specifications, we found some support for our hypotheses. Overall, these auxiliary analyses bestow confidence in our findings.
Discussion and Implications
We study how the scientific value of an innovation varies with knowledge maturity and its contingencies on technological and geographical distances, while accounting for the degree of adoption of this knowledge in the industry. We find that, up to a point, the scientific value of an innovation increases with the maturity of knowledge upon which it is based, but that beyond that point the value declines. We ascribe the initial appreciation in value to the time needed for knowledge to prove valuable and reliable. Employing mature knowledge may also make it possible to uncover new applications that have not been pursued in the past for lack of enabling technologies or complementary assets. The appreciation in the value of an innovation with knowledge maturity is in line with Nerkar’s (2003) study of the pharmaceuti-cal industry. Yet as knowledge matures beyond a certain threshold, memory decay can exac-erbate the challenges of retrieving, interpreting, and applying that knowledge, so that
by guest on May 29, 2014jom.sagepub.comDownloaded from
24 Journal of Management / Month XXXX
eventually it may be rendered obsolete, thus diminishing the value of corresponding innova-tions. Therefore, our findings suggest that moderately mature knowledge is most desirable for enhancing the scientific value of resulting innovations.
Our findings further indicate that the desirable level of knowledge maturity is contingent upon the distance of that knowledge from the industry’s technological domain. The more distant the knowledge from the current domain of expertise in the industry, the more difficult it is to generate value from maturing knowledge. An inventor’s unfamiliarity with distant knowledge and increasing difficulties in searching, internalizing, and leveraging that knowl-edge can limit its recombination opportunities and depreciate the value of innovations. However, these impediments can be offset by seeking geographically distant knowledge that can rejuvenate mature knowledge and enhance the scientific value of innovations that incor-porate it. We ascribe this effect to the relative novelty of mature knowledge that is used remotely from its geographical origin.
Finally, we suggest that, as mature knowledge is being incorporated in an increasing num-ber of innovations, they lose their novelty. Therefore, inventors are better off leveraging that knowledge before it is adopted by many firms in their industry. This entails monitoring the pace of knowledge adoption in the industry. Consideration of the distance and adoption con-tingencies can clarify whether inventors should adopt external knowledge as soon as it becomes available or instead wait until its value appreciates as a result of enhanced reliability.
Implications for Theory
Our study contributes to management research and to the literature on innovation by revealing the contingent value of knowledge maturity. We investigate the interplay of the maturity of the knowledge elements underlying innovations with the technological and geo-graphical distances of that knowledge. Unlike prior research that has concentrated on firms’ commercial gains from innovations, we study how knowledge maturity shapes the value of innovations for the scientific community in terms of recognition by peer inventors and tech-nological impact on subsequent innovations. We show that the scientific value of knowledge maturity can be better assessed when considering its technological and geographical dis-tances. Hence, firms may need to trace the technological and geographical origins of knowl-edge and consider the extent of its adoption in their industry.
We conclude that there is an optimal level of maturity beyond which the value of an inno-vation depreciates. However, relatively mature knowledge can enhance the value of an inno-vation to the extent that it has been sourced from a distant country. Thus, the value of innovations incorporating mature knowledge varies by country of origin, so that firms that are late to introduce innovations can still increase the contribution of their innovations to the scientific community by extending the international scope of their knowledge search. Additional heterogeneity is ascribed to the distance of the incorporated knowledge from the industry’s technological domain. Such distance limits the relevance of the inventor’s techno-logical expertise, thus diminishing the scientific value of an innovation that relies on mature knowledge. Finally, we uncover a boundary condition, overlooked by prior research, relating to the adoption of mature knowledge in the industry. We demonstrate that because innovation does not occur in a vacuum, its scientific value depreciates faster with knowledge maturity if a larger number of innovations incorporate such knowledge.
by guest on May 29, 2014jom.sagepub.comDownloaded from

Capaldo et al. / Knowledge Maturity and the Value of Innovations 25
Our study further advances innovation research by shedding new light on the temporal aspect of innovation. Prior innovation research has mostly paid attention to other issues, such as a firm’s tendencies to rely on internal versus external knowledge (Laursen & Salter, 2006), engage in distant versus local search for technological competencies (Katila & Ahuja, 2002; Rosenkopf & Nerkar, 2001), and span multiple knowledge domains (Capaldo & Messeni Petruzzelli, 2011). Less attention has been paid to knowledge maturity, with only a few studies that show mixed findings. Our study reconciles this mixed evidence by revealing that mature knowledge enhances innovation value up to a certain threshold. However, unlike prior research that suggested that the value of an innovation increases at a decreasing rate (Nerkar, 2003), we show that, beyond a certain level of knowledge maturity, this value actually diminishes. We also reveal that the added value of mature knowledge depends on its distance, with some con-flicting implications depending on whether reach is extended in the technological domain or geographical domain. The distance of knowledge seems to influence both its novelty and the ability to absorb it (Phene et al., 2006), whereas the rate of adoption of knowledge in the industry affects mostly the ability to benefit from knowledge application.
In addition, our study informs research on balancing exploration and exploitation (Capaldo, 2007; Gupta, Smith, & Shalley, 2006; Lavie, Stettner, & Tushman, 2010; March, 1991) by showing how such balance can be achieved when searching for knowledge over time. Counter to the temporal separation approach to balance (Brown & Eisenhardt, 1997) that calls for focusing on either exploration or exploitation at a given time, we advocate reli-ance on intermediately mature knowledge. In line with the domain separation approach (Lavie, Kang, & Rosenkopf, 2011; Lavie & Rosenkopf, 2006) and the ambidexterity litera-ture (He & Wong, 2004; O’Reilly & Tushman, 2004; Rothaermel & Alexandre, 2009), we call for balance across the technological and geographical domains. Firms are advised to seek technologically proximate knowledge while spanning geographical boundaries. Thus, we call for balancing geographical exploration with technological exploitation when seeking mature knowledge.
Finally, our study informs research on absorptive capacity (Ben-Oz & Greve, in press; Cohen & Levinthal, 1990; Lane, Koka, & Pathak, 2006; Zahra & George, 2002) by noting the limitations of relying on external knowledge that differs from the internal knowledge base. Specifically, our findings suggest that even if external knowledge is well established in the market, its absorption remains challenging if the inventors lack a related knowledge base. The challenges of incorporating and applying mature knowledge are ascribed to misinterpre-tation, misunderstanding, and misapplication of such knowledge, problems that grow with the technological distance between such external knowledge and the inventors’ domain of expertise. In fact, our findings reveal that when innovations incorporate mature knowledge beyond the current technological domain, the value of those innovations quickly diminishes.
Managerial Implications
By demonstrating how mature knowledge can enhance the value of innovations, we encourage managers to consider not only the type of knowledge used in innovations but also its birth date and birthplace. Mature knowledge is not necessarily less valuable, but its value depends on how distant it is from the current knowledge base and country of origin. To inno-vate effectively, firms need to assess the distance of knowledge sources and their adoption in
by guest on May 29, 2014jom.sagepub.comDownloaded from
26 Journal of Management / Month XXXX
the industry. We expect mature knowledge to be most valuable when it is related to the indus-try’s technological domain, yet geographically distant. Hence, our findings depart from prior research on absorptive capacity (Phene et al., 2006) that underscored the value of proximity irrespective of the type of distance. Furthermore, our findings underscore the need to balance exploration and exploitation across domains (Lavie & Rosenkopf, 2006), since the value of an innovation is maximized when seeking distant knowledge in the geographical domain (i.e., exploration) while investing in local search in the technological domain (i.e., exploita-tion). Managers do not typically consider the origin of knowledge in their decisions to incor-porate mature knowledge in new innovations, but they should pay more attention to it when considering how to leverage such knowledge in their firms’ innovations.
Limitations and Directions for Future Research
Our study contributes to the innovation literature while leaving room for future research. First, using patents as indicators of innovation may raise potential methodological concerns. Although patent citations enable the tracking of knowledge flows among innovations, sev-eral citations are often added by examiners and thus may not reflect an actual knowledge flow (Alcacer & Gittelman, 2006). In addition, real knowledge flows generally occur through complex interactions involving written and oral communication, learning, face-to-face inter-actions, chance meetings, and close working relationships, which may be difficult to track using patent citations (Singh, 2005). Moreover, patents are often treated as homogenous in cross-sectional studies despite the fact that they significantly differ across firms, industries, and technology fields (Gittelman, 2008). Finally, not all innovations are patentable, and not all patents represent innovations (Giuri et al., 2007), with some firms relying on alternative means for protecting their knowledge resources (de Faria & Sofka, 2010). Hence, despite the popularity of patent data in the innovation literature, patents cannot fully capture an innova-tion’s value. Patents represent only a subset of firms’ technologies that corresponds primarily to codified knowledge. In addition, not all patent citations reflect genuine incorporation of prior knowledge. Path-breaking innovations may not involve extensive citations to historical patents. We handle some of these limitations by including relevant control variables and applying scrutiny when interpreting our results. Furthermore, we considered nonpatent sources of knowledge in our robustness tests. Despite the above limitations, patents are still the most commonly used proxy for innovations (e.g., Cattani, 2005; Miller et al., 2007; Rosenkopf & Nerkar, 2001; Singh, 2008), since patent data are readily available in most countries; the comprehensiveness of patent data supports both cross-sectional and longitudi-nal analysis; and patent data contain detailed useful information, such as technological fields, assignees, inventors, and some other market features (Ratanawaraha & Polenske, 2007), thus making patent citations the most robust measure for capturing the scientific value of an innovation.
Second, future research can reexamine how mature knowledge contributes to firms’ finan-cial and market performance (Heeley & Jacobson, 2008), perhaps by distinguishing the implications of value creation mechanisms from those of value appropriation mechanisms. Third, we focused on the technological and geographic distances of knowledge, but future research may consider additional types of distance, such as that relating to organizational differences between inventors. Fourth, whereas we focused on the implications of competi-tion by studying the adoption of knowledge in the industry, future research may study the
by guest on May 29, 2014jom.sagepub.comDownloaded from
Capaldo et al. / Knowledge Maturity and the Value of Innovations 27
effects of collaboration in driving knowledge creation and application (Lavie & Drori, 2012). Fifth, scholars can focus on the mechanisms that enable effective integration of mature knowledge in innovations. Perhaps the value of an innovation depends on the effectiveness of these processes irrespective of the distance of knowledge. Finally, our sample is limited to the innovations of U.S.-based biotechnology firms that may exhibit particular patterns of patenting. Future research may assess the generalizability of our findings by extending our inquiry to other industries and countries, such as those in which patents do not serve as an essential element of the appropriability regime. Our findings are mostly applicable in tech-nology-driven industries in which knowledge and innovation are paramount.
Notes1. The USPTO assigns the following patent classes to the biotechnology domain: 424 (drug, bio-affecting,
and body treating compositions), 435 (chemistry: molecular biology and microbiology), 436 (chemistry: analytical and immunological testing), 514 (drug, bio-affecting, and body treating compositions [different subclasses]), 530 (chemistry: natural resins or derivatives; peptides or proteins; lignins or reaction products thereof), 536 (organic compounds), 800 (multicellular living organisms and unmodified parts thereof and related processes), 930 (peptide or protein sequence), and PLT (plants) (Rothaermel & Thursby, 2007).
2. The use of forward citations is particularly suitable for our study, since citations added by examiners do not represent a critical issue. First, the share of examiner citations for biotechnology patents is the lowest com-pared to all other technological fields. In fact, only 25% of drug and medical patents contain examiner citations (Alcacer, Gittelman, & Sampat, 2009), and assignees withhold only 5% to 7% of the relevant citations (Lampe, 2012). Second, we rely on patents granted by the USPTO to U.S. firms, hence further reducing the share of examiner citations, which is especially high for foreign firms (Alcacer et al., 2009). As a result, the share of examiners’ cita-tions in our sample of patents accounts for only 402 patents granted after 2000, corresponding to about 20% of the overall number of forward citations.
ReferencesAbernathy, W. J., & Clark, K. B. 1985. Innovation: Mapping the winds of creative destruction. Research Policy,
14: 3-22.Adner, R., & Levinthal, D. 2002. The emergence of emerging technologies. California Management Review, 45:
50-66.Adner, R., & Snow, D. 2010. Old technology responses to new technology threats: Demand heterogeneity and
technology retreats. Industrial and Corporate Change, 19: 1655-1675.Ahuja, G. 2000. Collaboration networks, structural holes, and innovation: A longitudinal study. Administrative
Science Quarterly, 45: 425-455.Ahuja, G., & Katila, R. 2004. Where do resources come from? The role of idiosyncratic situations. Strategic
Management Journal, 25(8-9): 887-907.Ahuja, G., & Lampert, C. M. 2001. Entrepreneurship in the large corporation: A longitudinal study of how estab-
lished firms create breakthrough inventions. Strategic Management Journal, 22: 521-543.Ai, C., & Norton, E. C. 2003. Interaction terms in logit and probit models. Economic Letters, 80: 123-129.Aiken, L. S., & West, S. G. 1991. Multiple regression: Testing and interpreting interactions. Newbury Park, CA:
Sage.Albert, M. B., Avery, D., Narin, F., & McAllister, P. 1991. Direct validation of citation counts as indicators of
industrially important patents. Research Policy, 20: 251-259.Alcacer, J., & Gittelman, M. 2006. How do I know what you know? Patent examiners and the generation of patent
citations. Review of Economics and Statistics, 88: 774-779.Alcacer, J., Gittelman, M., & Sampat, B. 2009. Applicant and examiner citations in U.S. patents: An overview and
analysis. Research Policy, 38: 415-427.Allison, P. D. 2000. Multiple imputation for missing data. A cautionary tale. Sociological Methods and Research,
28: 301-309.
by guest on May 29, 2014jom.sagepub.comDownloaded from

28 Journal of Management / Month XXXX
Argote, L. 1999. Organizational learning: Creating, retaining and transferring knowledge. Boston: Kluwer.Arora, A., Gambardella, A., Magazzini, L., & Pammolli, F. 2009. A breath of fresh air? Firm type, scale, scope, and
selection effects in drug development. Management Science, 55: 1638-1653.Arthur, B. 2009. The nature of technology. New York: Free Press.Audretsch, D. B. 1995. Innovation and industry evolution. Cambridge, MA: MIT Press.Audretsch, D. B., & Feldman, M. P. 1996. R&D spillovers and the geography of innovation and production.
American Economic Review, 86: 630-640.Bartholomew, S. 1997. National systems of biotechnology innovation: Complex interdependence in the global sys-
tem. Journal of International Business Studies, 28: 241-266.Benner, M., & Waldfogel, J. 2008. Close to you? Bias and precision in patent-based measures of technological
proximity. Research Policy, 37: 1556-1567.Ben-Oz, C., & Greve, H. R. in press. Short- and long-term performance feedback and absorptive capacity. Journal
of Management.Brown, S. L., & Eisenhardt, K. M. 1997. The art of continuous change: Linking complexity theory and time-paced
evolution in relentlessly shifting organizations. Administrative Science Quarterly, 42: 1-35.Cantwell, J. 1989. Technological innovations and multinational corporations. Cambridge, UK: Blackwell.Capaldo, A. 2007. Network structure and innovation: The leveraging of a dual network as a distinctive relational
capability. Strategic Management Journal, 28: 585-608.Capaldo, A., & Messeni Petruzzelli, A. 2011. In search of alliance-level relational capabilities: Balancing innova-
tion value creation and appropriability in R&D alliances. Scandinavian Journal of Management, 27: 273-286.Cattani, G. 2005. Preadaptation, firm heterogeneity, and technological performance: A study on the evolution of
fiber optics, 1970-1995. Organization Science, 16: 563-580.Cattani, G. 2006. Technological pre-adaptation, speciation, and emergence of new technologies: How Corning
invented and developed fiber optics. Industrial and Corporate Change, 15: 285-318.Cohen, W. M., & Levin, R. C. 1989. Empirical studies of innovation and market structure. In R. C. Schmalensee &
R. Willig (Eds.), Handbook of industrial organization: 1059-1107. Amsterdam: Elsevier.Cohen, W. M., & Levinthal, D. 1990. Absorptive capacity: A new perspective on learning and innovation.
Administrative Science Quarterly, 35: 128-152.de Faria, P., & Sofka, W. 2010. Knowledge protection strategies of multinational firms—A cross-country compari-
son. Research Policy, 39: 956-968.Eisenhardt, K. 1989. Making fast strategic decisions in high-velocity environments. Academy of Management
Journal, 32: 543-576.Felin, T., & Hesterly, W. S. 2007. The knowledge-based view, nested heterogeneity, and new value creation:
Philosophical considerations on the locus of knowledge. Academy of Management Review, 32: 195-218.Fleming, L. 2001. Recombinant uncertainty in technological search. Management Science, 47: 117-132.Fleming, L., & Sorenson, O. 2004. Science as a map in technological search. Strategic Management Journal, 25:
909-928.Florida, R. 1997. The globalization of R&D: Results of a survey of foreign-affiliated R&D laboratories in the USA.
Research Policy, 26: 85-103.Freddi, D. 2009. The integration of old and new technological paradigms in low- and medium-tech sectors: The case
of mechatronics. Research Policy, 38: 548-558.Freel, M. S. 2003. Sectoral patterns of small firm innovation, networking and proximity. Research Policy, 32: 751-
770.Frost, T. 2001. The geographic sources of foreign subsidiaries’ innovations. Strategic Management Journal, 22:
101-123.Furman, J. L., Porter, M. E., & Stern, S. 2002. The determinants of national innovative capacity. Research Policy,
31: 899-933.Gawer, A., & Cusumano, M. A. 2002. Platform leadership: How Intel, Microsoft, and Cisco drive industry innova-
tion. Boston: Harvard Business School Press.Gittelman, M. 2008. A note on the value of patents as indicators of innovation: Implications for management
research. Academy of Management Perspective, 22: 21-27.Giuri, P., Mariani, M., Brusoni, S., Crespi, G., Francoz, D., Gambardella, A., Garcia-Fontes, W., Geuna, A.,
Gonzales, R., Harhoff, D., Hoisl, K., Le Bas, C., Luzzi, A., Magazzini, L., Nesta, L., Nomaler, O., Palomeras, N., Patel, P., Romanelli, M., & Verspagen, B. 2007. Inventors and invention processes in Europe: Results from the PatVal-EU survey. Research Policy, 36: 1107-1127.
by guest on May 29, 2014jom.sagepub.comDownloaded from
Capaldo et al. / Knowledge Maturity and the Value of Innovations 29
Gourieroux, C., Monfort, A., & Trognon, A. 1984. Pseudo maximum likelihood methods: Theory. Econometrica, 52: 681-700.
Grant, R. M. 1996. Toward a knowledge-based theory of the firm. Strategic Management Journal, 17: 109-122.Gupta, A. K, Smith, K. G., & Shalley, C. E. 2006. The interplay between exploration and exploitation. Academy of
Management Journal, 49: 693-706.Hall, B. H., Jaffe, A. B., & Trajtenberg, M. 2005. Market value and patent citations. RAND Journal of Economics,
36: 16-38.Hausman, J., Hall, B., & Griliches, Z. 1984. Econometric models for count data with an application to the patents—
R&D relationship. Econometrica, 52: 909-938.He, Z., & Wong, P. 2004. Exploration vs. exploitation: An empirical test of the ambidexterity hypothesis.
Organization Science, 15: 481-494.Heckman, J. 1979. Sample selection bias as a specification error. Econometrica, 47: 153-161.Heeley, M. B., & Jacobson, R. 2008. The recency of technological inputs and financial performance. Strategic
Management Journal, 29: 723-744.Henderson, R. M., & Cockburn, I. M. 1994. Measuring competence? Exploring firm effects in pharmaceutical
research. Strategic Management Journal, 15: 63-84.Hess, A. M., & Rothaermel, F. T. 2011. When are assets complementary? Star scientists, strategic alliances, and
innovation in the pharmaceutical industry. Strategic Management Journal, 32: 895-909.Hitt, M. A., Hoskisson, R. E., & Kim, H. 1997. International diversification: Effects on innovation and firm perfor-
mance in product-diversified firms. Academy of Management Journal, 40: 767-798.Hoang, H., & Rothaermel, F. T. 2010. Leveraging internal and external experience: Exploration, exploitation, and
R&D project performance. Strategic Management Journal, 31: 734-758.Hoetker, G. 2007. The use of logit and probit models in strategic management research: Critical issues. Strategic
Management Journal, 28: 331-343.Hofstede, G. 1980. Culture’s consequences: International differences in work-related values. Beverly Hills, CA:
Sage.Huang, K. G., & Murray, F. E. 2009. Does patent strategy shape the long-run supply of public knowledge? Evidence
from human genetics. Academy of Management Journal, 52: 1193-1221.International Herald Tribune. 2009. Using old ideas to shine new light on cancer. December 31: 7.Jaffe, A. B. 1986. Technological opportunity and spillovers of R&D: Evidence from firms’ patents, profits, and
market values. American Economic Review, 76: 984-1001.Jaffe, A. B., & Trajtenberg, M. 2002. Patents, citations, and innovations: A window on the knowledge economy.
Cambridge, MA: MIT Press.Jaffe, A. B., Trajtenberg, M., & Henderson, R. 1993. Geographic localization and knowledge spillovers as evi-
denced by patent citations. Quarterly Journal of Economics, 108: 577-598.James, S. D., Leiblein, M. J., & Lu, S. 2013. How firms capture value from their innovations. Journal of Management,
39: 1123-1155.Katila, R. 2002. New product search over time: Past ideas in their prime? Academy of Management Journal, 45:
995-1010.Katila, R., & Ahuja, G. 2002. Something old, something new: A longitudinal study of search behavior and new
product introduction. Academy of Management Journal, 45: 1183-1194.Katila, R., & Chen, E. L. 2008. Effects of search timing on innovation: The value of not being in sync with rivals.
Administrative Science Quarterly, 53: 593-625.Kleinbaum, D. G., Lawrence, L. K., Muller, K. E., & Nizam, A. 1998. Applied regression analysis and other multi-
variable methods. Pacific Grove, CA: Brooks/Cole.Klepper, S. 1997. Industry life cycles. Industrial and Corporate Change, 6: 145-182.Kogut, B., & Singh, H. 1988. The effect of national culture on the choice of entry mode. Journal of International
Business Studies, 19: 411-432.Kogut, B., & Zander, U. 1992. Knowledge of the firm, combinative capabilities, and the replication of technology.
Organization Science, 3: 383-397.Koput, K. W. 1997. A chaotic model of innovative search: Some answers, many questions. Organization Science,
8: 528-542.Lampe, R. 2012. Strategic citation. Review of Economics and Statistics, 94: 320-333.Lane, P. J., Koka, B. R., & Pathak, S. 2006. The reification of absorptive capacity: A critical review and rejuvenation
of the construct. Academy of Management Review, 31: 833-863.
by guest on May 29, 2014jom.sagepub.comDownloaded from

30 Journal of Management / Month XXXX
Lanjouw, J. O., & Schankerman, M. 2004. Patent quality and research productivity: Measuring innovation with multiple indicators. Economics Journal, 114: 441-465.
Laursen, K., & Salter, A. 2006. Open for innovation: The role of openness in explaining innovation performance among U.K. manufacturing firms. Strategic Management Journal, 27: 131-150.
Lavie, D., & Drori, I. 2012. Collaborating for knowledge creation and application: The case of nanotechnology research centers. Organization Science, 23: 704-724.
Lavie, D., Kang, J., & Rosenkopf, L. 2011. Balance within and across domains: The performance implications of exploration and exploitation in alliances. Organization Science, 22: 1517-1538.
Lavie, D., & Rosenkopf, L. 2006. Balancing exploration and exploitation in alliance formation. Academy of Management Journal, 49: 797-818.
Lavie, D., Stettner, U., & Tushman, M. L. 2010. Exploration and exploitation within and across organizations. Academy of Management Annals, 4: 109-155.
Leonard-Barton, D. 1992. Core capabilities and core rigidities: A paradox in managing new product development. Strategic Management Journal, 13: 111-125.
Liebowitz, S. J., & Margolis, S. E. 1995. Path dependence, lock-in and history. Journal of Law, Economics and Organization, 11: 205-226.
March, J. 1991. Exploration and exploitation in organizational learning. Organization Science, 2: 71-87.Marinova, D. 2004. Actualizing innovation effort: The impact of market knowledge diffusion in a dynamic system
of competition. Journal of Marketing, 68: 1-20.Messeni Petruzzelli, A., & Savino, T. 2012. Search, recombination, and innovation: Lessons from haute cuisine.
Long Range Planning. Advance online publication. doi:10.1016/j.lrp.2012.09.001Miller, D. J., Fern, M. J., & Cardinal, L. B. 2007. The use of knowledge for technological innovation within diversi-
fied firms. Academy of Management Journal, 50: 307-326.Mueller, V., Rosenbusch, N., & Bausch, A. 2013. Success patterns of exploratory and exploitative innovation: A
meta-analysis of the influence of institutional factors. Journal of Management, 39: 1606-1636.Narin, F., Hamilton, K. S., & Olivastro, D. 1997. The increasing linkage between U.S. technology and public sci-
ence. Research Policy, 26: 313-330.Nelson, R., & Winter, S. 1982. An evolutionary theory of economic change. Cambridge, MA: Harvard University
Press.Nerkar, A. 2003. Old is gold? The value of temporal exploration in the creation of new knowledge. Management
Science, 49: 211-229.Nesta, L., & Saviotti, P. P. 2005. Coherence of the knowledge base and the firm’s innovative performance: Evidence
from the U.S. pharmaceutical industry. Journal of Industrial Economics, 53: 123-142.Nooteboom, B., Vanhaverbeke, W., Duysters, G., Gilsing, V., & van den Oord, A. 2007. Optimal cognitive distance
and absorptive capacity. Research Policy, 36: 1016-1034.Oerlemans, L. A. G., & Meeus, M. T. H. 2005. Do organizational and spatial proximity impact on firm perfor-
mance? Regional Studies, 39: 89-104.O’Reilly, C. A., III, & Tushman, M. L. 2004. The ambidextrous organization. Harvard Business Review, 82(4):
74-81.Perez, C., & Soete, L. 1988. Catching up in technology: Entry barriers and windows of opportunity. In G. Dosi, C.
Freeman, R. R. Nelson, G. Silverberg, & , L. L. Soete (Eds.), Technical change and economic theory: 458-479. London: Pinter.
Phene, A., & Almeida, P. 2008. Innovation in multinational subsidiaries: The role of knowledge assimilation and subsidiary capabilities. Journal of International Business Studies, 39: 901-919.
Phene, A., Fladmoe-Lindquist, K., & Marsh, L. 2006. Breakthrough innovations in the U.S. biotechnology industry: The effects of technological space and geographic origin. Strategic Management Journal, 27: 369-388.
Phene, A., & Tallman, S. 2002. Knowledge flows and geography in biotechnology. Journal of Medical Marketing, 2: 241-254.
Poppo, L., Zhou, K. Z., & Zenger, T. R. 2008. Examining the conditional limits of relational governance: Specialized assets, performance ambiguity, and long-standing ties. Journal of Management Studies, 45: 1195-1216.
Porter, M. E. 1990. The competitive advantage of nations. New York: Free Press.Ratanawaraha, A., & Polenske, K. R. 2007. Measuring the geography of innovation: A literature review. In K. R.
Polenske (Ed.), The economic geography of innovation: 30-59. Cambridge, UK: Cambridge University Press.
by guest on May 29, 2014jom.sagepub.comDownloaded from
Capaldo et al. / Knowledge Maturity and the Value of Innovations 31
Reitzig, M. 2004. Improving patent valuations for management purposes—Validating new indicators by analyzing application rationales. Research Policy, 33: 939-957.
Rosenkopf, L., & Almeida, P. 2003. Overcoming local search through alliances and mobility. Management Science, 49: 751-766.
Rosenkopf, L., & Nerkar, A. 2001. Beyond local search: Boundary-spanning, exploration, and impact in the optical disc industry. Strategic Management Journal, 22: 287-306.
Rothaermel, F. T., & Alexandre, M. T. 2009. Ambidexterity in technology sourcing: The moderating role of absorp-tive capacity. Organization Science, 20: 759-780.
Rothaermel, F. T., & Boeker, W. 2008. Old technology meets new technology: Complementarities, similarities, and alliance formation. Strategic Management Journal, 29: 47-77.
Rothaermel, F. T., & Thursby, M. 2007. The nanotech versus the biotech revolution: Sources of productivity in incumbent firm research. Research Policy, 36: 832-849.
Serapio, M. G., & Dalton, D. H. 1999. Globalization of industrial R&D: An examination of foreign direct invest-ments in R&D in the United States. Research Policy, 28: 303-316.
Singh, J. 2005. Collaborative networks as determinants of knowledge diffusion patterns. Management Science, 51: 756-770.
Singh, J. 2008. Distributed R&D, cross-regional knowledge integration and quality of innovative output. Research Policy, 37: 77-96.
Singh, J., & Agrawal, A. 2011. Recruiting for ideas: How firms exploit the prior inventions of new hires. Management Science, 57: 129-150.
Somaya, D. 2012. Patent strategy and management: An integrative review and research agenda. Journal of Management, 38: 1084-1114.
Sørensen, J., & Stuart, T. 2000. Aging, obsolescence, and organizational innovation. Administrative Science Quarterly, 45: 81-112.
Sorenson, O., Rivkin, J., & Fleming, L. 2006. Complexity, networks, and knowledge flow. Research Policy, 35: 994-1017.
Stuart, T. E., & Podolny, J. M. 1996. Local search and the evolution of technological capabilities. Strategic Management Journal, 17: 21-38.
Teece, D. J. 1986. Profiting from technological innovation: Implications for integration, collaboration, licensing and public policy. Research Policy, 15: 285-305.
Trajtenberg, M. 1990. A penny for your quotes: Patent citations and the value of innovations. RAND Journal of Economics, 21: 172-187.
Trajtenberg, M., Henderson, R., & Jaffe, A. B. 1997. University versus corporate patents: A window on the basic-ness of invention. Economics of Innovation and New Technology, 5: 19-50.
Turner, S. F., Mitchell, W., & Bettis, R. A. 2013. Strategic momentum: How experience shapes temporal consis-tency of ongoing innovation. Journal of Management, 39: 1855-1890.
Tushman, M. J., & Anderson, P. 1986. Technological discontinuities and organizational environments. Administrative Science Quarterly, 31: 439-465.
Van de Ven, A. H 1986. Central problems in the management of innovation. Management Science, 32: 590-607.Walker, R. 1995. Patents as scientific and technical literature. Metuchen, NJ: Scarecrow Press.Wang, H., & Li, J. 2008. Untangling the effects of overexploration and overexploitation on organizational perfor-
mance: The moderating role of environmental dynamism. Journal of Management, 34: 925-951.Wooldridge, J. M. 1999. Distribution-free estimation of some nonlinear panel data models. Journal of Econometrics,
90: 77-97.Zahra, S. A., & George, G. 2002. Absorptive capacity: A review, reconceptualization, and extension. Academy of
Management Review, 27: 185-203.Zander, U., & Kogut, B. 1995. Knowledge and the speed of the transfer and imitation of organizational capabilities:
An empirical test. Organization Science, 6: 76-92.Ziedonis, R. H. 2004. Don’t fence me in: Fragmented markets for technology and the patent acquisition strategies
of firms. Management Science, 50: 804-820.Zollo, M., & Winter, S. 2002. Deliberate learning and the evolution of dynamic capabilities. Organization Science,
13: 339-351.Zucker, L. G., Darby, M. R., & Brewer, M. B. 1998. Intellectual human capital and the birth of U.S. biotechnology
enterprises. American Economic Review, 88: 290-306.
by guest on May 29, 2014jom.sagepub.comDownloaded from
Top Related
Copyright © 2022 FDOKUMEN

