


Bahasa
Halaman
Hukum

© Emerald Group Publishing
1
Knowledge management in Iran aerospace industries: a study on critical factors
Mostafa Jafari, Peyman Akhavan, Jalal Rezaee Noor, and Mehdi N. Fesharaki
Industrial department of Iran University of Science and Technology, Tehran, Iran This article is (c) Emerald Group Publishing and permission has been granted for this version to appear here (http://www.emeraldinsight.com/journals.htm?articleid=1615793). Emerald does not grant permission for this article to be further copied/distributed or hosted elsewhere without the express permission from Emerald Group Publishing Limited.
Citation: Jafari, Mostafa, Akhavan, Peyman, Rezaee Nour, Jalal, and Mehdi N. Fesharaki (2007), Knowledge management in Iran aerospace industries: a study on critical factors, Aircraft Engineering and Aerospace Technology: An International Journal, Vol. 79, No. 4, pp. 375-389.
Abstract
Purpose: This paper is to discuss the essential issues of knowledge management adoption, in order
to establish a knowledge management program in Iran aerospace industries organization. In other
words, this research is one of the preliminary phases of implementing a knowledge management
system in a high-tech organization.
Design/methodology/approach: This research has identified critical factors of knowledge
management through Iran aerospace industries organizations based on a comprehensive review of
recent literature. For this purpose, a questionnaire was designed, applied and then analyzed by some
statistical methods. The results discussed various perspectives from the knowledge management
point of view, and provided some critical factors and a regression model for showing essential
issues of subject.
Findings: The statistical analysis determined eight factors as critical issues in this large scale case
study. These factors are "team working and KM features", "leadership and commitment of CEO",
"appropriate organizational infrastructure", "pilot and KM systems", "job enrichment and security",
"culture, change management and strategy", "collaborative and flexible organization" and "training
and learning". The overall results from the case study were positive as well, thus reflecting the
appropriateness of the suggested regression model.
© Emerald Group Publishing
2
Research limitations/implications: The extracted factors can act as a guideline for KM adoption in
the organizations. This helps to ensure that the essential issues are covered during design and
implementation phase of KM program. For academics, it provides a common language to discuss
and study the factors crucial for knowledge management.
Originality/value: The paper may present high value to researchers in the knowledge management
field and to practitioners involved with KM program in the organizations. This study further
provides an integrated perspective of critical issues for KM adoption in the high-tech industries
including the aerospace industry. It gives valuable information and guidelines that hopefully will
help the leaders to consider the important issues during knowledge management establishment in
the organization.
Keywords: Knowledge management, Critical factors, Aerospace industry, Iran.
Paper type: Case study
Introduction
Organizational capability is the sum of the specific skills, abilities, and competencies that
characterizes the organization as a system. Organizational capability evolves from experience,
individual skills and abilities, structures, processes, relationships, and the shared knowledge of the
organization. Since capability resides in the organizational system as a whole and not in specific
individuals, it is a unique characteristic of the organization. This makes it difficult to replicate
elsewhere and thus, becomes one of the few sources of sustained, competitive advantage in today’s
marketplace (Ulrich and Lake 1991).
Leaders who build organizational capability are actively involved in developing the intellectual
capital of their organizations. It follows that a key component of building organizational capability
is enriching the individual learning of organizational members. This is a necessity but not sufficient
condition for success.
Building organizational capability also requires putting in place organizational systems and
processes that capture individual learning and make them part of the organization’s collective
© Emerald Group Publishing
3
wisdom. Additionally, capability builders need to help differentiate essential from nonessential
learning by answering the questions “learning about what?" and “for what purpose?” They do so by
creating and disseminating a shared vision and values towards a knowledge-based organization.
If we are to come up with recommendations for educational intervention in knowledge-based
organizations, it is wise first to review some related topics concerning the characteristics of
successful organizations within the knowledge industry and, indeed, within industry in general in so
far as these characteristics might also apply to knowledge-based organizations.
A system or organization can be said to be knowledge-based if a significant portion of its internal
processes are focused on the exchange of knowledge, the creation and exploration of new solutions,
and coordination with other systems and organizations. In contrast to industrial systems that
produce tangible outputs, the outputs of a knowledge-based system generally have significant
intangible components such as innovation, creativity, discovery, or inventiveness. Knowledge
management also plays a vital role in a knowledge-based organization.
Knowledge management is known as a systematic, goal oriented application of measures to steer
and control the tangible and intangible knowledge assets of organizations, with the aim of using
existing knowledge inside and outside of these organizations to enable the creation of new
knowledge, and generate value, innovation and improvement (Wunram, 2000).
For a deeper understanding of the knowledge management processes, an attempt to express the
hidden meaning of data, information and knowledge is necessary. Data means a set of discrete and
objective facts concerning events. Therefore, they can be construed as a structured record of
transactions within an organization. Information is data with attributes of relevance and purpose,
usually having the format of a document or visual and/or audible message. Knowledge is linked to
the capacity for action. It is intuitive, therefore hard to define. It is linked to the users’ values and
experience, being strongly connected to pattern recognition, analogies and implicit rules (Joia,
2000).
© Emerald Group Publishing
4
KM is about interventions in the organizations' knowledge base, which by definition includes
individual and collective intellectual assets that help an organization to perform its tasks (Probst et
al., 2000). It undergoes regular changes that constitute organizational learning (Senge, 1990). A
review of the early KM literature shows that raw technical approaches drew the initial interest, but
are not sufficient to produce the desired outcome of KM (Davenport and Prusak, 2000). While
intranets and information repositories may provide means for people, they are not good in helping
people apply the new knowledge in the context of process work (Massey et al., 2002). Therefore,
every KM initiative has not only technical aspects, but also involves people and processes.
One of the most important industries which should be managed completely from the knowledge
point of view is aerospace industry. The design and construction of knowledge is incremental.
Aerospace systems are designed over time. They are tested, modified several times and certified.
The resulting observation product, usually called experience feedback, is provided to designers who
use it to modify their current understanding of the artifacts they have designed. Knowledge about
these artifacts becomes progressively mature through this incremental process.
Knowledge management in the design of aerospace systems addresses the question of how
designers can share, capitalize, and re-use knowledge in an effective and reliable way. Knowledge
management is situated in groups, organizations, and communities, playing different roles in the
design process. Design of aerospace systems has specific properties, such as dealing with
complexity, traceability, maturity of knowledge, interaction between experts, awareness of the stats
of information, and trust in knowledge (Boy and Barnard, 2003).
Today’s aerospace organizations are technologically sophisticated, multi million dollar machines to
which millions of people entrust their lives every year. So technical information and knowledge has
to be completely accurate and up-to-date (Documentum solutions for the aerospace and defense
industries, 2004).
Aerospace is also one of the most important industries in many advanced countries. Considering the
role of aerospace in developed/developing countries and the importance of deployment the
© Emerald Group Publishing
5
scientific results and high-tech findings to different parts of the other industries, most governments
have a special attention to it.
The consequence of an aging workforce is the imminent loss of vital knowledge and experience in
organizations. The loss of corporate knowledge caused by retirements and layoffs has considerable
impact on the aerospace industry.
The loss of experience through layoffs and retirements has also a negative effect on the
performance level of the workers who remain, and this performance loss often translates into
bottom-line problems. The advancing age of many skilled aerospace workers in the next decades
will increase various kinds of risks. As older workers retire, new workers will have to be trained,
leading to a workforce with less experience and seasoned knowledge.
Considering the role of knowledge in aerospace industries, critical factors and issues for KM
adoption should be distinguished and analyzed carefully. In this way, the main objectives of this
research are:
- Studying the effects of KM on the organizational success;
- Identification of the critical factors affecting successful adoption of a knowledge
management program;
- Analysis of the relations between the identified critical factors and organizational features.
Knowledge management in Iran aerospace industries organization
Aerospace and defense companies are facing increased pressure to boost efficiency as they cope
with shifting demands for new aerospace systems in a highly competitive environment.
Nevertheless, the inherent complexity of aerospace and defense means that companies cannot
achieve significant efficiency gains unless they provide a global workforce with streamlined access
to highly technical information. This requires a unified content value chain, where information can
be easily shared within and between relevant organizations (Documentum solutions for the
aerospace and defense industries, 2004).
© Emerald Group Publishing
6
To reduce costs, most of aerospace organizations have increased their outsourcing to suppliers of
subassemblies (such as engines, structures, landing gear, and avionics) and concentrating on their
core competencies of design, assembling and marketing aircraft. At the same time, they have made
efforts to reduce, reorganize, and rationalize their supply base. Thus, knowledge management in
these organizations has also become critical (Bozdogan et al., 1998; Gostic, 1998; Allen et al.,
2002).
To deal with an environment where wicked problems are common and aerospace projects can be
facilitated, creating a culture conducive to organizational learning, feedback, and error correction
has high importance in Iran Aerospace Industries Organization (AIO).
According to Schein (1999), to ensure that feedback is freely given without fear of blame,
competitive individualism must be minimized. Otherwise workers will simply dissociate themselves
from failure for fear of providing negative information about themselves or each other.
Unfortunately, the reward system, which is focused on paying individuals for performance, as well
as a “deep assumption that the individual really counts” (Schein, 1999) often strongly reinforce a
climate of competitive individualism. Hence, special efforts may need to be made to reward and
encourage teamwork and overcome the bias toward individualism in knowledge-based
organizations.
In their book, “The Power of Alignment,” Labovitz and Rosansky (1997) indicate that the most
important mechanism for ensuring effective feedback and error correction is to have measurements
in place that match the “theory of the business” and provide an accurate window on the current state
of the business.
Given the discussion above, it is not surprising that an orientation towards learning and openness to
change are key elements in many observers’ definition of the knowledge-based organization (De la
Mothe and Paquet 1997; Drucker 1992; Gregory 1998). For example, even as Jocelyne Bourgon
(1999) of the Canadian Centre for Management Development acknowledges the importance of a
leading-edge knowledge infrastructure to facilitate the collection, analysis and synthesis of
© Emerald Group Publishing
7
information, she goes on to argue that learning is an “essential and critical investment for a
knowledge-based organization.” Meanwhile, some researchers go even further, claiming that
learning is the “key to organizational survival.”
Taken together, the discussion above can lead AIO to a definition of the knowledge-based
organization which is centered on the following three attributes:
- its principal mission is to acquire, manipulate and deploy information and knowledge;
- it strives to be a ‘learning organization’ in which its members, both individually and collectively,
are continuously enhancing their capacity to produce results and adapt to changing circumstances;
- it is guided by a commitment to organizational excellence through such pursuits as benchmarking,
best practices and the fostering of collaborative relationships among its various stakeholders.
Considering the importance of knowledge management in a knowledge-based organization, this
topic will be discussed more, specially in some high-tech knowledge-based organizations such as
NASA.
NASA defines KM in this way:” Knowledge management is getting the right information to the
right people at the right time, and helping people create knowledge and share and act upon
information in ways that will measurably improve the performance of NASA and its partners.” This
means providing access to information at the time people need it to make the best decisions possible
for mission safety and success (Holcomb and Keegan, 2002).
Such as the most developing countries, Iran is also following a master program to reach the
important wish of capturing the space through launching the first Iranian national satellite. This
responsibility has been delegated to Iran’s Aerospace Industries Organization (AIO).
By now, Iranian engineers and scientists have spent many years working on this national project,
and have learned from the senior members and eventually mentored junior team members. Through
these years, AIO’s knowledge base and abilities are growing up. Today’s engineers and scientists
may work years on a project and then move on. Individually, they may gain a lot of knowledge, but
that knowledge remains with them and is not captured or passed on broadly for future missions.
© Emerald Group Publishing
8
New employees are tossed into a maelstrom of project implementation and expected to perform
without any substantial introduction to organizational processes, history, culture, and lessons
learned.
AIO’s knowledge, i.e. intellectual capital, is believed as the organization’s primary, sustainable
source of competitive advantage. Considering physical assets age, today’s workforce is mobile, and
technology is quickly bypassed. However, the leaders of AIO believe that knowledge in AIO can
endure. This knowledge is a fluid mix of experience and know-how that allows AIO’s employees to
strive for achieving the great wish of launching Iranian satellite.
Those companies whose cultures promote knowledge-sharing and individual learning have high
employee retention, attract high-quality employees, and have a workforce that focuses on fixing the
problem rather than fixing the blame. Knowledge management is the spark that will ignite AIO’s
ability to get the most from the investments have been made in its workforce and information
technology, and to harness the considerable intellectual capital within the organization and its
partners. Implementations in KM build upon technology and information to help and guide AIO
through the complexities of working with different teams and making ever-more-complex
decisions. AIO has many of the key ingredients to introduce itself as a knowledge-based
organization: a highly intelligent workforce, a need to learn in order to succeed, and some technical
infrastructure.
Considering the large amount of knowledge in AIO, and strong belief of top managers about
knowledge as the most important capital and the most important output of AIO, the managers
decided to establish a KM system in the organization.
The commitment of senior managers and their strong wish and belief on it, helped movement
towards a knowledge based organization. After vision definition, Iranian national satellite launch
was considered as the main and the most important objective, and then strategies were selected and
defined including organizational and knowledge strategies.
© Emerald Group Publishing
9
The traditional and hierarchical structure of the organization was not agile enough, so business
process reengineering was started in the organization. Moving towards a process-based organization
with a horizontal structure were the main targets of BPR project in AIO. All departments
decentralized and in this way, AIO was gradually formed as one of the most important scientific
and research park in Iran.
The BPR project resulted focus on process, especially R&D processes. Meanwhile the
organizational structure was designed in a way that, process teams could communicate with each
other as fluent as possible.
Each department of AIO was equipped by a developed research center that all R&D activities were
directed by it. All these research centers could share knowledge and communicate with each other
horizontally. Also a “knowledge management department” was organized in each of these research
centers and a CKO (Chief Knowledge Officer) was appointed in order to settle and arrange
knowledge and also facilitate knowledge sharing inside and outside of the organization.
Due to the necessity of developing human resources in a knowledge base organization, AIO started
training programs for the employees. These programs were followed in different domains and
especially academic educations in the universities. Short term training (during the work) and
training seminars were some other programs for developing human resources in AIO.
One of the most important challenges in AIO was available organizational culture and the resistance
against the change in some departments. This problem is being solved through an action plan.
Different sessions and meetings were hold for common clarity of the subject. In these sessions, the
importance of KM system and its functions were completely explained and the necessity of moving
towards this system was explored and discussed. Also many seminars were hold, and different
bulletin and magazines are published to help employee and managers get familiar with KM and its
role in different organizations, especially in aerospace industries. All these plans are helping in
acceptance the change and cultural changes.
© Emerald Group Publishing
10
Gradually, knowledge committees were established in different scientific groups and knowledge
sharing process was started seriously between different committees. These knowledge committees
had been emerged from different departments of the organization. They had different meetings with
each other continuously and regularly in order to share their experiences and scientific findings in
the best way. In this way, the network of experts was gradually formed in AIO.
In addition to training, many other programs are followed in AIO. As some programs faced with
some limitation at the first sages, they should be executed in small dimensions. So some pilots were
selected and the programs were deployed in them. One of these programs was reward system. After
the pilot program, the results were explored for getting feedback. The weaknesses and strengths of
the programs were monitored, and finally after some amendments, those programs were deployed to
all around the organization.
Meanwhile different programs such as knowledge identification, knowledge capturing, and storage
of knowledge were defined. Knowledge repositories, knowledge committee, and network of experts
were established in order to knowledge sharing more strongly and swiftly.
Also all departments started to extract their knowledge map in order to identify and capture their
knowledge in a better way. Transparency in all official relations in the organization and especially
financial transparency were deployed in all over the organization in order to motivate employees
and reinforce their trust and participation.
AIO managers believe that if they do not start managing their organizational knowledge, they will
repeat their mistakes and worse, they will never learn from their successes and can never grasp their
great vision, launching the Iranian national satellite to capture the space. That's why a knowledge
management program has been started in different departments of AIO. For that, this research was
designed in order to discover critical factors of KM as the preliminary steps of KM program in this
high-tech organization.
Critical dimensions of knowledge management
© Emerald Group Publishing
11
The authors followed critical success factors of knowledge management systems in different
references and through a comprehensive literature review distinguished some critical dimensions
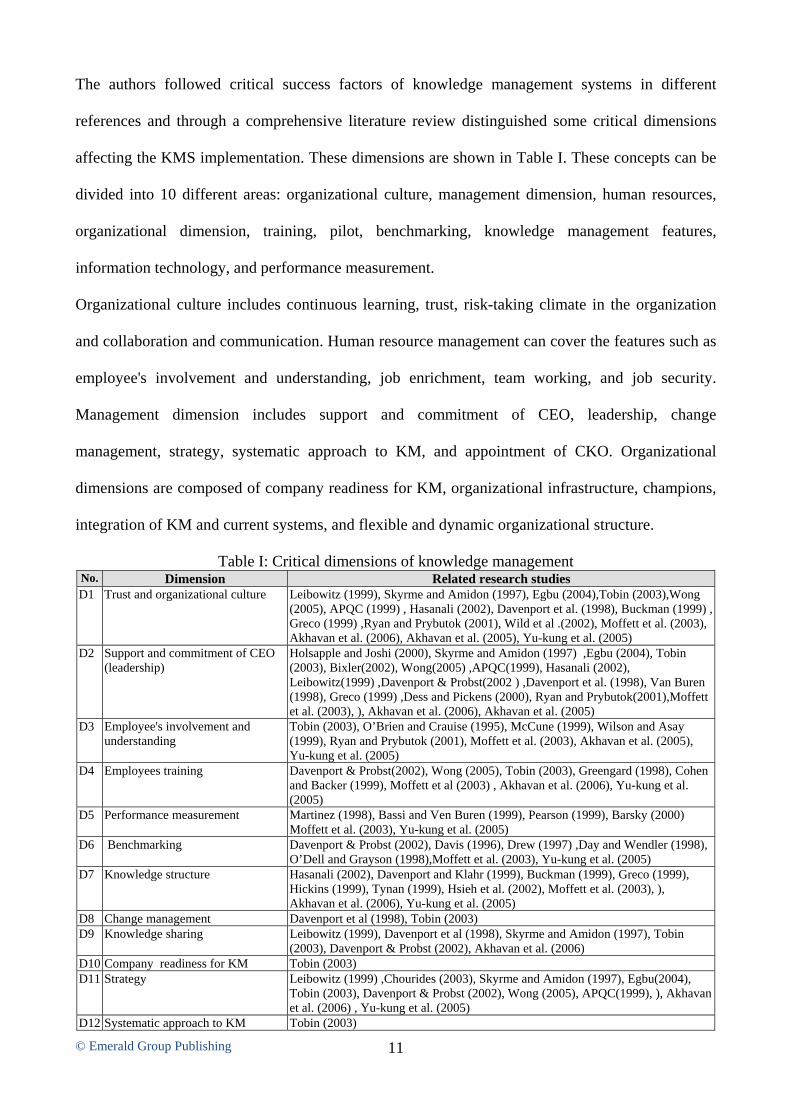
affecting the KMS implementation. These dimensions are shown in Table I. These concepts can be
divided into 10 different areas: organizational culture, management dimension, human resources,
organizational dimension, training, pilot, benchmarking, knowledge management features,
information technology, and performance measurement.
Organizational culture includes continuous learning, trust, risk-taking climate in the organization
and collaboration and communication. Human resource management can cover the features such as
employee's involvement and understanding, job enrichment, team working, and job security.
Management dimension includes support and commitment of CEO, leadership, change
management, strategy, systematic approach to KM, and appointment of CKO. Organizational
dimensions are composed of company readiness for KM, organizational infrastructure, champions,
integration of KM and current systems, and flexible and dynamic organizational structure.
Table I: Critical dimensions of knowledge management No. Dimension Related research studies D1 Trust and organizational culture Leibowitz (1999), Skyrme and Amidon (1997), Egbu (2004),Tobin (2003),Wong
(2005), APQC (1999) , Hasanali (2002), Davenport et al. (1998), Buckman (1999) ,Greco (1999) ,Ryan and Prybutok (2001), Wild et al .(2002), Moffett et al. (2003), Akhavan et al. (2006), Akhavan et al. (2005), Yu-kung et al. (2005)
D2 Support and commitment of CEO (leadership)
Holsapple and Joshi (2000), Skyrme and Amidon (1997) ,Egbu (2004), Tobin (2003), Bixler(2002), Wong(2005) ,APQC(1999), Hasanali (2002), Leibowitz(1999) ,Davenport & Probst(2002 ) ,Davenport et al. (1998), Van Buren (1998), Greco (1999) ,Dess and Pickens (2000), Ryan and Prybutok(2001),Moffett et al. (2003), ), Akhavan et al. (2006), Akhavan et al. (2005)
D3 Employee's involvement and understanding
Tobin (2003), O’Brien and Crauise (1995), McCune (1999), Wilson and Asay (1999), Ryan and Prybutok (2001), Moffett et al. (2003), Akhavan et al. (2005), Yu-kung et al. (2005)
D4 Employees training
Davenport & Probst(2002), Wong (2005), Tobin (2003), Greengard (1998), Cohen and Backer (1999), Moffett et al (2003) , Akhavan et al. (2006), Yu-kung et al. (2005)
D5 Performance measurement Martinez (1998), Bassi and Ven Buren (1999), Pearson (1999), Barsky (2000) Moffett et al. (2003), Yu-kung et al. (2005)
D6 Benchmarking Davenport & Probst (2002), Davis (1996), Drew (1997) ,Day and Wendler (1998), O’Dell and Grayson (1998),Moffett et al. (2003), Yu-kung et al. (2005)
D7 Knowledge structure Hasanali (2002), Davenport and Klahr (1999), Buckman (1999), Greco (1999), Hickins (1999), Tynan (1999), Hsieh et al. (2002), Moffett et al. (2003), ), Akhavan et al. (2006), Yu-kung et al. (2005)
D8 Change management Davenport et al (1998), Tobin (2003) D9 Knowledge sharing Leibowitz (1999), Davenport et al (1998), Skyrme and Amidon (1997), Tobin
(2003), Davenport & Probst (2002), Akhavan et al. (2006) D10 Company readiness for KM Tobin (2003) D11 Strategy Leibowitz (1999) ,Chourides (2003), Skyrme and Amidon (1997), Egbu(2004),
Tobin (2003), Davenport & Probst (2002), Wong (2005), APQC(1999), ), Akhavan et al. (2006) , Yu-kung et al. (2005)
D12 Systematic approach to KM Tobin (2003)
© Emerald Group Publishing
12
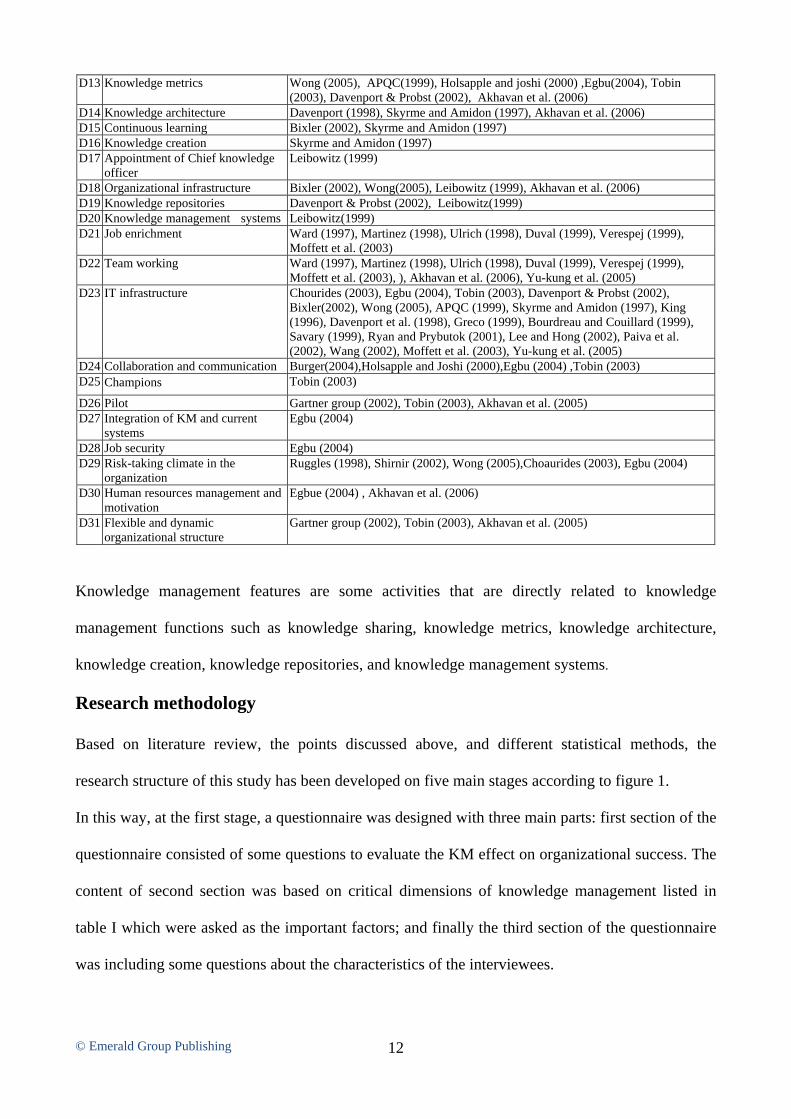
D13 Knowledge metrics Wong (2005), APQC(1999), Holsapple and joshi (2000) ,Egbu(2004), Tobin (2003), Davenport & Probst (2002), Akhavan et al. (2006)
D14 Knowledge architecture Davenport (1998), Skyrme and Amidon (1997), Akhavan et al. (2006) D15 Continuous learning Bixler (2002), Skyrme and Amidon (1997) D16 Knowledge creation Skyrme and Amidon (1997) D17 Appointment of Chief knowledge
officer Leibowitz (1999)
D18 Organizational infrastructure Bixler (2002), Wong(2005), Leibowitz (1999), Akhavan et al. (2006) D19 Knowledge repositories Davenport & Probst (2002), Leibowitz(1999) D20 Knowledge management systems Leibowitz(1999) D21 Job enrichment Ward (1997), Martinez (1998), Ulrich (1998), Duval (1999), Verespej (1999),
Moffett et al. (2003) D22 Team working Ward (1997), Martinez (1998), Ulrich (1998), Duval (1999), Verespej (1999),
Moffett et al. (2003), ), Akhavan et al. (2006), Yu-kung et al. (2005) D23 IT infrastructure Chourides (2003), Egbu (2004), Tobin (2003), Davenport & Probst (2002),
Bixler(2002), Wong (2005), APQC (1999), Skyrme and Amidon (1997), King (1996), Davenport et al. (1998), Greco (1999), Bourdreau and Couillard (1999), Savary (1999), Ryan and Prybutok (2001), Lee and Hong (2002), Paiva et al. (2002), Wang (2002), Moffett et al. (2003), Yu-kung et al. (2005)
D24 Collaboration and communication Burger(2004),Holsapple and Joshi (2000),Egbu (2004) ,Tobin (2003) D25 Champions Tobin (2003)
D26 Pilot Gartner group (2002), Tobin (2003), Akhavan et al. (2005) D27 Integration of KM and current
systems Egbu (2004)
D28 Job security Egbu (2004) D29 Risk-taking climate in the
organization Ruggles (1998), Shirnir (2002), Wong (2005),Choaurides (2003), Egbu (2004)
D30 Human resources management and motivation
Egbue (2004) , Akhavan et al. (2006)
D31 Flexible and dynamic organizational structure
Gartner group (2002), Tobin (2003), Akhavan et al. (2005)
Knowledge management features are some activities that are directly related to knowledge
management functions such as knowledge sharing, knowledge metrics, knowledge architecture,
knowledge creation, knowledge repositories, and knowledge management systems.
Research methodology
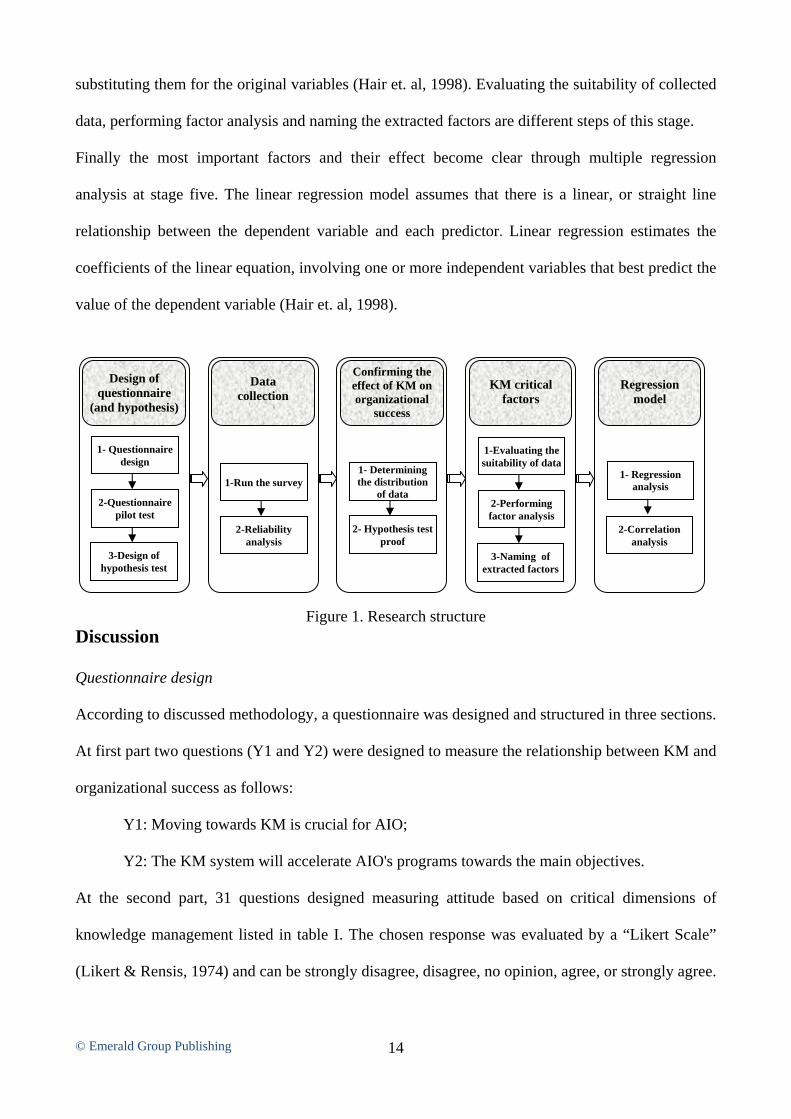
Based on literature review, the points discussed above, and different statistical methods, the
research structure of this study has been developed on five main stages according to figure 1.
In this way, at the first stage, a questionnaire was designed with three main parts: first section of the
questionnaire consisted of some questions to evaluate the KM effect on organizational success. The
content of second section was based on critical dimensions of knowledge management listed in
table I which were asked as the important factors; and finally the third section of the questionnaire
was including some questions about the characteristics of the interviewees.
© Emerald Group Publishing
13
It is important to say that a hypothesis test must be designed to evaluate KM positive effects on
organizational success and considering this hypothesis proof at second stage, the research can be
continued.
At the second stage, the survey is run to collect data from interviewees and based on the collected
data; the reliability analysis can be performed. Reliability analysis allows you to study the
properties of questionnaire and the items that make them up. The reliability analysis procedure
calculates a number of commonly used measures of scale reliability and also provides information
about the relationships between individual items in the measurement scale (Hair et. al, 1998).
The main purpose of third stage is to confirm the mentioned hypothesis in stage one. In this way, it
is necessary to determine the statistical distribution of collected data at the first part of the
questionnaire. Subsequently based on distribution of data, one of parametric or non-parametric tests
can be performed for hypothesis proof.
The forth stage of research framework is based on “factor analysis” and is concentrated on
extraction and identification of the critical factors affecting the adoption of KM in the AIO. Factor
analysis is also known as a generic name given to a class of multivariate statistical methods whose
primary purpose is to define the underlying structure in a data matrix. Broadly speaking, it
addresses the problem of analyzing the structure of the interrelationships (correlations) among a
large number of variables (e.g., test scores, test items, questionnaire responses) by defining a set of
common under-lying category, known as factors. With factor analysis, the researcher can first
identify the separate factors of the structure and then determine the extent to which each variable is
explained by each factor. Once these factors and the explanation of each variable are determined,
the two primary uses for factor analysis-summarization and data reduction-can be achieved. In
summarizing the data, factor analysis derives underlying factors that, when interpreted and
understood, describe the data in a much smaller number of concepts than the original individual
variables. Data reduction can be achieved by calculating scores for each underlying factors and
© Emerald Group Publishing
14
substituting them for the original variables (Hair et. al, 1998). Evaluating the suitability of collected
data, performing factor analysis and naming the extracted factors are different steps of this stage.
Finally the most important factors and their effect become clear through multiple regression
analysis at stage five. The linear regression model assumes that there is a linear, or straight line
relationship between the dependent variable and each predictor. Linear regression estimates the
coefficients of the linear equation, involving one or more independent variables that best predict the
value of the dependent variable (Hair et. al, 1998).
Figure 1. Research structure Discussion
Questionnaire design
According to discussed methodology, a questionnaire was designed and structured in three sections.
At first part two questions (Y1 and Y2) were designed to measure the relationship between KM and
organizational success as follows:
Y1: Moving towards KM is crucial for AIO;
Y2: The KM system will accelerate AIO's programs towards the main objectives.
At the second part, 31 questions designed measuring attitude based on critical dimensions of
knowledge management listed in table I. The chosen response was evaluated by a “Likert Scale”
(Likert & Rensis, 1974) and can be strongly disagree, disagree, no opinion, agree, or strongly agree.
1- Questionnaire design
2-Questionnaire pilot test
3-Design of hypothesis test
Design of questionnaire
(and hypothesis)
1-Run the survey
2-Reliability analysis
Data collection
1- Determining the distribution
of data
2- Hypothesis test proof
Confirming the effect of KM on organizational
success
1-Evaluating the suitability of data
2-Performing factor analysis
3-Naming of extracted factors
KM critical
factors
1- Regression analysis
Regression
model
2-Correlation analysis
© Emerald Group Publishing
15
In the other words, the second part of questionnaire measures the opinions on critical factors in the
adoption of a knowledge management system in the AIO.
In addition, following these 31 questions, information related to the basic profile of the interviewees
was requested at the end of the questionnaire. The main sampling targets were senior managers,
department managers and personnel who were involved in KM efforts and decision making.
Meanwhile, to evaluate the questionnaire, eight experts participated in a pilot test. The participants
suggested adding the title of job position to the options of the third section of the questionnaire.
Except of this change, all the pretest participants expressed strong agreement for the suitability of
the questionnaire. The questionnaire was considered finalized after little modifying.
It is important to say that this research is to identify critical factors of KM in AIO, but there is a
question: "Does a KM program really affect organizational success in the AIO?”. For confirming
this default, a hypothesis is configured:
H1. Knowledge management helps the organizational success.
In order to prove this hypothesis, as previously mentioned, two questions were designed above all
questions. This hypothesis can be evaluated after data collection.
Data collection
The research targets were members of the AIO including managers, senior experts and effective
staff in decision making. AIO has already promoted e-learning environment and has hosted
seminars on knowledge management and organizational success. Therefore most of the members
are aware of the importance of KM.
In order to understand the viewpoints on KM from all sectors of the aerospace central office and
different factories, questionnaires were sent to different departments including information, research
and development, academic and human resource departments. The number of questionnaires sent
out was 1120; the number returned was 506, which showed a return rate of 45.18 percent. 26 of the
returned questionnaires were incomplete and thus discarded, making the number of valid
questionnaires returned 480 or 42.86 percent of the total sent out.
© Emerald Group Publishing
16
Reliability analysis
With reliability analysis, you can get an overall index of the repeatability or internal consistency of
the measurement scale as a whole, and you can identify problem items that should be excluded from
the scale. The Cronbach’s alpha is a model of internal consistency, based on the average inter-item
correlation. The Cronbach’s alpha (Likert & Rensis, 1974) calculated from the 33 variables of this
research was 0.941, which showed high reliability for designed measurement scale.
Demographic profiles of interviewees
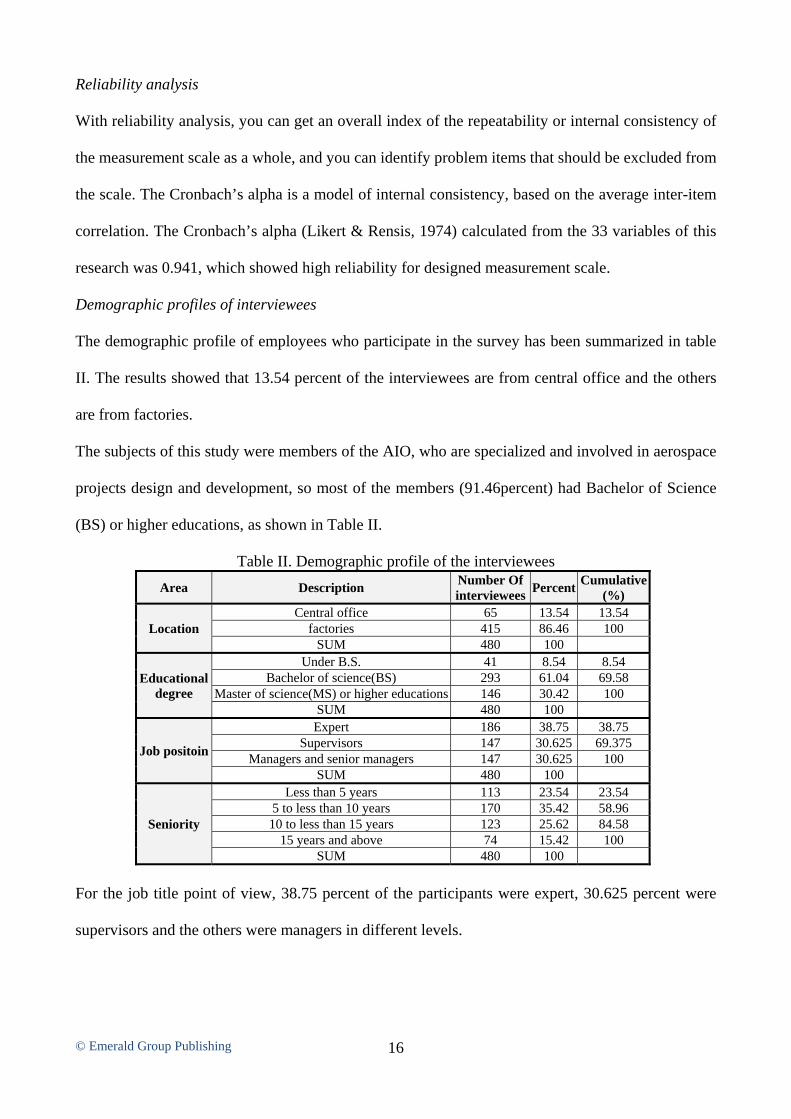
The demographic profile of employees who participate in the survey has been summarized in table
II. The results showed that 13.54 percent of the interviewees are from central office and the others
are from factories.
The subjects of this study were members of the AIO, who are specialized and involved in aerospace
projects design and development, so most of the members (91.46percent) had Bachelor of Science
(BS) or higher educations, as shown in Table II.
Table II. Demographic profile of the interviewees
Area Description Number Of interviewees
Percent Cumulative
(%)
Location Central office 65 13.54 13.54
factories 415 86.46 100 SUM 480 100
Educational degree
Under B.S. 41 8.54 8.54 Bachelor of science(BS) 293 61.04 69.58
Master of science(MS) or higher educations 146 30.42 100 SUM 480 100
Job positoin
Expert 186 38.75 38.75 Supervisors 147 30.625 69.375
Managers and senior managers 147 30.625 100 SUM 480 100
Seniority
Less than 5 years 113 23.54 23.54 5 to less than 10 years 170 35.42 58.96 10 to less than 15 years 123 25.62 84.58
15 years and above 74 15.42 100 SUM 480 100
For the job title point of view, 38.75 percent of the participants were expert, 30.625 percent were
supervisors and the others were managers in different levels.
© Emerald Group Publishing
17
Table II also shows the seniority of the participants. As it can be seen, 15.42 percent had over 15
years seniority, 25.62 percent had 10-15 years, 35.42 percent had 5-10 years and the others had less
than 5 years seniority.
Hypothesis test
One of the most popular ways of identification of the data statistical distribution is one-sample
Kolmogorov-Smirnov test. The Kolmogorov-Smirnov test compares the observed cumulative
distribution function for a variable with a specified theoretical distribution, which may be normal,
uniform, poisson, or exponential. The Kolmogorov-Smirnov Z is calculated by the largest
difference (in absolute value) between the observed and theoretical cumulative distribution
functions. This "goodness-of-fit test" tests whether the observations could reasonably have come
from the specified distribution or not. Many statistical parametric tests require normally distributed
variables. The one-sample Kolmogorov-Smirnov test can be used in order to test a variable whether
it is normally distributed or not. Large significance values (>.05) indicate that the observed
distribution corresponds to the theoretical distribution (Hollander & Wolfe, 1973).
According to our test results, the p-value of the all questions was less than 0.05, which showed that
the distribution of them was not normal.
As the statistical distribution of variables Y1 and Y2 were not normal, a statistical non-parametric
test must be used to prove hypothesis H1. In this way the authors used the Wald-Wolfowitz test to
determine the difference between the agree and disagree results.
Wald-Wolfowitz is a test that examines whether two independent samples (groups) come from the
same population or not. The Wald-Wolfowitz runs test combines and ranks the observations from
both groups. If the selected groups are from the same population, they should be randomly scattered
throughout the ranking and resulting in many runs. If the two groups differ, the number of runs will
be smaller than a random scatter (Hollander & Wolfe, 1973).
A significance level below 0.05 indicates that the two groups differ, as is also shown in Table III.
Considering the reliability of 95 percent, only two questions reached to consensus. The percentage
© Emerald Group Publishing
18
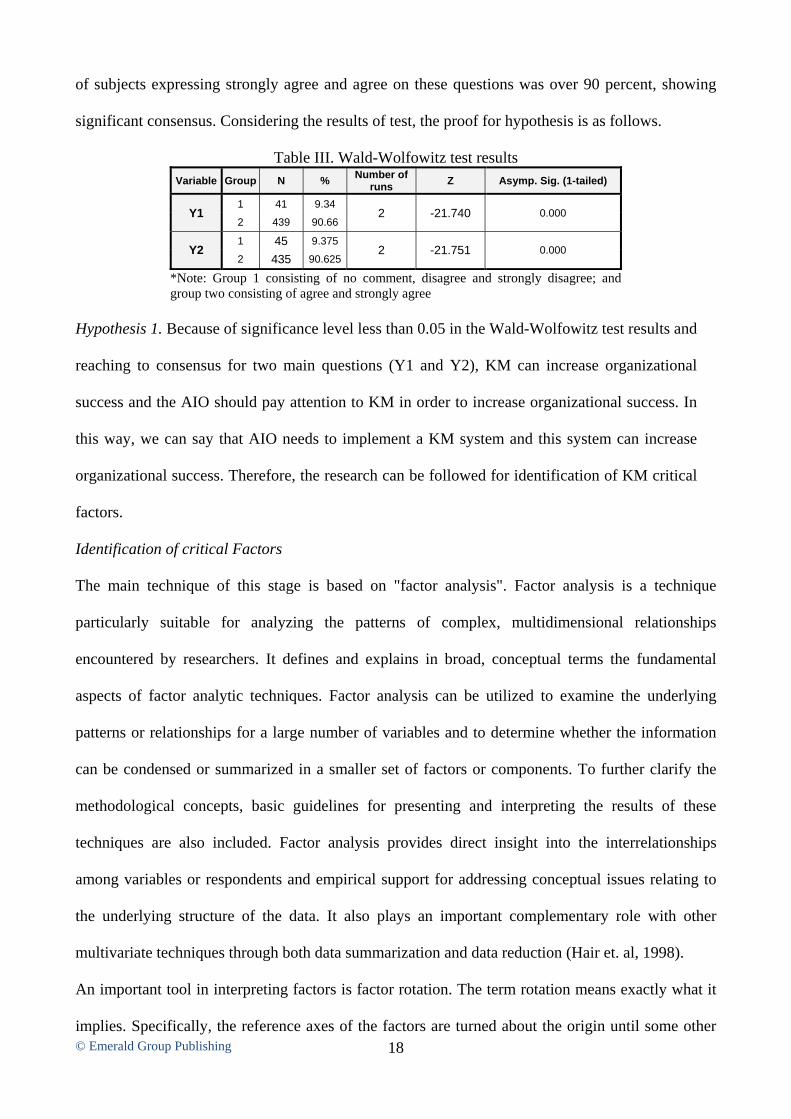
of subjects expressing strongly agree and agree on these questions was over 90 percent, showing
significant consensus. Considering the results of test, the proof for hypothesis is as follows.
Table III. Wald-Wolfowitz test results Variable Group N %
Number of runs
Z Asymp. Sig. (1-tailed)
Y1 1 41 9.34
2 -21.740 0.000 2 439 90.66
Y2 1 45 9.375
2 -21.751 0.000 2 435 90.625
*Note: Group 1 consisting of no comment, disagree and strongly disagree; and group two consisting of agree and strongly agree
Hypothesis 1. Because of significance level less than 0.05 in the Wald-Wolfowitz test results and
reaching to consensus for two main questions (Y1 and Y2), KM can increase organizational
success and the AIO should pay attention to KM in order to increase organizational success. In
this way, we can say that AIO needs to implement a KM system and this system can increase
organizational success. Therefore, the research can be followed for identification of KM critical
factors.
Identification of critical Factors
The main technique of this stage is based on "factor analysis". Factor analysis is a technique
particularly suitable for analyzing the patterns of complex, multidimensional relationships
encountered by researchers. It defines and explains in broad, conceptual terms the fundamental
aspects of factor analytic techniques. Factor analysis can be utilized to examine the underlying
patterns or relationships for a large number of variables and to determine whether the information
can be condensed or summarized in a smaller set of factors or components. To further clarify the
methodological concepts, basic guidelines for presenting and interpreting the results of these
techniques are also included. Factor analysis provides direct insight into the interrelationships
among variables or respondents and empirical support for addressing conceptual issues relating to
the underlying structure of the data. It also plays an important complementary role with other
multivariate techniques through both data summarization and data reduction (Hair et. al, 1998).
An important tool in interpreting factors is factor rotation. The term rotation means exactly what it
implies. Specifically, the reference axes of the factors are turned about the origin until some other
© Emerald Group Publishing
19
position has been reached. The unrotated factor solutions extract factors in the order of their
importance. The first factor tends to be a general factor with almost every variable loading
significantly, and it accounts for the largest amount of variance. The second and subsequent factors
are then based on the residual amount of variance. Each accounts for successively smaller portions
of variance. The ultimate effect of rotating the factor matrix is to redistribute the variance from
earlier factors to later ones to achieve a simpler, theoretically more meaningful factor pattern. The
simplest case of rotation is an orthogonal rotation, in which the axes are maintained at 90 degrees
(Hair et. al, 1998).
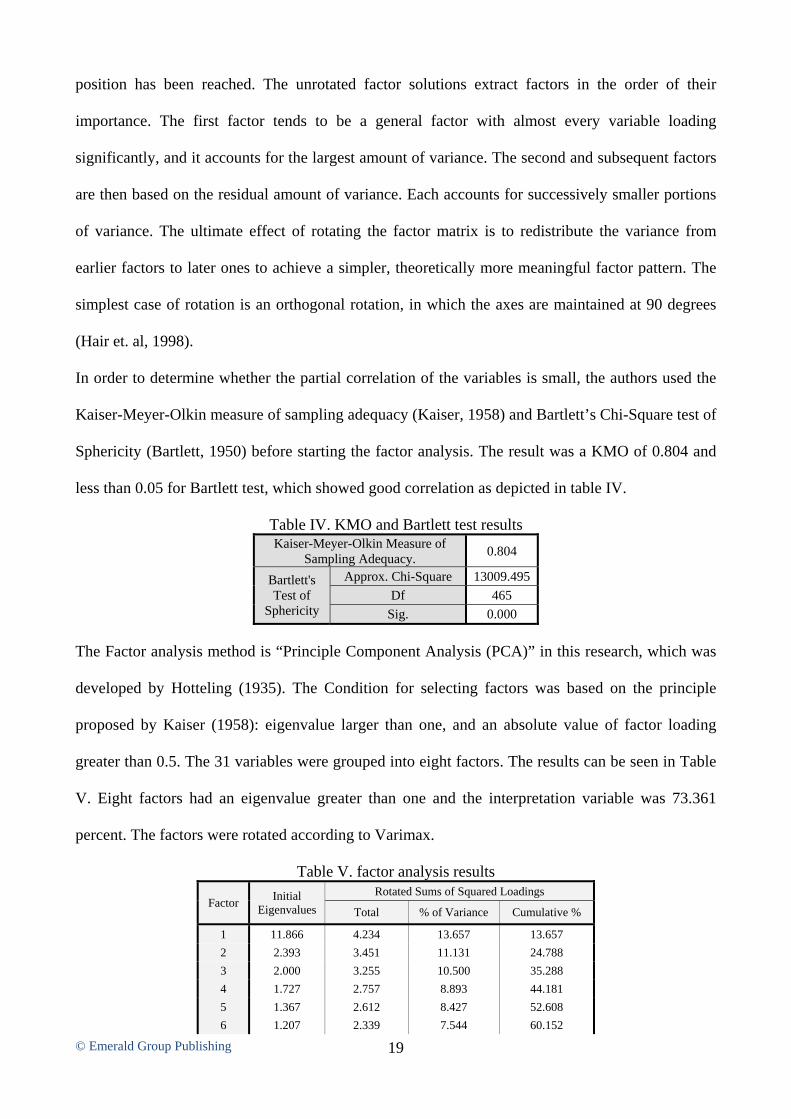
In order to determine whether the partial correlation of the variables is small, the authors used the
Kaiser-Meyer-Olkin measure of sampling adequacy (Kaiser, 1958) and Bartlett’s Chi-Square test of
Sphericity (Bartlett, 1950) before starting the factor analysis. The result was a KMO of 0.804 and
less than 0.05 for Bartlett test, which showed good correlation as depicted in table IV.
Table IV. KMO and Bartlett test results Kaiser-Meyer-Olkin Measure of
Sampling Adequacy. 0.804
Bartlett's Test of
Sphericity
Approx. Chi-Square 13009.495
Df 465
Sig. 0.000
The Factor analysis method is “Principle Component Analysis (PCA)” in this research, which was
developed by Hotteling (1935). The Condition for selecting factors was based on the principle
proposed by Kaiser (1958): eigenvalue larger than one, and an absolute value of factor loading
greater than 0.5. The 31 variables were grouped into eight factors. The results can be seen in Table
V. Eight factors had an eigenvalue greater than one and the interpretation variable was 73.361
percent. The factors were rotated according to Varimax.
Table V. factor analysis results
Factor Initial
Eigenvalues
Rotated Sums of Squared Loadings
Total % of Variance Cumulative %
1 11.866 4.234 13.657 13.657
2 2.393 3.451 11.131 24.788
3 2.000 3.255 10.500 35.288
4 1.727 2.757 8.893 44.181
5 1.367 2.612 8.427 52.608
6 1.207 2.339 7.544 60.152
© Emerald Group Publishing
20
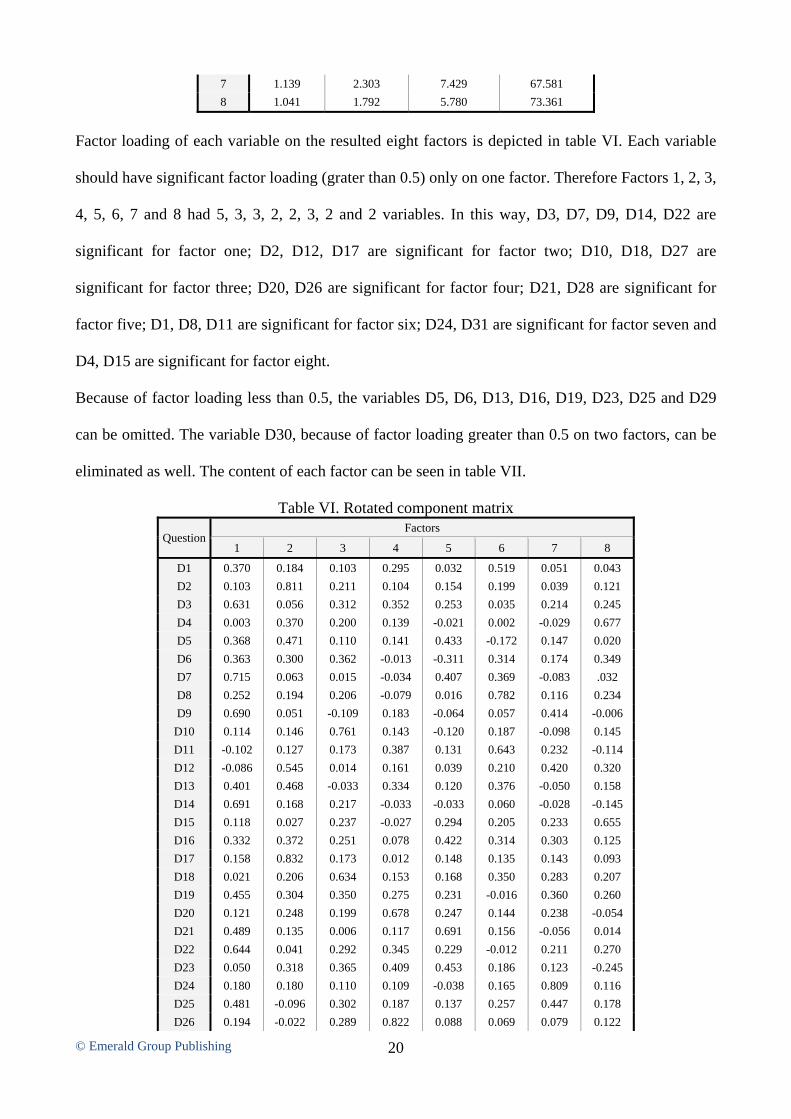
7 1.139 2.303 7.429 67.581
8 1.041 1.792 5.780 73.361
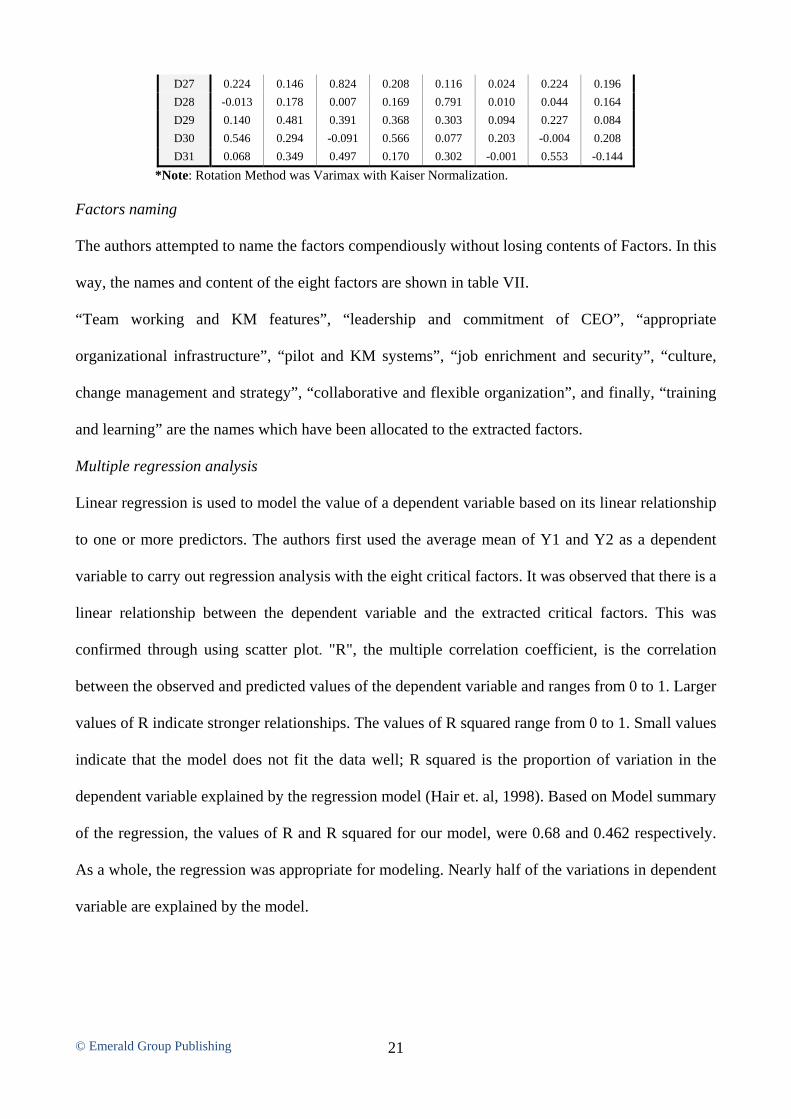
Factor loading of each variable on the resulted eight factors is depicted in table VI. Each variable
should have significant factor loading (grater than 0.5) only on one factor. Therefore Factors 1, 2, 3,
4, 5, 6, 7 and 8 had 5, 3, 3, 2, 2, 3, 2 and 2 variables. In this way, D3, D7, D9, D14, D22 are
significant for factor one; D2, D12, D17 are significant for factor two; D10, D18, D27 are
significant for factor three; D20, D26 are significant for factor four; D21, D28 are significant for
factor five; D1, D8, D11 are significant for factor six; D24, D31 are significant for factor seven and
D4, D15 are significant for factor eight.
Because of factor loading less than 0.5, the variables D5, D6, D13, D16, D19, D23, D25 and D29
can be omitted. The variable D30, because of factor loading greater than 0.5 on two factors, can be
eliminated as well. The content of each factor can be seen in table VII.
Table VI. Rotated component matrix
Question Factors
1 2 3 4 5 6 7 8
D1 0.370 0.184 0.103 0.295 0.032 0.519 0.051 0.043
D2 0.103 0.811 0.211 0.104 0.154 0.199 0.039 0.121
D3 0.631 0.056 0.312 0.352 0.253 0.035 0.214 0.245
D4 0.003 0.370 0.200 0.139 -0.021 0.002 -0.029 0.677
D5 0.368 0.471 0.110 0.141 0.433 -0.172 0.147 0.020
D6 0.363 0.300 0.362 -0.013 -0.311 0.314 0.174 0.349
D7 0.715 0.063 0.015 -0.034 0.407 0.369 -0.083 .032
D8 0.252 0.194 0.206 -0.079 0.016 0.782 0.116 0.234
D9 0.690 0.051 -0.109 0.183 -0.064 0.057 0.414 -0.006
D10 0.114 0.146 0.761 0.143 -0.120 0.187 -0.098 0.145
D11 -0.102 0.127 0.173 0.387 0.131 0.643 0.232 -0.114
D12 -0.086 0.545 0.014 0.161 0.039 0.210 0.420 0.320
D13 0.401 0.468 -0.033 0.334 0.120 0.376 -0.050 0.158
D14 0.691 0.168 0.217 -0.033 -0.033 0.060 -0.028 -0.145
D15 0.118 0.027 0.237 -0.027 0.294 0.205 0.233 0.655
D16 0.332 0.372 0.251 0.078 0.422 0.314 0.303 0.125
D17 0.158 0.832 0.173 0.012 0.148 0.135 0.143 0.093
D18 0.021 0.206 0.634 0.153 0.168 0.350 0.283 0.207
D19 0.455 0.304 0.350 0.275 0.231 -0.016 0.360 0.260
D20 0.121 0.248 0.199 0.678 0.247 0.144 0.238 -0.054
D21 0.489 0.135 0.006 0.117 0.691 0.156 -0.056 0.014
D22 0.644 0.041 0.292 0.345 0.229 -0.012 0.211 0.270
D23 0.050 0.318 0.365 0.409 0.453 0.186 0.123 -0.245
D24 0.180 0.180 0.110 0.109 -0.038 0.165 0.809 0.116
D25 0.481 -0.096 0.302 0.187 0.137 0.257 0.447 0.178
D26 0.194 -0.022 0.289 0.822 0.088 0.069 0.079 0.122
© Emerald Group Publishing
21
D27 0.224 0.146 0.824 0.208 0.116 0.024 0.224 0.196
D28 -0.013 0.178 0.007 0.169 0.791 0.010 0.044 0.164
D29 0.140 0.481 0.391 0.368 0.303 0.094 0.227 0.084
D30 0.546 0.294 -0.091 0.566 0.077 0.203 -0.004 0.208
D31 0.068 0.349 0.497 0.170 0.302 -0.001 0.553 -0.144
*Note: Rotation Method was Varimax with Kaiser Normalization. Factors naming
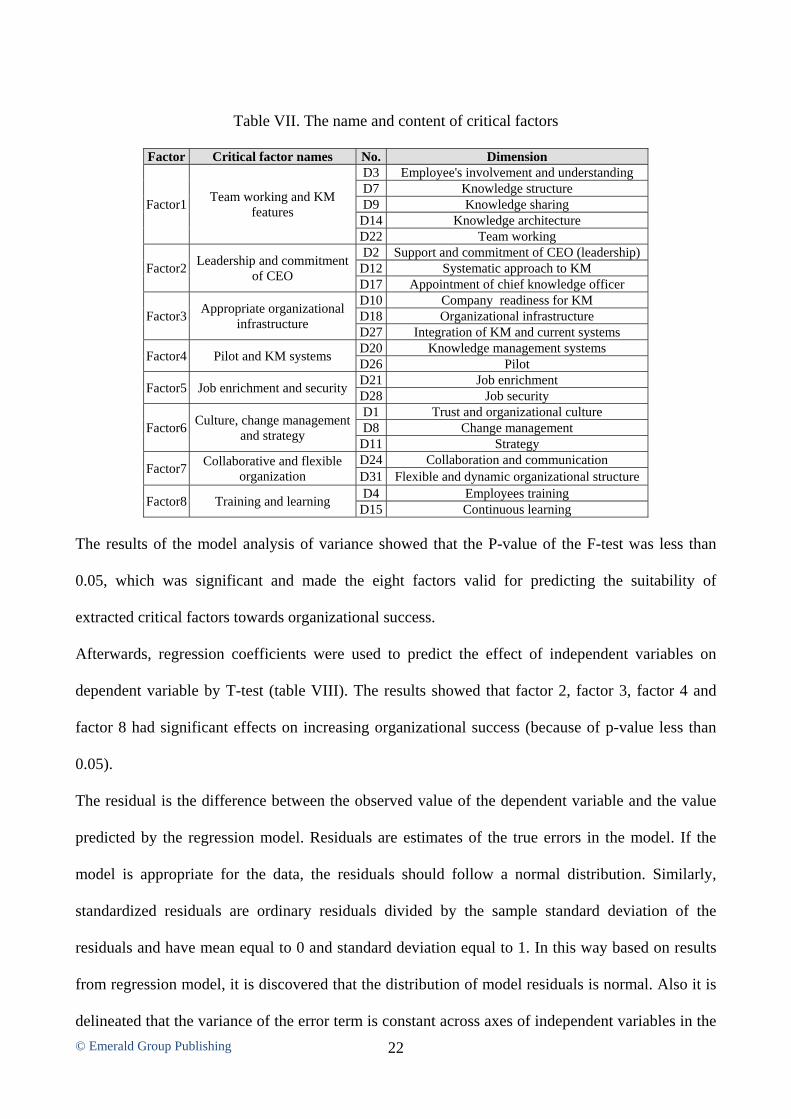
The authors attempted to name the factors compendiously without losing contents of Factors. In this
way, the names and content of the eight factors are shown in table VII.
“Team working and KM features”, “leadership and commitment of CEO”, “appropriate
organizational infrastructure”, “pilot and KM systems”, “job enrichment and security”, “culture,
change management and strategy”, “collaborative and flexible organization”, and finally, “training
and learning” are the names which have been allocated to the extracted factors.
Multiple regression analysis
Linear regression is used to model the value of a dependent variable based on its linear relationship
to one or more predictors. The authors first used the average mean of Y1 and Y2 as a dependent
variable to carry out regression analysis with the eight critical factors. It was observed that there is a
linear relationship between the dependent variable and the extracted critical factors. This was
confirmed through using scatter plot. "R", the multiple correlation coefficient, is the correlation
between the observed and predicted values of the dependent variable and ranges from 0 to 1. Larger
values of R indicate stronger relationships. The values of R squared range from 0 to 1. Small values
indicate that the model does not fit the data well; R squared is the proportion of variation in the
dependent variable explained by the regression model (Hair et. al, 1998). Based on Model summary
of the regression, the values of R and R squared for our model, were 0.68 and 0.462 respectively.
As a whole, the regression was appropriate for modeling. Nearly half of the variations in dependent
variable are explained by the model.
© Emerald Group Publishing
22
Table VII. The name and content of critical factors
Factor Critical factor names No. Dimension
Factor1 Team working and KM
features
D3 Employee's involvement and understanding D7 Knowledge structure D9 Knowledge sharing
D14 Knowledge architecture D22 Team working
Factor2 Leadership and commitment
of CEO
D2 Support and commitment of CEO (leadership) D12 Systematic approach to KM D17 Appointment of chief knowledge officer
Factor3 Appropriate organizational
infrastructure
D10 Company readiness for KM D18 Organizational infrastructure D27 Integration of KM and current systems
Factor4 Pilot and KM systems D20 Knowledge management systems D26 Pilot
Factor5 Job enrichment and security D21 Job enrichment D28 Job security
Factor6 Culture, change management
and strategy
D1 Trust and organizational culture D8 Change management
D11 Strategy
Factor7 Collaborative and flexible
organization D24 Collaboration and communication
D31 Flexible and dynamic organizational structure
Factor8 Training and learning D4 Employees training
D15 Continuous learning The results of the model analysis of variance showed that the P-value of the F-test was less than
0.05, which was significant and made the eight factors valid for predicting the suitability of
extracted critical factors towards organizational success.
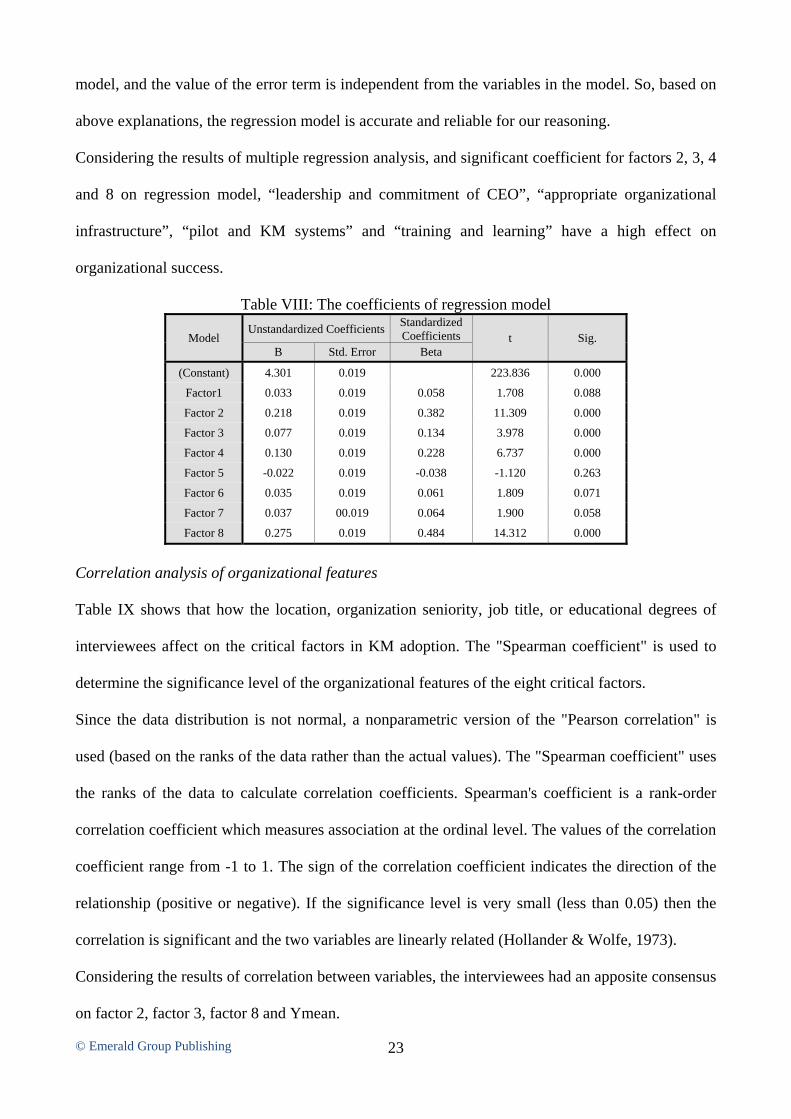
Afterwards, regression coefficients were used to predict the effect of independent variables on
dependent variable by T-test (table VIII). The results showed that factor 2, factor 3, factor 4 and
factor 8 had significant effects on increasing organizational success (because of p-value less than
0.05).
The residual is the difference between the observed value of the dependent variable and the value
predicted by the regression model. Residuals are estimates of the true errors in the model. If the
model is appropriate for the data, the residuals should follow a normal distribution. Similarly,
standardized residuals are ordinary residuals divided by the sample standard deviation of the
residuals and have mean equal to 0 and standard deviation equal to 1. In this way based on results
from regression model, it is discovered that the distribution of model residuals is normal. Also it is
delineated that the variance of the error term is constant across axes of independent variables in the
© Emerald Group Publishing
23
model, and the value of the error term is independent from the variables in the model. So, based on
above explanations, the regression model is accurate and reliable for our reasoning.
Considering the results of multiple regression analysis, and significant coefficient for factors 2, 3, 4
and 8 on regression model, “leadership and commitment of CEO”, “appropriate organizational
infrastructure”, “pilot and KM systems” and “training and learning” have a high effect on
organizational success.
Table VIII: The coefficients of regression model
Model
Unstandardized CoefficientsStandardized Coefficients t Sig.
B Std. Error Beta
(Constant) 4.301 0.019 223.836 0.000
Factor1 0.033 0.019 0.058 1.708 0.088
Factor 2 0.218 0.019 0.382 11.309 0.000
Factor 3 0.077 0.019 0.134 3.978 0.000
Factor 4 0.130 0.019 0.228 6.737 0.000
Factor 5 -0.022 0.019 -0.038 -1.120 0.263
Factor 6 0.035 0.019 0.061 1.809 0.071
Factor 7 0.037 00.019 0.064 1.900 0.058
Factor 8 0.275 0.019 0.484 14.312 0.000
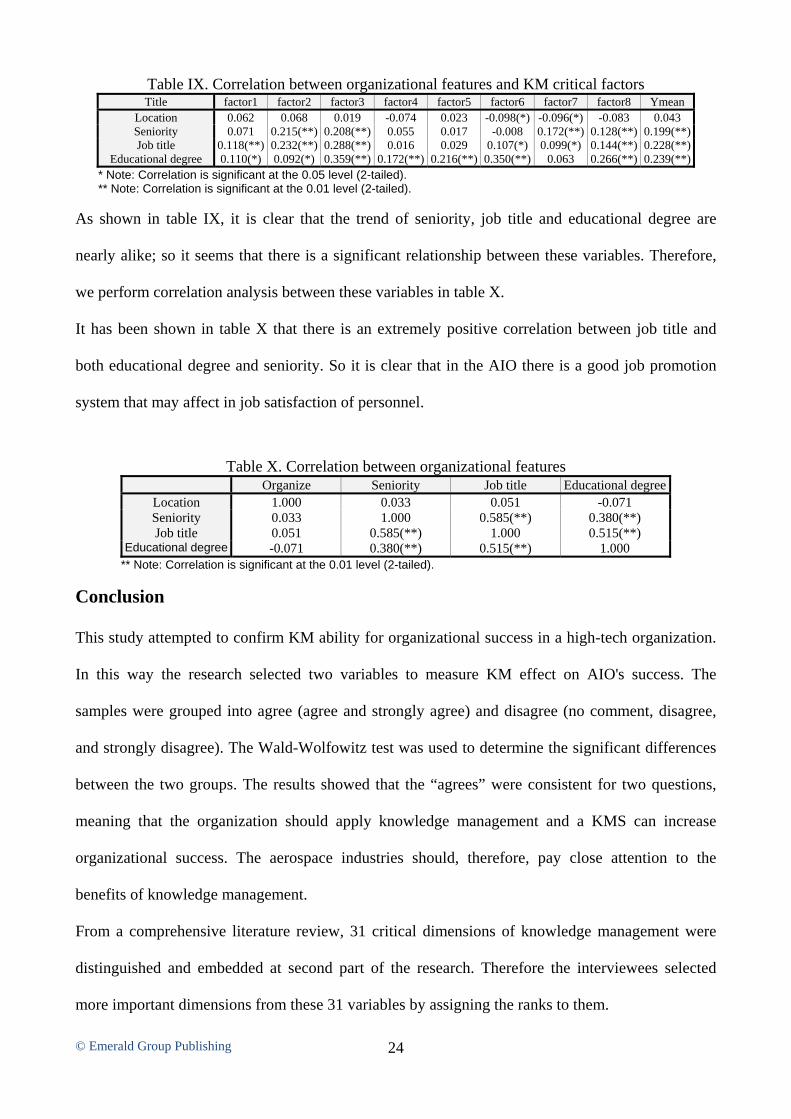
Correlation analysis of organizational features
Table IX shows that how the location, organization seniority, job title, or educational degrees of
interviewees affect on the critical factors in KM adoption. The "Spearman coefficient" is used to
determine the significance level of the organizational features of the eight critical factors.
Since the data distribution is not normal, a nonparametric version of the "Pearson correlation" is
used (based on the ranks of the data rather than the actual values). The "Spearman coefficient" uses
the ranks of the data to calculate correlation coefficients. Spearman's coefficient is a rank-order
correlation coefficient which measures association at the ordinal level. The values of the correlation
coefficient range from -1 to 1. The sign of the correlation coefficient indicates the direction of the
relationship (positive or negative). If the significance level is very small (less than 0.05) then the
correlation is significant and the two variables are linearly related (Hollander & Wolfe, 1973).
Considering the results of correlation between variables, the interviewees had an apposite consensus
on factor 2, factor 3, factor 8 and Ymean.
© Emerald Group Publishing
24
Table IX. Correlation between organizational features and KM critical factors Title factor1 factor2 factor3 factor4 factor5 factor6 factor7 factor8 Ymean
Location 0.062 0.068 0.019 -0.074 0.023 -0.098(*) -0.096(*) -0.083 0.043 Seniority 0.071 0.215(**) 0.208(**) 0.055 0.017 -0.008 0.172(**) 0.128(**) 0.199(**)Job title 0.118(**) 0.232(**) 0.288(**) 0.016 0.029 0.107(*) 0.099(*) 0.144(**) 0.228(**)
Educational degree 0.110(*) 0.092(*) 0.359(**) 0.172(**) 0.216(**) 0.350(**) 0.063 0.266(**) 0.239(**)* Note: Correlation is significant at the 0.05 level (2-tailed). ** Note: Correlation is significant at the 0.01 level (2-tailed).
As shown in table IX, it is clear that the trend of seniority, job title and educational degree are
nearly alike; so it seems that there is a significant relationship between these variables. Therefore,
we perform correlation analysis between these variables in table X.
It has been shown in table X that there is an extremely positive correlation between job title and
both educational degree and seniority. So it is clear that in the AIO there is a good job promotion
system that may affect in job satisfaction of personnel.
Table X. Correlation between organizational features Organize Seniority Job title Educational degree
Location 1.000 0.033 0.051 -0.071 Seniority 0.033 1.000 0.585(**) 0.380(**) Job title 0.051 0.585(**) 1.000 0.515(**)
Educational degree -0.071 0.380(**) 0.515(**) 1.000 ** Note: Correlation is significant at the 0.01 level (2-tailed).
Conclusion
This study attempted to confirm KM ability for organizational success in a high-tech organization.
In this way the research selected two variables to measure KM effect on AIO's success. The
samples were grouped into agree (agree and strongly agree) and disagree (no comment, disagree,
and strongly disagree). The Wald-Wolfowitz test was used to determine the significant differences
between the two groups. The results showed that the “agrees” were consistent for two questions,
meaning that the organization should apply knowledge management and a KMS can increase
organizational success. The aerospace industries should, therefore, pay close attention to the
benefits of knowledge management.
From a comprehensive literature review, 31 critical dimensions of knowledge management were
distinguished and embedded at second part of the research. Therefore the interviewees selected
more important dimensions from these 31 variables by assigning the ranks to them.
© Emerald Group Publishing
25
The study then used factor analysis to extract critical factors of knowledge management in AIO
through 31 variables. These factors were: “team working and KM features”, “leadership and
commitment of CEO”, “appropriate organizational infrastructure”, “pilot and KM systems”, “job
enrichment and security”, “culture, change management and strategy”, “collaborative and flexible
organization” and “training and learning”.
The mean of two variables measuring KM effect on AIO's success, used as dependent variable to
carry out regression analysis with the eight critical factors. In this way, the regression coefficients
were used to predict the effect of independent variables on dependent variable. The results showed
“leadership and commitment of CEO”, “appropriate organizational infrastructure”, “pilot and KM
systems” and “training and learning” are effective in regression model.
Finally, correlation analysis between organizational features and the critical factors was performed.
The organizational features discussed here include interviewee’s location, seniority, job positions
and educational degree. The correlation analysis showed that seniority level had an extremely
positive correlation with theses critical factors: "leadership and commitment of CEO", "appropriate
organizational infrastructure", "collaborative and flexible organization" and "training and learning".
This may be resulted from the level understanding of senior personnel about management area and
different features of organization.
Job position of interviewees had also an extremely positive correlation with "team working and KM
features", "leadership and commitment of CEO", "appropriate organizational infrastructure" and
"training and learning". Also it was positively correlated with the "culture, change management and
strategy" and "collaborative and flexible organization". It means that people with higher ranks in the
organization believe that these topics are crucial for successful KM adoption. This may be resulted
from their understanding about the situation and their familiarity about the importance of these
subjects. Educational degree of interviewees was positively correlated with theses critical factors:
"team working and KM features" and "leadership and commitment of CEO". Also it had an
extremely positive correlation with "appropriate organizational infrastructure", "pilot and KM
© Emerald Group Publishing
26
systems", "job enrichment and security", "culture, change management and strategy" and "training
and learning". Because they already had a thorough knowledge of KM related or work related
science and their cognition increases with higher educations.
Location of interviewees was negatively correlated with two critical factors: "culture, change
management and strategy" and "collaborative and flexible organization", meaning that opinions of
KM were not the same throughout central organization interviewees and industry interviewees. This
may be resulted from the satisfaction of personnel who are working in the related factories from
organizational culture point of view and/or may be raised from their viewpoints against the
organizational change whether they work in central office or in the related factories. The
organizational features such as seniority, job tile and educational degree of interviewees had an
extremely positive correlation with mean of two variables measuring KM effects on AIO's success.
Thus, subjects with higher seniority, job title and educational degree paid more attention to KM,
and believed that their organization would benefit from a KM system.
The authors believe that after this research, the AIO leaders can decide in a better way for
establishing a knowledge management system. Of course further research is needed. One area is the
influence of customers or suppliers on KM adoption. The other is the value proposition of KM
adoption and implementation for the entire supply chain. Other research directions can include
studying the effects of company size on KM efforts.
The complex relationship between KM and strategic orientations in a knowledge-based
organization should also be addressed in future research. The effects of the adoption of KM on
overall business performance will be better assessed through a deeper understanding of the firms’
motivation and inducement into the adoption and the relation of this motivation bears on strategic
management. Furthermore, a better understanding of the relation between the KM adoption and
business strategies will benefit the forthcoming reforms of the KMS and will result in better
guidelines for its implementation in a knowledge management program.
© Emerald Group Publishing
27
References Akhavan, Peyman, Jafari, Mostafa, and Mohammad Fathian (2006), “Critical success factors of knowledge management systems: a multi case analysis”, European business review, Vol. 18, No. 2, pp. 97-113. Akhavan, Peyman , Jafari, Mostafa and Mohammad Fathian (2005) , “Exploring the failure factors of implementing knowledge management system in the organizations”, Journal of knowledge management practice , Vol. 6. Alavi, M. and Leidner, D.E. (2001), “Review: knowledge management and knowledge management systems: conceptual foundations and research issues”, MIS Quarterly, Vol. 25 No. 1, pp. 107-36. APQC (1999), “Knowledge Management: Executive Summary”, Consortium Benchmarking Study Best-Practice Report, American Productivity & Quality Center, available at: www. apqc.org (accessed 10 October 2003). Barsky, N. and Marchant, G. (2000), “The most valuable resource: measuring and managing intellectual capital”, Strategic Finance Magazine, Vol. 81 No. 8, pp. 58-62. Bartlett, M.S. (1950), “Test of significance in factor analysis, British journal of psychology”, Vol. 3, pp. 77-85. Bassi, L. and Ven Buren, M. (1999), “Valuing investments in intellectual capital”, International Journal of Technology Management, Vol. 18 No. 5, pp. 414-32. Bell, H. (2001), Measuring and managing knowledge. Boston: McGraw-Hill/Irwin. Bhatt, G., 2001, Knowledge management in organization, Journal of knowledge management, Vol. 5, No. 1, pp. 68-75. Bixler, Charlie. (2002). “Knowledge management: A practical solution for emerging global security requirements.” KM World, Vol. 11, No. 5, pp.18–28. Bourdreau, A. and Couillard, G. (1999), “Systems integration and knowledge management”, Information Systems Management, Vol. 16, No. 4, pp. 24-32. Bourgon, J. (1999), “Serving in the Knowledge Age: a Commitment to Lifelong Learning.” Speech presented at Technology in Government Week, Ottawa, Ontario, Available at: http://www.ccmd-ccg.gc.ca/newsroom/speeches/gtec.html. Buckman, R. (1999), “Collaborative knowledge”, Human Resource Planning, Vol. 22 No. 1, pp. 22-3. Burger, Paul (2004), Critical Success Factors for Knowledge Management in Government Enterprises: A Case Study of Success at the Department of Commerce, SYSTALEX E-Gov Knowledge Management Exhibition booth 214, United States. Chourides, P., Longbottom, D. and Murphy, W. (2003), “Excellence in knowledge management: an empirical study to identify critical factors and performance measures”, Measuring Business Excellence, Vol. 7 No. 2, pp. 29-45. Celemmons, M., R., The complete idiot's guide to knowledge management. Madison: Pearson Education Inc., 2002. Cohen, S. and Backer, N. (1999), “Making and mining intellectual capital: method or madness?”, Training & Development, Vol. 53 No. 9, pp. 46-50.
© Emerald Group Publishing
28
Davenport, T. and Klahr, P. (1998), “Managing customer support knowledge”, California Management Review, Vol. 40, No. 3, pp. 195-208. Davenport, T., De Long, D. and Beers, M. (1998), “Successful knowledge management projects”, Sloan Management Review, Vol. 39 No. 2, pp. 43-57. Davis, T. (1996), “Managing knowledge-work support functions”, Journal of General Management, Vol. 22 No. 1, pp. 68-86. Day, J. and Wendler, J. (1998), “Best practice and beyond: knowledge strategies”, The McKinsey Quarterly, No. 1, pp. 19-25. De la Mothe, J. and Paquet, G. (1997), “Coordination Failures in the Learning Economy.” De la Mothe, J. and Paquet, G. [eds.] Challenges Unmet in the New Production of Knowledge: the Third PRIME Lectures, 1996-1997. Ottawa: Program of Research in International Management and Economy. Dess, G. and Picken, J. (2000), “Changing roles: leadership in the 21st century”, Organizational Dynamics, Vol. 28, No. 3, pp. 18-34. Drew, S. (1997), “From knowledge to action: the impact of benchmarking on organizational performance”, Long Range Planning, Vol. 30 No. 3, pp. 427-41. Drucker, P. (1992), “The New Society of Organizations.” Harvard Business Review. Vol. 70. No. 5, pp. 95-104. Douglas, Guthric (1996) Transforming an existing organization into a learning organization, Group decision support system. Duval, C. (1999), “Developing individual freedom to act: empowerment in the knowledge organization”, Participation & Empowerment: An International Journal, Vol. 7 No. 8, pp. 204-7.
Davenport, Thomas H. and Prusak (1998), Laurence: Working Knowledge – How Organizations Manage What They Know. Harvard Business School Press, Boston, Massachusetts. Davis, S. and C. Meyer, (1998) Blur: the speed of change in the connected economy, Oxford :Capstone. Drucker, Peter (1989), The new realities. Oxford: Hinemann. Egbu, Charles (2004), Managing knowledge and intellectual capital for improved organizational innovations in the construction industry: an examination of critical success factors, Engineering, Construction and Architectural Management, Volume 11, No. 5, pp. 301–315. Gartner Group (2002), Knowledge Management Workshop Report, 2002. Greco, J. (1999), “Knowledge is power”, Journal of Business Strategy, Vol. 20 No. 2, pp. 18-22. Greengard, S. (1998), “Will your culture support KM?”, Workforce, Vol. 77 No. 10, pp. 93-4. Gregory, V. (1998), “Knowledge Management and the Learning Organization.” Available: http://www.cas.usf.edu/lis/lis6260/lectures/km.htm. Hickins, M. (1999), “Xerox shares its knowledge”, Management Review, Vol. 88 No. 8, pp. 40-5. Huber, G. P. (1991), Organizational learning: The contributing processes and the literatures. Organization Science, 2(1): 88-115.
© Emerald Group Publishing
29
Hair, J. F., Anderson, R. E., Tatham, R. L. and Black, W. C. (1998), Multivariate data analysis, Upper Saddle River, NJ: Prentice Hall, pp. 7-232. Hassel, L. (2001), A philosophical perspective of knowledge management , Martin’s press, 2001. Hasanali, F. (2002), “Critical success factors of knowledge management”, available at: www. kmadvantage.com/docs/km_articles/Critical_Success_Factors_of_KM.pdf (accessed 20 November 2003). Hollander, M., and Wolfe, D. A. (1973), Nonparametric Statistical Methods, John Wiley & Sons, New York, pp. 21-132. Holsapple, C.W. and Joshi, K.D. (2000), “An investigation of factors that influence the management of knowledge in organizations”, Journal of Strategic Information Systems, Vol. 9 Nos. 2/3, pp. 235-61. Hotelling, H. (1935), The most predictable criterion, Journal of Educational psyhology, Vol. 26, pp. 139-142. Hsieh, C., Yang, H. and Lin, B. (2002), “Roles of knowledge management in online procurement systems”, Industrial Management & Data Systems, Vol. 102 No. 7, pp. 365-70. Jones, G., and J. M. George (2003), Contemporary management, 3 ed. Boston: McGraw-Hill, 2003. Kaiser, H.F. (1958), “The varimax criterion for analytic rotation in factor analysis”, Psychometrika, Vol. 23 No. 3, pp. 187-200. King, W. (1996), “Is and the learning organization”, Information Systems Management, Vol. 13 No. Summer, pp. 78-80. Leonard, D., & Sensiper, S. (1998), The role of tacit knowledge in group innovation. California Management Review, 40(3): 112-132. Lee, S.M. and Hong, S. (2002), “An enterprise-wide knowledge management system infrastructure”, Industrial Management & Data Systems, Vol. 102 No. 1/2, pp. 17-25. Liebowitz, J. (1999), “Key ingredients to the success of an organization’s knowledge management strategy”, Knowledge and Process Management, Vol. 6 No. 1, pp. 37-40. Labovitz, George and Rosansky, Victor (1997), The power of alignment: How great companies stay centered and accomplish extraordinary things. New York: John Wiley. Likert and Rensis (1974), “The method of constructing an attitude scale in Gray M. Marshall”, Chicago aldine publishing company, pp. 21-43. McCune, J. (1999), “Thirst for knowledge”, Management Review, Vol. 88 No. 4, pp. 10-12. Martinez, M. (1998), “The collective power of employee knowledge”, HRM Magazine, Vol. 43, No. 2, pp. 88-94. Menzies, H. (2001), Personal Communication, available at: http://www.usask.ca/library/gic/v2n1/mcconnell/mcconnell.html Moffett, S., McAdam, R. and Parkinson, S. (2003), “An empirical analysis of knowledge management applications”, Journal of Knowledge Management, Vol. 23, No. 3, pp. 6-26. Malaga, R. (2005), Information systems technology. Upper Saddle River, NJ: Prentice Hall.
© Emerald Group Publishing
30
Nonaka, I. (1991),"The Knowledge-creating company," Harvard Business Review, Vol. 69, pp. 96-104, 1991. Nonaka, I. 1994. A dynamic theory of organizational knowledge creation. OrganizationScience, 5(1): 14-37. Nonaka, I., & Takeuchi, H. (1995), The knowledge-creating company: How Japanese companies create the dynamics of innovation. New York: Oxford University Press. O’Brien, O. and Crauise, R. (1995), “Employee involvement in performance improvement: a consideration of tacit knowledge, commitment and trust”, Employee Relations, Vol. 17 No. 3, p. 110. O’Dell, C. and Grayson, J. (1998), “If only we knew what we know: identification and transfer of internal best practices”, California Management Review, Vol. 40 No. 3, pp. 154-65. Park, Y., and Seonwoo Kim (2005), Linkage between knowledge management and R&D management, Journal of knowledge management , Vol. 9, No. 4, pp. 34-44, 2005. Penrose, E. T(1995), The theory of the growth of the firm, 3rd ed., New York: Oxford University Press.
Polani, M. (1966), The tacit dimension, New York: Doubleday. Probst, G., and Steffen Raub and Kai Rmhardt (2000), Managing Knowledge (building Block for Success), John Wliley, 2000. Paiva, E.L., Roth, A.V. and Fensterseifer, J.E. (2002), “Focusing information in manufacturing: a knowledge management perspective”, Industrial Management & Data Systems, Vol. 102, No. 9, pp. 381-9. Pearson, T. (1999), “Measurements and the knowledge revolution”, Quality Progress, Vol. 32 No. 9, pp. 31-7. Ryan, S.D. and Prybutok, V.R. (2001), “Factors affecting knowledge management technologies: a discriminative approach”, Journal of Computer Information Systems, Vol. 41 No. 3, pp. 31-7. Ray, J., Mebane (2003), Designing a knowledge management system: a sense making perspective, The Pennsylvania State University, The Graduate School The Mary Jean and Frank P. Smeal College of Business Administration, 2003. Romer, P. M. (1993), Two strategies for economic development: Using ideas and producing ideas. Proceedings of the World Bank Annual Conference on Development Economics 1992. Washington, DC: World Bank. Ruggles, R. (1998). The state of the notion: Knowledge management in practice, California Management Practice, Vol.40, No.3, pp. 80-89. Sproull, L. S., & Goodman, P. S. (1990), Technology and organizations: Integration and opportunities. In P. S. Goodman, L. S. Sproull, & Associates, Technology and organizations: 1-44. San Francisco: Jossey-Bass. Savary, M. (1999), “Knowledge management and competition in the consulting industry”, California Management Review, Vol. 41 No. 2, pp. 95-107. Schein, Edgar H. (1999). Organizational learning: What is new? Address to the Third Biennnial International Conference on Advances in Management. Available at:http://learning.mit.edu/res/wp/10012ref.html Skyrme, D. and Amidon, D. (1997), “The knowledge agenda”, Journal of Knowledge Management, Vol. 1 No. 1, pp. 27-37. Tobin, Tom (2003), Ten principles for knowledge management success, Gartner Inc.
© Emerald Group Publishing
31
Tynan, S. (1999), “Best behaviors”, Management Review, Vol. 88 No. 10, pp. 8-61. Teece, D. (1998), "Capturing value from knowledge assets: the new economy, markets for know-how, and intangible assets," California Management Review, vol. 40 ,pp. 55-79, 1998. Thomas, G. (1995), “The Changing Economy and Knowledge-Based Services: How Will Canada Succeed?” Paper presented at the Couchiching Institute Winter Conference, Toronto, Ontario, available at: http://www.couch.ca/history/1995/Thomas.html. Ulrich, D. (1998), “Intellectual capital ¼ competence £ commitment”, Sloan Management Review, Vol. 39 No. 2, pp. 15-26. Ulrich,D. and D. Lake (1991),“Organizational Capability: Creating the Competitive Advantage .”The Academy of Management Executive, Vol.5, No. 1 , pp.7 7 – 9 2 . Van Buren, M. (1998), “Virtual coffee klatch”, Technical Training, Vol. 9 No. 5, pp. 42-6. Verespej, M. (1999), “Knowledge management: system or culture?”, Industry Week, Vol. 248 No. 15, pp. 20-3. Wang, S. (2002), “Knowledge maps for managing web-based business”, Industrial Management & Data Systems, Vol. 102 No. 7, pp. 357-64. Ward, J. (1997), “Implementing employee empowerment”, Information Systems Management, Vol. 14, Winter, pp. 62-7. Wild, R.H., Griggs, K.A. and Downing, T. (2002), “A framework for e-learning as a tool for knowledge management”, Industrial Management & Data Systems, Vol. 102 No. 7, pp. 371-80. Wilson, L. and Asay, D. (1999), “Putting quality in knowledge management”, Quality Progress, Vol. 32 No. 1, pp. 25-31. Witzel, M. (2000), "Knowledge corporation," in The IEBM handbook of information technology in business, M. Zeleny, Ed. London: Thomson Learning, 2000, pp. 142-150. Weick, K. E. (1990), Technology as equivoque: Sense making in new technologies. In P. S. Goodman, L. S. Sproull, & Associates, Technology and organizations: 1-44. San Francisco: Jossey-Bass. Wong, Kuan Yew (2005), Critical success factors for implementing knowledge management in small and medium enterprises, Industrial Management & Data Systems, Vol. 105 No. 3, pp. 261-279 Zeleny, (2001), "Knowledge vs. information," in The IEBM handbook of information technology in business, M. Zeleny, Ed. London: Thomson Learning, 2001, pp. 162-168.
Top Related
Copyright © 2022 FDOKUMEN

