


Bahasa
Halaman
Hukum

A Comparative Study of Techniques for DifferentialExpression Analysis on RNA-Seq DataZong Hong Zhang1, Dhanisha J. Jhaveri1, Vikki M. Marshall1, Denis C. Bauer1,2, Janette Edson1,3,
Ramesh K. Narayanan1, Gregory J. Robinson1, Andreas E. Lundberg4, Perry F. Bartlett1, Naomi R. Wray1,
Qiong-Yi Zhao1*
1 The University of Queensland, Queensland Brain Institute, Brisbane, Queensland, Australia, 2 CSIRO Preventative Health Flagship and CSIRO Computational Informatics,
Sydney, New South Wales, Australia, 3 The University of Queensland, Diamantina Institute, Brisbane, Queensland, Australia, 4 Swedish University of Agricultural Sciences,
Department of Clinical Sciences, Uppsala, Sweden
Abstract
Recent advances in next-generation sequencing technology allow high-throughput cDNA sequencing (RNA-Seq) to bewidely applied in transcriptomic studies, in particular for detecting differentially expressed genes between groups. Manysoftware packages have been developed for the identification of differentially expressed genes (DEGs) between treatmentgroups based on RNA-Seq data. However, there is a lack of consensus on how to approach an optimal study design andchoice of suitable software for the analysis. In this comparative study we evaluate the performance of three of the mostfrequently used software tools: Cufflinks-Cuffdiff2, DESeq and edgeR. A number of important parameters of RNA-Seqtechnology were taken into consideration, including the number of replicates, sequencing depth, and balanced vs.unbalanced sequencing depth within and between groups. We benchmarked results relative to sets of DEGs identifiedthrough either quantitative RT-PCR or microarray. We observed that edgeR performs slightly better than DESeq andCuffdiff2 in terms of the ability to uncover true positives. Overall, DESeq or taking the intersection of DEGs from two or moretools is recommended if the number of false positives is a major concern in the study. In other circumstances, edgeR isslightly preferable for differential expression analysis at the expense of potentially introducing more false positives.
Citation: Zhang ZH, Jhaveri DJ, Marshall VM, Bauer DC, Edson J, et al. (2014) A Comparative Study of Techniques for Differential Expression Analysis on RNA-SeqData. PLoS ONE 9(8): e103207. doi:10.1371/journal.pone.0103207
Editor: Paolo Provero, University of Turin, Italy
Received March 4, 2014; Accepted June 30, 2014; Published August 13, 2014
Copyright: � 2014 Zhang et al. This is an open-access article distributed under the terms of the Creative Commons Attribution License, which permitsunrestricted use, distribution, and reproduction in any medium, provided the original author and source are credited.
Funding: This work was supported by a National Health and Medical Research Council Program Grant to PFB, an Australian Research Council (FT FT0991360) andNHMRC (613602) fellowships to NRW and the Estate of Dr. Clem Jones AO. The funders had no role in study design, data collection and analysis, decision topublish, or preparation of the manuscript.
Competing Interests: The authors have declared that no competing interests exist.
* Email: [email protected]
Introduction
High-throughput cDNA sequencing (RNA-Seq) has emerged as
an attractive and cost-effective approach for transcriptome
profiling due to ongoing increases in throughput and decreases
in costs of next-generation sequencing (NGS). Compared to
microarray techniques, RNA-Seq can be performed without prior
knowledge of reference sequences and enables a wide range of
applications including transcriptome de novo assembly [1–4],
abundance estimation [5–9], and detection of alternative splicing
events [10–12], all of which have revolutionized our understand-
ing of the extent and complexity of eukaryotic transcriptomes [13].
In RNA-Seq experiments, the primary interest of biologists in
many studies is differential expression analysis between groups. To
quantify gene expression, RNA-Seq reads need to be aligned to
the reference genome for model organisms (e.g. human, mouse) or
to the transcriptome sequences reconstructed using de novoassembly strategies for organisms without reference sequences.
The number of mapped reads is calculated based on the outcome
of the alignment to estimate the relative expression level of genes
and subsequently statistical methods are applied to test the
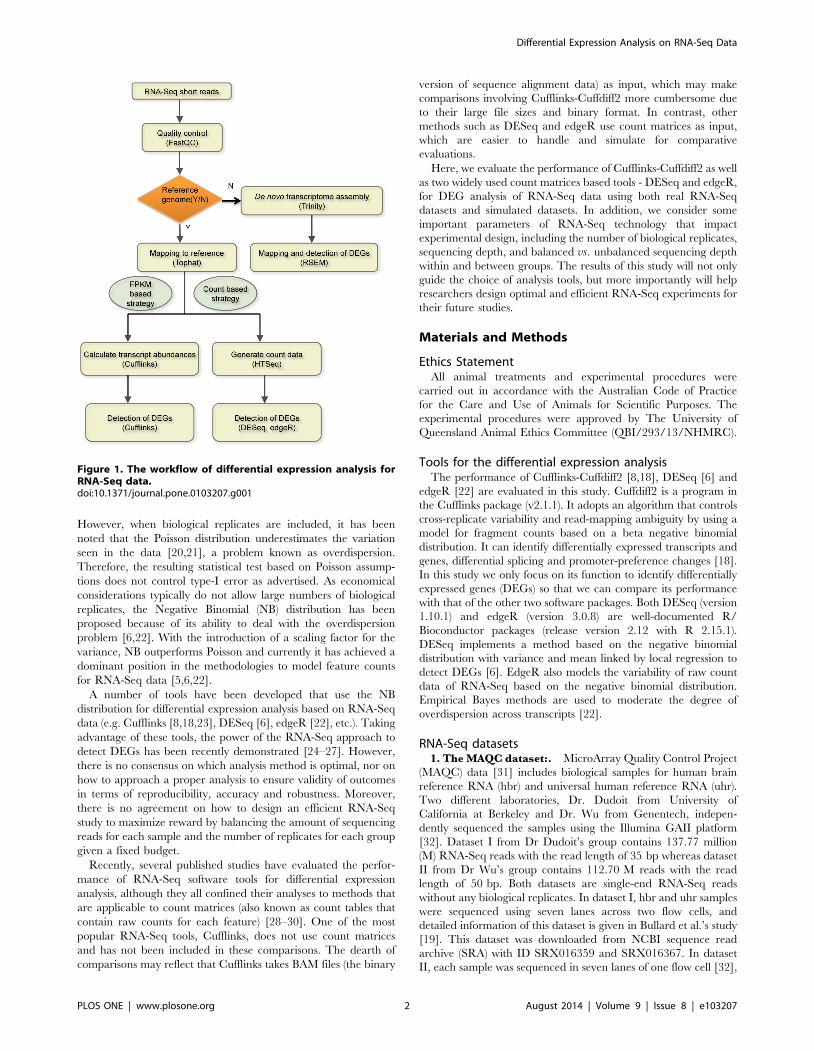
significance of differences between groups. The general workflow
for the analysis of differential expression is illustrated in Figure 1.
Although initially it was claimed that RNA-Seq applications
could produce unbiased, ready-to-analyze gene expression data
[14,15], in reality it is nontrivial to accurately quantify gene
expression and detect differentially expressed genes (DEGs).
Difficulties faced by researchers in RNA-Seq study design and
analysis are 1) general biases and errors inherent in the NGS
technology (e.g. biases introduced during library preparation,
nucleotide-specific and read-position specific biases in sequence
quality and error rate) [16,17]; 2) biases of abundance measures
due to the effects of nucleotide composition and the varying length
of genes or transcripts [5]; 3) undetermined effects of both
sequencing depth and the number of replicates; 4) the combina-
tion of technical and biological variation as well as biases within
and between treatment groups that make it difficult to accurately
discriminate real biological differences between groups; 5) the
existence of alternative gene isoforms and overlapping sense-
antisense transcripts may also compound difficulties in differential
expression analysis [18].
Several attempts have been made to address the aforemen-
tioned difficulties (e.g. ref.16–18). In early RNA-Seq studies
lacking biological replicates, the distribution of feature counts
across technical replicates was reported to fit well to a Poisson
distribution where the variance is equal to the mean [15,19].
PLOS ONE | www.plosone.org 1 August 2014 | Volume 9 | Issue 8 | e103207
However, when biological replicates are included, it has been
noted that the Poisson distribution underestimates the variation
seen in the data [20,21], a problem known as overdispersion.
Therefore, the resulting statistical test based on Poisson assump-
tions does not control type-I error as advertised. As economical
considerations typically do not allow large numbers of biological
replicates, the Negative Binomial (NB) distribution has been
proposed because of its ability to deal with the overdispersion
problem [6,22]. With the introduction of a scaling factor for the
variance, NB outperforms Poisson and currently it has achieved a
dominant position in the methodologies to model feature counts
for RNA-Seq data [5,6,22].
A number of tools have been developed that use the NB
distribution for differential expression analysis based on RNA-Seq
data (e.g. Cufflinks [8,18,23], DESeq [6], edgeR [22], etc.). Taking
advantage of these tools, the power of the RNA-Seq approach to
detect DEGs has been recently demonstrated [24–27]. However,
there is no consensus on which analysis method is optimal, nor on
how to approach a proper analysis to ensure validity of outcomes
in terms of reproducibility, accuracy and robustness. Moreover,
there is no agreement on how to design an efficient RNA-Seq
study to maximize reward by balancing the amount of sequencing
reads for each sample and the number of replicates for each group
given a fixed budget.
Recently, several published studies have evaluated the perfor-
mance of RNA-Seq software tools for differential expression
analysis, although they all confined their analyses to methods that
are applicable to count matrices (also known as count tables that
contain raw counts for each feature) [28–30]. One of the most
popular RNA-Seq tools, Cufflinks, does not use count matrices
and has not been included in these comparisons. The dearth of
comparisons may reflect that Cufflinks takes BAM files (the binary
version of sequence alignment data) as input, which may make
comparisons involving Cufflinks-Cuffdiff2 more cumbersome due
to their large file sizes and binary format. In contrast, other
methods such as DESeq and edgeR use count matrices as input,
which are easier to handle and simulate for comparative
evaluations.
Here, we evaluate the performance of Cufflinks-Cuffdiff2 as well
as two widely used count matrices based tools - DESeq and edgeR,
for DEG analysis of RNA-Seq data using both real RNA-Seq
datasets and simulated datasets. In addition, we consider some
important parameters of RNA-Seq technology that impact
experimental design, including the number of biological replicates,
sequencing depth, and balanced vs. unbalanced sequencing depth
within and between groups. The results of this study will not only
guide the choice of analysis tools, but more importantly will help
researchers design optimal and efficient RNA-Seq experiments for
their future studies.
Materials and Methods
Ethics StatementAll animal treatments and experimental procedures were
carried out in accordance with the Australian Code of Practice
for the Care and Use of Animals for Scientific Purposes. The
experimental procedures were approved by The University of
Queensland Animal Ethics Committee (QBI/293/13/NHMRC).
Tools for the differential expression analysisThe performance of Cufflinks-Cuffdiff2 [8,18], DESeq [6] and
edgeR [22] are evaluated in this study. Cuffdiff2 is a program in
the Cufflinks package (v2.1.1). It adopts an algorithm that controls
cross-replicate variability and read-mapping ambiguity by using a
model for fragment counts based on a beta negative binomial
distribution. It can identify differentially expressed transcripts and
genes, differential splicing and promoter-preference changes [18].
In this study we only focus on its function to identify differentially
expressed genes (DEGs) so that we can compare its performance
with that of the other two software packages. Both DESeq (version
1.10.1) and edgeR (version 3.0.8) are well-documented R/
Bioconductor packages (release version 2.12 with R 2.15.1).
DESeq implements a method based on the negative binomial
distribution with variance and mean linked by local regression to
detect DEGs [6]. EdgeR also models the variability of raw count
data of RNA-Seq based on the negative binomial distribution.
Empirical Bayes methods are used to moderate the degree of
overdispersion across transcripts [22].
RNA-Seq datasets1. The MAQC dataset:. MicroArray Quality Control Project
(MAQC) data [31] includes biological samples for human brain
reference RNA (hbr) and universal human reference RNA (uhr).
Two different laboratories, Dr. Dudoit from University of
California at Berkeley and Dr. Wu from Genentech, indepen-
dently sequenced the samples using the Illumina GAII platform
[32]. Dataset I from Dr Dudoit’s group contains 137.77 million
(M) RNA-Seq reads with the read length of 35 bp whereas dataset
II from Dr Wu’s group contains 112.70 M reads with the read
length of 50 bp. Both datasets are single-end RNA-Seq reads
without any biological replicates. In dataset I, hbr and uhr samples
were sequenced using seven lanes across two flow cells, and
detailed information of this dataset is given in Bullard et al.’s study
[19]. This dataset was downloaded from NCBI sequence read
archive (SRA) with ID SRX016359 and SRX016367. In dataset
II, each sample was sequenced in seven lanes of one flow cell [32],
Figure 1. The workflow of differential expression analysis forRNA-Seq data.doi:10.1371/journal.pone.0103207.g001
Differential Expression Analysis on RNA-Seq Data
PLOS ONE | www.plosone.org 2 August 2014 | Volume 9 | Issue 8 | e103207
the details regarding the dataset II are given in Nacu et al.’s study
[33]. This dataset was downloaded from NCBI Gene Expression
Omnibus (GEO) with ID GSE24284 (GSM597210 for hbr and
GSM597211 for uhr). In both datasets, all reads were merged
from different lanes for the same sample and the number of reads
for each sample is shown in Table S1 in Supporting Information
S1. The treatment groups compared for identification of DEGs are
hbr vs. uhr.
2. The K_N dataset:. The K_N RNA-Seq dataset was
generated in-house at Queensland Brain Institute from mouse
neurosphere cells treated by potassium chloride (KCl) and
norepinephrine. Briefly, adult (8–12 week old) male C57BL/6J
mice were used for all in vitro experiments conducted in this study.
All mice were housed in groups and maintained on a 12-hour
light/dark cycle with ad libitum access to food and water. After
mice were sacrificed by cervical dislocation, the neural precursor
activity was examined as described in detail in a previous study
[34]. The isolated hippocampal tissue was minced to obtain a
single cell suspension. The cell suspension was cultured in
complete neurosphere medium containing EGF and bFGF, in
the presence of norepinephrine (10 mM) or potassium chloride
(15 mM). The primary neurospheres were collected on day 14 for
each treatment. Total RNA was extracted from neurospheres
using TRIzol Reagent (Life Technologies) and chloroform (Sigma-
Aldrich) followed by precipitation and washing with isopropanol
and ethanol respectively. RNA samples were treated with the
Ambion DNA-free kit (Life Technologies) according to the
manufacturer’s instructions to remove any contamination from
genomic DNA. DNase-treated samples were assessed for their
RNA integrity number (RIN) using an Agilent RNA 6000 Pico Kit
(Agilent Technologies) on the Agilent 2100 Bioanalyser according
to the manufacturer’s instructions. RNA samples with a RIN
greater than 8 were selected and a total of 100 ng was used for
each sample for sequencing. Total RNA was quantitated using the
QuBit RNA assay kit (Life technologies, cat#Q32852). Sequence
libraries were generated using the Illumina TruSeq RNA Sample
Preparation Kit v2 (cat#RS-122-2001), with sample indexing/
multiplexing. A total of four libraries (four biological replicates)
were prepared for each of the treatment groups and sequenced
using the Illumina Hiseq2000 platform. Data generated from
potassium treatment group is referred to as ‘‘K’’, and data from
norepinephrine treatment is referred to as ‘‘N’’, hence the ‘‘K_N’’
dataset. In total, 476.38 M paired-end reads with a read length of
101 bp62 were generated (231.55 M for K and 244.83 M for N),
and we refer the full dataset of ‘‘K_N’’ as ‘‘K_N_full’’. The data
sizes of the four biological replicates in each group are shown in
Table S2.
In order to investigate the impact of sequencing depth on the
performance of three software tools, we randomly subsampled four
subsets of data with different sequencing depths from the
‘‘K_N_full’’ dataset. Each subset contains the balanced dataset
around 30 M, 20 M, 10 M, 5M for each individual sample, and
these subsets are named as ‘‘K_N_30M’’, ‘‘K_N_20M’’,
‘‘K_N_10M’’ and ‘‘K_N_5M’’, respectively. In order to study
the effects of unbalanced sequencing depth between treatment
groups, another two subsets were generated. One subset includes
30 M of data in the ‘‘K’’ group but 5 M in the ‘‘N’’ group, and
this subset is denoted as ‘‘unbalanced between groups 1’’. The
other unbalanced subset includes all data in the ‘‘K’’ group but
20 M in the ‘‘N’’ group and it is denoted as ‘‘unbalanced between
groups 2’’.
3. The lymphoblastoid cell lines dataset:. The lympho-
blastoid cell lines (LCL) RNA-Seq datasets were generated by
Pickrell et al. [35]. It is a large population based RNA-Seq
experiment, which sequenced 69 cell lines derived from Yoruban
individuals from Nigeria by the International HapMap Project.
Each sample was separately prepared and sequenced at two
independent sequencing centers (the Yale sequencing center and the
Argonne sequencing center) using the Illumina GAII platform.
In this study, we used samples with more than 8 M reads per
individual from those sequenced at Yale to gain enough sequencing
depth for each sample, which resulted in 40 samples in total (NCBI
SRA accessions: SRR031811 - SRR031820, SRR031839, SRR031840,
SRR031843 - SRR031846, SRR031848, SRR031857 - SRR031861,
SRR031867 - SRR031875, SRR031877, SRR031893 - SRR031896,
SRR031898, SRR031899, SRR031955, SRR031956). From these
40 individuals, we randomly selected and assigned N (N = 20, 14, 8,
6, 5, 4, 3, 2, 1) samples to each of the two hypothetical treatment
groups. N is the number of biological replicates in each hypothetical
treatment group. We expect no differentially expressed genes
between the two hypothetical groups because samples were
randomly selected from a same population. This dataset (hereafter
referred to as the LCL1 dataset) is used to estimate false positive
rates for the three software tools.
Comparisons of methods based on real RNA-Seq data are
limited because a complete list of true DEGs and non-DEGs is not
known. Therefore, we also used simulated data with known DEGs
to estimate the true positive rate and false positive rate.
Specifically, we simulated DEGs in two hypothetical groups using
a strategy similar to that described in [29]. Briefly, DEGs were
simulated to a random sample of 10% of the total genes. The
count values of these DEGs were generated by scaling their
original raw counts by exp{(21)idj} where two different groups are
indexed by i = 1, 2 and dj follows a two component normal
distribution with parameter m= (20.5, 0.5) and s= (0.7, 0.7). We
employed this simulation design based on the LCL1 dataset.
According to the simulated count values, bam files were generated
by randomly adding or removing aligned reads using custom
PERL scripts and SAMtools [36] for the application of Cuffdiff2.
This dataset is named as the LCL2 dataset.
In addition, five randomly subsampled subsets (hereafter we
referred as the LCL3 dataset) were generated based on the LCL2
dataset to test performance of each of three software tools using RNA-
Seq datasets with different sequencing depths or with unbalanced
sized data between/within groups, named as ‘‘S1_8M_balanced’’,
‘‘S2_5M_balanced’’, ‘‘S3_1M_balanced’’, ‘‘S4_5M_1M_btw’’ and
‘‘S5_5M_1M_within’’. Of them, ‘‘S1_8M_balanced’’, ‘‘S2_5M_ba-
lanced’’ and ‘‘S3_1M_balanced’’ are subsets with around 8 M, 5 M
and 1 M number of reads, respectively, for each sample in both
conditions. ‘‘S4_5M_1M_btw’’ is the subset with numbers of reads
being much higher in one condition (5 M) than that in the other
condition (1 M). ‘‘S5_5M_1M_within’’ is the subset that the data size
is unbalanced within each condition (i.e. numbers of reads for some of
the samples in condition 1 and condition 2 are around 5 M while
numbers of reads of other samples are around 1 M). See details in
Table S3 in Supporting Information S1 for the information of each
subset of LCL3 dataset. All studies for LCL1, LCL2 and LCL3
datasets were performed based on 10 independent simulations and
the average values (i.e. number of DEGs, false positive rate and true
positive rate) of the10 simulations were used.
Benchmark datasets1. Quantitative RT-PCR data:. The results of quantitative
RT-PCR (qRT-PCR) data from NCBI GEO (series ID GSE5350)
was used as gold standard to evaluate the performance of three
tools based on MAQC RNA-Seq datasets. We downloaded the
four technical replicates of the uhr sample from GSM129638 to
GSM129641, and the four technical replicates of the brain sample
Differential Expression Analysis on RNA-Seq Data
PLOS ONE | www.plosone.org 3 August 2014 | Volume 9 | Issue 8 | e103207
from GSM129642 to GSM129645, with a total of 1044 genes in
the list. Among these genes, only those genes with the unique
matched Refseq (hg19) gene ID were kept and genes with zero
read counts in all samples of qRT-PCR were filtered out. The log2
ratio of fold change (log2FC) of the gene expression value between
hbr and uhr was calculated according to Bullard et al.’s study [19].
Genes with |log2FC|.2 (more than 4 fold differentially expressed
between hbr and uhr) are considered as differentially expressed
(the positive set). In contrast, genes with |log2FC|,0.2 are
considered as the negative set. Among the 1044 genes, 410 genes
are in the positive set and 86 genes are in the negative set.2. Microarray data:. Microarray data for the neurosphere
samples was generated at Queensland Brain Institute. Briefly,
RNA was isolated from neurospheres generated in presence of
either N or K (n = 3 each, two biological replicates in common
with the RNA-Seq data) and converted to cDNA using Applause
WT-Amp ST kit (NuGEN). Fragmentation and biotin labelling of
the cDNA was carried out using Encore Biotin module (NuGEN)
for Affymetrix GeneChip Mouse Gene 1.0 ST arrays. Labelled
cDNA was hybridised to arrays in an oven at 45uC. Hybridised
arrays were scanned using the Affymetrix GeneChip Scanner and
the scanned data (.CEL files) was transferred to the Partek
Genomics Suite and data analysis was carried out as described in
Narayanan et al.’s study [37]. The results of cDNA microarrays
have been employed to verify the performance of three software
programs based on K_N RNA-Seq datasets. Among total 35557
genes of K_N microarray data, only genes with the unique
matched Refseq (mm10) gene ID were retained. Genes with
|log2FC|.1 and the corresponding P-value less than 0.05 were
chosen as the positive set whereas genes with the |log2FC|,0.1
and the P-value larger than 0.1 were chosen as the negative set. In
total, we obtained 77 genes in the positive set and 9072 genes in
the negative set from this microarray benchmark data.
Differential expression analysis for RNA-Seq datasetsOur basic analyses followed the general workflow depicted in
Figure 1. Briefly, Tophat (version 2.0.8) [38] was used to align the
short reads to the reference human genome (hg19) for MAQC and
LCL datasets and mouse genome (mm10) for K_N dataset.
Cuffdiff2 was then used to generate the list of DEGs. For input
into the DESeq and edgeR packages, the raw count table was
produced by HTseq-count (version 0.5.4p2) and then the lists of
DEGs were generated as recommended in the manuals of these
two packages. An example of detailed commands for the
differential expression analysis is listed in File S1 in Supporting
Information S1.
Evaluation of the performance of three techniques fordetecting DEGs
The area under the receiver operating characteristic (ROC)
curve (AUC) is used to evaluate the performance of different
techniques for the detection of DEGs as suggested in [32]. For the
MAQC RNA-Seq data, we compared the results of each software
program with the positive and negative sets from qRT-PCR. For
the K_N dataset, we compared the results from the full dataset and
its subsets with the positive and negative sets from the microarray
data. For the LCL dataset, since we introduced DE genes by
simulation, a full set of known DEGs and non-DEGs could be used
to evaluate the performance of three methods. Thus, true positives
(TP), false positives (FP), true negatives (TN) and false negatives
(FN) are calculated based on the comparison results between
RNA-Seq datasets and the positive and negative sets of the
corresponding benchmark dataset. The false positive rate (FPR)
and the true positive rate (TPR) are defined as follows: FPR = FP/
(FP+TN), TPR = TP/(TP+FN), (see also Table S4 in Supporting
Information S1).
The relationship between TPR and FPR is depicted by the
ROC. As pointed out by [32], two kinds of AUC can be calculated
in our experiments: (1) AUC1 is the area under the ROC curve in
the full range of FPR, i.e. 0#FPR#1 and the maximum AUC1 is
1; (2) AUC2 is the area under the ROC curve in the range of 0#
FPR#0.05 and the maximum AUC2 is 0.05. AUC1 reflects
overall performance of identification of DEGs for each tool. In
contrast, AUC2 reflects the relative performance when we limit
the range of the false positive rate to that often applied in discovery
analyses.
Data and source codes availabilityThe K_N RNA-Seq dataset has been deposited in the NCBI
SRA with accession ID SRX516577. The microarray data for the
neurosphere samples has been deposited in the NCBI Gene
Expression Omnibus with accession ID GSE57440.
Analysis pipelines with detailed descriptions for subsampling
datasets and generating BAM files based on simulated count
values are listed in File S1 in Supporting Information S1. All
custom PERL scripts mentioned in our analysis pipelines can be
downloaded from GitHub https://github.com/Qiongyi/RNA-
Seq-comparison/.
Results and Discussion
Biological and technical replicatesWe first investigated the impact of biological and technical
replicates on the performance of differential expression analysis for
each of three tools. The MAQC RNA-Seq datasets include two
technical replicates that were independently generated in two
different laboratories. The K_N RNA-Seq dataset as well as its
subsets include 4 biological replicates. The LCL RNA-Seq dataset
as well as its subsets include 20 biological replicates in each group.
All datasets have been processed through the analysis pipeline
shown in Figure 1 (reference genome available).
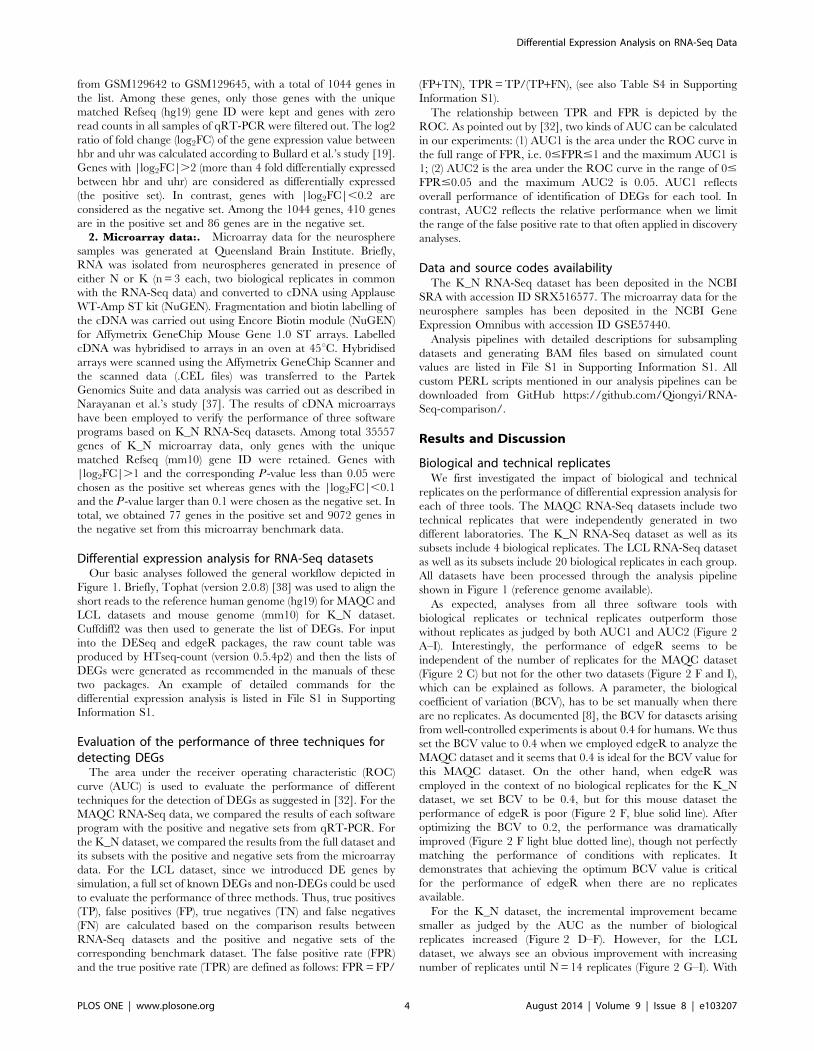
As expected, analyses from all three software tools with
biological replicates or technical replicates outperform those
without replicates as judged by both AUC1 and AUC2 (Figure 2
A–I). Interestingly, the performance of edgeR seems to be
independent of the number of replicates for the MAQC dataset
(Figure 2 C) but not for the other two datasets (Figure 2 F and I),
which can be explained as follows. A parameter, the biological
coefficient of variation (BCV), has to be set manually when there
are no replicates. As documented [8], the BCV for datasets arising
from well-controlled experiments is about 0.4 for humans. We thus
set the BCV value to 0.4 when we employed edgeR to analyze the
MAQC dataset and it seems that 0.4 is ideal for the BCV value for
this MAQC dataset. On the other hand, when edgeR was
employed in the context of no biological replicates for the K_N
dataset, we set BCV to be 0.4, but for this mouse dataset the
performance of edgeR is poor (Figure 2 F, blue solid line). After
optimizing the BCV to 0.2, the performance was dramatically
improved (Figure 2 F light blue dotted line), though not perfectly
matching the performance of conditions with replicates. It
demonstrates that achieving the optimum BCV value is critical
for the performance of edgeR when there are no replicates
available.
For the K_N dataset, the incremental improvement became
smaller as judged by the AUC as the number of biological
replicates increased (Figure 2 D–F). However, for the LCL
dataset, we always see an obvious improvement with increasing
number of replicates until N = 14 replicates (Figure 2 G–I). With
Differential Expression Analysis on RNA-Seq Data
PLOS ONE | www.plosone.org 4 August 2014 | Volume 9 | Issue 8 | e103207
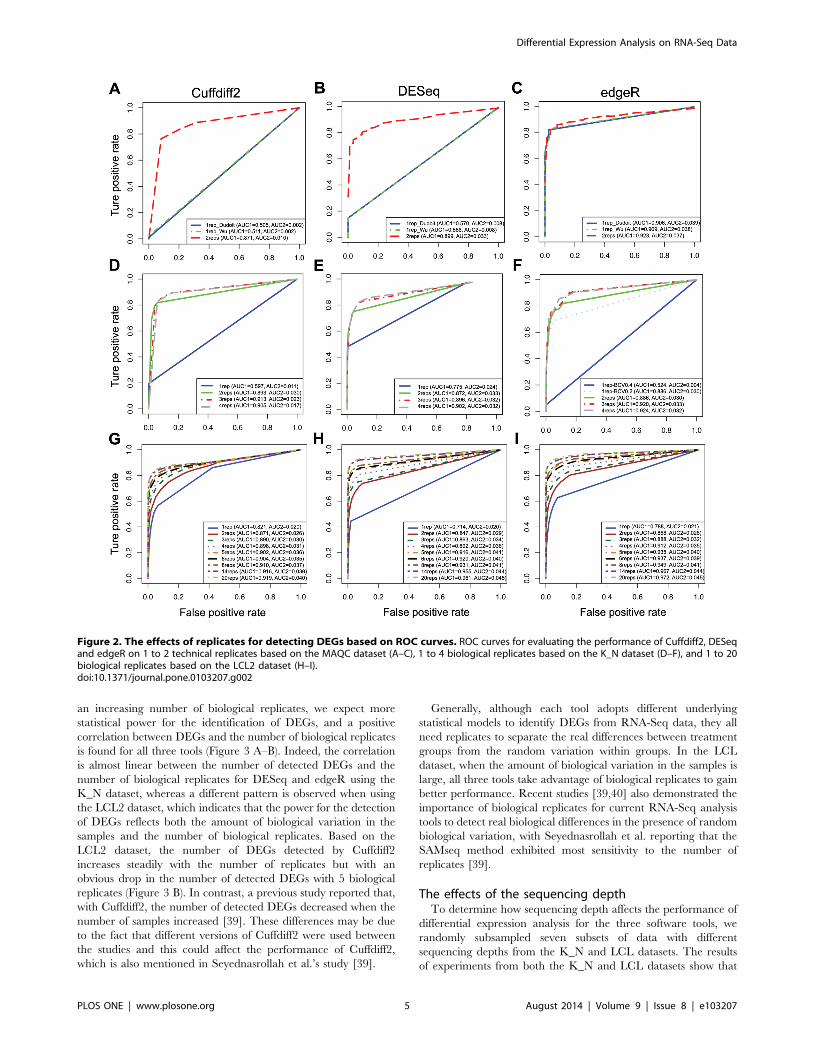
an increasing number of biological replicates, we expect more
statistical power for the identification of DEGs, and a positive
correlation between DEGs and the number of biological replicates
is found for all three tools (Figure 3 A–B). Indeed, the correlation
is almost linear between the number of detected DEGs and the
number of biological replicates for DESeq and edgeR using the
K_N dataset, whereas a different pattern is observed when using
the LCL2 dataset, which indicates that the power for the detection
of DEGs reflects both the amount of biological variation in the
samples and the number of biological replicates. Based on the
LCL2 dataset, the number of DEGs detected by Cuffdiff2
increases steadily with the number of replicates but with an
obvious drop in the number of detected DEGs with 5 biological
replicates (Figure 3 B). In contrast, a previous study reported that,
with Cuffdiff2, the number of detected DEGs decreased when the
number of samples increased [39]. These differences may be due
to the fact that different versions of Cuffdiff2 were used between
the studies and this could affect the performance of Cuffdiff2,
which is also mentioned in Seyednasrollah et al.’s study [39].
Generally, although each tool adopts different underlying
statistical models to identify DEGs from RNA-Seq data, they all
need replicates to separate the real differences between treatment
groups from the random variation within groups. In the LCL
dataset, when the amount of biological variation in the samples is
large, all three tools take advantage of biological replicates to gain
better performance. Recent studies [39,40] also demonstrated the
importance of biological replicates for current RNA-Seq analysis
tools to detect real biological differences in the presence of random
biological variation, with Seyednasrollah et al. reporting that the
SAMseq method exhibited most sensitivity to the number of
replicates [39].
The effects of the sequencing depthTo determine how sequencing depth affects the performance of
differential expression analysis for the three software tools, we
randomly subsampled seven subsets of data with different
sequencing depths from the K_N and LCL datasets. The results
of experiments from both the K_N and LCL datasets show that
Figure 2. The effects of replicates for detecting DEGs based on ROC curves. ROC curves for evaluating the performance of Cuffdiff2, DESeqand edgeR on 1 to 2 technical replicates based on the MAQC dataset (A–C), 1 to 4 biological replicates based on the K_N dataset (D–F), and 1 to 20biological replicates based on the LCL2 dataset (H–I).doi:10.1371/journal.pone.0103207.g002
Differential Expression Analysis on RNA-Seq Data
PLOS ONE | www.plosone.org 5 August 2014 | Volume 9 | Issue 8 | e103207
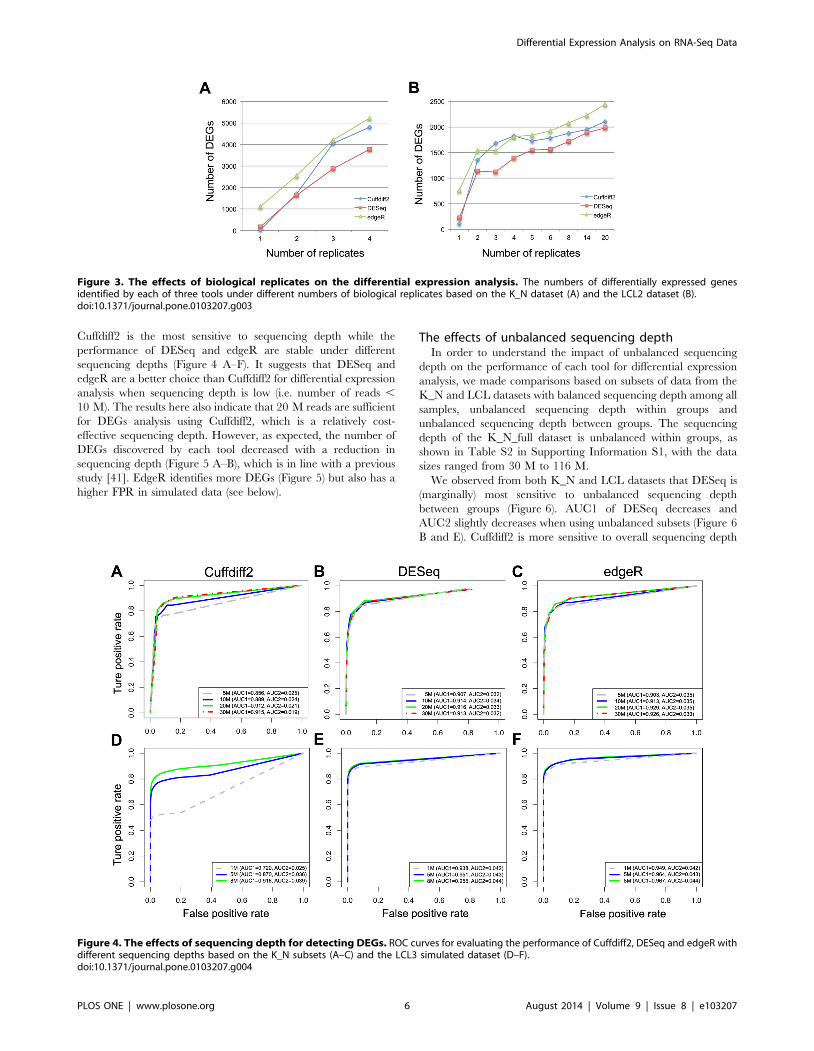
Cuffdiff2 is the most sensitive to sequencing depth while the
performance of DESeq and edgeR are stable under different
sequencing depths (Figure 4 A–F). It suggests that DESeq and
edgeR are a better choice than Cuffdiff2 for differential expression
analysis when sequencing depth is low (i.e. number of reads ,
10 M). The results here also indicate that 20 M reads are sufficient
for DEGs analysis using Cuffdiff2, which is a relatively cost-
effective sequencing depth. However, as expected, the number of
DEGs discovered by each tool decreased with a reduction in
sequencing depth (Figure 5 A–B), which is in line with a previous
study [41]. EdgeR identifies more DEGs (Figure 5) but also has a
higher FPR in simulated data (see below).
The effects of unbalanced sequencing depthIn order to understand the impact of unbalanced sequencing
depth on the performance of each tool for differential expression
analysis, we made comparisons based on subsets of data from the
K_N and LCL datasets with balanced sequencing depth among all
samples, unbalanced sequencing depth within groups and
unbalanced sequencing depth between groups. The sequencing
depth of the K_N_full dataset is unbalanced within groups, as
shown in Table S2 in Supporting Information S1, with the data
sizes ranged from 30 M to 116 M.
We observed from both K_N and LCL datasets that DESeq is
(marginally) most sensitive to unbalanced sequencing depth
between groups (Figure 6). AUC1 of DESeq decreases and
AUC2 slightly decreases when using unbalanced subsets (Figure 6
B and E). Cuffdiff2 is more sensitive to overall sequencing depth
Figure 3. The effects of biological replicates on the differential expression analysis. The numbers of differentially expressed genesidentified by each of three tools under different numbers of biological replicates based on the K_N dataset (A) and the LCL2 dataset (B).doi:10.1371/journal.pone.0103207.g003
Figure 4. The effects of sequencing depth for detecting DEGs. ROC curves for evaluating the performance of Cuffdiff2, DESeq and edgeR withdifferent sequencing depths based on the K_N subsets (A–C) and the LCL3 simulated dataset (D–F).doi:10.1371/journal.pone.0103207.g004
Differential Expression Analysis on RNA-Seq Data
PLOS ONE | www.plosone.org 6 August 2014 | Volume 9 | Issue 8 | e103207
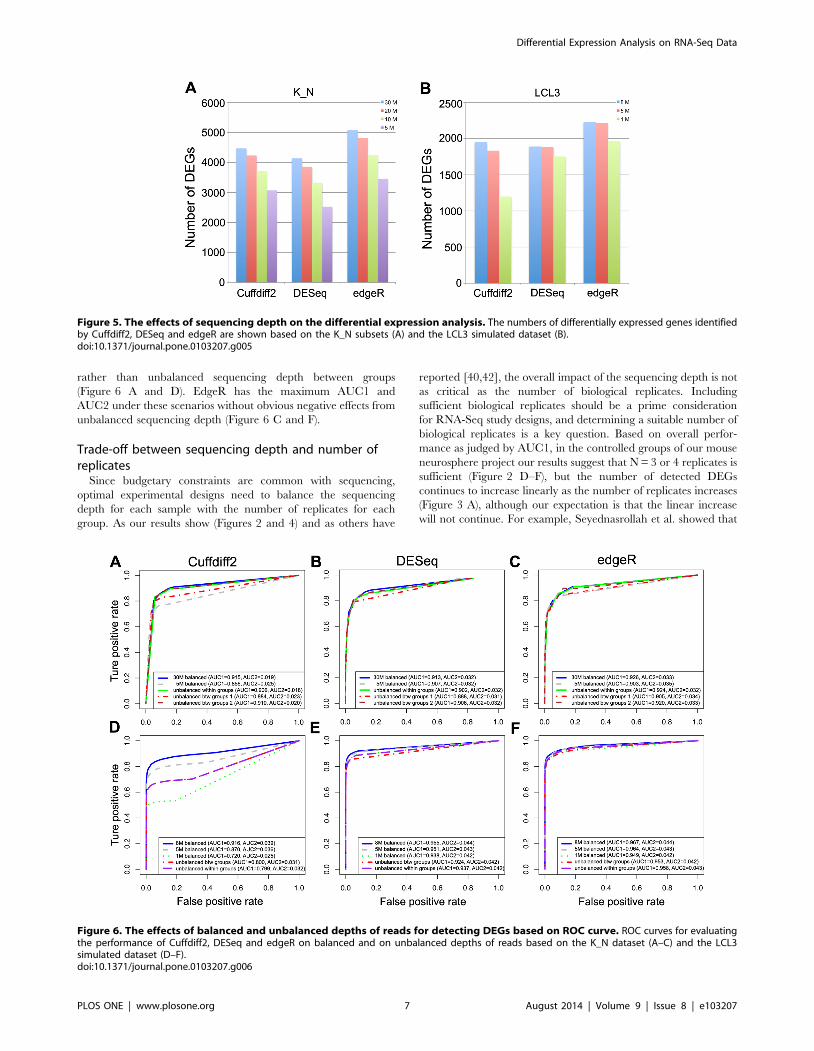
rather than unbalanced sequencing depth between groups
(Figure 6 A and D). EdgeR has the maximum AUC1 and
AUC2 under these scenarios without obvious negative effects from
unbalanced sequencing depth (Figure 6 C and F).
Trade-off between sequencing depth and number ofreplicates
Since budgetary constraints are common with sequencing,
optimal experimental designs need to balance the sequencing
depth for each sample with the number of replicates for each
group. As our results show (Figures 2 and 4) and as others have
reported [40,42], the overall impact of the sequencing depth is not
as critical as the number of biological replicates. Including
sufficient biological replicates should be a prime consideration
for RNA-Seq study designs, and determining a suitable number of
biological replicates is a key question. Based on overall perfor-
mance as judged by AUC1, in the controlled groups of our mouse
neurosphere project our results suggest that N = 3 or 4 replicates is
sufficient (Figure 2 D–F), but the number of detected DEGs
continues to increase linearly as the number of replicates increases
(Figure 3 A), although our expectation is that the linear increase
will not continue. For example, Seyednasrollah et al. showed that
Figure 5. The effects of sequencing depth on the differential expression analysis. The numbers of differentially expressed genes identifiedby Cuffdiff2, DESeq and edgeR are shown based on the K_N subsets (A) and the LCL3 simulated dataset (B).doi:10.1371/journal.pone.0103207.g005
Figure 6. The effects of balanced and unbalanced depths of reads for detecting DEGs based on ROC curve. ROC curves for evaluatingthe performance of Cuffdiff2, DESeq and edgeR on balanced and on unbalanced depths of reads based on the K_N dataset (A–C) and the LCL3simulated dataset (D–F).doi:10.1371/journal.pone.0103207.g006
Differential Expression Analysis on RNA-Seq Data
PLOS ONE | www.plosone.org 7 August 2014 | Volume 9 | Issue 8 | e103207
the number of DEGs plateaus at 4–6 replicates (samples from
inbred mice) using tools such as DESeq, edgeR, baySeq, limma,
etc. [39]; their study may be similar to our K_N dataset. In
contrast, we find in the LCL data derived from unrelated Yoruban
individuals that although the number of detected DEGs changes
little after N = 4 replicates (Figure 3 B), the overall performance
continues to increase (as judged by AUC1 in all three tools,
Figure 2 G–I) as the number of biological replicates increases,
presumably reflecting increasing accuracy of the detection of
DEGs. This indicates the importance of biological replicates to
uncover real biological differences when random biological
variation within groups is relatively large. Under a fixed budget,
the cost of generating biological replicates must be factored into
the experimental design, and on balance, we advise maximizing of
the number of biological replicates within these constraints.
Our results suggest that more biological replicates are required
to identify DEGs using RNA-Seq when studying human cell lines
from unrelated individuals in the same ethnic group than
equivalent studies based on neurosphere cells from inbred mice.
This suggests that the amount of biological variation in the
samples to be sequenced should be a major consideration when
determining the optimal number of biological replicates required
for a given RNA-Seq study. It is likely that more biological
replicates will be required in animal/human tissue samples
compared to human cell lines or cells from inbred lab strain
models. However, more gold standard datasets for benchmarking
and more comprehensive evaluations based on these datasets are
required to guide future RNA-Seq study designs in terms of the
optimal number of biological replicates relative to the amount of
biological variation in the samples.
The performance of three toolsFor all three datasets, we find that edgeR performs slightly
better than the other two tools as judged by the two AUC statistics
(Figure 7 A–C). A recent update of the Cufflinks software package
(version 2.1) introduced a new testing method into the Cuffdiff2
program that aimed to substantially improve performance over
previous releases. For comparison we also evaluated the pre-
update version of the Cuffdiff2 program (v2.0.2). We find that the
versions do perform differently under our test scenarios both in
terms of the AUC statistics (Figure 7 A–C) and the number of
identified DEGs (Figure S1 in Supporting Information S1).
Surprisingly, we noticed that the performance of Cuffdiff2
(v2.0.2) was inversely correlated with the number of biological
replicates in our LCL dataset when the number increased from 3
to 14, and the best performance as judged by AUC1 and AUC2
was achieved when there are 3 to 5 biological replicates (Figure S2
in Supporting Information S1). The overall performance of
Cuffdiff2 for differential expression analysis at gene level resolution
is not as good as that of the two count based tools evaluated in this
study, as judged by both AUC1 and AUC2 (Figure 4 and Figure 7
A–C). One qualification is that Cuffdiff2 achieves similar
performance compared with DESeq when there is sufficient
sequencing depth (i.e. $20 million reads) for each individual
sample (Figure 4 A and B). A possible explanation is that Cuffdiff2
transforms the alignment results to FPKM (Fragments Per
Kilobase of gene model per Million fragments mapped) values
rather than to raw count values. It then performs statistical tests
based on the beta negative binomial model, under the assumption
that this reflects the underlying distribution of the FPKM.
However, FPKM, or its counterpart RPKM (Reads Per Kilobase
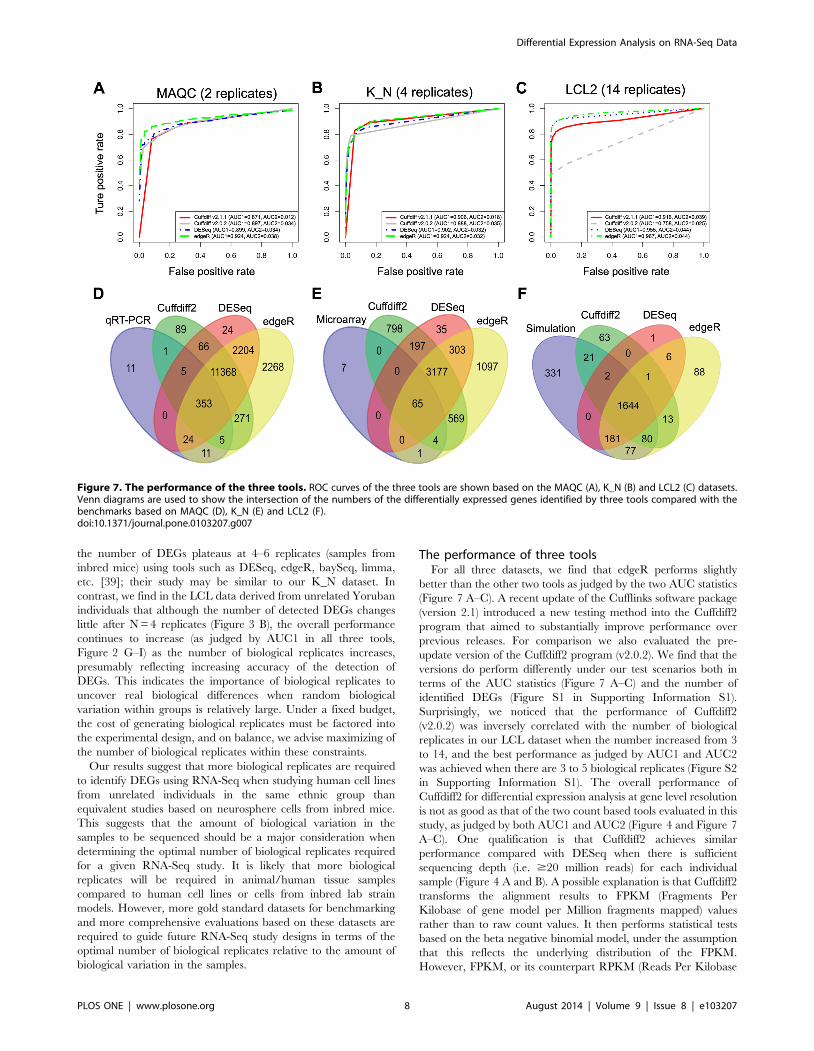
Figure 7. The performance of the three tools. ROC curves of the three tools are shown based on the MAQC (A), K_N (B) and LCL2 (C) datasets.Venn diagrams are used to show the intersection of the numbers of the differentially expressed genes identified by three tools compared with thebenchmarks based on MAQC (D), K_N (E) and LCL2 (F).doi:10.1371/journal.pone.0103207.g007
Differential Expression Analysis on RNA-Seq Data
PLOS ONE | www.plosone.org 8 August 2014 | Volume 9 | Issue 8 | e103207
of gene model per Million reads mapped) when a single-end
sequencing strategy is applied, may not be an appropriate way to
normalize RNA-Seq data, as discussed in many studies [43,44].
For example, FPKM normalization has been shown to reduce
sample variability when compared with raw counts, with the
resulting bell-shaped curve slightly skewed towards negative values
rather than centered over a zero value [44]. A more recent study
also indicated that transcript length normalization may not be a
good strategy and may cause conservative bias in Cuffdiff2 [45].
In this study, although most of the DEGs identified by each of
three tools overlapped, edgeR always detected more DEGs than
the other tools, with a number of DEGs identified exclusively by
edgeR (Figure 7 D–E). However, identification of more DEGs is
not always a good thing, since it may introduce more false positives
that make the experimental validation difficult. As an example
shown in the comparison between DEGs identified by edgeR and
true DEGs generated by simulation, edgeR introduced the most
(108) false positives compared with Cuffdiff2 (77) and DESeq (8)
(Figure 7 F). Using the LCL1 dataset, where we expect no
differentially expressed genes between groups, we found all three
tools performed well with reasonably small false positive rates.
DESeq achieved the best performance in this scenario with the
least number of false positives when there were biological
replicates available (Table S5 in Supporting Information S1).
It is interesting to note that, although both DESeq and edgeR
are negative binomial distribution model-based algorithms using
the same count matrices as input, many genes with high fold
change were picked up by edgeR but not by DESeq (Figure S3 in
Supporting Information S1). When we looked into these particular
DEGs, we observed that these DEGs were either lowly expressed
(small raw read count values) or highly variable amongst biological
replicates (i.e. high variance within groups) (File S2 in Supporting
Information S1), indicating that DESeq is more conservative than
edgeR in identifying DEGs under these conditions. This is in line
with findings from previous studies [28,29] which found that
DESeq is more conservative than other evaluated count based
tools. We also observed that DEGs exclusively identified by either
DESeq or edgeR showed a broader range of fold change than that
of Cuffdiff2-exclusive DEGs (Figure S3 in Supporting Information
S1). Since Cuffdiff2 is optimally designed to detect differential
expression at the transcript level based on different underlying
models and assumptions compared to DESeq and edgeR, it is not
surprising that there are differences in the statistical significance
testing for the identification of DEGs.
LimitationsOur study has several limitations that may constrain general-
ization of results. Firstly, we considered only three experimental
designs, one with two technical replicates, one with four biological
replicates, and one from simulation based on real RNA-Seq data
with 20 biological replicates. Comparisons may need to be made
over a broader range of scenarios to draw general conclusions.
Secondly, to determine true and false positive rates of the tools we
had to benchmark against a ‘‘gold standard’’ for real RNA-Seq
data. Here the DEGs from the benchmarked data sets were
obtained from qRT-PCR or microarray analyses. However, false
positives may exist in these lists. For the mouse neurosphere
project only 77 genes were selected as a positive set from the
microarray results, which may mislead the interpretation when
compared with RNA-Seq results. Considering this, we attempted
to overcome these limitations by also using simulated data sets in
which DEGs were known. Thirdly, in the mouse neurosphere
project two of the three biological replicates in the microarray
experiment were in common with the RNA-Seq analysis. A
cleaner interpretation would be achieved by the benchmarked set
being either fully the same or fully different. Fourthly, there are
several other count matrices based tools available for the
differential expression analysis, such as NBPSeq [46], baySeq
[47], SAMSeq [48] and ShrinkSeq [49], among others, but a
thorough comparison of all these tools is beyond the scope of the
present study. Despite these limitations, data sets that allow
benchmarking in this way are relatively rare and so we draw the
best conclusions within these constraints.
Conclusions
In this study, we conducted a comprehensive investigation to
evaluate the performance of three of the most widely used software
tools (Cuffdiff2, DESeq and edgeR) for differential expression
analysis of RNA-Seq data while considering a number of
important parameters of RNA-Seq experiments, including num-
ber of replicates, sequencing depth, and the unbalanced data
within or between groups. By using the results from qRT-PCR
and microarrays as benchmarks, we observed that edgeR performs
better than DESeq and Cuffdiff2 in terms of the ability to uncover
true positives with the default FDR setting (FDR,0.05). However,
this reflects that edgeR could always detect more DEGs than the
other two tools (e.g. For the K_N dataset, 8% and 38% more than
Cuffdiff2 and DESeq respectively), which may also introduce more
false positives. All three tools perform much better when there are
biological or technical replicates available. Consistent with
previous studies it suggests that biological replicates are a key
factor for differential expression analysis in RNA-Seq datasets
[50]. The optimal number of biological replicates is strongly
dependent on variability between biological replicates. In exper-
iments designed with no replicates, edgeR is recommended but the
value of BCV should be carefully set based on pilot data.
Our results show that Cuffdiff2 is most sensitive and DESeq is
least sensitive to sequencing depth, but the overall impact of
sequencing depth is not as critical as the number of biological
replicates, which is in agreement with previous studies [40,42]. As
our results indicate, the recommended sequencing depth for
mouse RNA-Seq is around 20 M for each sample if Cuffdiff2 is to
be used. When resources are limited, for the same number of total
reads, an increased number of biological replicates each with
reduced read depth is recommended over fewer replicates more
deeply sequenced. In addition, DESeq is more sensitive to
unbalanced sequencing depth between groups than the other
methods. EdgeR has the best performance as judged by two AUC
statistics without obvious negative effects under unbalanced
sequencing depth.
No single method is clearly superior for differential expression
analysis, since each has particular strengths that may be suitable
for specific RNA-Seq datasets. Considering the overall perfor-
mance based on three independent datasets in this study, Cuffdiff2
is not recommended for differential expression analysis at gene-
level resolution, particularly if sequencing depth is low (i.e. ,10
million reads per individual sample). DESeq or the intersection of
DEGs from two or more tools is recommended if the number of
false positives is a major concern in the study. DESeq is not
recommended if sequencing depth is unbalanced between groups,
although down-sampling of the libraries to a common size before
processing with DESeq may ameliorate this problem - an
approach used by NBPSeq [46]. Since titration of Illumina
RNA-Seq libraries is difficult and multiplexing of samples is
common (e.g. typically 3–12 libraries per HiSeq2000 lane), it is
largely expected to have unbalanced library sizes or low
sequencing depth for some samples. EdgeR can tolerate both of
Differential Expression Analysis on RNA-Seq Data
PLOS ONE | www.plosone.org 9 August 2014 | Volume 9 | Issue 8 | e103207
these factors and thus is slightly preferable for differential
expression analysis at the expense of potentially introducing more
false positives.
Supporting Information
Supporting Information S1 Figure S1, Venn diagram showing
the number of differentially expressed genes identified by two
versions of Cuffdiff2. Figure S2, The effects of biological replicates
on the differential expression analysis for Cuffdiff v2.0.2. Figure
S3, The detected fold changes of all the differentially expressed
genes identified by three tools were compared and shown,
including DESeq vs. edgeR (top panel), DESeq vs. Cuffdiff2
(middle panel) and edgeR vs. Cuffdiff2 (bottom panel). File S1,
Analysis pipelines, methods and examples of commands for
differential expression analysis, subsampling fastq files and
generating SAM/BAM files based on simulated count values. File
S2, The raw count values for genes with high fold changes were
picked up by edgeR but not by DESeq. Genes with high fold
changes (the absolute value of log2 fold changes larger than 2)
identified as DEGs by edgeR but not by DESeq are listed in the
file. The gene ID, the log2 fold changes (logFC) and FDR from
DESeq, the logFC and FDR from edgeR, the raw count values for
the four replicates of sample K (K1–K4) and sample N (N1–N4)
are shown in each of the columns. Table S1, Numbers of reads for
the human hbr and uhr samples from the MAQC dataset. Table
S2, Numbers of reads for the mouse neurosphere samples for
treatment groups of K and N (the K_N dataset). Table S3, The
number of reads for each individual sample of the LCL3 dataset.
Table S4, The definition for TP, FP, TN, FN, TPR and FPR.
Table S5, The false positive rate for Cuffdiff2, DESeq and edgeR
based on the LCL1 dataset.
(ZIP)
Acknowledgments
The authors would like to thank QBI-IT for their assistance on
computation support, Dr. Marie-Jo Brion and Dr. Jacob Gratten for
discussions and critical reading of the manuscript, and the reviewers for
their valuable comments and suggestions to improve the quality of the
paper.
Author Contributions
Conceived and designed the experiments: QYZ PFB NRW. Performed the
experiments: DJJ VMM JE RKN GJR. Analyzed the data: ZHZ QYZ.
Wrote the paper: ZHZ QYZ. Did some preliminary work for this study:
DB AEL.
References
1. Grabherr MG, Haas BJ, Yassour M, Levin JZ, Thompson DA, et al. (2011) Full-
length transcriptome assembly from RNA-Seq data without a reference genome.
Nat Biotechnol 29: 644–652.
2. Robertson G, Schein J, Chiu R, Corbett R, Field M, et al. (2010) De novo
assembly and analysis of RNA-seq data. Nat Methods 7: 909–912.
3. Schulz MH, Zerbino DR, Vingron M, Birney E (2012) Oases: robust de novoRNA-seq assembly across the dynamic range of expression levels. Bioinformatics
28: 1086–1092.
4. Zhao QY, Wang Y, Kong YM, Luo D, Li X, et al. (2011) Optimizing de novo
transcriptome assembly from short-read RNA-Seq data: a comparative study.
BMC Bioinformatics 12 Suppl 14: S2.
5. Oshlack A, Robinson MD, Young MD (2010) From RNA-seq reads to
differential expression results. Genome Biol 11: 220.
6. Anders S, Huber W (2010) Differential expression analysis for sequence countdata. Genome Biol 11: R106.
7. Robinson MD, Oshlack A (2010) A scaling normalization method for differential
expression analysis of RNA-seq data. Genome Biol 11: R25.
8. Trapnell C, Williams BA, Pertea G, Mortazavi A, Kwan G, et al. (2010)
Transcript assembly and quantification by RNA-Seq reveals unannotated
transcripts and isoform switching during cell differentiation. Nat Biotechnol 28:
511–515.
9. Li B, Dewey CN (2011) RSEM: accurate transcript quantification from RNA-
Seq data with or without a reference genome. BMC Bioinformatics 12: 323.
10. Anders S, Reyes A, Huber W (2012) Detecting differential usage of exons from
RNA-seq data. Genome Res 22: 2008–2017.
11. Pan Q, Shai O, Lee LJ, Frey BJ, Blencowe BJ (2008) Deep surveying of
alternative splicing complexity in the human transcriptome by high-throughput
sequencing. Nat Genet 40: 1413–1415.
12. Wang ET, Sandberg R, Luo S, Khrebtukova I, Zhang L, et al. (2008)Alternative isoform regulation in human tissue transcriptomes. Nature 456: 470–
476.
13. Wang Z, Gerstein M, Snyder M (2009) RNA-Seq: a revolutionary tool for
transcriptomics. Nat Rev Genet 10: 57–63.
14. Morin R, Bainbridge M, Fejes A, Hirst M, Krzywinski M, et al. (2008) Profiling
the HeLa S3 transcriptome using randomly primed cDNA and massively
parallel short-read sequencing. Biotechniques 45: 81–94.
15. Marioni JC, Mason CE, Mane SM, Stephens M, Gilad Y (2008) RNA-seq: anassessment of technical reproducibility and comparison with gene expression
arrays. Genome Res 18: 1509–1517.
16. Hansen KD, Brenner SE, Dudoit S (2010) Biases in Illumina transcriptome
sequencing caused by random hexamer priming. Nucleic Acids Res 38: e131.
17. McIntyre LM, Lopiano KK, Morse AM, Amin V, Oberg AL, et al. (2011) RNA-
seq: technical variability and sampling. BMC Genomics 12: 293.
18. Trapnell C, Hendrickson DG, Sauvageau M, Goff L, Rinn JL, et al. (2013)Differential analysis of gene regulation at transcript resolution with RNA-seq.
Nat Biotechnol 31: 46–53.
19. Bullard JH, Purdom E, Hansen KD, Dudoit S (2010) Evaluation of statistical
methods for normalization and differential expression in mRNA-Seq experi-ments. BMC Bioinformatics 11: 94.
20. Nagalakshmi U, Wang Z, Waern K, Shou C, Raha D, et al. (2008) The
transcriptional landscape of the yeast genome defined by RNA sequencing.
Science 320: 1344–1349.
21. Robinson MD, Smyth GK (2007) Moderated statistical tests for assessing
differences in tag abundance. Bioinformatics 23: 2881–2887.
22. Robinson MD, McCarthy DJ, Smyth GK (2010) edgeR: a Bioconductor
package for differential expression analysis of digital gene expression data.
Bioinformatics 26: 139–140.
23. Trapnell C, Roberts A, Goff L, Pertea G, Kim D, et al. (2012) Differential gene
and transcript expression analysis of RNA-seq experiments with TopHat and
Cufflinks. Nat Protoc 7: 562–578.
24. McGettigan PA (2013) Transcriptomics in the RNA-seq era. Curr Opin Chem
Biol 17: 4–11.
25. Dasgupta N, Xu YH, Oh S, Sun Y, Jia L, et al. (2013) Gaucher disease:
transcriptome analyses using microarray or mRNA sequencing in a Gba1
mutant mouse model treated with velaglucerase alfa or imiglucerase. PLoS One
8: e74912.
26. Kissopoulou A, Jonasson J, Lindahl TL, Osman A (2013) Next Generation
Sequencing Analysis of Human Platelet PolyA+ mRNAs and rRNA-Depleted
Total RNA. PLoS One 8: e81809.
27. Merrick BA, Phadke DP, Auerbach SS, Mav D, Stiegelmeyer SM, et al. (2013)
RNA-Seq profiling reveals novel hepatic gene expression pattern in aflatoxin B1
treated rats. PLoS One 8: e61768.
28. Soneson C, Delorenzi M (2013) A comparison of methods for differential
expression analysis of RNA-seq data. BMC Bioinformatics 14: 91.
29. Kvam VM, Liu P, Si Y (2012) A comparison of statistical methods for detecting
differentially expressed genes from RNA-seq data. Am J Bot 99: 248–256.
30. Robles JA, Qureshi SE, Stephen SJ, Wilson SR, Burden CJ, et al. (2012)
Efficient experimental design and analysis strategies for the detection of
differential expression using RNA-Sequencing. BMC Genomics 13: 484.
31. Shi L, Reid LH, Jones WD, Shippy R, Warrington JA, et al. (2006) The
MicroArray Quality Control (MAQC) project shows inter- and intraplatform
reproducibility of gene expression measurements. Nat Biotechnol 24: 1151–
1161.
32. Wan L, Sun F (2012) CEDER: accurate detection of differentially expressed
genes by combining significance of exons using RNA-Seq. IEEE/ACM Trans
Comput Biol Bioinform 9: 1281–1292.
33. Nacu S, Yuan W, Kan Z, Bhatt D, Rivers CS, et al. (2011) Deep RNA
sequencing analysis of readthrough gene fusions in human prostate adenocar-
cinoma and reference samples. BMC Med Genomics 4: 11.
34. Jhaveri DJ, Mackay EW, Hamlin AS, Marathe SV, Nandam LS, et al. (2010)
Norepinephrine directly activates adult hippocampal precursors via beta3-
adrenergic receptors. J Neurosci 30: 2795–2806.
35. Pickrell JK, Marioni JC, Pai AA, Degner JF, Engelhardt BE, et al. (2010)
Understanding mechanisms underlying human gene expression variation with
RNA sequencing. Nature 464: 768–772.
36. Li H, Handsaker B, Wysoker A, Fennell T, Ruan J, et al. (2009) The Sequence
Alignment/Map format and SAMtools. Bioinformatics 25: 2078–2079.
Differential Expression Analysis on RNA-Seq Data
PLOS ONE | www.plosone.org 10 August 2014 | Volume 9 | Issue 8 | e103207
37. Narayanan RK, Mangelsdorf M, Panwar A, Butler TJ, Noakes PG, et al. (2013)
Identification of RNA bound to the TDP-43 ribonucleoprotein complex in the
adult mouse brain. Amyotroph Lateral Scler Frontotemporal Degener 14: 252–
260.
38. Trapnell C, Pachter L, Salzberg SL (2009) TopHat: discovering splice junctions
with RNA-Seq. Bioinformatics 25: 1105–1111.
39. Seyednasrollah F, Laiho A, Elo LL (2013) Comparison of software packages for
detecting differential expression in RNA-seq studies. Brief Bioinform.
40. Liu Y, Zhou J, White KP (2014) RNA-seq differential expression studies: more
sequence or more replication? Bioinformatics 30: 301–304.
41. Tarazona S, Garcia-Alcalde F, Dopazo J, Ferrer A, Conesa A (2011) Differential
expression in RNA-seq: a matter of depth. Genome Res 21: 2213–2223.
42. Rapaport F, Khanin R, Liang Y, Pirun M, Krek A, et al. (2013) Comprehensive
evaluation of differential gene expression analysis methods for RNA-seq data.
Genome Biol 14: R95.
43. Li J, Witten DM, Johnstone IM, Tibshirani R (2012) Normalization, testing, and
false discovery rate estimation for RNA-sequencing data. Biostatistics 13: 523–
538.
44. Giorgi FM, Del Fabbro C, Licausi F (2013) Comparative study of RNA-seq- and
microarray-derived coexpression networks in Arabidopsis thaliana. Bioinfor-matics 29: 717–724.
45. Frazee AC, Pertea G, Jaffe AE, Langmead B, Salzberg SL, et al. (2014) Flexible
isoform-level differential expression analysis with Ballgown. bioRxiv doi:10.1101/003665
46. Di YM, Schafer DW, Cumbie JS, Chang JH (2011) The NBP Negative BinomialModel for Assessing Differential Gene Expression from RNA-Seq. Statistical
Applications in Genetics and Molecular Biology 10.
47. Hardcastle TJ, Kelly KA (2010) baySeq: empirical Bayesian methods foridentifying differential expression in sequence count data. BMC Bioinformatics
11: 422.48. Li J, Tibshirani R (2013) Finding consistent patterns: a nonparametric approach
for identifying differential expression in RNA-Seq data. Stat Methods Med Res22: 519–536.
49. Van De Wiel MA, Leday GG, Pardo L, Rue H, Van Der Vaart AW, et al.
(2013) Bayesian analysis of RNA sequencing data by estimating multipleshrinkage priors. Biostatistics 14: 113–128.
50. Fang Z, Cui X (2011) Design and validation issues in RNA-seq experiments.Brief Bioinform 12: 280–287.
Differential Expression Analysis on RNA-Seq Data
PLOS ONE | www.plosone.org 11 August 2014 | Volume 9 | Issue 8 | e103207
Copyright © 2022 FDOKUMEN

