


Bahasa
Halaman
Hukum

Journal Name
ARTICLE
This journal is © The Royal Society of Chemistry 20xx J. Name., 2013, 00, 1-3 | 1
Please do not adjust margins
Please do not adjust margins
a. School of Chemistry and Trinity Biomedical Sciences Institute (TBSI), Trinity
College Dublin, The University of Dublin, Dublin 2, Ireland. E-mail:
[email protected], [email protected]; Web:
http://thorrigunnlaugsson.wordpress.com,
http://chemistry.tcd.ie/staff/academic/SCANLAE b. School of Chemical and Physical Sciences, Keele University, Keele ST5 5BG, UK. c.
School of Biochemistry and Immunology and Trinity Biomedical Sciences Institute
(TBSI), Trinity College Dublin, The University of Dublin, Dublin 2, Ireland
† Footnotes rela)ng to the )tle and/or authors should appear here. Electronic Supplementary Information (ESI) available: [details of any supplementary information available should be included here]. See DOI: 10.1039/x0xx00000x. CCDC 1866499
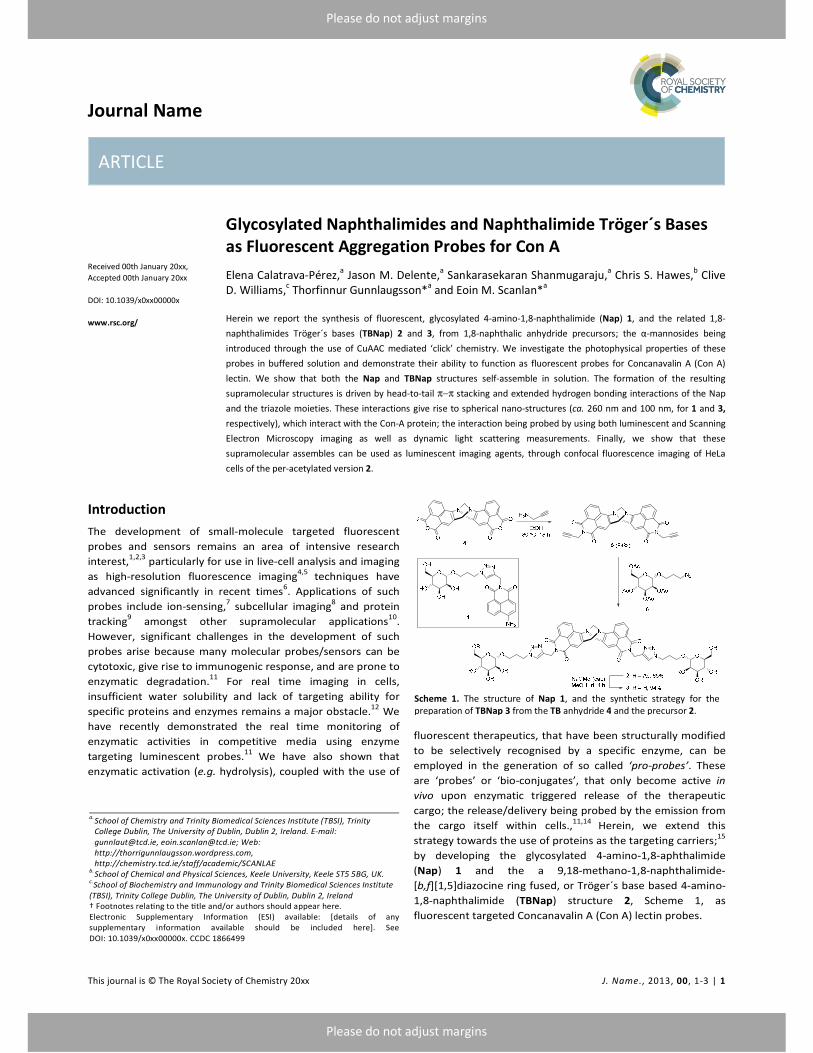
Scheme 1. The structure of Nap 1, and the synthetic strategy for the preparation of TBNap 3 from the TB anhydride 4 and the precursor 2.
Received 00th January 20xx,
Accepted 00th January 20xx
DOI: 10.1039/x0xx00000x
www.rsc.org/
Glycosylated Naphthalimides and Naphthalimide Tröger´s Bases
as Fluorescent Aggregation Probes for Con A
Elena Calatrava-Pérez,a Jason M. Delente,a Sankarasekaran Shanmugaraju,a Chris S. Hawes,b Clive D. Williams,c Thorfinnur Gunnlaugsson*a and Eoin M. Scanlan*a
Herein we report the synthesis of fluorescent, glycosylated 4-amino-1,8-naphthalimide (Nap) 1, and the related 1,8-
naphthalimides Tröger´s bases (TBNap) 2 and 3, from 1,8-naphthalic anhydride precursors; the α-mannosides being
introduced through the use of CuAAC mediated ‘click’ chemistry. We investigate the photophysical properties of these
probes in buffered solution and demonstrate their ability to function as fluorescent probes for Concanavalin A (Con A)
lectin. We show that both the Nap and TBNap structures self-assemble in solution. The formation of the resulting
supramolecular structures is driven by head-to-tail π−π stacking and extended hydrogen bonding interactions of the Nap
and the triazole moieties. These interactions give rise to spherical nano-structures (ca. 260 nm and 100 nm, for 1 and 3,
respectively), which interact with the Con-A protein; the interaction being probed by using both luminescent and Scanning
Electron Microscopy imaging as well as dynamic light scattering measurements. Finally, we show that these
supramolecular assembles can be used as luminescent imaging agents, through confocal fluorescence imaging of HeLa
cells of the per-acetylated version 2.
Introduction
The development of small-molecule targeted fluorescent
probes and sensors remains an area of intensive research
interest,1,2,3 particularly for use in live-cell analysis and imaging
as high-resolution fluorescence imaging4,5 techniques have
advanced significantly in recent times6. Applications of such
probes include ion-sensing,7 subcellular imaging8 and protein
tracking9 amongst other supramolecular applications10.
However, significant challenges in the development of such
probes arise because many molecular probes/sensors can be
cytotoxic, give rise to immunogenic response, and are prone to
enzymatic degradation.11 For real time imaging in cells,
insufficient water solubility and lack of targeting ability for
specific proteins and enzymes remains a major obstacle.12 We
have recently demonstrated the real time monitoring of
enzymatic activities in competitive media using enzyme
targeting luminescent probes.11 We have also shown that
enzymatic activation (e.g. hydrolysis), coupled with the use of
fluorescent therapeutics, that have been structurally modified
to be selectively recognised by a specific enzyme, can be
employed in the generation of so called ‘pro-probes’. These
are ‘probes’ or ‘bio-conjugates’, that only become active in
vivo upon enzymatic triggered release of the therapeutic
cargo; the release/delivery being probed by the emission from
the cargo itself within cells.,11,14 Herein, we extend this
strategy towards the use of proteins as the targeting carriers;15
by developing the glycosylated 4-amino-1,8-aphthalimide
(Nap) 1 and the a 9,18-methano-1,8-naphthalimide-
[b,f][1,5]diazocine ring fused, or Tröger´s base based 4-amino-
1,8-naphthalimide (TBNap) structure 2, Scheme 1, as
fluorescent targeted Concanavalin A (Con A) lectin probes.

ARTICLE Journal Name
2 | J. Name., 2012, 00, 1-3 This journal is © The Royal Society of Chemistry 20xx
Please do not adjust margins
Please do not adjust margins
Lectins are proteins which specifically recognise and bind to
carbohydrates.16 Lectins are involved in a wide range of
biological processes; including regulation of cell adhesion,
modulation of protein levels in blood, immune and
inflammatory processes, glycoprotein synthesis and the
promotion of cell-cell interactions.17 Lectins have important
therapeutic applications in cancer treatment, and are
biomarkers for disease and autophagy inducers.18,19 It is thus
not surprising that lectin recognition is a topical area of
research within supramolecular and medicinal chemistry.17
Con A is a lectin protein belonging to the legume-type family
that preferably binds to α-linked mannosides, but it is also able
to bind α-glucosides. With this in mind we designed probe 1,
which consists of a single α-mannoside unit covalently linked
to a Nap, Scheme 1. Above pH 7, Con A is presented as a
tetramer; where each subunit is separated ca. 72 Å apart.20
However, at mildly acidic pH, e.g. 4.5-5.5, Con A adopts a di-
meric structure. Each monomer contains two metal binding
sites for Ca2+ and Mn2+ ions, which need to be occupied for the
sugar binding to take place.21 In addition to the Nap derivative,
we developed a divalent system by synthesising the bis α-
mannoside TBNap derivative 2, Scheme 1., in order to directly
compare the interactions of the mono- vs. a divalent probe
with ConA. In this article, we present the results from our
investigation in the use of 1 and 2 as fluorescent aggregation
probes for lectins in solution and compatibility in vitro with
human cervical cancer cells.
Results and discussion
Design of Nap and TBNap based Lectin probes
Using CuAAC chemistry, the Nap and TBNap probes 1 and 2,
were synthesised as Con A targeted lectin probes; both being
synthesised from their corresponding 1,8-naphthalic anhydride
structures. Naps are well documented fluorophores,
possessing internal charge transfer excited state (ICT), that
have been extensively used in the development of florescent
sensor for ions and molecules, and in medicinal chemistry.22,23
In contrast to these, the TBNaps, are bi-naphthalimide
systems, that we have recently developed the application of in
significant detail; including their application as anticancer
drugs, cellular imaging agents and in MOFs and coordination
compounds and polymers, etc.24,25
Like Naps, TBNaps, also possess ICT excited state characters,
though to lesser extent. Due to the methano-1,5-diazocine ring
(N–CH2–N), the two naphthalimide components of the TBNaps
units are almost orthogonal to each other, with dihedral angles
ranging from 90 to 104°; thus making the TBNaps a highly
desirable recognition motive for biomolecules. 24,25 With this in
mind, both the Naps and the TBNaps were fully characterised
using a range of photophysical techniques, their photophysical
as well as their bioavailability properties were investigated.
Synthesis and photophysical analysis of 1-3
Mannosyl-naphthalimide conjugate 1 was prepared according
to the reported literature procedures. 4-Nitro-1,8-napthalic
anhydride and propargylamine, were first reacted together,
followed by conjugation to the per-O-acylated mannoside
derivative 6 using CuAAC mediated click chemistry under
microwave assisted conditions. A reduction of this
intermediate, to give the 4-amino analogue, using Pd/C and H2
at 2 atm., followed by deprotection of the mannose unit, gave
1 in good yield.11,26 The structure was fully characterised as
shown in ESI.
Fig. 1. Normalised absorption and emission spectra for 1 (black solid and black
dotted) and 3 (red solid and red dotted).

Journal Name ARTICLE
This journal is © The Royal Society of Chemistry 20xx J. Name., 2013, 00, 1-3 | 3
Please do not adjust margins
Please do not adjust margins
Fig. 2 Changes in the fluorescence emission of a) 1 and b) 3 in DPBS at room temperature upon changing the concentrations of these two structures between
1×10⁻⁶
to 1×10⁻⁴
M. Inset: The changes in the emission intensity at λ max as a function of increasing concentration of 1 and 3, respectively.
a)
b)
We have developed many examples TBNaps whereby imide
end functionalised 3- or the 4-amino-1,8-naphthalimides are
reacted with formaldehyde under acidic conditions. This
normally results in the formation of the desired TBNaps.
Unfortunately, this strategy did not work in this case, and the
desired compound 3 was difficult to isolate in high purity or
yield. Consequently, we moved towards synthesising 3 using
an alternative route, based on the use of the TB anhydride 4,
Scheme 1, which was recently developed in our laboratory,
and structurally fully charatesised.27 The anhydride, can be
formed in a signal step via nucleophilic substitution reaction
from a single common ‘synthon’, a 5-dimethyl-isophthalate
based TBNap (bis-[N-(5-dimethyl-isophthalate)]-9,18-
methano-1,8-naphthalimide [b,f][1,5]diazocine), upon
treatment with aqueous KOH. The anhydride was reacted with
propargylamine in refluxing ethanol to furnish the dialkyne
compound 5 in 94% yield. Compound 5 was then reacted
under CuAAC conditions in the presence of per-O-acylated
mannoside derivative 6, displaying an alkylazide group at the
anomeric position to furnish the protected product 2 in 65%
yield. Treatment of 2 under Zemplén conditions furnished the
desired product 3 in 98% yield. Both compounds 2 and 3 were
characterised (c.f. Experimental and ESI) using conventional
methods, including both NMR and HRMS. The 1H NMR of 2
(400 MHz, DMSO-d6) indicated that some aggregation or self-
assembly formation occurred in solution, with several broad
resonances assigned to the aromatic protons, while the
protons assigned to the diazocine moiety appeared as well
resolved set of signals between 5.5-5.0 ppm. The HRMS
(MALDI) of 1-3 gave the accurate mass for [M+H]+; which in
the case of 3, was found to be m/z = 1063.38054, for
C51H55N10O16.
Photophysical Characterisation of 1-3
Amino-naphthalimides such as 1 have push-pull based
intramolecular charge transfer (ICT) based photophysical
properties. Their absorption and fluorescence emission spectra
are therefore broad and occur within the UV-Vis and the
visible regions, possessing moderately large Stokes shift, as
shown in Fig. 1. Naps also normally possess reasonable
lifetimes and quantum yields (ΦF). The photophysical
characterisation of both 1 and 3 was carried in phosphate
buffered saline (PBS) solution. Probe 1 displayed an absorption
band centred ca. 430 nm (ε = 12,300 M-1cm-1) characteristic of
the intramolecular charge transfer (ICT) process, and a
fluorescence emission with its maximum at 530 nm upon
excitation at λmax at 433 nm. The ΦF was also measured as
under these conditions as 11% (see ESI for details). The
fluorescence excitation spectrum mirrored that seen in the
absorption spectrum (See ESI). In the case of 3, a broad
absorption band centred at 380 nm (ε = 9,000 M-1cm-1), with a
shoulder ca. 350 nm was observed. The emission spectra of 3
showed a band centred at 510 nm. Therefore, both the
absorption and emission spectra of the 1 are 50 nm blue-
shifted with respect to 3. This blue-shift is due to the
substitution of the 4-amino group, reducing the ICT (the push-
pull) process. In a similar manner, the per-O-acetylated
mannose 2, was also investigated and the UV-Vis absorption
and emission spectra matched that observed for 3.
Self-assembly formation in solution and solid-state analysis of 7
As the Naps are known to take part in ‘head-to-tail’
aggregation through π−π interactions, aggregation studies
were undertaken in solution, where both the absorption and
the fluorescence emission were monitored for 1 and 3.nIt is
also well known that sugars and short carbohydrates can self-
assemble into higher order structures. These studies were
carried out in pH 7.2 DPBS (Dulbecco's phosphate-buffered
saline), by varying the concentrations of these two structures
between 1×10⁻⁶ to 1×10⁻⁴ M. While the absorption spectrum
(See ESI) was not significantly affected, and the Beer-Lambert
plot gave a linear slope, the florescence emission of both
compounds was significantly affected at concentrations
greater than 5×10⁻⁵ M in the case of 3. For both systems, the
emission was quenched at elevated concentrations, Fig. 2.
In the case of 3, no significant changes were observed in the
λ max, but for the TBNap 1, the aggregation seem to be
occurring at slower rate, while being concomitantly causing
blue shift in the λ max. The quenching is characteristic of
naphthalimides π−π stacking interactions, in addition to
hydrogen bonding interactions between the imide and the 4-
amino moieties of stacked Naps ‘dimers’.23c These interactions
giving rise the formation of columns of such stacked

ARTICLE Journal Name
4 | J. Name., 2012, 00, 1-3 This journal is © The Royal Society of Chemistry 20xx
Please do not adjust margins
Please do not adjust margins
Fig. 3 a) Chemical structure of compound 7. (b) The X-ray crystal structure formed in H2O, and the extended π−π interactions, and (c) the two disordered orientations of the naphthalimide and alcohol fragments (minor conformer shown in green).
structures, which are often stabilised by solvent interactions,
such as hydrogen bonding to interstitial water protons. In the
case of 1 and 3, we anticipated that these supramolecular
interactions would be further aided by the mannoside
moieties, which would be expected to take part in the
formation of higher order self-assembly formations, through
extended and multiple intermolecular hydrogen bonding
interactions.
We have in the past characterised such ‘head-to-tail’
interactions both in solution as well as in the solid-state; these
normally showing a clear hydrogen bonding interaction
between the amino group of the Nap moiety.23c However,
attempts to crystallise either 1 or 3 on all occasions did not
result in the formations of crystals suitable for solid state
crystallographic analysis. We were however, able to obtain
crystals of the Nap structure 7, Fig. 3, which is structurally
related to 1, with the exception that the mannoside moiety is
missing. This ‘model’ compound was previously synthesised in
our laboratory by subjecting a glycosylated Nap ‘pro-probe’ to
the glycosidase enzymes β-galactosidase, which rapidly
hydrolysed the glycosidic bond, concomitantly releasing 7 into
cancer cells.11 7, and is a good model of 1, as it allows us gain
inside into the various supramolecular interactions occurring
at the Nap and the triazole moieties.
The structure of 7 is shown in Fig. 3a, as well as the packing
in the solid state in Fig. 3b. As can be seen in Fig. 3b, the Naps
display π−π stacking interactions, being arranged with a near-
120° rotation between the major axes of each successive Nap.
This orientation is different to what we have observed before,
where a true head-to-tail orientation is typically observed.
These interactions give rise to stacked columns; the chains are
bent to shroud the exterior of the columns and engage in
hydrogen bonding interactions with neighbouring groups.
There are three types of hydrogen bond donor in the
compound: the amine and alcohol groups and the triazole C-H
group. The alcohol and imide oxygen atoms and one triazole
nitrogen atom act as hydrogen bond acceptors. The Nap
molecules interact further with a molecule of water, shared
between four Nap molecules, forming hydrogen-bonding
interactions with the terminal alcohol. One could envisage that
such interactions could be potentially greater for 1 and 3,
given the number of additional hydrogen bonding
acceptors/donors available. As the more directional
interactions take place at the peripheries of the molecule,
substantial crystallographic disorder is observed on the core
atoms. This is related to the tendency of the central Naps to
orient across two positions related by rotation (Fig. 3c), with a
distribution 2:1 or 1:1 for the two unique residues. It is clear
from these results that the Nap structures can partake in self-
assembly processes, that could result in the formation of
higher-order materials, and that this could potentially affect
their biological applications. As 1 and 3 were developed as
fluorescent probes for Lectin protein, we set out to investigate
both the affinity of this binding interaction, through the use of
fluorescent titrations, as well as how this would affect the
‘material’ nature of 1 and 3 using Scanning Electron
Microscopy (SEM) imaging.
Con A binding studies
In order to investigate if the Nap compounds could function as
molecular probes for lectin proteins, we evaluated the changes
in their luminescent properties upon addition of Con A to
solutions of 1 and 3. Based on our investigation above, we
postulated that following addition of Con A, the carbohydrate-
lectin binding interactions would occur and potentially disrupt
aggregates resulting in significant changes in the fluorescence.
As a qualitative test, 0.1 equivalents of Con A were initially
added to a 1 × 10⁻⁴ M solution of 1 and 3, respectively, Fig. 4a
and b, in pH 7.2 DPBS solution, in the presence of 0.1 mM
MnCl2 and 0.1 mM CaCl2 at 25 °C. In the case of 1, the
fluorescence was enhanced significantly upon the addition of
Con A, highlighting its ability to interact with Con A, and
function as a lectin probe.
In contrast to this, the fluorescence intensity for 3 decreased
at λem = 510 nm but a new shoulder appeared at 450 nm. This
could possibly be due to the presence of the Tröger’s base
moiety, which places the two Naps part almost orthogonal.
We have observed similar effect upon binding Ru(II)
polypyridyl based TBNap upon binding to DNA.25 Similarly, we
analysed the binding of 2 to Con A. However, no changes were
observed in the fluorescence emission, indicating that
acetylated version was unable to bind to the protein in the
same manner as 3 (See ESI). Having established that both
compounds 1 and 3, interacted with Con A, a titration of 1 and
3 (1 × 10⁻⁴ M) with Con A was undertaken (using final
concentrations of Con A between 10-6 and 10-4 M). Here,
significant changes were observed in the emission of 1, which
was enhanced. The changes in the ICT band at 535 nm are
shown in Fig. 4c as a function of emission enhancement (F-F0)
where it is clear that the most significant changes occur at low
concentrations of Con A; the emission showing a linear trend
upon addition of Con A, until 9×10⁻⁵ M, after which a
saturation point is reached. In a similar manner, the changes in
the emission of 3 was monitored. While no significant changes
were observed in the λmax at 510 nm, changes were observed
at 450 nm shoulder, which also demonstrated a linear
enhancement occurred within the same concentration window
as that seen for 1, namely, between 2×10⁻⁶ and 8×10⁻⁵ M of
Con A. The titrations also showed that below 1 µM Con A

Journal Name ARTICLE
This journal is © The Royal Society of Chemistry 20xx J. Name., 2013, 00, 1-3 | 5
Please do not adjust margins
Please do not adjust margins
Fig. 4 Changes in the fluorescence emission intensity of 1 (a and c) and 3 (b and d),
respectively, upon addition of 0.1 Equiv. of Con A and varying concentrations of
Con A. in pH 7.2 DPBS solution, in the presence of 0.1 mM MnCl2 and 0.1 mM CaCl2
at 25°C.
a) b)
c) d)
Fig. 5. Normalised fluorescence Intensity of 1 (blue) and 3 (magenta) in the presence of different biomolecules, in pH 7.2 DPBS solution, in the presence of 0.1 mM MnCl2 and 0.1 mM CaCl2 at 25°C.
concentration, no changes were observed, Fig. 4c and d.
Unfortunately, we were unable to accurately determine the
binding affinity for these interactions.
Binding Selectivity
Encouraged by the positive results obtained with 1, we set out
to investigate the effect of the Con A binding under varying
conditions, and the results are summarised in Fig. 5. As can be
seen in Fig. 5, the addition of Con A (0.1 equivalents) led to a
ca. 70% increase in the fluorescent intensity of 1. The addition
of two-fold excess of α-D-mannose (compare to Con A) did not
affect the emission properties. This could indicate that the
probe was fully bound at this concentration. Similarly, no
further quenching was observed for 3 upon addition of α-D-
mannose at this concentration. In a separate experiment, the
probes were incubated with de-natured Con A (heated at 80 °C
for 30 min), and no relevant changes in the fluorescent
emission were observed, demonstrating that only a specific
binding interaction between Con A and the two probes
induces a change in the luminescence.
To further validate the binding interactions, the probes were
treated with 0.1 equiv. of Bovine Serum Albumin (BSA).
Albumin is a prevalent macromolecular transporter protein
found in the blood stream due to its capacity to bind and carry
small molecules. Significantly, no changes were observed in
the luminescence of 1 and 3 in the presence of BSA,
demonstrating that the fluorescence changes observed are
exclusively due to the selective binding with Con A. Following
this experiment, Con A (0.1 equiv) was added to this mixture
to investigate if the presence of BSA would interfere with
binding seen above. Gratifyingly, the fluorescence changes
followed the same trend as the experiment conducted in the
absence of BSA, highlighting that lectin-carbohydrate binding
remains efficient in the presence of other macromolecules.
This is an important finding in view of these compounds having
application as molecular probes in vitro.
We repeated this experiment using another relevant lectin
Peanut Agglutinin (PNA) which preferably binds to β-Gal-(1-3)-
β-GalNAc units, and identical, non-bonding, behaviour was
observed for both 1 and 3. Therefore the changes in the
luminescence are clearly only due to the selective binding
between the α-mannosides probes and Con A. Finally, as a
negative control, two structurally related Naps, that have
previously developed in our laboratory,11 possessing a β-
galactoside (Gal-Nap) and β-Lactoside (Lac-Nap) moiety
instead of the mannose site employed here, as well as 2, were
treated with Con A (0.1 equiv) under identical conditions as
described above. Importantly, only negligible changes were
observed in the fluorescence intensity of all of these probes
(See ESI) upon addition of Con A. We believe that this
demonstrates that the aggregation of 1 and 3 is significantly
affected upon binding to Con A. As we were unable to
accurately determining the binding constants for the
interaction of 1 and 3 for Con A, we set out to probe if the
nanostructure (e.g. the morphology of self-assembly structure
of 1 and 3) would be affected upon binding to Con A. This
elucidation was carried out by using SEM imaging.
Morphology studies
The self-assembly or aggregation of 1 and 3 was observed
above in solution. To investigate further the material nature of
these assembles, pH 7.2 DPBS solution of 1 and 3 were drop
casted onto silicon wafer, dried in air and imaged using SEM.
The results are shown in Fig. 6 (see also ESI). From this
imaging, it is clear that both 1 and 3 form particles; these being
of ca. 260 nm and 100 nm average size, Fig. 6a and b, for 1 and
3 respectively (it is also possible to see some salt formation,
due to the buffer from which these were casted from). These
images further support out findings above that both the Nap
and the TBNaps form self-assembly structures in solutions. The

ARTICLE Journal Name
6 | J. Name., 2012, 00, 1-3 This journal is © The Royal Society of Chemistry 20xx
Please do not adjust margins
Please do not adjust margins
Fig. 6. SEM images of 1 before (a) and after addition of 0.1 Equiv. of Con A (c) and 3 before (b) and after addition of 0.1 Equiv. of Con A (d), showing significant morphological changes that demonstrate the binding with Con A, after drop-casting from buffered pH 7.2 solutions of these compounds. The formation of salts is also visible in these images.
Fig. 7. Confocal images of HeLa cells treated with compound 1 (50 µM, first row), compound 3 (50 µM, second row) and compound 2 (50 µM, third row) after 24 h incubations. Compounds were excited by a 405 nm argon laser, emission 450-550 nm, DRAQ5 was excited by a 633 nm red helium-neon laser, emission >650 nm. *Compound 3 was not incubated with DRAQ5 as it quenched its fluorescence emission.
changes in the morphology of both of our probes when
interacting with Con A, was next carried out. The SEM images
of these are shown in Fig. 6c and d; the samples being formed
in identical manner except in the presence of 0.2 equivalents
of Con A, and 0.1 mM MnCl2 and 0.1 mM CaCl2, followed by
drop casting and drying in air. It is clear form Fig. 6c and d, that
the presence of the Con A. and the salts has significant effect
on the morphology of both 1 and 3. While some indications of
the presence of the nanospheres can be seen for 1, it is clear
that significant aggregation has occurred in the present of the
protein, and as above, in the presence of salts. However, SEM
imaging of the protein itself (drop casted from buffered ionic
solutions), demonstrated the formation of thick films which
lack the morphology seen in Fig. 6c (See ESI).
Similarly, the morphology of the TBNap 3 in the present of
Con A is significantly different to the self-assembly of 3 alone;
the presence of larger aggregates is observed that seem to
consist of spherical structures, some of which seem to indicate
a ‘collapsed’ hallow-spheres. These results provided further
evidence that these structures do interact with Con A resulting
in changes in their morphological features. To probe if the
DPBS buffer had an effect on the morphology of both probes,
the samples were prepared in pure deionised water, and the
resulting solution of 1 and 3 drop casted onto silicon wafer,
dried in air followed by few hours under vacuum and imaged
using SEM (See ESI). Gratifyingly, the two samples showed
similar morphology to that seen for samples prepared in DPBS
demonstrating that the buffer did not influence the
morphology of both probes and that the changes observed
previously are due to the presence of Con A. This observation
was also supported by DLS measurement that were carried out
on 3 in both the absence and presence of Con A in DPBS
buffer. Here, the DLS showed that the average size of the
aggregates in solution for the 3 alone was similar to that seen
in the SEM, while these were almost ten times the size upon
interacting with Con A (See ESI).
Biological Evaluation
Having demonstrated that 1 and 3 could interact with lectin
proteins, and that no interaction was seen with proteins such
as BSA (Fig. 5), we investigated the biological scope of 1 - 3 in
vitro using human cervical cancer cells (HeLa). We have
previously performed uptake studies of 1 across various cell
lines where no uptake was observed, even after long
incubation times (24 h) (Fig. 7, first row). However, 3 was
shown to localize within the cytosol of the HeLa cells (Fig. 7,
second row) within 24 h; possibly due to the greater
lipophilicity of 3 vs. 1. However, compound 3 was not shown
to be toxic, with IC50 values >100 µM (evaluated via Alamar
Blue assay). Longer incubation times (72 h), also resulted in
IC50 that were greater than 100 µM, therefore it can be
concluded that 3 could be used safely in vitro. To support this
rationale, compound 2 was also evaluated in vitro, as the
protected mannose units make it even more lipophilic and
therefore more prone to cellular uptake. Incubation in HeLa
cells (Fig. 7, third row) showed a greater uptake than either 1
or 3. However, due to its high hydrophobicity it was observed
to form aggregates in aqueous solution. Interestingly, short
times of incubation (of ca. 1 h) showed larger aggregates that
are more challenging for cellular uptake, and these aggregates
interact with the cell membrane (see ESI). After longer times
(24 h), the aggregates reduce in size and are increasingly
accumulated within the cells. Confocal imaging analysis

Journal Name ARTICLE
This journal is © The Royal Society of Chemistry 20xx J. Name., 2013, 00, 1-3 | 7
Please do not adjust margins
Please do not adjust margins
through the use of Z-stacks images proved that the smaller
aggregates were indeed located inside the cells whereas the
larger ones only interact with the cell membrane (see ESI).
Conclusions
Two structurally related glyconaphthalimide probes were
prepared and their photophysical and self-assembly properties
investigated. Their ability to function as fluorogenic molecular
probes for lectin binding was studied and it was demonstrated
that carbohydrate-lectin interactions resulted in a disruption
of aggregation that resulted in significant changes in
fluorescence. Binding studies in the presence of non-lectin
proteins demonstrated that changes in the luminescence arise
from selective binding interactions between the α-mannosides
probes and Con A and highlight the potential of these probes
for in vitro and in vivo applications. The monovalent 1 probe
was found to be superior to 3 for lectin detection although 3
more readily underwent cellular uptake in HeLa cells. Detailed
morphology studies further confirmed the disruption of
aggregates upon carbohydrate-lectin binding interactions. This
proof of principle opens novel avenues for molecular probe
design using naphthalimide derivatives. We are currently
investigating the use of TBNap structures as supramolecular
synthons for the formation of self-assemble in solutions for
applications in chemical biology.
Experimental
Materials and Methods
Unless otherwise stated; all commercial chemicals were
obtained from Sigma-Aldrich or Fluka and used without further
purification. Deuterated solvents for NMR use were purchased
from Apollo. Dry solvents were distilled under Argon and dried
over 4 Å molecular sieves prior to use. Solvents for synthesis
purposes were used at GPR grade. NMR spectra were recorded
on Bruker DPX–400 Advance spectrometers, operating at
400.13 MHz and 600.1 MHz for 1H NMR; 100.6 MHz and 150.9
MHz for 13C-NMR. Shifts are referenced to the internal solvent
signals.1 NMR data were processed using Mestrenova
software. HRMS spectra were measured on a Micromass LCT
electrospray TOF instrument with a WATERS 2690 autosampler
and methanol/acetonitrile as carrier solvent. Melting points
were determined using a Stuart Scientific Melting point was
determined using an Electrochemical IA9000 digital melting
point apparatus in an unsealed capillary tube and are
incorrect. Infrared spectra were recorded on a Perkin Elmer
Spectrum One FT-IR Spectrometer equipped with a Universal
ATR sampling accessory. Carbohydrate positions are named 1
to 6, starting the count in the anomeric position.
UV/Vis Measurements
UV-visible absorption spectra and optical density were
recorded by means of a Varian CARY 50 spectrophotometer.
Solutions were measured in 3 cm (10 mm x 10 mm) cuvettes.
The wavelength range was 200-600 nm with a scan rate of 300
nm min-1. The solvents employed were HPLC or
spectrophotometric grade.
Fluorescence Measurements
Fluorescence measurements were made with a Varian Carey
Eclipse Fluorimeter equipped with a 1.0 cm path length quartz
cell. The solvents used were of HPLC grade. The concentrations
of the compounds under investigation were the same as those
used for the UV-visible absorption measurements.
Cell Culture
HeLa cells were grown in Dulbecco’s Modified Eagle Medium
(Glutamax) supplemented with 10% fetal bovine serum, 1%
penicillin/streptomycin and 0.2% of plasmocin at 37˚C in a
humidified atmosphere of 5% CO2.
Alamar Blue Viability Assay
HeLa cells were seeded at a density of 2.5x10⁴ cells/well in 96-
well plates and treated with the indicated compounds for 24
or 72 h. Alamar blue (22 µl) was then added to each well and
incubated at 37 °C in the dark for 4 h. Plates were then read on
a fluorescence plate reader (SpectraMax Gemini, Molecular
Devices) with excitement and emission wavelengths of 544 nm
and 590 nm, respectively. Experiments were performed in
triplicate on three independent days with activity expressed as
percentage cell viability compared to vehicle treated controls.
All data points (expressed as means ± S.E.M.) were analysed
using GRAPHPAD Prism (Graphpad software Inc., San Diego,
CA).
Confocal Microscopy
Cells were seeded at a density of 5x10⁴ cells/dish in glass
bottom wells and leave to grow for 24 h. Before treatment cell
media was replaced by phenol-red free media and cells were
incubated with compounds (50 µM) for 1 and 24 h,
respectively. Cells were stained with DRAQ5 (red nuclear
stain), followed by viewing using Leica SP8 STED confocal
microscopy with a 40X oil immersion lens. Image analysis was
performed using Leica Application Suite software. Compounds
were excited by a 405 nm argon laser, emission 450-550 nm,
DRAQ5 was excited by a 633 nm red helium-neon laser,
emission >650 nm. Images are representative of three
independent experiments.
Scanning Electron Microscopy
The morphology of the samples were studied using a Carl Zeiss
Ultra SEM with an SE2 or in-lens detector in the Advanced
Microscopy Laboratory, CRANN, Trinity College Dublin, with
the samples deposited on silicon wafers with a thick silicon
dioxide layer. Prior to imaging, all samples were coated with a
conductive layer of Pd/Au using a Cressington 208Hr high-
resolution sputter coater.

ARTICLE Journal Name
8 | J. Name., 2012, 00, 1-3 This journal is © The Royal Society of Chemistry 20xx
Please do not adjust margins
Please do not adjust margins
X-ray Crystallography
The diffraction data were collected on a Bruker APEX-II Duo
dual-source instrument using microfocus Cu-Kα radiation (λ =
1.5405 Å) using ω and φ scans. A single crystal was mounted
on Mitegen micromounts in NVH immersion oil, and
maintained at a temperature of 100 K using a Cobra
cryostream. The diffraction data were reduced and processed
using the Bruker APEX suite of programs.28 Multi-scan
absorption corrections were applied using SADABS.29 The data
were solved using the Intrinsic Phasing routine in SHELXT.
Although the chiral space group P21212 gave the best statistics
and most appropriate structure model, no chirality
information is assumed and the structure was refined as a
racemic twin with full-matrix least squares procedures using
SHELXL-2015 within the OLEX-2 GUI.30-32. All non-hydrogen
atoms were refined with anisotropic displacement parameters.
All hydrogen atoms were placed in calculated positions and
refined with a riding model, with isotropic displacement
parameters equal to either 1.2 or 1.5 times the isotropic
equivalent of their carrier atoms. Due to the severe disorder in
the naphthalimide fragments of both unique molecules, DFIX,
SADI and RIGU restraints and EADP constraints were necessary
to maintain reasonable chemical geometries and Uij tensors,
particularly where atoms from both fragments were closely
overlapping. Occupancies of the individual conformers were
determined with free variable refinement and then fixed to
sensible fractional values. Specific collection and refinement
strategies are further outlined in the combined
crystallographic information file (cif) under the
_refine_special_details heading. CCDC 1866499.
Crystal Data for compound 7 (C36H35N10O6.5, M =711.74
g/mol): orthorhombic, space group P21212 (no. 18), a =
17.0714(12) Å, b = 27.849(2) Å, c = 6.8249(3) Å, V =
3244.7(4) Å3, Z = 4, T = 100.0 K, μ(CuKα) = 0.859 mm-1, Dcalc =
1.457 g/cm3, 21933 reflections measured (6.072° ≤ 2Θ ≤
137.048°), 5941 unique (Rint = 0.0536, Rsigma = 0.0544) which
were used in all calculations. The final R1 was 0.0754 (I > 2σ(I))
and wR2 was 0.2039 (all data).
Synthetic procedures
Bis-[N-(1-(3-(2’,3’,4’,6’-tetra-O-acetyl-α-D-
mannopyranosyloxy)propyl)-1H-1’’,2’’,3’’-triazol-4’’-yl)methyl)-
9,18-methano-1,8-naphthalimide-[b,f ][1,5]diazocine (2)
Compound 5 (28 mg, 0.05 mmol, 1 equiv), compound 1 (45
mg, 0.1 mmol, 2 equiv) and Cu(BF4)(MeCN)4 (10 mg, 0.03
mmol, 0.3 equiv) were dissolved in DMF (5 mL) in a microwave
vial. The reaction mixture was stirred for 2 h at 115 °C in a
microwave reactor. The solvent was removed in vacuo and the
crude product dissolved in a mixture of MeOH/CH2Cl2 (1:2) and
filtered through a plug of Celite® to remove the copper
catalyst. The filtrate was concentrated in vacuo and purified by
SiO2 column chromatography. The product was obatined as an
orange wax (40 mg, 66%). 1H (799.7 MHz, CDCl3): 8.69 (bs, 2H,
H-Ar), 8.62 (d, J = 11.4 Hz, 2H, H-Ar), 8.13 (s, 2H, H-Ar), 8.03 (s,
2H, H-Ar), 7.86 (s, 2H, H-Ar), 7.61 (s, 2H), 5.42 (bs, 3H), 5.27 –
5.24 (m, 4H, CH2), 5.21 (bs, 1H), 5.14 (app t, 2H, N-CH2), 4.76
(s, 2H, H-1), 4.66 – 4.64 (m, 2H), 4.61 – 4.56 (m, 2H), 4.43 –
4.39 (m, 2H), 4.38 – 4.34 (m, 2H), 4.20 – 4.35 (m, 2H), 4.05 (d, J
= 12.6 Hz, 2H), 3.96 – 3.92 (s, 2H), 3.71 – 3.67 (s, 2H), 3.40 –
3.35 (s, 2H), 2.14, 2.06, 2.05, 1.99 (s, 24H, OCOCH3), (2xCH2
buried under OCOCH3). 13C (201.1 MHz, CDCl3): 153.6, 133.5
(C-Ar), 129.8 (C-Ar), 100.4 (C-1), 71.9, 71.6 (C-CH2), 71.3, 69.6,
68.5 (C-CH2), 67.3, 67.2, 65.0, 59.7 (C-16), 59.6, 39.2, 37.8,
34.1, 33.7, 33.6, 23.6, 23.5, 23.4, 23.3, 22.4 (7C, OCOCH3). νmax
(ATR)/cm-1: 789, 1051 (C-N), 1229 (C-N), 1373, 1597 (ar. C-C),
1659 (C=O), 1747, 2923. HRMS (m/z - MALDI): Found:
1421.4504, ([M+Na]+. C67H70N10O24Na, Required: 1421.4462).
Bis-[N-(1-(3-(α-D-mannopyranosyloxy)propyl)-1H-1’,2’,3’-
triazol-4’-yl)methyl)-9,18-methano-1,8-naphthalimide-[b,f
][1,5]diazocine (3)
Compound 2 (40 mg, 0.028 mmol, 1 equiv) was dissolved in
MeOH/NaOMe (5 mL, 0.4 equiv). After stirring for 4 h at rt,
DOWEX® 50WX8-200 ion exchange resin was added to the
mixture until a neutral pH was measured. The reaction mixture
was filtered and the filtrate concentrated in vacuo. Yielding the
desired product as an orange powder (28 mg, 98%). M.p:
120.5 – 122.0 °C (decomposition). 1H (400 MHz, d-TFA): 9.05
(d, J = 8.0 Hz, 2H, H-Ar), 8.99 (d, J = 7.2 Hz, 2H, H-Ar), 8.84 (s,
2H, H-Ar), 8.65 – 8.59 (m, 2H, H-Ar), 8.36 (s, 2H, H-Ar), 5.96 (s,
2H, H-Ar), 5.93 – 5.87 (m, 4H, CH2, H-Ar), 5.83 (s, 2H, N-CH2),
5.32 – 5.29 (m, 2H), 5.28 – 5.25 (m, 2H), 5.22 (s, 2H), 5.00 –
4.94 (s, 6H), 4.55 – 4.39 (m, 2H), 4.55 – 4.29 (m, 2H), 4.19 –
4.08 (m, 4H), 3.81 – 3.75 (m, 2H). νmax (ATR)/cm-1: 980, 1100,
1490 (ar. C-C), 1750 (C=O), 3410 (OH/NH2). HRMS (m/z - ESI):
Found: 1063.38054, ([M+H]+. C51H55N10O16, Required:
1063.3792).
Bis-[N-(1-propargyl)]-9,18-methano-1,8-naphthalimide- [b,f
][1,5]diazocine (5)
Compound 4 (100 mg, 0.21 mmol, 1 equiv) was reacted with
propargylamine (35 µL, 0.54 mmol, 2.5 equiv) in EtOH (10 mL)
at 80 °C for 16 h. After this time, the reaction mixture was
filtered through celite and washed with cold EtOH leaving an
orange solid (108 mg, 94%). M.p: 292-294 °C (decomposition). 1H (400 MHz, CDCl3): 8.72 (d, J = 8.4 Hz, 2H, H-Ar), 8.65 (d, J =
7.2 Hz, 2H, H-Ar), 8.14 (s, 2H, H-Ar), 7.88 (app t, 2H, H-Ar), 5.15
(d, J = 16.9 Hz, 1H, N-CH2), 4.88 (s, 4H, H-2), 4.68 (s, 2H, N-CH2-
N), 4.59 (d, J = 16.9 Hz, 2H, N-CH2). 13C (100 MHz, CDCl3):
163.2, 162.6, 150.0, 131.6, 131.1, 131.0, 127.9, 127.78, 127.4,
126.9, 122.5, 117.8, 79.8, 73.4, 66.4, 56.5, 31.2, 29.4, 19.0. νmax
(ATR)/cm-1: 1033, 1661 (C=O), 1340 (ar. C-C), 2935 (CCH).
HRMS (m/z - MALDI): Found: 537.1578, ([M+Na]+.
C33H54N10O16Na, Required: 537.15557).
Conflicts of interest
There are no conflicts to declare.

Journal Name ARTICLE
This journal is © The Royal Society of Chemistry 20xx J. Name., 2013, 00, 1-3 | 9
Please do not adjust margins
Please do not adjust margins
Acknowledgements
We thank the Irish Research Council (IRC)(GOIPD/2013/442 to
S.S, and GOIPD/2015/446 to C.S.H) and Science Foundation
Ireland (SFI PI Award 13/IA/1865 to TG) and (SFI CDA Award
15/CDA/3310 to EMS) for the financial support.
Notes and references
1 a) D. Wu, A. C. Sedgwick, T. Gunnlaugsson, E. U. Akkaya, J. Yoon and T. D.
James, Chem.Soc.Rev.,2017,46,7105-7123 b) S. Erbas-Cakmak, S. Kolemen, A. C. Sedgwick, T. Gunnlaugsson, T. D. James, J. Yoon and E. U. Akkaya, Chem.
Soc. Rev., 2018, 47, 2228-2248. 2 (a) B. Daly, J. Ling and A. P. de Silva, Chem. Soc. Rev., 2015, 44, 4203-4211. (b) A. P.
de Silva, H. Q. N. Gunaratne, T. Gunnlaugsson, A. J. M. Huxley, C. P. McCoy, J. T. Rademacher and T. E. Rice, Chem. Rev., 1997, 97, 1515-1566; (c) W. Guan, W. Zhou, J. Lu and C. Lu, Chem. Soc. Rev., 2015. (d) E. B. Veale and T. Gunnlaugsson, Ann. Rep. Progr. Chem., 2010, 106, 376. (e) H. N. Kim, Z. Guo, W. Zhu, J. Yoon, H. Tian. Chem. Soc. Rev., 2011, 40, 79-93. Z. Guo, S. Park, J. Yoon, I. Shin. Chem. Soc.
Rev. 2014, 43, 16-29. 3 a) F. E. Poynton, S. A. Bright, S. Blasco, D. C. Williams, J. M. Kelly and T.
Gunnlaugsson, Chem. Soc. Rev., 2017, 46, 7706–7756. b) R. T. K. Kwok, C. W. T. Leung, J. W. Y. Lam and B. Z. Tang, Chem. Soc. Rev., 2015, 44, 4228–4238.
4 V. García-López, F. Chen, L. G. Nilewski, G. Duret, A. Aliyan, A. B. Kolomeisky, J. T. Robinson, G. Wang, R. Pal and J. M. Tour, Nature, 2017, 548, 567-572.
5 C. Moylan, E. M. Scanlan, M. O. Senge, Curr. Med. Chem. 2015, 22, 2238-2348. 6 (a) S. H. Hewitta and S. J. Butler, Chem. Commun., 2018, 54, 6635-6647. (b) I.
V. Kolesnichenko and E. V. Anslyn, Chem. Soc. Rev., 2017, 46, 2385-2390. 7 (a) P. A. Gale and C. Caltagirone, Coord. Chem. Rev. 2018, 354, 2–27 (b) A. B.
Aletti, D. M. Gillen and T. Gunnlaugsson, Coord. Chem. Rev. 2018, 354, 98–120. (c) Z. Xu, K.-H. Baek, H. N. Kim, J. Cui, X. Qian, D. R. Spring, I. Shin, J. Yoon. J.
Am. Chem. Soc. 2010, 132, 601−610. 8 (a) L. Fang, G. Trigiante, C. J. Kousseff, R. Crespo-Otero, M. P. Philpott and
M. Watkinson, Chem. Commun., 2018, 54, 9619-9622. (b) X. Sun, Q. Xu, G. Kim, S. E. Flower, J. P. Lowe, J. Yoon, J. S. Fossey, X. Qian, S. D. Bull and T. D. James, Chem. Sci., 2014, 5, 3368–3373. (b) X. Jia, Q. Chen, Y. Yang, Y. Tang, R. Wang, Y. Xu, W. Zhu and X. Qian, J. Am. Chem. Soc., 2016, 138, 10778–10781. (c) D. T. Shi, D. Zhou, Y. Zang, J. Li, G. R. Chen, T. D. James, X-P. He and H. Tian Chem Commun, 2015, 51, 3653-3655.
9 (a) H. M. Burke, T. Gunnlaugsson, E. M. Scanlan, Chem. Commun. 2015, 51, 10576-10588. (b) Z.-R. Dai, G.-B. Ge, L. Feng, J. Ning, L.-H. Hu, Q. Jin, D.-D. Wang, X. Lv, T.-Y. Dou, J.-N. Cui, L. Yang, J. Am. Chem. Soc. 2015, 137, 14488−14495.
10 (a) J. I. Lovitt, C. S. Hawes, A. D. Lynes, B. Haffner, M. E. Mobius and T. Gunnlaugsson, Inorg. Chem. Front, 2017, 4, 296. (b) C. S. Hawes, A. D. Lynes, K. Byrne, W. Schmitt, G. Ryan, M. E. Möbius and T. Gunnlaugsson, Chem.Commun.,2017, 53, 5989-5992. (c) C. S. Hawes, K. Byrne, W. Schmitt, and T. Gunnlaugsson, Inorg. Chem. 2016, 55, 11570−11582. (d) S. Mukherjee and P. Thilagar, Chem. Eur. J. 2014, 20, 8012−8023.
11 E. Calatrava-Perez, S. A. Bright, S. Achermann, C. Moylan, M. O. Senge, E. B. Veale, D. C. Williams, T. Gunnlaugsson and E. M. Scanlan, Chem. Commun., 2016, 52, 13086-13089.
12 Examples where such targeting has been achieved: (a) D. Wu, S. Cheung, R. Daly, H. Burke, E. M. Scanlan and D. F. O’Shea, Eur. J. Org. Chem., 2014, 6841. (b) Y. Fu, J. Zhang, H. Wang, J.-L. Chen, P. Zhao, G.-R. Chen, X.-P. He, Dyes and
Pigments, 2016, 133, 372-379. (c) M. H. Lee, J. H. Han, P.-S. Kwon, S. Bhuniya, J. Y. Kim, J. L. Sessler, C. Kang and J. S. Kim, J. Am. Chem. Soc., 2012, 134, 1316−1322. (d) R. Daly, G. Vaz, A. M. Davies, M. O. Senge, E. M. Scanlan, Chem. Eur. J. 2012, 18, 14671-14679; (e) O. B. Locos, C. C. Heindl, A. Corral, M. O. Senge, E. M. Scanlan, Eur. J. Org. Chem. 2010, 1026-1028.
13 (a) X. Jia, Y. Yang, Y. Xu, X. Qian, Pure Appl. Chem. 2014, 86, 1237-1246. (b) Z. Xu, L. Xu, J. Zhou, Y. Xu, W. Zhu and X. Qian, Chem. Commun., 2012, 48, 10871.
14 H.-Lin Zhang, X.-Li Wei, Y. Zang, J.-Y. Cao, S. Liu, X.-P. He, Q. Chen, Y.-T. Long, J. Li, G.-R. Chen and K. Chen, Adv. Mater. 2013, 25, 4097–4101.
15 S. Cecioni, A. Imberty and S. Vidal, Chem. Rev., 2015, 115, 525-561. 16 T. J. Berg JM, Stryer L., W H Freeman, 2002, ISBN-10: 0-7167-3051-0 17 T. Yau, X. Dan, C. Ng and T. Ng, Molecules, 2015, 20, 3791 18 (a) J. M. Benito, M. Gómez-García, C. Ortiz Mellet, I. Baussanne, J. Defaye and J.
M. García Fernández, J. Am. Chem. Soc., 2004, 126, 10355-10363. (b) V. Wittmann and R. J. Pieters, Chem. Soc. Rev., 2013, 42, 4492-4503.
19 P. N. Kanellopoulos, K. Pavlou, A. Perrakis, B. Agianian, C. E. Vorgias, C. Mavrommatis, M. Soufi, P. A. Tucker and S. J. Hamodrakas, J. Struct. Biol., 1996, 116, 345-355.
20 H. M. Burke, T. Gunnlaugsson and E. M. Scanlan, Org. Biomol. Chem., 2016, 14, 9133-9145.
21 M. Matsui and Y. Ebara, Bioorg. Med. Chem. Lett., 2012, 22, 6139-6143 22 (a) R. M. Duke, E. B. Veale, F. M. Pfeffer, P. E. Kruger and T. Gunnlaugsson, Chem.
Soc. Rev., 2010, 39, 3936-3953; (b) S. Banerjee, E. B. Veale, C. M. Phelan, S. A. Murphy, G. M. Tocci, L. J. Gillespie, D. O. Frimannsson, J. M. Kelly and T. Gunnlaugsson, Chem. Soc. Rev., 2013, 42, 1601-1618. (c) (e) S. Banerjee, J. A. Kitchen, S. A. Bright, J. E. O'Brien, D. C. Williams, J. M. Kelly and T. Gunnlaugsson, Chem. Commun., 2013, 49, 8522-8524.
23 (a) K. Jobe, C. H. Brennan, M. Motevalli, S. M. Goldup and M. Watkinson, Chem.
Commun., 2011, 47, 6036–6038. (b) J. Pancholi, D. J. Hodson, K. Jobe, G. A. Rutter, S. M. Goldup, and M. Watkinson, Chem. Sci. 2014, 5, 3528-3535. (c) J. A. Kitchen, P. N. Martinho, G. G. Morgan and T. Gunnlaugsson, Dalton Trans., 2014, 43, 6468-6479. (d) E. B. Veale, J. A. Kitchen and T. Gunnlaugsson, Supramol.
Chem., 2013, 25, 101–108. (e) E. Tamanini, A. Katewa, L. M. Sedger, M. H. Todd and M. Watkinson, Inorg. Chem. 2009, 48, 319. (f) E. Tamanini, K. Flavin, M. Motevalli, S. Piperno, L. A. Gheber, M. H. Todd and M. Watkinson, Inorg. Chem. 2010, 49, 3789. (g) F. Lupo, S. Gentile, F. P. Ballistreri, G. A. Tomaselli, M. E. Fragala and A. Gulino, Analyst, 2010, 135, 2273; (h) T. Gunnlaugsson, M. Glynn, G. M. Tocci, P. E. Kruger and F. M. Pfeffer, Coord. Chem. Rev, 2006, 250, 3094; (i) R. M. Duke and T. Gunnlaugsson, Tetrahedron Lett., 2007, 48, 8043. (j) T. Gunnlaugsson, M. Nieuwenhuyzen, L. Richard and V. Thoss, Tetrahedron Lett., 2001, 42, 4725. (k) T. Gunnlaugsson, B. Bichell and C. Nolan, Tetrahedron Lett., 2002, 43, 4989.
24 (a) E. B. Veale, D. O. Frimannsson, M. Lawler and T. Gunnlaugsson, Org. Lett., 2009, 11, 4040-4043; (b) E. B. Veale and T. Gunnlaugsson, J. Org. Chem., 2010, 75, 5513-5525; (c) S. Banerjee, S. A. Bright, J. A. Smith, J. Burgeat, M. Martinez-Calvo, D. C. Williams, J. M. Kelly and T. Gunnlaugsson, J. Org. Chem., 2014, 79, 9272-9283; (d) S. Murphy, S. A. Bright, F. E. Poynton, T. McCabe, J. A., E. B. Veale, D. C. Williams and T. Gunnlaugsson, Org. Biomol. Chem., 2014, 12, 6610-6623.
25 (a) S. Shanmugaraju, B. la Cour Poulsen, T. Arisa, D. Umadevi, H. L. Dalton, C. S. Hawes, S. Estalayo-Adrian, A. J. Savyasachi, G. W. Watson, D. C. Williams and T. Gunnlaugsson, Chem. Commun., 2018, 54, 4120-4123. (b) R. B. P. Elmes, M. Erby, S. A. Bright, D. C. Williams and T. Gunnlaugsson, Chem. Commun., 2012, 48, 2588-2590.
26 K. Hanaoka, Y. Muramatsu, Y. Urano, T. Terai and T. Nagano, Chem. Eur. J., 2010, 16, 568-572.
27 S. Shanmugaraju, D. McAdams, F. Pancotti, C. S. Hawes, E. B. Veale, J. A. Kitchen and T. Gunnlaugsson, Org. Biomol. Chem, 2017, 15, 7321-7329.
28 Bruker APEX-3, Bruker-AXS Inc., Madison, WI, 2016 29 Bruker DIFFRAC.EVA, Bruker-AXS Inc., Madison, WI, 2016 30 SADABS. Bruker-AXS Inc., Madison, WI, 2016 31 G. M. Sheldrick, Acta Crystallogr. Sect. A. 2015, 71, 3-8 32 G. M. Sheldrick, Acta Crystallogr. Sect. C. 2015, 71, 3-8 33 O. V. Dolomanov, L. J. Bourhis, R. J. Gildea, J. A. K. Howard and H. Puschmann,
J. Appl. Crystallogr. 2009, 42, 339-341
Copyright © 2022 FDOKUMEN

