


Bahasa
Halaman
Hukum

Cutting-Edge Research on Environmental Processes & Impacts
Journal of Environmental Monitoring
Celebratory 100th issueneworleans.setac.org
Big Science, Big Fun,in the Big Easy
What’s in it for you at SETAC New Orleans?
• Nearly 2,500 environmental scientists, assessors, regulators, and managers to interact with on topics including Ecological Risk Assessment; Environmental and Analytical Chemistry; New Orleans Local and Regional Issues; Risk Management, Remediation, and Science Policy; and Terrestrial or Wildlife Toxicology and Ecology
• More than 30 countries represented, affording you global exposure
• A 30-year history of cutting-edge science and a high-visibility trade show
• 1,700 presenters in 171 sessions on a theme you can relate to: Human–Environmental Interactions: Understanding Change in Dynamic Systems
• Worldwide, regional, state, and local government, business, academic, and nongovernmental organizations whose job opportunities are available to you through the SETAC CareerCenter
• Big science, big speakers, big get-togethers, beginning with Thursday’s opening session from 18:30 to 20:00 and continuing with Sunday night’s Big Science in the Big Easy and Big Bash Anniversary Social
Register now at neworleans.setac.org!
Not a member? Dues for SETAC members are only $140. To join, visit www.setac.org/node/2 and you can save on your meeting registration by applying for SETAC membership!
The Society of Environmental Toxicology and Chemistry (SETAC) is coming to New Orleans. And what better place to celebrate SETAC‘s 30th Annual Meeting in North America? The meeting offers science professionals unparalleled opportunities to connect, to learn, and to collaborate.
New Orleans Hilton RiversideThursday-Monday, 19-23 November 2009
ISSN 1464-0325
www.rsc.org/jem Volume 11 | Number 10 | October 2009 | Pages 1709–1888
De Kimpe, De Saeger et al.Fungi in mouldy interiors
Sun and ZhengOil spill response strategies
Baun et al.Limits for nanoparticles in EU waters
Krivit and MarwanLow-energy nuclear reaction research
Publ
ishe
d on
20
July
200
9. D
ownl
oade
d by
Hog
esch
ool G
ent o
n 24
/04/
2014
09:
03:3
1.
View Article Online / Journal Homepage / Table of Contents for this issue
PAPER www.rsc.org/jem | Journal of Environmental Monitoring
Publ
ishe
d on
20
July
200
9. D
ownl
oade
d by
Hog
esch
ool G
ent o
n 24
/04/
2014
09:
03:3
1.
View Article Online
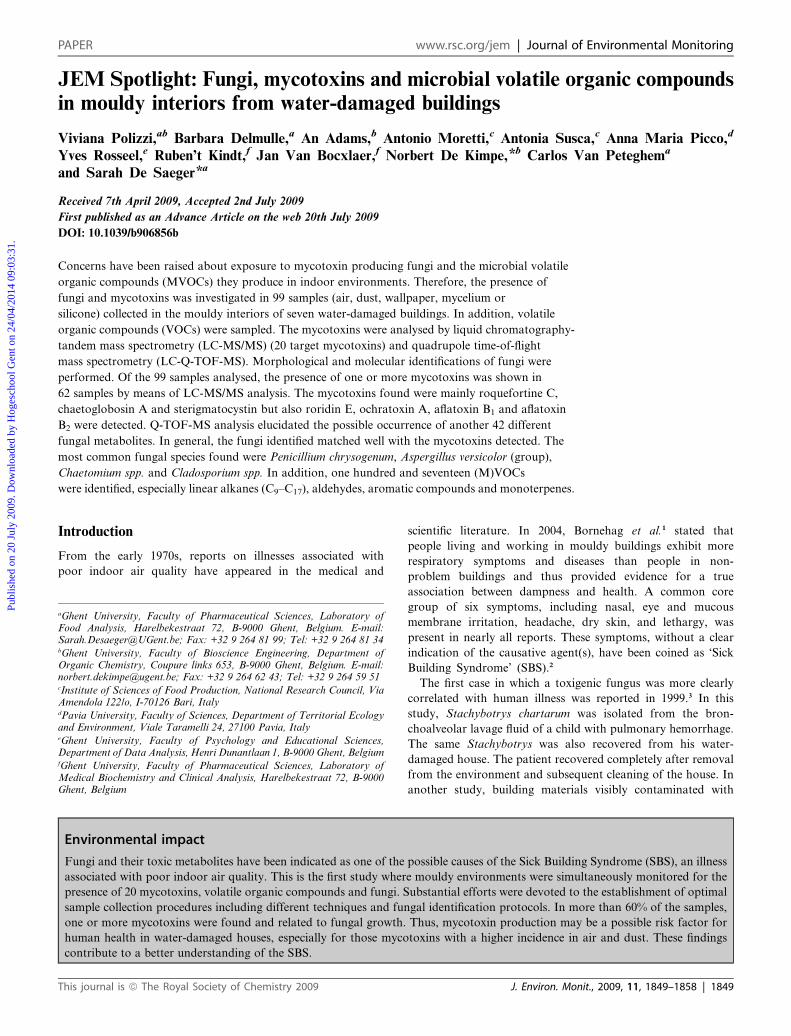
JEM Spotlight: Fungi, mycotoxins and microbial volatile organic compoundsin mouldy interiors from water-damaged buildings
Viviana Polizzi,ab Barbara Delmulle,a An Adams,b Antonio Moretti,c Antonia Susca,c Anna Maria Picco,d
Yves Rosseel,e Ruben’t Kindt,f Jan Van Bocxlaer,f Norbert De Kimpe,*b Carlos Van Peteghema
and Sarah De Saeger*a
Received 7th April 2009, Accepted 2nd July 2009
First published as an Advance Article on the web 20th July 2009
DOI: 10.1039/b906856b
Concerns have been raised about exposure to mycotoxin producing fungi and the microbial volatile
organic compounds (MVOCs) they produce in indoor environments. Therefore, the presence of
fungi and mycotoxins was investigated in 99 samples (air, dust, wallpaper, mycelium or
silicone) collected in the mouldy interiors of seven water-damaged buildings. In addition, volatile
organic compounds (VOCs) were sampled. The mycotoxins were analysed by liquid chromatography-
tandem mass spectrometry (LC-MS/MS) (20 target mycotoxins) and quadrupole time-of-flight
mass spectrometry (LC-Q-TOF-MS). Morphological and molecular identifications of fungi were
performed. Of the 99 samples analysed, the presence of one or more mycotoxins was shown in
62 samples by means of LC-MS/MS analysis. The mycotoxins found were mainly roquefortine C,
chaetoglobosin A and sterigmatocystin but also roridin E, ochratoxin A, aflatoxin B1 and aflatoxin
B2 were detected. Q-TOF-MS analysis elucidated the possible occurrence of another 42 different
fungal metabolites. In general, the fungi identified matched well with the mycotoxins detected. The
most common fungal species found were Penicillium chrysogenum, Aspergillus versicolor (group),
Chaetomium spp. and Cladosporium spp. In addition, one hundred and seventeen (M)VOCs
were identified, especially linear alkanes (C9–C17), aldehydes, aromatic compounds and monoterpenes.
Introduction
From the early 1970s, reports on illnesses associated with
poor indoor air quality have appeared in the medical and
aGhent University, Faculty of Pharmaceutical Sciences, Laboratory ofFood Analysis, Harelbekestraat 72, B-9000 Ghent, Belgium. E-mail:[email protected]; Fax: +32 9 264 81 99; Tel: +32 9 264 81 34bGhent University, Faculty of Bioscience Engineering, Department ofOrganic Chemistry, Coupure links 653, B-9000 Ghent, Belgium. E-mail:[email protected]; Fax: +32 9 264 62 43; Tel: +32 9 264 59 51cInstitute of Sciences of Food Production, National Research Council, ViaAmendola 122/o, I-70126 Bari, ItalydPavia University, Faculty of Sciences, Department of Territorial Ecologyand Environment, Viale Taramelli 24, 27100 Pavia, ItalyeGhent University, Faculty of Psychology and Educational Sciences,Department of Data Analysis, Henri Dunantlaan 1, B-9000 Ghent, BelgiumfGhent University, Faculty of Pharmaceutical Sciences, Laboratory ofMedical Biochemistry and Clinical Analysis, Harelbekestraat 72, B-9000Ghent, Belgium
Environmental impact
Fungi and their toxic metabolites have been indicated as one of the
associated with poor indoor air quality. This is the first study wher
presence of 20 mycotoxins, volatile organic compounds and fungi. S
sample collection procedures including different techniques and fun
one or more mycotoxins were found and related to fungal growth.
human health in water-damaged houses, especially for those myco
contribute to a better understanding of the SBS.
This journal is ª The Royal Society of Chemistry 2009
scientific literature. In 2004, Bornehag et al.1 stated that
people living and working in mouldy buildings exhibit more
respiratory symptoms and diseases than people in non-
problem buildings and thus provided evidence for a true
association between dampness and health. A common core
group of six symptoms, including nasal, eye and mucous
membrane irritation, headache, dry skin, and lethargy, was
present in nearly all reports. These symptoms, without a clear
indication of the causative agent(s), have been coined as ‘Sick
Building Syndrome’ (SBS).2
The first case in which a toxigenic fungus was more clearly
correlated with human illness was reported in 1999.3 In this
study, Stachybotrys chartarum was isolated from the bron-
choalveolar lavage fluid of a child with pulmonary hemorrhage.
The same Stachybotrys was also recovered from his water-
damaged house. The patient recovered completely after removal
from the environment and subsequent cleaning of the house. In
another study, building materials visibly contaminated with
possible causes of the Sick Building Syndrome (SBS), an illness
e mouldy environments were simultaneously monitored for the
ubstantial efforts were devoted to the establishment of optimal
gal identification protocols. In more than 60% of the samples,
Thus, mycotoxin production may be a possible risk factor for
toxins with a higher incidence in air and dust. These findings
J. Environ. Monit., 2009, 11, 1849–1858 | 1849
Publ
ishe
d on
20
July
200
9. D
ownl
oade
d by
Hog
esch
ool G
ent o
n 24
/04/
2014
09:
03:3
1.
View Article Online
moisture-related fungi were screened for cytotoxicity. In all cases
in which building occupants had reported verifiable skin, mucous
membrane, respiratory, central nervous system or neuro-
psychological abnormalities, cytotoxicity was found.4
Concerning human inhalational exposure, only fungal
metabolites that can become airborne are of interest. In a study
of Smith et al.,5 47% of the fungal isolates from the air flora of
a damp building displayed spore-associated cytotoxic properties.
This fact emphasises the potential health hazards of the contin-
uous inhalation of toxigenic fungal propagules by occupants of
mouldy houses.
Investigations have focused primarily on intact airborne
fungal spores assuming that spores are the main airborne parts of
fungi. However, different studies, all concerning Stachybotrys
chartarum, have demonstrated that the number of fungal frag-
ments released from contaminated surfaces was always higher
than the number of intact spores.6,7 These fungal fragments,
separated from conidia by means of filters with decreasing pore
size, contained macrocyclic trichothecenes.8
Therefore, the high number of fungal fragments released in
combination with their potential to deliver harmful antigens and
mycotoxins to the lung suggests that future exposure measure-
ments need to include measurements of fungal fragments as well.
This would provide more realistic exposure profiles.
Several field studies, however, have shown that airborne
fungal concentrations in problematic buildings are similar to
those observed in non-problematic buildings.6,9 It is, therefore,
important to investigate other potentially hazardous factors as
well, such as mycotoxins and microbial volatile organic
compounds (MVOCs).
Concerning mycotoxins, the majority of studies to date have
focused on trichothecene mycotoxins. However, it has been
shown that, while fungal isolates from water-damaged buildings
produce highly cytotoxic trichothecenes (e.g. verrucarins, ror-
idins, verrucarols, T-2 toxin, diacetoxyscirpenol, neosolaniol,
satratoxins, nivalenol and deoxynivalenol), they may also
produce other mycotoxins, including ochratoxin A, zearalenone,
aflatoxins and sterigmatocystin,10–15 which may induce health
problems upon inhalation. In fact, aflatoxins are classified by the
International Agency for Research on Cancer (IARC) as carci-
nogenic to humans (group 1), while ochratoxin A and ster-
igmatocystin are classified in group 2B ‘possibly carcinogenic to
humans’.16 Adverse effects have also been reported for other
mycotoxins. Chaetoglobosin A has a cytotoxic effect on various
cell lines,17 roquefortine C has a neurotoxic effect on cockerels18
and zearalenone is a cytotoxic potent estrogen having a negative
effect on the reproductive system.19
The Sick Building Syndrome has also been associated with the
presence of (M)VOCs.20 (M)VOCs can have adverse effects on
the respiratory systems, blood vessel systems and nerve systems,
may be carcinogenic21 and can cause mental and cognitive
distraction of the exposed subjects, which results in reduced
performance, especially if the odor is perceived as unpleasant or
unrecognizable.22 In addition, the detection of MVOCs may
indicate fungal growth. Certain species specific production
profiles may enable the identification of fungi based on the
detected fungal volatiles.23 In specific cases, certain marker
molecules, such as trichodiene, can be detected as indicators of
ongoing mycotoxin production.24
1850 | J. Environ. Monit., 2009, 11, 1849–1858
To date, mouldy interiors have not been monitored simulta-
neously for mycotoxins, MVOCs and fungal growth. The aim of
this study was to analyse MVOCs as possible indicators of fungal
growth and to reveal the presence of fungi and mycotoxins in
water-damaged buildings. These findings could contribute to
a better understanding of the SBS. Therefore, a broad range of
mycotoxins (20 compounds) was monitored using a multi-
mycotoxin liquid chromatography tandem mass spectrometry
(LC-MS/MS) method (based on Delmulle et al.25). This is in
contrast with earlier indoor reports, which concentrated on
a more limited range of mycotoxins. The samples were further
analysed with a quadrupole time-of-flight (Q-TOF) MS, to
identify less studied fungal metabolites. Since several authors
reported many errors in literature concerning fungal identifica-
tions and hence the connection between mycotoxins and the
source of the toxins,14,26 substantial efforts were devoted to the
establishment of optimal sample collection procedures and
fungal identification protocols.
Materials and methods
Reagents
Methanol (VWR International, Zaventem, Belgium), acetonitrile
(Biosolve BV, Valkenswaard, The Netherlands), stabilized
dichloromethane and ethyl acetate 99.5+% (Acros Organics,
Geel, Belgium) were high-performance liquid chromatography
grade. Water was obtained from a Milli-Q Gradient System
(Millipore, Brussels, Belgium) and formic acid from Acros
Organics. Ammonium acetate was supplied by Grauwmeer
(Leuven, Belgium) and anhydrous sodium acetate by Merck
(Darmstadt, Germany). Standards of nivalenol (NIV), deoxy-
nivalenol (DON), T-2 toxin (T-2), verrucarin A (VERA), ver-
rucarol (VERO), ochratoxin A (OTA), aflatoxin B1 (AFB1),
aflatoxin B2 (AFB2), aflatoxin G1 (AFG1), aflatoxin G2 (AFG2),
zearalenone (ZEA), sterigmatocystin (STERO) and roridin A
(RORA) were provided by Sigma (Bornem, Belgium). Diac-
etoxyscirpenol (DAS), neosolaniol (NEO) and deepoxy-deoxy-
nivalenol (DOM) were obtained from Coring System Diagnostix
GmbH (Gernsheim, Germany). Satratoxin G (SATG), satra-
toxin H (SATH) and roridin E (RORE) were purchased from the
New-Zealand Government Research Organisation (Wellington).
Chaetoglobosin A (CHAETO) was provided by Alexis
Biochemicals (Lausen, Switzerland) and roquefortine C (ROQC)
by IRIS biotech GmbH (Marktredwitz, Germany). Stock solu-
tions were prepared in methanol and stored at �20 �C.
Sampling procedures
The sampling procedures were approved by the Ethical
Committee of the Ghent University Hospital (B6702006019,
17/07/2006). Samples were taken in mouldy interiors from 7
water-damaged buildings throughout Belgium (House n� 1 to 7).
Criteria of choice were: visible fungal growth for at least 1 m2 of
surface area and presence of malodour. In some cases, namely in
houses 1, 3 and 4, at least one of the inhabitants reported health
problems, mainly respiratory problems, starting after mould
growth. Instead, in building 2 (a library), where different stored
books were heavily contaminated by fungi, headache and dizzi-
ness were experienced both by the people who moved the books
This journal is ª The Royal Society of Chemistry 2009
Table 1 Summary of the samples collected from 7 water-damaged buildings (positive sample ¼ containing 1 or more mycotoxins)
Sampled place N� of samples taken Type of sample N� of positive samples per house Type of positive sample
House n� 1 16 2 Air 5 5 Wallpaper8 Dust6 Wallpaper
House n� 2 21 3 Air 12 1 Air3 Dust 11 Mycelium15 Mycelium
House n� 3 14 2 Air 10 10 Wallpaper2 Dust10 Wallpaper
House n� 4 11 2 Air 9 2 Air7 Dust 7 Dust2 Mycelium
House n� 5 13 3 Air 9 3 Air2 Dust 2 Dust4 Wallpaper 1 Wallpaper2 Mycelium 2 Mycelium2 Silicone 1 Silicone
House n� 6 12 4 Air 8 4 Air3 Dust 2 Dust5 Wallpaper 2 Wallpaper
House n� 7 12 4 Air 9 4 Air2 Dust 2 Dust6 Mycelium 3 Mycelium
Total number of samples 99 62
Publ
ishe
d on
20
July
200
9. D
ownl
oade
d by
Hog
esch
ool G
ent o
n 24
/04/
2014
09:
03:3
1.
View Article Online
in the sampled room and by both persons carrying out the
sampling only during the stay in the room. In addition, one
recently built house (1991) was chosen as a control because it was
a clean, smoke-free environment with no building-related
complaints by the inhabitants. Moreover, sampled house n� 4
was re-sampled only for VOCs after long ventilation and clean-
ing, since it was still sensory unpleasant. In all cases except for
house n� 1, relative humidity (RH) and temperature values were
recorded with a thermohygrometer (Lufft, Fellbach, Germany).
To sample visible fungal growth on surfaces, mycelium was
scraped off with a sterile disposable scalpel (Swann-Morton,
Sheffield, United Kingdom) and if not possible, mouldy wall-
paper or silicone from window sealings were cut away. For
fungal identification, mycelium was sampled by ‘‘stick-to-it’’ lift
tape (Procare, Groningen, The Netherlands). The tape was
pressed gently to the mycelium and pulled back.
Dust was collected with a Cyclone Surface Sampler from
Burkard Manufacturing Company Limited (Hertfordshire,
United Kingdom). The area of surface sampled was always
measured (cm2).
Airborne mycotoxins were collected in all houses with an
Airborne Sample Analysis Platform (ASAP) system model 2800
Bioaerosol sampler (Thermo, New York, USA). The instrument
was operated at a flow rate of 200 litres per min. Ambient
particles between 1 and 10 micron in diameter were collected on
polyurethane foam (PUF) (Thermo Scientific, USA) during
a period of 3.5 h, resembling the breathing of an average man
(moderate activity, 80 kg) during 24 h (assuming breathing of
28 L/min). These high flow rates enabled the collection of suffi-
cient mycotoxin concentrations in a relatively short time frame,
which was preferable for practical reasons (sampling in private
homes). The PUF substrate was enclosed in a self-sealing
collection module called Intergrated Bio Aerosol Smart Sample
(iBASS� cartridge) (Thermo, New York, USA), in which two
This journal is ª The Royal Society of Chemistry 2009
PUF strips are sampled simultaneously. All samples described
(Table 1) were extracted for mycotoxin analysis with LC-MS/MS
and, afterwards, 23 of the samples were additionally analysed
with LC-Q-TOF-MS.
The (M)VOCs in the houses were sampled by dynamic head-
space absorption on Tenax and by solid-phase microextraction
(SPME) followed by gas chromatography-mass spectrometry
analysis. The 50/30 mm divinylbenzene/Carboxen/poly-
dimethylsiloxane (DVB/Car/PDMS) SPME fibre was purchased
from Supelco (Bornem, Belgium). The SPME fibre was exposed
to the mouldy environment for the longest time permitted, i.e.
30 minutes, 3.5 h or 24 h depending on the possibility to leave the
equipment in the buildings. The same sampling times were
applied to the dynamic headspace technique performed by means
of a hand-made pump to which a Tenax adsorption tube (length
18 cm, i.d. 4 mm, o.d. 6 mm) was attached, filled with 250 mg of
Tenax TA 60/80 mesh (Supelco, Bellefonte PA, USA).
Analytical procedures
Fungal identification. Mycelium was eluted from stick-to-it lift
tape by using sterile water that was dropped in peptone penta-
chloronitrobenzene agar and potato dextrose agar (PDA) con-
taining Petri dishes (three replicates for each sample and each
substrate). All growing colonies were purified and transferred on
malt extract agar, potato dextrose agar, water agar, yeast extract
agar, or Czapek agar substrates according to a previous genus
identification of the growing colonies, and then morphologically
identified at the species level.27
Further, fungal strains were cultured for 48 hours with
shaking (125 rpm) at 25 �C in 100 mL of Wikerham’s medium
(4% D-glucose, 0.5% peptone, 0.3% yeast extract, 0.3% malt
extract). The mycelium was vacuum-filtered on Whatman n� 4
filter paper and washed with distilled water, frozen (�20 �C) and
J. Environ. Monit., 2009, 11, 1849–1858 | 1851
Publ
ishe
d on
20
July
200
9. D
ownl
oade
d by
Hog
esch
ool G
ent o
n 24
/04/
2014
09:
03:3
1.
View Article Online
lyophilized. Lyophilized mycelium powder was used for genomic
DNA isolation, according to the E.Z.N.A. Fungal DNA
Miniprep Kit (Omega Bio-tek, Doraville, GA) instructions.
Extracted DNA was dissolved in 100 mL of sterile water and
stored at �20 �C. DNA concentrations were estimated using
a DNA ladder and electrophoresis.
Sequence analysis was performed in order to confirm the
identity of the strains established by morphological analysis. The
species identification of the strains was obtained by sequencing
a region of the b-tubulin gene by using primers Bt2a28 and T2.29
Glass and Donaldson28 and O’Donnell and Cigelnik29 developed
a series of primers for amplifying b-tubulin from filamentous
fungi, able to amplify different fungal genera, and therefore
suitable for identification of a large spectrum of fungi. Poly-
merase chain reaction (PCR) was performed using the following
conditions: denaturation at 94 �C for 10 min; 35 cycles of
denaturation at 94 �C for 50 s, annealing at 53 �C for 50 s,
extension at 72 �C for 1 min; final extension at 72 �C for 7 min,
followed by cooling at 4 �C until recovery of the samples.
Amplification of a 400 bp product was verified via gel electro-
phoresis on a 1.5% agar gel. Once verified, PCR products were
purified by filtration through Sephadex G-50 medium (Sigma)
prior to DNA sequencing. Sequence analysis was performed with
the Big Dye Terminator Cycle Sequencing Ready Reaction Kit
for both strands (Applied Biosystems). The resulting sequences of
all the isolates and reference strains were aligned by the Clustal
method with DNAMAN (version 5.2.9, Lynnon Biosoft) or
Bioedit (version 7.0.5, Ibis Therapeutics Carlsband, CA 92008)
software. The b-tubulin homology sequences were searched per-
forming a pairwise method in DDBJ/EMBL/GenBank Interna-
tional Nucleotide databases using Basic Local Alignments Search
Tool (BLAST) at http://www.ncbi.nlm.nih.gov/blast/.
Mycotoxin analysis by means of LC-MS. Extraction of PUF
(air) and silicone samples was performed in a Gosselin tube
(Nunc, Wiesbaden, Germany) by adding 15 mL of methanol:
water (90:10 v/v) to the sample. After shaking for 15 min on
a horizontal Mini Shaker S03 (Orbital, Stuart Scientific, Surrey,
England), the extract was removed and kept separate, followed by
addition of 15 mL of dichloromethane:ethyl acetate (50:50 v/v) to
the sample and shaking for 15 minutes. The dichlor-
omethane:ethyl acetate layer was combined with the methanol:
water layer and filtered through a folded paper filter, sort 15,
provided by VWR International (Zaventem, Belgium). After
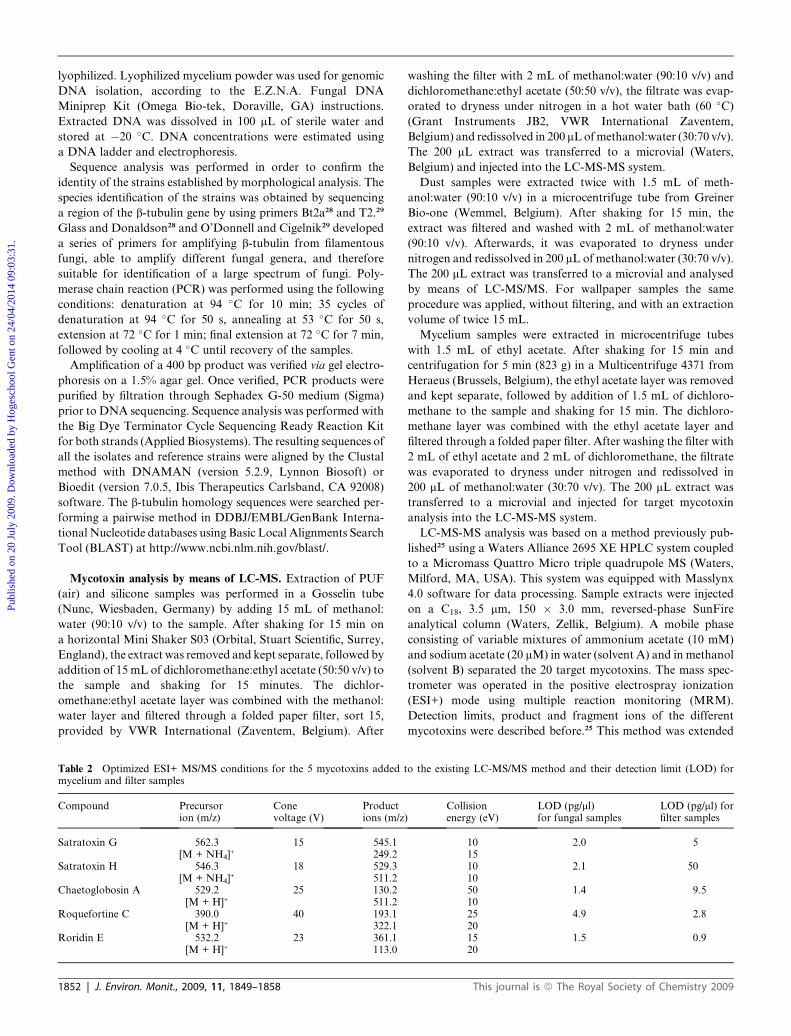
Table 2 Optimized ESI+ MS/MS conditions for the 5 mycotoxins added tmycelium and filter samples
Compound Precursorion (m/z)
Conevoltage (V)
Productions (m/z)
Satratoxin G 562.3 15 545.1[M + NH4]+ 249.2
Satratoxin H 546.3 18 529.3[M + NH4]+ 511.2
Chaetoglobosin A 529.2 25 130.2[M + H]+ 511.2
Roquefortine C 390.0 40 193.1[M + H]+ 322.1
Roridin E 532.2 23 361.1[M + H]+ 113.0
1852 | J. Environ. Monit., 2009, 11, 1849–1858
washing the filter with 2 mL of methanol:water (90:10 v/v) and
dichloromethane:ethyl acetate (50:50 v/v), the filtrate was evap-
orated to dryness under nitrogen in a hot water bath (60 �C)
(Grant Instruments JB2, VWR International Zaventem,
Belgium) and redissolved in 200 mL of methanol:water (30:70 v/v).
The 200 mL extract was transferred to a microvial (Waters,
Belgium) and injected into the LC-MS-MS system.
Dust samples were extracted twice with 1.5 mL of meth-
anol:water (90:10 v/v) in a microcentrifuge tube from Greiner
Bio-one (Wemmel, Belgium). After shaking for 15 min, the
extract was filtered and washed with 2 mL of methanol:water
(90:10 v/v). Afterwards, it was evaporated to dryness under
nitrogen and redissolved in 200 mL of methanol:water (30:70 v/v).
The 200 mL extract was transferred to a microvial and analysed
by means of LC-MS/MS. For wallpaper samples the same
procedure was applied, without filtering, and with an extraction
volume of twice 15 mL.
Mycelium samples were extracted in microcentrifuge tubes
with 1.5 mL of ethyl acetate. After shaking for 15 min and
centrifugation for 5 min (823 g) in a Multicentrifuge 4371 from
Heraeus (Brussels, Belgium), the ethyl acetate layer was removed
and kept separate, followed by addition of 1.5 mL of dichloro-
methane to the sample and shaking for 15 min. The dichloro-
methane layer was combined with the ethyl acetate layer and
filtered through a folded paper filter. After washing the filter with
2 mL of ethyl acetate and 2 mL of dichloromethane, the filtrate
was evaporated to dryness under nitrogen and redissolved in
200 mL of methanol:water (30:70 v/v). The 200 mL extract was
transferred to a microvial and injected for target mycotoxin
analysis into the LC-MS-MS system.
LC-MS-MS analysis was based on a method previously pub-
lished25 using a Waters Alliance 2695 XE HPLC system coupled
to a Micromass Quattro Micro triple quadrupole MS (Waters,
Milford, MA, USA). This system was equipped with Masslynx
4.0 software for data processing. Sample extracts were injected
on a C18, 3.5 mm, 150 � 3.0 mm, reversed-phase SunFire
analytical column (Waters, Zellik, Belgium). A mobile phase
consisting of variable mixtures of ammonium acetate (10 mM)
and sodium acetate (20 mM) in water (solvent A) and in methanol
(solvent B) separated the 20 target mycotoxins. The mass spec-
trometer was operated in the positive electrospray ionization
(ESI+) mode using multiple reaction monitoring (MRM).
Detection limits, product and fragment ions of the different
mycotoxins were described before.25 This method was extended
o the existing LC-MS/MS method and their detection limit (LOD) for
Collisionenergy (eV)
LOD (pg/ml)for fungal samples
LOD (pg/ml) forfilter samples
10 2.0 51510 2.1 501050 1.4 9.51025 4.9 2.82015 1.5 0.920
This journal is ª The Royal Society of Chemistry 2009
Publ
ishe
d on
20
July
200
9. D
ownl
oade
d by
Hog
esch
ool G
ent o
n 24
/04/
2014
09:
03:3
1.
View Article Online
with five additional mycotoxins, the optimized ESI+ MS/MS
conditions and detection limits of which are shown in Table 2.
During the analysis, identification criteria according to the
‘Commission Decision 2002/657/EC’ were used, i.e. the presence
of the two selected fragment ions, relative retention time of the
analyte and relative ion intensities.30
Twenty-three of the 99 sample extracts were additionally
analysed by means of liquid chromatography quadrupole time-
of-flight mass spectrometry (LC-Q-TOF-MS). An Alliance 2690
(LC) system was coupled to a micro quadrupole orthogonal
acceleration TOF-MS (Waters, Milford, MA, USA) equipped
with an orthogonal electrospray source (Z-spray�). An Atlantis
dC18 column, 3 mm, 150� 2.1 mm (Waters, Milford, MA, USA),
was used to analyse the same samples in scan mode. A mobile
phase of variable mixtures of formic acid (10 mM) in water
(solvent A) and formic acid (10 mM) in acetonitrile (solvent B)
was used. Compounds with m/z between 100 and 800 were
recorded in ESI + scan mode at a scan accumulation time of
2.0 sec and an interscan time of 0.1 sec. First, a standard mix was
analysed to check the masses of known mycotoxins. Afterwards,
the samples were analysed and the accurate masses of the
compounds present were measured in comparison with the
standard mycotoxin DOM, used as the internal lock mass. These
masses were manually annotated using accurate mass listings.14,31
(M)VOC analysis by means of GC-MS. The SPME desorption
was performed for 2 min in the inlet of an Agilent 6890 Gas
Chromatograph (GC) Plus (Agilent Technologies, Diegem,
Belgium) coupled with a quadrupole mass spectrometer HP 5973
Mass Selective Detector (MSD), equipped with a programmed
temperature vaporizer (CIS-4 PTV) injector (Gerstel, M€ulheim
a/d Ruhr, Germany), and a HP5-MS capillary column (30 m �0.25 mm i.d.; coating thickness 0.25 mm). Working conditions
were as follows: injector temperature 250 �C, transfer line
temperature 250 �C, oven temperature: start 35 �C, hold 5 min,
programmed from 35–120 �C at 5 �C min�1, from 120–280 �C at
20 �C min�1, hold 3 min; carrier gas (He) 1.2 mL min�1; splitless
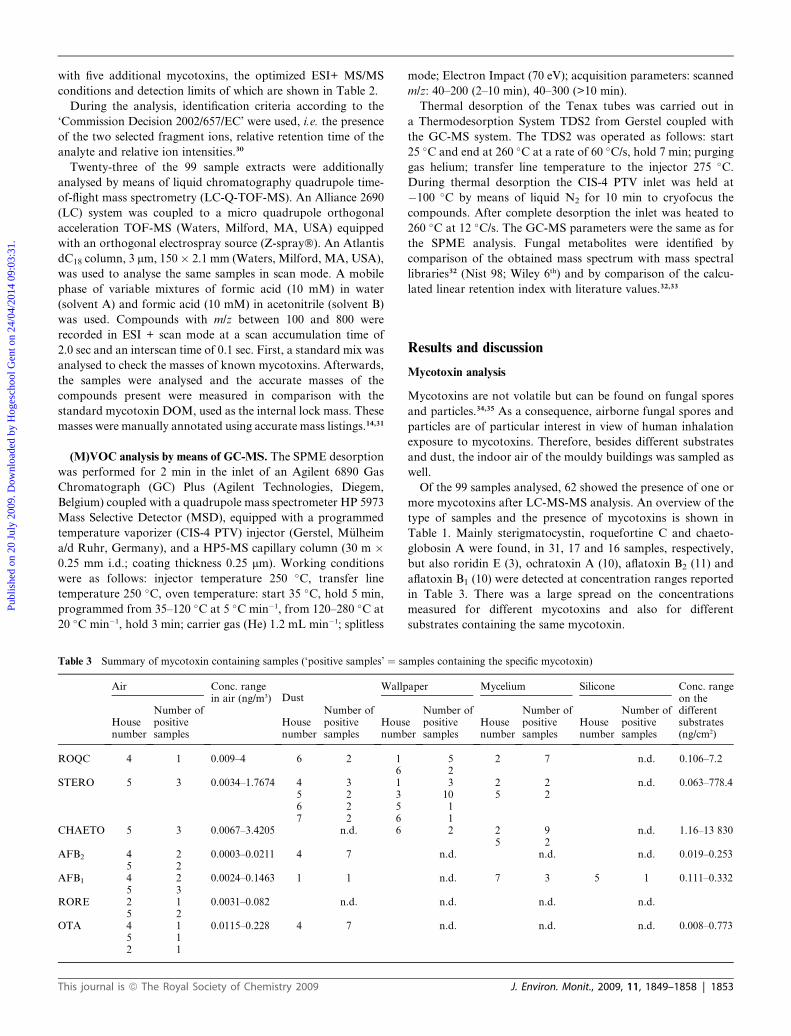
Table 3 Summary of mycotoxin containing samples (‘positive samples’ ¼ sa
Air Conc. rangein air (ng/m3) Dust
Wallp
Housenumber
Number ofpositivesamples
Housenumber
Number ofpositivesamples
Housnumb
ROQC 4 1 0.009–4 6 2 16
STERO 5 3 0.0034–1.7674 4 3 15 2 36 2 57 2 6
CHAETO 5 3 0.0067–3.4205 n.d. 6
AFB2 4 2 0.0003–0.0211 4 75 2
AFB1 4 2 0.0024–0.1463 1 15 3
RORE 2 1 0.0031–0.082 n.d.5 2
OTA 4 1 0.0115–0.228 4 75 12 1
This journal is ª The Royal Society of Chemistry 2009
mode; Electron Impact (70 eV); acquisition parameters: scanned
m/z: 40–200 (2–10 min), 40–300 (>10 min).
Thermal desorption of the Tenax tubes was carried out in
a Thermodesorption System TDS2 from Gerstel coupled with
the GC-MS system. The TDS2 was operated as follows: start
25 �C and end at 260 �C at a rate of 60 �C/s, hold 7 min; purging
gas helium; transfer line temperature to the injector 275 �C.
During thermal desorption the CIS-4 PTV inlet was held at
�100 �C by means of liquid N2 for 10 min to cryofocus the
compounds. After complete desorption the inlet was heated to
260 �C at 12 �C/s. The GC-MS parameters were the same as for
the SPME analysis. Fungal metabolites were identified by
comparison of the obtained mass spectrum with mass spectral
libraries32 (Nist 98; Wiley 6th) and by comparison of the calcu-
lated linear retention index with literature values.32,33
Results and discussion
Mycotoxin analysis
Mycotoxins are not volatile but can be found on fungal spores
and particles.34,35 As a consequence, airborne fungal spores and
particles are of particular interest in view of human inhalation
exposure to mycotoxins. Therefore, besides different substrates
and dust, the indoor air of the mouldy buildings was sampled as
well.
Of the 99 samples analysed, 62 showed the presence of one or
more mycotoxins after LC-MS-MS analysis. An overview of the
type of samples and the presence of mycotoxins is shown in
Table 1. Mainly sterigmatocystin, roquefortine C and chaeto-
globosin A were found, in 31, 17 and 16 samples, respectively,
but also roridin E (3), ochratoxin A (10), aflatoxin B2 (11) and
aflatoxin B1 (10) were detected at concentration ranges reported
in Table 3. There was a large spread on the concentrations
measured for different mycotoxins and also for different
substrates containing the same mycotoxin.
mples containing the specific mycotoxin)
aper Mycelium Silicone Conc. rangeon thedifferentsubstrates(ng/cm2)
eer
Number ofpositivesamples
Housenumber
Number ofpositivesamples
Housenumber
Number ofpositivesamples
5 2 7 n.d. 0.106–7.223 2 2 n.d. 0.063–778.4
10 5 2112 2 9 n.d. 1.16–13 830
5 2n.d. n.d. n.d. 0.019–0.253
n.d. 7 3 5 1 0.111–0.332
n.d. n.d. n.d.
n.d. n.d. n.d. 0.008–0.773
J. Environ. Monit., 2009, 11, 1849–1858 | 1853

Table 4 Overview of the 2 � 5 contingency tables for all mycotoxins (observed counts) against the expected counts assuming the null hypothesis
Observed counts Expected counts
Air Wallpaper Mycelium Dust Silicone Air Wallpaper Mycelium Dust Silicone
STERO Present 3 15 4 9 0 6 10 7 7 0.5Absent 9 5 10 4 1 6 10 7 6 0.5
CHAETO Present 3 2 11 0 0 3 5 4 3.5 0.3Absent 9 18 3 13 1 9 15 10 9.5 0.7
ROQC Present 1 7 7 2 0 3 6 4 3 0.3Absent 11 13 7 11 1 9 14 10 10 0.8
AFB2 Present 4 0 0 7 0 2 4 3 2 0.2Absent 8 20 14 6 1 10 16 11 11 0.8
AFB1 Present 5 0 3 1 1 2 3 2 2 0.2Absent 7 20 11 12 0 10 17 12 11 0.8
RORE Present 3 0 0 0 0 1 1 1 1 0.1Absent 9 20 14 13 1 11 19 13 12 0.9
OTA Present 3 0 0 7 0 2 3 2 2 0.2Absent 9 20 14 6 1 10 17 12 11 0.8
Table 5 Mycotoxin incidence for a specific sample (mycelium, wallpaper, air, dust or silicone)
P-value Pearson residualsAir Wallpaper Mycelium Dust Silicone
STERO 0.00629 �1.29 1.45 �1.2 0.88 �0.72CHAETO <0.0001 �0.11 �1.44 3.76 �1.86 �0.52ROQC 0.102 �1.3 0.5 1.52 �0.88 �0.53AFB2 <0.0001 1.2 �1.9 �1.6 2.99 �0.42AFB1 0.0016 2.12 �1.82 0.43 �0.79 2RORE 0.0336 3.10 �1.00 �0.84 �0.81 �0.22OTA <0.0001 0.71 �1.83 �1.53 3.28 �0.41
Publ
ishe
d on
20
July
200
9. D
ownl
oade
d by
Hog
esch
ool G
ent o
n 24
/04/
2014
09:
03:3
1.
View Article Online
Furthermore, the incidence of the detected mycotoxins for
each specific kind of substrate was investigated. For each
mycotoxin a 2 � 5 contingency table was constructed (Table 4).
To assess whether there was a significant association between the
incidence of the mycotoxin and the type of sample (air, wall-
paper, mycelium, dust or silicone), Fisher’s exact test was applied
using a network algorithm36 (Table 5). If the p-value was lower
than 0.05, the null hypothesis (‘‘there is no association between
mycotoxin incidence and type of sample’’) was rejected. In this
case, it is informative to inspect the Pearson residuals (Table 5).
Positive values indicate that more incidences are observed than
expected. For sterigmatocystin, for example, significant associ-
ations with the five types of samples were found. As can be seen
from the Pearson residuals, this was mostly due to its high inci-
dence in wallpaper and the low incidence in mycelium. On the
other hand, chaetoglobosin A showed a significant association
with mycelium. For roquefortine C, no association was observed.
Aflatoxin B2 was found in air and dust and was absent in wall-
paper and mycelium. Aflatoxin B1 as well was mainly present in
air. Since aflatoxins are classified by the International Agency for
Research on Cancer (IARC) as group 1 carcinogens, their pres-
ence in the indoor air of water-damaged interiors, is of serious
concern. Roridin E belongs to the toxic trichothecene group and
was again mostly found in air. Ochratoxin A is classified by
IARC in group 2B ‘possibly carcinogenic to humans’ and was in
our study mostly observed in respirable dust.
These results demonstrate the presence of mycotoxins in air,
settled dust and mycelium in indoor environments, thus
1854 | J. Environ. Monit., 2009, 11, 1849–1858
involving a potential health hazard for inhabitants of mouldy
water-damaged houses. However, no risk assessment has been
performed so far for human inhalational exposure to myco-
toxins. Nevertheless, health problems caused by inhaled myco-
toxins tend to be more serious than those caused by mycotoxins
absorbed via the digestive tract and the skin.7,37–39 Creasia et al.40
showed that mycotoxins can be 10 times more toxic through
inhalation than by oral intake. The mechanism of toxicity was
not elucidated, but a higher resorption rate of the toxins in the
lungs as compared to in the bowels and a first pass effect in the
liver after enteric resorption were discussed.37,40
In several cases, different mycotoxins were present in one
single sample. To date little is known on synergistic or antago-
nistic effects of simultaneous exposure to mycotoxins.37,39 Several
authors suggested the synergistic interaction between different
exposure agents as a biologically plausible theory that could
explain adverse health effects experienced at fairly low indoor
airborne microbial concentrations.38,41 Nielsen et al.42 suggested
synergistic effects of mycotoxins together with other biologically
active metabolites (e.g. endotoxins, bacteria, mites). Recent
reports have shown synergistic effects in cytotoxicity and
apoptosis mechanisms in mouse macrophages challenged by
spore extracts from co-cultures of S. chartarum and Aspergillus
versicolor.43
As LC-MS-MS only allows screening for target compounds
that are determined in advance, 23 of the 99 sample extracts were
additionally analysed by means of LC-Q-TOF-MS. In these
samples, 42 fungal metabolites with a molecular mass ranging
This journal is ª The Royal Society of Chemistry 2009
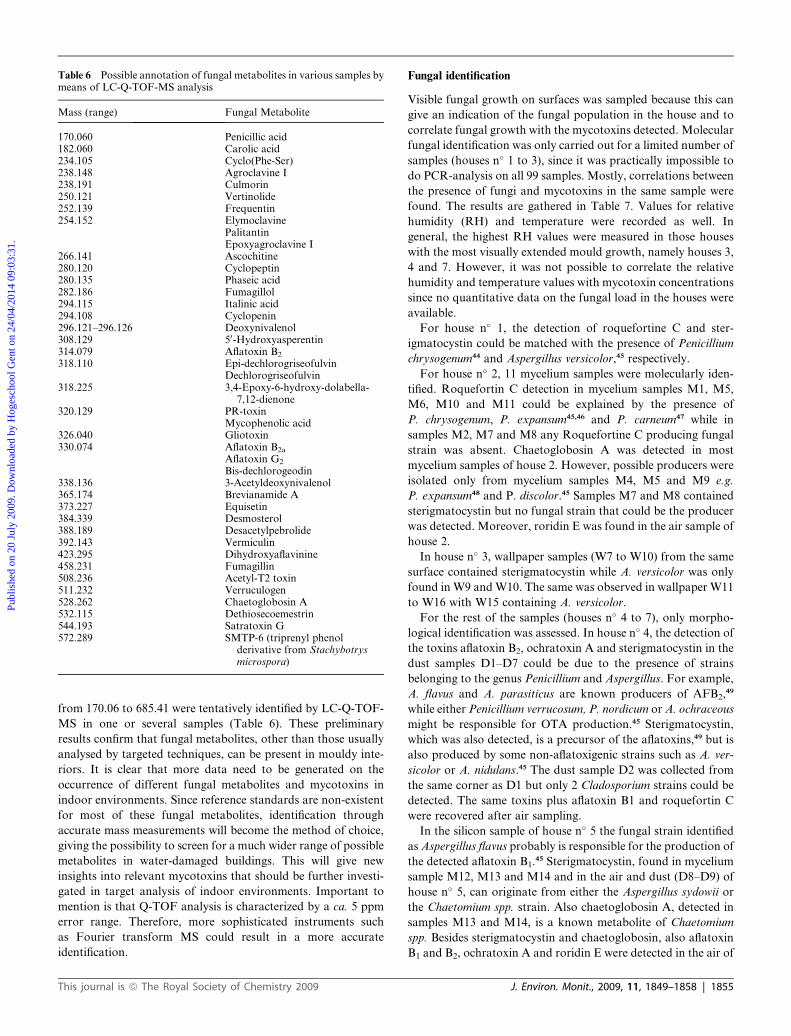
Table 6 Possible annotation of fungal metabolites in various samples bymeans of LC-Q-TOF-MS analysis
Mass (range) Fungal Metabolite
170.060 Penicillic acid182.060 Carolic acid234.105 Cyclo(Phe-Ser)238.148 Agroclavine I238.191 Culmorin250.121 Vertinolide252.139 Frequentin254.152 Elymoclavine
PalitantinEpoxyagroclavine I
266.141 Ascochitine280.120 Cyclopeptin280.135 Phaseic acid282.186 Fumagillol294.115 Italinic acid294.108 Cyclopenin296.121–296.126 Deoxynivalenol308.129 50-Hydroxyasperentin314.079 Aflatoxin B2
318.110 Epi-dechlorogriseofulvinDechlorogriseofulvin
318.225 3,4-Epoxy-6-hydroxy-dolabella-7,12-dienone
320.129 PR-toxinMycophenolic acid
326.040 Gliotoxin330.074 Aflatoxin B2a
Aflatoxin G2
Bis-dechlorogeodin338.136 3-Acetyldeoxynivalenol365.174 Brevianamide A373.227 Equisetin384.339 Desmosterol388.189 Desacetylpebrolide392.143 Vermiculin423.295 Dihydroxyaflavinine458.231 Fumagillin508.236 Acetyl-T2 toxin511.232 Verruculogen528.262 Chaetoglobosin A532.115 Dethiosecoemestrin544.193 Satratoxin G572.289 SMTP-6 (triprenyl phenol
derivative from Stachybotrysmicrospora)
Publ
ishe
d on
20
July
200
9. D
ownl
oade
d by
Hog
esch
ool G
ent o
n 24
/04/
2014
09:
03:3
1.
View Article Online
from 170.06 to 685.41 were tentatively identified by LC-Q-TOF-
MS in one or several samples (Table 6). These preliminary
results confirm that fungal metabolites, other than those usually
analysed by targeted techniques, can be present in mouldy inte-
riors. It is clear that more data need to be generated on the
occurrence of different fungal metabolites and mycotoxins in
indoor environments. Since reference standards are non-existent
for most of these fungal metabolites, identification through
accurate mass measurements will become the method of choice,
giving the possibility to screen for a much wider range of possible
metabolites in water-damaged buildings. This will give new
insights into relevant mycotoxins that should be further investi-
gated in target analysis of indoor environments. Important to
mention is that Q-TOF analysis is characterized by a ca. 5 ppm
error range. Therefore, more sophisticated instruments such
as Fourier transform MS could result in a more accurate
identification.
This journal is ª The Royal Society of Chemistry 2009
Fungal identification
Visible fungal growth on surfaces was sampled because this can
give an indication of the fungal population in the house and to
correlate fungal growth with the mycotoxins detected. Molecular
fungal identification was only carried out for a limited number of
samples (houses n� 1 to 3), since it was practically impossible to
do PCR-analysis on all 99 samples. Mostly, correlations between
the presence of fungi and mycotoxins in the same sample were
found. The results are gathered in Table 7. Values for relative
humidity (RH) and temperature were recorded as well. In
general, the highest RH values were measured in those houses
with the most visually extended mould growth, namely houses 3,
4 and 7. However, it was not possible to correlate the relative
humidity and temperature values with mycotoxin concentrations
since no quantitative data on the fungal load in the houses were
available.
For house n� 1, the detection of roquefortine C and ster-
igmatocystin could be matched with the presence of Penicillium
chrysogenum44 and Aspergillus versicolor,45 respectively.
For house n� 2, 11 mycelium samples were molecularly iden-
tified. Roquefortin C detection in mycelium samples M1, M5,
M6, M10 and M11 could be explained by the presence of
P. chrysogenum, P. expansum45,46 and P. carneum47 while in
samples M2, M7 and M8 any Roquefortine C producing fungal
strain was absent. Chaetoglobosin A was detected in most
mycelium samples of house 2. However, possible producers were
isolated only from mycelium samples M4, M5 and M9 e.g.
P. expansum48 and P. discolor.45 Samples M7 and M8 contained
sterigmatocystin but no fungal strain that could be the producer
was detected. Moreover, roridin E was found in the air sample of
house 2.
In house n� 3, wallpaper samples (W7 to W10) from the same
surface contained sterigmatocystin while A. versicolor was only
found in W9 and W10. The same was observed in wallpaper W11
to W16 with W15 containing A. versicolor.
For the rest of the samples (houses n� 4 to 7), only morpho-
logical identification was assessed. In house n� 4, the detection of
the toxins aflatoxin B2, ochratoxin A and sterigmatocystin in the
dust samples D1–D7 could be due to the presence of strains
belonging to the genus Penicillium and Aspergillus. For example,
A. flavus and A. parasiticus are known producers of AFB2,49
while either Penicillium verrucosum, P. nordicum or A. ochraceous
might be responsible for OTA production.45 Sterigmatocystin,
which was also detected, is a precursor of the aflatoxins,49 but is
also produced by some non-aflatoxigenic strains such as A. ver-
sicolor or A. nidulans.45 The dust sample D2 was collected from
the same corner as D1 but only 2 Cladosporium strains could be
detected. The same toxins plus aflatoxin B1 and roquefortin C
were recovered after air sampling.
In the silicon sample of house n� 5 the fungal strain identified
as Aspergillus flavus probably is responsible for the production of
the detected aflatoxin B1.45 Sterigmatocystin, found in mycelium
sample M12, M13 and M14 and in the air and dust (D8–D9) of
house n� 5, can originate from either the Aspergillus sydowii or
the Chaetomium spp. strain. Also chaetoglobosin A, detected in
samples M13 and M14, is a known metabolite of Chaetomium
spp. Besides sterigmatocystin and chaetoglobosin, also aflatoxin
B1 and B2, ochratoxin A and roridin E were detected in the air of
J. Environ. Monit., 2009, 11, 1849–1858 | 1855
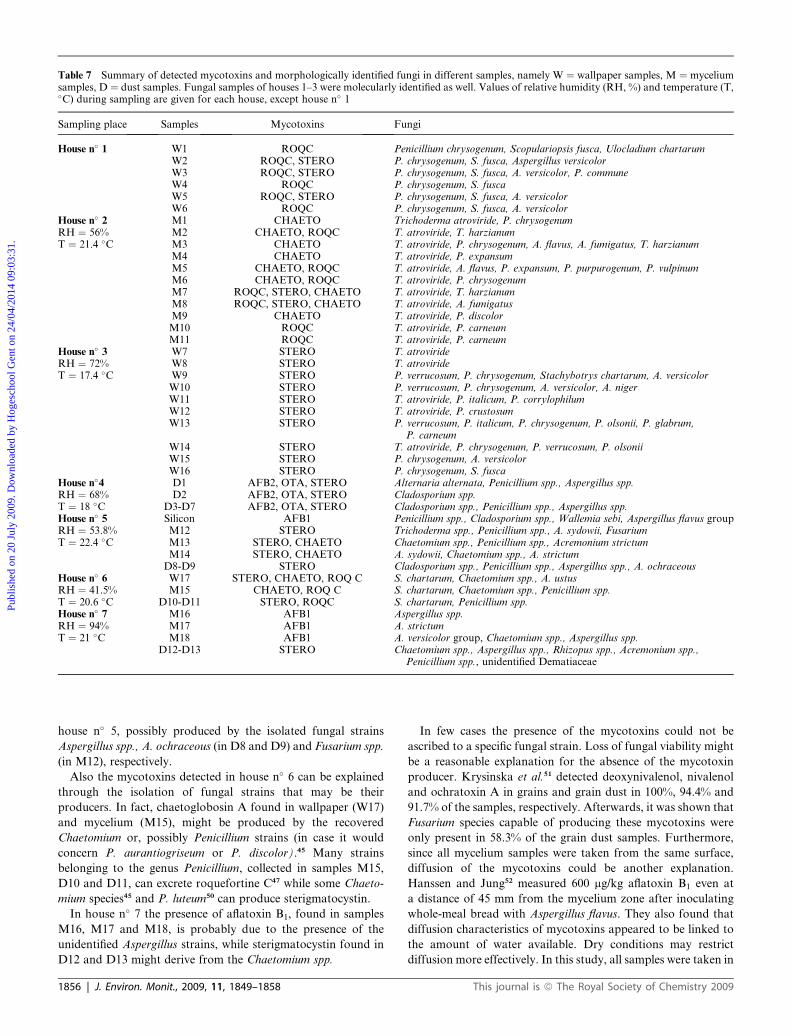
Table 7 Summary of detected mycotoxins and morphologically identified fungi in different samples, namely W ¼ wallpaper samples, M ¼ myceliumsamples, D ¼ dust samples. Fungal samples of houses 1–3 were molecularly identified as well. Values of relative humidity (RH, %) and temperature (T,�C) during sampling are given for each house, except house n� 1
Sampling place Samples Mycotoxins Fungi
House n� 1 W1 ROQC Penicillium chrysogenum, Scopulariopsis fusca, Ulocladium chartarumW2 ROQC, STERO P. chrysogenum, S. fusca, Aspergillus versicolorW3 ROQC, STERO P. chrysogenum, S. fusca, A. versicolor, P. communeW4 ROQC P. chrysogenum, S. fuscaW5 ROQC, STERO P. chrysogenum, S. fusca, A. versicolorW6 ROQC P. chrysogenum, S. fusca, A. versicolor
House n� 2 M1 CHAETO Trichoderma atroviride, P. chrysogenumRH ¼ 56% M2 CHAETO, ROQC T. atroviride, T. harzianumT ¼ 21.4 �C M3 CHAETO T. atroviride, P. chrysogenum, A. flavus, A. fumigatus, T. harzianum
M4 CHAETO T. atroviride, P. expansumM5 CHAETO, ROQC T. atroviride, A. flavus, P. expansum, P. purpurogenum, P. vulpinumM6 CHAETO, ROQC T. atroviride, P. chrysogenumM7 ROQC, STERO, CHAETO T. atroviride, T. harzianumM8 ROQC, STERO, CHAETO T. atroviride, A. fumigatusM9 CHAETO T. atroviride, P. discolorM10 ROQC T. atroviride, P. carneumM11 ROQC T. atroviride, P. carneum
House n� 3 W7 STERO T. atrovirideRH ¼ 72% W8 STERO T. atrovirideT ¼ 17.4 �C W9 STERO P. verrucosum, P. chrysogenum, Stachybotrys chartarum, A. versicolor
W10 STERO P. verrucosum, P. chrysogenum, A. versicolor, A. nigerW11 STERO T. atroviride, P. italicum, P. corrylophilumW12 STERO T. atroviride, P. crustosumW13 STERO P. verrucosum, P. italicum, P. chrysogenum, P. olsonii, P. glabrum,
P. carneumW14 STERO T. atroviride, P. chrysogenum, P. verrucosum, P. olsoniiW15 STERO P. chrysogenum, A. versicolorW16 STERO P. chrysogenum, S. fusca
House n�4 D1 AFB2, OTA, STERO Alternaria alternata, Penicillium spp., Aspergillus spp.RH ¼ 68% D2 AFB2, OTA, STERO Cladosporium spp.T ¼ 18 �C D3-D7 AFB2, OTA, STERO Cladosporium spp., Penicillium spp., Aspergillus spp.House n� 5 Silicon AFB1 Penicillium spp., Cladosporium spp., Wallemia sebi, Aspergillus flavus groupRH ¼ 53.8% M12 STERO Trichoderma spp., Penicillium spp., A. sydowii, FusariumT ¼ 22.4 �C M13 STERO, CHAETO Chaetomium spp., Penicillium spp., Acremonium strictum
M14 STERO, CHAETO A. sydowii, Chaetomium spp., A. strictumD8-D9 STERO Cladosporium spp., Penicillium spp., Aspergillus spp., A. ochraceous
House n� 6 W17 STERO, CHAETO, ROQ C S. chartarum, Chaetomium spp., A. ustusRH ¼ 41.5% M15 CHAETO, ROQ C S. chartarum, Chaetomium spp., Penicillium spp.T ¼ 20.6 �C D10-D11 STERO, ROQC S. chartarum, Penicillium spp.House n� 7 M16 AFB1 Aspergillus spp.RH ¼ 94% M17 AFB1 A. strictumT ¼ 21 �C M18 AFB1 A. versicolor group, Chaetomium spp., Aspergillus spp.
D12-D13 STERO Chaetomium spp., Aspergillus spp., Rhizopus spp., Acremonium spp.,Penicillium spp., unidentified Dematiaceae
Publ
ishe
d on
20
July
200
9. D
ownl
oade
d by
Hog
esch
ool G
ent o
n 24
/04/
2014
09:
03:3
1.
View Article Online
house n� 5, possibly produced by the isolated fungal strains
Aspergillus spp., A. ochraceous (in D8 and D9) and Fusarium spp.
(in M12), respectively.
Also the mycotoxins detected in house n� 6 can be explained
through the isolation of fungal strains that may be their
producers. In fact, chaetoglobosin A found in wallpaper (W17)
and mycelium (M15), might be produced by the recovered
Chaetomium or, possibly Penicillium strains (in case it would
concern P. aurantiogriseum or P. discolor).45 Many strains
belonging to the genus Penicillium, collected in samples M15,
D10 and D11, can excrete roquefortine C47 while some Chaeto-
mium species45 and P. luteum50 can produce sterigmatocystin.
In house n� 7 the presence of aflatoxin B1, found in samples
M16, M17 and M18, is probably due to the presence of the
unidentified Aspergillus strains, while sterigmatocystin found in
D12 and D13 might derive from the Chaetomium spp.
1856 | J. Environ. Monit., 2009, 11, 1849–1858
In few cases the presence of the mycotoxins could not be
ascribed to a specific fungal strain. Loss of fungal viability might
be a reasonable explanation for the absence of the mycotoxin
producer. Krysinska et al.51 detected deoxynivalenol, nivalenol
and ochratoxin A in grains and grain dust in 100%, 94.4% and
91.7% of the samples, respectively. Afterwards, it was shown that
Fusarium species capable of producing these mycotoxins were
only present in 58.3% of the grain dust samples. Furthermore,
since all mycelium samples were taken from the same surface,
diffusion of the mycotoxins could be another explanation.
Hanssen and Jung52 measured 600 mg/kg aflatoxin B1 even at
a distance of 45 mm from the mycelium zone after inoculating
whole-meal bread with Aspergillus flavus. They also found that
diffusion characteristics of mycotoxins appeared to be linked to
the amount of water available. Dry conditions may restrict
diffusion more effectively. In this study, all samples were taken in
This journal is ª The Royal Society of Chemistry 2009
Publ
ishe
d on
20
July
200
9. D
ownl
oade
d by
Hog
esch
ool G
ent o
n 24
/04/
2014
09:
03:3
1.
View Article Online
water-damaged houses with a high relative humidity, which
makes diffusion of mycotoxins possible. The most common
fungal species isolated from the seven sampled mouldy buildings
were Penicillium chrysogenum, Aspergillus versicolor (group),
Chaetomium spp. and Cladosporium spp.
(M)VOC analysis
In addition to mycotoxins and fungal species, volatile organic
compounds were sampled since it has been suggested that fungal
volatiles may be useful in the early detection of mould growth
and/or mycotoxin production.15,24
117 (M)VOCs were identified in the indoor air of the 9
buildings sampled (7 mouldy interiors, 1 control house and house
n� 4 after cleaning) (data not shown). The sampling technique
that yielded the highest (M)VOC concentrations and the best
peak shape was the dynamic headspace absorption on Tenax.
SPME-GC-MS confirmed the presence of almost all compounds.
When an environment was sampled twice, a longer sampling time
was shown to allow detection of more volatiles.
In the control house, the (M)VOC concentration was higher
than in the mouldy interiors, which can be due to the fact that
a more recent building emits more VOCs than an established
one.22,53 The concentration of M(VOC)s was also higher in house
n� 4 after cleaning than when evident mould growth and high
humidity were present. This is in agreement with some studies
where the sum of VOCs in reported ‘healthy’ buildings appeared
to be higher or equal to that measured in ‘sick’ buildings.54
Common (M)VOCs found in the seven mouldy buildings were
toluene, ethylbenzene, xylenes, 1-ethyl-2-methylbenzene and 2,6-
di-tert-butyl-4-methylphenol. Limonene, a-pinene, nonanal,
decanal, 2-methyl-3-(4-tert-butylphenyl)propanal, 1,3,5-trime-
thylbenzene and linear saturated alkanes (C9–C17) were also
found in the control house. Most of these compounds have been
described in a study in literature, where 2103 dwellings were
sampled for VOCs.55,56 Styrene,57 1,3-dimethylbenzene, trime-
thylbenzene, nonanal,58 2,6-di-tert-butyl-4-methylphenol, long-
ifolene, pinenes, limonene, ethylbenzene, toluene, octane and
nonane59 can be derived from the isolated fungal species. To
study the origin of these compounds, fungal species isolated from
the contaminated building materials are currently under
screening for VOC production. So far however, none of the
compounds detected is surely produced by the isolated fungi or
can be held responsible for the mouldy odour. Organic
compounds that are responsible for this odour may be present in
concentrations too low to be collected and/or identified by
standard analytical techniques.22
Conclusions
This is a first report on the simultaneous analysis of fungi,
mycotoxins and (M)VOCs in mouldy interiors. The occurrence
of mycotoxins in buildings is demonstrated. In general, the
fungal strains identified matched well with the mycotoxins
detected. However, it is not possible to evaluate the significance
of the detected mycotoxin concentrations due to the lack of
knowledge on the toxicity of mycotoxin inhalation. In addition,
due to the absence of quantitative data on fungal samples, only
the mycotoxin and (M)VOC presence and not the concentration
This journal is ª The Royal Society of Chemistry 2009
is discussed. Moreover, research is needed on the toxicity of co-
occurring indoor mycotoxins and other biologically active
agents. Since aflatoxin B1, aflatoxin B2, ochratoxin A and roridin
E found in indoor dust and air, may represent a health hazard,
studies concerning inhalational toxicity should address these
mycotoxins first.
At present, no mould-specific VOC was detected even in those
environments where a strong mouldy odour was present. The
presence of the majority of the (M)VOCs detected was in
agreement with other studies. These compounds were probably
emitted from building materials and cleaning products or were
infiltrations from the outdoor air. Many of them may cause
documented or suspected adverse health effects in humans.
Acknowledgements
This work was financially supported by the Research Founda-
tion – Flanders (FWO-Vlaanderen) (research project G.0034.07
and a postdoctoral fellowship of An Adams) and BOF UGent
(research project 015/102/07 and basic equipment 05B05106).
Special thanks to V. Ricci (ISPA-CNR, Italy) for his valuable
technical assistance. Also thanks to V. Vandecasteele and W.
Dubois (‘‘Vlaamse Overheid, Wonen – Vlaanderen’’, Belgium)
for the provision of water-damaged buildings, to Hamide
Senyuva (TUBITAK-ATAL, Turkey) for her valuable contri-
bution concerning the mycotoxin database.
References
1 C. G. Bornehag, J. Sundell, S. Bonini, A. Custovic, P. Malmberg,S. Skerfving, T. Sigsgaard and A. Verhoeff, Indoor Air, 2004, 14,243–257.
2 C. C. Chang, R. A. Ruhl, G. M. Halpern and M. E. Gershwin, J.Asthma, 1993, 30, 285–295.
3 O. Elidemir, G. N. Colasurdo, S. N. Rossmann and L. F. Leland,Pediatr., 1999, 104, 964–6.
4 E. Johanning, M. Gareis, C. S. Yang, E. L. Hintikka, M. Nikulin,B. Jarvis and R. Dietrich, Mycot. Res., 1998, 14, 60–73.
5 J. E. Smith, J. G. Anderson, C. W. Lewis and Y. M. Murad, FEMSMicrob Letters, 1992, 100, 337–343.
6 S. H. Cho, S. C. Seo, D. Schmechel, S. A. Grinshpun and T. Reponen,Atmos. Envir., 2005, 39, 5454–5465.
7 T. L. Brasel, J. M. Martin, C. G. Carriker, S. C. Wilson andD. C. Straus, Appl. Envir. Microb., 2005, 71, 7376–7388.
8 T. L. Brasel, D. R. Douglas, S. C. Wilson and D. C. Straus, Appl.Envir. Microb., 2005, 71, 114–122.
9 K. F. Nielsen, G. Holm, L. P. Uttrup and P. A. Nielsen, Int.Biodeterior. Biodegrad., 2004, 54, 325–336.
10 Y. Assouline-Dayan, A. Leong, Y. Shoenfeld and M. E. Gershwin, J.Asthma, 2002, 39, 191–201.
11 J. W. Bennett and M. Klich, Clin. Microb. Rev., 2003, 16, 497–516.12 K. M. Hendry and E. C. Cole, J. Toxicol. Environ. Health, 1993, 38,
183–198.13 B. B. Jarvis, Phytochemistry, 2003, 64, 53–60.14 K. F. Nielsen and J. Smedsgaard, J. Chromatogr. A, 2003, 1002, 111–
136.15 K. Wilkins, K. F. Nielsen and S. U. Din, Environ. Sci. Pollut. Res.,
2003, 10, 162–166.16 International Agency for Research on Cancer (IARC), www.iarc.fr
(read on 9/06/2009).17 M. R. Fogle, D. R. Douglas, C. A. Jumper and D. C. Straus,
Mycopathologia, 2007, 164, 49–56.18 R. E. Wagener, N. D. Davis and U. L. Diener, Appli. Environ.
Microbiol., 1980, 882–887.19 S. Abid-Essefi, Z. Ouanes, W. Hassen, I. Baudrimont, E. Creppy and
H. Bacha, Toxicol. in vitro, 2004, 18, 467–474.20 G. Fischer and W. Dott, Arch. Microbiol., 2003, 179, 75–82.
J. Environ. Monit., 2009, 11, 1849–1858 | 1857

Publ
ishe
d on
20
July
200
9. D
ownl
oade
d by
Hog
esch
ool G
ent o
n 24
/04/
2014
09:
03:3
1.
View Article Online
21 B. Yu, Z. Hu, M. Liu, H. Yang, Q. Kong and Y. Liu, Int.J. Refrigeration, 2008, 32, 3–20.
22 P. Wolkoff, J. K. Nojgaard, C. Franck and P. Skov, Indoor Air, 2006,16, 258–265.
23 T. O. Larsen and J. C. Frisvad, Mycol. Res., 1995, 99, 1153–1166.24 H. Jelen, D. Latus-Zietkiewicz, E. Wasowicz and E. Kaminski,
J. Microbiol. Methods, 1997, 31, 45–49.25 B. Delmulle, S. De Saeger, A. Adams, N. De Kimpe and C. Van
Peteghem, Rapid Commun. Mass Spectrom., 2006, 20, 771–776.26 J. C. Frisvad, K. F. Nielsen and R. A. Samson, in Advances In Food
Mycology: Advances in experimental medicine and biology, ed. A. D.Hocking, J. I. Pitt, R. A. Samson, and U. Thrane, Springer, NewYork, 2006, pp. 33–46.
27 W. Gams, H. A. Plaats-Niterink, R. A. Van Der Samson andJ. A. Stalpers, Cbc-Course of Mycology, 2nd edn., 1980, pp. 109.
28 N. L. Glass and G. C. Donaldson, Appl. Environ. Microbiol., 1995, 61,1323–1330.
29 K. O’Donnell and E. Cigelnik, Mol. Phylog. Evol., 1997, 7, 103–116.30 Commission Decision, Commission Decision of 12 August 2002
implementing Council Directive 96/23/EC concerning theperformance of analytical methods and the interpretation of results(2002/657/EC), in Off. J. European Communities, 2002.
31 H. Z. Senyuva, J. Gilbert and S. Ozturkoglu, Anal. Chim. Acta, 2008,617, 97–106.
32 R. Adams, Identification of Essential Oil Components by GasChromatography/Mass Spectrometr, Allured PublishingCorporation, Illinois, USA, 4th edn., 2007.
33 D. Joulain, and W. A. Konig, The Atlas of Spectral Data ofSesquiterpene Hydrocarbons, E.B.-Verlag, Hamburg, Germany, 1998.
34 R. De la Campa, K. Seifert and J. D. Miller, Mycopathologia, 2007,163, 161–168.
35 M. Y. Menetrez and K. K. Foarde, Indoor Built Environ., 2004, 13,75–82.
36 C. R. Mehta and N. R. Patel, J. Am. Stat. Assoc., 1983, 78, 427–434.37 J. Bunger, G. Westphal, A. Monnich, B. Hinnendahl, E. Hallier and
M. Muller, Toxicology, 2004, 202, 199–211.38 K. Huttunen, J. Pelkonen, K. F. Nielsen, U. Nuutinen, J. Jussila
and M. M. Hirvonen, Environ. Health Perspect., 2004, 112, 659–665.
39 Y. L. Wang, T. J. Chai, G. Z. Lu, C. S. Quan, H. Y. Duan,M. L. Yao, B. A. Zucker and G. Schlenker, Environ. Res., 2008,107, 139–144.
40 D. A. Creasia, J. D. Thurman, L. J. Jones, M. L. Nealley, C. G. York,R. W. Wannemacher and D. L. Bunner, Fundam. Appl. Toxicol.,1987, 8, 230–235.
41 E. K. Tangni and L. Pussemier, J. Sci. Food Agric., 2007, 87, 1263–1270.
1858 | J. Environ. Monit., 2009, 11, 1849–1858
42 K. F. Nielsen, S. Gravesen, P. A. Nielsen, B. Andersen, U. Thraneand J. C. Frisvad, Mycopathologia, 1999, 145, 43–56.
43 E. Bloom, K. Bal, E. Nyman, A. Must and L. Larsson, Appl. Environ.Microbiol., 2007, 73, 4211–4217.
44 T. G. Rand, S. Giles, J. Flemming, J. D. Miller and E. Puniani,Toxicol. Sci., 2005, 87, 213–222.
45 R. A. Samson, E. S. Hoekstra and J. C. Frisvad, in Introduction toFood- and Airborne Fungi,ed. R. A. Samson, E. S. Hoekstra andJ. C. Frisvad, Centraalbureau voor Schimmelcultures, Utrecht, 2004.
46 F. S. Chu, in Foodborne Infections and Intoxications, ed. H. P.Riemann, and D. O. Cliver, Academic Press, London, 2005, ch. 16,pp. 583–629.
47 J. C. Frisvad, J. Smedsgaard, T. O. Larsen and R. A. Samson, Studiesin Mycol., 2004, 49, 201–204.
48 B. Andersen, J. Smedsgaard and T. C. Frisvad, J. Agric. Food Chem.,2004, 52, 2421–2428.
49 J. Yu, P. K. Chang, K. C. Ehrlich, J. W. Cary, D. Bhatnagar,T. E. Cleveland, G. A. Payne, J. E. Linz, C. P. Woloshuk andJ. W. Bennett, Appl. Environ. Microbiol., 2004, 70, 1253–1262.
50 S. Udagawa, T. Muroi, H. Kurata, S. Sekita, K. Yoshihira, S. Natoriand M. Umeda, Can. J. Microbiol., 1979, 25, 170–177.
51 E. Krysinska-Traczyk, J. Perkowski and J. Dutkiewicz, in Ann. Agric.Environ. Med., 2007, 14, 159–167.
52 E. Hanssen and M. Jung, Zeitschrift fur Lebensmittel-UntersuchungUnd-Forschung, 1972, 150, 141–145.
53 M. Maroni, R. Axelrad and A. Bacaloni, Am. Ind. Hyg. Assoc. J.,1995, 56, 499–508.
54 P. Wolkoff, P. A. Clausen, B. Jensen, G. D. Nielsen andC. K. Wilkins, Indoor Air, 1997, 7, 92–106.
55 U. Schlink, G. J. Fritz, O. Herbarth and M. Richter, Int.J. Biometeorol., 2002, 47, 35–48.
56 U. Schlink, S. Dorling, E. Pelikan, G. Nunnari, G. Cawley,H. Junninen, A. Greig, R. Foxall, K. Eben, T. Chatterton,J. Vondracek, M. Richter, M. Dostal, L. Bertucco,M. Kolehmainen and M. Doyle, Atmos. Environ., 2003, 37, 3237–3253.
57 D. A. Betancourt, T. R. Dean, M. Y. Menetrez and S. A. Moore, inCharacterization of microbial volatile organic compounds (MVOC)emitted by Stachybotrys chartarum, Air Pollution Prevention andControl Division, National Risk Management Research Laboratory,U.S. Environmental Protection Agency, Research Triangle Park,NC 27711, USA, 2008.
58 H. Jelen and E. Wasowicz, Food Rev. Int., 1998, 14, 391–426.59 G. Str€om, J. West, B. Wessen and U. Palgrem, in Health Implications
of Fungi in Indoor Environments. Air Quality Monographs, ed. R.Samson, and B. Flannigan, Elsevier Publishing Company, 1994,vol. 2, pp. 291–305.
This journal is ª The Royal Society of Chemistry 2009
Top Related
Copyright © 2022 FDOKUMEN

