


Bahasa
Halaman
Hukum


*Corresponding author. Fax: #33 3 8824 3399.
Journal of Crystal Growth 197 (1999) 927—938
Heterogeneous nucleation of calcium phosphate salts ata solid/liquid interface examined by scanning angle
reflectometry
P.A. Ngankam!, P. Schaaf", J.C. Voegel!,*, F.J.G. Cuisinier!! INSERM U 424, Fe&de& ration de Recherche Odontologiques, Universite& Louis Pasteur, 11 rue Humann, 67085 Strasbourg Cedex, France
" Institut Charles Sadron (CNRS-ULP), 6 rue Boussingault, 67083 Strasbourg Cedex, France
Received 10 November 1998
Abstract
Mineralization of calcium phosphate salts at a solid/liquid silica interface was examined by means of scanning anglereflectometry (SAR). A critical supersaturation of 7.60$0.15 mM was found to be the lowest calcium phosphateconcentration at pH 6.85 at which the reflectivity at the Brewster angle started to vary. The analyses of the signals bymean of the homogeneous isotropic layer model led to layer thicknesses of about 3.5 lm also characterized by very lowmean refractive index increments. These observations were completed by complementary experiments. Scanning andtransmission electron microscopy led to similar layer thicknesses with crystallites dispersed in the whole layer confirmingthus SAR results. X-ray analyses showed a presence of brushite (DCPD) at the silica interface. A pH of 5.44 was estimatedfor the acidic silica interface for which DCPD is nucleated after addition of 7.60$0.15 mM calcium and phosphate.However, at this pH value, the solution is largely supersaturated with respect to hydroxyapatite (HAP theoreticalsaturating concentration: 1.37 mM). A faster growth of DCPD crystals compared to HAP crystals is thus assumed toexplain our observations. ( 1999 Elsevier Science B.V. All rights reserved.
Keywords: Nucleation; Calcium phosphate; Scanning angle reflectometry
1. Introduction
Hard tissue mineralization is a general processoccurring in all vertebrae and it is materialized byordered deposition of calcium phosphates on anextracellular organic matrix by means of an hetero-
geneous nucleation process [1]. The matrix pro-teins involved in hydroxyapatite nucleation appearmainly to be phosphorylated proteins like bonesialoproteins (BSP) [2,3]. BSP is very specific forbone tissue and appears to be spatially and tem-porally associated with bone crystal nucleation.The access to the initial nucleation process and thefurther crystal growth, in particular for calciumphosphate crystals, constituted one of the mainresearch topics on mineralization in biological
0022-0248/99/$ — see front matter ( 1999 Elsevier Science B.V. All rights reserved.PII: S 0 0 2 2 - 0 2 4 8 ( 9 8 ) 0 1 1 6 7 - 1
systems in the last two or three decades [4,5]. Themajor difficulty encountered in such investigationscomes from the need to analyze very tiny depositedparticles. Several techniques have been employed inthe past to perform such analyses, among themwere transmission electron microscopy (TEM),scanning electron microscopy (SEM), X-ray diffrac-tion and more recently high resolution electronmicroscopy (HREM). Electron microscopy allowsthe characterization of precisely located material[1]. The nature of the crystallized material beingoften further characterized by mean of X-ray dif-fraction. Very tiny crystallites issued from initialmineralizing stages within bone, dentine and en-amel were only observed with HREM [1,6,7]. Inthat case HREM allowed a morphological andtopographical characterization of mineral depositsand also the determination of their crystallographicstructures. This is achieved by the comparison be-tween real images with simulated images takinginto account the structural properties of the depositand also the parameters of the microscope. How-ever, all these approaches share a common problemlinked with sample dehydratation before observa-tion and other possible side effects like phase trans-formation and/or induction or precipitation ofartefactual inorganic deposits. The electron beamitself can induce phase transformations during ob-servation [8]. Even when cryo-techniques are em-ployed for sample preparation such side effectsare not necessarily avoided. Moreover, theseapproaches do not allow to follow the nucleationrates.
Several other approaches were developed inwhich the solid calcium phosphate deposits couldbe characterized in the presence of the ionic bulksolution. Thus, as for the dissolution of calciumphosphate salts, the deposition or mineralizationrates of calcium phosphate salts can be followed insitu with specific H` and calcium electrodes and byfollowing the phosphate concentration in solution[9,10]. This approach however neither furnishesdirect informations on the structural characteristicsof the layer nor on the morphological properties ofthe nucleated inorganic deposits.
Another more recently developed approach con-cerns studies using a so-called ‘steady-state’ system[11]. The analysis of calcification in agarose gels
in the presence of proteins constituted a break-through in the understanding of calcium phosphatenucleation processes and of the role of matrix pro-teins. In these studies the calcium and the phos-phate accumulated within agarose were determinedby X-ray diffraction after 3 days of reaction andafter gel calcination. This original approach suffershowever from two main limitations: (i) it is difficultto pinpoint the role played by the agarose gels, i.e.,to distinguish between heterogeneous nucleation atthe surface and nucleation in the bulk; (ii) thisapproach does not furnish any information aboutthe kinetics of the nucleation process.
Other investigations used the AFM technique tofollow crystal growth and nucleation processes ofcalcium phosphate [12—14]. This technique allowsin situ observations but several problems like tipinteraction with the surface can deeply interferewith the nucleation process. The very small volumeof the reaction cell renders also any further chem-ical analyses very difficult.
In this paper we present a new approach, scann-ing angle reflectometry (SAR) [15], to follow, insitu, heterogeneous nucleation at a silica/liquid in-terface. This technique was previously employed tostudy protein adsorption, antigen—antibody inter-actions [16] and the analyses of the coverage ofsurfaces by latex particles [17]. The proposed ex-perimental procedure allows to focus on the pro-cess occurring directly at the interface. Both, criticalsupersaturation and initial nucleation kinetics areaccessible. The evolution of the mean refractiveindex and of the optical thickness of the nucleatedlayer can also be followed versus time. Sub-sequently, SEM and TEM are used as complemen-tary techniques to determine the layer andindividual crystal morphologies. The crystallo-graphic structure is also investigated by means ofX-ray diffraction.
2. Materials and methods
2.1. Scanning angle reflectometry (SAR)
Structural information on the interfacial adsor-bed layer were obtained with SAR [15]. This tech-nique is based on the variation after adsorption of
928 P.A. Ngankam et al. / Journal of Crystal Growth 197 (1999) 927–938
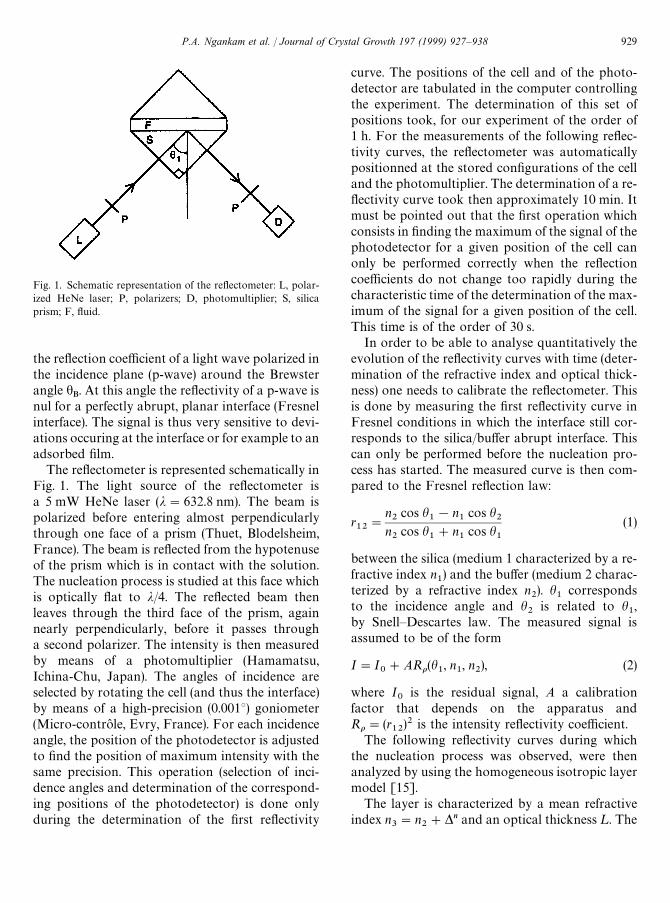
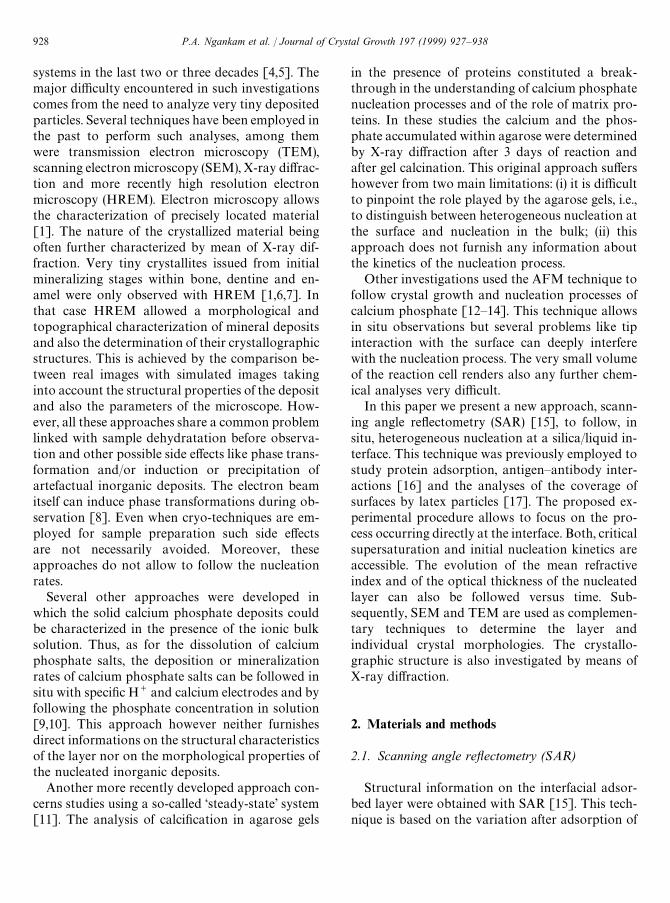
Fig. 1. Schematic representation of the reflectometer: L, polar-ized HeNe laser; P, polarizers; D, photomultiplier; S, silicaprism; F, fluid.
the reflection coefficient of a light wave polarized inthe incidence plane (p-wave) around the Brewsterangle h
B. At this angle the reflectivity of a p-wave is
nul for a perfectly abrupt, planar interface (Fresnelinterface). The signal is thus very sensitive to devi-ations occuring at the interface or for example to anadsorbed film.
The reflectometer is represented schematically inFig. 1. The light source of the reflectometer isa 5 mW HeNe laser (j"632.8 nm). The beam ispolarized before entering almost perpendicularlythrough one face of a prism (Thuet, Blodelsheim,France). The beam is reflected from the hypotenuseof the prism which is in contact with the solution.The nucleation process is studied at this face whichis optically flat to j/4. The reflected beam thenleaves through the third face of the prism, againnearly perpendicularly, before it passes througha second polarizer. The intensity is then measuredby means of a photomultiplier (Hamamatsu,Ichina-Chu, Japan). The angles of incidence areselected by rotating the cell (and thus the interface)by means of a high-precision (0.001°) goniometer(Micro-controle, Evry, France). For each incidenceangle, the position of the photodetector is adjustedto find the position of maximum intensity with thesame precision. This operation (selection of inci-dence angles and determination of the correspond-ing positions of the photodetector) is done onlyduring the determination of the first reflectivity
curve. The positions of the cell and of the photo-detector are tabulated in the computer controllingthe experiment. The determination of this set ofpositions took, for our experiment of the order of1 h. For the measurements of the following reflec-tivity curves, the reflectometer was automaticallypositionned at the stored configurations of the celland the photomultiplier. The determination of a re-flectivity curve took then approximately 10 min. Itmust be pointed out that the first operation whichconsists in finding the maximum of the signal of thephotodetector for a given position of the cell canonly be performed correctly when the reflectioncoefficients do not change too rapidly during thecharacteristic time of the determination of the max-imum of the signal for a given position of the cell.This time is of the order of 30 s.
In order to be able to analyse quantitatively theevolution of the reflectivity curves with time (deter-mination of the refractive index and optical thick-ness) one needs to calibrate the reflectometer. Thisis done by measuring the first reflectivity curve inFresnel conditions in which the interface still cor-responds to the silica/buffer abrupt interface. Thiscan only be performed before the nucleation pro-cess has started. The measured curve is then com-pared to the Fresnel reflection law:
r12"
n2
cos h1!n
1cos h
2n2
cos h1#n
1cos h
1
(1)
between the silica (medium 1 characterized by a re-fractive index n
1) and the buffer (medium 2 charac-
terized by a refractive index n2). h
1corresponds
to the incidence angle and h2
is related to h1,
by Snell—Descartes law. The measured signal isassumed to be of the form
I"I0#ARo(h1, n1, n2), (2)
where I0
is the residual signal, A a calibrationfactor that depends on the apparatus andRo"(r
12)2 is the intensity reflectivity coefficient.
The following reflectivity curves during whichthe nucleation process was observed, were thenanalyzed by using the homogeneous isotropic layermodel [15].
The layer is characterized by a mean refractiveindex n
3"n
2#*n and an optical thickness ¸. The
P.A. Ngankam et al. / Journal of Crystal Growth 197 (1999) 927–938 929
Fig. 2. Reflectivity curves in the presence of a solution of calcium and phosphate at a concentration of 7.75 mM for different contacttimes between the solution and the Suprasyl surface.
intensity of the reflectivity coefficient entering inexpression [2] for such a layer is given by
Ro(n3, ¸)"Ar13#r
32exp jd
1#r13
r23
exp jdB2, (3)
where rij
corresponds to the amplitude reflectioncoefficient of a Fresnel interface ij (see expression[1]) and d"4n¸n
3/j cos (h
3) where h
3is given by
Snell—Descartes law n1
sin h1"n
3sin h
3and j is
the wavelength of the laser in vacuum.Once A and I
0were determined during the calib-
ration step of the apparatus, the subsequent reflec-tivity curves were compared to expression [2] withRo (n
3, ¸) given by Eq. (3), the adjusting parameters
being n3
and ¸. The adjustment was done by usingsimplex method [18] and the quality of the fit wasdefined by the standard least-squares parameter
s2"n+i/1
1
n AR
%91(h
1)!R
5)(h
1, n
3, ¸)
p2(hi) B
2, (4)
where hi
represents the incidence angle, p(hi) the
expected error at the angle hiand n is the number of
angles at which reflectivity was measured. Theamount of material nucleated at the silica interfaceis then proportional to *n
3¸.
2.2. Chemical
Experiments were performed using calcium solu-tions prepared from CaCl
2(purity 99.5%) (Merck,
Darmstadt, Germany). Phosphate solutions wereobtained by mixing w/w equimolar solutions ofNa
2HPO
4,7H
2O and NaH
2PO
4,H
2O (purity
98.5%) (Merck, Darmstadt, Germany). Equimolarcalcium and phosphate solutions were mixed (w/w)in Tris-HCl buffer in presence of 150 mM KCl. Thefinal pH of the solution was 6.85. All solutions wereprepared with deionized water (Millipore, Bedford,Great-Britain) and were passed through 0.22 lmMillipore filters.
2.3. Typical experiments
Each experiment was preceded by an extensivecleaning of the cell and the tubings with a
930 P.A. Ngankam et al. / Journal of Crystal Growth 197 (1999) 927–938
Hellmanex solution (2%) (Hellma, Mullheim,Germany) heated at 50°C for 10 min. This stepwas followed by a 2 min. rinse with HCl (1%) andan extensive water flowing using deionized water.
Then, in the presence of pure water, a first reflec-tivity curve was determined. The cell was openedand the prism was put in contact with the calciumand phosphate solution. A reference reflectivitycurve was obtained from this solution before thebeginning of the nucleation process. The interfacialprocess was then followed continuously versus timeby determining a reflectivity curve every 10 min.A signal corresponding to a reaction at thesolid/liquid interface is materialized by an increaseof the reflectivity around h
B. The shape of the curve
and the position of the minimum evolves with time(Fig. 2). This evolution was followed during 15 h.The reproducibility was checked by repeating eachexperiment three times.
2.4. Deposited material characterization
SAR results were completed with the aid of sev-eral complementary techniques in order to precisethe morphology of the deposited material (SEM,TEM) and to determine the crystallographic natureof the deposited material (X-ray diffraction). Forthis aim, two similar experiments were performedin parallel, one directly in the reflectometer anda second in a similar cell in the presence of silicaslides made with the same material and the sameoptical characteristics k/4 as the prism used inSAR. Both experiments were started simulta-neously with precisely the same calcium and phos-phate solutions. After a given reaction timeestimated from the reflectivity signal evolution, thesilica slides were removed from the second cell andair dried in order to stop the nucleation process.The withdrawn specimens were then specificallyprepared for each microscope technique.
f SEM observations were done with a SEMStereoscan, (Cambridge, Cambridge, UK) oper-ating at 35 kV. Before observation, slides werecoated with gold-palladium in a Hummer juniorevaporator (Siemens, Karlsruhe, Germany).
f For transmission electron microscopy (TEM) thesilica slides with the deposited layer were embed-
ded in Epon 812. After polymerization, Epon 812and the embedded material were separated fromthe silica surface. For sectioning, specimens werereoriented in order to get sections cut perpen-dicularly to the interface. Nondecalcified sec-tions were obtained with a MT-2C (RMC,Tucson, USA) microtome equipped with a dia-mond knife. The unstained sections were ob-served in a Philips EM 430 ST transmissionelectron microscope operating at 100 kV, usinga double tilt specimen holder and a nitrogen-cooled anticontamination device.
f X-ray diffraction was realized with a D 5000Siemens powder diffractometer (Siemens, Mun-chen, Germany) using the Co Ka radiation(j
C0Ka
"0.1789 nm). The data were comparedwith the intensity and d
),-values of the Joint
Committee of Powder Diffraction Society(JCPDS) standards [19] of various calciumphosphate salts (particularly Brushite (DCPD)and hydroxyapatite (HAP)).
3. Results and discussion
Experiments were mainly performed for calciumand phosphate solutions varying from 6 to 8 mM.The reflectivity curves obtained for an experimentwith 7.75 mM of Ca and PO
4are given in Fig. 2.
For this concentration, after about 80 min of con-tact of the solution with the silica surface the reflec-tivity curves started to vary and evolvecontinuously with time. This constitutes a signaturefor important interfacial modifications at the silicasurface. The time lag of 80 min during which thereflected intensity did not change allowed to deter-mine the Fresnel curve and thus to calibrate theapparatus. The reproducibility of the experiment isdepicted in Fig. 3 which shows the evolution of theminimum reflectivity around the Brewster angle forfour independent experiments, two of them corre-sponding to a concentration of Ca and PO
4of
7.75 mM, the other two of a concentration of7.60 mM. This concentration (around 7.60 mMof Ca and PO
4) represents also the critical value
(superthreshold concentration) for which an inter-facial reaction was found by Hunter and Goldberg[11]. The critical supersaturation was defined in
P.A. Ngankam et al. / Journal of Crystal Growth 197 (1999) 927–938 931
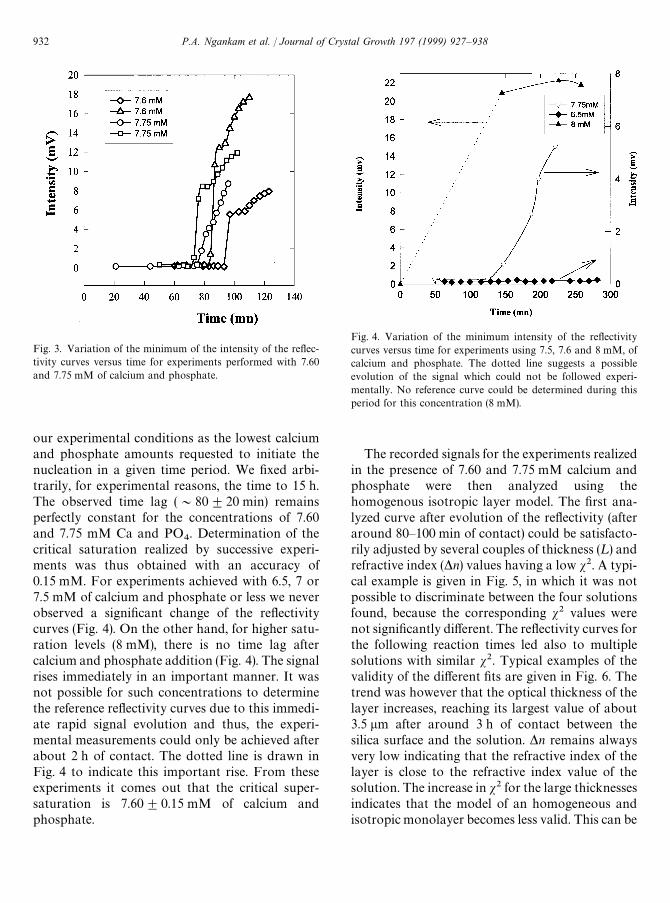
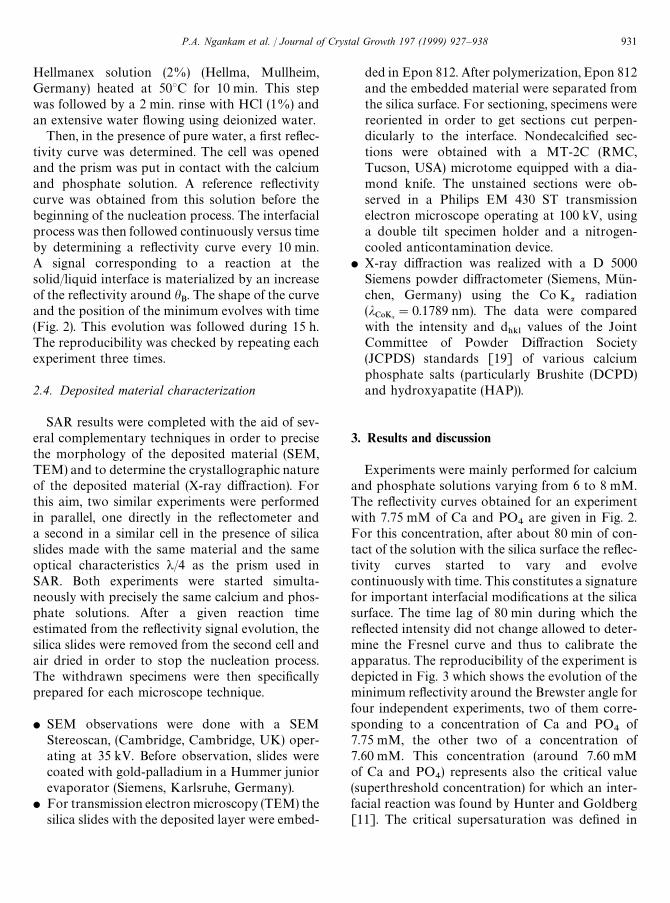
Fig. 3. Variation of the minimum of the intensity of the reflec-tivity curves versus time for experiments performed with 7.60and 7.75 mM of calcium and phosphate.
Fig. 4. Variation of the minimum intensity of the reflectivitycurves versus time for experiments using 7.5, 7.6 and 8 mM, ofcalcium and phosphate. The dotted line suggests a possibleevolution of the signal which could not be followed experi-mentally. No reference curve could be determined during thisperiod for this concentration (8 mM).
our experimental conditions as the lowest calciumand phosphate amounts requested to initiate thenucleation in a given time period. We fixed arbi-trarily, for experimental reasons, the time to 15 h.The observed time lag (&80$20 min) remainsperfectly constant for the concentrations of 7.60and 7.75 mM Ca and PO
4. Determination of the
critical saturation realized by successive experi-ments was thus obtained with an accuracy of0.15 mM. For experiments achieved with 6.5, 7 or7.5 mM of calcium and phosphate or less we neverobserved a significant change of the reflectivitycurves (Fig. 4). On the other hand, for higher satu-ration levels (8 mM), there is no time lag aftercalcium and phosphate addition (Fig. 4). The signalrises immediately in an important manner. It wasnot possible for such concentrations to determinethe reference reflectivity curves due to this immedi-ate rapid signal evolution and thus, the experi-mental measurements could only be achieved afterabout 2 h of contact. The dotted line is drawn inFig. 4 to indicate this important rise. From theseexperiments it comes out that the critical super-saturation is 7.60$0.15 mM of calcium andphosphate.
The recorded signals for the experiments realizedin the presence of 7.60 and 7.75 mM calcium andphosphate were then analyzed using thehomogenous isotropic layer model. The first ana-lyzed curve after evolution of the reflectivity (afteraround 80—100 min of contact) could be satisfacto-rily adjusted by several couples of thickness (¸) andrefractive index (*n) values having a low s2. A typi-cal example is given in Fig. 5, in which it was notpossible to discriminate between the four solutionsfound, because the corresponding s2 values werenot significantly different. The reflectivity curves forthe following reaction times led also to multiplesolutions with similar s2. Typical examples of thevalidity of the different fits are given in Fig. 6. Thetrend was however that the optical thickness of thelayer increases, reaching its largest value of about3.5 lm after around 3 h of contact between thesilica surface and the solution. *n remains alwaysvery low indicating that the refractive index of thelayer is close to the refractive index value of thesolution. The increase in s2 for the large thicknessesindicates that the model of an homogeneous andisotropic monolayer becomes less valid. This can be
932 P.A. Ngankam et al. / Journal of Crystal Growth 197 (1999) 927–938
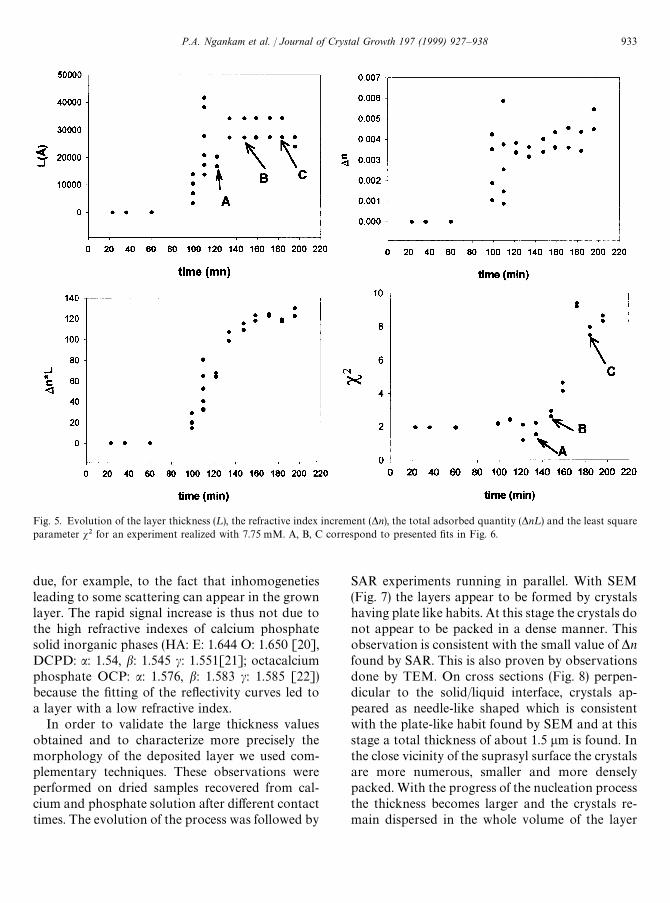
Fig. 5. Evolution of the layer thickness (¸), the refractive index increment (*n), the total adsorbed quantity (*n¸) and the least squareparameter s2 for an experiment realized with 7.75 mM. A, B, C correspond to presented fits in Fig. 6.
due, for example, to the fact that inhomogenetiesleading to some scattering can appear in the grownlayer. The rapid signal increase is thus not due tothe high refractive indexes of calcium phosphatesolid inorganic phases (HA: E: 1.644 O: 1.650 [20],DCPD: a: 1.54, b: 1.545 c: 1.551[21]; octacalciumphosphate OCP: a: 1.576, b: 1.583 c: 1.585 [22])because the fitting of the reflectivity curves led toa layer with a low refractive index.
In order to validate the large thickness valuesobtained and to characterize more precisely themorphology of the deposited layer we used com-plementary techniques. These observations wereperformed on dried samples recovered from cal-cium and phosphate solution after different contacttimes. The evolution of the process was followed by
SAR experiments running in parallel. With SEM(Fig. 7) the layers appear to be formed by crystalshaving plate like habits. At this stage the crystals donot appear to be packed in a dense manner. Thisobservation is consistent with the small value of *nfound by SAR. This is also proven by observationsdone by TEM. On cross sections (Fig. 8) perpen-dicular to the solid/liquid interface, crystals ap-peared as needle-like shaped which is consistentwith the plate-like habit found by SEM and at thisstage a total thickness of about 1.5 lm is found. Inthe close vicinity of the suprasyl surface the crystalsare more numerous, smaller and more denselypacked. With the progress of the nucleation processthe thickness becomes larger and the crystals re-main dispersed in the whole volume of the layer
P.A. Ngankam et al. / Journal of Crystal Growth 197 (1999) 927–938 933
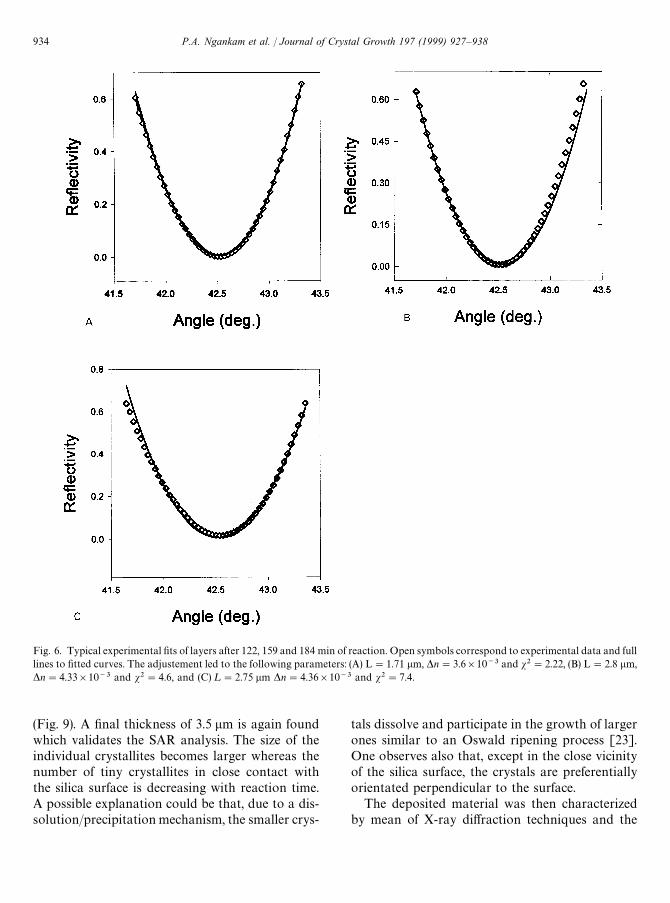
Fig. 6. Typical experimental fits of layers after 122, 159 and 184 min of reaction. Open symbols correspond to experimental data and fulllines to fitted curves. The adjustement led to the following parameters: (A) L"1.71 lm, *n"3.6]10~3 and s2"2.22, (B) L"2.8 lm,*n"4.33]10~3 and s2"4.6, and (C) ¸"2.75 lm *n"4.36]10~3 and s2"7.4.
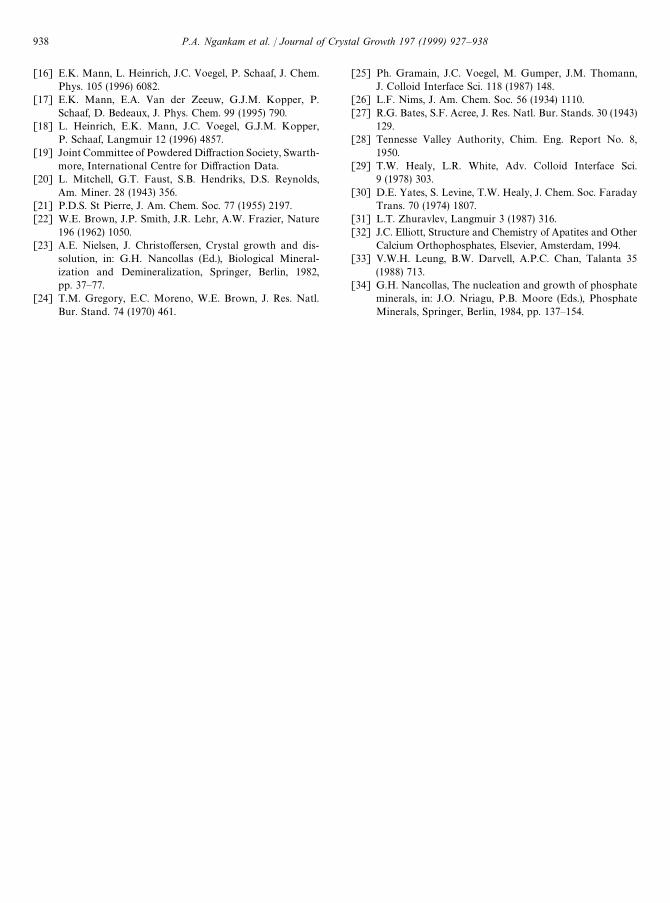
(Fig. 9). A final thickness of 3.5 lm is again foundwhich validates the SAR analysis. The size of theindividual crystallites becomes larger whereas thenumber of tiny crystallites in close contact withthe silica surface is decreasing with reaction time.A possible explanation could be that, due to a dis-solution/precipitation mechanism, the smaller crys-
tals dissolve and participate in the growth of largerones similar to an Oswald ripening process [23].One observes also that, except in the close vicinityof the silica surface, the crystals are preferentiallyorientated perpendicular to the surface.
The deposited material was then characterizedby mean of X-ray diffraction techniques and the
934 P.A. Ngankam et al. / Journal of Crystal Growth 197 (1999) 927–938
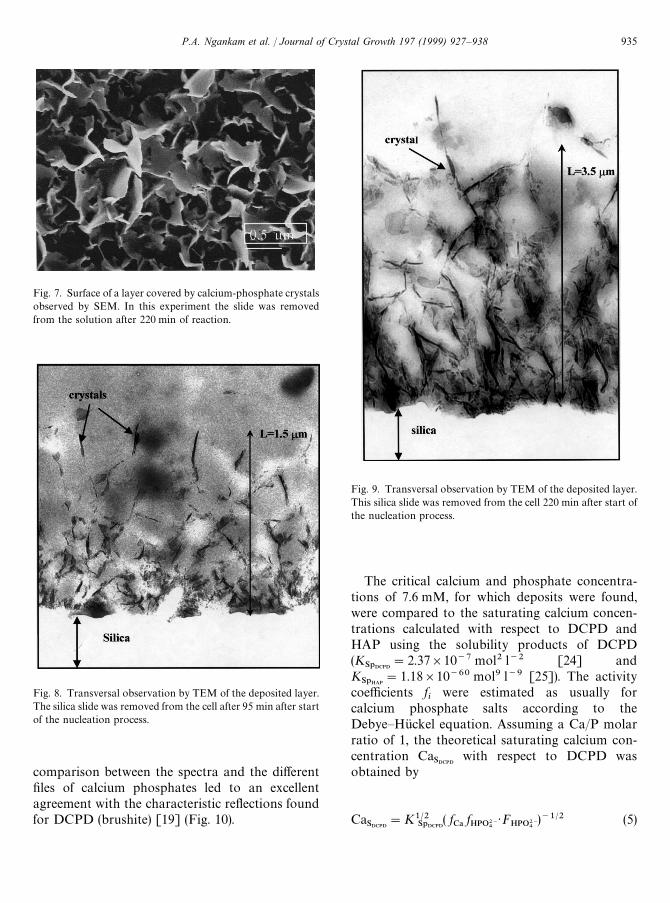
Fig. 7. Surface of a layer covered by calcium-phosphate crystalsobserved by SEM. In this experiment the slide was removedfrom the solution after 220 min of reaction.
Fig. 8. Transversal observation by TEM of the deposited layer.The silica slide was removed from the cell after 95 min after startof the nucleation process.
Fig. 9. Transversal observation by TEM of the deposited layer.This silica slide was removed from the cell 220 min after start ofthe nucleation process.
comparison between the spectra and the differentfiles of calcium phosphates led to an excellentagreement with the characteristic reflections foundfor DCPD (brushite) [19] (Fig. 10).
The critical calcium and phosphate concentra-tions of 7.6 mM, for which deposits were found,were compared to the saturating calcium concen-trations calculated with respect to DCPD andHAP using the solubility products of DCPD(K
S1DCPD"2.37]10~7 mol2 l~2 [24] and
KS1HAP
"1.18]10~60 mol9 l~9 [25]). The activitycoefficients f
iwere estimated as usually for
calcium phosphate salts according to theDebye—Huckel equation. Assuming a Ca/P molarratio of 1, the theoretical saturating calcium con-centration Ca
SDCPDwith respect to DCPD was
obtained by
CaSDCPD
"K1@2S1DCPD
( fC!
fHPO2~
4)F
HPO2~4)~1@2 (5)
P.A. Ngankam et al. / Journal of Crystal Growth 197 (1999) 927–938 935
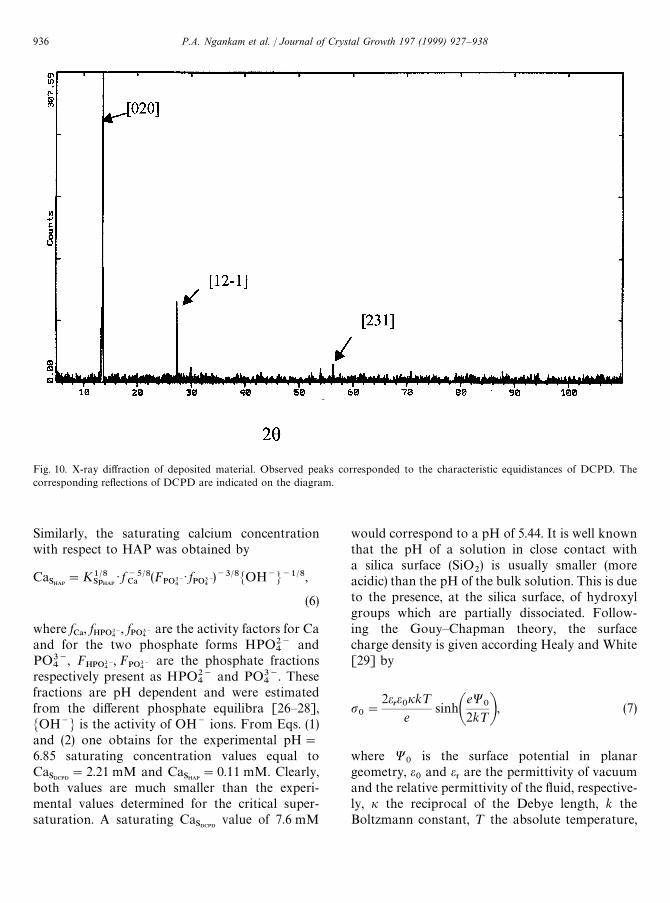
Fig. 10. X-ray diffraction of deposited material. Observed peaks corresponded to the characteristic equidistances of DCPD. Thecorresponding reflections of DCPD are indicated on the diagram.
Similarly, the saturating calcium concentrationwith respect to HAP was obtained by
CaSHAP
"K1@8S1HAP
) f~5@8C!
(FPO3~
4) fPO3~
4)~3@8MOH~N~1@8,
(6)
where fC!
, fHPO2~
4, f
PO3~4
are the activity factors for Caand for the two phosphate forms HPO2~
4and
PO3~4
, FHPO2~
4, F
PO3~4
are the phosphate fractionsrespectively present as HPO2~
4and PO3~
4. These
fractions are pH dependent and were estimatedfrom the different phosphate equilibra [26—28],MOH~N is the activity of OH~ ions. From Eqs. (1)and (2) one obtains for the experimental pH"
6.85 saturating concentration values equal toCa
SDCPD"2.21 mM and Ca
SHAP"0.11 mM. Clearly,
both values are much smaller than the experi-mental values determined for the critical super-saturation. A saturating Ca
SDCPDvalue of 7.6 mM
would correspond to a pH of 5.44. It is well knownthat the pH of a solution in close contact witha silica surface (SiO
2) is usually smaller (more
acidic) than the pH of the bulk solution. This is dueto the presence, at the silica surface, of hydroxylgroups which are partially dissociated. Follow-ing the Gouy—Chapman theory, the surfacecharge density is given according Healy and White[29] by
p0"
2ere0ik¹
esinhA
eW0
2k¹B, (7)
where W0
is the surface potential in planargeometry, e
0and e
3are the permittivity of vacuum
and the relative permittivity of the fluid, respective-ly, i the reciprocal of the Debye length, k theBoltzmann constant, ¹ the absolute temperature,
936 P.A. Ngankam et al. / Journal of Crystal Growth 197 (1999) 927–938

and e the elementary electric charge. According tothe same authors the potential W
0verifies also
2e3e0ik¹
e2Ns
sinhAeW
02k¹B"
d sinh(m)
1#d cosh(m), (8)
where N4represents the density of hydroxyl groups
and potential m and d are defined by
m"2.303(pH0!pH)!
eW0
k¹, (9)
d"2]10~*1K@2 (10)
in which *pK corresponds to the pK differencebetween acidic and basic oxyde groups. Finally, thepH
4at the surface is given by
pH4"pH#
eW0
2.303k¹. (11)
Eq. (8) was solved numerically for pH"6.85using *pK"7.0 [29], pH
0"2.5 [30], N
s"
5]1018 m~2 [31] and for free electrolyte concen-trations ranging from 150 to 200 mM. Thus, pH
4varied from 5.30 to 5.34. This value is close tothe value of 5.44 obtained for the critical super-saturation.
However for the estimated pH value of 5.44 thesaturating calcium concentration Ca
SHAPof 1.37 mM
is also quite smaller than the experimentally deter-mined value. DCPD formation is thus unexpectedfrom thermodynamic arguments because HAP isthe less soluble calcium-phosphate salt at pH 5.45.Moreover bTCP (tricalcium phosphate) and OCP(octacalcium phosphate) possess also smallersolubilities than DCPD [32]. One has then to con-sider as often found for calcium phosphate saltsthat it is not the less soluble salt which is formed,but the one having the largest nucleation rate [33].In addition, brushite was also previously detectedduring crystal formation and proposed as a precur-sor for HAP nucleation [34].
4. Conclusion
We used presently an optical technique (SAR)which allows to follow the reflectivity atsolid/liquid interfaces. We showed that this ap-proach constitutes an excellent tool to define pre-
cisely critical supersaturation domains and to ex-plore in situ in a wide range of ionic concentrations,inorganic salts crystallization onto the solid surface(in particular growth rate and layer thickness). SARresults were confirmed by complementary methods(TEM, SEM, X-ray diffraction) which allow to havemorphology information. In a next step the sameapproach will be employed to determine the roleonto mineralization of polypeptides (polyglutamicor polyaspartic acids) or proteins adsorbed directlyor on a modified silica surface.
Acknowledgements
The authors acknowledge Drs. Vincent Ball,Franc7 oise Poumier and Bernard Senger for helpfuldiscussions and the assistance of Roland Bury forthe SEM observations.
References
[1] F.J.G. Cuisinier, P. Steuer, A. Brisson, J.C. Voegel,J. Crystal Growth 156 (1995) 443.
[2] G.K. Hunter, H.A. Goldberg, Proc. Natl. Acad. Sci. USA18 (1993) 8562.
[3] A.L. Boskey, Ann. Rev. NY Acad. Sci. 760 (1995) 249.[4] S. Mann, Crystallographic Strategies in Biomineralization,
in: S. Mann, J. Webb, R.J.P. Williams (Eds.), Biominerali-zation, VCH, Weinheim, 1989, pp. 35—62.
[5] S. Mann, Nature 365 (1993) 499.[6] F.J.G. Cuisinier, J.C. Voegel, J. Yacaman, R.M. Frank,
J. Crystal Growth 116 (1992) 314.[7] P. Houlle, J.C. Voegel, P. Schultz, F.J.G. Cuisinier,
J. Dental Res. 76 (1997) 95.[8] E.F. Bres, J.L. Hutchison, B. Senger, J.C. Voegel, R. Frank,
Ultramicroscopy 35 (1991) 305.[9] G.H. Nancollas, S.J. Zawacki, Connect. Tissue Res. 21
(1989) 239.[10] J. Christoffersen, M.R. Christoffersen, W. Kibalczyc,
J. Crystal Growth 94 (1989) 3767.[11] G.K. Hunter, H.A. Goldberg, Biochem. J. 302 (1994)
175.[12] K. Onuma, A. Ito, T. Tateschi, T. Kameyama, J. Crystal
Growth 154 (1995) 118.[13] K. Onuma, A. Ito, T. Tateschi, J. Crystal Growth 167
(1996) 773.[14] D.A. Walters, B.L. Smith, A.M. Belcher, G.T. Paloczi, G.D.
Stucky, D.E. Morse, P.K. Hansma, Biophys. J. 72 (1997)1425.
[15] P. Schaaf, P. Dejardin, A. Schmitt, Langmuir 3 (1987)1131.
P.A. Ngankam et al. / Journal of Crystal Growth 197 (1999) 927–938 937
[16] E.K. Mann, L. Heinrich, J.C. Voegel, P. Schaaf, J. Chem.Phys. 105 (1996) 6082.
[17] E.K. Mann, E.A. Van der Zeeuw, G.J.M. Kopper, P.Schaaf, D. Bedeaux, J. Phys. Chem. 99 (1995) 790.
[18] L. Heinrich, E.K. Mann, J.C. Voegel, G.J.M. Kopper,P. Schaaf, Langmuir 12 (1996) 4857.
[19] Joint Committee of Powdered Diffraction Society, Swarth-more, International Centre for Diffraction Data.
[20] L. Mitchell, G.T. Faust, S.B. Hendriks, D.S. Reynolds,Am. Miner. 28 (1943) 356.
[21] P.D.S. St Pierre, J. Am. Chem. Soc. 77 (1955) 2197.[22] W.E. Brown, J.P. Smith, J.R. Lehr, A.W. Frazier, Nature
196 (1962) 1050.[23] A.E. Nielsen, J. Christoffersen, Crystal growth and dis-
solution, in: G.H. Nancollas (Ed.), Biological Mineral-ization and Demineralization, Springer, Berlin, 1982,pp. 37—77.
[24] T.M. Gregory, E.C. Moreno, W.E. Brown, J. Res. Natl.Bur. Stand. 74 (1970) 461.
[25] Ph. Gramain, J.C. Voegel, M. Gumper, J.M. Thomann,J. Colloid Interface Sci. 118 (1987) 148.
[26] L.F. Nims, J. Am. Chem. Soc. 56 (1934) 1110.[27] R.G. Bates, S.F. Acree, J. Res. Natl. Bur. Stands. 30 (1943)
129.[28] Tennesse Valley Authority, Chim. Eng. Report No. 8,
1950.[29] T.W. Healy, L.R. White, Adv. Colloid Interface Sci.
9 (1978) 303.[30] D.E. Yates, S. Levine, T.W. Healy, J. Chem. Soc. Faraday
Trans. 70 (1974) 1807.[31] L.T. Zhuravlev, Langmuir 3 (1987) 316.[32] J.C. Elliott, Structure and Chemistry of Apatites and Other
Calcium Orthophosphates, Elsevier, Amsterdam, 1994.[33] V.W.H. Leung, B.W. Darvell, A.P.C. Chan, Talanta 35
(1988) 713.[34] G.H. Nancollas, The nucleation and growth of phosphate
minerals, in: J.O. Nriagu, P.B. Moore (Eds.), PhosphateMinerals, Springer, Berlin, 1984, pp. 137—154.
938 P.A. Ngankam et al. / Journal of Crystal Growth 197 (1999) 927–938
Copyright © 2022 FDOKUMEN

