


Bahasa
Halaman
Hukum

CRACOW UNIVERSITY OF ECONOMICSDepartment of International TradeCentre for Strategic and International Entrepreneurship
ISSN 2353-883X eISSN 2353-8821 2019, Vol. 7, No. 2
a scientific quarterly
a scientific quarterly
Entrepreneurial Business and Economics Review
EBE R
ISSN 2353-883X eISSN 2353-8821 2019, Vol. 7, No. 2
This publication has been co-financed by the European Commission Representation in
Poland. The European Commission, or any person acting on its behalf, is not responsible for the use of the information contained in this publication. This publication reflects the views only of the authors, and the European Commission cannot be held responsible for
any use which may be made of the information contained therein
CRACOW UNIVERSITY OF ECONOMICS Department of International Trade Centre for Strategic and International Entrepreneurship

Editorial Board
Editor-in-Chief Krzysztof WACH
Associate Editors Jan BRZOZOWSKI, Marek ĆWIKLICKI, Marek DĄBROWSKI, Remigiusz GAWLIK,
Agnieszka GŁODOWSKA (Editorial Secretary), Michal GŁUSZAK, Małgorzata KOSAŁA, Bartłomiej MARONA (Online Editor),
Joanna PURGAŁ-POPIELA, Tomasz RACHWAŁ, Piotr STANEK, Marek SZARUCKI, Agnieszka WAŁĘGA, Agnieszka ŻUR
Executive Team for this Issue
Copy Editors: Krzysztof Kwiecień, Anna Marcinek-Markowska Proofreading: Anna Marcinek-Markowska
Issue Editor: Remigiusz Gawlik Cover and DTP: Marek Sieja
Original Version
The online journal is the primary and reference version. Both printed and online versions or the journal are original and identical.
ISSN 2353-883X (printed version) eISSN 2353-8821 (online version)
Publisher
Cracow University of Economics Centre for Strategic and International Entrepreneurship
Department of International Trade ul. Rakowicka 27, 31-510 Kraków, Poland
phone +48 12 293 5376, -5307, -5381, -5327, fax +48 12 293 5037 e-mail: [email protected]
www.eber.uek.krakow.pl
Printing and Binding
Drukarnia K&K Kraków www.kandk.com.pl
International Advisory Board
Paweł Capik, Keele University – Keele, United Kingdom Vesna Čančer, University of Maribor – Maribor, Slovenia
Byung June Chun, Chung-Ang University – Seoul, South Korea Franz Clement, Luxembourg Institute of Socio-Economic Research, Luxembourg
Nicola Daniele Coniglio, University of Bari “Aldo Moro”, Italy Jérôme Creel, OFCE & ESCP Europe – Paris, France
Marco Cucculelli, Università Politecnica delle Marche – Ancona, Italy Etienne Farvaque, Université du Havre & Skema Business School – Lille, France
Jörg Freiling, University of Bremen – Germany Geoff Goldman, University of Johannesburg – Johannesburg, South Africa
Antonio Duréndez Gómez-Guillamón, Technical University of Cartagena – Spain Elena Horská, Slovak University of Agriculture in Nitra – Nitra, Slovakia
Andreja Jaklič, University of Ljubljana – Slovenia Blaženka Knežević, University of Zagreb – Zagreb, Croatia
Jonathan Levie, University of Strathclyde – Glasgow, United Kingdom Youenn Loheac, France Business School – Brest, France
Pierre-Guillaume Méon, Université Libre de Bruxelles (ULB) – Brussels, Belgium J. Hanns Pichler, Vienna University of Economics and Business – Austria
Anna Pilková, Comenius University – Bratislava, Slovakia Aleksy Pocztowski, Cracow University of Economics – Krakow, Poland
Cornelia Pop, Babes-Bolyai University, Faculty of Business – Cluj-Napoca, Romania Panikkos Poutziouris, University of Central Lancashire Cyprus – Pyla, Larnaka, Cyprus
Matevž Rašković, Victoria University of Wellington – New Zealand Jurgita Raudeliūnienė, Vilnius Gediminas Technical University – Vilnius, Lithuania
Anne H. Reilly, Loyola University Chicago – Chicago, USA Aidin Salamzadeh, University of Tehran – Tehran, Iran
Arnold Schuh, Vienna University of Economics and Business – Austria Maura Sheehan, National University of Ireland – Galway, Ireland
Aviv Shoham, University of Haifa – Haifa, Israel Gerry Simons, Grand Valley State University – Grand Rapids, USA
Harinder Singh, Humboldt State University – Arcata, USA Jelena Stankevičienė, Vilnius Gediminas Technical University – Vilnius, Lithuania
Tomohiko Takahashi, Takushoku University – Tokyo, Japan Attila Tasnádi, Corvinus University of Budapest – Budapest, Hungary
Kiril Todorov, University of National and World Economy – Sofia, Bulgaria Stephane Vigeant, Equippe Lille & IESEG School of Management – Lille, France
Fuming Wang, University of International Business and Economics – Beijing, China
Reviewers
All articles are double-blinded peer-reviewed at least by two independent reviewers. The detailed list of reviewers is published at our website once a year.
Abstracting/Indexing
The journal, and all its articles, is abstracting and/or indexing in international databases, including:
ESCI Web of Science TM Core Collection (USA) Scopus by Elsevier (the Netherlands)
Clarivate Analytics (Beijing, China) EconLit – American Economic Association (USA)
ABI/INFORM Global (USA) ProQuest Entrepreneurship (USA)
EBSCO Business Source Ultimate (USA) EBSCO Business Source Corporate Plus (USA)
Cabell’s International (USA) Publons (Beijing, China)
ERIH Plus (Norway) DOAJ (England, UK)
Google Scholar (USA) NSD Nordi – Norwegian Register for Scientific Journals, Series and Publishers (Norway)
BazEkon (Poland) BazHum (Poland)
All articles published in EBER are tagged with an identification number
employing the Digital Object Identifier (DOI) System.
Copyright and License
Copyright by Authors and by Cracow University of Economics, CC BY-ND 4.0 License
EBER is an open access journal according to DOAJ.
Table of Contents
Public and Expert Opinions on Free Trade Agreements in South AmericaKrzysztof Beck, Bogna Gawrońska-Nowak, Paul Valdivieso
7
Shadow Economy and its Impact on Demand at the Investment Market of the Country
Yuriy Bilan, Tatiana Vasylieva, Sergij Lyeonov, Inna Tiutiunyk
27
The Attractiveness of Poland as a Medical Tourism Destinationfrom the Perspective of German and British Consumers
Diana Dryglas, Adrian Lubowiecki-Vikuk
45
New Imperative of Corporate Value Creationin Face of the Challenges of Sustainable Development
Andrzej Jaki, Barbara Siuta-Tokarska
63
China and Central and Eastern European Countries within ’16+1’: Group or Bilateral Relations?
Andreja Jaklič, Marjan Svetličič
83
Knowledge-Intensive Services Development in the EU:
Forecasts for Selected Countries and Implications for PolandBianka Godlewska-Dzioboń, Piotr Klimczyk, Agnieszka Witoń
101
Productivity or External Environment:
Which is More Important for Growth in Emerging Markets?Dzmitry Kruk
119
The Capacity of JESSICA Projects to Repay Loans Based on Own Revenues
Ida Musiałkowska, Piotr Idczak141
Factors Influencing Foreign Direct Investment Flows into Turkey
Ayla Oguş Binatli, Niloufer Sohrabji159
Progress of the V4 Countries towards the EU’s Energy and Climate Targets
in the Context of Energy Security ImprovementAgnieszka Joanna Pach-Gurgul, Marta Ulbrych
175
Strategic Challenges of Mergers and Acquisitions
in the Higher Education SectorŁukasz Sułkowski, Robert Seliga, Andrzej Woźniak
199
Positive Deviance as a Mediator in the Relationship Between High Performance Indicators and Entrepreneurial Orientation
Przemysław Zbierowski
217
Comparative International Entrepreneurship:
Theoretical Framework and Research DevelopmentAgnieszka Głodowska
235
The Similarity of the Demand Structure as a Determinant of the
Commodity Structure of Bilateral Trade in European Union CountriesMarek Maciejewski
249
2019, Vol. 7, No. 2 10.15678/EBER.2019.070201
Public and Expert Opinions
on Free Trade Agreements in South America
Krzysztof Beck, Bogna Gawrońska-Nowak, Paul Valdivieso
A B S T R A C T
Objective: Free Trade Agreements (FTA) have recently drawn public attention due to po-litical populism, alter-globalisation, and tendencies to redefine economic ties, together with the stereotype of mismatching social perception and so-called ‘expert knowledge’. Confronting this stereotype may contribute to better understanding of FTA controversies and identify possible vulnerability sources at the policy implementation level.
Research Design & Methods: To analyse FTA impact, meta-analysis of the literature re-search results was performed using the sample of eight Spanish language papers. We included models in which natural logarithm of a trade measure was regressed on FTA dummy variable with other explanatory variables following Viechtbauer (2010).
Findings: With FTA dummy variable increased trade can have its sources both in trade creation and trade diversion. Also, the endogeneity issue might result in overestimation of the effect, as countries that trade more are more likely to establish a FTA. Weighted least squares fixed effects models at both the study and the model level support this notion. Unweighted least squares models for Spanish language papers are the only ones where the positive effect of FTA is not statistically significant.
Implications & Recommendations: Spanish language literature gives a lot of support to the notion that FTAs are associated with higher trade. However, the exact size of the effect can be brought to question.
Contribution & Value Added: Public opinion in South America seems quite supportive for FTA and economic integration. Meta-analysis results confirm positive FTA effects, supporting its use as a convincing argument for further integration.
Article type: research article Keywords: Free Trade Agreements (FTA); meta-analysis; public opinion JEL codes: F13, F14, F53, F55, Z13
Received: 30 August 2018 Revised: 22 January 2019 Accepted: 2 February 2019
Suggested citation:
Beck, K., Gawrońska-Nowak, B., & Valdivieso, P. (2019). Public and Expert Opinions on Free Trade Agreements in South America. Entrepreneurial Business and Economics Review, 7(2), 7-25. https://doi.org/10.15678/EBER.2019.070201
8 | Krzysztof Beck, Bogna Gawrońska-Nowak, Paul Valdivieso
INTRODUCTION
Recently Free Trade Agreements (FTA) have been drawing public attention being affected enormously by new waves of political populism, alter-globalisation, and some tendencies to redefine patterns of the world economic ties. From the European perspective, especially the Comprehensive Economic and Trade Agreement (CETA), and the Transatlantic Trade and Investment Partnership (TTIP) have brought ‘on board’ serious public concerns about environmental protection, food quality, job security, and citizen rights. Donald Trump openly criticizes the North American Free Trade Agreement (NAFTA) calling it ‘the single worst trade deal ever approved in this (US) country’.
It is interesting to find out if South American public opinion on FTA is affected by sim-ilar populist tendencies. There is also quite a common stereotype that there is a mismatch between social perception concerning FTA with the so-called ‘expert knowledge’. Defining a mismatch between the social perception and the expert knowledge may contribute to better understanding of the controversies on FTA, as well as to properly defining possible sources of social conflicts and vulnerabilities of the policy at the implementation level. Having examined relevant studies on the social expectations in Europe concerning FTA (for example Bertelsmann Foundation, 2016; Eurobarometer 2014; 2015) one can observed that the analysis should be developed and continued in more detail, including country-specific and time-variant dimensions.
In our article we have a look at Latinobarómetro results to describe public opinion on FTA in South America and we confront them with so-called ‘expert opinions’. To do so we try to confirm in a statistically significant way if there is a key message in the Spanish language expert materials about trade and its effects that the experts could dis-seminate to the world.
In section 2 we briefly summarise historical evolution of FTA in South America. Section 3 provides us with public opinion on FTA and economic integration. In section 4 we present descriptive analysis of the Spanish language expert databases and methodological ap-proach towards meta-analysis, while section 5 shows its results. Section 6 concludes.
LITERATURE REVIEW
Free Trade Agreements in the Region: Present and Past
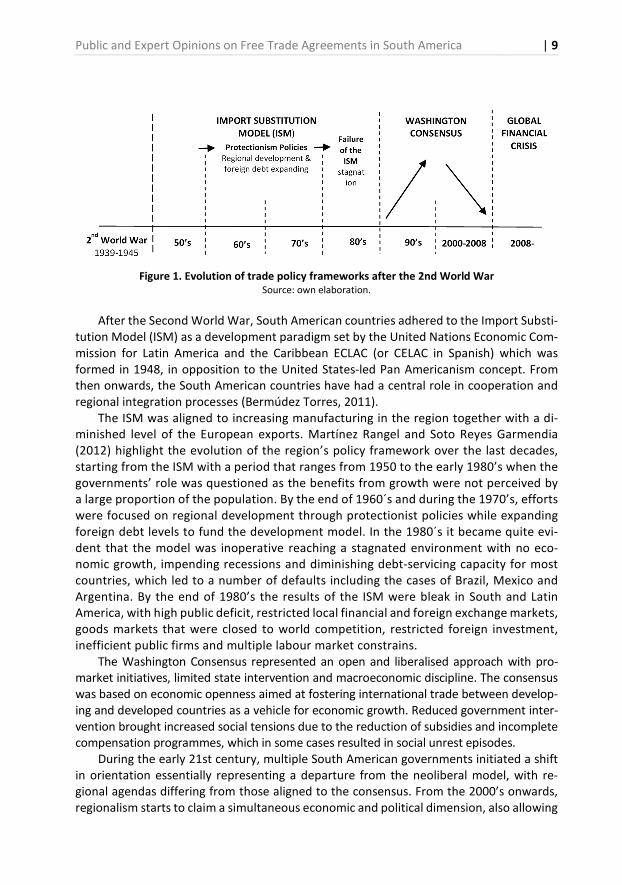
South America, along with Latin America as a whole, has historic and social conditions that favour integration. The region has multiple homogeneity traits when compared to other world regions. In particular, cultural, linguistic and religious similarities should be high-lighted. However, at the same time some political disagreements and periodical instabili-ties must be considered (Thoene, Zamora, Júnior, & Londoño, 2017; Shuaibu & Oladayo, 2016; Crespo Stupková, 2016). Economic growth and poverty reduction require trade, which in turn would only increase with openness and integration occurring in an environ-ment where supportive initiatives ensure that the benefits of trade spill to all the society (WTO, 2015). The region has a long history of integration efforts and trade agreements evolving in line with varying trade policy frameworks. This trend currently continues, even though the focus of the various trade agreements has varied over time together with the political context (Figure 1).
Public and Expert Opinions on Free Trade Agreements in South America | 9
Figure 1. Evolution of trade policy frameworks after the 2nd World War
Source: own elaboration.
After the Second World War, South American countries adhered to the Import Substi-tution Model (ISM) as a development paradigm set by the United Nations Economic Com-mission for Latin America and the Caribbean ECLAC (or CELAC in Spanish) which was formed in 1948, in opposition to the United States-led Pan Americanism concept. From then onwards, the South American countries have had a central role in cooperation and regional integration processes (Bermúdez Torres, 2011).
The ISM was aligned to increasing manufacturing in the region together with a di-minished level of the European exports. Martínez Rangel and Soto Reyes Garmendia (2012) highlight the evolution of the region’s policy framework over the last decades, starting from the ISM with a period that ranges from 1950 to the early 1980’s when the governments’ role was questioned as the benefits from growth were not perceived by a large proportion of the population. By the end of 1960´s and during the 1970’s, efforts were focused on regional development through protectionist policies while expanding foreign debt levels to fund the development model. In the 1980´s it became quite evi-dent that the model was inoperative reaching a stagnated environment with no eco-nomic growth, impending recessions and diminishing debt-servicing capacity for most countries, which led to a number of defaults including the cases of Brazil, Mexico and Argentina. By the end of 1980’s the results of the ISM were bleak in South and Latin America, with high public deficit, restricted local financial and foreign exchange markets, goods markets that were closed to world competition, restricted foreign investment, inefficient public firms and multiple labour market constrains.
The Washington Consensus represented an open and liberalised approach with pro-market initiatives, limited state intervention and macroeconomic discipline. The consensus was based on economic openness aimed at fostering international trade between develop-ing and developed countries as a vehicle for economic growth. Reduced government inter-vention brought increased social tensions due to the reduction of subsidies and incomplete compensation programmes, which in some cases resulted in social unrest episodes.
During the early 21st century, multiple South American governments initiated a shift in orientation essentially representing a departure from the neoliberal model, with re-gional agendas differing from those aligned to the consensus. From the 2000’s onwards, regionalism starts to claim a simultaneous economic and political dimension, also allowing
10 | Krzysztof Beck, Bogna Gawrońska-Nowak, Paul Valdivieso
for a more active government role in managing globalisation challenges. Social aspects become a key component in line with social development objectives (e.g. UN’s Millennium Objectives). This development occurs in line with reconsideration of the role of the state and the extent of its reach (Bizzozero, 2011a; Świerczyńska, 2017).
Tokatlian (2012) describes that South America suffers from an ‘integration complex’ with ambiguous results in a region representing a heterogeneous unity, particularly when referring to the political direction within countries. This characteristic is reflected in the existence of multiple blocs and trade agreements evolving simultaneously in a changing political landscape (Ulloa Urrutia & Marambio, 2014), highlighting that integration ideas are deeply ingrained, assuming that all countries in the region are involved in at least one integration initiative (Rhi-Sausi & Oddone, 2013).
Currently, the main active trade blocs with relevant presence of South American coun-tries are the Southern Common Market (Mercosur) formed in 1991 and currently with five full members: Argentina, Brazil, Paraguay, Uruguay and Venezuela; the Pacific Alliance (PA) formed in 2011 and currently with four full members: Chile, Colombia, Mexico and Peru; the Andean Community of Nations (ACN) formed in 1969 and currently with four full members: Bolivia, Colombia, Ecuador and Peru; and the Bolivarian Alliance for the Peoples of Our America (ALBA) formed in 2004 and currently with eleven countries as full mem-bers: Antigua and Barbuda, Bolivia, Cuba, Dominica, Ecuador, Grenada, Nicaragua, Saint Kitts and Nevis, Saint Lucia, Saint Vincent and the Grenadines and Venezuela1.
From this group, Mercosur and the Pacific Alliance are of particular relevance, given that they represent the two largest in terms of the size of their economies. Based on In-ternational Monetary Fund data2, for 2017 Mercosur represented approximately 3.7% of the world’s GDP and the PA 3.2%, whereas the ACN accounted for 1.1% and ALBA for 0.6%. The Spanish language expert database is built with focus primarily on Chile, although ex-panded to South American nations participating in the above listed agreements (i.e. Ar-gentina, Brazil3, Paraguay, Uruguay, Venezuela, Colombia, Peru, Bolivia and Ecuador).
In terms of the nature of the main agreements, Mercosur is designed as a free trade zone and customs union, and even though it was established in 1991, progress towards full implementation has been slow. Moreover, it serves as an example of the effects of an on-going political change in economic policy and trade relations within a major trade bloc, and of the potential evolution of trade blocs towards more open arrangements (i.e. fo-menting bloc relations with non-bloc parties). On the other hand, the Pacific Alliance, a newer initiative started in 2011, represents a new pragmatic approach in which eco-nomic aspects are not secondary to political considerations. Furthermore, the PA consti-tutes an agreement where the relation of the block with third parties are as important as
1 Additional regional blocs could be mentioned, such as the Community of Latin American and Caribbean States (CELAC) and the Union of South American Nations (UNASUR), although these are by conception primarily political organisations rather than trade blocs. There are other trade blocs in the Latin American region, being the most important the North American Free Trade Agreement (NAFTA), although, this agreement is beyond the scope of the analysis, given that it does not include any South American nations. 2 The data considers only full members, as those represent the countries having fully adopted the agreement. However, it must me mentioned that each of these agreements incorporate associated or observer countries. The percentage corresponds to the Gross domestic product based on purchasing-power-parity (PPP) share of world in total as indicated in the IMF’s World Economic Outlook (October 2017). 3 Literature review is limited to documents published in the Spanish language.
Public and Expert Opinions on Free Trade Agreements in South America | 11
intra-bloc relations. Therefore, it represents a new model of a trade agreement and inte-gration structure, and as such it is of key importance as a potential marker for the evolu-tion of these type of initiatives in the region and beyond.
The 2011-2017 period is of particular relevance in terms of events determining the current and potential future situation for the trade agreements in which South American countries partake. One particular event occurred in 2011 with the undertaking of founda-tional steps towards the creation of the Pacific Alliance, representing a more mature strat-egy with increased alignment between commercial and political interests (Rojas & Terán, 2016). A second event was the restructuring of both Mercosur and Andean Community starting in 2011 with Venezuela effectively leaving the ACN for incorporation into Mer-cosur, an event also serving to exemplify the prevalence of political interest over economic integration (Gutierrez, 2013), a phenomenon visible in earlier-generation agreements.
Regional Public Opinion on Integration
At present, regional integration can be seen as an incomplete project, with limitations such as reduced intraregional trade, lack of coordination, and the existence of multiple simul-taneous integration attempts following different approaches and ideological perspectives (Bárcena, Prado, Rosales, & Pérez, 2014; Bruslé, 2015; Benešová, Novotná, Šánová, & La-putková, 2016). Optimising and integrating the multiple initiatives that have been devel-oped over the last 60 years, involving tens of agreements and over 15 national associations with a variety of supranational bureaucratic structures is imperative (Foxley, 2015). Nev-ertheless, the reality is that political interests can disrupt long term advances in commer-cial aspects, as has been seen within Mercosur or with the clash of ideas between the ACN and the ALBA, where political adherences have recently been the sole determinant of eco-nomic policy (Giacalone, 2013), and through the critical views over the PA due to being an economic minded agreement among pro-market governments (Nolte & Wehner, 2014).
Traditionally, at relatively early integration stages, innovative organisational arrange-ments have been greatly valued, even despite the absence of major results (Bizzozero, 2011b). In contrast, decades after the conception, the agreement is evaluated from a more critical perspective, as recent public opinion commonly focuses on the lack of consistency between promises and reality, as well as institutional inefficiencies, even if some degree of social and political improvements are a reality (Caballero Santos, 2014).
Within the South American context, the implementation of social policies towards wel-fare increases is identified as the key political consideration and trade is seen as an active tool towards this objective. Latinobarómetro Corporation, a private non-profit organisation, based in Chile, is responsible for carrying out Latinobarómetro’s public opinion surveys providing a regional view on multiple topics, including current regional integration profile.
Over time, public views on economic and political opinions can and do change, both as a political change catalyst and as a social reaction to policy measures or international environment. Latinobarómetro has performed multiple public opinion surveys from 1995 to 20174, therefore allowing to review the public opinion evolution on a variety of aspects. In 1995, 74% of the surveyed supported an economic system based on private enterprises with varying degrees of government intervention, and only 11% supported the notion of
4 Latinobarómetro annual public opinion surveys from 1995, 2000, 2005, 2010, 2015 and 2017.
12 | Krzysztof Beck, Bogna Gawrońska-Nowak, Paul Valdivieso
no government intervention, which can be consistent with early reactions to the applica-tion of Washington Consensus-based measures in the absence of efficient social compen-sation efforts. When evaluating the situation in 2005 (at the early stages of new post Washington Consensus) one may observe that there is, however, a general support for a market economy although combined with well-expressed social sentiments for govern-ment intervention (63% of the population is in favour). At the same time, public opinion on the efficiency of recently privatised public services is not positive (with 58% of the pop-ulation displaying dissatisfaction with the post-privatisation situation).
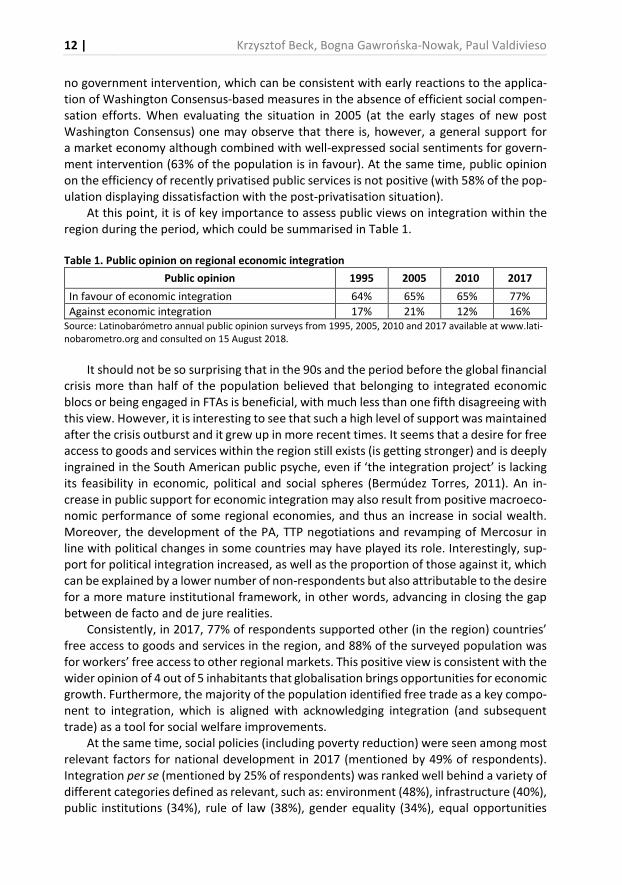
At this point, it is of key importance to assess public views on integration within the region during the period, which could be summarised in Table 1.
Table 1. Public opinion on regional economic integration
Public opinion 1995 2005 2010 2017
In favour of economic integration 64% 65% 65% 77%
Against economic integration 17% 21% 12% 16% Source: Latinobarómetro annual public opinion surveys from 1995, 2005, 2010 and 2017 available at www.lati-nobarometro.org and consulted on 15 August 2018.
It should not be so surprising that in the 90s and the period before the global financial crisis more than half of the population believed that belonging to integrated economic blocs or being engaged in FTAs is beneficial, with much less than one fifth disagreeing with this view. However, it is interesting to see that such a high level of support was maintained after the crisis outburst and it grew up in more recent times. It seems that a desire for free access to goods and services within the region still exists (is getting stronger) and is deeply ingrained in the South American public psyche, even if ‘the integration project’ is lacking its feasibility in economic, political and social spheres (Bermúdez Torres, 2011). An in-crease in public support for economic integration may also result from positive macroeco-nomic performance of some regional economies, and thus an increase in social wealth. Moreover, the development of the PA, TTP negotiations and revamping of Mercosur in line with political changes in some countries may have played its role. Interestingly, sup-port for political integration increased, as well as the proportion of those against it, which can be explained by a lower number of non-respondents but also attributable to the desire for a more mature institutional framework, in other words, advancing in closing the gap between de facto and de jure realities.
Consistently, in 2017, 77% of respondents supported other (in the region) countries’ free access to goods and services in the region, and 88% of the surveyed population was for workers’ free access to other regional markets. This positive view is consistent with the wider opinion of 4 out of 5 inhabitants that globalisation brings opportunities for economic growth. Furthermore, the majority of the population identified free trade as a key compo-nent to integration, which is aligned with acknowledging integration (and subsequent trade) as a tool for social welfare improvements.
At the same time, social policies (including poverty reduction) were seen among most relevant factors for national development in 2017 (mentioned by 49% of respondents). Integration per se (mentioned by 25% of respondents) was ranked well behind a variety of different categories defined as relevant, such as: environment (48%), infrastructure (40%), public institutions (34%), rule of law (38%), gender equality (34%), equal opportunities
Public and Expert Opinions on Free Trade Agreements in South America | 13
(46%), productivity (37%) and human capital (27%). This can suggest that integration is not perceived as a (practical?) goal in itself but probably rather broadly contextualised, per-ceived as a positive process, somehow contributing to social progress. Interestingly, peo-ple do appreciate successful integration implicite, recognizing the importance of its com-ponents, to mention only physical infrastructure, public institutions and rule of law among them. That goes in line with 66% of regional inhabitants declaring themselves as dissatis-fied with their national institutions, which also occurs with supranational ones.
When evaluating preferences in terms of which regions were seen as more important for deepening economic integration, it should be highlighted that the United States was named by 34% of the respondents, while Latin America as a region ranked close to the Eu-ropean Union, China and Japan (all of these ranging from 11% to 16%). The relative unim-portance of the home region can be explained by the current lack of maturity in on-going integration initiatives (together with the existence of multilateral agreements), resulting in diminished effects and overall efficiency. On the other hand, the prevalence of the United States as the identified relevant economic integration partner can be associated with the positive views on the effects of incoming foreign investment flows, which is supported by 67% of the population (with only 12% against it), and this view has not changed since 1995, where 69% of the surveyed identified direct incoming investing flows as positive.
For 1995 and 2000, 19% and 16% of the surveyed had pessimistic views over whether strong integration ties (i.e. regional common economic areas) could be a real-istic goal of their governments’ activities that would have been conducted by 2005, while 53% and 50%, respectively, were positive on that outcome. Two decades later, when asked about it in 2017, 28% of the population strongly acknowledged their na-tional governments’ efforts towards regional integration, 32% considered that little to no efforts had been implemented within the last five years, which helps to illustrate the perceived stagnated current state affairs and limited trust of the public in the govern-ments’ abilities to achieve fuller integration.
The relevance of trade as a key driver of economic integration remains an important topic of public discussion. For example, despite its limitations, Mercosur was identified by the general population of Argentina, Bolivia, Brazil, Chile, Paraguay, Uruguay and Vene-zuela as a top multilateral organisation providing the biggest benefits for its member soci-eties. Mercosur is also identified as the most relevant institution fostering economic de-velopment by the inhabitants of Mercosur countries, being named by 29% of respondents as crucial for development over an average response of 25% for integration as a whole.
As such, it can be said that there is demand for regional integration in Latin America and although there has been some progress, it is an incomplete process with differentiated re-sults between countries. This phenomenon can be measured in Latinobarómetro’s ‘In-tegrometer’, which is an indicator created by the Latinobarómetro NGO aiming to present a metric which measures dissatisfied demand for regional integration by quantifying it as the intersection of those respondents strongly in favour of integration while at the same time dissatisfied by their national governments’ efforts (or priorities) towards integration. Basco (2017) refers to the Integrometer, highlighting that for 2017 the Latin American region met-ric showed an average of 7.3%, more importantly, when exploring the relative metrics for South American countries, it is possible to identify that those having larger figures (i.e. Ven-ezuela with 20.8%, Argentina with 11.5% and Paraguay with 9.8%), share comparatively
14 | Krzysztof Beck, Bogna Gawrońska-Nowak, Paul Valdivieso
more inefficient institutions, increased restrictions on personal freedoms, and tighter re-strictions over people and capital mobility; while those with lower figures (i.e. Chile with 3.2%, Ecuador with 3.3% and Brazil with 3.7%) tend to present higher foreign trade involve-ment, more efficient structures, and in the Brazilian case, major size advantage. This ap-proach allows to identify regional dynamics, while also individual advances.
To sum it up, incomplete implementation of economic integration, which is Mer-cosur’s case, seems to be rather disappointing for the Latin American public opinion. It is also true that coexisting trade agreements are very heterogonous in their original nature. They have emerged from very different political perspectives, some initiated decades ago to concentrate on priorities that may seem a bit ‘old fashioned’ and fatigued now, while others were brought to life to highlight the pro-integration profile of the region, which continues to solidify despite its limitations and lack of speedy progress. Remarkably, vox
populi sounds more determined and inclined to follow the economic integration path than the policy-makers’ deeds. Therefore, it is quite reasonable to assume that the expert opin-ions could be better targeted, i.e. addressed to the latter to shed more light on economic integration, and in particular (updated) FTA anticipated results. That would, hopefully, im-prove social dialogue between citizens and the government, and lead to further steps in shaping a relevant economic integration model. But then again another question arises, how does ‘the expert voice’ sound. Is it coherent, comprehensible, and strong enough?
MATERIAL AND METHODS
Expert Opinion Database in the Spanish Language
To reflect the Spanish language ‘expert opinions’ concerning FTA we created a database consisting of 185 documents, which in principle included two main publishing categories:
− Spanish language research papers published in academic journals identified through in-ternational digital libraries and search resources5, as well as Chilean-based university re-positories6 (mostly located in the area of economics, but also social and political sciences).
− Economic reports or publications by Chilean-based think tanks7 with regional scope, su-pranational organisations8 and Chilean government bodies or agencies9.
Relevant key-words were applied (in Spanish): tratado de libre comercio (free trade agreement), acuerdo de libre comercio (free trade agreement), acuerdo de complementación
económica (economic complementary agreement), acuerdo de asociación económica (eco-nomic association agreement), Mercosur, Acuerdo Transpacífico de Cooperación Económica
5 International: Jstor, ProQuest, EBSCO, RePEc and Google Scholar. 6 The search incorporated the digital libraries from the three highest ranked Chilean universities (i.e. Uni-versidad de Chile, Pontificia Universidad Católica de Chile, and Universidad de Concepción) as per CWTS Leiden Ranking and Webometrics. 7 2016 Global Go To Think Tank Index Report by the University of Pennsylvania was employed to identify the highest ranked Chilean-based think tanks. The selected organisations were Centro de Estudios Públicos, Libertad y Desarrollo, Fundación para el Progreso, Fundación Jaime Guzmán, Fundación Chile 21, Comisión Económica para América Latina CEPAL and Corporación de Estudios para Latinoamerica. 8 The United Nations Conference on Trade and Development (UNCTAD) and the Organization for Economic Co-operation and Development (OECD). 9 Dirección General de Relaciones Económicas Internacionales (DIRECON), ProChile and Banco Central de Chile.
Public and Expert Opinions on Free Trade Agreements in South America | 15
(Transpacific Partnership), Alianza del Pacífico (Pacific Alliance), comercio (trade) and com-bined with the words: efecto (effect), impacto (impact), análisis (analysis), gravedad (grav-ity), equilibrio (equilibrium), and modelo (model).
Following this step, only documents published in the period between 2011 and 2017 were collected. In this way we obtained a literature sample that gave an updated post-crisis perspective.
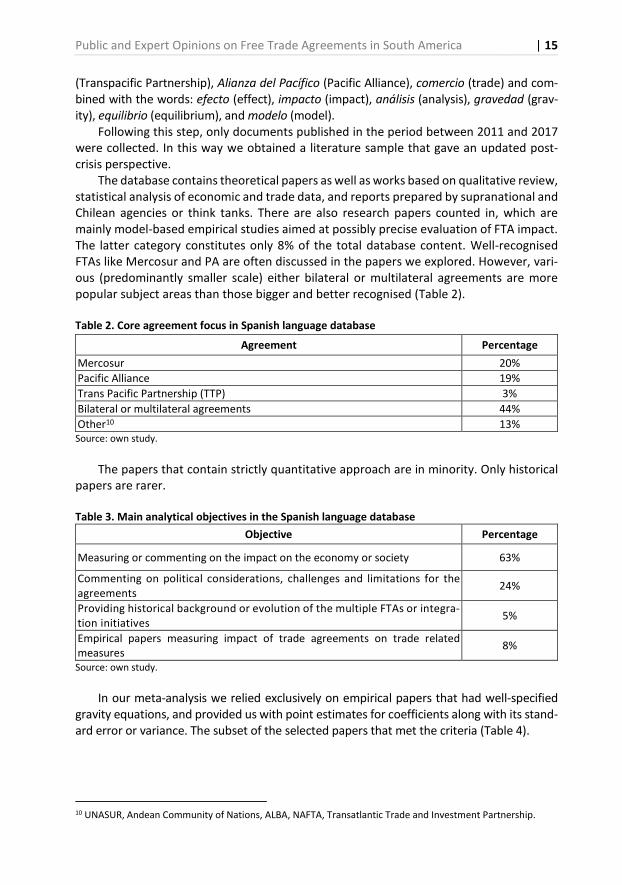
The database contains theoretical papers as well as works based on qualitative review, statistical analysis of economic and trade data, and reports prepared by supranational and Chilean agencies or think tanks. There are also research papers counted in, which are mainly model-based empirical studies aimed at possibly precise evaluation of FTA impact. The latter category constitutes only 8% of the total database content. Well-recognised FTAs like Mercosur and PA are often discussed in the papers we explored. However, vari-ous (predominantly smaller scale) either bilateral or multilateral agreements are more popular subject areas than those bigger and better recognised (Table 2).
Table 2. Core agreement focus in Spanish language database
Source: own study.
The papers that contain strictly quantitative approach are in minority. Only historical papers are rarer.
Table 3. Main analytical objectives in the Spanish language database
Objective Percentage
Measuring or commenting on the impact on the economy or society 63%
Commenting on political considerations, challenges and limitations for the agreements
24%
Providing historical background or evolution of the multiple FTAs or integra-tion initiatives
5%
Empirical papers measuring impact of trade agreements on trade related measures
8%
Source: own study.
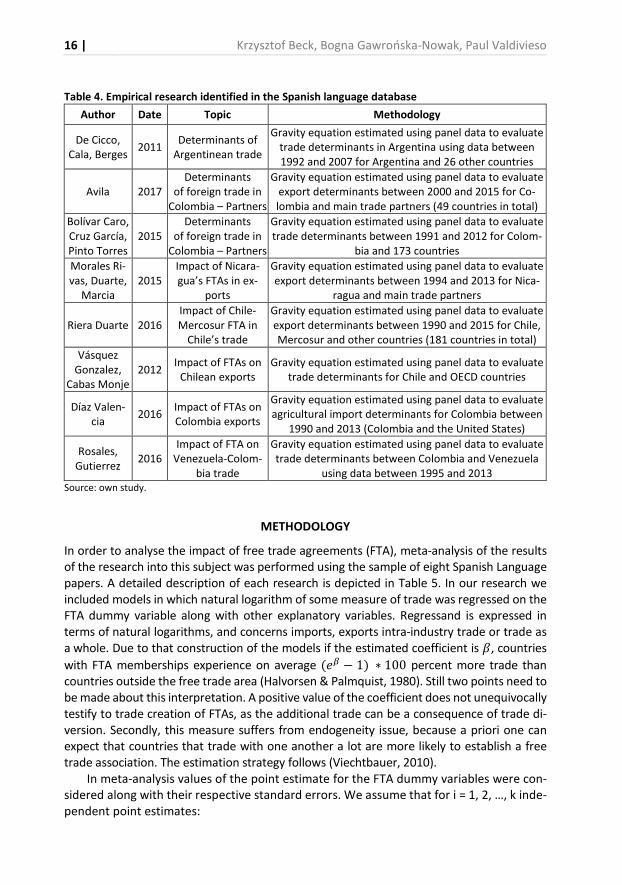
In our meta-analysis we relied exclusively on empirical papers that had well-specified gravity equations, and provided us with point estimates for coefficients along with its stand-ard error or variance. The subset of the selected papers that met the criteria (Table 4).
10 UNASUR, Andean Community of Nations, ALBA, NAFTA, Transatlantic Trade and Investment Partnership.
Agreement Percentage
Mercosur 20%
Pacific Alliance 19%
Trans Pacific Partnership (TTP) 3%
Bilateral or multilateral agreements 44%
Other10 13%
16 | Krzysztof Beck, Bogna Gawrońska-Nowak, Paul Valdivieso
Table 4. Empirical research identified in the Spanish language database
Author Date Topic Methodology
De Cicco, Cala, Berges
2011 Determinants of
Argentinean trade
Gravity equation estimated using panel data to evaluate trade determinants in Argentina using data between 1992 and 2007 for Argentina and 26 other countries
Avila 2017 Determinants
of foreign trade in Colombia – Partners
Gravity equation estimated using panel data to evaluate export determinants between 2000 and 2015 for Co-lombia and main trade partners (49 countries in total)
Bolívar Caro, Cruz García, Pinto Torres
2015 Determinants
of foreign trade in Colombia – Partners
Gravity equation estimated using panel data to evaluate trade determinants between 1991 and 2012 for Colom-
bia and 173 countries
Morales Ri-vas, Duarte,
Marcia 2015
Impact of Nicara-gua’s FTAs in ex-
ports
Gravity equation estimated using panel data to evaluate export determinants between 1994 and 2013 for Nica-
ragua and main trade partners
Riera Duarte 2016 Impact of Chile-Mercosur FTA in
Chile’s trade
Gravity equation estimated using panel data to evaluate export determinants between 1990 and 2015 for Chile, Mercosur and other countries (181 countries in total)
Vásquez Gonzalez,
Cabas Monje 2012
Impact of FTAs on Chilean exports
Gravity equation estimated using panel data to evaluate trade determinants for Chile and OECD countries
Díaz Valen-cia
2016 Impact of FTAs on Colombia exports
Gravity equation estimated using panel data to evaluate agricultural import determinants for Colombia between
1990 and 2013 (Colombia and the United States)
Rosales, Gutierrez
2016 Impact of FTA on
Venezuela-Colom-bia trade
Gravity equation estimated using panel data to evaluate trade determinants between Colombia and Venezuela
using data between 1995 and 2013 Source: own study.
METHODOLOGY
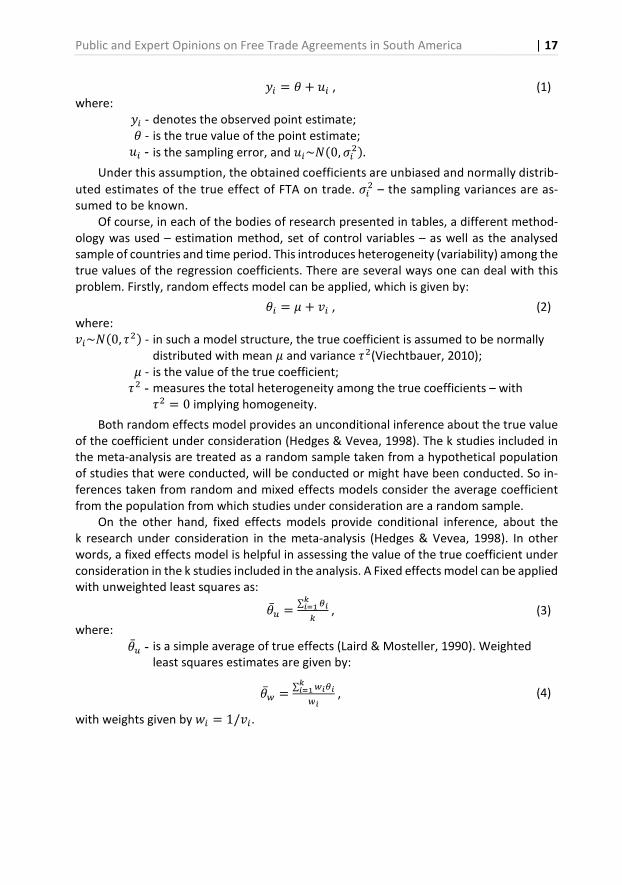
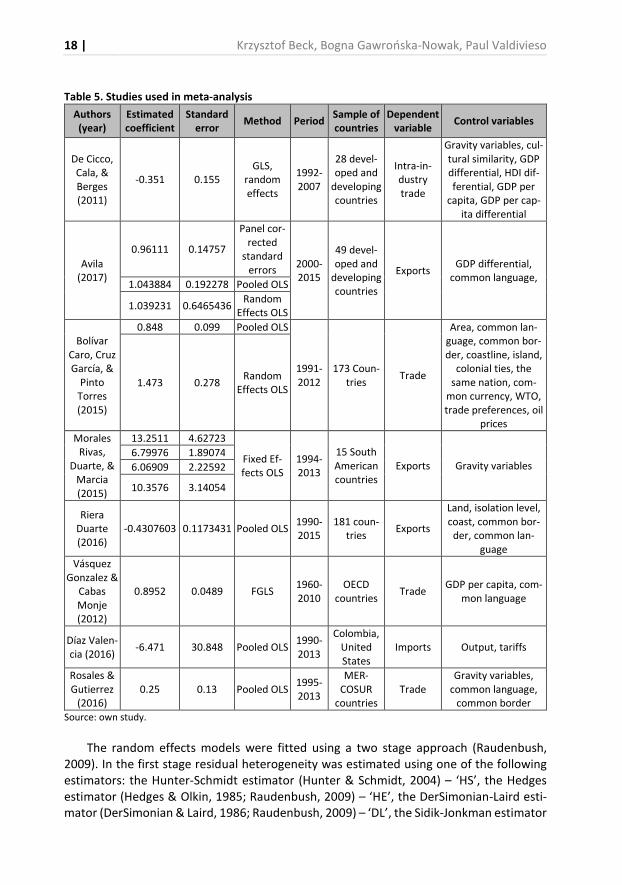
In order to analyse the impact of free trade agreements (FTA), meta-analysis of the results of the research into this subject was performed using the sample of eight Spanish Language papers. A detailed description of each research is depicted in Table 5. In our research we included models in which natural logarithm of some measure of trade was regressed on the FTA dummy variable along with other explanatory variables. Regressand is expressed in terms of natural logarithms, and concerns imports, exports intra-industry trade or trade as a whole. Due to that construction of the models if the estimated coefficient is �, countries
with FTA memberships experience on average (�� − 1) ∗ 100 percent more trade than countries outside the free trade area (Halvorsen & Palmquist, 1980). Still two points need to be made about this interpretation. A positive value of the coefficient does not unequivocally testify to trade creation of FTAs, as the additional trade can be a consequence of trade di-version. Secondly, this measure suffers from endogeneity issue, because a priori one can expect that countries that trade with one another a lot are more likely to establish a free trade association. The estimation strategy follows (Viechtbauer, 2010).
In meta-analysis values of the point estimate for the FTA dummy variables were con-sidered along with their respective standard errors. We assume that for i = 1, 2, …, k inde-pendent point estimates:
Public and Expert Opinions on Free Trade Agreements in South America | 17
�� = � + �� , (1) where:
�� - denotes the observed point estimate; � - is the true value of the point estimate;
�� - is the sampling error, and ��~�(0, ���).
Under this assumption, the obtained coefficients are unbiased and normally distrib-
uted estimates of the true effect of FTA on trade. ��� – the sampling variances are as-
sumed to be known. Of course, in each of the bodies of research presented in tables, a different method-
ology was used – estimation method, set of control variables – as well as the analysed sample of countries and time period. This introduces heterogeneity (variability) among the true values of the regression coefficients. There are several ways one can deal with this problem. Firstly, random effects model can be applied, which is given by:
�� = � + �� , (2) where: ��~�(0, ��) - in such a model structure, the true coefficient is assumed to be normally
distributed with mean � and variance ��(Viechtbauer, 2010); � - is the value of the true coefficient;
�� - measures the total heterogeneity among the true coefficients – with �� = 0 implying homogeneity.
Both random effects model provides an unconditional inference about the true value of the coefficient under consideration (Hedges & Vevea, 1998). The k studies included in the meta-analysis are treated as a random sample taken from a hypothetical population of studies that were conducted, will be conducted or might have been conducted. So in-ferences taken from random and mixed effects models consider the average coefficient from the population from which studies under consideration are a random sample.
On the other hand, fixed effects models provide conditional inference, about the k research under consideration in the meta-analysis (Hedges & Vevea, 1998). In other words, a fixed effects model is helpful in assessing the value of the true coefficient under consideration in the k studies included in the analysis. A Fixed effects model can be applied with unweighted least squares as:
�̅� =∑ ��
�� !
" , (3)
where:
�̅� - is a simple average of true effects (Laird & Mosteller, 1990). Weighted least squares estimates are given by:
�̅# =∑ #���
�� !
#� , (4)
with weights given by $� = 1/��.
18 | Krzysztof Beck, Bogna Gawrońska-Nowak, Paul Valdivieso
Table 5. Studies used in meta-analysis
Authors
(year)
Estimated
coefficient
Standard
error Method Period
Sample of
countries
Dependent
variable Control variables
De Cicco, Cala, & Berges (2011)
-0.351 0.155 GLS,
random effects
1992-2007
28 devel-oped and
developing countries
Intra-in-dustry trade
Gravity variables, cul-tural similarity, GDP differential, HDI dif-ferential, GDP per
capita, GDP per cap-ita differential
Avila (2017)
0.96111 0.14757
Panel cor-rected
standard errors
2000-2015
49 devel-oped and
developing countries
Exports GDP differential,
common language, 1.043884 0.192278 Pooled OLS
1.039231 0.6465436 Random
Effects OLS
Bolívar Caro, Cruz García, &
Pinto Torres (2015)
0.848 0.099 Pooled OLS
1991-2012
173 Coun-tries
Trade
Area, common lan-guage, common bor-der, coastline, island,
colonial ties, the same nation, com-
mon currency, WTO, trade preferences, oil
prices
1.473 0.278 Random
Effects OLS
Morales Rivas,
Duarte, & Marcia (2015)
13.2511 4.62723
Fixed Ef-fects OLS
1994-2013
15 South American countries
Exports Gravity variables 6.79976 1.89074
6.06909 2.22592
10.3576 3.14054
Riera Duarte (2016)
-0.4307603 0.1173431 Pooled OLS 1990-2015
181 coun-tries
Exports
Land, isolation level, coast, common bor-
der, common lan-guage
Vásquez Gonzalez &
Cabas Monje (2012)
0.8952 0.0489 FGLS 1960-2010
OECD countries
Trade GDP per capita, com-
mon language
Díaz Valen-cia (2016)
-6.471 30.848 Pooled OLS 1990-2013
Colombia, United States
Imports Output, tariffs
Rosales & Gutierrez
(2016) 0.25 0.13 Pooled OLS
1995-2013
MER-COSUR
countries Trade
Gravity variables, common language,
common border Source: own study.
The random effects models were fitted using a two stage approach (Raudenbush, 2009). In the first stage residual heterogeneity was estimated using one of the following estimators: the Hunter-Schmidt estimator (Hunter & Schmidt, 2004) – ‘HS’, the Hedges estimator (Hedges & Olkin, 1985; Raudenbush, 2009) – ‘HE’, the DerSimonian-Laird esti-mator (DerSimonian & Laird, 1986; Raudenbush, 2009) – ‘DL’, the Sidik-Jonkman estimator
Public and Expert Opinions on Free Trade Agreements in South America | 19
(Sidik & Jonkman, 2005a; 2005b) – ‘SJ’, the maximum-likelihood – ‘ML’ – and restricted maximum-likelihood estimator (Viechtbauer, 2005; Raudenbush, 2009) – ‘REML’, and the empirical Bayes estimator (Morris, 1983; Berkey et al., 1995) – ‘EB’. In the second stage �, �&, �', … , �) were estimated using weighted least squares with weights $� = 1/(�� +
��*), where ��* is the estimate of ��. Later on, the null hypothesis of ��=0 for random effects models was tested using Cochran’s Q-test (Hedges & Olkin, 1985).
Two sessions of estimations were run. In the first one, all models from all the articles were taken as a sample – in that instance, k amounted to 14 observations. In the second one the author’s preferred models were chosen, and in this case, k is given by eight observations. All the calculations were performed using the metafor package for R (Viechtbauer, 2010).
RESULTS AND DISCUSSION
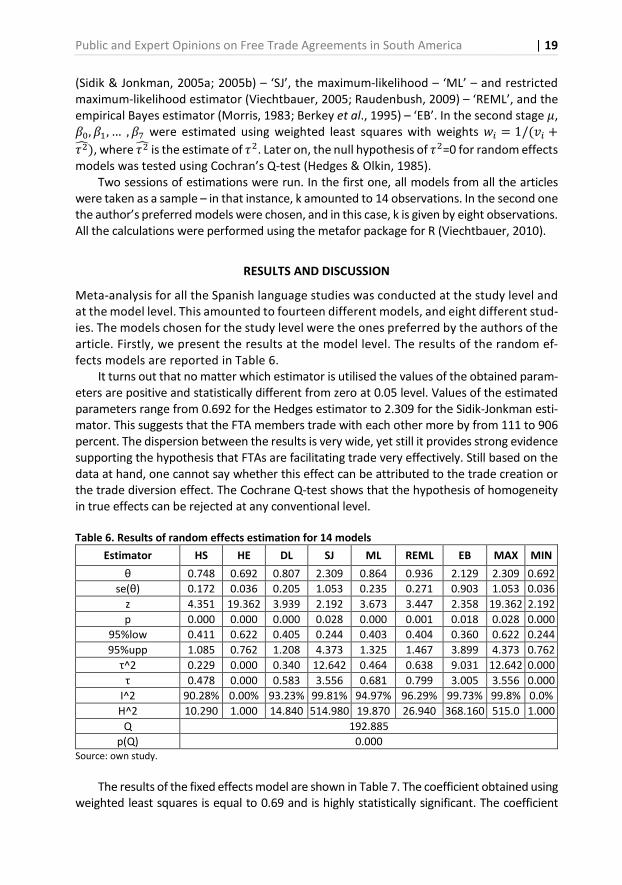
Meta-analysis for all the Spanish language studies was conducted at the study level and at the model level. This amounted to fourteen different models, and eight different stud-ies. The models chosen for the study level were the ones preferred by the authors of the article. Firstly, we present the results at the model level. The results of the random ef-fects models are reported in Table 6.
It turns out that no matter which estimator is utilised the values of the obtained param-eters are positive and statistically different from zero at 0.05 level. Values of the estimated parameters range from 0.692 for the Hedges estimator to 2.309 for the Sidik-Jonkman esti-mator. This suggests that the FTA members trade with each other more by from 111 to 906 percent. The dispersion between the results is very wide, yet still it provides strong evidence supporting the hypothesis that FTAs are facilitating trade very effectively. Still based on the data at hand, one cannot say whether this effect can be attributed to the trade creation or the trade diversion effect. The Cochrane Q-test shows that the hypothesis of homogeneity in true effects can be rejected at any conventional level.
Table 6. Results of random effects estimation for 14 models
Estimator HS HE DL SJ ML REML EB MAX MIN
θ 0.748 0.692 0.807 2.309 0.864 0.936 2.129 2.309 0.692
se(θ) 0.172 0.036 0.205 1.053 0.235 0.271 0.903 1.053 0.036
z 4.351 19.362 3.939 2.192 3.673 3.447 2.358 19.362 2.192
p 0.000 0.000 0.000 0.028 0.000 0.001 0.018 0.028 0.000
95%low 0.411 0.622 0.405 0.244 0.403 0.404 0.360 0.622 0.244
95%upp 1.085 0.762 1.208 4.373 1.325 1.467 3.899 4.373 0.762
τ^2 0.229 0.000 0.340 12.642 0.464 0.638 9.031 12.642 0.000
τ 0.478 0.000 0.583 3.556 0.681 0.799 3.005 3.556 0.000
I^2 90.28% 0.00% 93.23% 99.81% 94.97% 96.29% 99.73% 99.8% 0.0%
H^2 10.290 1.000 14.840 514.980 19.870 26.940 368.160 515.0 1.000
Q 192.885
p(Q) 0.000 Source: own study.
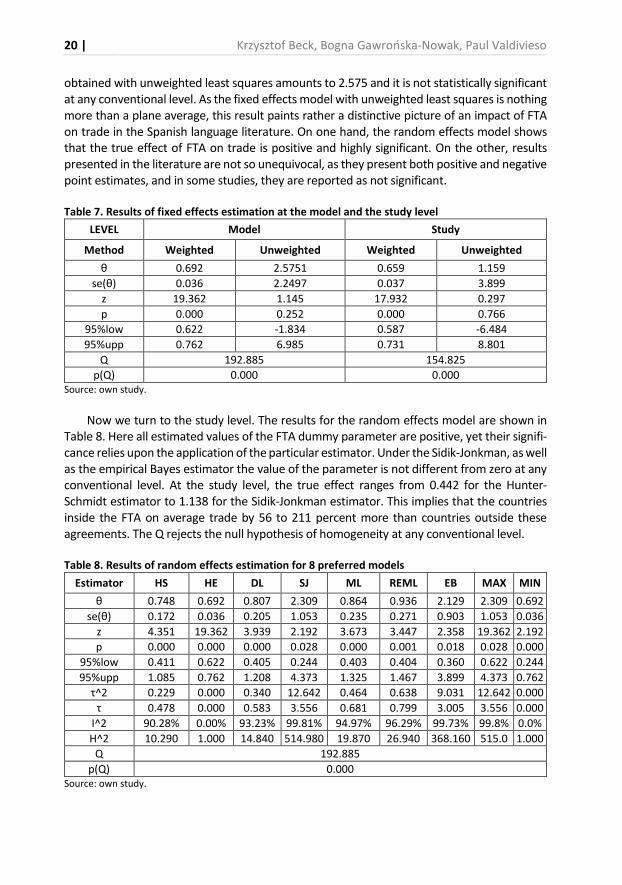
The results of the fixed effects model are shown in Table 7. The coefficient obtained using weighted least squares is equal to 0.69 and is highly statistically significant. The coefficient
20 | Krzysztof Beck, Bogna Gawrońska-Nowak, Paul Valdivieso
obtained with unweighted least squares amounts to 2.575 and it is not statistically significant at any conventional level. As the fixed effects model with unweighted least squares is nothing more than a plane average, this result paints rather a distinctive picture of an impact of FTA on trade in the Spanish language literature. On one hand, the random effects model shows that the true effect of FTA on trade is positive and highly significant. On the other, results presented in the literature are not so unequivocal, as they present both positive and negative point estimates, and in some studies, they are reported as not significant.
Table 7. Results of fixed effects estimation at the model and the study level
LEVEL Model Study
Method Weighted Unweighted Weighted Unweighted
θ 0.692 2.5751 0.659 1.159
se(θ) 0.036 2.2497 0.037 3.899
z 19.362 1.145 17.932 0.297
p 0.000 0.252 0.000 0.766
95%low 0.622 -1.834 0.587 -6.484
95%upp 0.762 6.985 0.731 8.801
Q 192.885 154.825
p(Q) 0.000 0.000 Source: own study.
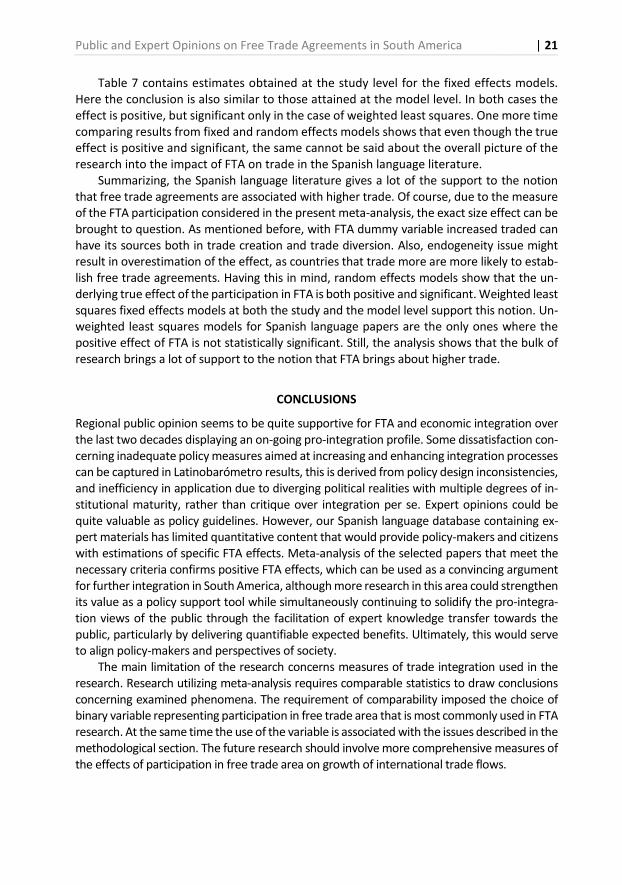
Now we turn to the study level. The results for the random effects model are shown in Table 8. Here all estimated values of the FTA dummy parameter are positive, yet their signifi-cance relies upon the application of the particular estimator. Under the Sidik-Jonkman, as well as the empirical Bayes estimator the value of the parameter is not different from zero at any conventional level. At the study level, the true effect ranges from 0.442 for the Hunter-Schmidt estimator to 1.138 for the Sidik-Jonkman estimator. This implies that the countries inside the FTA on average trade by 56 to 211 percent more than countries outside these agreements. The Q rejects the null hypothesis of homogeneity at any conventional level.
Table 8. Results of random effects estimation for 8 preferred models
Estimator HS HE DL SJ ML REML EB MAX MIN
θ 0.748 0.692 0.807 2.309 0.864 0.936 2.129 2.309 0.692
se(θ) 0.172 0.036 0.205 1.053 0.235 0.271 0.903 1.053 0.036
z 4.351 19.362 3.939 2.192 3.673 3.447 2.358 19.362 2.192
p 0.000 0.000 0.000 0.028 0.000 0.001 0.018 0.028 0.000
95%low 0.411 0.622 0.405 0.244 0.403 0.404 0.360 0.622 0.244
95%upp 1.085 0.762 1.208 4.373 1.325 1.467 3.899 4.373 0.762
τ^2 0.229 0.000 0.340 12.642 0.464 0.638 9.031 12.642 0.000
τ 0.478 0.000 0.583 3.556 0.681 0.799 3.005 3.556 0.000
I^2 90.28% 0.00% 93.23% 99.81% 94.97% 96.29% 99.73% 99.8% 0.0%
H^2 10.290 1.000 14.840 514.980 19.870 26.940 368.160 515.0 1.000
Q 192.885
p(Q) 0.000 Source: own study.
Public and Expert Opinions on Free Trade Agreements in South America | 21
Table 7 contains estimates obtained at the study level for the fixed effects models. Here the conclusion is also similar to those attained at the model level. In both cases the effect is positive, but significant only in the case of weighted least squares. One more time comparing results from fixed and random effects models shows that even though the true effect is positive and significant, the same cannot be said about the overall picture of the research into the impact of FTA on trade in the Spanish language literature.
Summarizing, the Spanish language literature gives a lot of the support to the notion that free trade agreements are associated with higher trade. Of course, due to the measure of the FTA participation considered in the present meta-analysis, the exact size effect can be brought to question. As mentioned before, with FTA dummy variable increased traded can have its sources both in trade creation and trade diversion. Also, endogeneity issue might result in overestimation of the effect, as countries that trade more are more likely to estab-lish free trade agreements. Having this in mind, random effects models show that the un-derlying true effect of the participation in FTA is both positive and significant. Weighted least squares fixed effects models at both the study and the model level support this notion. Un-weighted least squares models for Spanish language papers are the only ones where the positive effect of FTA is not statistically significant. Still, the analysis shows that the bulk of research brings a lot of support to the notion that FTA brings about higher trade.
CONCLUSIONS
Regional public opinion seems to be quite supportive for FTA and economic integration over the last two decades displaying an on-going pro-integration profile. Some dissatisfaction con-cerning inadequate policy measures aimed at increasing and enhancing integration processes can be captured in Latinobarómetro results, this is derived from policy design inconsistencies, and inefficiency in application due to diverging political realities with multiple degrees of in-stitutional maturity, rather than critique over integration per se. Expert opinions could be quite valuable as policy guidelines. However, our Spanish language database containing ex-pert materials has limited quantitative content that would provide policy-makers and citizens with estimations of specific FTA effects. Meta-analysis of the selected papers that meet the necessary criteria confirms positive FTA effects, which can be used as a convincing argument for further integration in South America, although more research in this area could strengthen its value as a policy support tool while simultaneously continuing to solidify the pro-integra-tion views of the public through the facilitation of expert knowledge transfer towards the public, particularly by delivering quantifiable expected benefits. Ultimately, this would serve to align policy-makers and perspectives of society.
The main limitation of the research concerns measures of trade integration used in the research. Research utilizing meta-analysis requires comparable statistics to draw conclusions concerning examined phenomena. The requirement of comparability imposed the choice of binary variable representing participation in free trade area that is most commonly used in FTA research. At the same time the use of the variable is associated with the issues described in the methodological section. The future research should involve more comprehensive measures of the effects of participation in free trade area on growth of international trade flows.
22 | Krzysztof Beck, Bogna Gawrońska-Nowak, Paul Valdivieso
REFERENCES
Ávila, H. (2017). El modelo de gravedad y los determinantes del comercio entre Colombia y sus principales socios económicos. Civilizar de Empresa y Economía, 12(1), 89-121. https://doi.org/10.22518/2462909X.688
Bárcena, A., Prado, A., Rosales, O., & Pérez, R. (2014). La Alianza del Pacífico y el MERCOSUR. Hacia la convergencia en la diversidad. Naciones Unidas Comisión Económica para América Latina y el Caribe (CEPAL).
Basco, A.I. (2017). La tecno-integración de América Latina: Instituciones, comercio exponencial y equidad en la era de los algoritmos. Inter-American Development Bank.
Benešová, I., Novotná, Z., Šánová, P., & Laputková, A. (2016). Economic comparison of agricultural sector of eurasian countries – is there any potential for development through economic coop-eration?. Agris On-line Papers in Economics and Informatics, 8(2), 19-31.
Berkey, C.S., Hoaglin, D.C., Mosteller, F., & Colditz, G.A. (1995). A Random-Effects Regression Model for Meta-Analysis. Statistics in Medicine, 14(4), 395-411. https://doi.org/10.1002/sim.4780140406
Bermúdez Torres, C.A. (2011). La integración regional a comienzos del siglo XXI: MERCOSUR y UNASUR. Memorias. Revista Digital de Historia y Arqueología desde el Caribe, 8(14).
Bizzozero, L. (2011a). América Latina a inicios de la segunda década del siglo XXI: entre el regionalismo estratégico y la regionalización fragmentada. Revista Brasileira de Política
Internacional, 54(1).
Bizzozero, L. (2011b). Aportes del MERCOSUR al regionalismo ya la teoría política de la integración regional. Una mirada desde los veinte años del proceso. Meridiano 47, 12(125), 11.
Bruslé, L.P. (2015). La integración continental sudamericana, inscripción espacial y dispositivo discursivo. Apuntes desde Bolivia, el país de contactos. Journal of Latin American
Geography, 14(2), 101-127. https://doi.org/10.1353/lag.2015.0025
Caballero Santos, S. (2014). El Acuerdo TransPacífico y su efecto en América Latina/The TransPacific Partnership Agreement and its effects on Latin America. Meridiano, 47, 15(141), 59.
Caro, L.M., García, N.C., & Torres, A.P. (2015). Modelo gravitacional del comercio internacional colombiano, 1991-2012. Economía & Región, 26, 245-270.
Crespo Stupková, L. (2016). Global value chain in agro-export production and its socio-economic im-pact in Michoacán, Mexico. Agris On-line Papers in Economics and Informatics, 8(1), 25-36.
De Cicco, J.A., Calá, C.D., & Berges, M. (2011). Determinantes nacionales del comercio intraindustrial en Argentina. Revista de Economía y Estadística, 49(2), 27-50.
DerSimonian, R., & Laird, N. (1986). Meta-Analysis in Clinical Trials. Controlled Clinical Trials, 7(3), 177-188. https://doi.org/10.1016/0197-2456(86)90046-2
Díaz Valencia, G.A. (2017). Incidencia del Tratado de Libre Comercio con Estados Unidos en la Competitividad del Sector Agrícola Colombiano: Casos del Arroz y Maíz. Revista de Economía
del Caribe, (19), 154-182.
Foxley, A. (2015). Bases para un desarrollo inclusivo. CIEPLAN.
Giacalone, R. (2013). Venezuela en Unasur: integración regional y discurso político. Desafíos, 25(1).
Gutiérrez, A. (2013). Estrategias de desarrollo divergentes: efectos sobre la integración económica entre Venezuela y Colombia. Desafíos, 25(1), 85-127.
Halvorsen, R., & Pamlquist, R. (1980). The Interpretation of Dummy Variables in Semilogarithmic Equations. The American Economic Review, 70(3), 474-475.
Hedges, L.V., & Olkin, I. (1985). Statistical Methods for Meta-Analysis. San Diego, CA: Academic Press.

Public and Expert Opinions on Free Trade Agreements in South America | 23
Hedges, L.V., & Vevea, J.L. (1998). Fixed- and Random-Effects Models in Meta-Analysis. Psychological
Methods, 3(4), 486-504. https://doi.org/10.1037/1082-989X.3.4.486
Higgins, J.P.T, & Thompson, S.G. (2002). Quantifying Heterogeneity in a Meta-analysis. Statistics in
Medicine, 23(11), 1663-1682. https://doi.org/10.1002/sim.1186
Hunter, J.E., & Schmidt, F.L. (2004). Methods of Meta-Analysis: Correcting Error and Bias in Research
Findings. 2nd edition. Newbury Park, CA: Sage.
Laird, N.L., & Mosteller, F. (1990). Some Statistical Methods for Combining Experimental Re-sults. International Journal of Technology Assessment in Health Care, 6(1), 5-30. https://doi.org/10.1017/S0266462300008916
Martínez Rangel, R., Garmendia, R., & Soto, E. (2012). El Consenso de Washington: la instauración de las políticas neoliberales en América Latina. Política y Cultura, (37), 35-64.
Morales Rivas, O., Duarte, N., & Marcia, G. (2015). Un Modelo de Gravedad Aplicado a las Exportaciones en Nicaragua. REICE Revista Electrónica de Investigación en Ciencias Económicas, 3(6), 1-13.
Morris, C.N. (1983). Parametric Empirical Bayes Inference: Theory and Applications. Journal of the Ameri-
can Statistical Association, 78(381), 47-55. https://doi.org/10.1080/01621459.1983.10477920
Nolte, D., & Wehner, L. (2014). La creciente presencia de la Alianza del Pacífico en América Latina. Iberoamericana (2001-), 14(53), 173-177. https://doi.org/10.18441/ibam.14.2014.53.173-177
Raudenbush, S.W. (2009). Analyzing Effect Sizes: Random Effects Models. In H. Cooper, L.V. Hedges, J.C. Valentine (Eds.). The Handbook of Research Synthesis and Meta-Analysis (2nd edition, pp. 295-315). New York: Russell Sage Foundation.
Rhi-Sausi, J.L., & Oddone, N. (2013). Integración regional y cooperación transfronteriza en los nuevos escenarios de América Latina. Investigación & Desarrollo, 21(1).
Riera, P. (2016). Evaluación del Tratado de Libre Comercio entre Chile y el Mercosur Mediante un Modelo Gravitacional. Master’s thesis. Santiago, Chile: Pontifical Catholic University of Chile.
Rojas, D., & Terán, J.M. (2016). La Alianza del Pacífico: nueva muestra del regionalismo en América Latina. OASIS, (24), 69-88. https://doi.org/10.18601/16577558.n24.05
Rosales, M., & Gutiérrez, A. (2016). Modelo Gravitacional del Comercio entre Venezuela y Colombia ¿Es Importante el Libre Comercio para aumentar el Intercambio Binacional?. La integración Económica entre Venezuela y Colombia: Evolución. Balance y Perspectivas, 99.
Shuaibu, M., & Oladayo, P. T. (2016). Determinants of human capital development in Africa: a panel data analysis. Oeconomia Copernicana, 7(4), 523-549. https://doi.org/10.12775/OeC.2016.030
Sidik, K., & Jonkman, J.N. (2005a). A Note on Variance Estimation in Random Effects Meta-Regression. Journal of Biopharmaceutical Statistics, 15(5), 823-838. https://doi.org/10.1081/BIP-200067915
Sidik, K., & Jonkman, J.N. (2005b). Simple Heterogeneity Variance Estimation for Meta-Analysis. Journal of
the Royal Statistical Society C, 54(2), 367-384. https://doi.org/10.1111/j.1467-9876.2005.00489.x
Świerczyńska, K. (2017). Structural transformation and economic development in the best perform-ing sub-Saharan African states. Equilibrium. Quarterly Journal of Economics and Economic Pol-
icy, 12(4), 547-571. https://doi.org/10.24136/eq.v12i4.29
Thoene, U., Zamora, C., Júnior, E., & Londoño, M.C. (2017). La Alianza del Pacífico y el regionalismo latinoamericano: En búsqueda de una revitalización autonomista de la integración. Análisis
Político, 30(89), 91-110. https://doi.org/10.15446/anpol.v30n89.66219
Tokatlian, J. (2012). Latinoamérica y el complejo integracionista: Un Concepto a Debate. Desarrollo
Económico, 51, (204), 475-492.
Ulloa Urrutia, A., & Marambio, S. (2014). Latinoamérica y el Caribe, desafíos comerciales de la región y una agenda para la integración Contenido. Latinoamérica.

24 | Krzysztof Beck, Bogna Gawrońska-Nowak, Paul Valdivieso
Vásquez González, B.A., & Cabas Monje, J.H. (2012). Análisis De Las Exportaciones De Chile, A Los Países De La Ocde, Mediante El Modelo Gravitacional. Proceedings del XXVIII Encuentro Nacional de Facultades de Administración y Economía, ENEFA Proceedings – Vol. 5, 2012 ASFAE.
Viechtbauer, W. (2005). Bias and Efficiency of Meta-Analytic Variance Estimators in the Random-Effects Model. Journal of Educational and Behavioral Statistics, 30(3), 261-293. https://doi.org/10.3102/10769986030003261
Viechtbauer, W. (2010). Conducting Meta-Analyses in R with the metaphor Package. Journal of Sta-
tistical Software, 36(3), 1-48. https://doi.org/10.18637/jss.v036.i03
World Trade Organization and World Bank. (2015). La función del comercio en la eliminación de la pobreza. Geneve: World Trade Organization.
Public and Expert Opinions on Free Trade Agreements in South America | 25
Authors
The contribution share of authors is equal and amounted to 33.33% each of them.
Krzysztof Beck
Assistant Professor, director of the Econometrics Department. Graduated from Cracow University of Economics and received PhD degree in Economics at Faculty of International Business and Eco-nomics at Poznan University of Business and Economics. A recipient of an award in the Central Statistical Office of Poland’s competition for the best doctoral dissertation in Statistics. Since 2014, has been the head of Applied Economics Institute at Lazarski University in Warsaw. A lec-turer on English-language double degree studies accredited by Coventry University. His main in-terests include: international economics, international business cycles, international trade, cur-rency unions, macroeconomics, econometrics, applied econometrics, mathematical economics, bayesian statistics, and programming. Correspondence to: Dr. Krzysztof Beck, Lazarski University in Warsaw, ul Świeradowska 43, 02-662 Warszawa, Poland, e-mail: [email protected] ORCID http://orcid.org/0000-0003-3679-2962
Bogna Gawrońska-Nowak
Associate Professor. Graduated from the University of Lodz, Coimbra University, Erasmus Univer-sity in Rotterdam and London School of Economics. She did her PhD in Economics at Faculty of Economics and Sociology at the University of Lodz and her habilitation at the Faculty of Interna-tional Business and Economics at Poznan University of Business and Economics. Since 2009, she has been the head of Department of Economics at Lazarski University in Warsaw. She is a lecturer on English-language double degree studies accredited by Coventry University. Correspondence to: Prof. UŁa, dr hab. Bogna Gawronska-Nowak, Lazarski University in Warsaw, ul Świeradowska 43, 02-662 Warszawa, Poland, e-mail: [email protected] ORCID http://orcid.org/0000-0003-3651-7637
Paul Valdivieso
A business economist and a consultant. Graduated from Andrés Bello Catholic University, University of Wales and Warsaw University of Technology Business School. He completed his PhD in Economics at Kozminski University in Warsaw. At present, he works in an international consulting firm, advising multinational groups with the financial planning of cross-border intra-group transactions. He worked at the Department of Economics at Lazarski University in Warsaw as a lecturer, and currently is a member of the Institute of Socio-Economic Enquiry in Warsaw and acts as a master’s thesis supervisor within the Faculty of Economics and Business at University of Chile in Santiago. He has published articles in international and financial economics as well as strategic management. Correspondence to: Dr. Paul Valdivieso, ISEE Instyt Społeczno-Ekonomicznych Ekspertyz w Warszawie, ul. Mickiewicza 74 lok. 74, 01-650 Warszawa, Poland, e-mail: [email protected]
Acknowledgements and Financial Disclosure
This article has been presented as the academic paper at the scientific conference GLOB2018: “Globalization and Regionalization in the Contemporary World: Competitiveness, Development, Sustainability” organized in Kraków on 21-22 September 2019.
26 | Krzysztof Beck, Bogna Gawrońska-Nowak, Paul Valdivieso
Copyright and License
This article is published under the terms of the Creative Commons Attribution – NoDerivs (CC BY-ND 4.0) License
http://creativecommons.org/licenses/by-nd/4.0/
Published by the Centre for Strategic and International Entrepreneurship – Krakow, Poland
The copyediting and proofreading of articles in English is financed in the framework of contract No. 913/P-DUN/2019 by the Ministry of Science and Higher Education of the Republic of Poland committed to activities aimed at science promotion.
This publication has been co-financed by the European Commission Representation in Poland. The European Commission, or any person acting on its behalf, is not re-sponsible for the use of the information contained in this publication. This publication reflects the views only of the authors, and the European Commission cannot be held responsible for any use which may be made of the information contained therein.
2019, Vol. 7, No. 2 10.15678/EBER.2019.070202
Shadow Economy and its Impact on Demand
at the Investment Market of the Country
Yuriy Bilan, Tatiana Vasylieva, Sergij Lyeonov, Inna Tiutiunyk
A B S T R A C T
Objective: The objective of the research is to study the link between drivers of the shadow economy and the demand level on the investment market.
Research Design & Methods: Based on the Shapiro-Wilk test, the normality of capital investment distribution and the shadow economy level of the European Union coun-tries and Ukraine are evaluated. Spearman and Shapiro-Wilk tests are used to identify the most relevant indicators of impact.
Findings: The analysis of the changing dynamics regarding the capital investment vol-ume and the shadow economy level in Ukraine and the EU countries during 2010-2016 shows that there is an inverse link between them – the growth of the shadow economy has a negative impact on the capital investment volume in the country.
Implications & Recommendations: This research proves significant influence of the shadow economy on the demand level on the investment market and underlines the necessity to review the current state policy to stimulate the demand on the investment market from the viewpoint of the most relevant shadow drivers.
Contribution & Value Added: The scientific contribution of the article is that existing research on the impact of shadow economy on the economic development of countries remains fragmented, as well as studies assessing its effect on a country’s investment attractiveness. The constructed econometric model may provide some insight into bet-ter understanding of the most influential factors affecting a country’s investment at-tractiveness and the immediate response to it.
Article type: research article
Keywords: shadow economy; investment activities; money laundering; legalisa-tion; corruption
JEL codes: F63, G17, H3,K220
Received: 27 November 2018 Revised: 28 February 2019 Accepted: 5 March 2019
Suggested citation:
Bilan, Y., Vasylieva, T., Lyeonov, S., & Tiutiunyk, I. (2019). Shadow Economy and its Impact on De-mand at the Investment Market of the Country. Entrepreneurial Business and Economics Review, 7(2), 27-43. https://doi.org/10.15678/EBER.2019.070202
28 | Yuriy Bilan,Tatiana Vasylieva, Sergij Lyeonov, Inna Tiutiunyk
INTRODUCTION
Under conditions of the financial resources deficit, internal and external investments are significant tools to fasten rates of economic growth and to create a possibility to move to the qualitatively new level of a country’s development (Skare & Porada-Rochoń, 2019).
Specialists of the United Nations Conference on Trade and Development define an increase in the foreign direct investment (FDI) volumes and qualitative transformation of their flows as a key dominant to achieve Millennium Development Goals. Such goals have an obvious social and economic focus, so that is why today the important task for govern-ments of all countries is to set a clear and stable relationship in the investing sphere.
Investments are observed as factors of the technical and technological production ren-ovation, structural shifts in the national economy, an increase in the economic qualitative indicators at the micro and macro levels, a guarantee of a country’s macroeconomic stability (Rahimi, 2016; Damoska Sekuloska, 2018; Nazarczuk & Krajewska, 2018; Do & Park, 2018; Špička, 2018). The formation of the country’s favorable investment environment, being un-der the influence of external and internal factors, is considered to be the basis for investment attractiveness of any country (Cheba & Szopik-Depczyńska, 2017). One of the biggest de-structive factors is the shadow economy (Al-Sadig, 200; Blajer-Gołębiewska & Kos, 2016; Bobenič Hintošová et al., 2018; Kostyuchenko et al., 2018; Leonov et al., 2014; 2018; Vasi-lyeva, 2013, 2016, 2018).
According to United Nations Office on Drugs and Crime (2018), the annual amount of money laundering is equal to 2-5% of the world GDP and is said to cause a significant im-pact on the economic development indicators of a country. It is observed by investors as one of the main threats to effective capital investment.
Thus, the performed analysis shows that there is a great changeability and instability of the FDI volumes in the majority of the analysed countries and updates the necessity to define the most significant factors of impact on them.
Therefore, the main objective of the article is to measure the impact made by some drivers of the shadow economy (SE) on the investment activity in Ukraine and the EU coun-tries. While identifying them, we use statistical methods such as the Shapiro-Wilk test, Spearman’s rank correlation, econometric modelling.
The remainder of the article is arranged as follows. In the second section, we analyse the current studies of the shadow economy impact on investment activity in a country. In the third section the shadow economy drivers which have the greatest impact on the de-mand level at the country’s FDI are analysed. In the fourth section, we present a correla-tion analysis between the volume of capital investment and selected variables. Based on the set dependencies, a mathematic model is built. In section 5, we present our conclu-sions and suggestions for further research.
LITERATURE REVIEW
The degree of the interrelation between the shadow economy and a country’s investment attractiveness has been actively studied by representatives of the world countries’ inter-national economic community. The available theoretical and empirical studies have not provided an unambiguous answer to this problem. One of the reasons for such a situation
Shadow Economy and its Impact on Demand at the Investment Market… | 29
is the fact that the susceptibility level of a country’s investment development indicators from the shadow economy level is defined not only by the objective reasons of their inter-relation but also by the economic development stability, the economic security level, in-vestment potential, the existence of an economic or political crisis in the country. On the other hand, there are many scientific works which deal with the determinants of the shadow economy, the correlation level evaluation between general indicators of the shadow economy and direct foreign investment volume. However, nowadays, there are not detailed investigations of the impact made by separate factors of the shadow economy on the investment level and identification of the most influential ones.
Determinants of Shadow Economy
The scientific literature has a great variety of approaches to identify the most influential determinants of the shadow economy, which differ with the impact factors and results of their action degree and directions assessment.
Many authors (Sookram et al., 2009; Williams, & Nadin, 2012) studied the shadow economy in terms of its relationship with the labour market. According to Wiseman (2013), employment problems in the country, high level of unemployment become the reasons for an increase in informal employment. While studying the labour market in Poland, Cich-ocki and Tyrowicz (2010) made conclusions that on the one hand, the shadow economy factors are taxation disorders at the official labour market, and on the other hand, the absence of the demand for some professions on the official market.
Another factor, observed in terms of the influence in the shadow economy, is the con-fidence level in the government and good governance. Teobaldelli and Schneider (2013), Ipatov et al. (2018) confirmed that countries where the fiscal regulation of the economy is carried out on a democratic base, had lower shadow economy.
Based on the examples of foreign experience, Krumplyte (2008) demonstrates that countries with a high tax burden (52-55%) are more competitive and have a small amount of the shadow economy (Sweden, Denmark, Finland). Countries with a relatively low tax burden (up to 20%) have the shadow economy of over 60% of GDP (Georgia, Mexico).
In general, for most industrial countries the following factors influence the level of the shadow economy (Enste, 2015): tax burden and excessive contributions of social insur-ance; frequency and intensity of the regulation of officially recorded economy, extremely strict regulation of the labour market with untimely retirement, growing unemployment rate and limitation of possible work hours per week, which define the search of illegal jobs. Usually, countries with a high level of the shadow economy demonstrate a low level of being ready to pay taxes, defined by corruption, tolerance of the state, and low respect and loyalty to public organisations. Analysing the countries of the Central and Eastern Eu-rope, including the Baltic states, scientists (Schneider, 2007) point to other reasons which specify the shadow economy: incompetence of official institutions (legal acts, bureau-cracy, judicial practice); corruption which undermines the confidence in government; weak realisation of legislation, impossibility or unwillingness to protect the property rights; high expenses for business development and burden on business administration; low probability of the fact that it is possible to avoid it if one avoids paying taxes or doing illegal work; extremely high bureaucracy.
The level of the shadow economy in Lithuania during 2000-2011 is explained by such factors as labour power velocity, the volume of the international trade, the private sector
30 | Yuriy Bilan,Tatiana Vasylieva, Sergij Lyeonov, Inna Tiutiunyk
crediting and business freedom index. In Estonia and Lithuania, the limitations of the private sector credit are determinant factors which influence the scales of the shadow economy.
Drivers of Shadow Economy and Investment Activities
There are various empirical studies on the link between separate elements in the shadow economy and the investment activities. Some of them have argued that the shadow econ-omy impeded the investment growth. However, there are a lot of studies identifying the shadow economy as an important determinant of the FDI attracted by a country (Wei, 2000; Cleeve, 2008; Al-Sadig, 2007; Asiedu, 2006; Morrissey et al., 2012; Omidie et al., 2017, Formankova et al., 2018; Nunes et al., 2017).
According to the first hypothesis, the shadow economy negatively affects the level of social and economic development of a country, distorts the indicators of official statistics and therefore would lead to ineffective macroeconomic policy. Abed and Davoodi (2002) study a negative impact of the shadow economy on the FDI for 24 transition countries.
The similar results of the negative influence, made by corruption, on total FDI in Eastern Europe and the former Soviet Union are provided by Smarzynska and Wei (2000). Lambsdorff and Cornelius (2000) investigated the negative impact of the shadow economy on FDI for the African countries. They found that corruption deterred FDI more than local investments.
On the other hand, the shadow economy is characterised by a range of positive effects on investment activity in a country. Based on the data of 73 countries, Egger and Winner (2005) made a conclusion that foreign companies being interested in mak-ing FDI might use various channels of money laundering, corruption schemes in order to receive special conditions.
Abror (2015) analysed the regional effect of shadow economies on FDI for 40 coun-tries divided into four groups (Europe, South & North America, Africa & Middle East, Asia & Oceania) over the period from 1999 to 2009 using a panel data method. He made a conclusion that the European countries have a statistically significant and negative relationship between the SE and FDI. South and North America countries have a statis-tically significant and positive relationship between them. Janicki (2004) concluded that the trade openness was the most important determinant of FDI for eight EU countries (Bulgaria, the Czech Republic, Estonia, Hungary, Poland, Slovakia, Slovenia, Romania) and Ukraine. The salary level had also a significant influence. The lower it was, the higher interest grew among foreign investors.
Riedl (2009) defined the flowing factors of influence on the direct foreign invest-ments for new EU countries (The Czech Republic, Estonia, Hungary, Latvia, Lithuania, Poland, Slovakia and Slovenia): GDP, concentration of the industry and agglomeration had a positive impact, the salary level – negative. For such countries as the Czech Re-public, Hungary, Poland, etc., Demirhan (2008) defined that trade openness positively influences FDI, inflation and tax rate – negatively.
A great number of researchers suggests that FDI inflows in the developing econo-mies favourably related to the openness to trade (Zdziarski, Światowiec-Szczepańska, Troilo, & Małys, 2017). Addison and Heshmati (2003) examined the impact of FDI in al-most 50 developing countries using exports and imports as a percentage share of GDP. Their findings indicate that there is a positive and significant relationship between both of them.
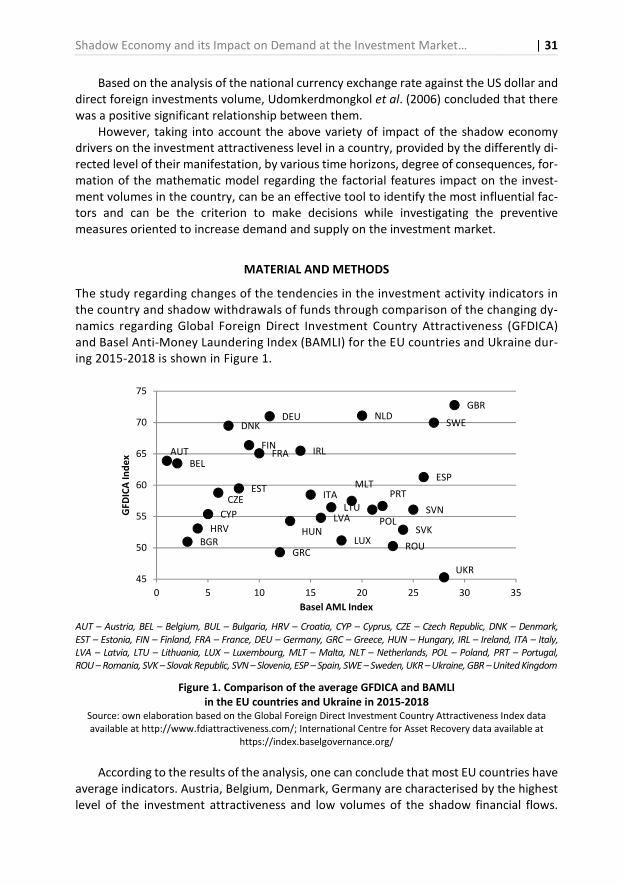
Shadow Economy and its Impact on Demand at the Investment Market… | 31
Based on the analysis of the national currency exchange rate against the US dollar and direct foreign investments volume, Udomkerdmongkol et al. (2006) concluded that there was a positive significant relationship between them.
However, taking into account the above variety of impact of the shadow economy drivers on the investment attractiveness level in a country, provided by the differently di-rected level of their manifestation, by various time horizons, degree of consequences, for-mation of the mathematic model regarding the factorial features impact on the invest-ment volumes in the country, can be an effective tool to identify the most influential fac-tors and can be the criterion to make decisions while investigating the preventive measures oriented to increase demand and supply on the investment market.
MATERIAL AND METHODS
The study regarding changes of the tendencies in the investment activity indicators in the country and shadow withdrawals of funds through comparison of the changing dy-namics regarding Global Foreign Direct Investment Country Attractiveness (GFDICA) and Basel Anti-Money Laundering Index (BAMLI) for the EU countries and Ukraine dur-ing 2015-2018 is shown in Figure 1.
AUT – Austria, BEL – Belgium, BUL – Bulgaria, HRV – Croatia, CYP – Cyprus, CZE – Czech Republic, DNK – Denmark,
EST – Estonia, FIN – Finland, FRA – France, DEU – Germany, GRC – Greece, HUN – Hungary, IRL – Ireland, ITA – Italy,
LVA – Latvia, LTU – Lithuania, LUX – Luxembourg, MLT – Malta, NLT – Netherlands, POL – Poland, PRT – Portugal,
ROU – Romania, SVK – Slovak Republic, SVN – Slovenia, ESP – Spain, SWE – Sweden, UKR – Ukraine, GBR – United Kingdom
Figure 1. Comparison of the average GFDICA and BAMLI
in the EU countries and Ukraine in 2015-2018
Source: own elaboration based on the Global Foreign Direct Investment Country Attractiveness Index data available at http://www.fdiattractiveness.com/; International Centre for Asset Recovery data available at
https://index.baselgovernance.org/
According to the results of the analysis, one can conclude that most EU countries have average indicators. Austria, Belgium, Denmark, Germany are characterised by the highest level of the investment attractiveness and low volumes of the shadow financial flows.
AUTBEL
BGRHRV
CYP
CZE
DNK
EST
FINFRA
DEU
GRC
HUN
IRL
ITA
LVALTU
LUX
MLT
NLD
POL
PRT
ROU
SVK
SVN
ESP
SWE
UKR
GBR
45
50
55
60
65
70
75
0 5 10 15 20 25 30 35
GF
DIC
A I
nd
ex
Basel AML Index
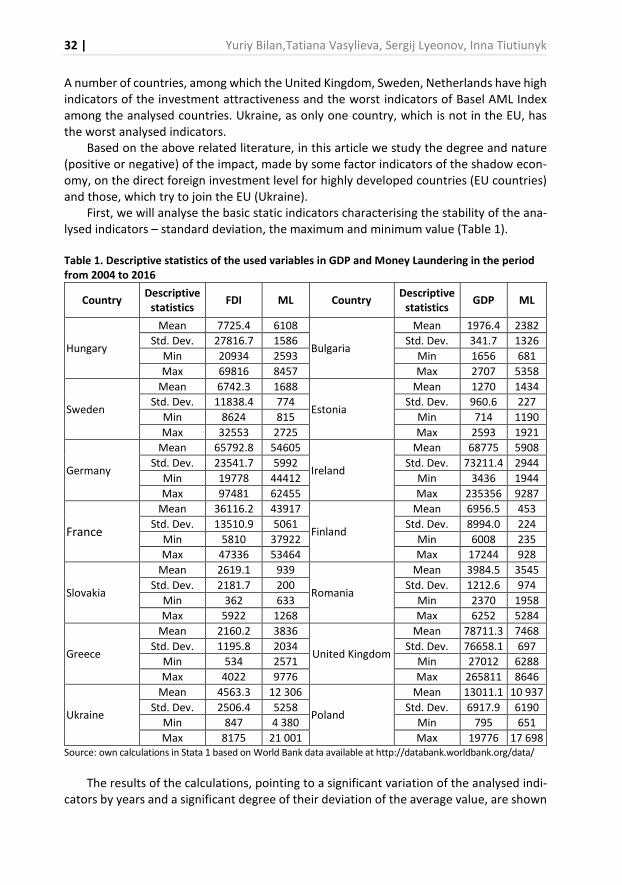
32 | Yuriy Bilan,Tatiana Vasylieva, Sergij Lyeonov, Inna Tiutiunyk
A number of countries, among which the United Kingdom, Sweden, Netherlands have high indicators of the investment attractiveness and the worst indicators of Basel AML Index among the analysed countries. Ukraine, as only one country, which is not in the EU, has the worst analysed indicators.
Based on the above related literature, in this article we study the degree and nature (positive or negative) of the impact, made by some factor indicators of the shadow econ-omy, on the direct foreign investment level for highly developed countries (EU countries) and those, which try to join the EU (Ukraine).
First, we will analyse the basic static indicators characterising the stability of the ana-lysed indicators – standard deviation, the maximum and minimum value (Table 1).
Table 1. Descriptive statistics of the used variables in GDP and Money Laundering in the period
from 2004 to 2016
Country Descriptive
statistics FDI ML Country
Descriptive
statistics GDP ML
Hungary
Mean 7725.4 6108
Bulgaria
Mean 1976.4 2382
Std. Dev. 27816.7 1586 Std. Dev. 341.7 1326
Min 20934 2593 Min 1656 681
Max 69816 8457 Max 2707 5358
Sweden
Mean 6742.3 1688
Estonia
Mean 1270 1434
Std. Dev. 11838.4 774 Std. Dev. 960.6 227
Min 8624 815 Min 714 1190
Max 32553 2725 Max 2593 1921
Germany
Mean 65792.8 54605
Ireland
Mean 68775 5908
Std. Dev. 23541.7 5992 Std. Dev. 73211.4 2944
Min 19778 44412 Min 3436 1944
Max 97481 62455 Max 235356 9287
France
Mean 36116.2 43917
Finland
Mean 6956.5 453
Std. Dev. 13510.9 5061 Std. Dev. 8994.0 224
Min 5810 37922 Min 6008 235
Max 47336 53464 Max 17244 928
Slovakia
Mean 2619.1 939
Romania
Mean 3984.5 3545
Std. Dev. 2181.7 200 Std. Dev. 1212.6 974
Min 362 633 Min 2370 1958
Max 5922 1268 Max 6252 5284
Greece
Mean 2160.2 3836
United Kingdom
Mean 78711.3 7468
Std. Dev. 1195.8 2034 Std. Dev. 76658.1 697
Min 534 2571 Min 27012 6288
Max 4022 9776 Max 265811 8646
Ukraine
Mean 4563.3 12 306
Poland
Mean 13011.1 10 937
Std. Dev. 2506.4 5258 Std. Dev. 6917.9 6190
Min 847 4 380 Min 795 651
Max 8175 21 001 Max 19776 17 698 Source: own calculations in Stata 1 based on World Bank data available at http://databank.worldbank.org/data/
The results of the calculations, pointing to a significant variation of the analysed indi-cators by years and a significant degree of their deviation of the average value, are shown
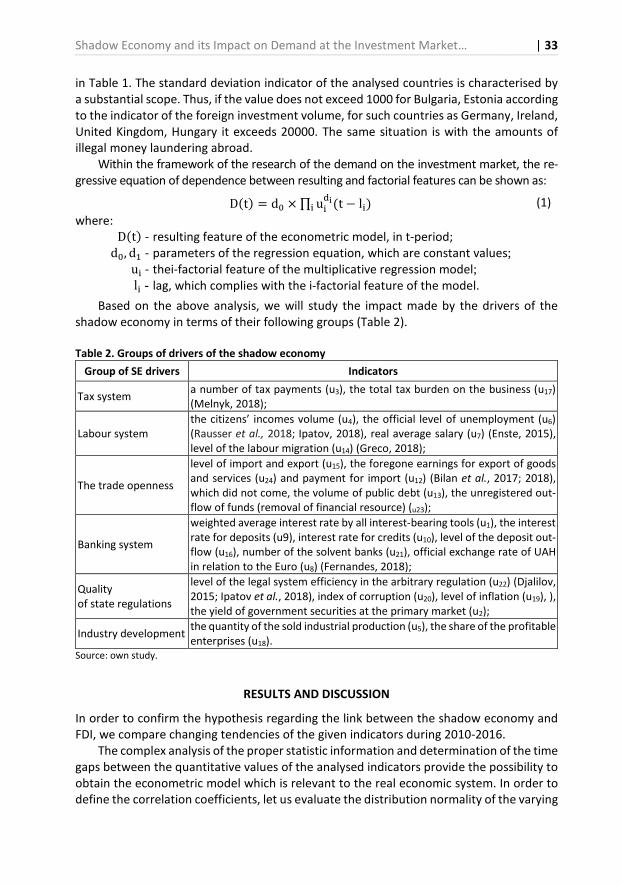
Shadow Economy and its Impact on Demand at the Investment Market… | 33
in Table 1. The standard deviation indicator of the analysed countries is characterised by a substantial scope. Thus, if the value does not exceed 1000 for Bulgaria, Estonia according to the indicator of the foreign investment volume, for such countries as Germany, Ireland, United Kingdom, Hungary it exceeds 20000. The same situation is with the amounts of illegal money laundering abroad.
Within the framework of the research of the demand on the investment market, the re-gressive equation of dependence between resulting and factorial features can be shown as:
D�t� = d� × ∏ u�
� �t − l��� (1)
where: D�t� - resulting feature of the econometric model, in t-period;
d�, d� - parameters of the regression equation, which are constant values; u� - thei-factorial feature of the multiplicative regression model; l� - lag, which complies with the i-factorial feature of the model.
Based on the above analysis, we will study the impact made by the drivers of the shadow economy in terms of their following groups (Table 2).
Table 2. Groups of drivers of the shadow economy
Group of SE drivers Indicators
Tax system a number of tax payments (u3), the total tax burden on the business (u17) (Melnyk, 2018);
Labour system the citizens’ incomes volume (u4), the official level of unemployment (u6) (Rausser et al., 2018; Ipatov, 2018), real average salary (u7) (Enste, 2015), level of the labour migration (u14) (Greco, 2018);
The trade openness
level of import and export (u15), the foregone earnings for export of goods and services (u24) and payment for import (u12) (Bilan et al., 2017; 2018), which did not come, the volume of public debt (u13), the unregistered out-flow of funds (removal of financial resource) (u23);
Banking system
weighted average interest rate by all interest-bearing tools (u1), the interest rate for deposits (u9), interest rate for credits (u10), level of the deposit out-flow (u16), number of the solvent banks (u21), official exchange rate of UAH in relation to the Euro (u8) (Fernandes, 2018);
Quality of state regulations
level of the legal system efficiency in the arbitrary regulation (u22) (Djalilov, 2015; Ipatov et al., 2018), index of corruption (u20), level of inflation (u19), ), the yield of government securities at the primary market (u2);
Industry development the quantity of the sold industrial production (u5), the share of the profitable enterprises (u18).
Source: own study.
RESULTS AND DISCUSSION
In order to confirm the hypothesis regarding the link between the shadow economy and FDI, we compare changing tendencies of the given indicators during 2010-2016.
The complex analysis of the proper statistic information and determination of the time gaps between the quantitative values of the analysed indicators provide the possibility to obtain the econometric model which is relevant to the real economic system. In order to define the correlation coefficients, let us evaluate the distribution normality of the varying
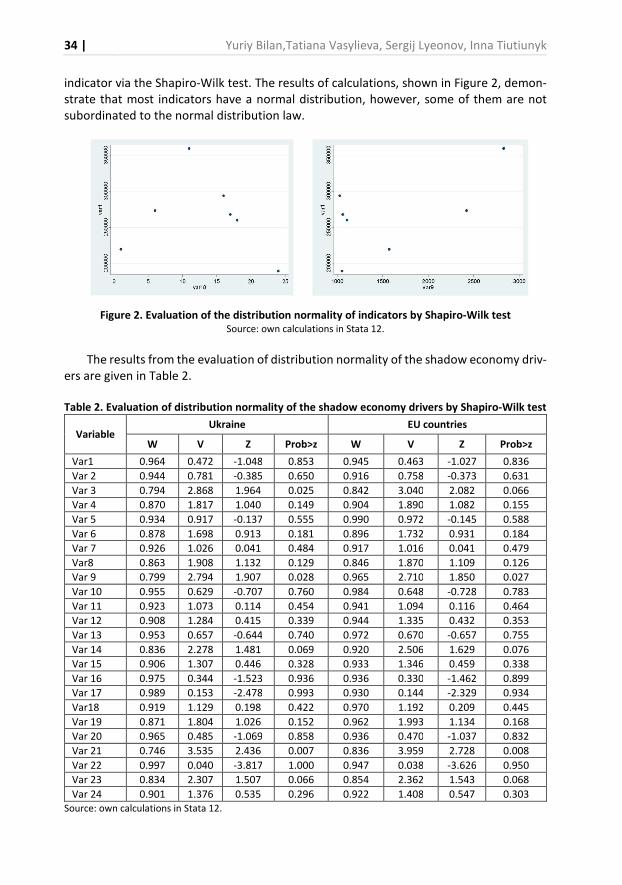
34 | Yuriy Bilan,Tatiana Vasylieva, Sergij Lyeonov, Inna Tiutiunyk
indicator via the Shapiro-Wilk test. The results of calculations, shown in Figure 2, demon-strate that most indicators have a normal distribution, however, some of them are not subordinated to the normal distribution law.
Figure 2. Evaluation of the distribution normality of indicators by Shapiro-Wilk test
Source: own calculations in Stata 12.
The results from the evaluation of distribution normality of the shadow economy driv-ers are given in Table 2.
Table 2. Evaluation of distribution normality of the shadow economy drivers by Shapiro-Wilk test
Variable Ukraine EU countries
W V Z Prob>z W V Z Prob>z
Var1 0.964 0.472 -1.048 0.853 0.945 0.463 -1.027 0.836
Var 2 0.944 0.781 -0.385 0.650 0.916 0.758 -0.373 0.631
Var 3 0.794 2.868 1.964 0.025 0.842 3.040 2.082 0.066
Var 4 0.870 1.817 1.040 0.149 0.904 1.890 1.082 0.155
Var 5 0.934 0.917 -0.137 0.555 0.990 0.972 -0.145 0.588
Var 6 0.878 1.698 0.913 0.181 0.896 1.732 0.931 0.184
Var 7 0.926 1.026 0.041 0.484 0.917 1.016 0.041 0.479
Var8 0.863 1.908 1.132 0.129 0.846 1.870 1.109 0.126
Var 9 0.799 2.794 1.907 0.028 0.965 2.710 1.850 0.027
Var 10 0.955 0.629 -0.707 0.760 0.984 0.648 -0.728 0.783
Var 11 0.923 1.073 0.114 0.454 0.941 1.094 0.116 0.464
Var 12 0.908 1.284 0.415 0.339 0.944 1.335 0.432 0.353
Var 13 0.953 0.657 -0.644 0.740 0.972 0.670 -0.657 0.755
Var 14 0.836 2.278 1.481 0.069 0.920 2.506 1.629 0.076
Var 15 0.906 1.307 0.446 0.328 0.933 1.346 0.459 0.338
Var 16 0.975 0.344 -1.523 0.936 0.936 0.330 -1.462 0.899
Var 17 0.989 0.153 -2.478 0.993 0.930 0.144 -2.329 0.934
Var18 0.919 1.129 0.198 0.422 0.970 1.192 0.209 0.445
Var 19 0.871 1.804 1.026 0.152 0.962 1.993 1.134 0.168
Var 20 0.965 0.485 -1.069 0.858 0.936 0.470 -1.037 0.832
Var 21 0.746 3.535 2.436 0.007 0.836 3.959 2.728 0.008
Var 22 0.997 0.040 -3.817 1.000 0.947 0.038 -3.626 0.950
Var 23 0.834 2.307 1.507 0.066 0.854 2.362 1.543 0.068
Var 24 0.901 1.376 0.535 0.296 0.922 1.408 0.547 0.303 Source: own calculations in Stata 12.
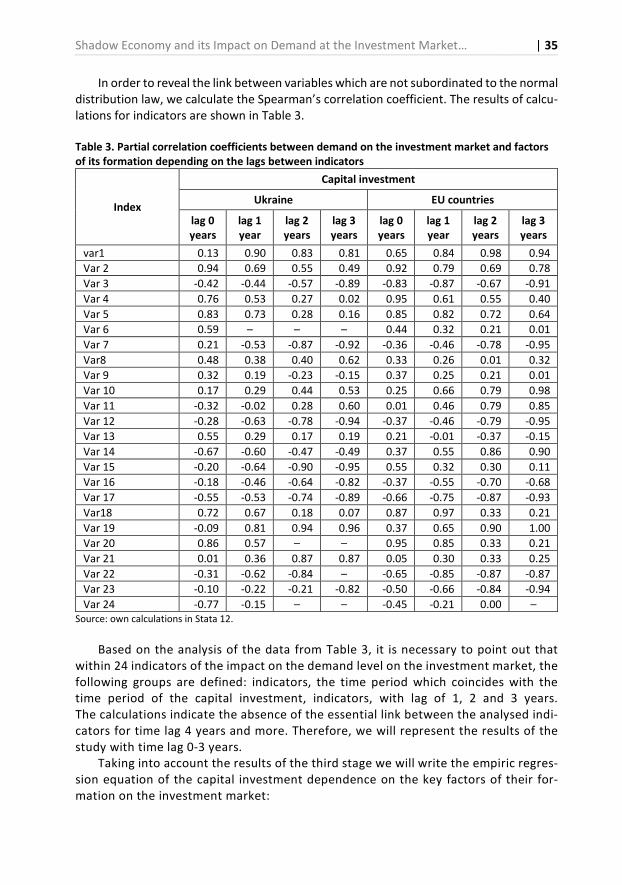
Shadow Economy and its Impact on Demand at the Investment Market… | 35
In order to reveal the link between variables which are not subordinated to the normal distribution law, we calculate the Spearman’s correlation coefficient. The results of calcu-lations for indicators are shown in Table 3.
Table 3. Partial correlation coefficients between demand on the investment market and factors
of its formation depending on the lags between indicators
Index
Capital investment
Ukraine EU countries
lag 0
years
lag 1
year
lag 2
years
lag 3
years
lag 0
years
lag 1
year
lag 2
years
lag 3
years
var1 0.13 0.90 0.83 0.81 0.65 0.84 0.98 0.94
Var 2 0.94 0.69 0.55 0.49 0.92 0.79 0.69 0.78
Var 3 -0.42 -0.44 -0.57 -0.89 -0.83 -0.87 -0.67 -0.91
Var 4 0.76 0.53 0.27 0.02 0.95 0.61 0.55 0.40
Var 5 0.83 0.73 0.28 0.16 0.85 0.82 0.72 0.64
Var 6 0.59 – – – 0.44 0.32 0.21 0.01
Var 7 0.21 -0.53 -0.87 -0.92 -0.36 -0.46 -0.78 -0.95
Var8 0.48 0.38 0.40 0.62 0.33 0.26 0.01 0.32
Var 9 0.32 0.19 -0.23 -0.15 0.37 0.25 0.21 0.01
Var 10 0.17 0.29 0.44 0.53 0.25 0.66 0.79 0.98
Var 11 -0.32 -0.02 0.28 0.60 0.01 0.46 0.79 0.85
Var 12 -0.28 -0.63 -0.78 -0.94 -0.37 -0.46 -0.79 -0.95
Var 13 0.55 0.29 0.17 0.19 0.21 -0.01 -0.37 -0.15
Var 14 -0.67 -0.60 -0.47 -0.49 0.37 0.55 0.86 0.90
Var 15 -0.20 -0.64 -0.90 -0.95 0.55 0.32 0.30 0.11
Var 16 -0.18 -0.46 -0.64 -0.82 -0.37 -0.55 -0.70 -0.68
Var 17 -0.55 -0.53 -0.74 -0.89 -0.66 -0.75 -0.87 -0.93
Var18 0.72 0.67 0.18 0.07 0.87 0.97 0.33 0.21
Var 19 -0.09 0.81 0.94 0.96 0.37 0.65 0.90 1.00
Var 20 0.86 0.57 – – 0.95 0.85 0.33 0.21
Var 21 0.01 0.36 0.87 0.87 0.05 0.30 0.33 0.25
Var 22 -0.31 -0.62 -0.84 – -0.65 -0.85 -0.87 -0.87
Var 23 -0.10 -0.22 -0.21 -0.82 -0.50 -0.66 -0.84 -0.94
Var 24 -0.77 -0.15 – – -0.45 -0.21 0.00 – Source: own calculations in Stata 12.
Based on the analysis of the data from Table 3, it is necessary to point out that within 24 indicators of the impact on the demand level on the investment market, the following groups are defined: indicators, the time period which coincides with the time period of the capital investment, indicators, with lag of 1, 2 and 3 years. The calculations indicate the absence of the essential link between the analysed indi-cators for time lag 4 years and more. Therefore, we will represent the results of the study with time lag 0-3 years.
Taking into account the results of the third stage we will write the empiric regres-sion equation of the capital investment dependence on the key factors of their for-mation on the investment market:
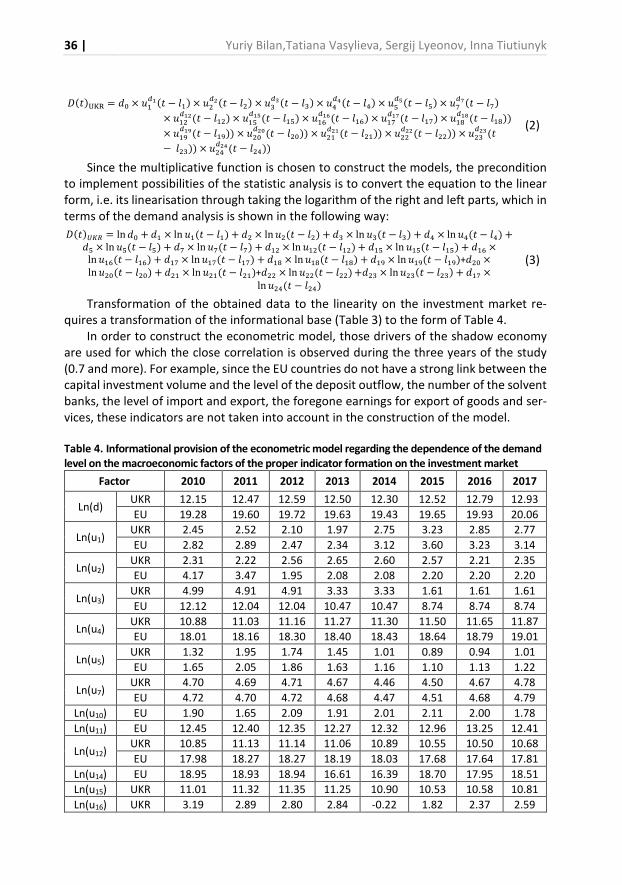
36 | Yuriy Bilan,Tatiana Vasylieva, Sergij Lyeonov, Inna Tiutiunyk
������� = �� × ������ − ��� × ��
���� − ��� × ��
���� − ��� × � �!�� − � � × �"
�#�� − �"� × �$�%�� − �$�
× �������� − ���� × ��"
��#�� − ��"� × ��&
��'�� − ��&� × ��$��%�� − ��$� × ��(
��)�� − ��(��
× ��*
��+�� − ��*�� × ���
��,�� − ����� × �������� − ����� × ���
����� − ����� × ���
�����
− ����� × �� ��!�� − �� ��
(2)
Since the multiplicative function is chosen to construct the models, the precondition to implement possibilities of the statistic analysis is to convert the equation to the linear form, i.e. its linearisation through taking the logarithm of the right and left parts, which in terms of the demand analysis is shown in the following way:
����./0 = ln �� + �� × ln ���� − ��� + �� × ln ���� − ��� + �� × ln ���� − ��� + � × ln � �� − � � +
�" × ln �"�� − �"� + �$ × ln �$�� − �$� + ��� × ln ����� − ���� + ��" × ln ��"�� − ��"� + ��& ×
ln ��&�� − ��&� + ��$ × ln ��$�� − ��$� + ��( × ln ��(�� − ��(� + ��* × ln ��*�� − ��*�+��� ×
ln ����� − ���� + ��� × ln ����� − ����+��� × ln ����� − ���� +��� × ln ����� − ���� + ��$ ×
ln �� �� − �� �
(3)
Transformation of the obtained data to the linearity on the investment market re-quires a transformation of the informational base (Table 3) to the form of Table 4.
In order to construct the econometric model, those drivers of the shadow economy are used for which the close correlation is observed during the three years of the study (0.7 and more). For example, since the EU countries do not have a strong link between the capital investment volume and the level of the deposit outflow, the number of the solvent banks, the level of import and export, the foregone earnings for export of goods and ser-vices, these indicators are not taken into account in the construction of the model.
Table 4. Informational provision of the econometric model regarding the dependence of the demand
level on the macroeconomic factors of the proper indicator formation on the investment market
Factor 2010 2011 2012 2013 2014 2015 2016 2017
Ln(d) UKR 12.15 12.47 12.59 12.50 12.30 12.52 12.79 12.93
EU 19.28 19.60 19.72 19.63 19.43 19.65 19.93 20.06
Ln(u1) UKR 2.45 2.52 2.10 1.97 2.75 3.23 2.85 2.77
EU 2.82 2.89 2.47 2.34 3.12 3.60 3.23 3.14
Ln(u2) UKR 2.31 2.22 2.56 2.65 2.60 2.57 2.21 2.35
EU 4.17 3.47 1.95 2.08 2.08 2.20 2.20 2.20
Ln(u3) UKR 4.99 4.91 4.91 3.33 3.33 1.61 1.61 1.61
EU 12.12 12.04 12.04 10.47 10.47 8.74 8.74 8.74
Ln(u4) UKR 10.88 11.03 11.16 11.27 11.30 11.50 11.65 11.87
EU 18.01 18.16 18.30 18.40 18.43 18.64 18.79 19.01
Ln(u5) UKR 1.32 1.95 1.74 1.45 1.01 0.89 0.94 1.01
EU 1.65 2.05 1.86 1.63 1.16 1.10 1.13 1.22
Ln(u7) UKR 4.70 4.69 4.71 4.67 4.46 4.50 4.67 4.78
EU 4.72 4.70 4.72 4.68 4.47 4.51 4.68 4.79
Ln(u10) EU 1.90 1.65 2.09 1.91 2.01 2.11 2.00 1.78
Ln(u11) EU 12.45 12.40 12.35 12.27 12.32 12.96 13.25 12.41
Ln(u12) UKR 10.85 11.13 11.14 11.06 10.89 10.55 10.50 10.68
EU 17.98 18.27 18.27 18.19 18.03 17.68 17.64 17.81
Ln(u14) EU 18.95 18.93 18.94 16.61 16.39 18.70 17.95 18.51
Ln(u15) UKR 11.01 11.32 11.35 11.25 10.90 10.53 10.58 10.81
Ln(u16) UKR 3.19 2.89 2.80 2.84 -0.22 1.82 2.37 2.59
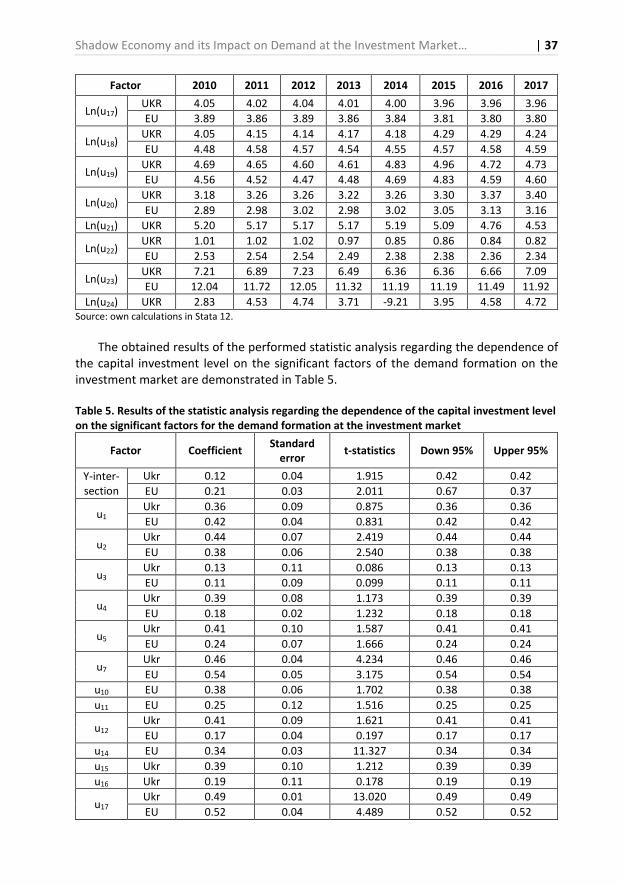
Shadow Economy and its Impact on Demand at the Investment Market… | 37
Factor 2010 2011 2012 2013 2014 2015 2016 2017
Ln(u17) UKR 4.05 4.02 4.04 4.01 4.00 3.96 3.96 3.96
EU 3.89 3.86 3.89 3.86 3.84 3.81 3.80 3.80
Ln(u18) UKR 4.05 4.15 4.14 4.17 4.18 4.29 4.29 4.24
EU 4.48 4.58 4.57 4.54 4.55 4.57 4.58 4.59
Ln(u19) UKR 4.69 4.65 4.60 4.61 4.83 4.96 4.72 4.73
EU 4.56 4.52 4.47 4.48 4.69 4.83 4.59 4.60
Ln(u20) UKR 3.18 3.26 3.26 3.22 3.26 3.30 3.37 3.40
EU 2.89 2.98 3.02 2.98 3.02 3.05 3.13 3.16
Ln(u21) UKR 5.20 5.17 5.17 5.17 5.19 5.09 4.76 4.53
Ln(u22) UKR 1.01 1.02 1.02 0.97 0.85 0.86 0.84 0.82
EU 2.53 2.54 2.54 2.49 2.38 2.38 2.36 2.34
Ln(u23) UKR 7.21 6.89 7.23 6.49 6.36 6.36 6.66 7.09
EU 12.04 11.72 12.05 11.32 11.19 11.19 11.49 11.92
Ln(u24) UKR 2.83 4.53 4.74 3.71 -9.21 3.95 4.58 4.72 Source: own calculations in Stata 12.
The obtained results of the performed statistic analysis regarding the dependence of the capital investment level on the significant factors of the demand formation on the investment market are demonstrated in Table 5.
Table 5. Results of the statistic analysis regarding the dependence of the capital investment level
on the significant factors for the demand formation at the investment market
Factor Coefficient Standard
error t-statistics Down 95% Upper 95%
Y-inter-section
Ukr 0.12 0.04 1.915 0.42 0.42
EU 0.21 0.03 2.011 0.67 0.37
u1 Ukr 0.36 0.09 0.875 0.36 0.36
EU 0.42 0.04 0.831 0.42 0.42
u2 Ukr 0.44 0.07 2.419 0.44 0.44
EU 0.38 0.06 2.540 0.38 0.38
u3 Ukr 0.13 0.11 0.086 0.13 0.13
EU 0.11 0.09 0.099 0.11 0.11
u4 Ukr 0.39 0.08 1.173 0.39 0.39
EU 0.18 0.02 1.232 0.18 0.18
u5 Ukr 0.41 0.10 1.587 0.41 0.41
EU 0.24 0.07 1.666 0.24 0.24
u7 Ukr 0.46 0.04 4.234 0.46 0.46
EU 0.54 0.05 3.175 0.54 0.54
u10 EU 0.38 0.06 1.702 0.38 0.38
u11 EU 0.25 0.12 1.516 0.25 0.25
u12 Ukr 0.41 0.09 1.621 0.41 0.41
EU 0.17 0.04 0.197 0.17 0.17
u14 EU 0.34 0.03 11.327 0.34 0.34
u15 Ukr 0.39 0.10 1.212 0.39 0.39
u16 Ukr 0.19 0.11 0.178 0.19 0.19
u17 Ukr 0.49 0.01 13.020 0.49 0.49
EU 0.52 0.04 4.489 0.52 0.52
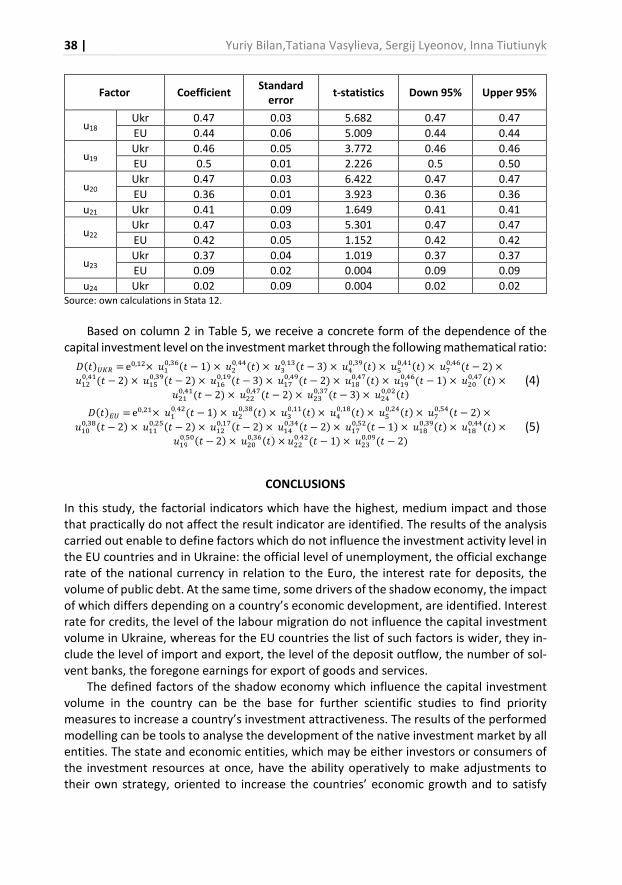
38 | Yuriy Bilan,Tatiana Vasylieva, Sergij Lyeonov, Inna Tiutiunyk
Factor Coefficient Standard
error t-statistics Down 95% Upper 95%
u18 Ukr 0.47 0.03 5.682 0.47 0.47
EU 0.44 0.06 5.009 0.44 0.44
u19 Ukr 0.46 0.05 3.772 0.46 0.46
EU 0.5 0.01 2.226 0.5 0.50
u20 Ukr 0.47 0.03 6.422 0.47 0.47
EU 0.36 0.01 3.923 0.36 0.36
u21 Ukr 0.41 0.09 1.649 0.41 0.41
u22 Ukr 0.47 0.03 5.301 0.47 0.47
EU 0.42 0.05 1.152 0.42 0.42
u23 Ukr 0.37 0.04 1.019 0.37 0.37
EU 0.09 0.02 0.004 0.09 0.09
u24 Ukr 0.02 0.09 0.004 0.02 0.02 Source: own calculations in Stata 12.
Based on column 2 in Table 5, we receive a concrete form of the dependence of the capital investment level on the investment market through the following mathematical ratio:
����./0 = e�,��× ���,�&�� − 1� × ��
�, ��� × ���,���� − 3� × �
�,�*��� × �"�, ���� × �$
�, &�� − 2� ×
����, ��� − 2� × ��"
�,�*�� − 2� × ��&�,�*�� − 3� × ��$
�, *�� − 2� × ��(�, $��� × ��*
�, &�� − 1� × ����, $��� ×
����, ��� − 2� × ���
�, $�� − 2� × ����,�$�� − 3� × ��
�,����� (4)
����7. = e�,��× ���, ��� − 1� × ��
�,�(��� × ���,����� × �
�,�(��� × �"�,� ��� × �$
�," �� − 2� ×
����,�(�� − 2� × ���
�,�"�� − 2� × ����,�$�� − 2� × ��
�,� �� − 2� × ��$�,"��� − 1� × ��(
�,�*��� × ��(�, ��� ×
��*�,"��� − 2� × ���
�,�&��� × ����, ��� − 1� × ���
�,�*�� − 2� (5)
CONCLUSIONS
In this study, the factorial indicators which have the highest, medium impact and those that practically do not affect the result indicator are identified. The results of the analysis carried out enable to define factors which do not influence the investment activity level in the EU countries and in Ukraine: the official level of unemployment, the official exchange rate of the national currency in relation to the Euro, the interest rate for deposits, the volume of public debt. At the same time, some drivers of the shadow economy, the impact of which differs depending on a country’s economic development, are identified. Interest rate for credits, the level of the labour migration do not influence the capital investment volume in Ukraine, whereas for the EU countries the list of such factors is wider, they in-clude the level of import and export, the level of the deposit outflow, the number of sol-vent banks, the foregone earnings for export of goods and services.
The defined factors of the shadow economy which influence the capital investment volume in the country can be the base for further scientific studies to find priority measures to increase a country’s investment attractiveness. The results of the performed modelling can be tools to analyse the development of the native investment market by all entities. The state and economic entities, which may be either investors or consumers of the investment resources at once, have the ability operatively to make adjustments to their own strategy, oriented to increase the countries’ economic growth and to satisfy
Shadow Economy and its Impact on Demand at the Investment Market… | 39
public needs in the case of the state regulation, and in the case of other participants from the investment market – to maximise the profit.
Despite the current limitation of the sample size through the analysis of only Ukraine as a country with an average level of development, which tries to be a member of the EU, that does not let to make general and fundamental conclusions, we prove that some driv-ers of the shadow economy influence the capital investment volumes of some countries in various ways. However, the reasons for these differences within this research are not analysed. Secondly, we do not consider the fact that for some factors an average correla-tion can be increasingly caused by the similarity of tendencies regarding the changes in these indicators, but not by the close relationship between them. Thirdly, the sample size is due to the limitation of data for some countries in the world that does not enable to take most factors into account.
The goal of further research may be to define the tightness and nature of the relation-ship between the analysed factors and to construct a model which considers the synergy effect from the complex influence of the analysed factors, provides the evaluation of the significance level regarding the shadow economy drivers together with other factors of the impact on the capital investment volume in a country.
REFERENCES
Abed, G.T., & Davoodi, H.R. (2002). Corruption, Structural Reforms, and Economic Performance. Govern-
ance, Corruption & Economic Performance, International Monetary Fund, Washington D.C., 489-537.
Abror, Q.A. (2015). Effects of shadow economy on foreign direct investment. Proceeding – Kuala Lumpur
International Business, Economics and Law Conference, 6(3), Hotel Putra, Kuala Lumpur, Malaysia.
Addison, T., & Heshmati, A. (2003). The New Global Determinants of FDI Flows to Developing Countries. World Institute For Development Economics Research WIDER, Discussion Paper No. 2003/45.
Al-Sadig, A. (2007). The effects of corruption on FDI inflows. The Cato Journal, 29, 267.
Asiedu, E. (2006). Foreign Direct Investment in Africa: The Role of Natural Resources, Market Size, Government Policy, Institutions and Political Instability. World Economy, 29, 63-77. https://doi.org/10.1111/j.1467-9701.2006.00758.x
Bilan, Y., Korauš, A., Simionescu M., & Schönfeld, J. (2017). The impact of monetary variables on the economic growth and sustainable development: Case of selected countries. Journal of Security
and Sustainability Issues, 6(3), 383-390. http://jssidoi.org/jssi/papers/papers/view/216
Bilan, Y., Mishchuk, H., Samoliuk, N., & Streimikiene, D. (2018). Income Inequality and its Conse-quences within the Framework of Social Justice. Problemy Ekorozwoju – Problems of Sustainable
Development, 13(2), 131-138.
Bilan, Yu., Moroz, S., Nagyova, L., Horska, E., & Polakova, Z. (2017). The current state and prospects of trade relations between Ukraine and the European Union: the Visegrad vector. Economic
Annals-XXI, 163(1-2(1)), 14-21.
Bobenič Hintošová, A., Bruothová, M., Kubíková, Z., & Ručinský R. (2018). Determinants of foreign direct investment inflows: A case of the Visegrad countries. Journal of International Studies,
11(2), 222-235. http://doi.org/10.14254/2071-8330.2018/11-2/15
Cheba, K., & Szopik-Depczyńska, K. (2017). Multidimensional comparative analysis of the competi-tive capacity of the European Union countries and geographical regions. Oeconomia Coperni-
cana, 8(4), 487-504. https://doi.org/10.24136/oc.v8i4.30
40 | Yuriy Bilan,Tatiana Vasylieva, Sergij Lyeonov, Inna Tiutiunyk
Cichocki, S., & Tyrowicz, J. (2010). Shadow employment in post-transition – Is informal employment a matter of choice or no choice in Poland?. The Journal of Socio-Economics, 39(4), 527-535.
Cleeve, E. (2008). How Effective Are Fiscal Incentives to Attract FDI to Sub-Saharan Africa?. The Jour-
nal of Developing Areas, 42, 135-153.
Damoska Sekuloska, J. (2018). Causality between foreign direct investment in the automotive sector and export performance of Macedonian economy. Equilibrium. Quarterly Journal of Economics
and Economic Policy, 13(3), 427-443. https://doi.org/10.24136/eq.2018.021
Demirhan, E., & Masca, M. (2008). Determinants of Foreign Direct Investment Flows. Prague Eco-
nomic Papers, 4, 356-369. https://doi.org/10.18267/j.pep.337
Djalilov, K., Lyeonov, S., & Buriak, A. (2015). Сomparative studies of risk, concentration and efficiency in transition economies. Risk Governance & Control: Financial Markets & Institutions, 5(4(1)), 177-186.
Do, M.H., & Park, S.C. (2018). New Rural Development and hierarchical governance in Vietnam: Im-pacts of government support on rural households’ income using a hierarchical linear modelling. Agris On-line Papers in Economics and Informatics 10(4), 3-15.
Egger, P., & Winner, H. (2005). Evidence on Corruption as an Incentive for Foreign Direct Investment. European Journal of Political Economy, 21(4), 932-952.
Enste, D.H. (2015). The shadow economy in industrial countries. IZA World of Labour 2015, 127, 1-10. https://doi.org/10.15185/izawol.127
Fernandes, A.J.L. (2018). Transnational banks’ influence on the development of the economy and the financial sector of developing countries (on the example of Poland, Brazil, Turkey). Market-
ing and Management of Innovations, 3, 253-259. http://doi.org/10.21272/mmi.2018.3-22
Formankova, S., Trenz, O., Faldik, O., Kolomaznik, J., & Vanek, P. (2018). The future of investing-sustainable and responsible investing. Marketing and Management of Innovations, 2, 94-102. http://doi.org/10.21272/mmi.2018.2-08
Greco, F. (2018). Resilience: Transform adverse events into an opportunity for growth and economic sustainability through the adjustment of emotions. Business Ethics and Leadership, 2(1), 44-52. https://doi.org/10.21272/bel.2(1).44-52.2018
Hubert, P.J., & Phanindra, V.W. (2004). Determinants of foreign direct investment: empirical evi-dence from EU accession candidates. Applied Economics, 36, 505-509. https://doi.org/10.1080/00036840410001682214
Ipatov, B.G., McClelland, B., Williamson, P., Khanfar, N., & Cavico, F.J. (2018). An Analysis of the Re-lationship between Regulatory Control and Corruption based on Product and Market Regulation and Corruption Perceptions Indices. Business Ethics and Leadership, 2(3), 6-20. https://doi.org/10.21272/bel.2(3).6-20.2018
Ipatov, M., & Grebeniuk, N. (2018). Assessing the level of adaptation of employees to the transfor-mation processes in the company. Business Ethics and Leadership, 2(1), 106-115. https://doi.org/10.21272/bel.2(1).106-115.2018
Kostyuchenko, N., Starinskyi, M., Tiutiunyk, S., & Kobushko, Ia. (2018). Methodical Approach to the Assessment of Risks Connected With the Legalization of the Proceeds of Crime. Montenegrin
Journal of Economics, 14(4), 021-041.
Krumplyte, J. (2008). Šešelines ekonomikos samprata ir priežasciu analize. Ekonomika ir Vadyba: Ak-
tualijos ir Perspektyvos, 4(13), 238-250.
Lambsdorff, J. Graf, & Cornelius, P. (2000). Corruption, Foreign Investment and Growth, The Africa
Competitiveness Report 2000/2001. Harvard University: Oxford University Press, (pp. 70-78).
Leonov, S.V., & Isaieva, O.V. (2014). Determinants of government bond spread in Ukraine and new EU members, Actual Problems of the Economics, 5, 416-425.
Shadow Economy and its Impact on Demand at the Investment Market… | 41
Lyeonov, S.V., Vasylieva, T.A., & Lyulyov, O.V. (2018). Macroeconomic stability evaluation in coun-tries of lower-middle income economies. Scientific Bulletin of National Mining University, 1, 138-146. https://doi.org/10.29202/nvngu/2018-1/4
Melnyk, L., Sineviciene, L., Lyulyov, O., Pimonenko, T., & Dehtyarova, I. (2018). Fiscal decentralization and macroeconomic stability: the experience of Ukraine’s economy. Problems and Perspectives
in Management, 16(1), 105-114. https://doi.org/10.21511/ppm.16(1).2018.10
Morrissey, O., & Udomkerdmongkol, M. (2012). Governance, Private Investment and Foreign Direct Investment in Developing Countries. World Development, 40, 437-445.
Nazarczuk, J.M., & Krajewska, A. (2018). Local determinants of foreign direct investment in Poland: the role of relative distance. Equilibrium. Quarterly Journal of Economics and Economic Policy, 13(1), 73-88. https://doi.org/10.24136/eq.2018.004
Nunes, P., Serrasqueiro, Z., & Matos, A. (2017). Determinants of investment in fixed assets and in intangible assets for high-tech firms. Journal of International Studies, 10(1), 173-179. https://doi.org/10.14254/2071-8330.2017/10-1/12
Omidi, M., Min, Q., & Omidi, M. (2017). Combined Effect of Economic Variables on Fraud, a Survey of Developing Countries. Economics and Sociology, 10(2), 267-278. https://doi.org/10.14254/2071-789X.2017/10-2/20
Rahimi, F.A.F. (2016). The impact of international forces withdrawal on investment in Herat, Afghanistan. Journal of International Studies, 9(1), 44-55. https://doi.org/10.14254/2071-8330.2016/9-1/3
Rausser, G., Strielkowski, W., Bilan, Y., & Tsevukh, Y. (2018). Migrant remittances and their impact on the economic development of the Baltic States. Geographica Pannonica, 22(3), 165-175.
Riedl, A. (2009). Location factors of FDI and the growing services economy. Economics of Transition, 18(4), 741-761. https://doi.org/10.1111/j.1468-0351.2010.00391.x
Schneider, F. (2007). Shadow economies and corruption all over the world: New estimates for 145 countries. Open-Assessment E-Journal, 1, 1-66.
Skare, M., & Porada-Rochoń, M. (2019). Financial and economic development link in transitional economies: a spectral Granger causality analysis 1991-2017. Oeconomia Copernicana, 10(1), 7-35. https://doi.org/10.24136/oc.2019.001
Smarzynska, B.K., & Wei, S. (2000). Corruption and the Composition of Foreign Direct Investment: Firm-
Level Evidence. World Bank Discussion Paper Series no. 2360. Washington, DC: World Bank.
Sookram, S., Watson, P.K., & Schneider, F. (2009). Characteristics of households in the informal sector of an emerging economy. Applied Economics, 41(27), 3545-3559. https://doi.org/10.1080/00036840701493733
Špička, J. (2018). Dynamic effects of public investment support in the food and beverage industries. Agris On-line Papers in Economics and Informatics, 10(1), 91-110.
Teobaldelli, D., & Schneider, F. (2013). The influence of direct democracy on the shadow economy. Public Choice, 157(3), 157-543.
Udomkerdmongkol, M., Görg, H., & Morrissey, O. (2006) Foreign Direct Investment and Exchange rates: A case study of U.S. FDI in emerging countries. University of Nottingham, Discussion Pa-pers in Economics, Discussion Paper No. 06/05.
Vasilyeva, T., Sysoyeva, L., & Vysochyna, A. (2016). Formalization of factors that are affecting the stability of Ukraine banking system. Risk Governance & Control: Financial Markets & Institutions,
6(4), 7-11. https://doi.org/10.22495/rcgv6i4art1
Vasilyeva, T.A., Lunyakov, O.V., & Leonov, S.V. (2013). Analysis of internal and external imbalances in the financial sector of Ukraine’s economy. Actual Problems of the Economics, 12(150), 176-184.
42 | Yuriy Bilan,Tatiana Vasylieva, Sergij Lyeonov, Inna Tiutiunyk
Vasylieva, T., Lyeonov, S., Lyulyov, O., & Kyrychenko, K. (2018). Macroeconomic stability and its im-pact on the economic growth of the country. Montenegrin Journal of Economics, 14(1), 159-170. https://doi.org/10.14254/1800-5845/2018.14-1.12
Wei, S.-J. (2000). How Taxing is Corruption on International Investors?. Review of Economics and
Statistics, 82, 1-11. https://doi.org/10.1162/003465300558533
Williams, C.C., & Nadin, S. (2012) Joining up the fight against undeclared work in Europe. Manage-
ment Decision, 50(10), 1758-1771. https://doi.org/10.1108/00251741211279585
Zdziarski, M., Światowiec-Szczepańska, J., Troilo, M., & Małys, Ł., (2017). Adventurous Foreign Direct Investment. Journal of Management and Business Administration, 25(2), 117-139.
Authors
The contribution share of authors is equal and amounted to 25% each of them.
Yuriy Bilan
Dr hab. (Rzeszow University of Technology, Poland), Professor (Rzeszow University of Technology, Po-land). His research interests include economic development, investment, innovation activity, finance. Correspondence to: Prof. Dr. Yuriy Bilan, Rzeszow University of Technology, Aleja Powstańców Warszawy 12, 35-959 Rzeszów, Poland, e-mail: [email protected] ORCID http://orcid.org/0000-0003-0268-009X
Tatiana Vasylieva
Doctor of Economics (Ukrainian Academy of Banking, Ukraine), Professor (Ukrainian Academy of Banking, Ukraine). Her research interests include banking, investment, risk management, innova-tion activity, social responsibility, education. Correspondence to: Prof. Dr Tatiana Vasylieva, Oleg Balatskyi Academic and Research Institute of Finance, Economics and Management, Sumy State University, Rimsky-Korsakov st., 2, 40001, Sumy, Ukraine, e-mail: [email protected] ORCID http://orcid.org/0000-0003-0635-7978
Sergij Lyeonov
Doctor of Economics (Ukrainian Academy of Banking, Ukraine), Professor (Ukrainian Academy of Banking, Ukraine). His research interests include banking, investment, risk management, innova-tion activity. Correspondence to: Prof., Dr Sergij Lyeonov, Economic Cybernetics Department, Sumy State Uni-versity, Rimsky-Korsakov st., 2, 40001, Sumy, Ukraine, e-mail: [email protected] ORCID http://orcid.org/0000-0001-5639-3008
Inna Tiutiunyk
PhD in economics (Sumy State University, Ukraine). Her research interests include shadow econ-omy, investment, finance, fiscal policy. Correspondence to: PhD Inna Tiutiunyk, Finance and Entrepreneurship Department, Sumy State Uni-versity, Rimsky-Korsakov st., 2, 40001, Sumy, Ukraine, e-mail: [email protected] ORCID http://orcid.org/0000-0001-5883-2940
Shadow Economy and its Impact on Demand at the Investment Market… | 43
Acknowledgements and Financial Disclosure
The article was written within the project no. 0117U003930 entitled ‘Econometric modelling of the mechanism of prevention of shadow capital outflows schemes through tax and investment channels in Ukraine’ financed by Ministry of Education and Science of Ukraine conducted by Sumy State University in the years 2017-2020.
The article was written within the project no. 0117U002251 entitled ‘Improvement of national anti-money laundering system in terms of increasing the financial and economic security of the state’ financed by Ministry of Education and Science of Ukraine conducted by Sumy State Univer-sity in the years 2017-2019.
The article came into being within the project no. 0118U003569 entitled ‘Modeling and forecast-ing the socio-economic-political road map of reforms in Ukraine for the transition to a sustainable growth model’ financed by Ministry of Education and Science of Ukraine conducted by Sumy State University in the years 2018-2020.
Copyright and License
This article is published under the terms of the Creative Commons Attribution – NoDerivs (CC BY-ND 4.0) License
http://creativecommons.org/licenses/by-nd/4.0/
Published by the Centre for Strategic and International Entrepreneurship – Krakow, Poland
The copyediting and proofreading of articles in English is financed in the framework of contract No. 913/P-DUN/2019 by the Ministry of Science and Higher Education of the Republic of Poland committed to activities aimed at science promotion.


2019, Vol. 7, No. 2 10.15678/EBER.2019.070203
The Attractiveness of Poland as a Medical Tourism
Destination from the Perspective of German
and British Consumers
Diana Dryglas, Adrian Lubowiecki-Vikuk
A B S T R A C T
Objective: The aim of the article is an assessment of the attractiveness of Poland as
a medical tourism destination (MTD).
Research Design & Methods: Survey data were collected from 282 German and British
tourists, using a self-administered questionnaire. The Computer-Assisted Web Interviewing
method was used to conduct the survey. Subsequently, the responses were analysed using
advanced statistical tools (McNemar’s exact test, Cochran’s Q test snd Chi-square test).
Findings: The results indicated that tourists from Western Europe are currently more in-
terested in using medical services in Central and Eastern Europe countries (CEEC) than in
the past. Out of CEEC, Poland was the most frequently chosen MTD. Associations with
Poland as a MTD were affected by such socio-demographic factors as age and nationality.
Implications & Recommendations: Identification of the growing importance of Po-
land as a MTD, as well as socio-demographic factors affecting the choice of Poland as
a MTD have important implications for scholars, allowing them to understand how
medical tourists evaluate the attractiveness of MTDs in Poland, and can be a useful
tool for marketing planners, destination managers and marketers to create an effec-
tive marketing policy of MTDs in Poland.
Contribution & Value Added: The study fills an important gap regarding the lack of em-
pirical content allowing for the exploration of the attractiveness of MTDs in Poland.
Article type: research article
Keywords: Poland; tourism destination attractiveness; medical tourism, medi-
cal services
JEL codes: L83, Z32
Received: 19 February 2019 Revised: 30 April 2019 Accepted: 21 May 2019
Suggested citation: Dryglas, D., & Lubowiecki-Vikuk, A. (2019). The Attractiveness of Poland as a Medical Tourism Desti-
nation from the Perspective of German and British Consumers. Entrepreneurial Business and Eco-
nomics Review, 7(2), 45-62. https://doi.org/10.15678/EBER.2019.070203
46 | Diana Dryglas, Adrian Lubowiecki-Vikuk
INTRODUCTION
Since the late 1990s – mainly because of mass media (television, the Internet, the press)
and the tourism industry – medical tourism has gained momentum (Connell, 2016). This
trend stems from ‘changes in demographics, today’s education, standard of living, social
behaviour, and lifestyle’ (Breitrück & Nunn, 2011, p. 57; Stankova, Tsvetkov, & Ivanova,
2019). Medical tourism should be perceived as a phenomenon in which patients travel
outside their permanent place of residence to use health-related services, including
tourism packages (Connell, 2013). It is a growing phenomenon spurred on by an
increasingly empowered patient base searching for quality, affordability, availability,
accessibility in healthcare, perceived quality, satisfaction, and trust in the staff and clinic,
and attractiveness of a tourism destination (Choi, 2016; Connell, 2013), including access
to treatments that are not legally allowed in the place of residence (Dryglas, 2018). The
reasons why patients undertake medical trips also include a feeling of overall
dissatisfaction with the national health system, or even the need to preserve
confidentiality for some people seeking medical treatment (Cameron, Crooks, Chouinard,
Snyder, Johnston, & Casey, 2014). As reported by Gupte and Panjamapirom (2014), the
number of medical tourists increased from approximately 10.5 million in 2011 to 23.2 mil-
lion in 2017, and generated global revenue of approximately USD 40-60 billion. For in-
stance, in South Korea alone, medical tourism revenue in 2017 amounted to USD 15 billion
and is predicted to reach USD 20 billion by 2022 (South Korea medical tourism market:
Insights, opportunity, analysis, market shares and forecast 2017-2022, 2018). Nonethe-
less, according to Beladi, Chao, Ee and Hollas (2015), the output contribution of medical
tourism is overestimated by an average of 26.8%.
In the field of science and social life, medical tourism is still not fully recognised or
clearly defined (Connell, 2013). Various approaches are adopted in literature to explain
this phenomenon, and thus the concept of medical tourism is still unstable. According to
Connell, any medically-motivated cross-border mobility should be referred to as medical
travel, ‘but it should also be noted that ‘medical tourism’ will continue to be used for many
components of that mobility’ (Connell, 2013, p. 10).
Medical tourism is a complex process, resulting from the requirements of the modern
market, particularly in terms of demand (Runnels & Carrera, 2012). The medical tourism
market understood as ‘the entirety of service-financial exchange relations between the pro-
vider (medical and tourism sector entity) and the beneficiary (medical tourist), occurring out-
side of the latter’s place of permanent residence, who finances (or co-finances) the process
of purchasing a package of services, which brings benefits to both sides’ (Lubowiecki-Vikuk
& Rab-Przybyłowicz, 2015, p. 87), is extensive and internally complex. This stems from a spe-
cific relation, namely an interdependent exchange taking place between providers and pur-
chasers of both medical and tourism services, and paramedical and paratourism services
(Heung, Kucukusta, & Song, 2010). This, in turn, necessitates interdisciplinary market re-
search, including scientific studies, as a status quo from the medical and tourism point of
view (Freyer & Kim, 2014). The medical tourism destination (MTD) applies to specific areas,
i.e. countries, regions, cities and metropolitan areas (Ghanbari, Hajinejad, & Rahmani, 2014;
Ormond & Kaspar, 2019), where the medical tourism product is offered, in other words pre-
pared for sale as a package offer consisting of medical and tourism services, the basis for
The Attractiveness of Poland as a Medical Tourism Destination from… | 47
which is set by the presence of clinics and private providers of medical services (Rab-
Przybyłowicz, 2016). Nowadays, there are numerous countries which constitute MTDs,
especially Asian countries (e.g. Singapore, India, Thailand, Malaysia, South Korea), the U.S.,
Mexico, countries of the Middle and South America (e.g. Crooks, Turner, Snyder, Johnston,
& Kingsbury, 2011; Fetscherin & Stephano, 2016; Guiry & Vequist, 2015; Junio, Kim, & Lee,
2017; Mahendradhata, 2019). The remaining MTDs are still difficult to reach, especially the
Balkan countries (Kiss, 2015) and Central and Eastern Europe countries (CEEC), where Poland
is considered one of the MTD leaders in this part of Europe (Fetscherin & Stephano, 2016;
Mainil, Eijgelaar, Klijs, Nawijn, & Peeters, 2017). Unlike in Asian countries and Western
Europe, where the emphasis is put on prevention, mental and physical health, in CEEC the
emphasis is primarily placed on physical health (Smith & Puczkó, 2014).
Extensive research into the phenomenon of MTDs conducted mainly in Asian MTDs
and Western Europe (de la Hoz-Correa, Muñoz-Leiva, & Bakucz, 2018; Guiry & Veguist,
2015; Lu & Wu, 2018), strikingly reflects the fragmentary nature of scientific knowledge
about this subject in CEEC. The above-mentioned studies focus on the analysis of risks,
barriers and factors attracting foreign patients to a given destination (country, centre).
Furthermore, Zarei and Maleki (2019) demonstrated that the perceived quality of medical
services and patient satisfaction are the most important factors that attract medical tour-
ists. What is also important are lower service costs and shorter wait time, which depend
on the complexity and invasiveness of a given medical procedure (Connell, 2013). On the
other hand, the authors state that the cooperation of entities offering medical services,
the already mentioned quality of these services, insurance and legal provisions constitute
the main barriers to the decision on having treatment abroad. A study by Sziva, Balázs,
Michalkó, Kiss, Puczkó, Smith and Apró (2017) demonstrates that the potential of MTDs in
CEEC has not been fully exploited. Therefore, the aim of the article is an empirical verifi-
cation of the attractiveness of MTDs in Poland.
The contribution of this research is twofold. First, it provides an overview of MTD at-
tractiveness in literature on medical tourism. Second, the empirical part of the study fills
an important gap regarding the lack of empirical content allowing for the exploration of
the attractiveness of MTDs in Poland. The study serves as a springboard for a discussion
on the attractiveness of MTDs in Poland as perceived by foreign medical tourists. Hence,
the study provides a thorough exploration of MTD attractiveness and its better under-
standing in CEEC through the analysis of Poland.
LITERATURE REVIEW
Mayo and Jarvis (1981) define destination attractiveness as ‘the relative importance of indi-
vidual benefits and the perceived ability of the destination to deliver these individual bene-
fits’ (Mayo & Jarvis, 1981, p. 201). Only few attempts have been made to identify the attrib-
utes that medical tourists consider as important in evaluating the attractiveness of MTD and
to investigate the contribution of MTD attributes to MTD attractiveness. A review of litera-
ture suggests that MTDs are multiattribute and thus the identification of the various catego-
ries of these attributes becomes important. According to Dryglas and Salamaga (2018), the
existence of a MTD does not require natural resources but only particular political and legal
regulations (e.g. provisions on abortion or transplantation), as well as medical infrastructure
(a clinic or hospital). However, the perception of a MTD as a place with natural and cultural
48 | Diana Dryglas, Adrian Lubowiecki-Vikuk
attractions and a climate differing from those found at one’s place of residence contributes
to the formation of MTD attractiveness. The MTD attractiveness is primarily formed by med-
ical treatments and services, destination attributes, and tourism-specific factors (Junio, Kim,
& Lee, 2017). The research conducted by Lu and Wu (2015) clearly shows that medical tour-
ists felt that higher service quality led to better corporate image of medical institutions,
which was reflected in positive influences on the perceived value of MTD. With reference to
the destination components of UNWTO (2007), Pollard (2012) distinguished seven criterions
of MTD attractiveness: destination image (‘place myths’), risk and reward (outcome, guar-
antee, track record, safety), geographical proximity (travel convenience – access and barri-
ers, travel time), infrastructure (support services, internal travel, accommodation), cultural
proximity (language, food, customs and practices, religion), destination environment (cli-
mate, facilities, tourism attractions), and price (cost of stay, insurance, cost of treatment,
cost of travel). What constitutes the MTD attractiveness is, among other things: favorable
climate, beautiful and often pristine natural environment, convenient location in Europe and
competitive and sometimes relatively low prices for international medical tourists (Kiss,
2015; Smith & Puczkó, 2014). This part of Europe is not only touristically attractive, but also
innovative as for the access to technological medical specialisations (Wisla & Sierotowicz,
2016). Yet, the number of tourist agencies specialising in medical tourism is growing in CEEC
(Dryglas, 2018; Smith, Puczkó, Michalkó, Kiss, & Sziva, 2016). It is crucial since according to
Hemdi, Hassan, Aminuddin and Adanan (2016) as well as Idrus, Musa, Naziman, Aznan, Oth-
man and Pauzi (2012) MTD attractiveness will positively and significantly influence a future
choice of a MTD. This study extends prior studies through categorising the attributes of MTD
attractiveness into medical and tourism characteristics (Table 1). Based on the literature of
the subject, medical and tourism attributes that constitute MTD attractiveness can be di-
vided into: (1) economic factors (lower costs of treatment abroad, the economic develop-
ment of enterprises, country/region development), (2) cultural and social factors (the need
to preserve confidentiality for some people seeking medical treatment), (3) organisational-
legal factors (avoiding queues, access to medical procedures that are illegal in the patient’s
country of origin, effective marketing representatives of medical facilities, the ability to re-
fund part of the cost of treatment), (4) technological factors (a high standard of medical care
using state-of-the-art equipment), (5) spatial factors (travel distance), (6) natural factors (e.g.
favourable climate) (Chew & Koeshendro, 2015; Connell, 2013; Fetscherin & Stephano,
2016; Ganguli & Ebrahim, 2017; Lubowiecki-Vikuk, 2018; Lubowiecki-Vikuk & Gnusowski,
2016; Lunt, Smith, Mannion, Green, Exworthy, Hanefeld, & et al., 2014).
However, negative characteristics may significantly limit the possibilities of MTD image
development in a given CEEC. This is particularly visible in MTDs of CEEC which, on the one
hand, have the potential of being perceived as attractive but, on the other, are not well known
among potential medical tourists who base their associations on unfavorable stereotypes ra-
ther than on facts. Stereotypes are very common in the medical tourism market. In the con-
text of CEEC, potential medical tourists are aware that such countries exist but they know little
of the medical tourism product offered there. Thus, the problem of the country image can be
a barrier to the development of MTD despite its attractiveness. An example of such a destruc-
tive influence of image on MTD development is the position of CEEC in the international mar-
ket of medical tourism. Developing countries constitute a good example here because they
are perceived as countries with low-quality services and skills of doctors, which in turn leads
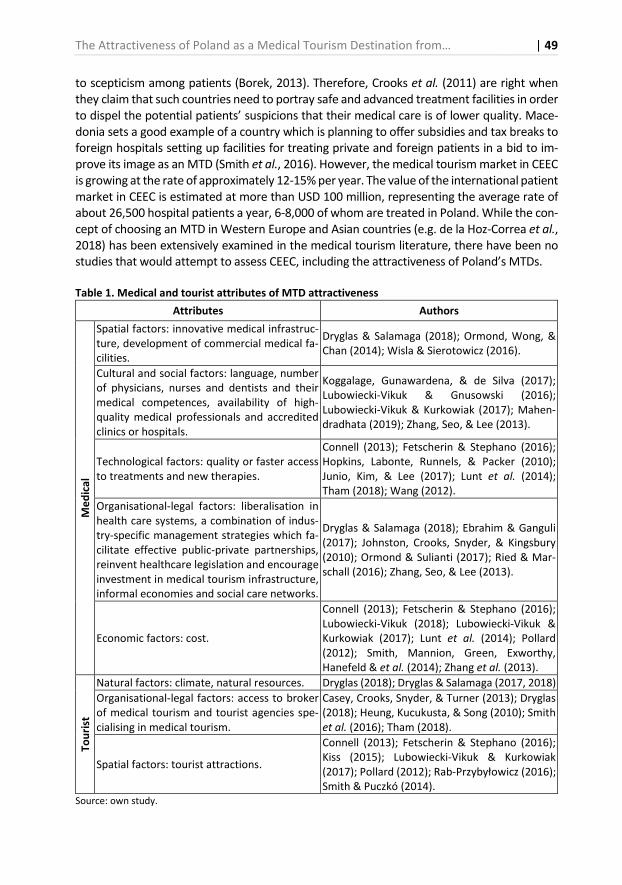
The Attractiveness of Poland as a Medical Tourism Destination from… | 49
to scepticism among patients (Borek, 2013). Therefore, Crooks et al. (2011) are right when
they claim that such countries need to portray safe and advanced treatment facilities in order
to dispel the potential patients’ suspicions that their medical care is of lower quality. Mace-
donia sets a good example of a country which is planning to offer subsidies and tax breaks to
foreign hospitals setting up facilities for treating private and foreign patients in a bid to im-
prove its image as an MTD (Smith et al., 2016). However, the medical tourism market in CEEC
is growing at the rate of approximately 12-15% per year. The value of the international patient
market in CEEC is estimated at more than USD 100 million, representing the average rate of
about 26,500 hospital patients a year, 6-8,000 of whom are treated in Poland. While the con-
cept of choosing an MTD in Western Europe and Asian countries (e.g. de la Hoz-Correa et al.,
2018) has been extensively examined in the medical tourism literature, there have been no
studies that would attempt to assess CEEC, including the attractiveness of Poland’s MTDs.
Table 1. Medical and tourist attributes of MTD attractiveness
Attributes Authors
Me
dic
al
Spatial factors: innovative medical infrastruc-
ture, development of commercial medical fa-
cilities.
Dryglas & Salamaga (2018); Ormond, Wong, &
Chan (2014); Wisla & Sierotowicz (2016).
Cultural and social factors: language, number
of physicians, nurses and dentists and their
medical competences, availability of high-
quality medical professionals and accredited
clinics or hospitals.
Koggalage, Gunawardena, & de Silva (2017);
Lubowiecki-Vikuk & Gnusowski (2016);
Lubowiecki-Vikuk & Kurkowiak (2017); Mahen-
dradhata (2019); Zhang, Seo, & Lee (2013).
Technological factors: quality or faster access
to treatments and new therapies.
Connell (2013); Fetscherin & Stephano (2016);
Hopkins, Labonte, Runnels, & Packer (2010);
Junio, Kim, & Lee (2017); Lunt et al. (2014);
Tham (2018); Wang (2012).
Organisational-legal factors: liberalisation in
health care systems, a combination of indus-
try-specific management strategies which fa-
cilitate effective public-private partnerships,
reinvent healthcare legislation and encourage
investment in medical tourism infrastructure,
informal economies and social care networks.
Dryglas & Salamaga (2018); Ebrahim & Ganguli
(2017); Johnston, Crooks, Snyder, & Kingsbury
(2010); Ormond & Sulianti (2017); Ried & Mar-
schall (2016); Zhang, Seo, & Lee (2013).
Economic factors: cost.
Connell (2013); Fetscherin & Stephano (2016);
Lubowiecki-Vikuk (2018); Lubowiecki-Vikuk &
Kurkowiak (2017); Lunt et al. (2014); Pollard
(2012); Smith, Mannion, Green, Exworthy,
Hanefeld & et al. (2014); Zhang et al. (2013).
To
uri
st
Natural factors: climate, natural resources. Dryglas (2018); Dryglas & Salamaga (2017, 2018)
Organisational-legal factors: access to broker
of medical tourism and tourist agencies spe-
cialising in medical tourism.
Casey, Crooks, Snyder, & Turner (2013); Dryglas
(2018); Heung, Kucukusta, & Song (2010); Smith
et al. (2016); Tham (2018).
Spatial factors: tourist attractions.
Connell (2013); Fetscherin & Stephano (2016);
Kiss (2015); Lubowiecki-Vikuk & Kurkowiak
(2017); Pollard (2012); Rab-Przybyłowicz (2016);
Smith & Puczkó (2014).
Source: own study.
50 | Diana Dryglas, Adrian Lubowiecki-Vikuk
Consequently, this gap in the literature led to the following hypothesis:
H1: The number of Britons and Germans interested in medical services provided
outside their countries who would like to use medical services in CEEC is greater
than the number of people who have already used such services in CEEC.
The data for 2009 indicate that foreign patients spent approx. USD 200 million on
medical tourism services in Poland. Two years later, there was an increase by almost 20%
(OECD, 2014). As reported by Rab-Przybyłowicz (2016), in 2015 most of the tourism-
related spending in Poland was generated by foreign tourists who visited the country for
health/medical reasons. An average tourist spent around USD 490 per day/per person
compared to USD 742 per day/per person spent by a medical tourist. Unfortunately, the
size of the Polish medical tourism market has not been estimated yet due to the lack of
fully reliable scientific research. The statistical data available are most often constructed
rather intuitively, based on individual regional data, drawing on the analyses of the global
medical tourism industry (Connell, 2016). The medical tourism in Poland is related in par-
ticular to private providers of medical services. For this reason, the overall assessment of
the healthcare system quality published periodically by the WHO and the OECD which
regards the dominant public sector in Poland may not reflect a better quality and stand-
ards of healthcare provided by private health centres used by foreign patients (Borek,
2013, p. 342). It should also be taken into account that the rankings of the quality and
accessibility of healthcare which are widely available to foreign patients are unfavourable
for Poland. Apart from that, no systematic analysis of the data concerning the quality,
efficiency and availability of medical care provided by private centres has been conducted
yet. In the years 2011-14, the medical tourism market in Poland was dominated by Polish
citizens, and every third and every fifth medical tourist came from the UK and Germany,
respectively (Lubowiecki-Vikuk & Rab-Przybyłowicz, 2015). For medical purposes, Poland
was also visited by citizens of Ireland, the USA, the Netherlands, Norway, Denmark and
Sweden. Apart from the EU citizens, there appeared a segment of tourists from the Com-
monwealth of Independent States and the Persian Gulf. Over 40,500 foreign patients
(mainly males) used the services of pharmacies in southern Poland in the year 2014. They
came from the UK, Germany, Russia, the Czech Republic and, less frequently, from Asian
countries (Lubowiecki-Vikuk & Mucha, 2015). In Poland medical tourism is treated as an
export product (Euromonitor International, 2014; OECD, 2014). Thus, medical tourism
was one of the priority industries promoted by the Ministry of Economy in the years 2012-
2015, and in the years 2017-2019 with a 2022 perspective it is going to be promoted by
the Polish Tourist Organisation (PTO). Creating the image of Poland as an MTD has mainly
been based on the participation of medical and paramedical entities, including tourism
ones, in foreign trade missions and medical tourism fairs.
PTO (2016) in a broad aspect, i.e. pro-health services, promotes inter alia medical
tourism in foreign markets, constituting one of those entities which contribute to creating
an image of Poland as an MTD. These actions are aimed at Russian, Ukrainian, Norwegian,
American and Arabic markets, which is a result of EU subsidies. According to the PTO
(2015) reports, foreign tourists expressed satisfaction with their stay in Poland. This is
connected with their activities conducive to high satisfaction, among which treatments
‘for health & beauty’ are of particular importance. Foreign tourists perceive Poland as:
touristically attractive; offering the possibility of spending free time in line with one’s
The Attractiveness of Poland as a Medical Tourism Destination from… | 51
preferences; a place which is worth further exploring, and a country which does not pose
a threat to tourists. Furthermore, the country is primarily associated with cities (city
break), visiting monuments, museums, forests and national parks and UNESCO sites. Yet,
it is pointed out that Poland still does not have a distinctive, coherent and attractive MTD
image abroad (Kiryluk & Glińska, 2015).
While there have been studies that attempted to identify the scale of the develop-
ment of MTDs in CEEC (Fetscherin & Stephano, 2016), there have been no studies that
would assess which of the MTDs in CEEC is most popular among medical tourists.
This study was an attempt to bridge this gap and therefore it puts forward another
hypothesis:
H2: Poland is the country most frequently chosen by Britons and Germans who
have already used or would like to use medical services in the CEEC region.
According to Buhalis (2000), each type of destination can only match certain types
of demand. For that reason MTDs do not endeavor to cater for the entire market, seeing
the futility of such efforts. Thus, MTD attractiveness necessitates looking at the attrib-
utes of its constitution through the prism of individual market segments. In this context,
some authors indicate that demographic factors like age, gender, or nationality affect
the perception of the tourism destination (e.g. Rittichainuwat, Qu, & Brown, 2001). This
leads to selecting segments which attributes of MTD attractiveness will be targeted at
and developing a suitable marketing strategy for each of them (Dryglas & Salamaga,
2018). In the present study, the focus is placed especially on gender, age and nationality
segmentation analysis regarded as segmentation based on socio-demographic variables.
As the market of recipients of medical services offered by Poland is not a unified whole,
it is crucial that local governments and MTD managers distinguish its segments based
on socio-demographic factors and target particular attributes which constitute the at-
tractiveness of Poland’s MTD at a specific type of consumers in order to make MTDs in
Poland more competitive on the European medical market.
Hence the attempt to demonstrate relations between particular attributes of the at-
tractiveness of Poland’s MTD market and socio-demographic factors.
Therefore, the additional research hypothesis is as follows:
H3: Respondents’ opinions about Poland as a MTD are influenced by socio-demo-
graphic factors.
MATERIAL AND METHODS
The research material for the study was obtained through surveys carried out among Brit-
ons and Germans who constitute a large segment of medical tourists in Poland. They were
considered the best research samples for studying Poland’s identity as an MTD because
studies by Lunt et al. (2014) and Hanefeld, Smith and Noree (2016) demonstrate that Po-
land is the leading MTD among CEECs in the case of Britons, and Schmerler (2018) reports
that the same is true in the case of Germans, which stems from cross-border collaboration
between providers and insurers (Ried & Marschall, 2016). On the basis of information from
Medical Tourism Association (MTA, 2015) and the International Medical Travel Journal on
accredited and certified medical tourism entities those operating in Germany and Great
52 | Diana Dryglas, Adrian Lubowiecki-Vikuk
Britain were selected. They were subsequently sent the Internet address of the question-
naire. An invitation to participate in the study was also made available on specially dedi-
cated online forums and social networking sites, since as proved by Abubakar and Ilkan
(2016) – virtual community membership has a strong influence on a medical tourist’s be-
haviours and the way information is transmitted. In this way, the questionnaire was tar-
geted at a clearly defined group of people, i.e. those who were interested in medical ser-
vices provided outside their country or had already used such services and at the same
time visited selected websites related to medical tourism in CEEC.
A total of 300 responses in German and English were received. Out of these, 18
questionnaires were excluded from the analysis due to incomplete information they
contained. The final sample constituted (n = 282) valid and usable responses. In accord-
ance with Westland’s (2010) statistical algorithm for computing the absolute minimum
sample size, the lower bound on sample size was established at 228 respondents. There-
fore, our sample of 282 fulfills the recommended minimum sample size for sampling
adequacy. For a sample size of 282 and a confidence interval of 95%, the resulting sam-
ple error is 5.8%. The characteristics of the target group were determined in advance.
Both Britons and Germans completed the same number of surveys (n = 141), with an
equal number of female and male respondents (71 vs. 70).
The study was conducted from 1 to 30 September, 2015, just after the end of the
tourist season. The pilot version of the questionnaire was administered to 20 tourists to
ensure that the questions were comprehensible. Their feedback and suggestions were
incorporated into the final instrument.
The survey questionnaire, modified after the pilot study (n = 20) and based on literature
review consisted of 3 questions. The first question (Q1) was: Would you like to use medical
services in CEEC? (Albania, Belarus, Bosnia and Herzegovina, Bulgaria, Croatia, the Czech Re-
public, Estonia, Hungary, Latvia, Lithuania, Macedonia, Moldova, Montenegro, Poland, Ro-
mania, Serbia, Slovakia, Slovenia and Ukraine – binary variable with values 1 – Yes and 0 –
No). The second question (Q2) was: Have you used medical services in CEEC? (binary variable
with values 1 or 0, measured among respondents who chose at least one country in Q1 or
Q2, the variable takes the value of 1 if a given country was indicated by the respondent and
0 otherwise). The third question (Q3) was: What attributes do you associate Poland with?
(i.e. non-medical attributes: tourism and leisure activities, big cities, historical monuments,
art and culture, nature/scenery, Polish food, great shopping, friendly people, famous Poles,
family/friends, developing country; medical attributes: medical services). Furthermore, with
multiple-response categorical variables, each attribute was a binary response with value 1
(the attribute was indicated) or 0 (the attribute was not indicated).
In the first question, the respondents could choose a maximum of 3 CEEC. In the sec-
ond question, apart from indicating 3 CEEC, the respondents could choose an answer stat-
ing that they had not had any experience with medical tourism. We also collected data on
the gender, age and nationality of the respondents.
The Computer-Assisted Web Interviewing (CAWI) method was used to conduct the
survey. The method was based on the technique of computer-assisted data collection.
The advantage of this method is that it minimises errors by automatically saving the
database and its low cost. When choosing the CAWI method, the authors largely sought
to keep private space of the researched community due to the fact that medical tourists
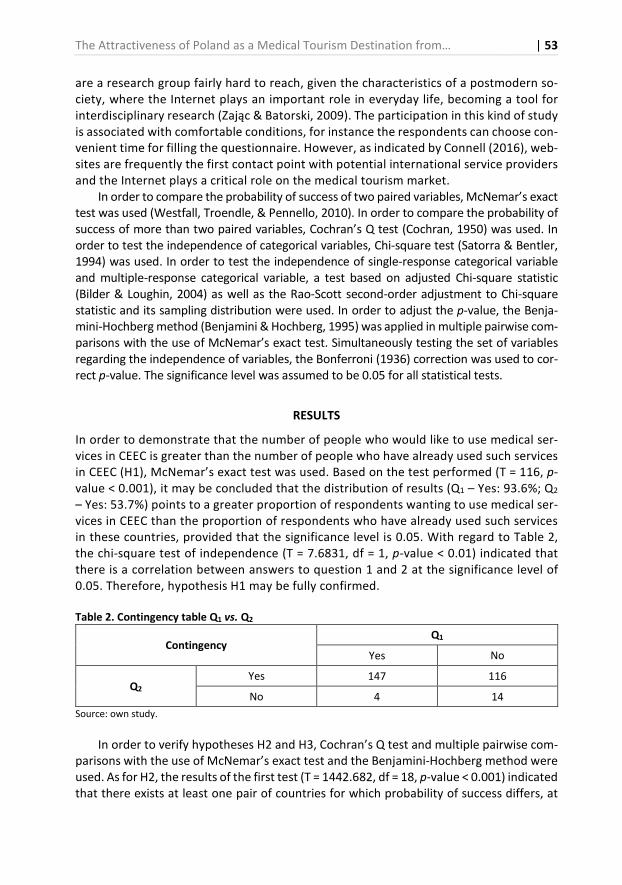
The Attractiveness of Poland as a Medical Tourism Destination from… | 53
are a research group fairly hard to reach, given the characteristics of a postmodern so-
ciety, where the Internet plays an important role in everyday life, becoming a tool for
interdisciplinary research (Zając & Batorski, 2009). The participation in this kind of study
is associated with comfortable conditions, for instance the respondents can choose con-
venient time for filling the questionnaire. However, as indicated by Connell (2016), web-
sites are frequently the first contact point with potential international service providers
and the Internet plays a critical role on the medical tourism market.
In order to compare the probability of success of two paired variables, McNemar’s exact
test was used (Westfall, Troendle, & Pennello, 2010). In order to compare the probability of
success of more than two paired variables, Cochran’s Q test (Cochran, 1950) was used. In
order to test the independence of categorical variables, Chi-square test (Satorra & Bentler,
1994) was used. In order to test the independence of single-response categorical variable
and multiple-response categorical variable, a test based on adjusted Chi-square statistic
(Bilder & Loughin, 2004) as well as the Rao-Scott second-order adjustment to Chi-square
statistic and its sampling distribution were used. In order to adjust the p-value, the Benja-
mini-Hochberg method (Benjamini & Hochberg, 1995) was applied in multiple pairwise com-
parisons with the use of McNemar’s exact test. Simultaneously testing the set of variables
regarding the independence of variables, the Bonferroni (1936) correction was used to cor-
rect p-value. The significance level was assumed to be 0.05 for all statistical tests.
RESULTS
In order to demonstrate that the number of people who would like to use medical ser-
vices in CEEC is greater than the number of people who have already used such services
in CEEC (H1), McNemar’s exact test was used. Based on the test performed (T = 116, p-
value < 0.001), it may be concluded that the distribution of results (Q1 – Yes: 93.6%; Q2
– Yes: 53.7%) points to a greater proportion of respondents wanting to use medical ser-
vices in CEEC than the proportion of respondents who have already used such services
in these countries, provided that the significance level is 0.05. With regard to Table 2,
the chi-square test of independence (T = 7.6831, df = 1, p-value < 0.01) indicated that
there is a correlation between answers to question 1 and 2 at the significance level of
0.05. Therefore, hypothesis H1 may be fully confirmed.
Table 2. Contingency table Q1 vs. Q2
Contingency Q1
Yes No
Q2 Yes 147 116
No 4 14
Source: own study.
In order to verify hypotheses H2 and H3, Cochran’s Q test and multiple pairwise com-
parisons with the use of McNemar’s exact test and the Benjamini-Hochberg method were
used. As for H2, the results of the first test (T = 1442.682, df = 18, p-value < 0.001) indicated
that there exists at least one pair of countries for which probability of success differs, at
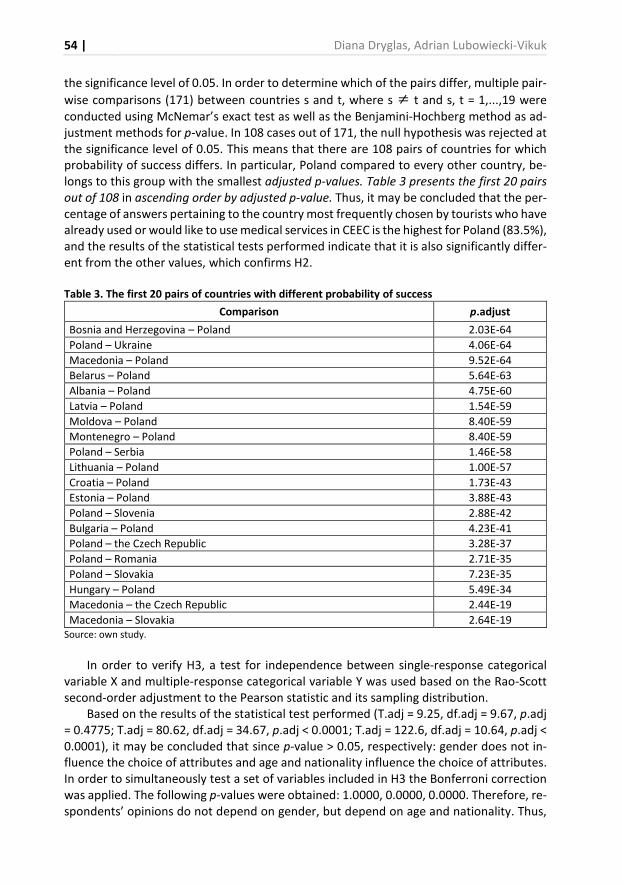
54 | Diana Dryglas, Adrian Lubowiecki-Vikuk
the significance level of 0.05. In order to determine which of the pairs differ, multiple pair-
wise comparisons (171) between countries s and t, where s ≠ t and s, t = 1,...,19 were
conducted using McNemar’s exact test as well as the Benjamini-Hochberg method as ad-
justment methods for p-value. In 108 cases out of 171, the null hypothesis was rejected at
the significance level of 0.05. This means that there are 108 pairs of countries for which
probability of success differs. In particular, Poland compared to every other country, be-
longs to this group with the smallest adjusted p-values. Table 3 presents the first 20 pairs
out of 108 in ascending order by adjusted p-value. Thus, it may be concluded that the per-
centage of answers pertaining to the country most frequently chosen by tourists who have
already used or would like to use medical services in CEEC is the highest for Poland (83.5%),
and the results of the statistical tests performed indicate that it is also significantly differ-
ent from the other values, which confirms H2.
Table 3. The first 20 pairs of countries with different probability of success
Comparison p.adjust
Bosnia and Herzegovina – Poland 2.03E-64
Poland – Ukraine 4.06E-64
Macedonia – Poland 9.52E-64
Belarus – Poland 5.64E-63
Albania – Poland 4.75E-60
Latvia – Poland 1.54E-59
Moldova – Poland 8.40E-59
Montenegro – Poland 8.40E-59
Poland – Serbia 1.46E-58
Lithuania – Poland 1.00E-57
Croatia – Poland 1.73E-43
Estonia – Poland 3.88E-43
Poland – Slovenia 2.88E-42
Bulgaria – Poland 4.23E-41
Poland – the Czech Republic 3.28E-37
Poland – Romania 2.71E-35
Poland – Slovakia 7.23E-35
Hungary – Poland 5.49E-34
Macedonia – the Czech Republic 2.44E-19
Macedonia – Slovakia 2.64E-19
Source: own study.
In order to verify H3, a test for independence between single-response categorical
variable X and multiple-response categorical variable Y was used based on the Rao-Scott
second-order adjustment to the Pearson statistic and its sampling distribution.
Based on the results of the statistical test performed (T.adj = 9.25, df.adj = 9.67, p.adj
= 0.4775; T.adj = 80.62, df.adj = 34.67, p.adj < 0.0001; T.adj = 122.6, df.adj = 10.64, p.adj <
0.0001), it may be concluded that since p-value > 0.05, respectively: gender does not in-
fluence the choice of attributes and age and nationality influence the choice of attributes.
In order to simultaneously test a set of variables included in H3 the Bonferroni correction
was applied. The following p-values were obtained: 1.0000, 0.0000, 0.0000. Therefore, re-
spondents’ opinions do not depend on gender, but depend on age and nationality. Thus,
The Attractiveness of Poland as a Medical Tourism Destination from… | 55
it may be concluded that in light of the values presented in Table 4 and the results of the
statistical test performed, hypothesis H3 may be partially confirmed.
CONCLUSIONS AND DISCUSSION
The results of the present empirical study indicate that tourists from Western Europe
are currently more interested in using medical services in Poland than in the past. This
is due to the involvement of respective governments in the development of medical
tourism of the countries concerned (Ganguli & Ebrahim, 2017). Recently, medical tour-
ism has become a part of the policy of governments in CEEC, among them Montenegro
and Poland. Its objective is not only an effective intervention in the national healthcare
system or an increase in exports of medical services, but also an improvement of a poor
image of MTD (Ormond, 2011). Good practices of governments include the support and
creation of MTD image (Jónás-Berki, Csapó, Pálfi, & Aubert, 2015). They are primarily
based on: incentives, government promotion and policy investments (Kowalska-Bobko,
Mokrzycka, Sagan, Włodarczyk, & Zabdyr-Jamróz, 2016). Additionally, they encourage
cooperation and partnerships between the public and private medical and tourism
sectors (Iordache, Ciochină, & Popa, 2013).
Out of CEEC, Poland was the most frequently chosen MTD because in Poland costs of
healthcare services are often lower than in the countries of Western Europe, and the
standard of these services is considered to be high (Euromonitor International, 2014).
What is also worth emphasising is the fact that associations with a given destination are
affected by such socio-demographic factors as age and nationality but not gender, which
may stem from the fact that awareness and national identity play a greater role when
choosing attributes defining an MTD. So, the concept of building MTD attractiveness is the
result of not only specific features of an MTD, which determine its market success, but
also, to a large extent, of how the medical tourists perceive a given MTD.
The added value of the present work, which contributes to the development of mar-
keting in MTDs, encompasses the cognitive (empirical) and applied dimensions. As regards
the empirical part, identification of the growing importance of Poland as a MTD, as well as
the socio-demographic factors affecting the choice of a given MTD can be a useful tool for
marketing planners, destination managers and marketers to create an effective marketing
policy of MTDs. This approach implies collaborative, cooperative and multilevel way of
MTD management. In other words, the managers of the supply-side entities providing
medical tourism services and destination management organisations should be an active
nexus between different actors involved in enterprise and destination management, plan-
ning and policy making. Consequently, what is necessary to create the attractiveness of
MTDs in Poland is cooperation at the national level, regional level (between individual re-
gions) and local level (between local authorities and medical and tourist enterprises as
well as collaboration of medical and tourism companies).
Due to time and financial limitations of the project, the empirical research was con-
ducted only in reference to selected medical tourists. The obstacles mentioned do not di-
minish the cognitive value of the research. They constitute a starting point for further re-
search studies, which should be aiming especially at a deeper exploration of MTD attrac-
tiveness in Poland. This study was limited by the methodology applied as outlined below.
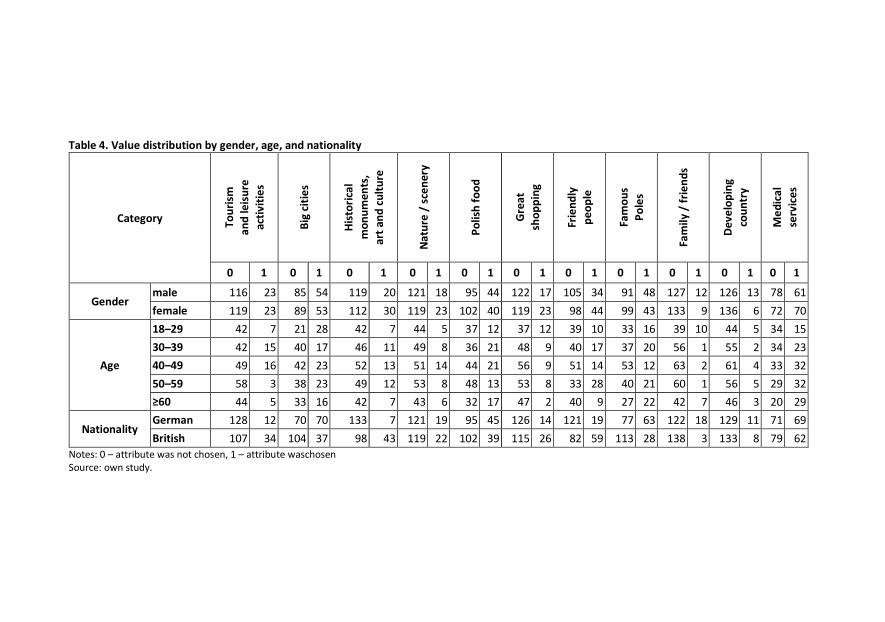
Table 4. Value distribution by gender, age, and nationality
Category T
ou
rism
an
d l
eis
ure
act
ivit
ies
Big
cit
ies
His
tori
cal
mo
nu
me
nts
,
art
an
d c
ult
ure
Na
ture
/ s
cen
ery
Po
lish
fo
od
Gre
at
sho
pp
ing
Frie
nd
ly
pe
op
le
Fam
ou
s
Po
les
Fam
ily
/ f
rie
nd
s
De
ve
lop
ing
cou
ntr
y
Me
dic
al
serv
ice
s
0 1 0 1 0 1 0 1 0 1 0 1 0 1 0 1 0 1 0 1 0 1
Gender male 116 23 85 54 119 20 121 18 95 44 122 17 105 34 91 48 127 12 126 13 78 61
female 119 23 89 53 112 30 119 23 102 40 119 23 98 44 99 43 133 9 136 6 72 70
Age
18–29 42 7 21 28 42 7 44 5 37 12 37 12 39 10 33 16 39 10 44 5 34 15
30–39 42 15 40 17 46 11 49 8 36 21 48 9 40 17 37 20 56 1 55 2 34 23
40–49 49 16 42 23 52 13 51 14 44 21 56 9 51 14 53 12 63 2 61 4 33 32
50–59 58 3 38 23 49 12 53 8 48 13 53 8 33 28 40 21 60 1 56 5 29 32
≥60 44 5 33 16 42 7 43 6 32 17 47 2 40 9 27 22 42 7 46 3 20 29
Nationality German 128 12 70 70 133 7 121 19 95 45 126 14 121 19 77 63 122 18 129 11 71 69
British 107 34 104 37 98 43 119 22 102 39 115 26 82 59 113 28 138 3 133 8 79 62
Notes: 0 – attribute was not chosen, 1 – attribute waschosen
Source: own study.
The Attractiveness of Poland as a Medical Tourism Destination from… | 57
The CAWI method has some disadvantages. A lot of people still do not have Internet ac-
cess, although various studies suggest that electronic word-of-mouth is now the most
common source of information to medical travellers.
REFERENCES
Abubakar, A.M., & Ilkan, M. (2016). Impact of online WOM on destination trust and intention to
travel: A medical tourism perspective. Journal of Destination Marketing & Management, 5(3),
192-201. https://doi.org/10.1016/j.jdmm.2015.12.005
Beladi, H., Chao, C.-C., Ee, M.S., & Hollas, D. (2015). Medical tourism and health worker
migration in developing countries. Economic Modelling, 46, 391-396.
https://doi.org/10.1016/j.econmod.2014.12.045
Benjamini, Y., & Hochberg, Y. (1995). Controlling the false discovery rate: A practical and powerful
approach to multiple testing. Journal of the Royal Statistical Society, Series B, 57(1), 289-300.
Bilder, C.R., & Loughin, T.M. (2004). Testing for marginal independence between two categorical
variables with multiple responses. Biometrics, 60(1), 241-248.
Bonferroni, C.E. (1936). Teoria statistica delle classi e calcolo delle probabilità. Pubblicazioni del R
Istituto Superiore di Scienze Economiche e Commerciali di Firenze, 8, 3-62.
Borek, E. (2013). Medical tourism in Europe and in Poland – present status, development bariers,
perspectives and recemendations concerning the development of medical tourism in Poland.
Public Health and Governance. Scientific Issues of Health Protection, 11, 333-348.
Breitrück, V., & Nunn, E. (2011). Health & medical tourism. in A. Papathanassis, (Ed.). The long
tail of tourism: holiday niches and their impact on mainstream tourism (pp. 57-67).
Wiesbaden: Gabler Verlag.
Buhalis, D. (2000). Marketing the competitive destination of the future. Tourism Management,
21(1), 97-116. https://doi.org/10.1016/S0261-5177(99)00095-3
Cameron, K., Crooks, V.A., Chouinard, V., Snyder, J., Johnston, R., & Casey, V. (2014). Motivation,
justification, normalization: Talk strategies used by Canadian medical tourists regarding their
choices to go abroad for hip and knee surgeries. Social Science & Medicine, 106, 93-100.
https://doi.org/10.1016/j.socscimed.2014.01.047
Casey, V., Crooks, V.A., Snyder, J., & Turner, L. (2013). Knowledge brokers, companions, and naviga-
tors: a qualitative examination of informal caregivers’ roles in medical tourism. International
Journal for Equity in Health, 12, 94. https://doi.org/10.1186/1475-9276-12-94
Chew, Y.T., & Koeshendro, A.D. (2015). Identifying research gaps in medical tourism. In M. Kozak,
N. & Kozak (Eds.). Destination marketing: An international perspective (pp. 119-125). London:
Taylor & Francis.
Choi, H. (2016). Medical tourism. In J. Jafari & H. Xiao (Eds.). Encyclopedia of tourism (pp. 602-603).
Switzerland: Springer International Publishing.
Cochran W.G. (1950). The comparison of percentages in matched samples. Biometrika, 37(3-4), 256-266.
Connell, J. (2013). Contemporary medical tourism: Conceptualisation, culture and commodification.
Tourism Management, 34, 1-13. https://doi.org/10.1016/j.tourman.2012.05.009
Connell, J. (2016). Reducing the scale? From global images to border crossings in medical tourism.
Global Networks, 16(4), 531-550. https://doi.org/10.1111/glob.12136
Crooks, V.A., Turner, L., Snyder, J., Johnston, R., & Kingsbury, P. (2011). Promoting medical tourism
to India: Messages, images, and the marketing of international patient travel. Social Science &
Medicine, 72(5), 726-732. https://doi.org/10.1016/j.socscimed.2010.12.022
58 | Diana Dryglas, Adrian Lubowiecki-Vikuk
de la Hoz-Correa, A., Muñoz-Leiva, F., & Bakucz, M. (2018). Past themes and future trends in
medical tourism research: A co-word analysis. Tourism Management, 65, 200-211.
https://doi.org/10.1016/j.tourman.2017.10.001
Dryglas, D. (2018). Designing a health tourism product structure model in the process of marketing
management. Warsaw: PWN.
Dryglas, D., & Salamaga, M. (2017). Applying destination attribute segmentation to health tourists:
A case study of Polish spa resorts. Journal of Travel & Tourism Marketing, 34(4), 503-514.
https://doi.org/10.1080/10548408.2016.1193102
Dryglas, D., & Salamaga, M. (2018). Segmentation by push motives in health tourism destinations:
A case study of Polish spa resorts. Journal of Destination Marketing & Management, 9, 234-246.
https://doi.org/10.1016/j.jdmm.2018.01.008
Ebrahim, A.H., & Ganguli, S. (2017). Strategic priorities for exploiting Bahrain’s medical tourism
potential. Journal of Place Management and Development, 10(1), 45-60.
https://doi.org/10.1108/JPMD-03-2016-0011
Euromonitor International (2014). Health and wellness tourism in Poland. Retrieved on January 5,
2019 from http://www.euromonitor.com/health-and-wellness-tourism-in-poland/report
Fetscherin, M., & Stephano, R.M. (2016). The medical tourism index: Scale development and valida-
tion. Tourism Management, 52, 539-556. https://doi.org/10.1016/j.tourman.2015.08.010
Freyer, W., & Kim, B.S. (2014). Medizintourismus und Medizinreisen - eine inter-disziplinäre
Betrachtung. Gesundheitswesen, 76(1), 65-68.
Gallarza, M.G., Saura, I.G., & Garcia, H.C. (2002). Destination image: Toward a conceptual framework.
Annals of Tourism Research, 29(1), 56-78. https://doi.org/10.1016/S0160-7383(01)00031-7
Ganguli, S., & Ebrahim, A.H. (2017). A qualitative analysis of Singapore’s medical tourism competitiveness.
Tourism Management Perspectives, 21, 74-84. https://doi.org/10.1016/j.tmp.2016.12.002
Ghanbari, S., Hajinejad, A., & Rahmani, P. (2014). Formulating strategic plan of medical tourism
development. International Journal of Travel Medicine and Global Health, 2(4), 149-154.
Guiry, M., & Veguist, D.G. (2015). South Korea’s medical tourism destination brand personality and
the influence of personal values. Asia Pacific Journal of Tourism Research, 20(5), 563-584.
https://doi.org/10.1080/10941665.2014.904804
Gupte, G., & Panjamapirom, A. (2014). Understanding medical tourism. In A.I. Culyer (Ed.),
Encyclopedia of Health Economics (pp. 404-410). York, UK: Elsevier.
Hanefeld, J., Smith, R., & Noree, T. (2016). Medical tourism. In R.M. Scheffler. (Ed.), World sci-
entific handbook of global health economics and public policy (pp. 333-350). London: World
Scientific Publishing Co.
Hemdi, M.A., Hassan, N.A., Aminuddin, N., & Adanan, A. (2016). Medical tourism destination choice:
A proposition and research agenda. In S.A. Jamal, S.M.Radzi,., N. Sumarjan, C.T, Chik, & M.F.S.
Bakhtiar,. (Eds.), Innovation and best practices in hospitality and tourism research (pp. 185-188).
London: Taylor & Francis Group.
Heung, V.C.S., Kucukusta, D., & Song, H. (2010). A conceptual model of medical tourism: Implications
for future research. Journal of Travel & Tourism Marketing, 27(3), 236-251.
https://doi.org/10.1080/10548401003744677
Hopkins, L., Labonte, R., Runnels, V., & Packer, C. (2010). Medical tourism today: What is the state
of existing knowledge?. Journal of Public Health Policy, 31(2), 185-198.
https://doi.org/10.1057/jphp.2010.10
Idrus, S., Musa, R., Naziman, Y.H.N.M., Aznan, N.F.M., Othman, A.Y., & Pauzi, N.M. (2012). Medical
tourism destination brand positioning model. In A. Zainal, S.M. Radzi, R., Hashim, C.T. Chik, & R.
The Attractiveness of Poland as a Medical Tourism Destination from… | 59
Abu, (Eds.), Current issues in hospitality and tourism research and innovations. Proceedings of
the International Hospitality and Tourism Conference, IHTC 2012 (pp. 515-518). Boca Raton: CRC
Press, Taylor & Francis Group.
Iordache, C., Ciochină, I., & Popa, R. (2013). Medical tourism – between the content and socio-
economic development goals. Development strategies. Romanian Journal of Marketing, 1, 31-42.
Johnston, R., Crooks, V.A., Snyder, J., & Kingsbury, P. (2010). What is known about the effects of
medical tourism in destination and departure countries? A scoping review. International Journal
for Equity in Health, 9, 24. https://doi.org/10.1186/1475-9276-9-24
Jónás-Berki, M., Csapó, J., Pálfi, A., & Aubert, A. (2015). A market and spatial perspective of health tourism
destinations: The Hungarian experience. International Journal of Tourism Research, 17, 602-612.
Junio, M.M.V., Kim, J.H., & Lee, T.J. (2017). Competitiveness attributes of a medical tourism destina-
tion: The case of South Korea with importance-performance analysis. Journal of Travel & Tour-
ism Marketing, 34(4), 444-460. https://doi.org/10.1080/10548408.2016.1182454
Kiryluk, H., & Glińska, E. (2015). Creation and evaluation of the tourist image of a country – The
example of Poland. Procedia - Social and Behavioral Sciences, 213, 671-676.
Kiss, K. (2015). The challenges of developing health tourism in the Balkans. Tourism, 63(1), 97-110.
Koggalage, P.D., Gunawardena, N.S., & de Silva, A.H. (2017). Medical travellers’ perspectives in se-
lecting in-patient services at selected private hospitals in Sri Lanka. Asia Pacific Journal of Tour-
ism Research, 22(7), 747-757. https://doi.org/10.1080/10941665.2017.1319396
Kowalska-Bobko, I., Mokrzycka, A., Sagan, A., Włodarczyk, W.C., & Zabdyr-Jamróz, M. (2016). Imple-
mentation of the cross-border healthcare directive in Poland: How not to encourage patients
to seek care abroad?. Health Policy, 120(11), 1233-1239. https://doi.org/10.1016/j.health-
pol.2016.07.011
Lu, H.Y., & Wu, W.Y. (2018). Factors associated with medical travel behaviours: The
input-process-output perspective. Current Issues in Tourism, 21(3), 243-258.
https://doi.org/10.1080/13683500.2015.1072503
Lubowiecki-Vikuk, A. (2018). Consumption of dental services: Medical tourism in CEE. European Journal
of Service Management, 27/1(3), 135-142. https://doi.org/10.18276/ejsm.2018.27/1-16
Lubowiecki-Vikuk, A., & Gnusowski, M. (2016). The role of inter-cultural competence on the medical
tourism market in Poland. Hygeia Public Health, 51(3), 255-261.
Lubowiecki-Vikuk, A., & Kurkowiak, J. (2017). Medical tourism potential of Central and Eastern Eu-
rope: Attempt at classification. CBU International Conference Proceedings, 5, 286-293.
https://doi.org/10.12955/cbup.v5.940
Lubowiecki-Vikuk, A., & Mucha, D. (2015). Pharmaceutical tourism development prospects in the
region of Southern Poland. Scientific Treatises of University School of Physical Education in
Wrocław, 49, 147-156.
Lubowiecki-Vikuk, A., & Rab-Przybyłowicz, J. (2015). Selected aspect of functioning medical tourism
market in Poland. Folia Turistica, 34, 85-107.
Lunt, N., Smith, R.D., Mannion, R., Green, S.T., Exworthy, M., Hanefeld, J., & et al. (2014). Implications
for the NHS of inward and outward medical tourism: A policy and economic analysis using literature
review and mixed-methods approaches. Health Services and Delivery Research, 2(2), 1-234.
Mahendradhata, Y. (2019). Proceed with caution: Potential challenges and risks of developing
healthcare tourism in Indonesia. Global Public Health, 14(3), 340-350.
https://doi.org/10.1080/17441692.2018.1504224

60 | Diana Dryglas, Adrian Lubowiecki-Vikuk
Mainil, T., Eijgelaar, E., Klijs, J., Nawijn, J., & Peeters, P. (2017). Research for TRAN Committee –
Health tourism in the EU: a general investigation. Brussels: European Parliament, Policy Depart-
ment for Structural and Cohesion Policies.
Mayo, E., & Jarvis, L. (1981). Psychology of leisure travel. Boston: CABI Publishing.
MTA (2015). MTA members in Europe. Retrieved from: https://www.medicaltourismassociation.com/
en/mta-members-in-europe.html
OECD (2014). Health at a glance: Europe 2014. OECD Publishing.
Ormond, M., & Kaspar, H. (2019). Medical travel/tourism and the city. In I.Vojnovic, A.L. Pearson,
A. Gershim, G. DeVerteuil & A. Allen (Eds.), Handbook of Global Urban Health (pp. 1-21). Abing-
don: Routledge.
Ormond, M. (2011). Shifting subjects of health-care: Placing ‘medical tourism’ in the context of Ma-
laysian domestic health-care reform. Asia Pacific Viewpoint, 52(3), 247-259.
https://doi.org/10.1111/j.1467-8373.2011.01457.x
Ormond, M., & Sulianti, D. (2017). More than medical tourism: lessons from Indonesia and Malaysia
on South-South intra-regional medical travel. Current Issues in Tourism, 20(1), 94-110.
https://doi.org/10.1080/13683500.2014.937324
Ormond, M., Wong, K.M., & Chan, C.K. (2014). Medical tourism in Malaysia: how can we better iden-
tify and manage its advantages and disadvantages?. Global Health Action, 7, 96-99.
https://doi.org/10.3402/gha.v7.25201
Pollard, K. (2012). How can we measure a destination’s attractiveness?. Retrieved from
https://www.imtj.com/blog/how-can-we-measure-destinations-attractiveness/ on January 5, 2019.
Prebensen, N.K. (2007). Exploring tourists’ images of a distant destination. Tourism Management,
28(3), 747-756. https://doi.org/10.1016/j.tourman.2006.05.005
PTO. (2015). A tourism service consumer survey, assessing the level of satisfaction with tourism ser-
vices used by national and foreign tourists during their travel and stay in Poland in 2014.
Retrieved from http://www.pot.gov.pl/do-pobrania/l/materialy-do-pobrania/badania-i-analizy
on January 5, 2019.
PTO. (2016). Market analysis - health service promotion. Retrieved from http://pot.gov.pl/6-
4fundusze-ue/l/program-promocji-uslug-prozdrowotnych/koncepcja-programu-promocji-
uslug-prozdrowotnych on January 5, 2019.
Rab-Przybyłowicz, J. (2016). Trends and socio-economic aspects of medical tourism development in
Poland. Studia Periegetica, 2(16), 99-118.
Ried, W., & Marschall, P. (2016). Potential benefits of cross-border health care: The case of Poland
and Germany. Economics and Sociology, 9(3), 14-27. https://doi.org/10.14254/2071-
789X.2016/9-3/2
Rittichainuwat, B.N., Qu, H., & Brown, T.J. (2001). Thailand’s international travel image mostly favor-
able. Cornell Hospitality Quarterly, 42(2), 82-95. https://doi.org/10.1016/S0010-
8804(01)80020-3
Runnels, V., & Carrera, P. (2012). Why do patients engage in medical tourism?. Maturitas, 73(4), 300-
304. https://doi.org/10.1016/j.maturitas.2012.08.011
Satorra, A., & Bentler, P.M. (1994). Corrections to test statistics and standard errors in covariance
structure analysis. In von A. Eye & C.C. Clogg (Eds.), Latent variables analysis: Applications for
developmental research (pp. 399-419). Thousand Oaks, CA: Sage.
Schmerler, K. (2018). Medical tourism in Germany: Determinants of international patients’ destina-
tion choice. Cham, Switzerland: Springer International Publishing.
The Attractiveness of Poland as a Medical Tourism Destination from… | 61
Smith, M., & Puczkó, L. (2014). Health, tourism and hospitality: wellness, spas and medical travel.
London: Routledge.
Smith, M., Puczkó, L., Michalkó, G., Kiss, K., & Sziva, I. (2016). Balkan wellbeing and health tourism
study. Budapest: Metropolitan University. Retrieved from http://infota.org/wp-content/up-
loads/2016/03/BalkanWellbeingFINALREPORT.pdf on January 5, 2019.
South Korea medical tourism market: Insights, opportunity, analysis, market shares and forecast
2017–2022. (2018). Retrieved from http://www.orbisresearch.com/reports/index/ south-
korea-medical-tourism-market-insights-opportunity-analysis-market-shares-and-forecast-
2017-2022 on January 5, 2019.
Stankova, M., Tsvetkov, T., & Ivanova, L. (2019). Tourist development between security and terror-
ism: empirical evidence from Europe and the United States. Oeconomia Copernicana, 10(2).
https://doi.org/10.24136/oc.2019.011
Sziva, I., Balázs, O., Michalkó, G., Kiss, K., Puczkó, L., Smith, M., & Apró, E. (2017). Branding strategy
of the countries in the Balkan region – focusing on health tourism. GeoJournal of Tourism and
Geosites, 19, 61-69.
Tasci, A.D.A., Gartner, W.C., & Cavusgil, S.T. (2007). Conceptualization and operationalization of des-
tination image. Journal of Hospitality & Tourism Research, 31(2), 194-223.
https://doi.org/10.1177/1096348006297290
Tham, A. (2018). Sand, surgery and stakeholders: A multi-stakeholder involvement model of domes-
tic medical tourism for Australia’s Sunshine Coast. Tourism Management Perspectives, 25, 29-
40. https://doi.org/10.1016/j.tmp.2017.11.002
UNWTO (2007). A practical guide to tourism destination management. Madrid: World Tourism Or-
ganization.
Wang, H.Y. (2012). Value as a medical tourism driver. Managing Service Quality, 22(5), 465-491.
https://doi.org/10.1108/09604521211281387
Westfall, P.H., Troendle, J.F., & Pennello, G. (2010). Multiple McNemar tests. Biometrics, 66(4), 1185-1191.
Westland, J.C. (2010). Lower bounds on sample size in structural equation modeling. Electronic Com-
merce Research and Applications, 9(6), 476-487.
Wisla, R., & Sierotowicz, T. (2016). Medical technological specializations of Central and Eastern Eu-
ropean regions. Economics and Sociology, 9, 195-209. https://doi.org/10.14254/2071-
789X.2016/9-3/17
Wongkit, M., & McKercher, B. (2016). Desired attributes of medical treatment and medical service
providers: A case study of medical tourism in Thailand. Journal of Travel & Tourism Marketing,
33(1), 14-27. https://doi.org/10.1080/10548408.2015.1024911
Zając, J.M., & Batorski, D. (2009). Methods of increasing maneuverability in the Internet research. In
A. Haber & M. Szałas (Eds.). Evaluation to the challenges facing the public finance sector (pp.
129-147). Warsaw: PARP.
Zarei, A., & Maleki, F. (2019). Asian medical marketing, a review of factors affecting Asian medical
tourism development. Journal of Quality Assurance in Hospitality & Tourism, 20(1), 1-15.
https://doi.org/10.1080/1528008X.2018.1438959
Zhang, J., Seo, S., & Lee, H. (2013). The impact of psychological distance on Chinese customers when
selecting an international healthcare service country. Tourism Management, 35, 32-40.
https://doi.org/10.1016/j.tourman.2012.05.007
62 | Diana Dryglas, Adrian Lubowiecki-Vikuk
Authors
Contribution share of authors is equal and amounted to 50% each of them: D. Dryglas – contrib-
uted to the discussion, and performed the statistical analyses; A. Lubowiecki-Vikuk – conceived
the study, designed the study, collected data and drafted the manuscript.
Diana Dryglas
Associate Professor at the Department of General Geology and Geotourism of the AGH University
of Science and Technology. Her research interests include management of a tourism product and
tourism destination, and health tourism, especially therapeutic (healing) tourism.
Correspondence to: Dr hab. Diana Dryglas, AGH University of Science and Technology, Depart-
ment of General Geology and Geotourism, Al. Mickiewicza, 30, 30-059 Krakow, Poland, e-mail:
ORCID http://orcid.org/0000-0001-6136-1369
Adrian Lubowiecki-Vikuk
Assistant Professor at the Department of Consumer Behaviour Research of the Warsaw School
of Economics. His research interests include consumer behaviour in the area of sport, tourism
and medicine.
Correspondence to: Dr Adrian Lubowiecki-Vikuk, Warsaw School of Economics, Institute of Man-
agement, Department of Consumer Behaviour Research, Al. Niepodległości, 162, 02-554 Warsaw,
Poland, e-mail: [email protected]
ORCID http://orcid.org/0000-0001-9672-9514
Acknowledgements and Financial Disclosure
This research was supported by AGH University of Science and Technology in Krakow grant
No. 11.11.140.005.
We gratefully acknowledge the efforts of two anonymous reviewers for valuable comments
on this article.
Copyright and License
This article is published under the terms of the Creative Commons
Attribution – NoDerivs (CC BY-ND 4.0) License
http://creativecommons.org/licenses/by-nd/4.0/
Published by the Centre for Strategic and International Entrepreneurship – Krakow, Poland
The copyediting and proofreading of articles in English is financed in the framework
of contract No. 913/P-DUN/2019 by the Ministry of Science and Higher Education
of the Republic of Poland committed to activities aimed at science promotion.
2019, Vol. 7, No. 2 10.15678/EBER.2019.070204
New Imperative of Corporate Value Creation
in Face of the Challenges of Sustainable Development
Andrzej Jaki, Barbara Siuta-Tokarska
A B S T R A C T
Objective: The aim of the article is to present and exemplify the mechanisms of changes
in defining and influencing the new imperative of corporate value creation. It is implied
by the impact of the sustainable development concept.
Research Design & Methods: The research focused on the concept of corporate value
creation in the context of the challenges connected to sustainable development. In the
article, both inductive and deductive ways of reasoning were adopted, which makes it
possible to combine the results of the detailed research.
Findings: The publication indicates the emerging need for a change in the manner of
perceiving and thinking about values – ‘from grasping value for today – towards the
value of the future.’ This is related to the need to formulate the new imperative of
corporate value creation.
Implications & Recommendations: The reasonable profit concept can also be the basis
for the formulation of the postulate of ‘reasonable speed of corporate value creation.’
Therefore, there is a need to redefine the existing imperative of corporate value crea-
tion and implement a new imperative based on the idea of the responsibility for the
existence and long-term development of the enterprise.
Contribution & Value Added: The result is the disclosure of the emergence of a hybrid
concept of sustainable value-based management. The added value of this article is the
proposal to create a new imperative of corporate value creation based on the founda-
tion of the restitution of the idea of responsibility.
Article type: conceptual article
Keywords: theory of development; sustainable development; corporate value cre-
ation; value-based management; sustainable value-based management
JEL codes: D8, L2, M2, Q5
Received: 30 August 2018 Revised: 8 March 2019 Accepted: 21 March 2019
Suggested citation:
Jaki, A., & Siuta-Tokarska, B. (2019). New Imperative of Corporate Value Creation in Face of the Chal-
lenges of Sustainable Development. Entrepreneurial Business and Economics Review, 7(2), 63-81.
https://doi.org/10.15678/EBER.2019.070204
64 | Andrzej Jaki, Barbara Siuta-Tokarska
INTRODUCTION
In the source approach, sustainable development is understood as a process of transfor-
mations that is supposed to ensure that the needs of the present generation are met with-
out compromising the developmental opportunities of future generations (by means of
integrated activities with regard to the natural, social, and economic environments). The
implementation of global-scale activities has its sources in the local space; these activities
are manifested in practice in the effects of the functioning of business entities of different
sizes (including very large, large, and small enterprises) in the context of natural, social,
and economic capital, among others.
The activity of enterprises translates directly into the natural environmental, social, and
economic systems in which they accomplish their goal. Therefore, sustainable development
on the level of an enterprise means the broadly understood ecologisation of the operational
processes with a simultaneous attempt to fulfill the expectations of possibly all stakeholders
(including the financial expectations of the owners, the needs for the safety and stabilisation
of the employees, and others). In the macro-economic dimension, it refers threefold (eco-
nomically, socially, and ecologically) to the sustainable socio-economic development that is
the foundation for the strand of economics called New Pragmatism (Kolodko, 2017).
Striving for the sustainable development of an enterprise has significantly influenced
the conditionings that accompany the realisation of the basic financial goal, which is mar-
ket value maximisation. The conclusions coming from both the implementation and use of
the value-based management concept as well as the experiences of the latest global eco-
nomic crisis related to the mentioned concept showed the need to expose the shared
value creation as the fundamental goal of an enterprise on the one hand and the postulate
for the evolution of the value-based management concept towards the new hybrid con-
cept of sustainable value-based management on the other.
The aim of the article is to present and exemplify the mechanisms of changes in de-
fining and influencing the imperative of corporate value creation implied by the impact of
the sustainable development concept and a relative need for the coincidental treatment
of the environmental, social, and economic conditionings of the management process.
The research problem posed by the authors of this publication does not solely concern
the question of the observed effects of changes in the contemporary economy; i.e., the
lack of sustainability between the three economic pillars (natural, social, and economic
capital) is also connected with the search for their sources. The authors are of the opinion
that the reason for this situation is the misunderstanding and lack of the actual implemen-
tation of some ‘values’ that may be regarded as superior in the socio-economic life of
a person living at the turn of the 21st century. This lack of value implementation is mani-
fested in the bitter taste of the so-called liquid modernity described by Bauman (2000) in
the context of social philosophy. In this field, a type of research gap appears that has been
identified as the previous lack of correlation between the concept of sustainable develop-
ment and the concept of creating organisational values in the aspect of a new way of un-
derstanding the imperative of creating values.
The authors claim that the tendency to multiply the value of invested capital and the
need for development should be sustainable and long-lasting, and it should be character-
New Imperative of Corporate Value Creation in Face of the Challenges… | 65
ised by the responsibility for the existence and future prosperity of the organisation. More-
over, the publication indicates the emerging need for a change in the manner of perceiving
and thinking about values (environmental, social, and economic ones): ‘from grasping
value for today – towards the value of the future’.
The article is structured as follows. First, we present our research questions and meth-
ods, followed by a literature review and theory development. This chapter is divided into
five sections. The first two sections present the concept of sustainable development and
its connection with the category of value. The next two show the essence of the imperative
of corporate value creation and the concept of value-based management; the need for
changes in this concept are also indicated here. Finally, the last section presents the new
concept of sustainable value-based management, followed by our conclusions.
MATERIAL AND METHODS
Presenting and exemplifying the mechanisms of changes in defining and influencing the im-
perative of corporate value creation (including striving to link the concept of value-based
management with the concept of sustainable development) required the formulation of re-
search questions that would specify the aim of the article. The research questions presented
below were posed in connection with the above-mentioned obstacles and problems. To an-
swer them, some theoretical and cognitive analyses were made that should, in turn, result
in eliminating the above-mentioned research gap. The questions are as follows:
1. In what way is the concept of value reflected in the concept of sustainable develop-
ment?
2. On what foundation should the imperative of value creation within the organisation
activity be based?
How do we gain a consensus between the pragmatic expectations of investors con-
cerning the maximisation of the economic capital value and the need for preserving mod-
eration referring to the level of risk-taking by managers without treating the concept of
value-based management as a kind of financial perpetuum mobile?
The needs related to achieving the aim of the article and providing answers to the
formulated research questions constitute the criteria according to which the research
methods were chosen. Taking into account the conceptual nature of the article, the anal-
ysis and critical evaluation of the book as well as the literature relating to the subject mat-
ter were used in the first place. In particular, this applies to key books in the field of devel-
opment economics, philosophical, and economic value theory, sustainable development,
value-based management, and the impact of the concept of social responsibility on shap-
ing the development and value of the enterprise. The results of the conducted analysis
became the basis for the synthesis. Current articles were also used that referred to the
conditions, limitations, and effects of implementing both the concept of sustainable de-
velopment and the concept of value-based management. The use of primarily deductive
reasoning as well as inductive reasoning enabled us to formulate qualitative conclusions
resulting from our literature review as well as the results of our own research and second-
ary research. Taking into account the pragmatic nature of the management science in the
article, a normative approach based on formulating standards and recommendations for
66 | Andrzej Jaki, Barbara Siuta-Tokarska
business practice was also used. This also highlights the application values of the article.
As a result, it allowed us to answer the research questions (thus, the aim of the article).
LITERATURE REVIEW AND THEORY DEVELOPMENT
Sustainable Development: Concept and Idea
The paradigm of sustainable development that has been present in the environmental,
social, and economic aspect of life for more than 30 years is indicated as a real fact,
inscribing in and even co-shaping the current stage of the civilisational development of
mankind (Egelston, 2013). The above-mentioned problems are part of the issues dis-
cussed within the frameworks of the economy of development1 concerning especially
those theories that are regarded as second-generation theories. Within the research on
economic changes in reference to those theories, the importance of the qualitative fac-
tors of a non-economic origin has been underlined2. Social goals is underlined and the
good, both of an average man and especially social groups regarded as ‘economically
handicapped’, constitutes a value with simultaneous bearing in mind to preserve the
rules of economic effectiveness both in the micro and macro-economic dimension3. The
theories of the economy of development may therefore be treated as the foundations
for building the concept of sustainable development.
In their attempt to thoroughly and multidimensionally analyse the literature of the
subject, the authors nevertheless decided not to present the historical analyses or the
evolution of the views concerning the concepts of sustainable development and the tools
measuring it, being aware of the fact that this topic has been fairly well-described in the
subject literature and also taking bibliometric analyses into consideration (for instance,
1 Among the doctrines of supporting the development, one can notice that these theories are both abundant and
in many cases contradictory, which causes them to be perceived as not one consistent system on the required
shape of an economic system. It is nevertheless possible to distinguish the following theories (Dobrescu,
Hristache, & Iacob, 2012):
- the theory of economic growth comprising the post-Keyenist current (Robinson, Harrod, Domar, Kalm, Kaldor,
or Bombach) and the neo-classical (the works of Meade, Solow, and Swan),
- economic development (especially Schumpeter), and
- the development of poorly economically developed countries (Bentham, Nurkse, Myrdal, Rostow,
Rosenstein-Rodan, and Chenery). 2 The main problems of the theory of the economy of development of the first generation concentrate around
the accumulation of capital as the preliminary and sufficient condition for development (assuming that some
part of this capital must come from outside sources as some kind of external aid or foreign investment) Among
these theories, it is worth enumerating the following:
- the ‘big-push’ theory by Rosenstein-Rodan (see Kreickeiemier & Wrona, 2017),
- the theory of balanced growth by Nurkse (see Kattel, Kregel, & Reinert, 2009),
- the strategy of economic development by Hirschman (see Ellerman, 2004),
- the theory of economic development with unlimited supplies of labour by Lewis (see Wang & Piesse, 2009) or
- the stages of growth theory by Rostow (see Solivetti, 2005).
As far as the theories of the economy of development of the second generation are concerned, another approach
can be observed among its representatives. They are institutionalists (Ayres, Veblen, Commons), structuralists
(Prebisch), or the supporters of the school of dependencies (Singer, Preibisch). In these theories, the way in which
the problem of development is perceived has changed, taking into consideration the areas being of a non-eco-
nomic character (especially social issues). 3 The suggested strategies in this respect are the strategy of basic needs and the strategy of fighting poverty,
creating new places of work, domestic product redistribution, and grass-roots development.
New Imperative of Corporate Value Creation in Face of the Challenges… | 67
Pulgarín, Eklund, Garrote, & Escalona-Fernández, 2015; Bettencourt & Kaur, 2011; Cairns
& Martinet, 2014; Dahl, 2012). Instead, they try to present the essence of sustainable
development in the context of the issues connected with creating values in organisations,
showing the mechanisms of changes at the same time and presenting their own proposals
connected with the discussed topics.
A good command of the subject literature also makes it possible for the authors to char-
acterise sustainable development as a science by presenting the views of its main represent-
atives, starting with the ones radically opting for social justice and preserving the natural
environment (the supporters of Eco Socialism, socio economy, feminist economy, or the so-
called deep economy) and finishing with those who are supporters of corpo-capitalism, as
well as those whose efforts aim at creating capitalism with a human face (the supporters of
making capitalism less green) or even apostates with Daly as their leader.
To sum up, one can claim that the implementation of the concept of sustainable de-
velopment requires some kind of consensus between three ideological and political fields:
− ecologism connected with durability,
− a political system warranting social justice, and
− an economic system that ensures economic growth but without violating the fields pro-
ceeding it.
The authors of the publication are of the opinion that the layout (the position) of
these three elements should be arranged in a suitable ranking. This issue is discussed
later in this publication.
In spite of the lack of doubts in practical terms as for the need to implement the concept
of sustainable development as well as the necessity of the co-awareness in its creation in
theoretical terms, its full realisation is questioned (Borys, 2011). Some researchers who deal
with the subject of the contemporary development of the world point to the permanence of
changes and the omnipresent state of imbalance as a common phenomenon and even es-
tablished in today’s reality. They ask how we can talk about balance if the state of imbalance
is a natural state. In this context, however, a question arises: is it really a natural state or only
the one observed/occurring at the present stage of world development?
On the other hand, other researchers point to sustainable development as a well de-
scribed paradigm that is not only a general idea or a vaguely defined one (e.g., Borowiecki
& Siuta-Tokarska, 2018; Olawumi & Chan, 2018; Sinakou, Boeve-de Pauw, Goossens, &
Van Petegem, 2018). When comparing these two contradictory statements, it seems ap-
propriate to look at self-regulating systems. Natural sciences are going towards exactly
such a view of the problem. Therefore, as Piątek (2007) rightly observes, ‘healthy ecosys-
tems ... owing to natural homeostatic systems, regulating the circulation of matter and
energy ... stay in the state of permanent, sustainable development. If they become unbal-
anced, they are able to return to the balance as long as they have a sufficient level of
biodiversity. Natural ecosystems do not need awareness to react to changes in the envi-
ronment in a sustainable manner.’ Also, a human being is not an alienated creature but
one living together with the environment of which he is a part and that he changes at the
same time. In this aspect, a problem occurs concerning the geographical and time dimen-
sion of the reflection over the use of the existing resources of the Earth by man. The geo-
graphical dimension refers to the internationalisation and globalisation processes that
make the level of co-dependence among different locations as related to the exploitation

68 | Andrzej Jaki, Barbara Siuta-Tokarska
and use of natural resources increase rapidly. The time dimension concerns the progress-
ing intensification of economic activity related to the intensification of the problem of the
scarcity of resources and, as a consequence, an inter- and intra-generational balance and
justice in the use of those resources (Nilsson, Griggs, & Visbeck, 2016). Considering man-
kind as a whole, a dilemma occurs concerning the availability of resources that should be
shared – both by the present and future generations. The problem of shared resources
discussed in the deliberations by Lloyd (the metaphor of a pasture and its use by shep-
herds increasing their herds whose actions that are seemingly effective in the short-term
result in limitations and a lack of effectiveness for other users and for themselves in the
long-term) and then developed by Hardin (see Walker, 2009 and Ostrom, 2015) highlights
the need for the real activation of activities with regard to natural resource management
(that is, the globe). This need must, however, be fulfilled in the multi-generational dimen-
sion; thus, it requires the use of resources in such a way as to optimise the relative effects
but from the point of view of the wealth of future generations as well and not only of the
present generation. Such a view of the issue of using natural resources is nothing new.
However, in spite of announcing as early as 1987 (under the auspices of the UN of the so-
called Gro Harlem Brundtland Report), the problem is not solved, but increasing imbal-
ances in the natural, social, and economic capital occurring as a whole (Borowiecki & Siuta-
Tokarska, 2018) are still an issue to be resolved. Therefore, a question arises:
Why, despite the good will of the representatives of the governments of the world’s
countries and international institutions (UN), does mankind still keep going downhill, not
implementing tasks arising from the concept of sustainable and permanent development
that was defined more than 30 years ago?
It seems that this state of affairs is caused by a misunderstanding and lack of the actual
implementation of ‘values’ in socio-economic life superior to the natural world but being
the sine qua non condition for the existence of life as such.
The Term of Value and Sustainable Development in the Aspect
of the Functioning of Enterprises
In the philosophical approach, value is the basic axiological category standing for every-
thing that is valuable and desirable and what constitutes the ultimate goal of humans.
Value can be understood and determined both in reference to the object itself as well as
its qualities and the idea (Hartman, 2011).
The term value itself (Latin: valor) comes from the term ’be valuable’ derived from phi-
losophy and being the object of axiological research; that is, studies about values (Biddle &
Schafft, 2015). As a philosophical discipline, axiology in particular includes studies on:
− the essence of value (valor as the major quality of any value and as an idea),
− types of values (biological, aesthetic, scientific, ethical, absolute, and relative values),
− conditions of the cognition and realisation of values,
− structure and the manner of the existence of a value,
− hierarchy and volume of a value,
− autonomy and objectivity of values4.
4 The broad sense of value as a philosophical category was presented by outstanding Polish philosopher Ingarden,
among others.
New Imperative of Corporate Value Creation in Face of the Challenges… | 69
There is an ongoing dispute among philosophers concerning the understanding of
value with regard to objects in the objective or subjective approach (Biedenbach, 2016).
Objectivists approach value as a quality inherent to the entity/phenomenon irrespective
of a subjective assessment made by a specific entity in accordance with a given point of
view, whereas subjectivists understand it as a quality assigned to an object/phenome-
non by an entity, revealing only specific emotional and volitional attitudes5 with regard
to the evaluation. According to contemporary philosophy, a kind of a compromise as-
sumes that values stand for the attitude of the acting individual to a given object, which
is related to the belief that the object directly or indirectly fulfills his needs; it is subjec-
tive in this approach, but it has an objective aspect at the same time since value depends
on the potential properties of a given object.
As can be observed, ‘value’ means the property of an object or an object possessing
this property6 – only a positive property or a positive or negative property; the property
has either a special economic significance or a broad philosophical one. An important as-
pect of the indicated understanding of the notion of value is distinguishing two types of
value – this desired one (namely, the positive value) but, at the same time, one that can
be defined as a negative pejorative one (which is defined as an anti-value7). In the litera-
ture of the subject, we can also indicate the isolation of values felt, declared, and recog-
nized. Considering the systematic division, Ingarden indicates their three groups: vital, cul-
tural, and moral values (Gabrusewicz & Przybylska-Kapuścińska, 2013).
On the other hand, by taking into account the aspect of experience, one can notice
a transition of the civilization of the turn of the 20th and 21st century into the so-called
‘liquid modernity’ (Bauman, 2000), the core of which is the lack of rooting (identity, values)
and the absence of real borders (geopolitical → communication→ trade → consumption).
Hence, the notion of liquid modernity may be characterised by variability, relativity, and
pluralism, all of which ‘deprive practically every single being of its value.’
Assuming that values escape their descriptive definition, what should be indicated is
the understanding of values as a specific pattern that requires realization in human action.
In a similar way, we should look at the problem of sustainable development in the context
of the three capitals included in it (namely natural, social, and economic ones) as a concept
requiring a new philosophy of a deed and the deed itself.
As it is correctly emphasized by Piątek (2007), philosophy ‘wants to establish the hu-
man world, seeing the specificity of a human in his symbiosis with nature, and not in the
opposites occurring between them.’ Therefore, it is related to the understanding that
mankind is rooted in nature with pressure put on biocentrism as a new model of man’s
attitude towards nature with the simultaneous opposition to the attitude of arrogant an-
thropocentrism (Piątek, 2007).
The realisation of the sustainable development concept requires an attitude towards
the process of its implementation (Siva, Gremyr, Bergquist, Garvare, Zobel, & Isaksson,
2016) that will be consistent and at the same time filled with the power of idea and can,
moreover, be indicated itself as a value for which the mankind of the 21st century strives
5 Volitional – that is, dependent on the will. 6 In this context, Tischner uses the definition ’the object that is entitled to any values’ (see Tischner, 2002). 7 On the grounds of axiology, assigning a specific sign to a value refers to perceiving it from the perspective of
existential judgments.
70 | Andrzej Jaki, Barbara Siuta-Tokarska
(as opposed to the ubiquitous liquid modernity). In this aspect, the notion of value is an
integral part of the concept of sustainable development, creating a value by the fact of its
existence as an idea in this concept.
Philosophical considerations pertaining to the essence and conditions of shaping values
were an important starting point for the formation and development of the economic value
theory. The basis for the development of the economic value theory were the works by Smith
(2007), Ricardo (2001), and Say (2001), who defined and conceptualised such basic concepts
as exchangeable value, value in use, natural value, and reproductive value. This created the
basis for the further development of the theory of value and its use as related to the pro-
cesses of the functioning and development of enterprises. A business’s understanding of
value is based on the concept of economic value related to the ability of economic resources
to generate economic benefits resulting from their effective use, leading to the multiplica-
tion of value of the invested capital (Mayfield, 1997). In this context, value and its creation
can be considered in the enterprise’s operations from three perspectives:
− from the management perspective, where the maximisation of market value as the en-
terprise’s goal and the purpose of corporate governance and the basis for assessing its
effectiveness are of key importance,
− from the perspective of accounting, which is a system for measuring economic values char-
acterising the activities of the enterprise and the value of its assets, equity, and liabilities,
− from the business valuation perspective, where the concept of asset-based value and the
concept of income-based value are the basis of the enterprise’s valuation methods as well
as the value and valuation standards.
It should be stressed that the concept is multidimensional and at the same time dy-
namic, which brings specific consequences in its implementation, including the problems
and dilemmas occurring and concerning measures as well as defining the value of such
measurements itself (Palea, 2018; Hak, Janoušková, & Moldan, 2016).
What results from the research conducted by the Center for Business Excellence in
the Farmer School of Business at Miami University and Crowe Horwath LLP is that the ma-
jority of business leaders are convinced of the strategic value for the organisation on ac-
count of sustainable development initiatives. However, what is challenging to them is data
reporting, as there are no unanimously defined methods of their measurement.
One of the possibilities used by businesses to report their activity is preparing such
reports based on the guidelines of the International Integrated Reporting Council (IIRC) as
well as the indicators of the Global Reporting Initiative (GRI). The indicators proposed by
the GRI are divided into the following segments (Szejnwald-Brown, de Jong, & Levy, 2008;
Tarquinio, Raucci, & Benedetti, 2018):
− strategy and analysis,
− profile of the organisation,
− identification of significant aspects and scopes,
− engagement of stakeholders,
− profile of the report,
− supervision,
− corporate governance,
− ethics,
New Imperative of Corporate Value Creation in Face of the Challenges… | 71
− detailed indicators, including the following:
o information concerning attitude towards management,
o economic indicators, including economic results, presence on the market, indirect
economic influence, and buying practices,
o environmental indicators, including materials/raw materials, energy, water, biodi-
versity, emissions, sewage and waste, products and services, compliance with regu-
lations, transport, general, assessment of the supplier’s environment, and complaint
mechanisms concerning environmental issues,
o social indicators, including hiring practice and dignified work, human rights, society,
and responsibility for the product.
Applied business practices should contribute to the growth of the value of a given
business entity (influence on economic capital) and support the fulfillment of the needs
occurring with regard to natural and social capitals (see also Ikemefuna, 2016). An in-
crease in the value of a business entity is therefore discussed in activities that can be
presented by means of three key factors of sustainable development on the firm’s level
while setting its environmental, social, and economic goals at the same time (Moldavska
& Welo, 2019; Dhahri & Omri, 2018):
1. The ecological (environmental) factor, which first strives to minimise the negative
impact of the company’s activities on the environment and natural resources and
then affect a positive influence (initiatives and activities restoring the natural state
of the environment).
2. The social factor, which is manifested through a positive influence on society’s co-
operation with both the employees and the local community. It should be done by
creating or taking part in social programmes of this type as well as launching initi-
atives for pro-social activities, such as raising the awareness of human rights and
workers’ rights, as well as propagating ethical activities and responsibility for the
products/services sold.
3. The technical and economic factors, whose main assumption is increasing the safety
of the entity’s employees while maintaining the simultaneous growth of the eco-
nomic effectiveness of the enterprise related to the application of modern pro-en-
vironmental technologies.
An important issue in the context of reporting the accomplishment level of sustainable
development by enterprises is the problem of the implementation (Moratis & Melissen,
2019) of this type of activity’ practically exclusively in large and very large economic entities,
with the omission of the SME-sector enterprises (Lortie, Nadeau, & Vezeau, 2016), whose
number in the world economy is the largest in terms of quantity. Therefore, the need for
these types of activities in smaller entities is indicated as well, with the consideration to the
specificity of their activity and size class. In the opinion of the authors of this publication, the
implementation of the sustainable development concept should have a bottom-up character
(regardless of the top-down activities on the part of the state), starting from the smallest
market participants up to the largest ones. Only the full awareness and sensitisation to this
issue of all of the participants of this process can bring the expected changes.
72 | Andrzej Jaki, Barbara Siuta-Tokarska
As Gabrusewicz and Przybylska-Kapuścińska observed (2013), the following can be in-
dicated among the fundamental problems related to business reporting on the Sustainable
Development Goals achievement:
− a lack of the systematisation of terms in sustainable development,
− a lack of capital resources that could support the development of this concept in en-
terprises,
− a lack of the existence of the standard process of the verification of costs and profits
that come from the concept of sustainable development in the enterprise (value
measurement).
Regardless of the discussed problems concerning the practical implementation of the
concept of sustainable development in enterprises, it should be strongly emphasised that,
on the level of enterprises ‘the world’ is quite often perceived from the perspective of an
instrumental value. Such perceptions are then contradictory to authentic responsibility for
the business activity of the organisation, as well as for the sustainable development of the
enterprise. Hence, what is needed is a new rebuilt imperative of value creation that stands
in opposition to the liquid modernity of the contemporary world while at the same time
being rooted in the fundamental rule of the restitution of the idea of responsibility for
1. nature capital (as the sine qua non condition of the existence of life in general),
2. social capital,
3. economic capital,
according to the above-suggested rank.
Imperative of Value Creation versus Models of Functioning of Enterprises
The contemporary finance theory and firm theory regard the maximisation of the market
value as the basic goal of a company activity. It is primarily the consequence of the logic on
the basis of which the market economy functions as well as a resultant natural attempt of
the capital owners to multiply its value. This corresponds to the assumptions of the financial
(investment) perception of an enterprise as a form of investment; therefore, the natural aim
of its activity is the growth of its market value (McTaggart, Kontes, & Mankins, 1994). At the
same time, the impact of various internal and external factors (including the establishment
and evolution of legal forms as well as the types of ownership of enterprises) has brought
about deep transformations in the models of the functioning of enterprises.
In the neoclassical model of an enterprise, the attention was concentrated on profit
maximisation as the superior goal of its activity, which determined the corporate value in
a fundamental way. The model was adequate for the époque of the capitalism of entre-
preneurs – owners managing enterprises, who were obviously guided by their pragmatic
expectations of the multiplication of the invested capital value while undertaking their
managerial activities. The evolution of the types of enterprise ownership that were initi-
ated with the separation of ownership from management and the emergence of non-clas-
sical private ownership shaped new enterprise models. These models are related to the
following stages of economic development:
− the managerial capitalism era, where managerial decisions were handed over to man-
agers employed for this and natural persons still prevailed in the ownership structures
of enterprises. The occurrence of managers as a new group of company stakeholders
New Imperative of Corporate Value Creation in Face of the Challenges… | 73
arose primarily from the growing complexity of managerial decisions and, therefore,
the need for the professionalisation of management,
− the investor capitalism era, which in addition to the separation of ownership and man-
agement is characterised by domination of the ownership structures of enterprises by
institutional investors, including investment funds, pension funds, insurance funds, and
banks; thus, entities in the case of which pressure on the multiplication of the invested
capital value arises from the necessity to fulfill the expectations of the customers of the
mentioned financial institutions.
The indicated transformations in the models of the functioning of enterprises caused
the necessity of a significantly different approach, both to the issue of defining the basic
enterprise’s aim and the ways of ensuring its effective and efficient realisation. Under
these conditions, the pro-value paradigm of management and the relative value-based
management concept were formed and developed.
The pioneer contribution to the creation, development, and dissemination of value-
based management was primarily made by the following authors:
− in the field of the identification of the premises and assumptions to create the concept:
Rappaport (1986),
− in the field of conceptualisation value-based management as a new management con-
cept: Copeland, Koller, and Murrin (1990), McTaggart, Kontes, and Mankis (1994),
− in the field of creating and developing tools for measuring and evaluating the effective-
ness of value creation: Steward (1991) and Ehrbar (1998).
During the following years, we continued to find a creative continuation of the above-
mentioned authors’ achievements in the field of value-based management concept devel-
opment in the works of Black, Wright, and Bachman (1998), Knight (1998), Martin and
Petty (2000), and Young and O’Byrne (2001).
The concept of value-based management binds corporate strategy with the process of
managing company finance along with their orientation to making decisions resulting in the
maximisation of corporate value. This was supposed to contribute to the integration of the
goals of the owners with those of the managers and, thus, to the liquidation of the negative
effects that the separation of ownership and management brought for the multiplication of
corporate value. At the same time, it set another stage in management science related to its
growing financialisation and, thus, the departure from the technocratic approach formed by
the authors of this scientific discipline. Financialisation is connected with an increasing role
of financial institutions in the processes of managing an enterprise of the non-financial sec-
tor, as well as with the growing significance of the capital market as a mechanism of exercis-
ing control over an enterprise, among others (Stochhammer, 2013).
Changes within the enterprise functioning models also arose from other parallelly oc-
curring transformations in their ownership structures and relative management mecha-
nisms. This mainly refers to the following:
− the inclusion of state and local government units in the ownership structures of enter-
prises, which contributed to the emergence of such ownership types as state ownership
and communal ownership. At the same time, it brought about changes in the hierarchy
of corporate goals related to the exposure of tangible goals connected with the accom-
74 | Andrzej Jaki, Barbara Siuta-Tokarska
plishment of important interests of the state and local communities as company stake-
holders. It simultaneously required the assurance of the effective allocation of public
funds engaged in enterprises in the form of investment capital and subsidies, primarily
enabling the accomplishment of important social goals,
− inclusion of employees in the ownership structures of enterprises, the result of which
are subsequent types of ownership: employee ownership (based on American Em-
ployee Stock Ownership Plans),
− private and local governmental ownership focused on the consideration of coinci-
dentally treated tangible, social, and financial goals.
At the same time, these transformations set the subsequent stages of economic de-
velopment; namely, state and local government capitalism as well as stakeholder capital-
ism. These stages are related to the growing influence of increasingly broader groups of
internal and external stakeholders on the functioning of the enterprise.
A Need for Changes in the Concept of Value-Based Management
The experiences derived from the practice of implementing the value-based management
concept in the 1990s and at the beginning of the 21st century also showed the weaknesses
of this concept as well as the potential threats that may result from it for the effectiveness
of corporate value creation. A broad discussion on this referred primarily to the following:
− understanding the essence and mechanism of the concept functioning and the
method of using partial and summary measures of corporate value creation within
it (Smith, 2009),
− complexity and conditionings of the concept implementation (Starowic, Cooper, &
Davis, 2004).
The need for a deeper penetration of weaknesses of the value-based management
concept was exposed by the latest economic crisis. The experiences derived from that cri-
sis stressed the need for the introduction of significant changes in the area of the concept’s
use, referring mainly to the problem related to the measurement of the effectiveness of
corporate value creation and the influence of the mechanism of corporate governance.
The essence of the value-based management concept makes the measurement of the
effectiveness of corporate value creation play a crucial role from the point of view of the
concept's fulfillment of the expectations formulated towards it. As a new group of enter-
prise effectiveness measures, market measures were intended to enable both the meas-
urement of the partial effects of corporate value creation as well as create conditions to
show the influence of these effects on this value. However, the lack of established patterns
and standards referring to the selection and use of these measures also enabled the crea-
tion of an untrue image of the enterprise and its financial condition as a result of data
manipulation and the use of gaps in accounting principles – including the methods of
measuring the economic volumes that characterise the activity of an enterprise (Reich-
mann, 2016). At the same time, it has brought about numerous dysfunctions in the busi-
ness value measurement we often deal with in the contemporary economy ‘contami-
nated’ by the phenomenon of excessive financialisation manifested in the detachment of
financial flows from real processes (Stockhammer, 2013). It has also contributed to the
growth of the phenomenon of asymmetry of information among management boards of
enterprises and their owners and investors as well as credit institutions. This creates the
New Imperative of Corporate Value Creation in Face of the Challenges… | 75
need for a significant reorientation of our accounting paradigms. It should tend toward
the development of patterns and standards adjusted to the changed reality and relative
new information needs and, at the same time, create mechanisms protecting us from the
negative consequences of creative accounting.
The global economic crisis also proved the inefficiency and ineffectiveness of many
supervisory and regulatory mechanisms that should accompany the value-based manage-
ment concept and constitute an integral component of corporate governance. An im-
portant premise for the creation and conceptualisation of value-based management was
the need for a search for tools integrating the goals of the owners with the goals of man-
gers in charge of enterprises, which under the conditions of the separation of ownership
and management brings a number of negative consequences for the effectiveness of cor-
porate value creation (defined as an ‘agency problem’). At the same time, the agency the-
ory of enterprise is widely used as a perspective of describing the essence and mechanisms
of corporate governance, which implies the need for linking the issues of the effectiveness
of corporate value creation to the problem of corporate governance (Cornelius & Kogut,
2003). Corporate governance mechanisms (and the ownership supervision within it)
should prevent a situation when the blind faith of investors in unlimited possibilities to
obtain higher and higher return rates becomes a factor stimulating the phenomenon of
the detachment of the corporate value category from its fundamental bases and favors
excessive behaviourism in its assessment, which may lead to tremendous perturbations in
the functioning of the financial market. The mechanisms should also limit the voluntarism
of managers, which is deprived of any rational premises (since managers undertook un-
justifiable risks expecting higher and higher profits).
New Imperative of Value Creation and the Concept of Sustainable Value-Based
Management: In Search of Economic Reason and Moderation
The global investor capitalism era and the experience derived from the consequences of
the economic crisis at the beginning of the 21st century brought about the necessity of
changes in respect to understanding and the way of using the value-based management
concept. In this context, Porter and Kramer (2011) called for the need to redefine the
basic goal of the enterprise, which they defined as creating shared value. The shared
value concept exposes a wide group of internal and external stakeholders of a company
as beneficiaries of the effects of creating its value. At the same time, it should be noted
that, although originally oriented to multiplying the wealth of shareholders, the concept
of value-based management is exhibited by the fact that the objectives of shareholders
must be done at the expense of its depletion for the other stakeholders. On the contrary,
the financial success of owners also creates conditions for an increase in value for other
groups. Effective enterprises create new jobs and financial incentives for employees,
pay higher taxes, and are reliable and desirable clients for banks and contractors for
cooperators. At the same time, such an assertion suggests that enterprises create value
for their owners only when value is created for other stakeholders at the same time.
Therefore, the theory of stakeholders equates the goal of the company’s activity in the
first place with the creation of values for its internal and external stakeholders, noticing
the broad social context of the functioning of business entities.
Taking into consideration the postulates of the concept of sustainable development
and the benefits it brought from the point of view of the efficiency and sustainability of

76 | Andrzej Jaki, Barbara Siuta-Tokarska
enterprise development, it seems logical to use these achievements for the needs of for-
mulating a new imperative of corporate value creation and the postulate of the evolution
of the value-based management concept towards sustainable value-based management.
At the same time, the concept is the manifestation of the coincidence of the value-based
management concept with the sustainable development concept and corporate social re-
sponsibility concept (Martin, Petty, & Wallace, 2009). A hybrid character of the mentioned
management concept is the reason for which its ideological foundation links the pro-value
paradigm to the sustainable development and management ethics paradigms. The con-
cept reflects a new approach to management, where the achievement of social goals is
closely related to the achievement of economic goals and social responsibility coexists
with responsibility towards the enterprise (Igwe, Icha-Huma, & Madichie, 2018). There-
fore, such an approach refers to the foundations of the corporate governance theory, re-
ferring to two models of the enterprise (the financial and social ones) and exposing varied
beneficiaries of the effects of corporate value creation (Cornelius & Kogut, 2003).
The concept of sustainable value-based management orients the enterprise’s man-
agement system to attempt to maximise its market value while maintaining economic
reason and moderation. The mentioned features relate primarily to such groups of
stakeholders as owners and managers. As investors, the former should possess moder-
ation in the formulation of the expectations related to the rate of capital multiplication
– the required rate of return. Making key decisions affecting the use of capital, the latter
should take a reasonable risk in the sense of responsibility for the long-term develop-
ment of the enterprise and business continuity.
On this occasion, we can also see a return to the roots of the value-based manage-
ment concept. Initially, the value-based management term referred to a management
system focused on the provision of value for a broad group of company stakeholders
(particularly the owners, employees and customers) being guided by the basic principles
of economic and social justice. However, broad dissemination of the mentioned term in
the circles of American business was the reason why it has only been associated with
and used in the context of the multiplication of the enterprise market value and the
wealth of its owners since the end of the 1980s. Its primary meaning was then replaced
by the term ‘justice-based management’ as a management concept based on the idea
of economic and social justice (Miller, Greaney, & Brohawn, 1994).
CONCLUSIONS
The concept of value-based management was formed as a result of the evolution of pro-
value management due to changes in the internal and external conditionings of the enter-
prise functioning and experiences derived from the latest global economic crisis. It also pos-
itively responds to the formulated postulate of linking the issues of the effectiveness of
corporate value creation to the problems of corporate governance through the examina-
tion of the corporate value creation process in a broad perspective of shared value creation
whose beneficiaries are its various stakeholders. The proposed concept of sustainable
value-based management is also inherent to the idea of the economics of moderation
based on the creation of mechanisms for balancing economic streams and resources to
maintain a dynamic balance, guaranteeing stable long-term economic growth (Kolodko,
New Imperative of Corporate Value Creation in Face of the Challenges… | 77
2017). Referring the assumptions and postulates of the economics of moderation to effec-
tive corporate value creation, we must say that investors should keep their own common
economic sense in formulating expectations referring to the speed of the capital multipli-
cation value, and managers should take risks within reasonable limits, not treating the
value-based management concept as a financial perpetum mobile. This also leads to the
conclusion that the reasonable profit concept referring to the assessment of the effective-
ness of enterprises belonging to regulated sectors (Narmania, 2018) can also be the basis
for the formulation of the postulate of a ‘reasonable speed of corporate value creation.’
Stakeholders of the enterprise (particularly its owners and managers as well as its potential
investors) should perceive the process of multiplying the value of invested capital as a pro-
cess of the sustainable creation of value in the long-term – without exposing the enterprise
to excessive and unreasonable risk. Responsibility for the existence and sustainable devel-
opment of an enterprise also requires a redefinition of the imperative of value creation,
taking into account the necessity of sustainable use and multiplication of the enterprise’s
resources and not merely the blind pursuit of obtaining immediate benefits.
Taking into consideration the research subject concerning the problems of creating val-
ues in business organisations as well as the problems of sustainable development, some
limitations connected with the above-mentioned issues have been displayed. These limita-
tions appear due to the fact that the authors attempted to perceive the research area ho-
listically; hence, the necessity for looking at it from the broadest possible perspective ap-
pears. The theoretical research in this respect concerned business organisations that are
seen as a part of the economy sector; hence, making any generalisations from the concep-
tual digressions is extremely difficult. This difficulty results from the differences among or-
ganisations, such as their size classification (from micro to large entities), their range (from
local to global markets), or their type of business activity (the service, industrial, or trade
sectors). This means that the implementation of a new imperative of corporate value crea-
tion and the concept of sustainable value-based management (regardless of the general
frame or base presented in the article) will require it to be filled with content that will, in
turn, be fitted to the above-mentioned specific features of business organisations.
Further research should be led in the context of contemporary economic doctrines
and the nature of 21st-century capitalism. Such research could reveal the possibilities of
implementation of the idea of sustainable development, taking into account the need
for the sustainability of this process in the long term.
REFERENCES
Bauman, Z. (2000). Liquid Modernity. Cambridge: Polity Press.
Bettencourt, L.M.A., & Kaur, J. (2011). Evolution and structure of sustainability science. Proceedings
of the National Academy of Sciences of the United States of America, 108(49), 19,540-19,545.
Biddle, C., & Schafft, K.A. (2015). Axiology and Anomaly in the Practice of Mixed Methods Work Prag-
matism, Valuation, and the Transformative Paradigm. Journal of Mixed Methods Research, 9(4),
320-334. https://doi.org/10.1177/1558689814533157
Biedenbach, T. (2016). The open secret of values: the roles of values in axiology in project research.
Project Management Journal, 47(3), 139-155. https://doi.org/10.1177/875697281604700312
Black, A.P., Wright, P., & Bachman, J.E. (1998). In Search of Shareholder Value: Managing the Drives
of Performance. London: Pitman Publishing.
78 | Andrzej Jaki, Barbara Siuta-Tokarska
Borowiecki, R., & Siuta-Tokarska, B. (2018). Nauki o zarządzaniu w świetle paradygmatów. Przegląd
Organizacji, 4, 7-15.
Borys, T. (2011). Zrównoważony rozwój – jak rozpoznać ład zintegrowany?. Problemy Ekorozwoju
6(2), 75-81.
Cairns, R.D., & Martinet, V. (2014). An environmental-economic measure of sustainable develop-
ment. European Economic Review, 69, 4-17. https://doi.org/10.1016/j.euroecorev.2014.03.001
Copeland, T., Koller, T., & Murrin, J. (1990). Valuation: Measuring and Managing the Value of Com-
panies. 1st Edition, New York: John Wiley & Sons Inc.
Cornelius, P., & Kogut, B.M. (2003). Corporate Governance and Capital Flows in a Global Economy.
New York: Oxford University Press.
Dahl, A.L. (2012). Achievements and gaps in indicators for sustainability. Ecological Indicators, 17,
14-19. https://doi.org/10.1016/j.ecolind.2011.04.032
Dobrescu, M., Hristache, D., & Iacob, S. (2012). Recent theoretical progress in economics and its
impact on economic policy. Procedia – Social and Behavioral Sciences, 62, 562-565.
Dhahri, S., & Omri, A. (2018). Entrepreneurship contribution to the three pillars of sustainable de-
velopment: What does the evidence really say?. World Development, 106, 64-77.
https://doi.org/10.1016/j.worlddev.2018.01.008
Egelston, A.E. (2013). Sustainable Development. A History. New York-London: Springer.
Ehrbar, A. (1998). EVA – The Real Key to Creating Wealth. New York: John Wiley & Sons Inc.
Ellerman, D. (2004). Revisiting Hirschman on Development Assistance and Unbalanced Growth. Ea-
stern Economic Journal, 30(2), 311-331.
Gabrusewicz, T., & Przybylska-Kapuścińska, W. (2013). Wartość w zrównoważonym rozwoju. Nauki
o Finansach, 4(17), 55-62.
Gray, R.H. (2006). Social, environmental and sustainability reporting and organisational value crea-
tion: Whose value? Whose creation?. Accounting, Auditing & Accountability Journal, 19(6), 793-
819. https://doi.org/10.1108/09513570610709872
Hak, T., Janoušková, S., & Moldan, B. (2016). Sustainable development goals: a need for relevant
indicators. Ecological Indicators, 60, 565-573. https://doi.org/10.1016/j.ecolind.2015.08.003
Hartman, R.S. (2011). The structure of value: Foundations of Scientific axiology. Eugene: Wipf and
Stock Publishers.
Hopwood, B., Mellor, M., & O’Brien, G. (2005). Sustainable development: mapping different ap-
proaches. Sustainable Development, 13, 38-52.
Igwe, P.A., Icha-Ituma, A., & Madichie, N.O. (2018). An Evaluation of CSR and Social Value Practices
Among UK Commercial and Social Enterprises. Entrepreneurial Business and Economics Review,
6(1), 37-52, https://doi.org/10.15678/EBER.2018.060102
Ikemefuna, A. (2016). International Entrepreneurship Theory: Past, Present and Way
Forward, Entrepreneurial Business and Economics Review 4(4), 93-103,
https://doi.org/10.15678/EBER.2016.040406
Kattel, R., Kregel, J.A., & Reinert, E.S. (2009). The Relevance of Ragnar Nurkse and Classical Develop-
ment Economics. Working Papers in Technology Governance and Economic Dynamics, 21, 1-34.
Knight, J.A. (1998). Value Based Management: Developing a Systematic Approach to Creating Share-
holder Value. New York: McGraw-Hill.
Kolodko, G.W. (2017). New Pragmatism: In the Quest for Economics and Development Policy in the
21th Century. Journal of Management and Business Administration. Central Europe, 25(2),
2-5. https://doi.org/10.7206/jmba.ce.2450-7814.192
New Imperative of Corporate Value Creation in Face of the Challenges… | 79
Kreickemeier, U., & Wrona, J. (2017). Industrialisation and the Big Push in a Global Economy. Dϋssel-
dorf Institute for Competition Economics. Discussion Paper, 249, 1-25.
Lortie, M., Nadeau, S., & Vezeau, S. (2016). Holistic sustainable development: Floor-layers and micro-
enterprises. Applied Ergonomics, 57, 8-16. https://doi.org/10.1016/j.apergo.2016.01.017
Martin, J.D., & Petty, J.W. (2000). Value Based Management: The Corporate Response to the Share-
holder Revolution. Boston: Harvard Business School Press.
Martin, J.D., Petty, J.W., & Wallace, J.S. (2009). Value Based Management with Corporate Social Re-
sponsibility. New York: Oxford University Press.
Mayfield, J. (1997). Economic Value Management. The Route to Shareholder Value. Management
Accounting, 75(8), 32-33.
McTaggart, J.M., Kontes, P.W., & Mankins, M.C. (1994). The Value Imperative. Managing for Superior
Shareholder Returns. New York: The Free Press.
Miller, J.H., Greaney, M.D., & Brohawn, D.K. (Eds.) (1994). Curing World Poverty: The Role of Prop-
erty. New York: Social Justice Review.
Moldavska, A., & Welo, T. (2019). A Holistic approach to corporate sustainability assessment: Incor-
porating sustainable development goals into sustainable manufacturing performance evalua-
tion. Journal of Manufacturing Systems, 50, 53-68. https://doi.org/10.1016/j.jmsy.2018.11.004
Moratis, L., & Melissen, F. (2019). How do the sustainable development goals question rather than
inform corporate sustainability?. Resources, Conservation and Recycling, 141, 253-254.
Narmania, D. (2018). Economic Policy Uncertainty and Risk Management in Regulated Sectors. In-
ternational Journal of Business and General Management, 7(4), 19-28.
Nilsson, M., Griggs, D., & Visbeck, M. (2016). Policy: map the interactions between Sustainable De-
velopment Goals. Nature, 534, 320-322. https://doi.org/10.1038/534320a
Olawumi, T.O., & Chan, D.W.M. (2018). A scientrometric review of global research on sustainability
and sustainable development. Journal of Cleaner Production, 183, 231-250.
https://doi.org/10.1016/j.jclepro.2018.02.162
Ostrom, E. (2015). Governing the commons. The evolution of institutions for collective action. Cam-
bridge: Cambridge University Press.
Palea, V. (2018). Financial reporting for sustainable development: Critical insights into IFRS imple-
mentation in the European Union. Accounting Forum, 42(3), 248-260.
https://doi.org/10.1016/j.accfor.2018.08.001
Piątek, Z. (2007). Przyrodnicze i społeczno-historyczne warunki równoważenia ładu ludzkiego świata.
Problemy Ekorozwoju, 2(2), 5-18.
Porter, M.E., & Kramer, M.R. (2001). The Big Idea: Creating Shared Value. Harvard Business Re-
view, 1, 62-77.
Pulgarín, A., Eklund, P., Garrote, R., & Escalona-Fernández, M.I. (2015). Evolution and Structure of
Sustainable Development: A Bibliometric Study. Brazilian Journal of Information Scienc, 9(1).
Rappaport, A. (1986). Creating Shareholder Value. The New Standard for Business Performance. New
York: The Free Press.
Reichmann, M. (2016). Creative Accounting and Electoral Motives: Evidence from OECD Countries.
Journal of Comparative Economics, 44(2), 243-257. https://doi.org/10.1016/j.jce.2015.07.001
Ricardo, D. (2001). On The Principles of Political Economy and Taxation. Ontario: Batoche Books,
Kitchner.
Say, J.B. (2001). A Treatise on Political Economy; or the Production, Distribution, and Consumption of
Wealth. Ontario: Batoche Books, Kitchner.

80 | Andrzej Jaki, Barbara Siuta-Tokarska
Sinakou, E., Boeve-de Pauw, J., Goossens, M., & Van Petegem, P. (2018). Academics in the Field of
Education for Sustainable Development: Their Conceptions of Sustainable Development. Jour-
nal of Cleaner Production, 184, 321-332.
Siva, V., Gremyr, I., Bergquist, B., Garvare, R., Zobel, T., & Isaksson, R. (2016). The support of Quality
Management to sustainable development: a literature review. Journal of Cleaner Production,
138(2), 148-157.
Smith, A. (2007). An Inquiry into the Nature and Causes of the Wealth of Nations. Amsterdam – Lau-
sanne – Melbourne – Milan – New York – Sao Paulo: MetaLibri.
Smith, P. (2009). Shareholder Value Implementation: Turning Promise into Reality, L.E.K. Consulting
Executive Insights, IV(1), 1-7.
Solivetti, L.M. (2005). W.W. Rostow and His Contribution to Development Studies: A Note. The Jour-
nal of Development Studies, 41(4), 719-724. https://doi.org/10.1080/00220380500092903
Starovic, D., Cooper, S., & Davis, M. (2004). Maximising Shareholder Value. Achieving clarity in deci-
sion-making. London: CIMA.
Steward, III, G.B. (1991). The Quest for Value. A Guide for Senior Managers. New York: Harper Business.
Stockhammer, E. (2013). Financialization and the Global Economy. In M.H. Wolfson & G.H. Epstein,
(Eds.), The Political Economy of Financial Crises. New York: Oxford University Press.
Szejnwald-Brown, H., de Jong, M., & Levy, D.L. (2008). Building institutions based on information
disclosure: lessons from GRI’s sustainability reporting. Journal of Cleaner Production, 17, 571-
580. https://doi.org/10.1016/j.jclepro.2008.12.009
Tarquinio, S., Raucci, D., & Benedetti, R. (2018). An Investigation of Global Reporting Initiative Per-
formance Indicators in Corporate Sustainability Reports: Greek, Italian and Spanish Evidence.
Sustanaibility, 10, 1-19.
Tischner, J. (2002). Thinking in Value., Cracow: Polish Publishing House ‘Znak.’
Walker, P.A. (2009). From ‘tragedy’ to commons: How Hardin’s mistake might save the world. Journal of
Natural Resources Policy Research, 1(3), 283-286. https://doi.org/10.1080/19390450903040520
Wang, X., & Piesse, J. (2009). Economic Development and Surplus Labour: A Critical Review of the
Lewis Model. BWPI Working Paper, 89, 1-32.
Young, S.D., & O’Byrne, S.F. (2001). EVA and Value-Based Management. A Practical Guide to Imple-
mentation. New York: McGraw-Hill.
New Imperative of Corporate Value Creation in Face of the Challenges… | 81
Authors
The contribution share of authors is equal and amounted to 50% each of them.
Andrzej Jaki
Associate Professor at Department of Economics and Organization of Enterprises, Cracow Univer-
sity of Economics, His research interests are in value-based management and business valuation.
Correspondence to: prof. UEK dr hab. Andrzej Jaki, Cracow University of Economics, Department
of Economics and Organization of Enterprises, ul. Rakowicka 27, 31-510 Kraków, Poland;
+48 12 293 53 30; [email protected]
ORCID http://orcid.org/0000-0002-4799-4343
Barbara Siuta-Tokarska
Associate Professor at Department of Economics and Organization of Enterprises, Cracow Univer-
sity of Economics, Her research interest include enterprise development, especially SMEs; sus-
tainable development; development management.
Correspondence to: prof. UEK dr hab. Barbara Siuta-Tokarska, Cracow University of Economics,
Department of Economics and Organization of Enterprises, ul. Rakowicka 27, 31-510 Kraków, Po-
land, +48 12 293 74 37, [email protected]
ORCID http://orcid.org/0000-0001-9078-6243
Acknowledgements and Financial Disclosure
The paper was financed with subsidies granted to the Faculty of Management of the Cracow Uni-
versity of Economics for maintaining the research capacity.
This article has been presented as the academic paper at the scientific conference GLOB2018:
“Globalization and Regionalization in the Contemporary World: Competitiveness, Development,
Sustainability” organized in Kraków on 21-22 September 2019.
Copyright and License
This article is published under the terms of the Creative Commons
Attribution – NoDerivs (CC BY-ND 4.0) License
http://creativecommons.org/licenses/by-nd/4.0/
Published by the Centre for Strategic and International Entrepreneurship – Krakow, Poland
The copyediting and proofreading of articles in English is financed in the framework
of contract No. 913/P-DUN/2019 by the Ministry of Science and Higher Education
of the Republic of Poland committed to activities aimed at science promotion.
This publication has been co-financed by the European Commission Representation
in Poland. The European Commission, or any person acting on its behalf, is not re-
sponsible for the use of the information contained in this publication. This publication
reflects the views only of the authors, and the European Commission cannot be held
responsible for any use which may be made of the information contained therein.

2019, Vol. 7, No. 2 10.15678/EBER.2019.070205
China and Central and Eastern European Countries
within ’16+1’: Group or Bilateral Relations?
Andreja Jaklič, Marjan Svetličič
A B S T R A C T
Objective: The article focuses on developments within the ’16+1’ initiative: It aims to analyse whether the relations between China and CEECs are more multilateral or bilat-eral in nature and discuss the implications for business.
Research Design & Methods: We review the literature on the ‘16+1’, overview interna-tional trade and investment between CEECs and China, development of institutional framework and examine the case of China-Slovenia economic relations in greater detail.
Findings: Highly intensive diplomatic relationships since the establishment of the initi-ative in 2012 have evolved into deeper, though unbalanced economic relations, result-ing in net trade deficit and high concentration in trade and investment.
Implications & Recommendations: Formally multilateral platform, ‘16+1’, kept the trade policies and business strategies predominantly still within bilateral relations strat-egies of national countries. Multilateralising the ‘16+1’ remains an opportunity for CEECs and the EU. Secondly, in most countries strong bilateral cooperation with China is a part of efforts to diversify their international economic cooperation and a catching up process parallel with the growing role of China in the global economy.
Contribution & Value Added: Monitoring trade and investments between CEECs and China provides insights to describe CEECs patterns of economic globalisation, institu-tional framework for entrepreneurship and information how the ’16+1’ has influenced globalisation patterns in the EU trade and investment, rethinking of EU-China cooper-ation and competition and cooperation among CEECs.
Article type: research article Keywords: CEE; 16+1; China; trade; FDI; trade policy; One Belt One Road JEL codes: F13, F21, F23
Received: 10 October 2018 Revised: 9 February 2019 Accepted: 1 March 2019
Suggested citation:
Jaklič, A., & Svetličič, M. (2019). China and Central and Eastern European Countries within ‘16+1’: Group or Bilateral Relations?. Entrepreneurial Business and Economics Review, 7(2), 83-100. https://doi.org/10.15678/EBER.2019.070205
84 | Andreja Jaklič, Marjan Svetličič
INTRODUCTION
The new reality of tectonic changes in the global economy, increasing importance of emerging economies and structural changes transforming trade in a more intra-firm trade within global value chains influenced trade and investment policy changes in Central and Eastern European countries (CEECs). They also stimulated a new generation of trade and investment agreements generated as part of China’s major globalisation Belt and Road Initiative (BRI) initiative. Their role in trade liberalisation and the distribution of costs and benefits is dramatically changing due to the changing structure of global trade with an increasing role of services and low level of tariffs on manufactured goods (Rodrik, 2018; Baldwin, 2011). One of such innovative approaches to regional cooperation, established in 2012, is the ‘16+1’1; the initiative that serves China’s vision to increase its political influ-ence in the world and on CEECs by promoting China-European Union (EU) relations. The ‘16+1’ initiative is regarded by Chinese as ‘one of the most important achievements of China’ (Tianping, 2017; Pepermans, 2018). It can be regarded as part of One Belt One Road (BRI), a major long term China strategy of materialising China’s advantages in the world, which aims to facilitate economic development in a vast region covering sub-regions in Asia, Europe and Africa and promote greater integration among the 60-plus countries along the Belt and Road (Huang, 2016). ’CEEc, providing a strategic link between Asia and West Europe, are vital to the success of the BRI’ (HKTDC, 2016, p. 2).
Such cooperation supports core strategic Chinese interests in strengthening relations with the EU. The ‘16+1’ has brought change, together with both great expectations and concerns. China may utilise the scheme for political gains. ‘Some CEECs reiterated their ability to serve as China’s gateway to markets in the EU, the world’s largest economic block’ (Tianping, 2017). It can be materialised through such a ‘soft belly’ of the EU, some say. ‘Not surprisingly the EU has the lukewarm and reserved stance towards the ‘16+1’ China-CEE cooperation’ (Turcsányi, 2017). Some claim that ‘the ‘16+1’ scheme is a part of broader divide and rule Chinese policy’ (Godement & Vasselier, 2017, p. 65), while others do not agree that ‘European concerns over China’s political objectives are justified’2 and claim that so far they see little evidence of a strategic attempt on China’s part to ‘divide’ CEECs from the rest of the EU (Hellström, 2016; Pepe, 2017). New formal ‘friends’ of the ‘16+1’ (like Portugal from 2018) are increasingly likely. China has, on the other hand, also taken some risk and started developmental initiative, since CEECs still represent a region with a relatively slower catching-up process within Europe.
1 The ‘16+1’ format is an initiative by the People’s Republic of China aimed at intensifying and expanding cooperation with 11 EU Member States and 5 Balkan countries (Albania, Bosnia and Herzegovina, Bulgaria, Croatia, the Czech Republic, Estonia, Hungary, Latvia, Lithuania, Macedonia, Montenegro, Poland, Romania, Serbia, Slovakia, Slovenia) in the fields of investments, transport, finance, science, education, and culture. In the framework of the initiative, China has defined three potential priority areas for economic cooperation: infrastructure, high technologies, and green technologies. The initiative was inaugurated by the first 16+1 Summit held in Warsaw, Poland, in 2012. 2 There are two main concerns. First, China may intensify efforts to use the influence it is building in CEECs to frustrate aspects of the EU’s common China policy. Second, some 16+1 countries may use strong ties with China to buttress negotiating positions against Brussels, such dynamics could undermine Brussels’ effectiveness in of-ten fractious relations with its second-largest trade partner. One concern is that China’s push for guaranteed contracts for its companies will undermine the EU’s single market rules on public procurement.
China and Central and Eastern European Countries within… | 85
Since 2012 developed world economies have experienced a relative stagnation in the value of their trade in goods, while China has continued progression as one of the world’s leading trading nations. Its share in the world exports for goods and services rose from 9.0 per cent to 13.6 per cent during the period 2006-2016, while its share of imports grew at an even faster pace, increasing by 4.9 percentage points to reach 12.0 per cent in 2016 (Eurostat, 2017c, p. 28).
Political relations between China and CEECs were recently more intensive than with any other region. High frequency of ‘16+1’ summits was accompanied by a number of lower-level gatherings, several sectoral coordination mechanisms across CEE and local cooperation between CEECs and Chinese cities and provinces. However, the general assessment after five years of existence was often summed up as ‘hot politics, but cold
economics’ (Turcsanyi, 2017). The initial expectations – to reach USD 100 billion trade by 2015 – were not achieved; in 2017 trade in goods reached EUR 57.3 billion, only 10 per cent of the total EU-China trade.
The initiative has been thus evaluated as ‘work in progress’ (European Parliament briefing, September 2018) and closer monitoring has started from both CEE countries within the initiative and a rising number of external observers. The Chinese influence in the CEE region – ‘chinfluence’ 3-is getting increasing attention. Discussions on the effects of cooperation and calls for a more balanced trade and reciprocity of market access emerged (among CEECs, the EU and observers) more intensively after the 2018 Sofia Summit. The EU, as a ‘traditional observer’ gets accompanied by Austria, Belarus, Greece, Switzerland, the European Bank for Reconstruction and Development. The fear is that the ‘16+1’ is threatening the EU's one voice strategy in its relationship with China and Western Balkan membership ‘candidate’ countries, the impact on the EU's internal political dynamics and the process of catching-up new CEE members in their economic development with the 'old' EU Member States. Next, changes in institutional frame-works are also influencing entrepreneurial activity.
This contribution aims to identify trends and (potential) changes in institutional frame-work and economic cooperation between CEECs and China, which are relevant for entre-preneurship theory and practice. Monitoring trade and investments in CEECs provides in-sights to describe their patterns of economic globalisation and information on how the ‘16+1’ has influenced globalisation patterns in the EU trade and investment. Our hypoth-esis is, that formally multilateral platforms, such as ‘16+1’, kept the trade policies and busi-ness strategies predominantly still within bilateral relations strategies of national coun-tries. Secondly, in most countries strong bilateral cooperation with China is a part of efforts to diversify their international economic cooperation (originating also from entrepreneur-ial initiatives) and the catching up process parallel with the growing role of China in the global economy. Using a multilevel and mix method approach we firstly review bilateral trade and investments of CEECs with China. Next, we examine the case of China-Slovenia economic relations, a country placed at the periphery of the ‘16+1’ platform, but strongly connected with trade and investment in the EU and top innovating country among CEECs. In conclusions we sum up findings and implications.
3 Chinfluence is a new project dedicated to analysing the Chinese impact in the region, mirroring similar research undertaken by think-tanks in the EU Member States not part of the 16+1 format (http://www.chinfluence.eu/)
86 | Andreja Jaklič, Marjan Svetličič
MATERIAL AND METHODS
We review relatively scarce literature on the ‘16+1’ and proceed with an overview of de-velopments in international trade and investment of CEE with China. Analysing economic links between CEECs and China does not extend beyond trade and investment transactions into other domains, which may be impacted by ‘16+1’, such as cultural relations, economic migration, income distribution or wage developments, financial flows, the application of information and communication technologies, environmental impacts or geopolitical as-pects. The overview of formal institutions is, however, added. To capture the extent and diversity of CEE-China cooperation we use a multilevel and mixed method approach; the regional perspective of macro data is complemented by a case study of bilateral relations. Exploring the diversity of bilateral relations within the ‘16+1’ framework and a case study of bilateral relations can improve the understanding of Chinese engagement in CEE. It can also explain the creation and functioning of the ‘16+1’ platform, which is essential for un-derstanding the Chinese foreign (trade) policy, an influence on entrepreneurial activity and business strategies of CEE firms.
The regional comparative overview is based on the Eurostat data, as 11 of countries within the 16+1 initiative are the EU-members (CEE-11) and five of them are Western Bal-kan countries, among them the EU candidates and potential candidates. The data draws on information from Eurostat’s online database; based on the European Statistical System (ESS) and the European System of Central Banks (ESCB), as well as other official interna-tional sources, the United Nations (UN) and the World Trade Organisation (WTO).
A case study on China-Slovenia economic relations presents an example of a smaller pe-ripheral country – of both the EU and the ‘16+1’, but ranking high in innovation and trade integration. As such it can demonstrate the developments ‘of a hub and spoke’ effects of the ‘16+1’. The analysis uses multiple sources, such as the Bank of Slovenia, the Ministry of Fi-nance and the Slovenian Chamber of Commerce, while we examine entrepreneurial barriers and problems by reviewing interviews and surveys carried by the Chamber of Commerce and some specific research (Raškovič, 2018; Polajžer & Turk, 2013; Ivančič, 2009).
LITERATURE REVIEW
The pace and the scale of China’s economic transformation have no historical precedent (Zho, 2012, p. 103). Its economic growth of the previous three and a half decades was based on several key factors: a sequence of market-oriented institutional reforms, including open-ness to international trade and direct investment, combined with low wages and a favoura-ble demographic structure (Wei et al., 2017). China has made tremendous changes in pro-duction, but also in the volume and structure of global trade in the last decade. The biggest change in the structure of global exports of goods was an expansion in the share of Chinese exports, which rose from 11.0 per cent of the total value in 2006 to 17.0 per cent by 2016. In 2016, China became the leading exporter of goods (EUR 1.9 trillion), while the United States was the largest importer of goods (EUR 2.0 trillion). In both cases the EU-28 occupied the second position, with both exported and imported goods valued at EUR 1.7 trillion. The EU-28, China and the United States have been the three largest players in international trade of goods since 2004 (when China outperformed Japan). In 2007, China surpassed the United

China and Central and Eastern European Countries within… | 87
States as the second largest exporter of goods in the world and this pattern was reproduced again in 2014 when China overtook the EU-28 to record the highest share of exported goods, a position that was maintained in 2015 and 2016 (Eurostat, 2017c). In 2016 the EU adopted a new strategy on China (EC, 2016) promoting reciprocity and fair competition across all ar-eas of cooperation. The strategy also includes a trade agenda with a strong focus on improv-ing market access opportunities, including negotiations on a Comprehensive Agreement on Investment. It is also calling on China to engage with ambition at a multilateral level. China is now the EU’s second-biggest trading partner following the United States and the EU is China’s biggest trading partner. China and Europe trade is on average over EUR1 billion a day, bilateral trade in services amounts to more than 10 per cent of total trade in goods, and the EU’s exports of services make up 19 per cent of the EU’s total exports of goods. The EU has currently a trade deficit with China, however the EU’s overall trade balance is positive.
Firstly, we examine the developments and diversity within the ‘16+1’ and proceed with a case study of China-Slovenia cooperation.
Developments and Diversity in ‘16+1’
China engaged 16 CEECs under the ‘16+1’ cooperation in 2012 when the consequences of the 2008 financial crisis were still strongly present in the region. CEECs enthusiastically embraced this form of cooperation as a chance to diversify their EU-focused economic relations and strengthen the resilience of their economies to ‘next’ crises. The ‘16+1’ for-mat, considered CEECs' advanced stage of development and evolved in a slightly different way from other China-led regional platforms. The idea of a multilateral approach and mul-tilevel governance is manifested in high frequency of ‘16+1’ summits4 along with a number of lower-level gatherings, several sectoral coordination mechanisms across CEE and local cooperation between CEECs and Chinese cities and provinces. Over the last five years, the frequency of multi-level and sector-specific meetings or other consultations has increased. Nevertheless, China has kept intensive bilateral ties. ‘Looking for the future, the bilateral
cooperation under the framework of the ‘16+1 Cooperation’ still has huge potential and
opportunities and will be one of the major points of growth.’ (Ping & Zuokui, 2017, p. 6). Most of the actual business though is transacted bilaterally, like in FOCAC and summits are largely venues for strings of bilateral meetings between Chinese officials and leaders from participating countries although CEECs basically discard such an ‘African’ approach (Gode-ment & Vasselier, 2017, p. 66, p. 73; Buckley & Liu, 2009). This reflects huge differences among CEECs in many dimensions. Among them there are the EU members and those as-piring to be ones. Next, there are huge differences in their development level and struc-tures of the economies. Lastly, all the countries have also their own individual agendas for such a cooperation. Although the ‘16+1’ looks like a multilateral scheme it is basically pri-marily a framework facilitating bilateral cooperation.
Such an approach resulted in a modest cumulative change in 2012-2017 period and very diverse and unbalanced bilateral economic relations of individual CEE economies with China. Trade in goods between China and all CEECs reached EUR 57.3 billion in 2017, while the total EU-China trade was EUR573 billion. Between 2012 and 2017, China-CEECs trade
4 Past annual summits were held in Warsaw (2012), Bucharest (2013), Belgrade (2014), Suzhou (2015), Riga (2016), Budapest (2017) and Sofia (2018), (which took place only eight months after the 2017 Budapest summit, shortly before the 20th EU-China summit in July 2018).
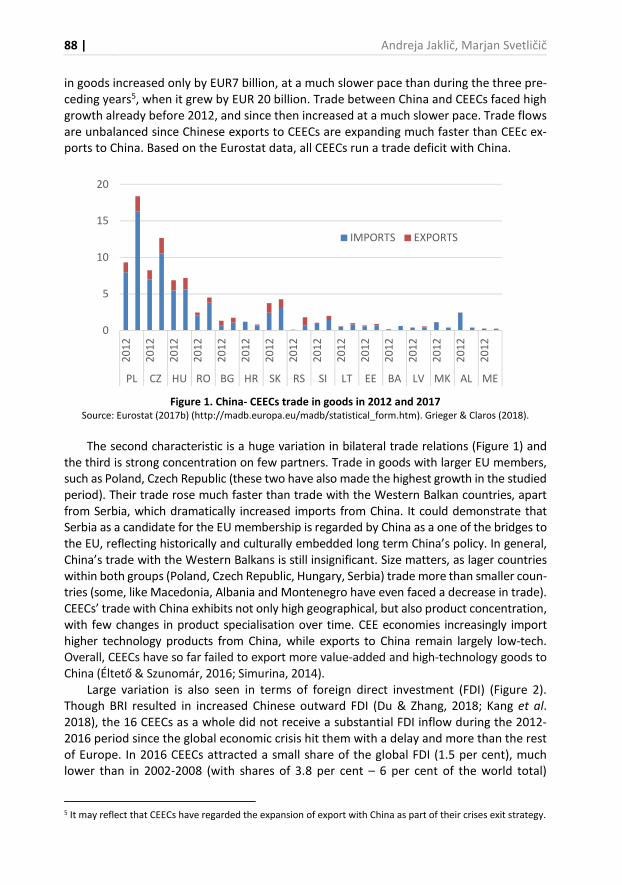
88 | Andreja Jaklič, Marjan Svetličič
in goods increased only by EUR7 billion, at a much slower pace than during the three pre-ceding years5, when it grew by EUR 20 billion. Trade between China and CEECs faced high growth already before 2012, and since then increased at a much slower pace. Trade flows are unbalanced since Chinese exports to CEECs are expanding much faster than CEEc ex-ports to China. Based on the Eurostat data, all CEECs run a trade deficit with China.
Figure 1. China- CEECs trade in goods in 2012 and 2017
Source: Eurostat (2017b) (http://madb.europa.eu/madb/statistical_form.htm). Grieger & Claros (2018).
The second characteristic is a huge variation in bilateral trade relations (Figure 1) and the third is strong concentration on few partners. Trade in goods with larger EU members, such as Poland, Czech Republic (these two have also made the highest growth in the studied period). Their trade rose much faster than trade with the Western Balkan countries, apart from Serbia, which dramatically increased imports from China. It could demonstrate that Serbia as a candidate for the EU membership is regarded by China as a one of the bridges to the EU, reflecting historically and culturally embedded long term China’s policy. In general, China’s trade with the Western Balkans is still insignificant. Size matters, as lager countries within both groups (Poland, Czech Republic, Hungary, Serbia) trade more than smaller coun-tries (some, like Macedonia, Albania and Montenegro have even faced a decrease in trade). CEECs’ trade with China exhibits not only high geographical, but also product concentration, with few changes in product specialisation over time. CEE economies increasingly import higher technology products from China, while exports to China remain largely low-tech. Overall, CEECs have so far failed to export more value-added and high-technology goods to China (Éltető & Szunomár, 2016; Simurina, 2014).
Large variation is also seen in terms of foreign direct investment (FDI) (Figure 2). Though BRI resulted in increased Chinese outward FDI (Du & Zhang, 2018; Kang et al. 2018), the 16 CEECs as a whole did not receive a substantial FDI inflow during the 2012-2016 period since the global economic crisis hit them with a delay and more than the rest of Europe. In 2016 CEECs attracted a small share of the global FDI (1.5 per cent), much lower than in 2002-2008 (with shares of 3.8 per cent – 6 per cent of the world total)
5 It may reflect that CEECs have regarded the expansion of export with China as part of their crises exit strategy.
0
5
10
15
20
20
12
20
12
20
12
20
12
20
12
20
12
20
12
20
12
20
12
20
12
20
12
20
12
20
12
20
12
20
12
20
12
PL CZ HU RO BG HR SK RS SI LT EE BA LV MK AL ME
IMPORTS EXPORTS
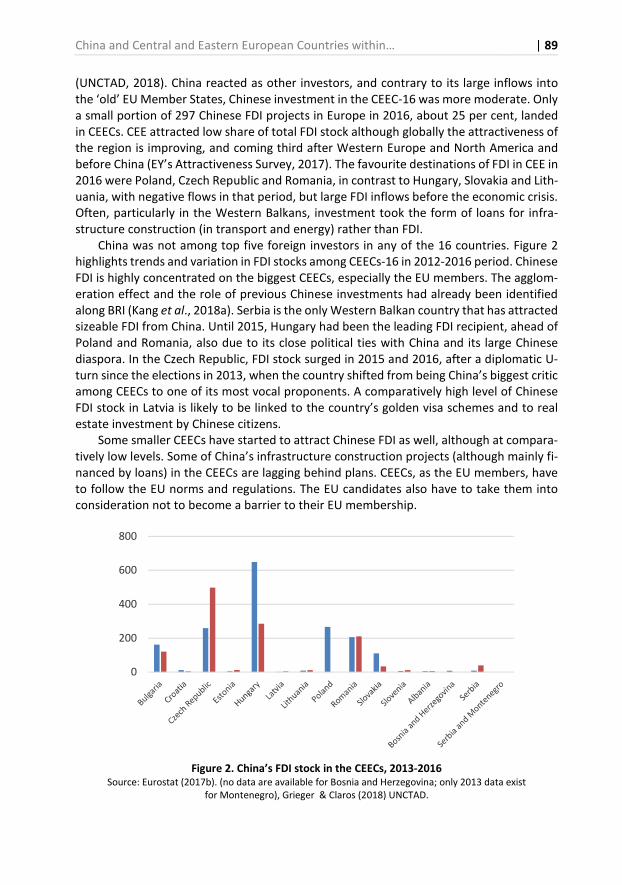
China and Central and Eastern European Countries within… | 89
(UNCTAD, 2018). China reacted as other investors, and contrary to its large inflows into the ‘old’ EU Member States, Chinese investment in the CEEC-16 was more moderate. Only a small portion of 297 Chinese FDI projects in Europe in 2016, about 25 per cent, landed in CEECs. CEE attracted low share of total FDI stock although globally the attractiveness of the region is improving, and coming third after Western Europe and North America and before China (EY’s Attractiveness Survey, 2017). The favourite destinations of FDI in CEE in 2016 were Poland, Czech Republic and Romania, in contrast to Hungary, Slovakia and Lith-uania, with negative flows in that period, but large FDI inflows before the economic crisis. Often, particularly in the Western Balkans, investment took the form of loans for infra-structure construction (in transport and energy) rather than FDI.
China was not among top five foreign investors in any of the 16 countries. Figure 2 highlights trends and variation in FDI stocks among CEECs-16 in 2012-2016 period. Chinese FDI is highly concentrated on the biggest CEECs, especially the EU members. The agglom-eration effect and the role of previous Chinese investments had already been identified along BRI (Kang et al., 2018a). Serbia is the only Western Balkan country that has attracted sizeable FDI from China. Until 2015, Hungary had been the leading FDI recipient, ahead of Poland and Romania, also due to its close political ties with China and its large Chinese diaspora. In the Czech Republic, FDI stock surged in 2015 and 2016, after a diplomatic U-turn since the elections in 2013, when the country shifted from being China’s biggest critic among CEECs to one of its most vocal proponents. A comparatively high level of Chinese FDI stock in Latvia is likely to be linked to the country’s golden visa schemes and to real estate investment by Chinese citizens.
Some smaller CEECs have started to attract Chinese FDI as well, although at compara-tively low levels. Some of China’s infrastructure construction projects (although mainly fi-nanced by loans) in the CEECs are lagging behind plans. CEECs, as the EU members, have to follow the EU norms and regulations. The EU candidates also have to take them into consideration not to become a barrier to their EU membership.
Figure 2. China’s FDI stock in the CEECs, 2013-2016
Source: Eurostat (2017b). (no data are available for Bosnia and Herzegovina; only 2013 data exist for Montenegro), Grieger & Claros (2018) UNCTAD.
0
200
400
600
800
90 | Andreja Jaklič, Marjan Svetličič
China’s investments are primarily guided by its interest within BRI in the region to better connect to the EU market through new intermodal transport channels as time and cost saving alternatives to existing longer ones. Chinese firms were found to invest more along the ‘Belt and Road’ route after the BRI was launched (Kang et al., 2018a); especially large state-owned listed firms (Liu, 2018). Hence, transport and energy in-vestment and infrastructure construction have been China’s priorities for the CEECs. This matches the CEEC’ interest in improving transport and energy infrastructure. The 2017 IMF report (Atoyan et al., 2018) on the infrastructure gap in the Western Balkans states that with the present annual public investment rates it would take the region about 33 years to catch up with the EU level of capital stock per capita. As for the entry mode of FDI, since 2011 Chinese greenfield investment has decreased in favour of ac-quisitions and has been more common in the EU-11 than in the Western Balkan coun-tries. However, as wages have risen significantly in China but have remained compara-tively low in the CEECs, this has created incentives for China to relocate production to the EU’s periphery, which may serve increasingly as an assembly base of products for the EU markets (tariff-jumping FDI). In the manufacturing and services sectors, China’s market-seeking and efficiency-seeking motives have led to both greenfield investment and acquisitions.
The diversity of bilateral ties of 16 CEECs with China has been classified by Oehler-Şincai (2017, p. 13) The matrix has four different groups with regards to the position of the country in the EU and its attitude to cooperation intensity in the ‘16+1’ format:
1. Active participants (‘champions’, ‘leaders’) include the Czech Republic, Hungary, Po-land, and Serbia. All are Euro-sceptic and all are China’s strategic partners.
2. Ambitious partners include Bulgaria, Latvia, FYR Macedonia, Romania and Slovenia. Most of them are Euro-optimists or Euro-moderates (apart from Bulgaria, which is Euro-sceptic).
3. Followers include Croatia, Estonia, Lithuania and Slovakia. These countries are known as Euro-optimists or Euro-moderates.
4. Laggards involve Albania, Bosnia-Herzegovina and Montenegro, known as Euro-opti-mists/Euro-moderates.
Oehler-Şincai (2017, pp. 13-15) further concludes that a higher degree of depend-ency on the EU market and capital does not ensure a positive attitude towards the EU. The highest growth in trade was namely reached with Euro-sceptic countries (Visegrád group, Bulgaria and Serbia), while the Euro-optimists and Euro-moderates represent less than a half of the CEECs in the 16. Even more recent Chinese initiatives, meant to con-solidate the economic ties with CEE-16 through direct lending (especially for infrastruc-ture), trade and investment have not ensured automatically a positive attitude towards China, though, however, these countries are ready to intensify their cooperation with China, as a complementary factor for their economic growth.
CEECs’ relations with China are not formally coordinated (and do not seem to be informally coordinated either); though the initiative has offered the opportunity to cre-ate a new CEEC 'growth pole club' (Ping & Zuokui, 2017, p. 11), they only modestly upgraded ‘previously weak partnerships’ and rather reacted as competitors. China is an increasingly influential actor and is active in shaping the foreign relations of other countries (Shen & Watters, 2016; Zhang & Hao, 2018). A platform of 16 CEE countries
China and Central and Eastern European Countries within… | 91
is therefore too weak to advance these countries’ interests vis-à-vis China and a more powerful EU platform may be complementary. However, the platform generates a net-working pushing effect, which stimulates the CEE participants to keep the pace with the active players in order not to be left behind. Their efforts to institutionalise eco-nomic cooperation (through a variety of Councils, Contact Mechanisms and Secretari-ats across different sectors and associations) thus also vary greatly (Table 1). Poland is the most active member among the CEECs, and eight other countries have one institu-tionalised area of cooperation, often in line with their recognised priority by each par-ticipant, which provides more efficiency in organising the ‘16+1’ activities.
As a big country the Chinese think big, they prefer to deal with large countries or groupings to small ones. They regard CEEC partners in the ‘16+1’ on the one hand as a homogeneous group (which is not the case), and on the other hand they differentiate their approach to different countries (or groups within). Instabilities in the EU can po-tentially provoke competition among the ‘16’ for China’s attention, however, it is in China’s interest to maintain the region’s stability in order to achieve its own economic interests. Beijing quickly realised that successful implementation of projects under the ‘16+1’ framework would require endorsement from the EU and compliance with the EU regulations. For that reason, the 2014 Belgrade Guidelines pledged that all 11 EU mem-bers would act ‘in accordance with EU legislation, regulations and policies’, whereas the EU-China Connectivity Platform initiated in September 2015 and the Riga Declaration issued at the last 16+1 summit in November 2016 recognize the need towards finding synergy between CEE-China and EU-China relations (Istenič, 2017, p. 13).
China is becoming more important and a strategic partner for CEECs and strong bilateral cooperation with China is a part of efforts to diversify their international eco-nomic cooperation parallel with the growing role of China in the global economy. In the majority of CEEC-16, however, the EU integration process remains the central element of the economic policies. In spite of the EU weaknesses, most of the CEECs remain strongly dependent on the EU markets and capital. This supports the findings of Nölke and Vliegenthart (2009), who labelled the countries in this region as Dependent Market Economies. However, this does not prevent 11 EU member countries, especially Vise-grád Group (V4), but also the candidates such as Serbia, to find a balance between the EU decisions and their own national interest. In their view, the ‘16+1’ and intensified bilateral economic relations with China reduce the dependency on the EU and support the process of catching up in their economic development with ‘old’ EU Member States.6 In spite of new complexity within the region and in the EU-China relations (Yu, 2018), CEECs perceive the 16+1’ as an opportunity for more economic cooperation and deeper regional integration. Similarly, as BRI programmes and projects that have emerged as an internal and external policy framework for an openly inclusive ‘win-win’ cooperation model based on shared development and on communities of shared inter-ests (Kang et al., 2017b).
6 The EU engages in the 16+1 as a summit observer, adheres to the principles of its 2016 strategy for China and works towards cooperation with China on physical and digital infrastructure - through the EU-China Connectivity Platform. It has added the Berlin Process to its Western Balkans policy and has issued a new strategy providing for a credible enlargement perspective for and an enhanced EU engagement with the Western Balkans.
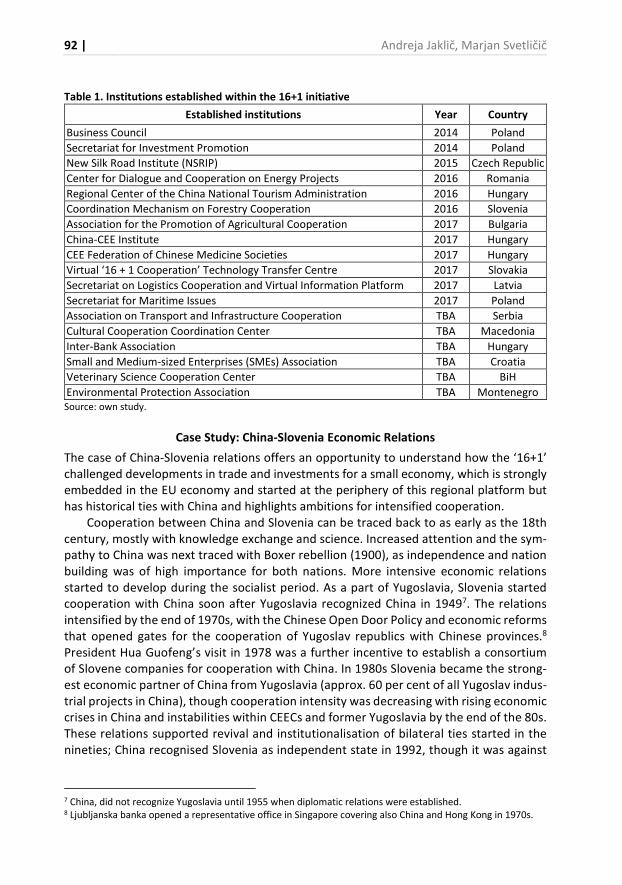
92 | Andreja Jaklič, Marjan Svetličič
Table 1. Institutions established within the 16+1 initiative
Established institutions Year Country
Business Council 2014 Poland
Secretariat for Investment Promotion 2014 Poland
New Silk Road Institute (NSRIP) 2015 Czech Republic
Center for Dialogue and Cooperation on Energy Projects 2016 Romania
Regional Center of the China National Tourism Administration 2016 Hungary
Coordination Mechanism on Forestry Cooperation 2016 Slovenia
Association for the Promotion of Agricultural Cooperation 2017 Bulgaria
China-CEE Institute 2017 Hungary
CEE Federation of Chinese Medicine Societies 2017 Hungary
Virtual ‘16 + 1 Cooperation’ Technology Transfer Centre 2017 Slovakia
Secretariat on Logistics Cooperation and Virtual Information Platform 2017 Latvia
Secretariat for Maritime Issues 2017 Poland
Association on Transport and Infrastructure Cooperation TBA Serbia
Cultural Cooperation Coordination Center TBA Macedonia
Inter-Bank Association TBA Hungary
Small and Medium-sized Enterprises (SMEs) Association TBA Croatia
Veterinary Science Cooperation Center TBA BiH
Environmental Protection Association TBA Montenegro Source: own study.
Case Study: China-Slovenia Economic Relations
The case of China-Slovenia relations offers an opportunity to understand how the ‘16+1’ challenged developments in trade and investments for a small economy, which is strongly embedded in the EU economy and started at the periphery of this regional platform but has historical ties with China and highlights ambitions for intensified cooperation.
Cooperation between China and Slovenia can be traced back to as early as the 18th century, mostly with knowledge exchange and science. Increased attention and the sym-pathy to China was next traced with Boxer rebellion (1900), as independence and nation building was of high importance for both nations. More intensive economic relations started to develop during the socialist period. As a part of Yugoslavia, Slovenia started cooperation with China soon after Yugoslavia recognized China in 19497. The relations intensified by the end of 1970s, with the Chinese Open Door Policy and economic reforms that opened gates for the cooperation of Yugoslav republics with Chinese provinces.8 President Hua Guofeng’s visit in 1978 was a further incentive to establish a consortium of Slovene companies for cooperation with China. In 1980s Slovenia became the strong-est economic partner of China from Yugoslavia (approx. 60 per cent of all Yugoslav indus-trial projects in China), though cooperation intensity was decreasing with rising economic crises in China and instabilities within CEECs and former Yugoslavia by the end of the 80s. These relations supported revival and institutionalisation of bilateral ties started in the nineties; China recognised Slovenia as independent state in 1992, though it was against
7 China, did not recognize Yugoslavia until 1955 when diplomatic relations were established. 8 Ljubljanska banka opened a representative office in Singapore covering also China and Hong Kong in 1970s.
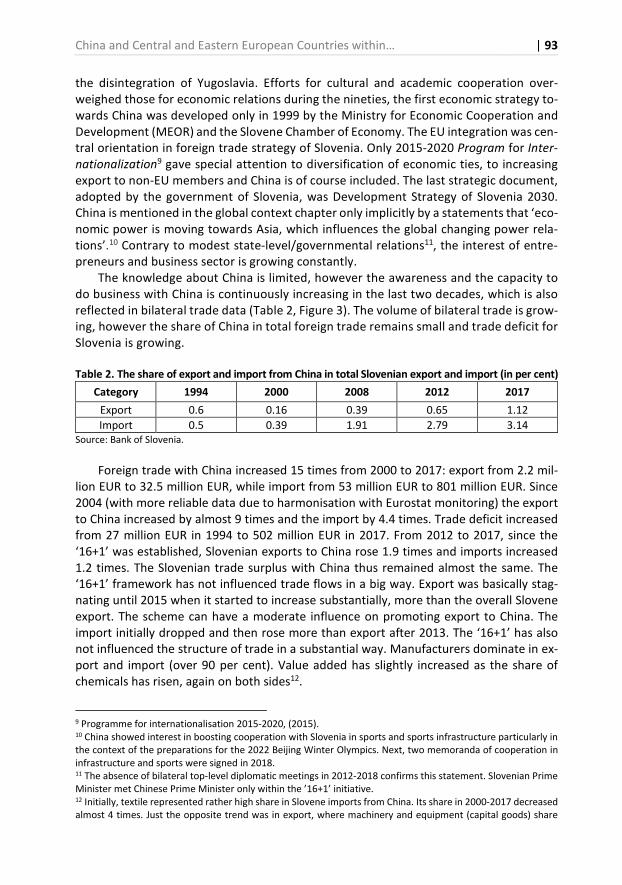
China and Central and Eastern European Countries within… | 93
the disintegration of Yugoslavia. Efforts for cultural and academic cooperation over-weighed those for economic relations during the nineties, the first economic strategy to-wards China was developed only in 1999 by the Ministry for Economic Cooperation and Development (MEOR) and the Slovene Chamber of Economy. The EU integration was cen-tral orientation in foreign trade strategy of Slovenia. Only 2015-2020 Program for Inter-
nationalization9 gave special attention to diversification of economic ties, to increasing export to non-EU members and China is of course included. The last strategic document, adopted by the government of Slovenia, was Development Strategy of Slovenia 2030. China is mentioned in the global context chapter only implicitly by a statements that ‘eco-nomic power is moving towards Asia, which influences the global changing power rela-tions’.10 Contrary to modest state-level/governmental relations11, the interest of entre-preneurs and business sector is growing constantly.
The knowledge about China is limited, however the awareness and the capacity to do business with China is continuously increasing in the last two decades, which is also reflected in bilateral trade data (Table 2, Figure 3). The volume of bilateral trade is grow-ing, however the share of China in total foreign trade remains small and trade deficit for Slovenia is growing.
Table 2. The share of export and import from China in total Slovenian export and import (in per cent)
Category 1994 2000 2008 2012 2017
Export 0.6 0.16 0.39 0.65 1.12
Import 0.5 0.39 1.91 2.79 3.14 Source: Bank of Slovenia.
Foreign trade with China increased 15 times from 2000 to 2017: export from 2.2 mil-lion EUR to 32.5 million EUR, while import from 53 million EUR to 801 million EUR. Since 2004 (with more reliable data due to harmonisation with Eurostat monitoring) the export to China increased by almost 9 times and the import by 4.4 times. Trade deficit increased from 27 million EUR in 1994 to 502 million EUR in 2017. From 2012 to 2017, since the ‘16+1’ was established, Slovenian exports to China rose 1.9 times and imports increased 1.2 times. The Slovenian trade surplus with China thus remained almost the same. The ‘16+1’ framework has not influenced trade flows in a big way. Export was basically stag-nating until 2015 when it started to increase substantially, more than the overall Slovene export. The scheme can have a moderate influence on promoting export to China. The import initially dropped and then rose more than export after 2013. The ‘16+1’ has also not influenced the structure of trade in a substantial way. Manufacturers dominate in ex-port and import (over 90 per cent). Value added has slightly increased as the share of chemicals has risen, again on both sides12.
9 Programme for internationalisation 2015-2020, (2015). 10 China showed interest in boosting cooperation with Slovenia in sports and sports infrastructure particularly in the context of the preparations for the 2022 Beijing Winter Olympics. Next, two memoranda of cooperation in infrastructure and sports were signed in 2018. 11 The absence of bilateral top-level diplomatic meetings in 2012-2018 confirms this statement. Slovenian Prime Minister met Chinese Prime Minister only within the ’16+1’ initiative. 12 Initially, textile represented rather high share in Slovene imports from China. Its share in 2000-2017 decreased almost 4 times. Just the opposite trend was in export, where machinery and equipment (capital goods) share
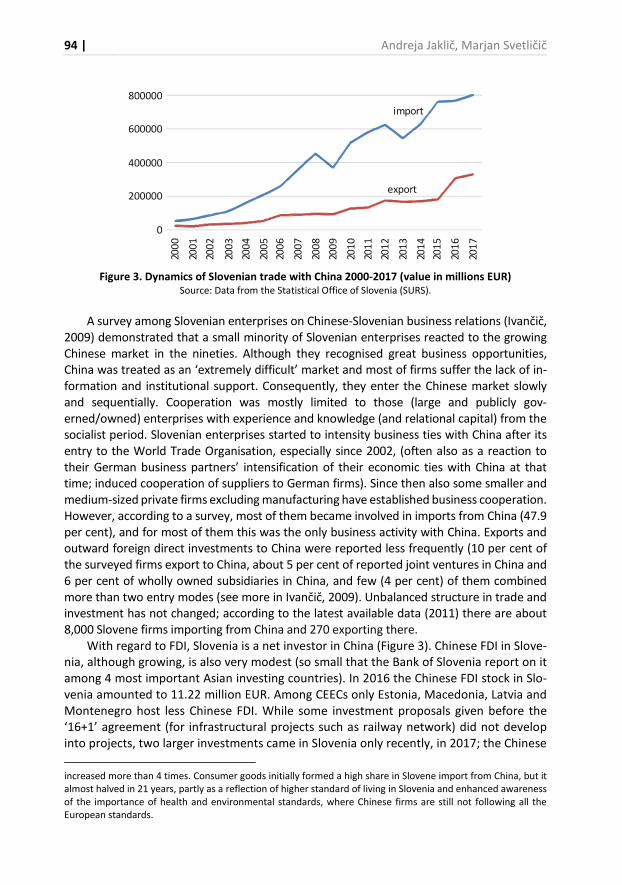
94 | Andreja Jaklič, Marjan Svetličič
Figure 3. Dynamics of Slovenian trade with China 2000-2017 (value in millions EUR)
Source: Data from the Statistical Office of Slovenia (SURS).
A survey among Slovenian enterprises on Chinese-Slovenian business relations (Ivančič, 2009) demonstrated that a small minority of Slovenian enterprises reacted to the growing Chinese market in the nineties. Although they recognised great business opportunities, China was treated as an ‘extremely difficult’ market and most of firms suffer the lack of in-formation and institutional support. Consequently, they enter the Chinese market slowly and sequentially. Cooperation was mostly limited to those (large and publicly gov-erned/owned) enterprises with experience and knowledge (and relational capital) from the socialist period. Slovenian enterprises started to intensity business ties with China after its entry to the World Trade Organisation, especially since 2002, (often also as a reaction to their German business partners’ intensification of their economic ties with China at that time; induced cooperation of suppliers to German firms). Since then also some smaller and medium-sized private firms excluding manufacturing have established business cooperation. However, according to a survey, most of them became involved in imports from China (47.9 per cent), and for most of them this was the only business activity with China. Exports and outward foreign direct investments to China were reported less frequently (10 per cent of the surveyed firms export to China, about 5 per cent of reported joint ventures in China and 6 per cent of wholly owned subsidiaries in China, and few (4 per cent) of them combined more than two entry modes (see more in Ivančič, 2009). Unbalanced structure in trade and investment has not changed; according to the latest available data (2011) there are about 8,000 Slovene firms importing from China and 270 exporting there.
With regard to FDI, Slovenia is a net investor in China (Figure 3). Chinese FDI in Slove-nia, although growing, is also very modest (so small that the Bank of Slovenia report on it among 4 most important Asian investing countries). In 2016 the Chinese FDI stock in Slo-venia amounted to 11.22 million EUR. Among CEECs only Estonia, Macedonia, Latvia and Montenegro host less Chinese FDI. While some investment proposals given before the ‘16+1’ agreement (for infrastructural projects such as railway network) did not develop into projects, two larger investments came in Slovenia only recently, in 2017; the Chinese
increased more than 4 times. Consumer goods initially formed a high share in Slovene import from China, but it almost halved in 21 years, partly as a reflection of higher standard of living in Slovenia and enhanced awareness of the importance of health and environmental standards, where Chinese firms are still not following all the European standards.
import
400000
export
0
600000
800000
200
1200000
200
2
200
3
200
5
200
0
200
6
200
7
200
9
200
4
201
0
201
1
201
3
200
8
201
4
201
5
201
7
201
2
201
6

China and Central and Eastern European Countries within… | 95
acquired TAM Durabus and the Hisense acquired Gorenje, the largest household appli-ances producer. The largest Chinese FDI in Slovenia was the purchase of Outfit 7 bought from Slovene owners for 1 bn dollars by Zhejiang Jinke Peroxide13, after the acquisition with a new name of Zhejiang Jinke Culture Industry. Chinese investors see Slovenia as at-tractive due to its strategic location and well-educated workforce. Their investments in Slovenia serve them to acquire new modern technology and knowledge. Recent targets demonstrate that China is well on the way toward more innovative economy (Wei et al., 2017). The experiences of investors on both sides clearly show that the preferred way is a two-way (investment) cooperation; Chinese firms in Slovenia and Slovene firms with the same partners in China. Cases of such cooperation are Pipistrel14, Arctur15 and Elaphe.16 Next, concentrating cooperation in specific niches, particularly hi-tech, is the best strategy for smaller Slovene firms (not able to compete on economies of scale or scope).
Direct investments to China are also low, but are rising steadily. The share of outward FDI in China in total Slovene investments abroad increased from 0.3 per cent in 2012 to 0.8 per cent in 2016. In terms of value, they gradually increased (although oscillating annually)17 from extremely modest 0.1 million EUR in 2002 to 7.7 million EUR in 2006 and finally to 44 million EUR plus 4.4 million EUR in Honk Kong in 2016 (Bank of Slovenia, 2017). This is far from what other EU countries are doing in China being, after USA, the number two location for FDI in the world and considered as the most promising FDI home economy for 2017-2019 (UNCTAD; 2017; 9)18. Main activities of Slovenian companies in the Chinese market are: production of footwear, products and semi-products for thermoplastics electronics and electromechanical industry, products and components for the automotive industry, sales promotion and market operations, support for the purchasing activities of the parent com-pany. Only recently more technology intensive investments started (Krka; pharmaceutics). More than thirty Slovenian companies have representative offices and companies in the field of automotive, electro, chemical, footwear, textile, trade and transport, operating in China. Among them there are Le-technika, Gorenje, Domel, Etol, Cablex, Letrika, Kolektor, Krka, Cosylab Alpina, Unior, EURO PLUS engineering, Cablex and Gostol.
Enterprises still lack knowledge and skills to overcome all the risks involved in interna-tional operations successfully. They are increasingly aware of different mind-sets and have started to articulate needs for learning and understanding the background of Chinese tradi-tion. Different philosophical frameworks between China and the West are reflected in di-verging concepts of managing relations with the outside world (Lajčiak, 2017). The im-portance of understanding an institutional change and ongoing transition in China becomes not only a key challenge to theory makers and business strategists (Child & Tse, 2001, p. 5), but also to enterprises. Slovenian enterprises, although used for transition, (still) have to learn a lot on doing business with China (Polajžer & Turk, 2013; Ivančič, 2009).
13 A Chinese firm located in Cyprus. As the ultimate owner was outside Slovenia, transaction is not seen in bilat-eral FDI statistics. 14 A producer of super light aircrafts. 15 This high technology firm active in high-performance computing, can also promote Hi-Tech export goods from China to Europe having exclusive rights to export to Europe. 16 It Is a leading firms producing in-wheel electric motors which are considered as the future in electric cars. 17 In 2013 and 2014, however, some Slovenian firms even relocated production facilities back to Slovenia; (Fi-nance, September, 2015). 18 UNCTAD (2017): World Investment Report 2017, UN, New York and Geneve, 9.
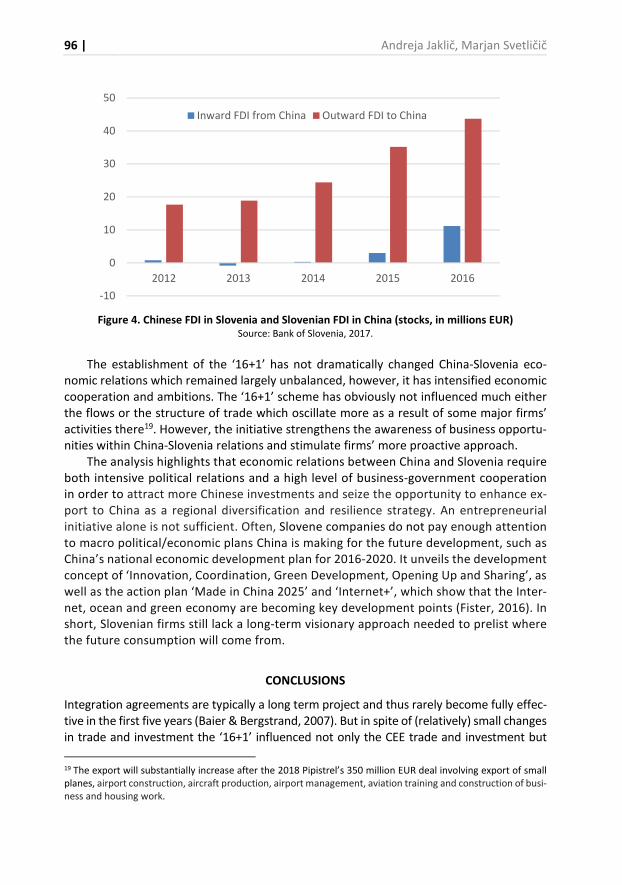
96 | Andreja Jaklič, Marjan Svetličič
Figure 4. Chinese FDI in Slovenia and Slovenian FDI in China (stocks, in millions EUR)
Source: Bank of Slovenia, 2017.
The establishment of the ‘16+1’ has not dramatically changed China-Slovenia eco-nomic relations which remained largely unbalanced, however, it has intensified economic cooperation and ambitions. The ‘16+1’ scheme has obviously not influenced much either the flows or the structure of trade which oscillate more as a result of some major firms’ activities there19. However, the initiative strengthens the awareness of business opportu-nities within China-Slovenia relations and stimulate firms’ more proactive approach.
The analysis highlights that economic relations between China and Slovenia require both intensive political relations and a high level of business-government cooperation in order to attract more Chinese investments and seize the opportunity to enhance ex-port to China as a regional diversification and resilience strategy. An entrepreneurial initiative alone is not sufficient. Often, Slovene companies do not pay enough attention to macro political/economic plans China is making for the future development, such as China’s national economic development plan for 2016-2020. It unveils the development concept of ‘Innovation, Coordination, Green Development, Opening Up and Sharing’, as well as the action plan ‘Made in China 2025’ and ‘Internet+’, which show that the Inter-net, ocean and green economy are becoming key development points (Fister, 2016). In short, Slovenian firms still lack a long-term visionary approach needed to prelist where the future consumption will come from.
CONCLUSIONS
Integration agreements are typically a long term project and thus rarely become fully effec-tive in the first five years (Baier & Bergstrand, 2007). But in spite of (relatively) small changes in trade and investment the ‘16+1’ influenced not only the CEE trade and investment but
19 The export will substantially increase after the 2018 Pipistrel’s 350 million EUR deal involving export of small planes, airport construction, aircraft production, airport management, aviation training and construction of busi-ness and housing work.
-10
0
10
20
30
40
50
2012 2013 2014 2015 2016
Inward FDI from China Outward FDI to China
China and Central and Eastern European Countries within… | 97
also the globalisation patterns in the EU trade and investment. The initiative started as a sort of ‘South-South’ multilateral scheme reflecting very diverse bilateral trade and investment ties between China and individual CEECs. Not only has it modestly intensified the ‘16+1’ co-operation but also stimulated more fundamental rethinking of the EU-China cooperation and internal competition and cooperation among CEECs. For the majority of CEECs-16 the EU integration process remains the central strategy while the ‘6+1’ a regional diversification and resilience enhancing complementary internationalisation strategy as part of their catching-up process and global integration. The boosting effect of the ‘16+1’ on institutional cooper-ation is noticed, as it was with OBOR (Kang et al., 2018; Du & Zhang, 2018).
Trade and investment in the first five years of the existence of the ‘16+1’ framework have not (yet) changed substantially either in terms of volume or in structure, but re-mained relatively modest and largely country diverse. The concentration of FDI and trade flows is related to CEE countries’ size, the EU membership or candidacy of it, but also po-litical relations and consensus between Chinas’ strategic interests regarding big infrastruc-tural projects as a part of BRI and CEEC national or regional (EU) infrastructure strategy. The latter seems to be even more important determinant in the future.
The case of China-Slovenia economic relations revel the perspective of small CEE econ-omy, which is strongly embedded in the EU economy and Western Balkan countries, and where the business sector tries to move from the periphery of the ‘16+1’ initiative. It shares most of the strategic objectives all CEECs have, i.e. to diversify economic coopera-tion and try to take advantages of the large and growing China market also by upgrading economic cooperation more and more in favour of long term/investment projects.
The question whether the ‘16 +1’ has stimulated the development in CEECs and ena-bled them a wider access to larger and more diverse markets; higher living standards; lower prices and a greater choice for consumers or a widespread adoption of new tech-nologies is yet to be explored in the coming years. Satisfaction with the rise of acquisitions and investment in infrastructure project in CEECs and hopes to stimulate development by diversifying their trade and investment pattern go in line with concerns for a more bal-anced trade, reciprocity of market access and more open tenders in the infrastructure construction. Multilateralising the ‘16+1’ remains an opportunity for CEE and the EU.
REFERENCES
Atoyan, R.V., Benedek, D., Cabezon, E., Cipollone , G., Miniane J.A, Nguyen, N., Petri, M. Reinke, J., & Roaf, J. (2018). Public Infrastructure in the Western Balkans Opportunities and Challenges. Departmental Paper No. 18/02, IMF.
Baldwin, R.E. (2011). 21st Century Regionalism: Filling the Gap between 21st Century Trade and 20th Century Trade Rules. World Trade Organization. https://doi.org/10.2139/ssrn.1869845
Bank of Slovenia (2017). Neposredne naložbe – Direct Investment, 2016, Year 21, No. 1, November 2017, Ljubljana, 31.
Baier, S.L., & Bergstrand, J.H. (2007). Do Free Trade Agreements Actually Increase Members’ Inter-national Trade?. Journal of International Economics, 71(1), 72-95.
Buckley, P.J., & Liu, X. (2009). The determinants of chinese outward foreign direct investment. Journal of International Business Studies, 40(2), 353-354.
Burjanadze, A. (2017). China and the EU within the framework of ‘16+1’: Obstacles and Pro-
spects. Retrieved from http://www.lai.lv/viedokli/china-and-the-eu-within-the-frame-work-of-161-obstacles-and-prospects-631 on March 20, 2018.
98 | Andreja Jaklič, Marjan Svetličič
Caleb, M.C., & Szunomár, Á. (2017). Chinese foreign direct investment in Central and Eastern Europe: an institutional perspective. In J. Drahokoupil (Ed.), Chinese investment in Europe: corporate
strategies and labour relations (pp. 121-140.). Brussels: ETUI aisbl. Čeplak Mencin, R. (2012). V deželi nebesnega zmaja – 350 let stikov s Kitajsko, Ljubljana: Založba. Du, J., & Zhang, Y. (2018). Does one belt one road strategy promote Chinese overseas direct invest-
ment?. China Economic Review, 47, 189-205. Éltető, A., & Szunomár, Á. (2016). Chinese investment and trade – strengthening ties with Central
and Eastern Europe. International Journal of Business and Management, IV(1), 24-48. Eurostat (2017a). International trade in goods. Retrieved from http://ec.europa.eu/eurostat/web/in-
ternational-trade-in-goods/data/database on July 21, 2017. Eurostat (2017b). EU Direct Investment. Retrieved on from http://appsso.eurostat.ec.eu-
ropa.eu/nui/submitViewTableAction.do July 21, 2017. Eurostat (2017c). Globalisation patterns in EU trade and investment 2017. Luxembourg: Publications
Office of the European Union. European Comission (2016). Elements for a new EU strategy on China. High Representative of the
Union for Foreign Affairs and Security Policy. Brussels. EY (2017). Ernst and Young’s Attractiveness Survey 2017. Retrieved from https://www.ey.com/Pub-
lication/vwLUAssets/EY_Attractiveness_Survey_2017/$FILE/EY-Attractiveness-Survey%20Eu-rope-2017.pdf on July, 29, 2018.
Fister, S. (2016). China and Slovenia – Building a firm foundation for economic cooperation. Inter-view with H.E. YE Hao, Ambassador of the People’s Republic of China in Slovenia. The Slovenia
Times, February 4, 2016. Grieger, G., & Claros, E. (2018). China, the 16+1 format and the EU. EPRS | European Parliamentary
Research Service. Retrieved from http://www.europarl.europa.eu/RegData/etudes/BRIE/2018/ 625173/EPRS_BRI(2018)625173_EN.pdf on September 14, 2018.
Godement, F., & Vasselier, A. (2017). China at the Gates; a New Power audit of EU-China Relations,
The European Council on Foreign Relations (ECFR). Retrieved from http://www.ecfr.eu/page/-/China_Power_Audit.pdf on March 19, 2018.
HKTDC (2016). Belt and Road Opportunities in Central and Eastern Europe. Retrieved from http://economists-pick-research.hktdc.com/business-news/article/Research-Articles/Belt-and-Road-Opportunities-in-Central-and-Eastern-Europe/rp/en/1/1X000000/1X0A7MSE.html on March 22, 2018.
Hellström, J. (2016). China’s Acquisitions in Europe, European Perceptions of Chinese. Investments
and their Strategic Implications. Stockholm: FOI, Swedish Defence Research Agency. Huang, Y. (2016). Understanding China’s Belt & Road Initiative: Motivation, framework and assess-
ment. China Economic Review, 40, 314-321. Istenič, S. (2017). China-CEE Relations in the 16+1; Format and Implications for Taiwan; 14th Annual
Conference on ‘China-EU Relations and the Taiwan Question’ Shanghai, China, October 19-21, 2017. Retrieved from https://www.swp-berlin.org/fileadmin/contents/products/projekt_pa-piere/Taiwan2ndTrack_Sa%C5%A1a_Isteni%C4%8D_2017.pdf on March 17, 2018.
Ivančič, V. (2009). Poslovanje slovenskih podjetij s Kitajsko. Ljubljana: Falulteta za družbene vede. Univerza v Ljubljani.
Lajčiak, M. (2017). China´s cultural fundamentals behind current foreign policy views: Heritage of old thinking habits in Chinese modern thoughts. Journal of International Studies, 10(2), 9-27. https://doi.org/10.14254/2071-8330.2017/10-2/1
Liu, J., Jiang, L., Zhang, L., & Chen, X. (2018). OFDI Agglomeration and Chinese Firm Location Deci-sions under the ‘Belt and Road’ Initiative. Sustainability, 10(11), 4060; https://doi.org/10.3390/su10114060
Kang, L., Peng, F., Zhu, Y., & Pan, A. (2018a). Harmony in Diversity: Can the One Belt One Road Initi-ative Promote China’s Outward Foreign Direct Investment?. Sustainability, 10(9), 3264; https://doi.org/10.3390/su10093264
China and Central and Eastern European Countries within… | 99
Khan, M.K., Sandano, I.A., Pratt, C.B., & Farid, T. (2018b). China’s Belt and Road Initiative: A Global Model for an Evolving Approach to Sustainable Regional Development. Sustainability, 10(11), 4234; https://doi.org/10.3390/su10114234
Nölke, A., & Vliegenthart, A. (2009). Enlarging the Varieties of Capitalism – The Emergence of De-pendent Market Economies in East Central Europe. World Politics, 61(4), 670-702.
Oehler-Şincai, I.M. (2017). The 16+1 Process: Correlations between the EU Dependency/ Attitude Ma-trix and the Cooperation Intensity with China. Retrieved from https://16plus1.files.word-press.com/2017/12/info-cctb-paper-september-2017.pdf on March 17, 2018.
Pepe, J.M. (2017). China’s Inroads into Central, Eastern, and South Eastern Europe Implications for Germany and the EU, DGAP analyses 3.
Pepermans, A. (2018). China’s 16+1 and Belt and Road Initiative in Central and Eastern Europe: eco-nomic and political influence at a cheap price. Journal of Contemporary Central and Eastern
Europe, 26(2-3), 181-203. Ping, H., & Zuokui, L. (Eds.) (2017). The Cooperation between China and Central & Eastern European
Countries (16+1): 2012-2017. China-CEEC Think Tanks Network. Retrieved from http://16plus1-thinktank.com/u/cms/cepen/201801/13214915w9yy.pdf on June 23, 2018.
Polajžer, B., & Turk, N. (2013). Kako uspešno poslovati na Kitajskem. (how to do business with China). Ljubljana, SPIRIT Slovenija; MGRT in GZS, Ljubljana. Retrieved https://www.izvoznookno.si/ Doku-menti/AKTUALNO/2014/Prirocnik%20o%20poslovanju%20s%20Kitajsko.pdf on March 17, 2018 from.
Programme for internationalisation 2015-2020, (2015). Retrieved on March 16, 2018 from http://www.mgrt.gov.si/fileadmin/mgrt.gov.si/pageuploads/SEKTOR_ZA_INTERNACIONALIZA-CIJO/ANG/Program_INTER_2015-2020_koncna_EN-_FINAL.pdf
Rodrik, D. (2018). What Do Trade Agreements Really Do?. Journal of Economic Perspectives, 32(2), 73-90. Raškovič, M. (2017). China-CEE Cooperation in the eyes of the Beholder: Perceptions of the BRIInitiative
and Attitudes towards China in Slovenia. China – CEE institute. Working paper no. 20. Turcsanyi, R.Q. (2017). Central European Attitudes towards Chinese Energy Investments: The Cases
of Poland, Slovakia, and the Czech Republic. Energy Policy, 101, 711-722. Yu, J. (2018). The belt and road initiative: domestic interests, bureaucratic politics and the EU-China
relations. Asia Europe Journal, 16(3), 223-236. Zhang, L., & Hao, X. (2018). The Impact of Political Relations on China’s Outward
Direct Investment. Entrepreneurial Business and Economics Review, 6(4), 12-26. https://doi.org/10.15678/EBER.2018.060401
Zhu, X. (2012). Understanding China’s Growth: Past, Present, and Future. Journal of Economic Per-
spectives, 26, 4, 103-124. Wei, S.J., Zhuan, X., & Xie, Z. (2017). From ‘Made in China’ to ‘Innovated in China’: Necessity, Pro-
spect, and Challenges. Journal of Economic Perspectives, 31, 1, 49-70.
100 | Andreja Jaklič, Marjan Svetličič
Authors
The contribution share of authors is equal and amounted to 50% each of them.
Andreja Jaklič
Professor of International Economics and international Business, University of Ljubljana, Faculty of Social Sciences, Centre of International Relations, coordinator for European studies pro-gramme. Involved in several international research projects (ACE Phare, Horizon 2020, GDN) and consultancy (UNCTAD, European Commission, OECD). Visiting professor and researcher at Wirtschaftsuniversität Wien, Helsinki Centre for Markets in Transition, Corvinus University, Trento University and Hubei University in Wuhan (China). Her publications include monographs, Enhanced Transition through Outward Internationalization (Ashgate Publishing, 2003), several book chapters and over 40 articles, also in Journal of World Business, Transnational Corporations, The Services Industries Journal, Eastern European Economies and Post-Communist Economies. An executive member of AIB-CEE board, served as a board member of EIBA (2010-2016). Correspondence to: prof. dr. Andreja Jaklič, University of Ljubljana, Faculty of Social Sciences, Kardeljeva pl. 5, 1000 Ljubljana, Slovenia, e-mail: [email protected] ORCID http://orcid.org/0000-0001-5118-9112
Marjan Svetličič
Professor Emeritus. University of Ljubljana, Faculty of Social Sciences and research fellow at the Cen-tre of International Relations. Dean of the Faculty of Social Sciences (Ljubljana; 1997-2000); Visiting Fellow at the University of Reading, Reading, UK, (1994); President of EIBA 2004, Vice president of EIBA 2005-2007; member of the Steering Committee of the Standing Group of the European Con-sortium for Political Research (ECPR;2006-2008), Director of the Research Center for Developing Countries (since 1998 Centre of International Cooperation and Development, Ljubljana; 1987-1990), Consultancy work for international organizations like UNCTAD, World bank-IFC, UNIDO, UNESCO, OECD Development Centre, IFC, UNDP, UN University Institute WIDER, OSCE and EU Commission like Evaluator of Phare ACE programmes (1997-99) and Asia Europe Foundation. Correspondence to: prof. dr. Marjan Svetličič, University of Ljubljana, Faculty of Social Sciences, Kardeljeva pl. 5, 1000 Ljubljana, Slovenia, e-mail: [email protected] ORCID http://orcid.org/0000-0002-5821-6707
Acknowledgements and Financial Disclosure
The authors would like to thank the anonymous referees for their useful comments, which al-lowed to increase the value of this article.
Copyright and License
This article is published under the terms of the Creative Commons Attribution – NoDerivs (CC BY-ND 4.0) License
http://creativecommons.org/licenses/by-nd/4.0/
Published by the Centre for Strategic and International Entrepreneurship – Krakow, Poland
The copyediting and proofreading of articles in English is financed in the framework of contract No. 913/P-DUN/2019 by the Ministry of Science and Higher Education of the Republic of Poland committed to activities aimed at science promotion.
2019, Vol. 7, No. 2 10.15678/EBER.2019.070206
Knowledge-Intensive Services Development
in the EU: Forecasts for Selected Countries
and Implications for Poland
Bianka Godlewska-Dzioboń, Piotr Klimczyk, Agnieszka Witoń
A B S T R A C T
Objective: The first purpose of the article and the underlying research is to identify trends in the development of the knowledge-intensive services (KIS) sector in se-lected EU countries and to create forecasts of its further growth. The second purpose is to recognize factors that may help or inhibit Poland from drawing upon the experi-ences of the analysed countries.
Research Design & Methods: We use time-series trend forecasting. Forecasts of the development of the KIS sector in the EU are constructed basing on available time series (2008 - 2017) using the least square method (LSM).
Findings: Knowledge-intensive services are developing with various speed in the EU countries, but an existence of a ‘glass ceiling’ in the context of a possible level of devel-opment can be noted. This ‘glass ceiling’ is situated on different levels for different groups of countries (higher for the most innovative ones, lower for others). While Po-land is on the path of convergence with highly-developed EU countries in respect to the growth of knowledge-intensive services sector, several country-specific factors hinder its ability to enter the path of convergence with the innovation-leaders, thus most prob-ably preventing it from ever reaching the highest ‘glass ceiling.’
Implications & Recommendations: The innovation policy should not only be oriented to support R&D activities but also support the development of KIS.
Contribution & Value Added: The added value of the article lies in filling the gap in the literature concerning the analysed issue. The findings may serve as suggestions for creating innovation policy.
Article type: research article
Keywords: convergence; innovative services; knowledge-intensive services; Eu-ropean Union; Polish economy
JEL codes: O33, O38
Received: 30 August 2018 Revised: 6 March 2019 Accepted: 7 March 2019
Suggested citation:
Godlewska-Dzioboń, B., Klimczyk, P., & Witoń, A. (2019). Knowledge-Intensive Services Develop-ment in the EU: Forecasts for Selected Countries and Implications for Poland. Entrepreneurial Busi-
ness and Economics Review, 7(2), 101-118. https://doi.org/10.15678/EBER.2019.070206
102 | Bianka Godlewska-Dzioboń, Piotr Klimczyk, Agnieszka Witoń
INTRODUCTION
Modern economies are based on knowledge and information. Knowledge and information are recognized as the driver of productivity and economic growth. The term ‘knowledge-based economy’ stems from this fuller recognition of the place of knowledge and infor-mation in modern economies.
One of the elements of knowledge-based economy is a dynamic development of knowledge-intensive services (KIS) (Wyszkowska-Kuna, 2016). The areas of KIS are char-acterised by large involvement in research and development1 (Doloreux, Shearmur, & Rodriguez, 2015) and employment of highly educated workforce. The knowledge re-source held by the service provider and innovation are necessary conditions for the ac-tivity to be included in KIS category. These services may be provided as part of business activity or obtained from specialised third-party companies. KIS is, therefore, capital and knowledge-intensive. These services are a vital source of innovation for businesses and entire economy. Knowledge-intensive services contribute not only through the diffusion of knowledge and innovation to the creation and transfer of modern technology but also to an increase in productivity (Musolesi, & Huiban, 2009, p. 63) and thus to acceleration of economic growth (Klaesson, & Norman, 2015, p. 158).
An increase in the number and influence of knowledge-intensive business services (KIBS) in the EU can be attributed to several factors. First, there is an increasing need for knowledge within the economy. Increasing research and development is seen as a sig-nificant venue towards the attainment of this objective. Second, the strategies put in place by most governments in the region offer a conducive environment for the increase in KIBS (Pauceanu, 2015, p. 12). In Poland and other CEE countries, a rapid growth of KIS can be seen after 1989 (Baláž, 2004, p. 1).
The purpose of the article is to show trends in the development of the knowledge-intensive services (KIS) sector in selected EU countries and to create projections of its further growth. The second purpose is to identify factors that may help or inhibit Poland from drawing upon the experiences of the analysed countries. To fulfill those aims, we verify the main hypothesis, which is as follows: the process of development of knowledge-intensive services has a certain limit that cannot be overcome, which can be called a ‘glass ceiling’. Furthermore, three additional hypotheses were developed: (1) The level of the proposed ‘glass ceiling’ of knowledge-intensive services development varies in particular economies; (2) The knowledge-intensive services sector is character-ised by decreasing marginal productivity; (3) Knowledge-intensive services sector in Po-land is on the path of convergence with highly-developed EU countries.
To verify these hypotheses we use time series trend forecasting of the development of the KIS sector in the EU countries.
1 A study carried out by Masso and Vather (2012) concludes that, although knowledge-intensive services (KIS) spend more on research and development (R&D) the efficiency of turning R&D expenditures into innovation is higher in less knowledge-intensive sectors.
Knowledge-Intensive Services (KIS) Development in EU: Forecasts… | 103
LITERATURE REVIEW
In the literature of the subject, two concepts are often used interchangeably: knowledge-intensive services (KIS) and knowledge-intensive business services (KIBS). The difference be-tween them is that knowledge-intensive business services (KIBS) are the sub-group of KIS. In the literature, KIBS are defined as firms that provide knowledge-intensive goods and services for other business firms (Schricke, Zenker, & Stahlecker 2012, p. 6). Thus, KIBS include all KIS, except for education, health and social work, recreational, cultural, and sporting activities, which are services destined for consumers (Wyszkowska-Kuna, 2016).
The origins of the research on KIS dates back to the 1990s of the last century (Miles et
al., 1995). According to this author, ‘Knowledge-Intensive Business Services involve eco-nomic activities which are intended to result in the creation, accumulation, or dissemina-tion of knowledge’ (Miles et al., 1995, p. 18). They act as transmitters of knowledge, con-tributing in different ways to the innovation processes of related firms (Miles et al., 1995, pp. 41-42). Currently, applicable definitions of KIS and KIBS have some common features, focusing on the high involvement of excellent work (requiring a high level of knowledge), a diffusion process and a significant impact on innovative activities within the enterprise and the economy (Gallego & Maroto, 2015; Dubosson & Fragniere, 2008). Concluding, knowledge-intensive business services (KIBS) are:
− performed by private companies and organisations,
− relying on professional knowledge, related to a specific (technical) discipline or (tech-nical) functional domain,
− supplying intermediate products and services that are knowledge-based (Bilderbeek et al., 1998).
KIS are key players in innovation systems, particularly in advanced regions where man-ufacturing competitiveness depends on knowledge contents provided by highly special-ised suppliers (Braga, Marques, & Serrasqueiro, 2018 p. 360).
Among the determinants of the development of the KIS sector one can mention (Miles et al., 2018):
− growing demand from organisations that focus on ‘core competences’, outsourcing non-core activities to specialised suppliers,
− increasing requirements for external knowledge,
− changing environments and technologies which require knowledge to fully utilise them,
− growing complexity of economies and the technologies which are deployed in them.
Nowadays, many authors develop the concept of knowledge-intensive services. Full review of authors, publications, topics, and the number of citations is included in a study by Figueiredo et al. (2017). The three most-quoted authors are: Miles, Hertog and Muller, and the four most frequently quoted articles are by Muller and Zenker (2001), Hertog (2000), Miles (2005) and Bettencourt et al. (2002).
Many studies focus on spatial variation of innovation in the knowledge-intensive business sector. The subject of their analysis is the regional diversification of companies in the KIS sec-tor (Brenner et al., 2018; Dolores & Shearmur, 2012; Klaesson & Norman, 2015; Pauceanu, 2015; Ženka et al., 2017). The mentioned articles analyse the KIS in some countries (Sweden, Germany, the Czech Republic). Only Alexandrina Pauceanu (2015) presents KIS in all countries
104 | Bianka Godlewska-Dzioboń, Piotr Klimczyk, Agnieszka Witoń
of the EU. As a continuation of our research on the service sector (Godlewska-Dzioboń, Klimczyk, & Witoń, 2018), in this article we follow the above mentioned research and also focus on the KIS topic from the point of view of the service structure. We want to present the current KIS situation and its share in the EU countries, but our added value is forecasting changes of KIS and their implications for the Polish economic policy.
According to Rodriguez (2014), studies of KIS can be classified into three groups de-pending on their main objective. The first group contains works that link regional inno-vation efficiency and KIBS (i.e. Brenner et al., 2018; Gallego & Maroto, 2015). The second group of authors and we focus on the location of KIS (Pauceanu, 2015; Ženka et al., 2017). The third group of publications addresses how regional features affect the for-mation of KIS (Dolores & Shearmur, 2012).
There seems to be an agreement in literature that knowledge intensive (business) ser-vices can contribute to economic growth, either regional or national (Brenner et al., 2018; Desmarchelier, Djellal, & Gallouj, 2013). Knowledge intensive business services provide ad-vanced technological knowledge directly to other industrial sectors, and indirectly to the whole economy (Castellacci, 2008; Radovanović, Dmitrović, & Žarkić Joksimović, 2017). The economy can benefit collectively from the knowledge produced by KIBS (Brenner et al., 2018). The contribution of KIBS to the productivity of the other industrial sectors may well exceed the productivity gains as measured within the KIBS sector itself (Castaldi, 2009).
However, the relationship between KIS/KIBS and economic growth is two-way. There is a strong demand-pull mechanism in place. Growth in the rest of the economy causes KIBS to grow in the next or later years (Brenner et al., 2018). Therefore, the de-velopment of the KIS/KIBS sector in the most developed EU economies is limited due to the slowdown in economic growth. Additionally, according to Baumol (2002) and Wolff (2002), intellectual work is stagnant – the rise in costs is nowhere near being balanced by the improvement in the ‘act of thinking’. This causes productivity decreases in knowledge-intensive sectors. What is more, some KIS/KIBS firms follow their clients overseas, and/or seek new markets in (especially) emerging economies. A possible trend is likely to be the emergence of KIBS firms within emerging economies – catering to local and/or world markets (Miles, 2018). Having considered this, we proposed the main hy-pothesis of the study, which posits that the process of development of knowledge-in-tensive services has a certain limit that cannot be overcome, which can be called a ‘glass ceiling’. The exact level of that limit should be analysed in further studies.
MATERIAL AND METHODS
Sector development of knowledge-intensive services is measured as employment in KIS in relation to all employment in the economy. The data was obtained from the Eurostat’s data-base. The data source is the European Labour Force Survey (LFS). The definition of knowledge-intensive services used by Eurostat is based on a selection of relevant items of NACE Rev. 2 on a 2-digit level and is oriented to the ratio of highly qualified workers in these areas.
In the course of study, the following hypotheses were developed: The main hypoth-esis: The process of development of knowledge-intensive services has a certain limit that cannot be overcome, which can be called a ‘glass ceiling’. Additional hypotheses were developed:

Knowledge-Intensive Services (KIS) Development in EU: Forecasts… | 105
1. The level of the proposed ‘glass ceiling’ of knowledge-intensive services development varies in particular economies;
2. The knowledge-intensive services sector is characterised by decreasing marginal productivity;
3. The knowledge-intensive services sector in Poland is on the path of convergence with highly-developed EU countries.
The available data include the years 2008-2017 and that period was used to build predictions about the development of the KIS sector in the European Union. The length of the available time-series must be considered a limitation of the study, and it needs to be taken into account when perusing the results. Additionally, this method does not identify factors causing the ‘glass ceiling’ in KIS. This issue should be addressed in further studies. Forecasts were constructed using the method of least squares. The method of least squares is a standard approach in regression analysis to approximate the solution of overdetermined systems. The principle of least squares regression states that the best choice of this linear relationship is the one that minimises the square in the vertical dis-tance from the y values in the data and the y values on the regression line (Watkins, 2016, p. 37). This leads to a minimisation problem for:
����, �� = ∑ ��
� = ∑ �� − �� + ������
� (1)
This approach – with the use of econometric models to forecast socio-economic – is known as a classical statistical approach (Wilks, 2006, p. 217). It is used in cases in which the course of the testing phenomenon is regular over time, and the observed trend is per-manent and can be described with a smooth mathematical function. It is assumed that the regularity governing the testing phenomenon will not change significantly during the pe-riod for which the forecast is based. The predictions reach the year 2025, but their accu-racy decreases as the time horizon progresses.
It was initially assumed that the time series equations would be evaluated in the form of second-degree polynomials:
�̂� = � + �� ∗ �� + �� ∗ � (2)
where: �̂� - ind involvement of employment in the KIS sector in the country � in the year �; � - time variable; � - constant;
��, �� - structural parameters.
In some cases, for a better fit of the model, statistically insignificant at least at the level α=0.1 independent variables appearing in the estimation process were aban-doned (time variable or its square) and eventually, linear time series were obtained. The estimated equations for all EU countries are included in Table 1.
The degree of the fit of the model was different for different countries. The model’s fit is assessed by the coefficient of determination R2. The value of this coefficient shows what part of the variation in the response variable is due to the fit of the model. The rest (1- R2) is due to the residuals. The R2 can be interpreted as the proportion of the variation of the predictand that is described or accounted for by the regression (Wilks, 2006, p. 186). R2 is calculated in the following way (Watkins, 2016, p. 43):
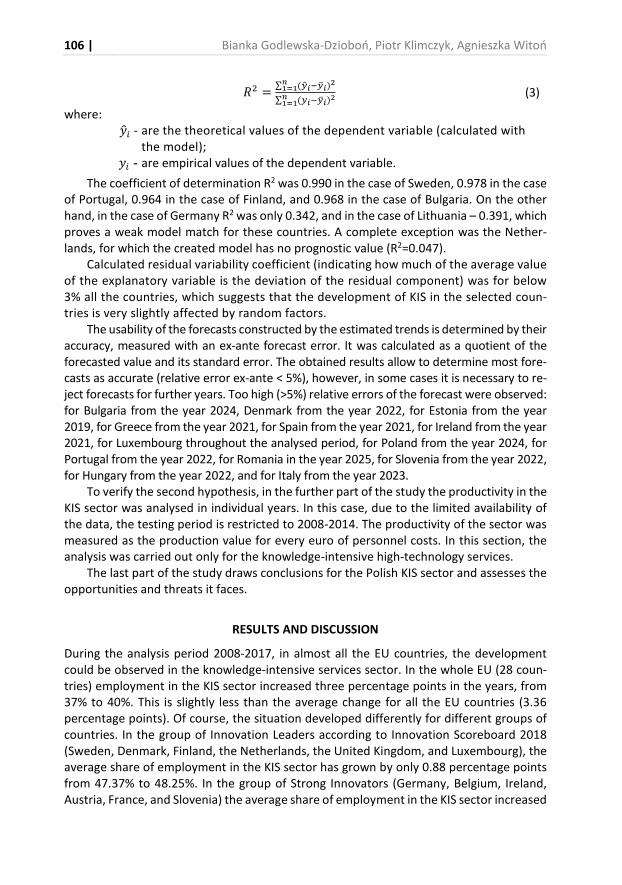
106 | Bianka Godlewska-Dzioboń, Piotr Klimczyk, Agnieszka Witoń
�� =∑ ���������
� !"!
∑ ���������
!"!
(3)
where: �� - are the theoretical values of the dependent variable (calculated with
the model); � - are empirical values of the dependent variable.
The coefficient of determination R2 was 0.990 in the case of Sweden, 0.978 in the case of Portugal, 0.964 in the case of Finland, and 0.968 in the case of Bulgaria. On the other hand, in the case of Germany R2 was only 0.342, and in the case of Lithuania – 0.391, which proves a weak model match for these countries. A complete exception was the Nether-lands, for which the created model has no prognostic value (R2=0.047).
Calculated residual variability coefficient (indicating how much of the average value of the explanatory variable is the deviation of the residual component) was for below 3% all the countries, which suggests that the development of KIS in the selected coun-tries is very slightly affected by random factors.
The usability of the forecasts constructed by the estimated trends is determined by their accuracy, measured with an ex-ante forecast error. It was calculated as a quotient of the forecasted value and its standard error. The obtained results allow to determine most fore-casts as accurate (relative error ex-ante < 5%), however, in some cases it is necessary to re-ject forecasts for further years. Too high (>5%) relative errors of the forecast were observed: for Bulgaria from the year 2024, Denmark from the year 2022, for Estonia from the year 2019, for Greece from the year 2021, for Spain from the year 2021, for Ireland from the year 2021, for Luxembourg throughout the analysed period, for Poland from the year 2024, for Portugal from the year 2022, for Romania in the year 2025, for Slovenia from the year 2022, for Hungary from the year 2022, and for Italy from the year 2023.
To verify the second hypothesis, in the further part of the study the productivity in the KIS sector was analysed in individual years. In this case, due to the limited availability of the data, the testing period is restricted to 2008-2014. The productivity of the sector was measured as the production value for every euro of personnel costs. In this section, the analysis was carried out only for the knowledge-intensive high-technology services.
The last part of the study draws conclusions for the Polish KIS sector and assesses the opportunities and threats it faces.
RESULTS AND DISCUSSION
During the analysis period 2008-2017, in almost all the EU countries, the development could be observed in the knowledge-intensive services sector. In the whole EU (28 coun-tries) employment in the KIS sector increased three percentage points in the years, from 37% to 40%. This is slightly less than the average change for all the EU countries (3.36 percentage points). Of course, the situation developed differently for different groups of countries. In the group of Innovation Leaders according to Innovation Scoreboard 2018 (Sweden, Denmark, Finland, the Netherlands, the United Kingdom, and Luxembourg), the average share of employment in the KIS sector has grown by only 0.88 percentage points from 47.37% to 48.25%. In the group of Strong Innovators (Germany, Belgium, Ireland, Austria, France, and Slovenia) the average share of employment in the KIS sector increased
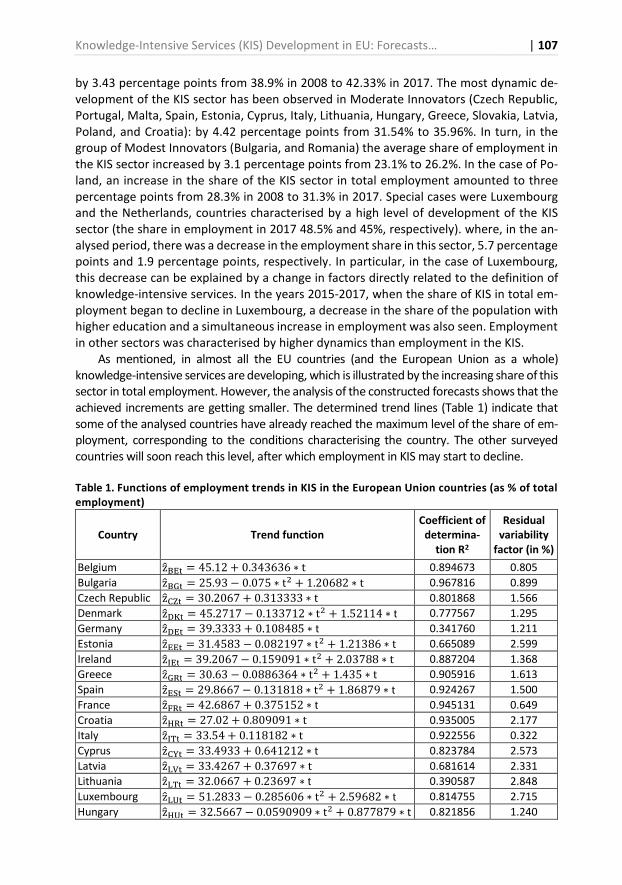
Knowledge-Intensive Services (KIS) Development in EU: Forecasts… | 107
by 3.43 percentage points from 38.9% in 2008 to 42.33% in 2017. The most dynamic de-velopment of the KIS sector has been observed in Moderate Innovators (Czech Republic, Portugal, Malta, Spain, Estonia, Cyprus, Italy, Lithuania, Hungary, Greece, Slovakia, Latvia, Poland, and Croatia): by 4.42 percentage points from 31.54% to 35.96%. In turn, in the group of Modest Innovators (Bulgaria, and Romania) the average share of employment in the KIS sector increased by 3.1 percentage points from 23.1% to 26.2%. In the case of Po-land, an increase in the share of the KIS sector in total employment amounted to three percentage points from 28.3% in 2008 to 31.3% in 2017. Special cases were Luxembourg and the Netherlands, countries characterised by a high level of development of the KIS sector (the share in employment in 2017 48.5% and 45%, respectively). where, in the an-alysed period, there was a decrease in the employment share in this sector, 5.7 percentage points and 1.9 percentage points, respectively. In particular, in the case of Luxembourg, this decrease can be explained by a change in factors directly related to the definition of knowledge-intensive services. In the years 2015-2017, when the share of KIS in total em-ployment began to decline in Luxembourg, a decrease in the share of the population with higher education and a simultaneous increase in employment was also seen. Employment in other sectors was characterised by higher dynamics than employment in the KIS.
As mentioned, in almost all the EU countries (and the European Union as a whole) knowledge-intensive services are developing, which is illustrated by the increasing share of this sector in total employment. However, the analysis of the constructed forecasts shows that the achieved increments are getting smaller. The determined trend lines (Table 1) indicate that some of the analysed countries have already reached the maximum level of the share of em-ployment, corresponding to the conditions characterising the country. The other surveyed countries will soon reach this level, after which employment in KIS may start to decline.
Table 1. Functions of employment trends in KIS in the European Union countries (as % of total
employment)
Country Trend function
Coefficient of
determina-
tion R2
Residual
variability
factor (in %)
Belgium z�$%& = 45.12 + 0.343636 ∗ t 0.894673 0.805
Bulgaria z�$0& = 25.93 − 0.075 ∗ t� + 1.20682 ∗ t 0.967816 0.899
Czech Republic z�45& = 30.2067 + 0.313333 ∗ t 0.801868 1.566
Denmark z�67& = 45.2717 − 0.133712 ∗ t� + 1.52114 ∗ t 0.777567 1.295
Germany z�6%& = 39.3333 + 0.108485 ∗ t 0.341760 1.211
Estonia z�%%& = 31.4583 − 0.082197 ∗ t� + 1.21386 ∗ t 0.665089 2.599
Ireland z�8%& = 39.2067 − 0.159091 ∗ t� + 2.03788 ∗ t 0.887204 1.368
Greece z�09& = 30.63 − 0.0886364 ∗ t� + 1.435 ∗ t 0.905916 1.613
Spain z�%:& = 29.8667 − 0.131818 ∗ t� + 1.86879 ∗ t 0.924267 1.500
France z�;9& = 42.6867 + 0.375152 ∗ t 0.945131 0.649
Croatia z�<9& = 27.02 + 0.809091 ∗ t 0.935005 2.177
Italy z�8=& = 33.54 + 0.118182 ∗ t 0.922556 0.322
Cyprus z�4>& = 33.4933 + 0.641212 ∗ t 0.823784 2.573
Latvia z�?@& = 33.4267 + 0.37697 ∗ t 0.681614 2.331
Lithuania z�?=& = 32.0667 + 0.23697 ∗ t 0.390587 2.848
Luxembourg z�?A& = 51.2833 − 0.285606 ∗ t� + 2.59682 ∗ t 0.814755 2.715
Hungary z�<A& = 32.5667 − 0.0590909 ∗ t� + 0.877879 ∗ t 0.821856 1.240
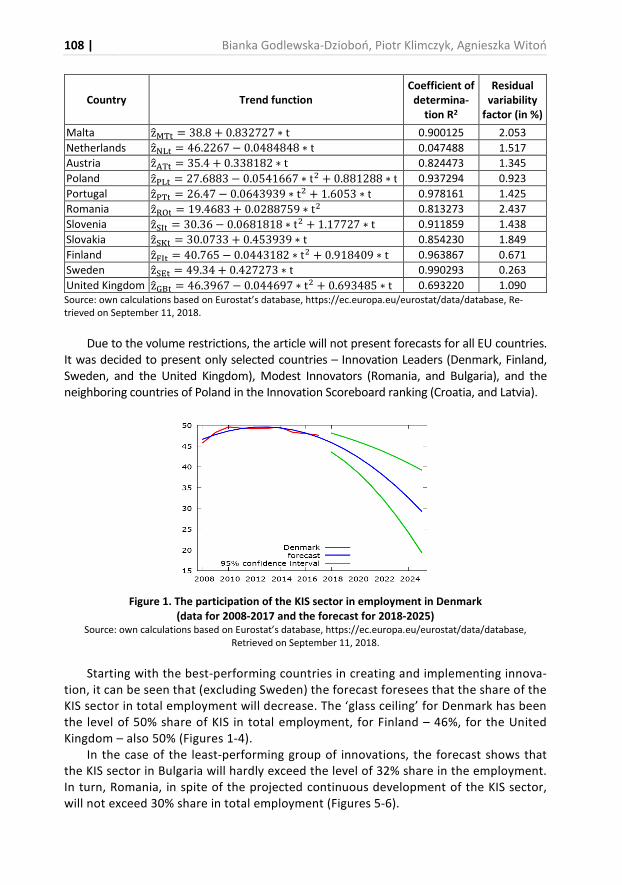
108 | Bianka Godlewska-Dzioboń, Piotr Klimczyk, Agnieszka Witoń
Country Trend function
Coefficient of
determina-
tion R2
Residual
variability
factor (in %)
Malta z�B=& = 38.8 + 0.832727 ∗ t 0.900125 2.053
Netherlands z�C?& = 46.2267 − 0.0484848 ∗ t 0.047488 1.517
Austria z�D=& = 35.4 + 0.338182 ∗ t 0.824473 1.345
Poland z�E?& = 27.6883 − 0.0541667 ∗ t� + 0.881288 ∗ t 0.937294 0.923
Portugal z�E=& = 26.47 − 0.0643939 ∗ t� + 1.6053 ∗ t 0.978161 1.425
Romania z�9F& = 19.4683 + 0.0288759 ∗ t� 0.813273 2.437
Slovenia z�:8& = 30.36 − 0.0681818 ∗ t� + 1.17727 ∗ t 0.911859 1.438
Slovakia z�:7& = 30.0733 + 0.453939 ∗ t 0.854230 1.849
Finland z�;8& = 40.765 − 0.0443182 ∗ t� + 0.918409 ∗ t 0.963867 0.671
Sweden z�:%& = 49.34 + 0.427273 ∗ t 0.990293 0.263
United Kingdom z�0$& = 46.3967 − 0.044697 ∗ t� + 0.693485 ∗ t 0.693220 1.090
Source: own calculations based on Eurostat’s database, https://ec.europa.eu/eurostat/data/database, Re-trieved on September 11, 2018.
Due to the volume restrictions, the article will not present forecasts for all EU countries. It was decided to present only selected countries – Innovation Leaders (Denmark, Finland, Sweden, and the United Kingdom), Modest Innovators (Romania, and Bulgaria), and the neighboring countries of Poland in the Innovation Scoreboard ranking (Croatia, and Latvia).
Figure 1. The participation of the KIS sector in employment in Denmark
(data for 2008-2017 and the forecast for 2018-2025)
Source: own calculations based on Eurostat’s database, https://ec.europa.eu/eurostat/data/database, Retrieved on September 11, 2018.
Starting with the best-performing countries in creating and implementing innova-tion, it can be seen that (excluding Sweden) the forecast foresees that the share of the KIS sector in total employment will decrease. The ‘glass ceiling’ for Denmark has been the level of 50% share of KIS in total employment, for Finland – 46%, for the United Kingdom – also 50% (Figures 1-4).
In the case of the least-performing group of innovations, the forecast shows that the KIS sector in Bulgaria will hardly exceed the level of 32% share in the employment. In turn, Romania, in spite of the projected continuous development of the KIS sector, will not exceed 30% share in total employment (Figures 5-6).
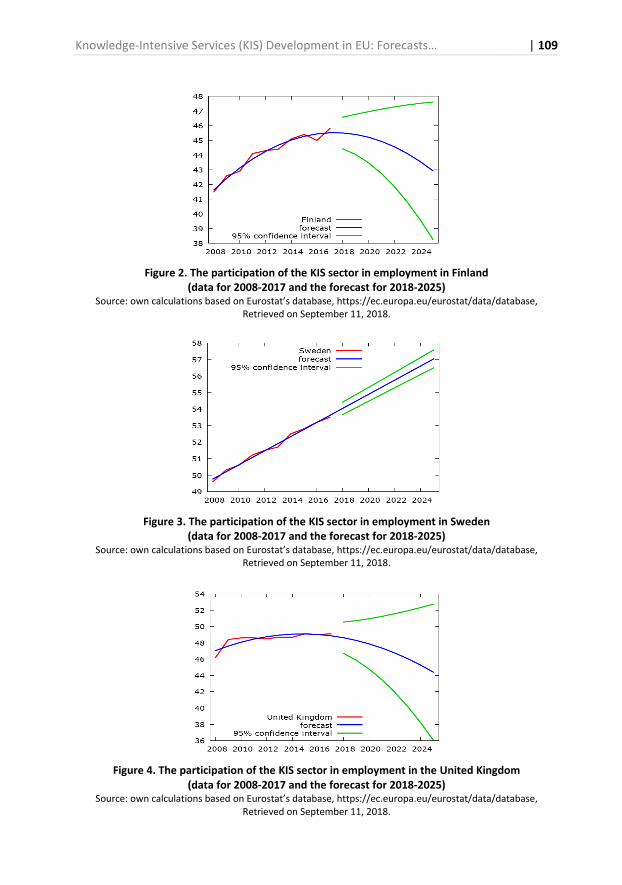
Knowledge-Intensive Services (KIS) Development in EU: Forecasts… | 109
Figure 2. The participation of the KIS sector in employment in Finland
(data for 2008-2017 and the forecast for 2018-2025)
Source: own calculations based on Eurostat’s database, https://ec.europa.eu/eurostat/data/database, Retrieved on September 11, 2018.
Figure 3. The participation of the KIS sector in employment in Sweden
(data for 2008-2017 and the forecast for 2018-2025)
Source: own calculations based on Eurostat’s database, https://ec.europa.eu/eurostat/data/database, Retrieved on September 11, 2018.
Figure 4. The participation of the KIS sector in employment in the United Kingdom
(data for 2008-2017 and the forecast for 2018-2025)
Source: own calculations based on Eurostat’s database, https://ec.europa.eu/eurostat/data/database, Retrieved on September 11, 2018.
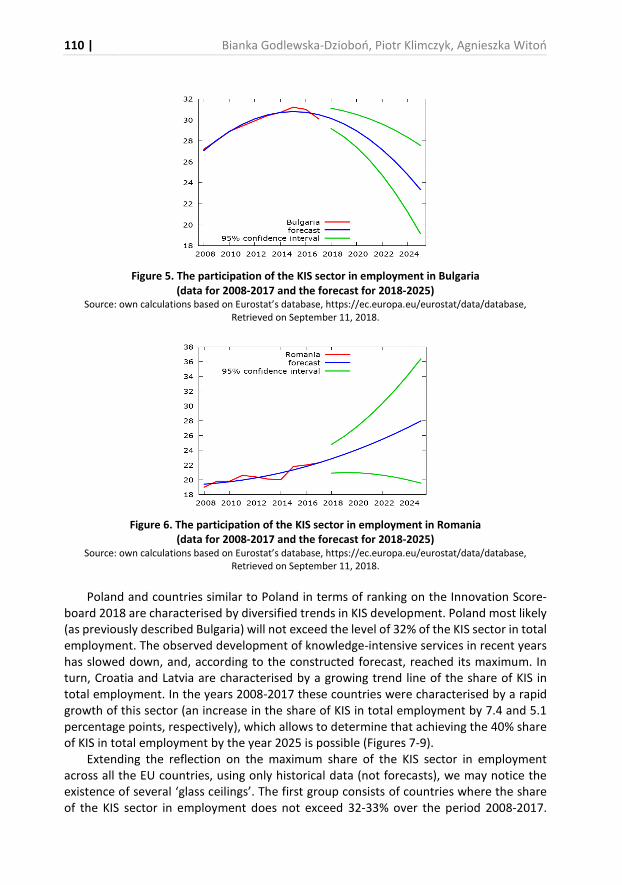
110 | Bianka Godlewska-Dzioboń, Piotr Klimczyk, Agnieszka Witoń
Figure 5. The participation of the KIS sector in employment in Bulgaria
(data for 2008-2017 and the forecast for 2018-2025)
Source: own calculations based on Eurostat’s database, https://ec.europa.eu/eurostat/data/database, Retrieved on September 11, 2018.
Figure 6. The participation of the KIS sector in employment in Romania
(data for 2008-2017 and the forecast for 2018-2025)
Source: own calculations based on Eurostat’s database, https://ec.europa.eu/eurostat/data/database, Retrieved on September 11, 2018.
Poland and countries similar to Poland in terms of ranking on the Innovation Score-board 2018 are characterised by diversified trends in KIS development. Poland most likely (as previously described Bulgaria) will not exceed the level of 32% of the KIS sector in total employment. The observed development of knowledge-intensive services in recent years has slowed down, and, according to the constructed forecast, reached its maximum. In turn, Croatia and Latvia are characterised by a growing trend line of the share of KIS in total employment. In the years 2008-2017 these countries were characterised by a rapid growth of this sector (an increase in the share of KIS in total employment by 7.4 and 5.1 percentage points, respectively), which allows to determine that achieving the 40% share of KIS in total employment by the year 2025 is possible (Figures 7-9).
Extending the reflection on the maximum share of the KIS sector in employment across all the EU countries, using only historical data (not forecasts), we may notice the existence of several ‘glass ceilings’. The first group consists of countries where the share of the KIS sector in employment does not exceed 32-33% over the period 2008-2017.
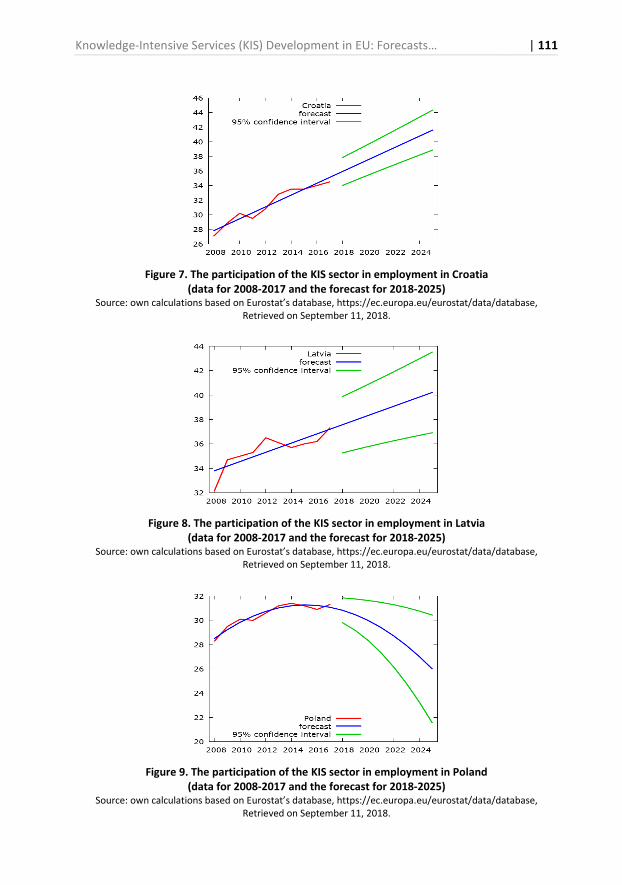
Knowledge-Intensive Services (KIS) Development in EU: Forecasts… | 111
Figure 7. The participation of the KIS sector in employment in Croatia
(data for 2008-2017 and the forecast for 2018-2025)
Source: own calculations based on Eurostat’s database, https://ec.europa.eu/eurostat/data/database, Retrieved on September 11, 2018.
Figure 8. The participation of the KIS sector in employment in Latvia
(data for 2008-2017 and the forecast for 2018-2025)
Source: own calculations based on Eurostat’s database, https://ec.europa.eu/eurostat/data/database, Retrieved on September 11, 2018.
Figure 9. The participation of the KIS sector in employment in Poland
(data for 2008-2017 and the forecast for 2018-2025)
Source: own calculations based on Eurostat’s database, https://ec.europa.eu/eurostat/data/database, Retrieved on September 11, 2018.
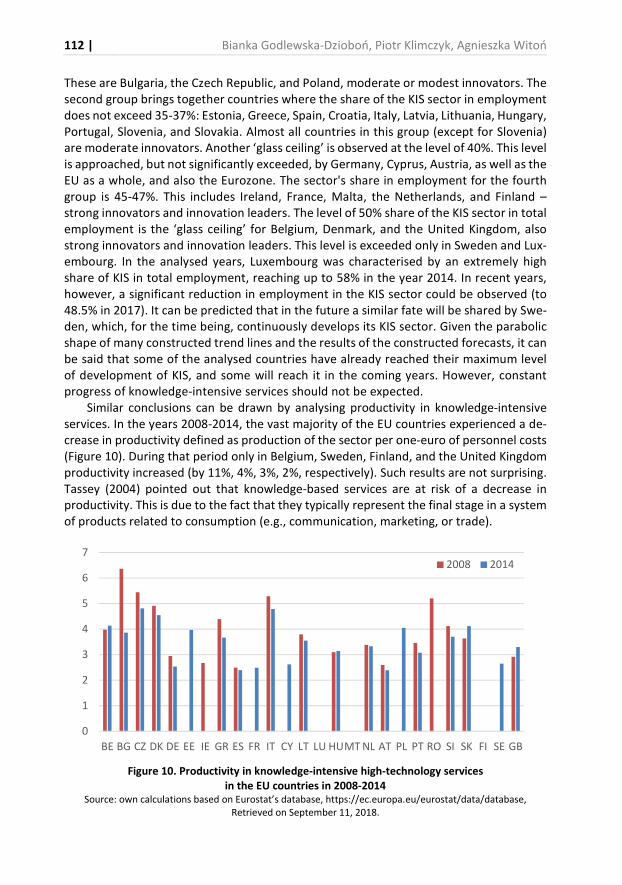
112 | Bianka Godlewska-Dzioboń, Piotr Klimczyk, Agnieszka Witoń
These are Bulgaria, the Czech Republic, and Poland, moderate or modest innovators. The second group brings together countries where the share of the KIS sector in employment does not exceed 35-37%: Estonia, Greece, Spain, Croatia, Italy, Latvia, Lithuania, Hungary, Portugal, Slovenia, and Slovakia. Almost all countries in this group (except for Slovenia) are moderate innovators. Another ‘glass ceiling’ is observed at the level of 40%. This level is approached, but not significantly exceeded, by Germany, Cyprus, Austria, as well as the EU as a whole, and also the Eurozone. The sector's share in employment for the fourth group is 45-47%. This includes Ireland, France, Malta, the Netherlands, and Finland – strong innovators and innovation leaders. The level of 50% share of the KIS sector in total employment is the ‘glass ceiling’ for Belgium, Denmark, and the United Kingdom, also strong innovators and innovation leaders. This level is exceeded only in Sweden and Lux-embourg. In the analysed years, Luxembourg was characterised by an extremely high share of KIS in total employment, reaching up to 58% in the year 2014. In recent years, however, a significant reduction in employment in the KIS sector could be observed (to 48.5% in 2017). It can be predicted that in the future a similar fate will be shared by Swe-den, which, for the time being, continuously develops its KIS sector. Given the parabolic shape of many constructed trend lines and the results of the constructed forecasts, it can be said that some of the analysed countries have already reached their maximum level of development of KIS, and some will reach it in the coming years. However, constant progress of knowledge-intensive services should not be expected.
Similar conclusions can be drawn by analysing productivity in knowledge-intensive services. In the years 2008-2014, the vast majority of the EU countries experienced a de-crease in productivity defined as production of the sector per one-euro of personnel costs (Figure 10). During that period only in Belgium, Sweden, Finland, and the United Kingdom productivity increased (by 11%, 4%, 3%, 2%, respectively). Such results are not surprising. Tassey (2004) pointed out that knowledge-based services are at risk of a decrease in productivity. This is due to the fact that they typically represent the final stage in a system of products related to consumption (e.g., communication, marketing, or trade).
Figure 10. Productivity in knowledge-intensive high-technology services
in the EU countries in 2008-2014
Source: own calculations based on Eurostat’s database, https://ec.europa.eu/eurostat/data/database, Retrieved on September 11, 2018.
0
1
2
3
4
5
6
7
BE BG CZ DK DE EE IE GR ES FR IT CY LT LU HUMT NL AT PL PT RO SI SK FI SE GB
2008 2014
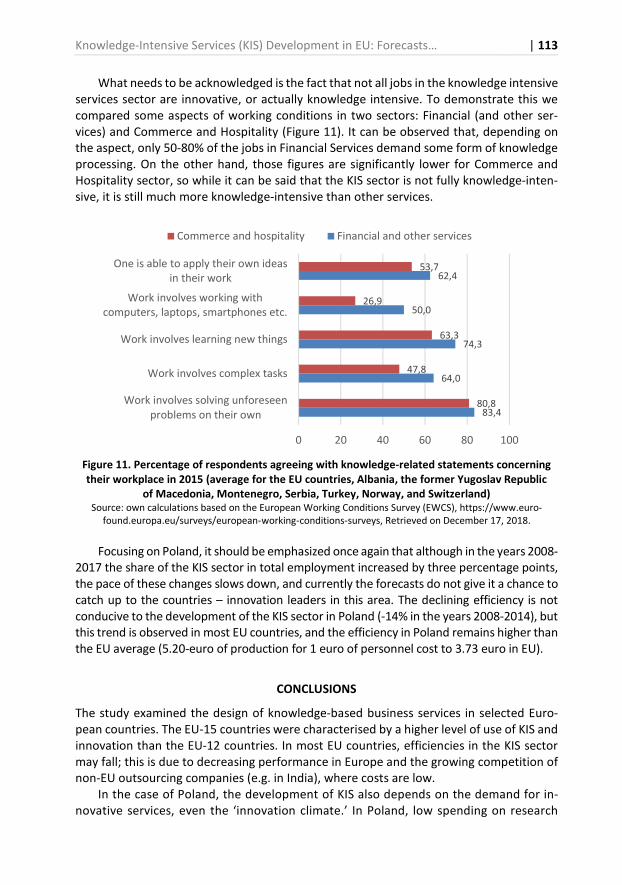
Knowledge-Intensive Services (KIS) Development in EU: Forecasts… | 113
What needs to be acknowledged is the fact that not all jobs in the knowledge intensive services sector are innovative, or actually knowledge intensive. To demonstrate this we compared some aspects of working conditions in two sectors: Financial (and other ser-vices) and Commerce and Hospitality (Figure 11). It can be observed that, depending on the aspect, only 50-80% of the jobs in Financial Services demand some form of knowledge processing. On the other hand, those figures are significantly lower for Commerce and Hospitality sector, so while it can be said that the KIS sector is not fully knowledge-inten-sive, it is still much more knowledge-intensive than other services.
Figure 11. Percentage of respondents agreeing with knowledge-related statements concerning
their workplace in 2015 (average for the EU countries, Albania, the former Yugoslav Republic
of Macedonia, Montenegro, Serbia, Turkey, Norway, and Switzerland)
Source: own calculations based on the European Working Conditions Survey (EWCS), https://www.euro-found.europa.eu/surveys/european-working-conditions-surveys, Retrieved on December 17, 2018.
Focusing on Poland, it should be emphasized once again that although in the years 2008-2017 the share of the KIS sector in total employment increased by three percentage points, the pace of these changes slows down, and currently the forecasts do not give it a chance to catch up to the countries – innovation leaders in this area. The declining efficiency is not conducive to the development of the KIS sector in Poland (-14% in the years 2008-2014), but this trend is observed in most EU countries, and the efficiency in Poland remains higher than the EU average (5.20-euro of production for 1 euro of personnel cost to 3.73 euro in EU).
CONCLUSIONS
The study examined the design of knowledge-based business services in selected Euro-pean countries. The EU-15 countries were characterised by a higher level of use of KIS and innovation than the EU-12 countries. In most EU countries, efficiencies in the KIS sector may fall; this is due to decreasing performance in Europe and the growing competition of non-EU outsourcing companies (e.g. in India), where costs are low.
In the case of Poland, the development of KIS also depends on the demand for in-novative services, even the ‘innovation climate.’ In Poland, low spending on research
83,4
64,0
74,3
50,0
62,4
80,8
47,8
63,3
26,9
53,7
0 20 40 60 80 100
Work involves solving unforeseenproblems on their own
Work involves complex tasks
Work involves learning new things
Work involves working withcomputers, laptops, smartphones etc.
One is able to apply their own ideasin their work
Commerce and hospitality Financial and other services
114 | Bianka Godlewska-Dzioboń, Piotr Klimczyk, Agnieszka Witoń
and development continues, despite the extensive participation of people with higher education in the labour market, resulting in a significant mismatch between the skills of workforce and business needs.
However, weak signals suggesting a break in the trends presented can be seen. In Eu-rope, this signal is the economic growth that eventually appears after the financial and debt crisis. With a demand-side mechanism, economic growth can revive the KIS sector. In partic-ular, in Poland a significant influx of immigrant workers from non-EU countries (mainly Ukraine) can reduce staff costs in the KIS sector. Migrant workers tend to concentrate in larger cities, and many of them are attending local schools for higher education. This skilled workforce finds employment in outsourcing companies located in Poland, as opposed to pre-vious years, when outsourcing companies moved to non-EU countries seeking lower costs.
The test carried out was not free from research limitations. It should be noted that the time series used to construct the projections were limited due to the availability of data con-cerning the EU's knowledge-intensive sectors; this can affect the accuracy of the results.
It can be concluded that the future standard of living for citizens in the EU will de-pend heavily on the KIS sector and the services sector. Based on the findings, it can be considered that it is essential that policymakers and governments put more emphasis on the development of the sector, notably by offering financial support, incentives and building a favourable political and economic environment for the functioning of KIS and knowledge transfer process. Besides, the development of a knowledge-based economy should also intensify the development of the information and communication sector (ICT). The results of the study can be a signal for innovation policy that it should not only target R&D activities, but also support the development of KIS and innovation systems. It should also be noted that the current technological advances not only allow but also determine the implementation of activities related to the use of artificial intelligence and robotics in organisations. This will be a competitive advantage by reducing the cost of doing business, while at the same time increasing the efficiency of investment. How-ever, it should be remembered that while the introduction of artificial intelligence un-doubtedly contributes to the growth of GDP, it is not possible to downplay ethical issues or the consequences of the social introduction of new technologies.
Concluding, it should be stressed that the providers of business services have a rel-atively high potential to create innovative solutions in their activities. They are quite well prepared for both the infrastructure and the personnel side. There are no signifi-cant financial constraints in this respect, and innovation is regarded as important sup-port for the processes of market competition.
Unexpectedly, however, the market can also hinder innovation development in KIS. Many companies using these services are more valued for their proven, less risk-based solutions. Inherent barriers in customer awareness seem to be the most difficult to over-come, and their recognition requires to conduct research among managers of companies using knowledge-intensive services.
We hope that our article will be an inspiration for further scientific research in the topic of KIS. Due to research limitations we focused only on the main components of the KIS development in the EU countries. The most important questions that should be ad-dressed in the future concern the following issues:
− What creates the glass ceiling in the KIS sector?
Knowledge-Intensive Services (KIS) Development in EU: Forecasts… | 115
− Could the decreases in KIS employment in innovation leader countries be due to automation and AI development?
− What are the possible factors that could help a country to break the forecasted trend?
REFERENCES
Baláž, V. (2004). Knowledge-intensive business services in transition economies. The Service Indus-
tries Journal, 24(4), 83-100, https://doi.org/10.1080/0264206042000275208
Baumol, W.J. (2002). Services as leaders and the leader of the services. In J. Gadrey & F. Gallouj (Eds.), Productivity, Innovation and Knowledge in Services: New Economic & Socio-Economic Ap-
proaches (pp. 147-163), Cheltenham, UK, Northampton, MA, USA: Edward Elgar Publishing..
Bettencourt, L.A., Ostrom, A.L., Brown, S.W., & Roundtree, R.I. (2002). Client co-production in knowledge-intensive business services. California Management Review, 44(4), 100-128.
Bilderbeek, R., den Hertog, P., Marklund, G. & Miles, I. (1998). Services in Innovation Knowledge Intensive Business Services (KIBS) as Co-producers of Innovation, Synthesis Paper SI4S-S3/ 1998. Oslo: Studies in Technology, Innovation and Economic Policy Group, 1-59.
Braga, A., Marques, C.S., & Serrasqueiro, Z. (2017). Internationalisation Strategy of Knowledge-In-tensive Business Services. Journal of the Knowledge Economy, Springer; Portland International Center for Management of Engineering and Technology (PICMET), 9(2), June, 359-377. https://doi.org/10.1007/s13132-017-0461-5
Brenner, T., Capasso, M., Duschl, M., Frenken, K., & Treibich, T. (2018). Causal relations between knowledge-intensive business services and regional employment growth. Regional Studies, 52(2), 172-183, https://doi.org/10.1080/00343404.2016.1265104
Castaldi, C. (2009). The relative weight of manufacturing and services in Europe: An innovation per-spective. Technological Forecasting and Social Change, 76(6), 709-722. https://doi.org/10.1016/j.techfore.2008.08.001
Castellacci, F. (2008). Technological paradigms, regimes and trajectories: Manufacturing and service industries in a new taxonomy of sectoral patterns of innovation. Research Policy, 37(6), 978-994. https://doi.org/10.1016/j.respol.2008.03.011
Desmarchelier, B., Djellal, F., & Gallouj, F. (2013). Knowledge intensive business services and long term growth. Structural Change and Economic Dynamics, 25, 188-205.
Doloreux, D., Shearmur, R., & Rodriguez, M. (2015). Determinants of R&D in knowledge-intensive business services firms, Economics of Innovation and New Technology, 391-404. https://doi.org/10.1080/10438599.2015.1067001
Doloreux, D., & Shearmur, R. (2012). Collaboration, information and the geography of innovation in knowledge intensive business services, Journal of Economic Geography, 12(1), 79-105, https://doi.org/10.1093/jeg/lbr003
Dubosson, M., & Fragniere, E. (2009). The Consequences of Information Overload in Knowledge Based Service Economies: An Empirical Research Conducted in Geneva. Service Science 1(1), 56-62. https://doi.org/10.1287/serv.1.1.56
Gallego, J., & Maroto, A. (2015). The Specialization in Knowledge-Intensive Business Services (KIBS) across Europe: Permanent Co-Localization to Debate. Regional Studies, 49(4), 644-664. https://doi.org/10.1080/00343404.2013.799762
Godlewska-Dzioboń, B., Klimczyk, P., & Witoń, A. (2018). Determinatives of Employment Changes in the Polish Service Sector Between 2005 and 2017. In A. Nalepka, A. Ujwary-Gil (Eds), Business
and Non-profit Organizations Facing Increased Competition and Growing Customers’ Demands
116 | Bianka Godlewska-Dzioboń, Piotr Klimczyk, Agnieszka Witoń
(pp. 519-534). Nowy Sącz; Nowy Targ: Wyższa Szkoła Biznesu – National-Louis University; Foun-dation for the Dissemination of Knowledge and Science ‘Cognitione’.
Hertog, P. (2000). Knowledge intensive business services as co-producers of innovation. Interna-
tional Journal of Innovation Management, 4(4), 491-528.
J-Figueiredo, R., Vieira Neto, J., Gonçalves Quelhas, O.L., & de Matos Ferreira, J.J. (2017). Knowledge Intensive Business Services (KIBS): Bibliometric Analysis And Their Different Behaviors In The Scientific Literature. INMR – Innovation & Management Review, 14(3), 216-225. Retrieved from http://www.revistas.usp.br/rai/article/view/134958 on March 10, 2018.
Klaesson, J., & Norman, T. (2015). Market potential and the employment growth of knowledge-in-tensive services: comparing different geographical resolutions. The Annals of Regional Science, 55(1), October, 157-185. https://doi.org/10.1007/s00168-015-0701-1
Masso, J., & Vahter, P. (2012). The link between innovation and productivity in Estonia´s services sector. Service Industries Journal, 32(16), 2527-2541. https://doi.org/10.1080/02642069. 2011.600444
Miles, I. (2005). Knowledge intensive business services: Prospects and policies. Foresight, 7(6), 39-63, https://doi.org/10.1108/14636680510630939
Miles, I.D., Belousova, V., & Chichkanov, N. (2018). Knowledge intensive business services: ambigui-ties and continuities. Foresight, 20(1), 1-26.
Miles, I., Kastrinos, N., Bilderbeek, R., den Hertog, P., Flanagan, K., Huntink, W., & Bouman, M. (1995). Knowledge-Intensive Business Services: Users, Carriers and Sources of Innovation. European Inno-
vation Monitoring System (EIMS) Publication, 15. European Commission, Brussels, 1-105.
Muller, E., & Zenker, A. (2001). Business services as actors of knowledge transformation: The role of KIBS in regional and national innovation systems. Research Policy, 30(9), 1501-1516.
Musolesi, A., & Huiban, J.P. (2010). Innovation and productivity in knowledge intensive business ser-vices. Journal of Productivity Analysis, 34, 63-81. https://doi.org/10.1007/s11123-009-0163-5
Pauceanu, A.M. (2015). Impact of knowledge intensive businesses services on the economic perfor-mance of sectors and regions in the UE. Africa Development and Resources Research Institute
Journal, Ghana, West Africa, 8(2), 2343-6891.
Radovanović, N., Dmitrović, V., & Žarkić Joksimović, N. (2017). From Knowledge to Innovation and Back: Empirical Testing of Knowledge-Intensive Industries in Serbia. Entrepreneurial Business
and Economics Review, 5(3), 119-131. https://doi.org/10.15678/EBER.2017.050306
Rodriguez, M. (2014). Innovation, Knowledge Spillovers and High-Tech Services in European Re-gions. Inzinerine Ekonomika-Engineering Economics, 25(1), 31-39. https://doi.org/10.5755/j01.ee. 25.1.3207
Schricke, E., Zenker, A., & Stahlecker, T. (2012). Knowledge-intensive (business) services in Europe, Euro-pean Commission, EUR 25189 EN, Brussel, Retrieved from ec.europa.eu/research/innovation-un-ion/pdf/knowledge_intensive_business_services_in_europe_2011. pdf on September 25, 2018.
Tassey, G. (2004). Policy Issues for R&D investment in a knowledge-based economy. Journal of Tech-
nology Transfer, 29(2), 153-185.
Wilks, D.S. (2006). Statistical Methods in the Atmospheric Sciences. Burlington, MA: Academic Press, 1-630, Retrieved from http://danida.vnu.edu.vn/cpis/files/Books /Statistical%20methods %20in%20the%20atmospheric%20sciences,%20D.%20Wilks%20(2ed.,%20I GS%2091,%20Elsev ier,%202006)(ISBN%200127519661)(649s).pdf on September 25, 2018.
Watkins, J.C. (2016). An Introduction to the Science of Statistics: From Theory to Implementation. Preliminary Edition, Tucson, AZ: University of Arizona, 1-429. Retrieved http://math.ari-zona.edu /~jwatkins/statbook.pdf on December 18, 2018.
Knowledge-Intensive Services (KIS) Development in EU: Forecasts… | 117
Wolff, E. (2002). How stagnant are services? In J. Gadrey & F. Gallouj (Eds.), Productivity, innovation
and knowledge in services: new economic and socio-economic approaches. (pp. 3-25), Chelten-ham, UK, Northampton, MA, USA: Edward Elgar Publishing..
Wyszkowska-Kuna, J. (2016). Competitiveness of the New European Union Member States in Inter-national Trade in Knowledge-intensive Business Services. Comparative Economic Research, 19(3), 5-26. https://doi.org/10.1515/cer-2016-0018
Ženka, J., Novotný, J., Slach, O., & Ivan, I. (2017). Spatial Distribution of Knowledge-Intensive Busi-ness Services in a Small Post-Communist Economy. Journal of the Knowledge Economy, Springer; Portland International Center for Management of Engineering and Technology (PIC-MET), 8(2), June, 385-406. https://doi.org/10.1007/s13132-015-0260-9
The copyediting and proofreading of articles in English is financed in the framework of contract No. 913/P-DUN/2019 by the Ministry of Science and Higher Education of the Republic of Poland committed to activities aimed at science promotion.
This publication has been co-financed by the European Commission Representation in Poland. The European Commission, or any person acting on its behalf, is not re-sponsible for the use of the information contained in this publication. This publication reflects the views only of the authors, and the European Commission cannot be held responsible for any use which may be made of the information contained therein.
118 | Bianka Godlewska-Dzioboń, Piotr Klimczyk, Agnieszka Witoń
Authors
The contribution share of authors is equal and amounted to 33% each of them.
Bianka Godlewska-Dzioboń
Master in Economics (Faculty of Economics, specialisation: Accountancy, Cracow University of Economics); PhD in Economics (Cracow University of Economics). Research interests include in-ternational trade, labour market and the structure of economy. Correspondence to: Bianka Godlewska-Dzioboń PhD, Cracow University of Economics, ul. Rako-wicka 27, 31-510 Kraków, Poland, e-mail: [email protected] ORCID http://orcid.org/0000-0001-9668-458X
Piotr Klimczyk
Master in Economics (Faculty of Economics, specialisation: Foreign Trade, Cracow University of Economics); PhD in Economics (Cracow University of Economics). Research interests include in-ternational trade, labour market and the structure of economy. Correspondence to: Piotr Klimczyk, PhD, Cracow University of Economics, Theory of Economics Department, ul. Rakowicka 27, 31-510 Kraków, Poland, e-mail: [email protected] ORCID http://orcid.org/0000-0001-9238-2744
Agnieszka Witoń
Master in Economics (specialisation: International Economics, Jagiellonian University in Cracow); PhD in Economics (Cracow University of Economics). Research interests include economic growth, socio-economic development, and knowledge-based economy. Correspondence to: Agnieszka Witoń, PhD, Cracow University of Economics, Theory of Economics Department, ul. Rakowicka 27, 31-510 Kraków, Poland, e-mail: [email protected] ORCID http://orcid.org/0000-0002-4024-2851
Acknowledgements and Financial Disclosure
The authors would like to thank the anonymous reviewers and the Thematic Editor of EBER for their useful comments, which allowed to increase the quality of this article. The research has been co-financed from funds allocated to the Faculty of Economics and International Relations of the Cracow University of Economics, as part of subsidies for maintaining research potential.
This article has been presented as the academic paper at the scientific conference GLOB2018: “Globalization and Regionalization in the Contemporary World: Competitiveness, Development, Sustainability” organized in Kraków on 21-22 September 2019.
Copyright and License
This article is published under the terms of the Creative Commons Attribution – NoDerivs (CC BY-ND 4.0) License
http://creativecommons.org/licenses/by-nd/4.0/
Published by the Centre for Strategic and International Entrepreneurship – Krakow, Poland
2019, Vol. 7, No. 2 10.15678/EBER.2019.070207
Productivity or the External Environment: Which is
More Important for Growth in Emerging Markets?
Dzmitry Kruk
A B S T R A C T
Objective: Assessing and comparing growth promoting effects associated with
productivity determinants and external environment determinants in 34 emerging
market economies.
Research Design & Methods: The study is based on growth regression research design.
Two different modelling frameworks – panel OLS and Arellano-Bond GMM estimator –
are exploited. The study operates with a unique dataset, covering 34 emerging market
economies over 11 years (2007-2017). A traditional set of growth regressors is enriched
by the measures of productivity determinants. A set of country-specific measures of
the external environment stance are computed and exploited in the modelling frame-
work. Moreover, for capturing numerous attributes of growth promoting effects, the
study considers alternative measures of economic growth.
Findings: Both productivity and external environment determinants are meaningful
for growth in emerging market. However, external environment determinants dom-
inate in explaining short-term growth, while productivity determinants are more im-
portant for long-run sustainable growth.
Implications & Recommendations: The importance of external conditions for emerg-
ing markets should not lead us to incorrect belief that productivity fundamentals do
not matter anymore. Changes in the external environment are more likely to generate
relatively short-term growth rate fluctuations. Hence, a country aiming to secure sus-
tainable growth should still first of all think about productivity fundamentals.
Contribution & Value Added: The study allows to explain recent signs of decoupling
between productivity gains and output growth without challenging the foreground
role of productivity for generating growth.
Article type: research article
Keywords: economic growth; TFP; external environment; emerging markets
JEL codes: F43, F44, O47, P24, P27
Received: 30 August 2018 Revised: 15 April 2019 Accepted: 17 April 2019
Suggested citation:
Kruk, D. (2019). Productivity or the External Environment: Which is More Important for Growth in
Emerging Markets?. Entrepreneurial Business and Economics Review, 7(2), 119-139.
https://doi.org/10.15678/EBER.2019.070207
120 | Dzmitry Kruk
INTRODUCTION
As we are close to enter the 4th decade of economic transition in Central and Eastern
Europe (CEE), there is a resurged interest in studies about growth in emerging markets
(EM). To a large extent, it stems from the contradictions and collisions between growth
theory predictions and recent evidence from EM.
The role of productivity (total factor productivity, TFP) gains in EM’s growth tends
to be the central challenge herewith. Growth theory assumes that TFP gains must be
the most powerful channel of growth. Before the Great Recession the majority of em-
pirical studies on emerging markets mainly supported this vision (e.g. Klenow & Rodri-
guez-Clare, 1997; Hall & Jones, 1999). This view became a kind of near-consensus, alt-
hough some influential studies (e.g. Young, 1995) argued that capital accumulation was
the most crucial for growth in EM.
The evidence from the current decade seems to be challenging that near-consensus
on productivity. On the one hand, numerous studies document the deficit of TFP gains
for the bulk of EM after the Great Recession (e.g. IMF, 2015, 2016, 2017; Adler et al.,
2017). On the other hand, EM keep on growing and output growth definitely outpaces
those of productivity (IMF, 2017). Hence, one may argue whether productivity is crucial
for growth in EM any more.
Which growth determinant(s) can explain the mismatch between output and
productivity growth and fill the gap in understanding the sources of growth in EM?
A recent study by IMF (2017) puts external conditions as a key nominee for this role. It
argues that just external conditions have contributed substantially to EM’s growth,
compensating for the lack of productivity gains.
But this kind of response (if accepted) leads to numerous contradictions/challenges.
For instance, whether the growth-enhancing effect of external conditions can be theoret-
ically justified and treated as a persistent substitute to productivity. In practice, the latter
means whether a current growth path in EM is sustainable. From the economic policy per-
spective, it puts the issues of good growth-promoting policies again on the agenda. For
instance, shall a country refocus from productivity enhancers to securing favourable ex-
ternal conditions (e.g. through economic integration, trade agreements, etc.)?
Documented empirical evidence about the importance of external conditions for EM
(e.g. IMF, 2017), is still not the ultimate diagnosis. Studies focused on detecting growth
determinants are very sensitive to exploited data and methodology (Acemoglu, 2009; Cal-
deron, Loyaza, & Shmidt-Hebbel, 2006). Hence, the issue of relative importance of exter-
nal conditions and productivity requires more evidence and research.
This article deals with the subject matter at the ‘primary’ level of growth research, i.e.
at the level of growth determinants. Documenting and assessing explanatory power of
alternative growth determinants usually serves as the basis for further theoretical and em-
pirical research. Barro-style growth regressions (Barro, 1991; 2001) is the core element of
the research design of the study. However, it is enriched by a number of important ingre-
dients. First, it differentiates between a shorter and longer time-horizon in respect to
growth outcomes. Second, a unique dataset has been formed/computed for the study,
which allows to control for a wide set of productivity and external conditions determi-
nants. Third, the study employs alternative estimators – OLS fixed effect framework and
Productivity or the External Environment: Which is More Important for… | 121
GMM Arellano and Bond estimator – for estimating the growth effect of determinants of
interest. Dual estimation framework provides robustness check, on the one hand, and se-
cures enough room for economic interpretations, on the other hand.
The objective of the study is to assess and compare growth-promoting effects associated
with productivity determinants and external environment determinants in 34 emerging mar-
ket economies. Herewith, these two groups of determinants are treated as rivals in a sense.
The rest of the study is organised as follows. Section 2 provides a literature review and
formulates the agenda for this study. Section 3 is devoted to data description and meth-
odological issues. Section 4 reports and discusses the results. Section 5 concludes.
LITERATURE REVIEW
Since Solow (1957) a notion that TFP is the major channel of economic growth has become
a cornerstone of the economic growth theory. The notion was reapproved within the endog-
enous growth concept (e.g. Aghion & Howitt, 1992; Grossman & Helpman, 1991; Romer,
1990). However, empirical evidence on the patterns of economic growth is not that straight-
forward. On the one hand, Hall and Jones (1999), Klenow and Rodriguez-Clare (1997), Wolff
(1991) provide empirical support to the theory. On the other hand, Jorgenson, Ho and Stiroh
(2005), as well as Christensen, Cummings and Jorgenson (1981) oppose it, stating that the
mainstream approach underestimates the role of capital accumulation.
Empirical evidence on growth in EM supplies more food for reflection. Before the Great
Recession, the mainstream approach admitted productivity and determinants behind it as
the key for explaining growth in EM (e.g. Jones, 2016; Klenow & Rodriguez-Clare, 1997). But
herewith the opposing empirical evidence was more convincing, especially at the level of
individual countries. Young (1995), showed that the contribution of TFP to output growth
in ‘Asian tigers’ was ‘not particularly low, …but not extraordinary high’. Torre and Colunga
(2015) showed that in Mexico the contribution of TFP to growth between 1990 and 2011
was negative. Kruk and Bornukova (2014) argued that Belarusian growth was mainly due to
capital accumulation. The estimates by De Gregorio (2018) showed that for numerous EM
TFP gains between 1990 and 2014 were modest.
After the Great Recession the concerns about the role of productivity in EM’s growth
intensified. Empirical evidence signals the lack of productivity gains in EM (IMF, 2015, 2016,
2017; Adler et al., 2017; Nezinsky & Fifekova, 2014). Apart from being crucially important
itself, this challenge gives a rise to at least two additional concerns in respect to EM.
First, it resurges interest in the role of growth channels1 in terms of the growth account-
ing procedure. In other words, if accepting the statement of lowering contribution from
productivity, the point of interest is – which channel(s) has/have substituted the TFP one in
securing growth in 2010s? For instance, IMF (2017) argue that decreasing TFP contribution
during the last 15 years in EM was substituted by the ones associated with capital intensity
1 The sense of terms ‘growth channel (factor)’ and ‘growth determinant’ within this study confirms to the gener-
ally accepted one in the literature (e.g. Barro, 2001; Hall & Jones, 1999; Wong, 2001). The term ‘growth channel
(factor)’ denotes the contribution of accumulation of inputs (labor, capital, human capital) and those of TFP gains
to growth, basing on the growth accounting procedure. The term ‘growth determinant’ denotes forces behind
growth that may affect it through different channels. Sometimes alternative terminology may be used to denote
the same issue. For instance, Acemoglu (2009) denotes growth channels as ‘growth proximates’, while growth
determinants as ‘growth causes’.
122 | Dzmitry Kruk
(mainly) and human capital accumulation (to a lower extent). The latter, if accepted, casts
doubts on the sustainability of this new growth regime, given theoretical considerations.
Second, the generally accepted view on growth determinants becomes questionable.
The bulk of growth determinants highlighted in the literature may be systemised within
three broad groups: institutions (Acemoglu, Johnson, & Robinson, 2001), technologies and
ideas (e.g. Jones, 2016), and allocative efficiency (e.g. Hsieh & Klenow, 2009). The deter-
minants within these groups are usually associated with productivity, i.e. they are treated
to affect growth through the productivity channel. If there are doubts about the produc-
tivity channel itself, these growth determinants should be re-examined as well.
Updating the debate about the role of external conditions in growth performance (e.g.
Calderon et al., 2006; Arora & Vamvakidis, 2005), IMF (2017) argue that just external condi-
tions are the growth determinant that have compensated for the lack of productivity gains.
However, this kind of explanation does not offset all the contradictions mentioned above.
First, if accepting external conditions as an alternative to productivity-based growth, we ac-
tually must match corresponding determinants to other growth channels. Hence, shall we
think about the external environment as the growth determinant acting through (physical or
human) capital accumulation? Nevertheless, the rationale for treating external conditions as
the growth determinant emphasizes its engagement just into the productivity channel of
growth (Arora & Vamvakidis, 2005). Alternatively, shall we think about more sophisticated
mechanisms of the impact of the external environment on productivity?
Second, presumably weakening growth and the strengthening role of external conditions
are the phenomena that should be considered in different time dimensions. Treating external
conditions as the determinant of long-term growth does not seem evident per se. Justification
for linkages between the external environment and long-term growth mainly covers such in-
stitutional features of external engagement as trade and financial openness (e.g. Dollar &
Kraay, 2003; Edison, Klein, Ricci, & Slok, 2002). But as Calderon et al. (2006). show, even
these linkages are not robust. In turn, matching such indicators of the external environment
as the stance of external demand, trade conditions, financial conditions (e.g. IMF, 2017; Arora
& Vamvakidis, 2005) to long-term growth outcomes might be even less theoretically justified.
On the contrary, matching them to business cycle /short-term output fluctuations tends to be
more natural (e.g. Paweta, 2018; Kaminsky, Reinhart, & Vegh, 2004).
Studying productivity and external conditions at the level of growth determinants (i.e.
assessing and comparing their growth promoting effect) might be an important step to
assemble the growth puzzle in EM in the last decade. According to Acemoglu (2009, p. 15),
this approach serves as ‘the input into the types of theories that we would like to develop’.
The approach is based on growth regressions pioneered by Barro (1991, 2001) as a tool for
studying a conditional distribution of income among countries. However, it requires proper
fine-tuning according to the pursued objective.
MATERIAL AND METHODS
Methodology
The central element of the research design for this article is the growth regression ap-
proach. The original Barro growth regression framework may be summarised as follows
(Acemoglu, 2009, p. 83):
Productivity or the External Environment: Which is More Important for… | 123
��,�,��� = � ∗ log (��,���) + β ∗ ��,�+��,� (1)
where:
��� - output (per capita) growth rate;
��,��� - level of output (per capita);
�, β - coefficient and matrix of coefficients;
��,� - growth determinants;��,� - error term.
However, three types of concerns are associated with this framework. First, nu-
merous technical drawbacks may cast doubts on the results. Acemoglu (2009) summa-
rises these drawbacks for the case of original specification and estimating through OLS
as: (a) endogeneity; (b) room for misinterpretation of the economic sense of regression
coefficients; (c) weak theoretical background of the approach for open economies.
Hence, proper specification of growth regression and estimation technique are criti-
cally important for the robustness of the results.
Second, a proper measure of growth on the left-hand side of the regression matters
as well. Recalling the concerns about proper matching of external conditions to growth
outcomes (either to business cycle or to long-term growth) makes the distinction be-
tween output growth rates by time-horizon reasonable. Furthermore, for international
comparisons a standard measure of growth (based on domestic SNA statistics) might
also contain some drawbacks.
Third, the approach is extremely sensitive to the bundle of the growth determinants
considered. Calderon et al. (2004) show that contradictions among researchers on
growth determinants often occur because they operate with different sets of ‘nominees’
for growth determinants. For instance, Rodrick, Subramanian and Trebbi (2004) oppose
the results of previous research arguing that ‘once institutions are controlled for … it
‘trumps’ everything else’. Hence, the initial set of growth determinants ‘nominees’ mat-
ters and should reflect and correspond to the objectives of the exercise. Similar to this
logic, incorporation of growth determinants closely linked with productivity into growth
regressions with ‘standard’ determinants (including those associated with external con-
ditions) might be an important step for puzzling out the collisions between productivity
and external conditions in the context of growth in EM.
Bearing these caveats in mind, the growth regression approach in this study is en-
riched with three additional important ingredients. First, two alternative specifications for
growth regressions are exploited – panel OLS fixed effects estimator and Arellano-Bond
estimator. The former is better for the economic interpretation and decomposition of ac-
tual growth by determinants. The latter is econometrically robust, and serves as the ro-
bustness check for the former. Second, the study differentiates among output growth
measures (left-hand side of growth regression) in two dimensions: time-horizon and the
concept of measurement. Third, following the objective of the study, two groups of ‘nom-
inees’ for growth determinants are considered – external conditions and productivity de-
terminants. They are treated as ‘rivals’ in explaining growth outcomes in EM. An important
novelty herewith is engaging numerous variables associated with productivity as potential
growth determinants into the scope of analysis. Moreover, a unique database of external
conditions indicators was formed for the study. Computing procedures for these variables
aim at securing their exogeneity in respect to growth indicators.
124 | Dzmitry Kruk
For mitigating technical drawbacks (b) and (c) of Barro-style growth regression (men-
tioned above) the field has worked out an augmented approach that incorporates fixed
effects model. Bearing this in mind, Acemoglu (2009, p. 85) argues that the following
specification is meaningful for studying growth determinants:
log(��,�) = � ∗ log (��,���) + β ∗ ��,�+�� + �� + ��,� (2)
where:
��,� - level of output (per capita);
�, β - coefficient and matrix of coefficients;
��,� - growth determinants; �� - country fixed effect;
μ� - time fixed effect;
��,� - error term.
In many empirical growth studies, to highlight the focus on growth rate (not level) this
framework is modified through rearranging the first term from the right-hand side to the
left-hand one and implicitly implying the restriction of � = 1. Furthermore, for this study
the focus on just two groups of growth determinants and treating them as ‘rivals’ is actu-
alized through the absence of direct control for ‘standard’ growth determinants (e.g. initial
conditions, integration into the global economy, etc.). However, allowing for a constant
term, and both individual cross-section and time fixed effect is expected to capture the
impact of such determinants. Finally, the following framework is employed:
��,� = � + Α ∗ ��,� + Β ∗ Ζ�,� + �� + ��+��,� (3)
where:
��� - output growth indicators;
� - common intercept
Α, B - matrixes of coefficients
��� - the vector of external conditions indicators; �� - the vector of productivity indicators
�� - country-specific fixed effects
�� - time fixed effect
��� - error term.
The specification (3) stems from theoretical considerations (Acemoglu, 2009, p. 85)
and includes fixed effects (both in time and cross-section dimension) by definition.
Hence, OLS fixed effects estimator is applied herewith (without prior econometric spec-
ification tests, e.g. Durbin-Wu-Hausman test).
The specification (3) allows for a meaningful economic interpretation, but there might
be doubts in robustness when estimating this specification. Arellano and Bond (1991)
show that in cases when the panel is dynamic with rather small T and rather large N, the
problem of endogeneity is likely to arise, leading to inconsistent estimates of the model.
They worked out an alternative specification that solves the problem of endogeneity. In
the application to this study Arellano-Bond estimator is specified according to (4). Follow-
ing Arellano and Bond (1991), the specification (4) is estimated using generalised
method of moments (GMM).
The models (3) and (4) are estimated for 4 different measures of output growth rate
(response variables), but with the same explanatory variables. First, output growth rates
Productivity or the External Environment: Which is More Important for… | 125
are differentiated by the time-horizon. The simplest choice for the response variable is an
annual GDP per capita growth rate. However, this rate tends to be too volatile because of
the contribution of the business cycle fluctuations. It is worthwhile to get rid of the latter,
if bearing in mind the focus on the long-term growth. In other words, we should refocus
on the trend2 of GDP and its growth rate. However, Coibion, Gorodnichenko, and Ulate
(2017) show that the vast majority of techniques aiming at getting rid of demand shocks
fail to do so. Moreover, full refocusing on the trend growth rate might lead to ignoring
that part of variation which could be assigned to demand shocks by mistake. So, we have
a kind of a trap. The ‘raw’ measure of output growth is too volatile and includes unneces-
sary fluctuations associated with demand shocks. At the same time, it is doubtful to obtain
a credible measure of trend growth. In this situation, dealing with both time-horizons and
treating corresponding output growth rates as alternative response variables might be
a proper solution. Moreover, considering two time-horizons might be useful for detecting
the properties of the alternative groups of growth determinants.
��,� = Γ ∗ ��,��� + Α ∗ ��,� + Β ∗ Ζ�,� + �� + ��+��,� (4)
where:
��,� - output growth indicators;
��,��� - lagged dependent variable;
Α, Β, Γ - matrixes of coefficients;
��,� - the vector of external conditions indicators; �,� - the vector of productivity indicators;
�� - country-specific fixed effects;
�� - time fixed effect;
��,� - error term.
Second, output growth rates are differentiated by the measurement concept. A ‘stand-
ard’ one employs the growth rates of real GDP per capita for each country. However, these
growth rates might keep too many common factors and ‘traces’ from the external environ-
ment inside themselves. Hence, they might be excessively sensitive to external conditions.
Employing relative indicators of countries’ well-being (with a common numeraire) and
treating corresponding first differences as the measures of growth might eliminate/miti-
gate ‘traces’ from external conditions. Hence, the study also employs the speed of closing
the income gap (i.e. the ratio between the level of GDP per capita in a country vs. the one
in the US3) of a country as the alternative measure of its output growth.
According to this concept, a country can ‘obtain some reward’ for more growth sus-
tainability and less dependence on external shocks. For instance, if a country’s growth is
more stable than the sample average one, but still close to the sample mean, the ‘stand-
ard’ approach would not stress this country from the mass, while this approach would do
this. Moreover, within ‘the speed of closing the income gap’ approach we can obtain
a kind of a natural mechanism for the meaningful comparison of growth in countries with
2 The terms ‘potential output’ and ‘potential growth’ are frequently used in this context, as well. Following the
theoretical definition of ‘potential output’, it might reflect a ‘perfect’ way to remove demand shocks. But in
practice, the term is frequently used in different meanings and I assume different techniques behind it. Hence,
in order to avoid the misuse of the term and emphasize an ‘imperfect’ way of removing demand shocks, I use
a more neutral term – trend output. 3 Levels of GDP per capita measured in Geary-Khamis international dollar (UN, 1992, p. 64)
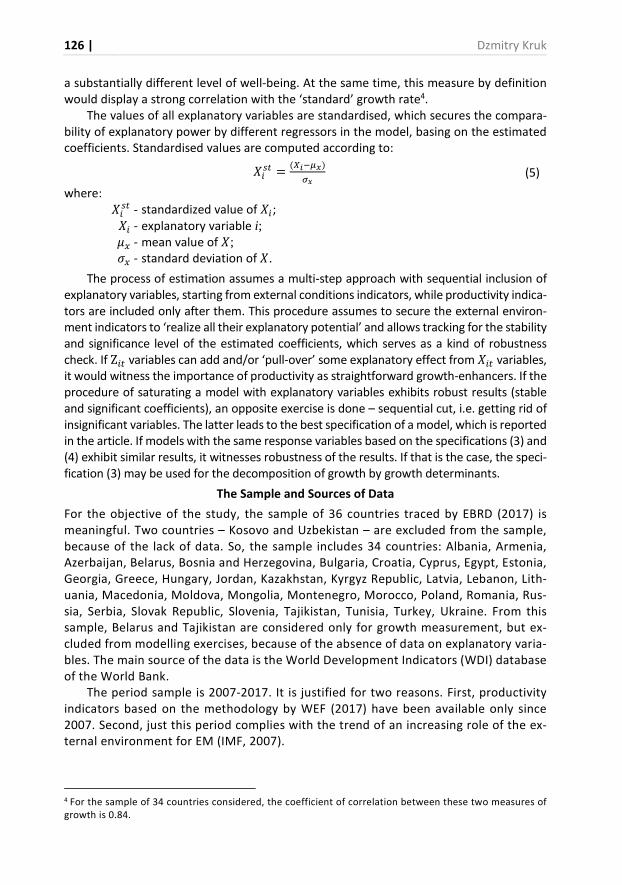
126 | Dzmitry Kruk
a substantially different level of well-being. At the same time, this measure by definition
would display a strong correlation with the ‘standard’ growth rate4.
The values of all explanatory variables are standardised, which secures the compara-
bility of explanatory power by different regressors in the model, basing on the estimated
coefficients. Standardised values are computed according to:
���� = ( !�"#)$#
(5)
where:
���� - standardized value of ��; �� - explanatory variable i; �% - mean value of �; &% - standard deviation of �.
The process of estimation assumes a multi-step approach with sequential inclusion of
explanatory variables, starting from external conditions indicators, while productivity indica-
tors are included only after them. This procedure assumes to secure the external environ-
ment indicators to ‘realize all their explanatory potential’ and allows tracking for the stability
and significance level of the estimated coefficients, which serves as a kind of robustness
check. If Ζ�� variables can add and/or ‘pull-over’ some explanatory effect from ��� variables,
it would witness the importance of productivity as straightforward growth-enhancers. If the
procedure of saturating a model with explanatory variables exhibits robust results (stable
and significant coefficients), an opposite exercise is done – sequential cut, i.e. getting rid of
insignificant variables. The latter leads to the best specification of a model, which is reported
in the article. If models with the same response variables based on the specifications (3) and
(4) exhibit similar results, it witnesses robustness of the results. If that is the case, the speci-
fication (3) may be used for the decomposition of growth by growth determinants.
The Sample and Sources of Data
For the objective of the study, the sample of 36 countries traced by EBRD (2017) is
meaningful. Two countries – Kosovo and Uzbekistan – are excluded from the sample,
because of the lack of data. So, the sample includes 34 countries: Albania, Armenia,
Azerbaijan, Belarus, Bosnia and Herzegovina, Bulgaria, Croatia, Cyprus, Egypt, Estonia,
Georgia, Greece, Hungary, Jordan, Kazakhstan, Kyrgyz Republic, Latvia, Lebanon, Lith-
uania, Macedonia, Moldova, Mongolia, Montenegro, Morocco, Poland, Romania, Rus-
sia, Serbia, Slovak Republic, Slovenia, Tajikistan, Tunisia, Turkey, Ukraine. From this
sample, Belarus and Tajikistan are considered only for growth measurement, but ex-
cluded from modelling exercises, because of the absence of data on explanatory varia-
bles. The main source of the data is the World Development Indicators (WDI) database
of the World Bank.
The period sample is 2007-2017. It is justified for two reasons. First, productivity
indicators based on the methodology by WEF (2017) have been available only since
2007. Second, just this period complies with the trend of an increasing role of the ex-
ternal environment for EM (IMF, 2007).
4 For the sample of 34 countries considered, the coefficient of correlation between these two measures of
growth is 0.84.
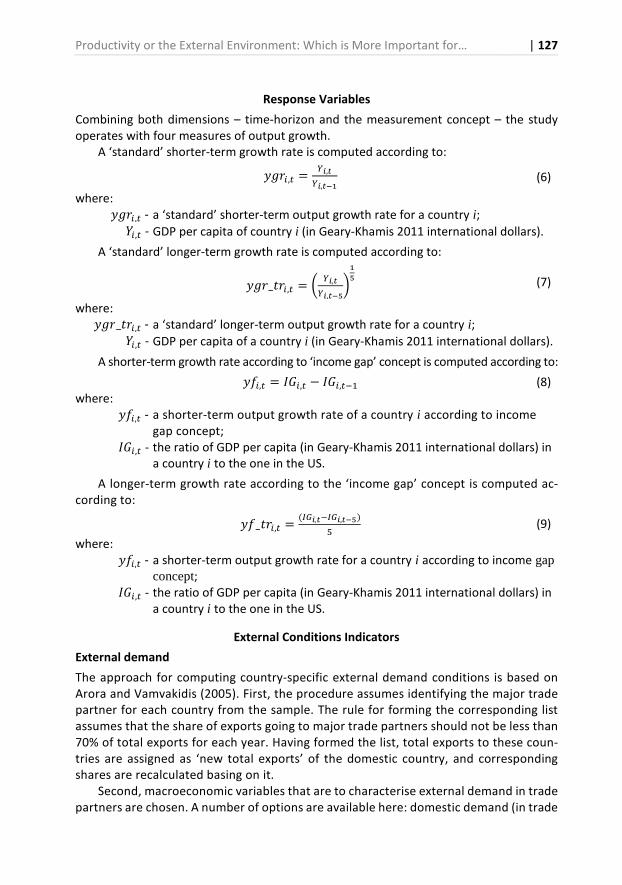
Productivity or the External Environment: Which is More Important for… | 127
Response Variables
Combining both dimensions – time-horizon and the measurement concept – the study
operates with four measures of output growth.
A ‘standard’ shorter-term growth rate is computed according to:
�'(�,� = )!,*)!,*+, (6)
where:
�'(�,� - a ‘standard’ shorter-term output growth rate for a country i;.�,� - GDP per capita of country i (in Geary-Khamis 2011 international dollars).
A ‘standard’ longer-term growth rate is computed according to:
�'(_0(�,� = 1 )!,*)!,*+2
3,2 (7)
where:
�'(_0(�,� - a ‘standard’ longer-term output growth rate for a country i;.�,� - GDP per capita of a country i (in Geary-Khamis 2011 international dollars).
A shorter-term growth rate according to ‘income gap’ concept is computed according to:
�4�,� = 56�,� − 56�,��� (8)
where:
�4�,� - a shorter-term output growth rate of a country i according to income
gap concept;
56�,� - the ratio of GDP per capita (in Geary-Khamis 2011 international dollars) in
a country i to the one in the US.
A longer-term growth rate according to the ‘income gap’ concept is computed ac-
cording to:
�4_0(�,� = (89!,*�89!,*+2): (9)
where:
�4�,� - a shorter-term output growth rate for a country i according to income gapconcept;
56�,� - the ratio of GDP per capita (in Geary-Khamis 2011 international dollars) in
a country i to the one in the US.
External Conditions Indicators
External demand
The approach for computing country-specific external demand conditions is based on
Arora and Vamvakidis (2005). First, the procedure assumes identifying the major trade
partner for each country from the sample. The rule for forming the corresponding list
assumes that the share of exports going to major trade partners should not be less than
70% of total exports for each year. Having formed the list, total exports to these coun-
tries are assigned as ‘new total exports’ of the domestic country, and corresponding
shares are recalculated basing on it.
Second, macroeconomic variables that are to characterise external demand in trade
partners are chosen. A number of options are available here: domestic demand (in trade
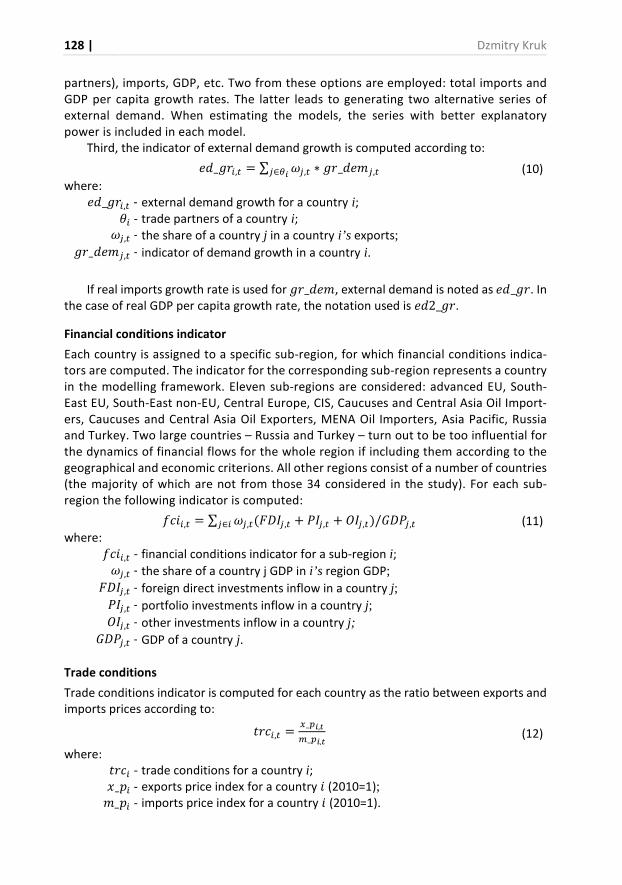
128 | Dzmitry Kruk
partners), imports, GDP, etc. Two from these options are employed: total imports and
GDP per capita growth rates. The latter leads to generating two alternative series of
external demand. When estimating the models, the series with better explanatory
power is included in each model.
Third, the indicator of external demand growth is computed according to:
;<_'(�,� = ∑ >�,� ∗ '(_<;?�,��∈A! (10)
where:
;<_'(�,� - external demand growth for a country i;B� - trade partners of a country i;
>�,� - the share of a country j in a country i’s exports;'(_<;?�,� - indicator of demand growth in a country i.
If real imports growth rate is used for '(_<;?, external demand is noted as ;<_'(. In
the case of real GDP per capita growth rate, the notation used is ;<2_'(.
Financial conditions indicator
Each country is assigned to a specific sub-region, for which financial conditions indica-
tors are computed. The indicator for the corresponding sub-region represents a country
in the modelling framework. Eleven sub-regions are considered: advanced EU, South-
East EU, South-East non-EU, Central Europe, CIS, Caucuses and Central Asia Oil Import-
ers, Caucuses and Central Asia Oil Exporters, MENA Oil Importers, Asia Pacific, Russia
and Turkey. Two large countries – Russia and Turkey – turn out to be too influential for
the dynamics of financial flows for the whole region if including them according to the
geographical and economic criterions. All other regions consist of a number of countries
(the majority of which are not from those 34 considered in the study). For each sub-
region the following indicator is computed:
4DE�,� = ∑ >�,�(FG5�,� + H5�,� + I5�,�)/6GH�,��∈� (11)
where:
4DE�,� - financial conditions indicator for a sub-region i;>�,� - the share of a country j GDP in i’s region GDP;
FG5�,� - foreign direct investments inflow in a country j;H5�,� - portfolio investments inflow in a country j;I5�,� - other investments inflow in a country j;
6GH�,� - GDP of a country j.
Trade conditions
Trade conditions indicator is computed for each country as the ratio between exports and
imports prices according to:
0(D�,� = %_K!,*L_K!,* (12)
where:
0(D� - trade conditions for a country i;M_N� - exports price index for a country E (2010=1);
?_N� - imports price index for a country E (2010=1).
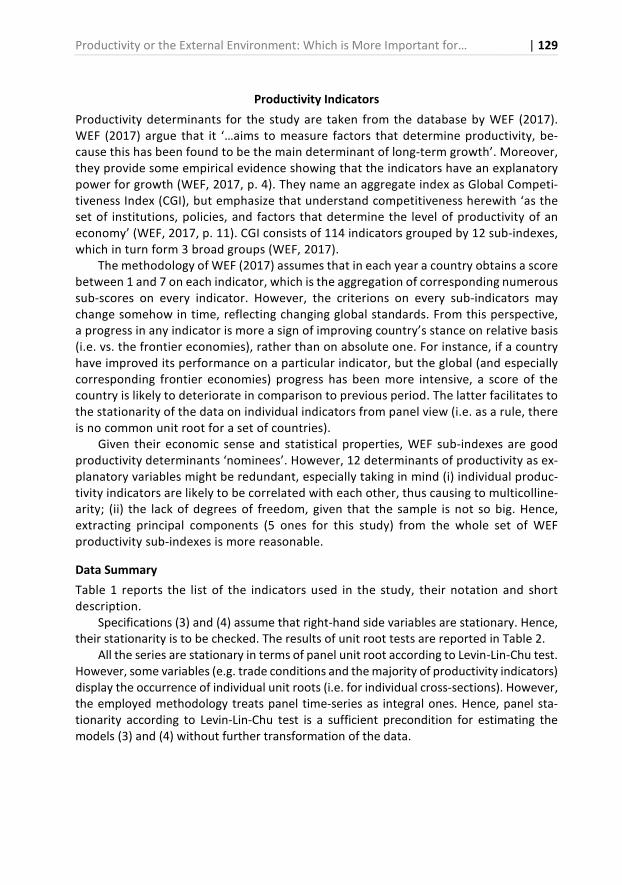
Productivity or the External Environment: Which is More Important for… | 129
Productivity Indicators
Productivity determinants for the study are taken from the database by WEF (2017).
WEF (2017) argue that it ‘…aims to measure factors that determine productivity, be-
cause this has been found to be the main determinant of long-term growth’. Moreover,
they provide some empirical evidence showing that the indicators have an explanatory
power for growth (WEF, 2017, p. 4). They name an aggregate index as Global Competi-
tiveness Index (CGI), but emphasize that understand competitiveness herewith ‘as the
set of institutions, policies, and factors that determine the level of productivity of an
economy’ (WEF, 2017, p. 11). CGI consists of 114 indicators grouped by 12 sub-indexes,
which in turn form 3 broad groups (WEF, 2017).
The methodology of WEF (2017) assumes that in each year a country obtains a score
between 1 and 7 on each indicator, which is the aggregation of corresponding numerous
sub-scores on every indicator. However, the criterions on every sub-indicators may
change somehow in time, reflecting changing global standards. From this perspective,
a progress in any indicator is more a sign of improving country’s stance on relative basis
(i.e. vs. the frontier economies), rather than on absolute one. For instance, if a country
have improved its performance on a particular indicator, but the global (and especially
corresponding frontier economies) progress has been more intensive, a score of the
country is likely to deteriorate in comparison to previous period. The latter facilitates to
the stationarity of the data on individual indicators from panel view (i.e. as a rule, there
is no common unit root for a set of countries).
Given their economic sense and statistical properties, WEF sub-indexes are good
productivity determinants ‘nominees’. However, 12 determinants of productivity as ex-
planatory variables might be redundant, especially taking in mind (i) individual produc-
tivity indicators are likely to be correlated with each other, thus causing to multicolline-
arity; (ii) the lack of degrees of freedom, given that the sample is not so big. Hence,
extracting principal components (5 ones for this study) from the whole set of WEF
productivity sub-indexes is more reasonable.
Data Summary
Table 1 reports the list of the indicators used in the study, their notation and short
description.
Specifications (3) and (4) assume that right-hand side variables are stationary. Hence,
their stationarity is to be checked. The results of unit root tests are reported in Table 2.
All the series are stationary in terms of panel unit root according to Levin-Lin-Chu test.
However, some variables (e.g. trade conditions and the majority of productivity indicators)
display the occurrence of individual unit roots (i.e. for individual cross-sections). However,
the employed methodology treats panel time-series as integral ones. Hence, panel sta-
tionarity according to Levin-Lin-Chu test is a sufficient precondition for estimating the
models (3) and (4) without further transformation of the data.
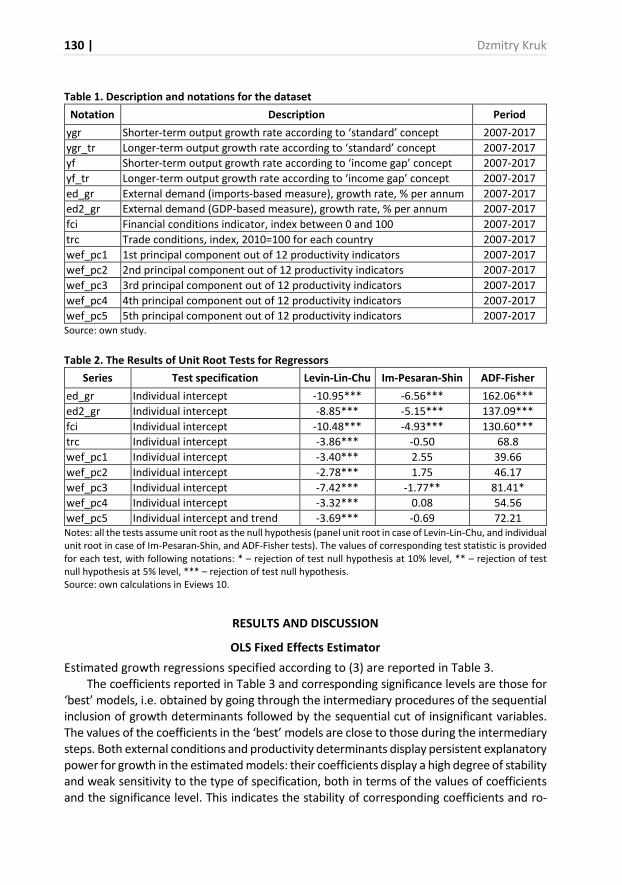
130 | Dzmitry Kruk
Table 1. Description and notations for the dataset
Notation Description Period
ygr Shorter-term output growth rate according to ‘standard’ concept 2007-2017
ygr_tr Longer-term output growth rate according to ‘standard’ concept 2007-2017
yf Shorter-term output growth rate according to ‘income gap’ concept 2007-2017
yf_tr Longer-term output growth rate according to ‘income gap’ concept 2007-2017
ed_gr External demand (imports-based measure), growth rate, % per annum 2007-2017
ed2_gr External demand (GDP-based measure), growth rate, % per annum 2007-2017
fci Financial conditions indicator, index between 0 and 100 2007-2017
trc Trade conditions, index, 2010=100 for each country 2007-2017
wef_pc1 1st principal component out of 12 productivity indicators 2007-2017
wef_pc2 2nd principal component out of 12 productivity indicators 2007-2017
wef_pc3 3rd principal component out of 12 productivity indicators 2007-2017
wef_pc4 4th principal component out of 12 productivity indicators 2007-2017
wef_pc5 5th principal component out of 12 productivity indicators 2007-2017
Source: own study.
Table 2. The Results of Unit Root Tests for Regressors
Series Test specification Levin-Lin-Chu Im-Pesaran-Shin ADF-Fisher
ed_gr Individual intercept -10.95*** -6.56*** 162.06***
ed2_gr Individual intercept -8.85*** -5.15*** 137.09***
fci Individual intercept -10.48*** -4.93*** 130.60***
trc Individual intercept -3.86*** -0.50 68.8
wef_pc1 Individual intercept -3.40*** 2.55 39.66
wef_pc2 Individual intercept -2.78*** 1.75 46.17
wef_pc3 Individual intercept -7.42*** -1.77** 81.41*
wef_pc4 Individual intercept -3.32*** 0.08 54.56
wef_pc5 Individual intercept and trend -3.69*** -0.69 72.21
Notes: all the tests assume unit root as the null hypothesis (panel unit root in case of Levin-Lin-Chu, and individual
unit root in case of Im-Pesaran-Shin, and ADF-Fisher tests). The values of corresponding test statistic is provided
for each test, with following notations: * – rejection of test null hypothesis at 10% level, ** – rejection of test
null hypothesis at 5% level, *** – rejection of test null hypothesis.
Source: own calculations in Eviews 10.
RESULTS AND DISCUSSION
OLS Fixed Effects Estimator
Estimated growth regressions specified according to (3) are reported in Table 3.
The coefficients reported in Table 3 and corresponding significance levels are those for
‘best’ models, i.e. obtained by going through the intermediary procedures of the sequential
inclusion of growth determinants followed by the sequential cut of insignificant variables.
The values of the coefficients in the ‘best’ models are close to those during the intermediary
steps. Both external conditions and productivity determinants display persistent explanatory
power for growth in the estimated models: their coefficients display a high degree of stability
and weak sensitivity to the type of specification, both in terms of the values of coefficients
and the significance level. This indicates the stability of corresponding coefficients and ro-
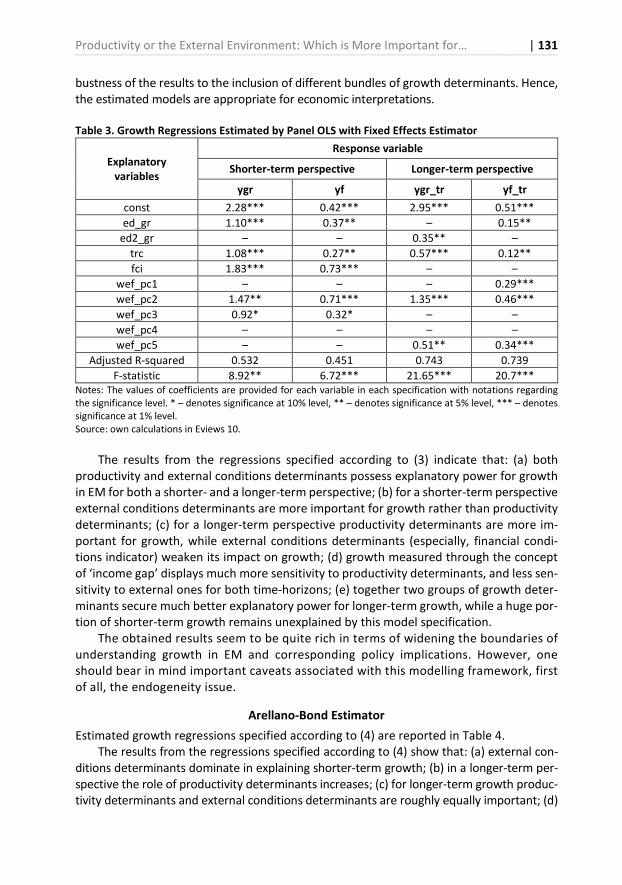
Productivity or the External Environment: Which is More Important for… | 131
bustness of the results to the inclusion of different bundles of growth determinants. Hence,
the estimated models are appropriate for economic interpretations.
Table 3. Growth Regressions Estimated by Panel OLS with Fixed Effects Estimator
Explanatory
variables
Response variable
Shorter-term perspective Longer-term perspective
ygr yf ygr_tr yf_tr
const 2.28*** 0.42*** 2.95*** 0.51***
ed_gr 1.10*** 0.37** – 0.15**
ed2_gr – – 0.35** –
trc 1.08*** 0.27** 0.57*** 0.12**
fci 1.83*** 0.73*** – –
wef_pc1 – – – 0.29***
wef_pc2 1.47** 0.71*** 1.35*** 0.46***
wef_pc3 0.92* 0.32* – –
wef_pc4 – – – –
wef_pc5 – – 0.51** 0.34***
Adjusted R-squared 0.532 0.451 0.743 0.739
F-statistic 8.92** 6.72*** 21.65*** 20.7***
Notes: The values of coefficients are provided for each variable in each specification with notations regarding
the significance level. * – denotes significance at 10% level, ** – denotes significance at 5% level, *** – denotes
significance at 1% level.
Source: own calculations in Eviews 10.
The results from the regressions specified according to (3) indicate that: (a) both
productivity and external conditions determinants possess explanatory power for growth
in EM for both a shorter- and a longer-term perspective; (b) for a shorter-term perspective
external conditions determinants are more important for growth rather than productivity
determinants; (c) for a longer-term perspective productivity determinants are more im-
portant for growth, while external conditions determinants (especially, financial condi-
tions indicator) weaken its impact on growth; (d) growth measured through the concept
of ‘income gap’ displays much more sensitivity to productivity determinants, and less sen-
sitivity to external ones for both time-horizons; (e) together two groups of growth deter-
minants secure much better explanatory power for longer-term growth, while a huge por-
tion of shorter-term growth remains unexplained by this model specification.
The obtained results seem to be quite rich in terms of widening the boundaries of
understanding growth in EM and corresponding policy implications. However, one
should bear in mind important caveats associated with this modelling framework, first
of all, the endogeneity issue.
Arellano-Bond Estimator
Estimated growth regressions specified according to (4) are reported in Table 4.
The results from the regressions specified according to (4) show that: (a) external con-
ditions determinants dominate in explaining shorter-term growth; (b) in a longer-term per-
spective the role of productivity determinants increases; (c) for longer-term growth produc-
tivity determinants and external conditions determinants are roughly equally important; (d)
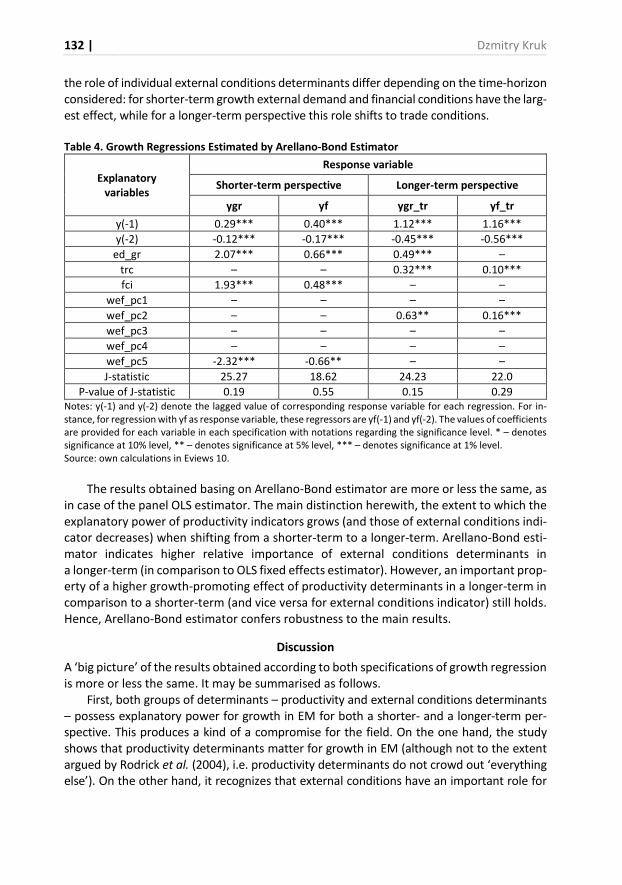
132 | Dzmitry Kruk
the role of individual external conditions determinants differ depending on the time-horizon
considered: for shorter-term growth external demand and financial conditions have the larg-
est effect, while for a longer-term perspective this role shifts to trade conditions.
Table 4. Growth Regressions Estimated by Arellano-Bond Estimator
Explanatory
variables
Response variable
Shorter-term perspective Longer-term perspective
ygr yf ygr_tr yf_tr
y(-1) 0.29*** 0.40*** 1.12*** 1.16***
y(-2) -0.12*** -0.17*** -0.45*** -0.56***
ed_gr 2.07*** 0.66*** 0.49*** –
trc – – 0.32*** 0.10***
fci 1.93*** 0.48*** – –
wef_pc1 – – – –
wef_pc2 – – 0.63** 0.16***
wef_pc3 – – – –
wef_pc4 – – – –
wef_pc5 -2.32*** -0.66** – –
J-statistic 25.27 18.62 24.23 22.0
P-value of J-statistic 0.19 0.55 0.15 0.29
Notes: y(-1) and y(-2) denote the lagged value of corresponding response variable for each regression. For in-
stance, for regression with yf as response variable, these regressors are yf(-1) and yf(-2). The values of coefficients
are provided for each variable in each specification with notations regarding the significance level. * – denotes
significance at 10% level, ** – denotes significance at 5% level, *** – denotes significance at 1% level.
Source: own calculations in Eviews 10.
The results obtained basing on Arellano-Bond estimator are more or less the same, as
in case of the panel OLS estimator. The main distinction herewith, the extent to which the
explanatory power of productivity indicators grows (and those of external conditions indi-
cator decreases) when shifting from a shorter-term to a longer-term. Arellano-Bond esti-
mator indicates higher relative importance of external conditions determinants in
a longer-term (in comparison to OLS fixed effects estimator). However, an important prop-
erty of a higher growth-promoting effect of productivity determinants in a longer-term in
comparison to a shorter-term (and vice versa for external conditions indicator) still holds.
Hence, Arellano-Bond estimator confers robustness to the main results.
Discussion
A ‘big picture’ of the results obtained according to both specifications of growth regression
is more or less the same. It may be summarised as follows.
First, both groups of determinants – productivity and external conditions determinants
– possess explanatory power for growth in EM for both a shorter- and a longer-term per-
spective. This produces a kind of a compromise for the field. On the one hand, the study
shows that productivity determinants matter for growth in EM (although not to the extent
argued by Rodrick et al. (2004), i.e. productivity determinants do not crowd out ‘everything
else’). On the other hand, it recognizes that external conditions have an important role for
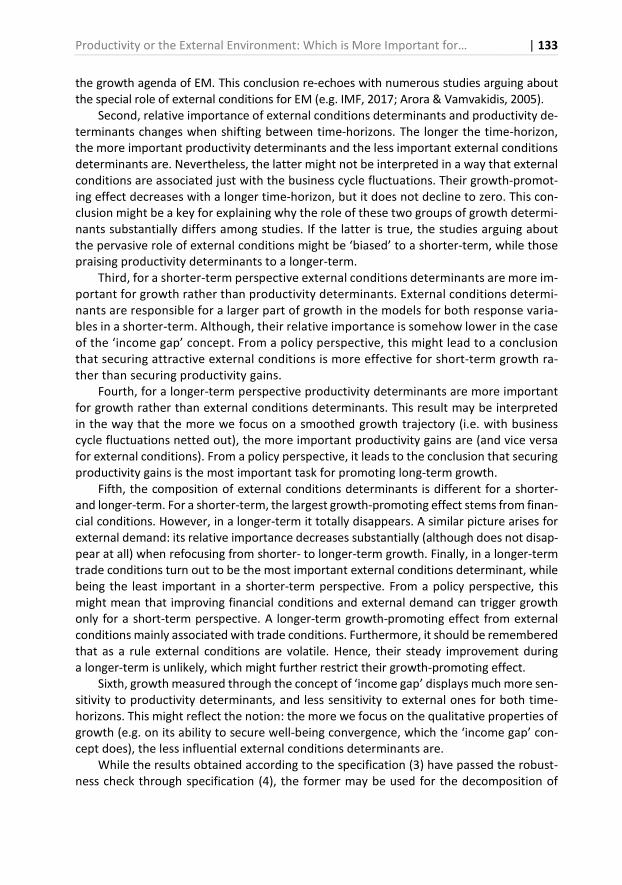
Productivity or the External Environment: Which is More Important for… | 133
the growth agenda of EM. This conclusion re-echoes with numerous studies arguing about
the special role of external conditions for EM (e.g. IMF, 2017; Arora & Vamvakidis, 2005).
Second, relative importance of external conditions determinants and productivity de-
terminants changes when shifting between time-horizons. The longer the time-horizon,
the more important productivity determinants and the less important external conditions
determinants are. Nevertheless, the latter might not be interpreted in a way that external
conditions are associated just with the business cycle fluctuations. Their growth-promot-
ing effect decreases with a longer time-horizon, but it does not decline to zero. This con-
clusion might be a key for explaining why the role of these two groups of growth determi-
nants substantially differs among studies. If the latter is true, the studies arguing about
the pervasive role of external conditions might be ‘biased’ to a shorter-term, while those
praising productivity determinants to a longer-term.
Third, for a shorter-term perspective external conditions determinants are more im-
portant for growth rather than productivity determinants. External conditions determi-
nants are responsible for a larger part of growth in the models for both response varia-
bles in a shorter-term. Although, their relative importance is somehow lower in the case
of the ‘income gap’ concept. From a policy perspective, this might lead to a conclusion
that securing attractive external conditions is more effective for short-term growth ra-
ther than securing productivity gains.
Fourth, for a longer-term perspective productivity determinants are more important
for growth rather than external conditions determinants. This result may be interpreted
in the way that the more we focus on a smoothed growth trajectory (i.e. with business
cycle fluctuations netted out), the more important productivity gains are (and vice versa
for external conditions). From a policy perspective, it leads to the conclusion that securing
productivity gains is the most important task for promoting long-term growth.
Fifth, the composition of external conditions determinants is different for a shorter-
and longer-term. For a shorter-term, the largest growth-promoting effect stems from finan-
cial conditions. However, in a longer-term it totally disappears. A similar picture arises for
external demand: its relative importance decreases substantially (although does not disap-
pear at all) when refocusing from shorter- to longer-term growth. Finally, in a longer-term
trade conditions turn out to be the most important external conditions determinant, while
being the least important in a shorter-term perspective. From a policy perspective, this
might mean that improving financial conditions and external demand can trigger growth
only for a short-term perspective. A longer-term growth-promoting effect from external
conditions mainly associated with trade conditions. Furthermore, it should be remembered
that as a rule external conditions are volatile. Hence, their steady improvement during
a longer-term is unlikely, which might further restrict their growth-promoting effect.
Sixth, growth measured through the concept of ‘income gap’ displays much more sen-
sitivity to productivity determinants, and less sensitivity to external ones for both time-
horizons. This might reflect the notion: the more we focus on the qualitative properties of
growth (e.g. on its ability to secure well-being convergence, which the ‘income gap’ con-
cept does), the less influential external conditions determinants are.
While the results obtained according to the specification (3) have passed the robust-
ness check through specification (4), the former may be used for the decomposition of
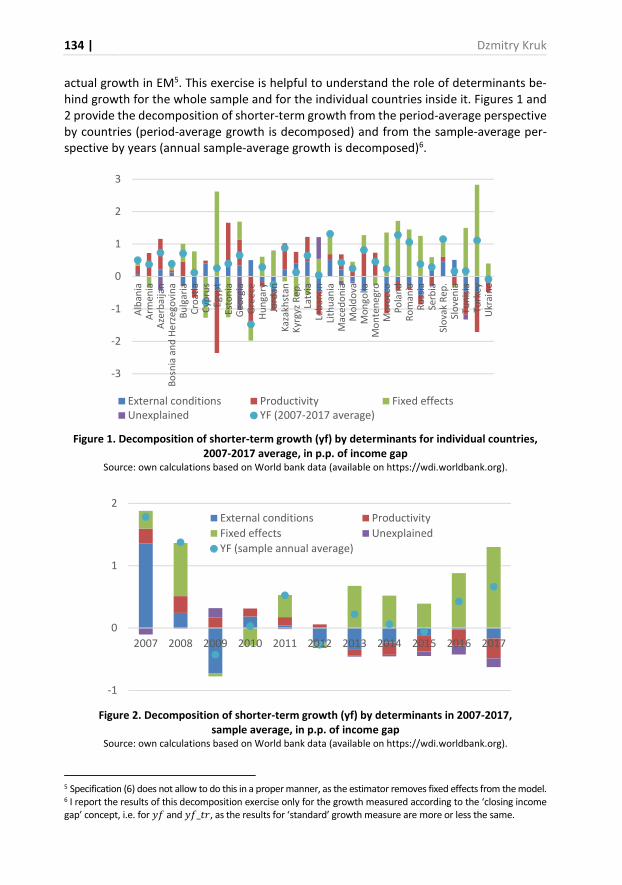
134 | Dzmitry Kruk
actual growth in EM5. This exercise is helpful to understand the role of determinants be-
hind growth for the whole sample and for the individual countries inside it. Figures 1 and
2 provide the decomposition of shorter-term growth from the period-average perspective
by countries (period-average growth is decomposed) and from the sample-average per-
spective by years (annual sample-average growth is decomposed)6.
Figure 1. Decomposition of shorter-term growth (yf) by determinants for individual countries,
2007-2017 average, in p.p. of income gap
Source: own calculations based on World bank data (available on https://wdi.worldbank.org).
Figure 2. Decomposition of shorter-term growth (yf) by determinants in 2007-2017,
sample average, in p.p. of income gap
Source: own calculations based on World bank data (available on https://wdi.worldbank.org).
5 Specification (6) does not allow to do this in a proper manner, as the estimator removes fixed effects from the model. 6 I report the results of this decomposition exercise only for the growth measured according to the ‘closing income
gap’ concept, i.e. for �4 and �4_0(, as the results for ‘standard’ growth measure are more or less the same.
-3
-2
-1
0
1
2
3
Alb
an
iaA
rme
nia
Aze
rba
ija
nB
osn
ia a
nd
He
rze
go
vin
aB
ulg
ari
aC
roa
tia
Cyp
rus
Eg
yp
tE
sto
nia
Ge
org
iaG
ree
ceH
un
ga
ryJo
rda
nK
aza
kh
sta
nK
yrg
yz
Re
p.
Latv
iaLe
ba
no
nLi
thu
an
iaM
ace
do
nia
Mo
ldo
va
Mo
ng
olia
Mo
nte
ne
gro
Mo
rocc
oP
ola
nd
Ro
ma
nia
Ru
ssia
Se
rbia
Slo
va
k R
ep
.S
love
nia
Tu
nis
iaT
urk
ey
Ukra
ine
External conditions Productivity Fixed effects
Unexplained YF (2007-2017 average)
-1
0
1
2
2007 2008 2009 2010 2011 2012 2013 2014 2015 2016 2017
External conditions Productivity
Fixed effects Unexplained
YF (sample annual average)
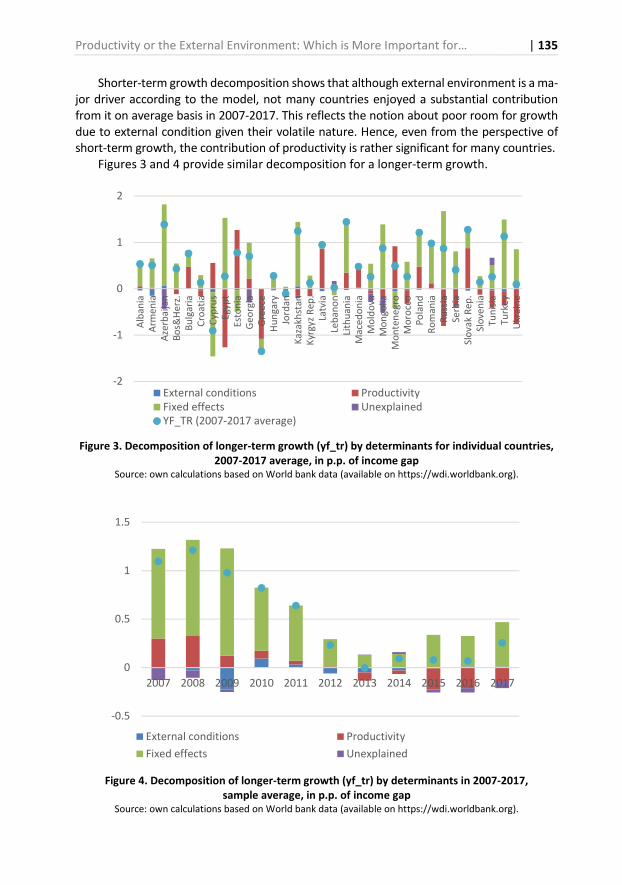
Productivity or the External Environment: Which is More Important for… | 135
Shorter-term growth decomposition shows that although external environment is a ma-
jor driver according to the model, not many countries enjoyed a substantial contribution
from it on average basis in 2007-2017. This reflects the notion about poor room for growth
due to external condition given their volatile nature. Hence, even from the perspective of
short-term growth, the contribution of productivity is rather significant for many countries.
Figures 3 and 4 provide similar decomposition for a longer-term growth.
Figure 3. Decomposition of longer-term growth (yf_tr) by determinants for individual countries,
2007-2017 average, in p.p. of income gap
Source: own calculations based on World bank data (available on https://wdi.worldbank.org).
Figure 4. Decomposition of longer-term growth (yf_tr) by determinants in 2007-2017,
sample average, in p.p. of income gap
Source: own calculations based on World bank data (available on https://wdi.worldbank.org).
-2
-1
0
1
2
Alb
an
ia
Arm
en
ia
Aze
rba
ija
n
Bo
s&H
erz
.
Bu
lga
ria
Cro
ati
a
Cyp
rus
Eg
yp
t
Est
on
ia
Ge
org
ia
Gre
ece
Hu
ng
ary
Jord
an
Ka
zakh
sta
n
Kyrg
yz
Re
p.
Latv
ia
Leb
an
on
Lith
ua
nia
Ma
ced
on
ia
Mo
ldo
va
Mo
ng
olia
Mo
nte
ne
gro
Mo
rocc
o
Po
lan
d
Ro
ma
nia
Ru
ssia
Se
rbia
Slo
va
k R
ep
.
Slo
ve
nia
Tu
nis
ia
Tu
rke
y
Ukra
ine
External conditions Productivity
Fixed effects Unexplained
YF_TR (2007-2017 average)
-0.5
0
0.5
1
1.5
2007 2008 2009 2010 2011 2012 2013 2014 2015 2016 2017
External conditions Productivity
Fixed effects Unexplained
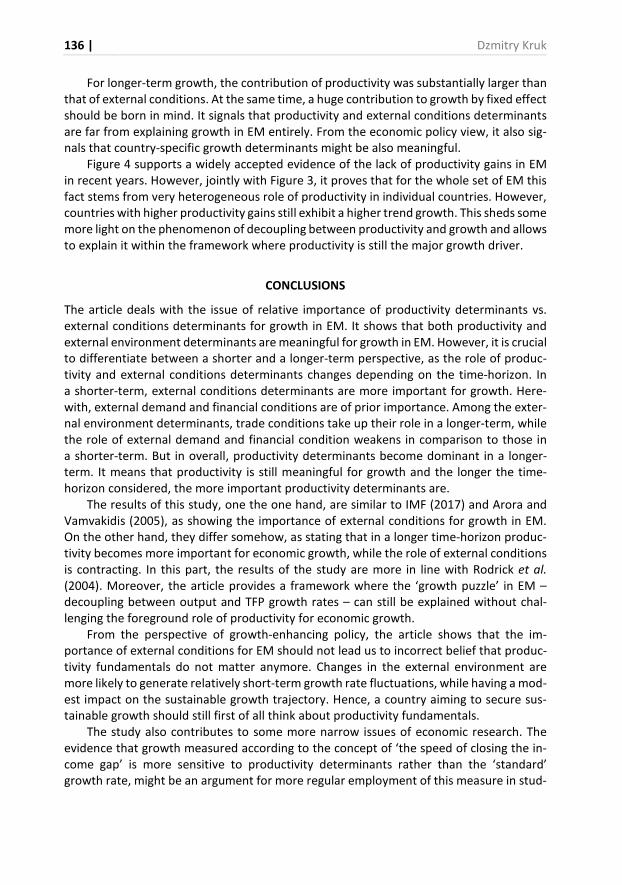
136 | Dzmitry Kruk
For longer-term growth, the contribution of productivity was substantially larger than
that of external conditions. At the same time, a huge contribution to growth by fixed effect
should be born in mind. It signals that productivity and external conditions determinants
are far from explaining growth in EM entirely. From the economic policy view, it also sig-
nals that country-specific growth determinants might be also meaningful.
Figure 4 supports a widely accepted evidence of the lack of productivity gains in EM
in recent years. However, jointly with Figure 3, it proves that for the whole set of EM this
fact stems from very heterogeneous role of productivity in individual countries. However,
countries with higher productivity gains still exhibit a higher trend growth. This sheds some
more light on the phenomenon of decoupling between productivity and growth and allows
to explain it within the framework where productivity is still the major growth driver.
CONCLUSIONS
The article deals with the issue of relative importance of productivity determinants vs.
external conditions determinants for growth in EM. It shows that both productivity and
external environment determinants are meaningful for growth in EM. However, it is crucial
to differentiate between a shorter and a longer-term perspective, as the role of produc-
tivity and external conditions determinants changes depending on the time-horizon. In
a shorter-term, external conditions determinants are more important for growth. Here-
with, external demand and financial conditions are of prior importance. Among the exter-
nal environment determinants, trade conditions take up their role in a longer-term, while
the role of external demand and financial condition weakens in comparison to those in
a shorter-term. But in overall, productivity determinants become dominant in a longer-
term. It means that productivity is still meaningful for growth and the longer the time-
horizon considered, the more important productivity determinants are.
The results of this study, one the one hand, are similar to IMF (2017) and Arora and
Vamvakidis (2005), as showing the importance of external conditions for growth in EM.
On the other hand, they differ somehow, as stating that in a longer time-horizon produc-
tivity becomes more important for economic growth, while the role of external conditions
is contracting. In this part, the results of the study are more in line with Rodrick et al.
(2004). Moreover, the article provides a framework where the ‘growth puzzle’ in EM –
decoupling between output and TFP growth rates – can still be explained without chal-
lenging the foreground role of productivity for economic growth.
From the perspective of growth-enhancing policy, the article shows that the im-
portance of external conditions for EM should not lead us to incorrect belief that produc-
tivity fundamentals do not matter anymore. Changes in the external environment are
more likely to generate relatively short-term growth rate fluctuations, while having a mod-
est impact on the sustainable growth trajectory. Hence, a country aiming to secure sus-
tainable growth should still first of all think about productivity fundamentals.
The study also contributes to some more narrow issues of economic research. The
evidence that growth measured according to the concept of ‘the speed of closing the in-
come gap’ is more sensitive to productivity determinants rather than the ‘standard’
growth rate, might be an argument for more regular employment of this measure in stud-
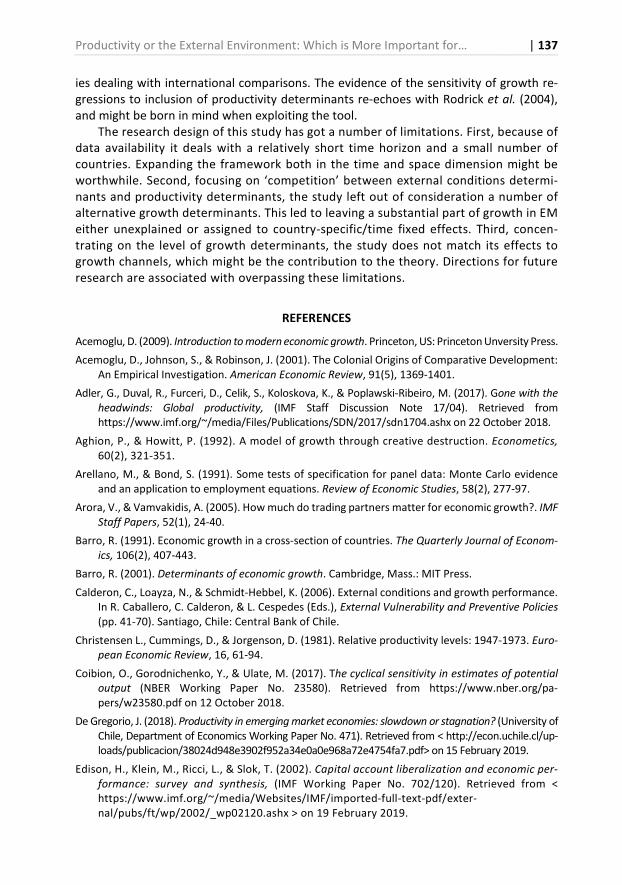
Productivity or the External Environment: Which is More Important for… | 137
ies dealing with international comparisons. The evidence of the sensitivity of growth re-
gressions to inclusion of productivity determinants re-echoes with Rodrick et al. (2004),
and might be born in mind when exploiting the tool.
The research design of this study has got a number of limitations. First, because of
data availability it deals with a relatively short time horizon and a small number of
countries. Expanding the framework both in the time and space dimension might be
worthwhile. Second, focusing on ‘competition’ between external conditions determi-
nants and productivity determinants, the study left out of consideration a number of
alternative growth determinants. This led to leaving a substantial part of growth in EM
either unexplained or assigned to country-specific/time fixed effects. Third, concen-
trating on the level of growth determinants, the study does not match its effects to
growth channels, which might be the contribution to the theory. Directions for future
research are associated with overpassing these limitations.
REFERENCES
Acemoglu, D. (2009). Introduction to modern economic growth. Princeton, US: Princeton Unversity Press.
Acemoglu, D., Johnson, S., & Robinson, J. (2001). The Colonial Origins of Comparative Development:
An Empirical Investigation. American Economic Review, 91(5), 1369-1401.
Adler, G., Duval, R., Furceri, D., Celik, S., Koloskova, K., & Poplawski-Ribeiro, M. (2017). Gone with the
headwinds: Global productivity, (IMF Staff Discussion Note 17/04). Retrieved from
https://www.imf.org/~/media/Files/Publications/SDN/2017/sdn1704.ashx on 22 October 2018.
Aghion, P., & Howitt, P. (1992). A model of growth through creative destruction. Econometics,
60(2), 321-351.
Arellano, M., & Bond, S. (1991). Some tests of specification for panel data: Monte Carlo evidence
and an application to employment equations. Review of Economic Studies, 58(2), 277-97.
Arora, V., & Vamvakidis, A. (2005). How much do trading partners matter for economic growth?. IMF
Staff Papers, 52(1), 24-40.
Barro, R. (1991). Economic growth in a cross-section of countries. The Quarterly Journal of Econom-
ics, 106(2), 407-443.
Barro, R. (2001). Determinants of economic growth. Cambridge, Mass.: MIT Press.
Calderon, C., Loayza, N., & Schmidt-Hebbel, K. (2006). External conditions and growth performance.
In R. Caballero, C. Calderon, & L. Cespedes (Eds.), External Vulnerability and Preventive Policies
(pp. 41-70). Santiago, Chile: Central Bank of Chile.
Christensen L., Cummings, D., & Jorgenson, D. (1981). Relative productivity levels: 1947-1973. Euro-
pean Economic Review, 16, 61-94.
Coibion, O., Gorodnichenko, Y., & Ulate, M. (2017). The cyclical sensitivity in estimates of potential
output (NBER Working Paper No. 23580). Retrieved from https://www.nber.org/pa-
pers/w23580.pdf on 12 October 2018.
De Gregorio, J. (2018). Productivity in emerging market economies: slowdown or stagnation? (University of
Chile, Department of Economics Working Paper No. 471). Retrieved from < http://econ.uchile.cl/up-
loads/publicacion/38024d948e3902f952a34e0a0e968a72e4754fa7.pdf> on 15 February 2019.
Edison, H., Klein, M., Ricci, L., & Slok, T. (2002). Capital account liberalization and economic per-
formance: survey and synthesis, (IMF Working Paper No. 702/120). Retrieved from <
https://www.imf.org/~/media/Websites/IMF/imported-full-text-pdf/exter-
nal/pubs/ft/wp/2002/_wp02120.ashx > on 19 February 2019.
138 | Dzmitry Kruk
Dollar, D., & Kraay, A. (2003). Institutions, trade, and growth. Journal of Monetary Economics,
50(1), 133-162.
EBRD. (2017). Transition report 2017-2018, London, UK: European Bank for Reconstruction and
Development.
Grossman, G., & Helpman, E. (1991). Innovation and growth in the global economy. Cambridge,
MA: MIT Press.
Hall, R., & Jones, C. (1999). Why do some countries produce so much more output per worker than
others?. Quarterly Journal of Economics, 114(1), 83-116.
Hsieh, C., & Klenow, P. (2010). Development Accounting. American Economic Journal: Macroeco-
nomics, 2(1), 207-223.
IMF. (2015). Where are we headed? Perspectives on potential output. In IMF (Ed.), World Economic
Outlook, April, 2015 (pp. 69-110). International Monetary Fund, Washington, DC.
IMF. (2016). How to get back on the fast track? In IMF (Eds.) Regional economic issues: Central, East-
ern and Southeastern Europe, (pp. 18-47). International Monetary Fund, Washington, DC.
IMF (2017). Roads less travelled: growth in emerging markets and developing economies in a com-
plicated external environment. In IMF (Eds.), World economic outlook, April, 2017 (pp. 65-120).
International Monetary Fund, Washington, DC.
Kaminsky, G., Reinhart, C., & Vegh, C. (2004). When it rains, it pours: procyclical capital flows and
macroeconomic policies. NBER Macroeconomics Annual, 19(2004), 11-53.
Jones, C. (2016). The facts of economic growth. In J. Taylor & H. Uhlig (Eds.), Handbook of Macroe-
conomics (pp. 3-69). Philadelphia, PA: Elsevier.
Jorgenson, D.W., Ho, M.S., & Stiroh, K.J. (2005). Growth in U.S. industries and investments in information
technology and higher education. In C. Corrado, J. Haltiwanger, & D. Sichel (Eds.). Measuring capital
in the new economy (pp. 403-478). National Bureau of Economic Research, Cambridge, MA.
Klenow, P., & Rodriguez-Clare, A. (1997). The neoclassical revival in growth economics: has it gone
too far?. (NBER Macroeconomics Annual 1997, 73-114). Retrieved from
https://www.nber.org/chapters/c11037.pdf on 19 September 2018.
Kruk, D., & Bornukova, K. (2014). Belarusian Economic Growth Decomposition, (BEROC Working Pa-
per No. 24). Retrieved from < http://eng.beroc.by/webroot/delivery/files/WP_24_eng_Bornu-
kova&Kruk.pdf> on 15 February 2019.
Nezinsky, E., & Fifekova, E. (2014). The V4: the decade after EU entry, Entrepreneurial Business and
Economic Review, 2(2), 31-46.
Paweta, W. (2018). Impact of the international financial crisis on the business cycle in the Visegrad
group, Entrepreneurial Business and Economic Review, 6(3), 43-58.
Rodrick, D., Subramanian, A., & Trebbi, F. (2004). Institutions rule: the primacy of institutions over ge-
ography and integration in economic development. Journal of Economic Growth, 9(2), 131-165.
Romer, P. (1990). Endogenous technical change. Journal of Political Economy, 98(5), 71-102.
Solow, R. (1957). Technical Change and the Aggregate Production Function. The Review Of Econom-
ics And Statistics, 39(3), 312-320.
Torre, L., & Colunga, L. (2015). Patterns of Total Factor Productivity Growth in Mexico: 1991-2011,
(Banco de Mexica Working Paper No. 2015-24). Retrieved from
http://www.banxico.org.mx/publications-and-press/banco-de-mexico-working-pa-
pers/%7B75BC453F-698E-8AD1-6BC0-5B41E9D85156%7D.pdf on 15 February 2019.
UN. (1992). Handbook of the International Comparison Program, New York, US: United Nations.
Productivity or the External Environment: Which is More Important for… | 139
Wolff, E. (1991). Capital formation and productivity convergence over the long term. American Eco-
nomic Review, 81(3), 565-79.
Wong, W. (2001). The channels of economic growth: a channel decomposition exercise, (National
University of Singapore, Department of Economics Working Paper No. 0101). Retrieved from
http://www.fas.nus.edu.sg/ecs/pub/wp/ wp0101.pdf on 15 February 2019.
World Economic Forum. (2017). The global competitiveness report 2017-2018, Geneva: World
Economic Forum.
Young, A. (1995) The tyranny of the numbers: confronting the statistical realities of the East Asian
growth experience. Quarterly Journal of Economics, 110(3), 641-680.
Author
Dzmitry Kruk
Researcher at Belarusian Economic Research and Outreach Center (BEROC), PhD student in Cra-
cow University of Economics. His research interest includes: growth and finance, growth in
emerging markets, monetary policy.
Correspondence to: Mr. Dzmitry Kruk, BEROC, Gazety Pravda ave. 11-B, Minsk, 220018, Belarus,
e-mail: [email protected]
ORCID http://orcid.org/0000-0003-3770-9323
Acknowledgements and Financial Disclosure
I would like to thank Prof. Marek Dabrowski, Dr. Piotr Stanek and other participants of Interna-
tional Economics Section at 4th International Scientific Conference 2018 held by Cracow Univer-
sity of Economics for their helpful comments and insights.
This article has been presented as the academic paper at the scientific conference GLOB2018:
“Globalization and Regionalization in the Contemporary World: Competitiveness, Development,
Sustainability” organized in Kraków on 21-22 September 2019.
Copyright and License
This article is published under the terms of the Creative Commons
Attribution – NoDerivs (CC BY-ND 4.0) License
http://creativecommons.org/licenses/by-nd/4.0/
Published by the Centre for Strategic and International Entrepreneurship – Krakow, Poland
The copyediting and proofreading of articles in English is financed in the framework
of contract No. 913/P-DUN/2019 by the Ministry of Science and Higher Education
of the Republic of Poland committed to activities aimed at science promotion.
This publication has been co-financed by the European Commission Representation
in Poland. The European Commission, or any person acting on its behalf, is not re-
sponsible for the use of the information contained in this publication. This publication
reflects the views only of the authors, and the European Commission cannot be held
responsible for any use which may be made of the information contained therein.

2019, Vol. 7, No. 2 10.15678/EBER.2019.070208
The Capacity of JESSICA Projects to Repay Loans Based on Own Revenues
Piotr Idczak, Ida Musiałkowska
A B S T R A C T
Objective: Objectives of the article are the following: to identify 1) similarity/ dissimi-larity in Polish regions with regard to the implementation of JESSICA projects in terms of the size of JESSICA loans/ projects and the legal form of beneficiaries, 2) what factors have the biggest impact on the project capacities to generate revenues.
Research Design & Methods: The authors used the logistic regression to build a model showing the association of the variables analysed on the dependent variable. In addi-tion, to point out a relative importance from all possible orderings of explanatory vari-ables and to show the most important one(s), ANOVA method was applied.
Findings: Not all the projects co-financed under the JESSICA initiative bring revenues from their main operations. The legal form of a beneficiary plays an important role. Both projects implemented by companies and projects of a relatively high value increase the probability of generating revenues. Location of the project (capital city/ non-capital city of the region) is not significant with regard to capacities to generate revenues.
Implications & Recommendations: JESSICA projects characterised with a high value and implemented by entities having the company status involve private capital and consequently generate capital backflows. They contribute to leverage effects and thereby raise the role of JESSICA as a powerful instrument aimed at rendering existing market failures. It seems that the results of the study might help to design the use of JESSICA resources in the current and the future EU financial perspective.
Contribution & Value Added: The article sheds more light on a still under-researched area of the use of financial instruments in the EU Cohesion Policy. The analysis provides pioneering results and points out the vital issues for future research.
Article type: research article
Keywords: JESSICA; Poland; regeneration; revenue-generating projects; Cohe-sion Policy
JEL codes: R51, R53, R58, F36, H43
Received: 30 August 2018 Revised: 20 March 2019 Accepted: 26 March 2019
Suggested citation: Idczak, P., & Musiałkowska, I. (2019). The Capacity of JESSICA Projects to Repay the Loans Based on Own Revenues. Entrepreneurial Business and Economics Review, 7(2), 141-157. https://doi.org/10.15678/EBER.2019.070208
142 | Piotr Idczak, Ida Musiałkowska
INTRODUCTION
Urban areas, being in the focus of the study, require investment in urban infrastructure, heritage and cultural sites, deprived areas, housing, etc. Nevertheless, the financial re-sources of public and private entities have not been sufficient to respond to high de-mand in cities. Apart from grants and loans coming from the banking sector, there has been a new initiative introduced at the European level by the European Commission together with two public banks: the European Investment Bank and the Council of Eu-rope Development Bank – the JESSICA (Joint European Support for Sustainable Invest-ment in City Areas) initiative. The support offered under JESSICA is based on the use of the Cohesion Policy structural funds in a form of repayable financing. There are, how-ever, still surprisingly few studies looking into a different nature of such financial aid (Bode, 2015; Dąbrowski, 2014, 2015; Fotino, 2014; Musiałkowska & Idczak, 2016; Nadler & Nadler, 2018). The majority of evaluation reports were done before or in the mid 2007-2013 financial perspective – for Śląskie and Pomorskie regions (CCI, 2010; EIB, 2010b) or Mazowieckie Region (EIB, 2011) and do not provide answers to in-depth research questions regarding e.g. the capacities of projects to ensure the repayability of JESSICA funding.
As reported by the authors in a previous study, one out of three projects imple-mented within the framework of JESSICA initiative does not generate any revenues (Musiałkowska & Idczak, 2019). In addition, these preliminary findings suggest that the most desired projects from the JESSICA perspective are those of a high value and de-signed by private entities. These kinds of projects not only can provide revenues needed to fully cover the operating costs but also to ensure the repayment of the loan. To the authors’ knowledge, there is no other empirical study to date that has consid-ered JESSICA from the point of view of the project implementation. Therefore, the main objective of this study is to investigate the impact factors that may affect the capacities of the projects to generate revenues on the basis of their primary business activities. Special interest is in how variables such as the legal form of the beneficiary, project location, project value, value of the JESSICA loan, the region implementing the JESSICA initiative, the bank providing JESSICA loan influence the project capacities to generate own revenues, if any.
We concentrate on this intuitively obvious issue, taking into account the fact that the basic tasks of the JESSICA initiative are to develop an effective process for supporting ur-ban development by revolving funds and to enhance and accelerate a potential for new investments in urban areas. According to the preliminary rules, only projects that generate return flows are eligible for funding offered by this instrument and the repayment should be achieved either in the form of solely commercial returns or project revenues secured directly by investors from other sources (Musiałkowska & Idczak, 2018a). In our previous study we found out that not all projects bring revenues from the commercial returns and that the form of a beneficiary (public or private) matters. Thus, in order to achieve the objective set out, this study seeks to address the following specific issues: Which of the variables analysed significantly contributes to achieving capacities to generate own reve-nues by JESSICA projects? Which of the variables considered has the greatest impact on
The Capacity of JESSICA Projects to Repay Loans Based on Own Revenues | 143
the project capacity to generate own revenues? Are there any differences between re-gions with regard to the number of projects that have received revenues from primary business activities? How does the project capacity to generate own revenues vary spatially in particular regions? Which projects meet the JESSICA requirements to the greatest pos-sible extent? By providing answers to these questions, the study can shed further light in the debate on the implementation of revolving instruments in the regional and urban pol-icy. Moreover, our study provides further evidence for the functioning of the JESSICA ini-tiative and thereby bridges a gap in the literature on it.
The article is structured as follows. Section two describes briefly the JESSICA initiative in Poland. Section three provides details on data and methodology and is followed by section four that outlines the results and discusses the factors mostly influencing a pro-ject capacity to generate own revenues. The final section concludes with a brief discus-sion on the implications of the findings for the policy practice.
LITERATURE REVIEW
This new and innovative initiative – JESSICA – was created in order to increase the amount of money for investments related to sustainable development and regeneration processes in cities in the 2007-2013 financial perspective. The initiative that is imple-mented in the framework of the Cohesion Policy uses the resources of one of the struc-tural funds – the European Regional Development Fund – in the form of revolving in-struments (loans, guarantees), allowing for e.g. achieving the multiplier effect of the actions implemented (Memorandum of Understanding, 2006). JESSICA was developed by the European Commission in cooperation with the European Investment Bank (EIB) – which can act as a trust fund manager and which works in cooperation with the Council of Europe Development Bank (CEB). In the years 2007-2013, this initiative was applied in 11 EU countries, including Poland (European Commission, 2014). In all five Polish re-gions: Mazowieckie, Pomorskie, Śląskie, Wielkopolskie, and Zachodniopomorskie that decided to implement JESSICA, the EIB was a beneficiary of the measures of regional operational programmes and performed a function of the so-called holding fund that cooperated with the specialised Urban Development Funds (that is: Bank Gospodarstwa Krajowego – BGK, Bank Ochrony Środowiska – BOŚ and Bank Zachodni WBK S.A. – BZWBK S.A.), namely entities responsible for the selection of projects and providing co-financing to them (Musiałkowska & Idczak, 2018a).
JESSICA involved repayable funding which, contrary to grant-based assistance com-monly available within the framework of CP, was intended to provide in general private investors with incentives to encourage them to develop projects aimed at redressing imbalances in urban areas (Nadler & Kreuz, 2011). The main strength of such a kind of funding was to trigger the catalytic effect of private as well as public capital available on the market, and thereby leverage other resources, in addition to EU Structural Funds, for urban renewal. The basic rule relies here on reinvesting both revenues generated by the investments and the reimbursement of principal amount in other urban projects (EIB, 2010a, pp. 45-48). This, in turn, means that only projects generating return flows, that is repayable investments, in principle can be financed from JESSICA funds (Mazars, 2013, pp. 10-11). Since the generation of capital backflows is mandatory, projects should show an adequate level of financial profitability. In other words, they should ensure, in
144 | Piotr Idczak, Ida Musiałkowska
a dynamic capital budgeting analysis, cash inflows raising from sale revenues (i.e. flows directly paid by users for the goods or services provided by particular projects) that allow for retaining the profitability within the meaning of the financial internal rate of return (Arup, 2009, pp. 44-46; Nadler & Nadler, 2018). In this context, projects should be char-acterised by a long-term viability and demonstrate a high self-financing level. Moreover, JESSICA was deemed to be a powerful catalyst for mobilising additional financial re-sources to encourage public-private partnership (PPP) solutions focused on the imple-mentation of urban development projects (Held & Jakubowski, 2009).
JESSICA, in general, supports projects in the following areas: urban infrastructure (includ-ing for transport, water and sewage systems or power), heritage or places relevant to culture (contributing to the development of tourism or another permanent use), development of brownfield sites (including cleaning and decontamination of the areas), creation of new com-mercial premises for small and medium-sized enterprises, development of information tech-nology and research and development works, expansion of university buildings and improving energy efficiency (European Commission, 2013a). Almost all types of legal persons enumer-ated in the Polish law were eligible to apply for funds (for more see sections 3-4).
According to the European authorities involved in the design of the Cohesion Policy, this initiative should bring a number of benefits, of which the most important are the following (European Commission, 2013b):
− generating profits through projects implemented using financial engineering instru-ments,
− occurrence of leverage – by combining structural funds with other existing sources of funding,
− the initiative is to provide flexibility in structural terms regarding the usage of funds (in the form of equity, debt or guaranteed investments, which can be adapted to the spe-cific needs of countries and regions),
− gaining know-how from private investors, which aims to facilitate the acquisition of fur-ther investments in the coming years and provide technical and financial performance in the implementation phase of the project and during its management,
− an increase in establishing partnerships between stakeholders such as: countries, re-gions, cities, EIB, CEB, other banks, investors, in order to solve problems of urban areas,
− emphasis put on the so-called social aspect of the projects, estimated based on the advantage of positive externalities of an urban project (the so-called social elements) over the commercial part of an investment,
− bigger complexity and diversity of the projects when comparing to the grant system (e.g. shopping malls, business incubators, office space, dormitories, hotels, under-ground parking, etc.).
The values of the available funds under JESSICA differed among the regions. Wielko-polskie region allocated the biggest amount of 66.3 mln EUR, while Zachodniopomorskie region allocated the lowest amount that accounted for half of Wielkopolskie region allo-cation, namely 30 mln EUR (Musiałkowska & Idczak, 2018a). The projects of the highest values (and the highest value of the JESICA loan) were implemented in Zachodniopomor-skie region, whereas the biggest differentiation in terms of the project values was ob-served in Pomorskie region (Figure 1).
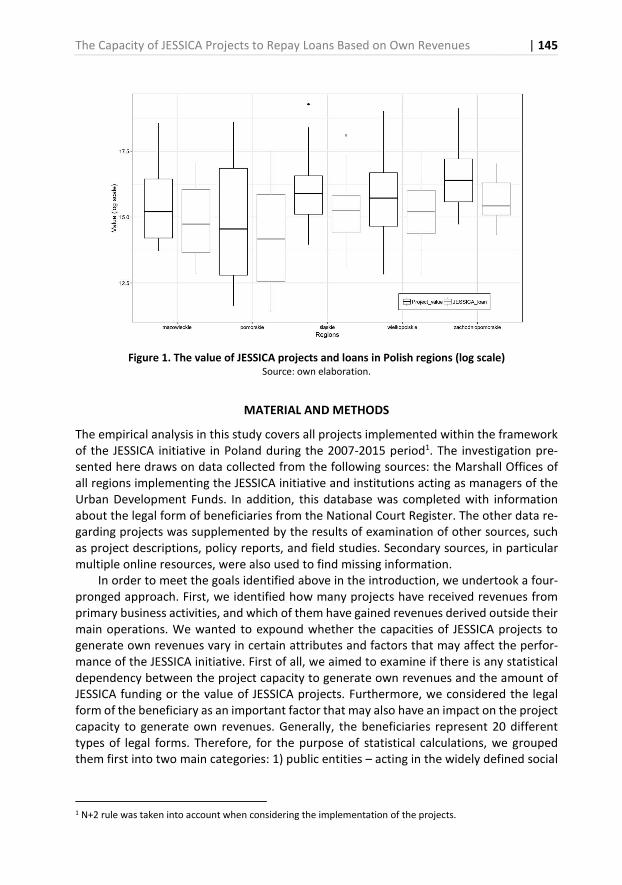
The Capacity of JESSICA Projects to Repay Loans Based on Own Revenues | 145
Figure 1. The value of JESSICA projects and loans in Polish regions (log scale) Source: own elaboration.
MATERIAL AND METHODS
The empirical analysis in this study covers all projects implemented within the framework of the JESSICA initiative in Poland during the 2007-2015 period1. The investigation pre-sented here draws on data collected from the following sources: the Marshall Offices of all regions implementing the JESSICA initiative and institutions acting as managers of the Urban Development Funds. In addition, this database was completed with information about the legal form of beneficiaries from the National Court Register. The other data re-garding projects was supplemented by the results of examination of other sources, such as project descriptions, policy reports, and field studies. Secondary sources, in particular multiple online resources, were also used to find missing information.
In order to meet the goals identified above in the introduction, we undertook a four-pronged approach. First, we identified how many projects have received revenues from primary business activities, and which of them have gained revenues derived outside their main operations. We wanted to expound whether the capacities of JESSICA projects to generate own revenues vary in certain attributes and factors that may affect the perfor-mance of the JESSICA initiative. First of all, we aimed to examine if there is any statistical dependency between the project capacity to generate own revenues and the amount of JESSICA funding or the value of JESSICA projects. Furthermore, we considered the legal form of the beneficiary as an important factor that may also have an impact on the project capacity to generate own revenues. Generally, the beneficiaries represent 20 different types of legal forms. Therefore, for the purpose of statistical calculations, we grouped them first into two main categories: 1) public entities – acting in the widely defined social
1 N+2 rule was taken into account when considering the implementation of the projects.
146 | Piotr Idczak, Ida Musiałkowska
and public interest and 2) private entities – operating for profit. In the next step, we ex-tracted within each category those types of beneficiaries that largely outnumbered the other types. We decided to investigate as a separate legal form those of the entities that have a company status. The same procedure was used to take a local government author-ity as a separate legal form as well. The rationale behind this is the fact that they represent legal forms of the two largest groups of beneficiaries. Another factor taken into consider-ation in the study was location. Due to a relatively small number of projects in our study population (161), location was analysed in dichotomous terms, that is, whether the pro-jects were implemented in the capital cities of the regions or in areas situated outside the capital cities. Additionally, the analysis also covered two other factors, namely region and urban development fund. By doing so, we wanted to find out whether these factors could influence the capacities of the projects to generate own revenues.
Second, we examined the dependence existing between all of the variables included in the study. Since the assessment of the statistical significance relies here upon comparing different groups of measures (numerical and categorical data), we applied the Wilcoxon rank sum test with continuity correction. It is a non-parametric test and can be used to compare two independent groups of the sample2.
In order to explain whether the JESSICA projects are characterised by the capacity to gen-erate revenues from their primary business activities, we used a logistic regression that allows us to estimate the probability of a binary response variable (Y) based on predictor variables (X) (Lever, Krzywinski, & Altman, 2016). The model in the simple form is the following:
log � ��������� = � + � + � �� + ⋯ + � �� (1)
where the odds ratio is defined by the function of the probability of success, that is, of hav-ing capacity to generate revenues �� = 1� which is given by the fact that a particular pro-ject is a revenue-generating project, and the probability of failure otherwise. � is the fixed
component and is an integral part of the model, while � , �, … , �� are regression coef-
ficients associated with particular independent variables and must be estimated with the
use of the maximum likelihood. ��, ��, … , ��� stand for p predictors and are respectively:
type of the beneficiary; company status; local government authority status (LGA), etc. Finally, because we used multiple predictor variables in the regression model we also
wanted to find out which variable is the most influential in predicting the binary response (Y) variable. This was done by applying ANOVA analysis that assesses potential differences in a ratio-scale dependent variable by categorical independent variables. All calculations were done in the R statistical package (R Core Team, 2018).
RESULTS AND DISCUSSION
As mentioned before, JESSICA projects should have a long-term viability and demonstrate a high self-financing level. However, as Table 1 shows, nearly one in every three projects
2 It is assumed that it tests with the null hypothesis that the distribution of given measurements in population X is the same as that in Y – to put this more precisely, the median difference between the first and the second measurement groups amounts to zero. If the medians of two populations differ, it points to a difference in the shapes of two distributions.
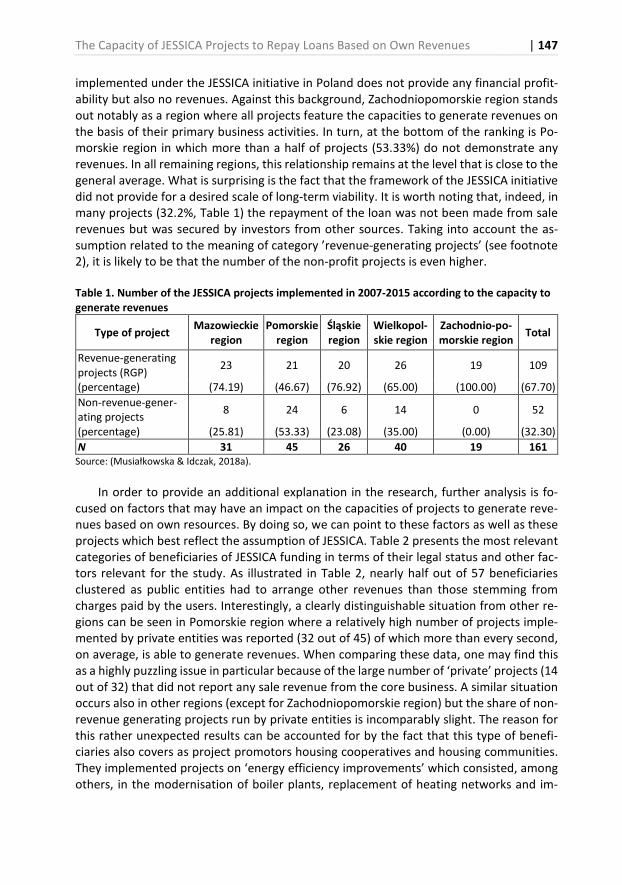
The Capacity of JESSICA Projects to Repay Loans Based on Own Revenues | 147
implemented under the JESSICA initiative in Poland does not provide any financial profit-ability but also no revenues. Against this background, Zachodniopomorskie region stands out notably as a region where all projects feature the capacities to generate revenues on the basis of their primary business activities. In turn, at the bottom of the ranking is Po-morskie region in which more than a half of projects (53.33%) do not demonstrate any revenues. In all remaining regions, this relationship remains at the level that is close to the general average. What is surprising is the fact that the framework of the JESSICA initiative did not provide for a desired scale of long-term viability. It is worth noting that, indeed, in many projects (32.2%, Table 1) the repayment of the loan was not been made from sale revenues but was secured by investors from other sources. Taking into account the as-sumption related to the meaning of category ’revenue-generating projects’ (see footnote 2), it is likely to be that the number of the non-profit projects is even higher.
Table 1. Number of the JESSICA projects implemented in 2007-2015 according to the capacity to generate revenues
Type of project Mazowieckie
region Pomorskie
region Śląskie region
Wielkopol-skie region
Zachodnio-po-morskie region
Total
Revenue-generating projects (RGP)
23 21 20 26 19 109
(percentage) (74.19) (46.67) (76.92) (65.00) (100.00) (67.70)
Non-revenue-gener-ating projects
8 24 6 14 0 52
(percentage) (25.81) (53.33) (23.08) (35.00) (0.00) (32.30)
N 31 45 26 40 19 161 Source: (Musiałkowska & Idczak, 2018a).
In order to provide an additional explanation in the research, further analysis is fo-cused on factors that may have an impact on the capacities of projects to generate reve-nues based on own resources. By doing so, we can point to these factors as well as these projects which best reflect the assumption of JESSICA. Table 2 presents the most relevant categories of beneficiaries of JESSICA funding in terms of their legal status and other fac-tors relevant for the study. As illustrated in Table 2, nearly half out of 57 beneficiaries clustered as public entities had to arrange other revenues than those stemming from charges paid by the users. Interestingly, a clearly distinguishable situation from other re-gions can be seen in Pomorskie region where a relatively high number of projects imple-mented by private entities was reported (32 out of 45) of which more than every second, on average, is able to generate revenues. When comparing these data, one may find this as a highly puzzling issue in particular because of the large number of ‘private’ projects (14 out of 32) that did not report any sale revenue from the core business. A similar situation occurs also in other regions (except for Zachodniopomorskie region) but the share of non-revenue generating projects run by private entities is incomparably slight. The reason for this rather unexpected results can be accounted for by the fact that this type of benefi-ciaries also covers as project promotors housing cooperatives and housing communities. They implemented projects on ‘energy efficiency improvements’ which consisted, among others, in the modernisation of boiler plants, replacement of heating networks and im-
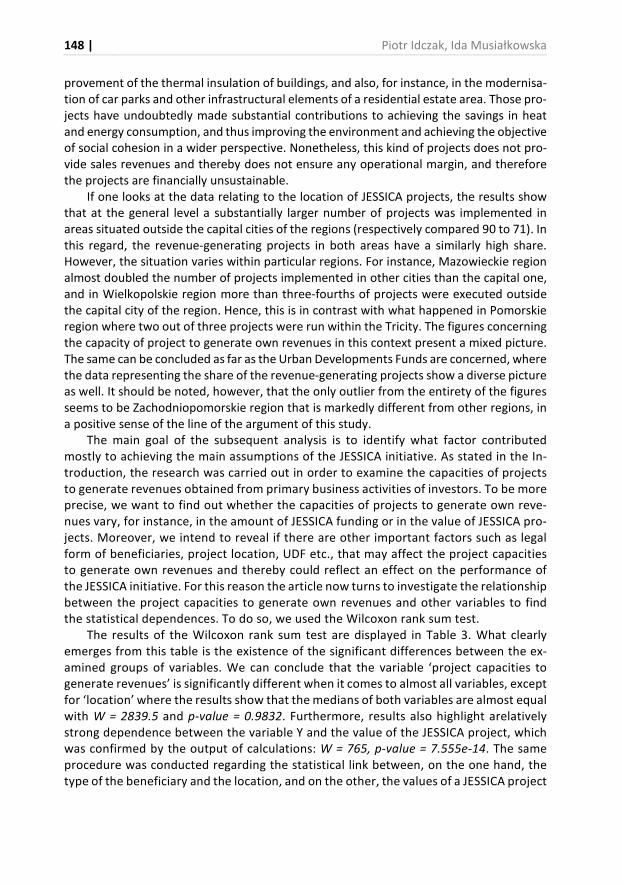
148 | Piotr Idczak, Ida Musiałkowska
provement of the thermal insulation of buildings, and also, for instance, in the modernisa-tion of car parks and other infrastructural elements of a residential estate area. Those pro-jects have undoubtedly made substantial contributions to achieving the savings in heat and energy consumption, and thus improving the environment and achieving the objective of social cohesion in a wider perspective. Nonetheless, this kind of projects does not pro-vide sales revenues and thereby does not ensure any operational margin, and therefore the projects are financially unsustainable.
If one looks at the data relating to the location of JESSICA projects, the results show that at the general level a substantially larger number of projects was implemented in areas situated outside the capital cities of the regions (respectively compared 90 to 71). In this regard, the revenue-generating projects in both areas have a similarly high share. However, the situation varies within particular regions. For instance, Mazowieckie region almost doubled the number of projects implemented in other cities than the capital one, and in Wielkopolskie region more than three-fourths of projects were executed outside the capital city of the region. Hence, this is in contrast with what happened in Pomorskie region where two out of three projects were run within the Tricity. The figures concerning the capacity of project to generate own revenues in this context present a mixed picture. The same can be concluded as far as the Urban Developments Funds are concerned, where the data representing the share of the revenue-generating projects show a diverse picture as well. It should be noted, however, that the only outlier from the entirety of the figures seems to be Zachodniopomorskie region that is markedly different from other regions, in a positive sense of the line of the argument of this study.
The main goal of the subsequent analysis is to identify what factor contributed mostly to achieving the main assumptions of the JESSICA initiative. As stated in the In-troduction, the research was carried out in order to examine the capacities of projects to generate revenues obtained from primary business activities of investors. To be more precise, we want to find out whether the capacities of projects to generate own reve-nues vary, for instance, in the amount of JESSICA funding or in the value of JESSICA pro-jects. Moreover, we intend to reveal if there are other important factors such as legal form of beneficiaries, project location, UDF etc., that may affect the project capacities to generate own revenues and thereby could reflect an effect on the performance of the JESSICA initiative. For this reason the article now turns to investigate the relationship between the project capacities to generate own revenues and other variables to find the statistical dependences. To do so, we used the Wilcoxon rank sum test.
The results of the Wilcoxon rank sum test are displayed in Table 3. What clearly emerges from this table is the existence of the significant differences between the ex-amined groups of variables. We can conclude that the variable ‘project capacities to generate revenues’ is significantly different when it comes to almost all variables, except for ‘location’ where the results show that the medians of both variables are almost equal with W = 2839.5 and p-value = 0.9832. Furthermore, results also highlight arelatively strong dependence between the variable Y and the value of the JESSICA project, which was confirmed by the output of calculations: W = 765, p-value = 7.555e-14. The same procedure was conducted regarding the statistical link between, on the one hand, the type of the beneficiary and the location, and on the other, the values of a JESSICA project
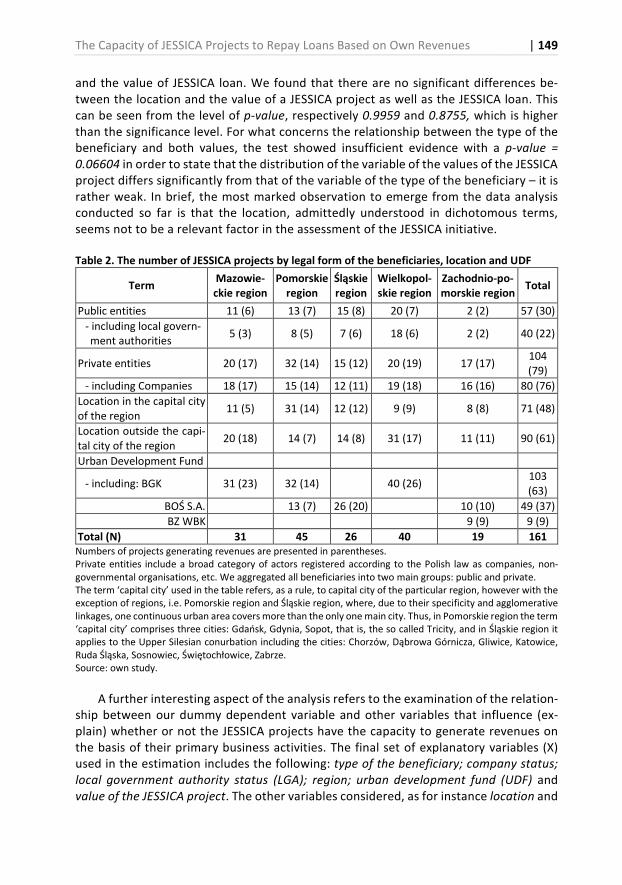
The Capacity of JESSICA Projects to Repay Loans Based on Own Revenues | 149
and the value of JESSICA loan. We found that there are no significant differences be-tween the location and the value of a JESSICA project as well as the JESSICA loan. This can be seen from the level of p-value, respectively 0.9959 and 0.8755, which is higher than the significance level. For what concerns the relationship between the type of the beneficiary and both values, the test showed insufficient evidence with a p-value =
0.06604 in order to state that the distribution of the variable of the values of the JESSICA project differs significantly from that of the variable of the type of the beneficiary – it is rather weak. In brief, the most marked observation to emerge from the data analysis conducted so far is that the location, admittedly understood in dichotomous terms, seems not to be a relevant factor in the assessment of the JESSICA initiative.
Table 2. The number of JESSICA projects by legal form of the beneficiaries, location and UDF
Term Mazowie-ckie region
Pomorskie region
Śląskie region
Wielkopol-skie region
Zachodnio-po-morskie region
Total
Public entities 11 (6) 13 (7) 15 (8) 20 (7) 2 (2) 57 (30)
- including local govern-ment authorities
5 (3) 8 (5) 7 (6) 18 (6) 2 (2) 40 (22)
Private entities 20 (17) 32 (14) 15 (12) 20 (19) 17 (17) 104 (79)
- including Companies 18 (17) 15 (14) 12 (11) 19 (18) 16 (16) 80 (76)
Location in the capital city of the region
11 (5) 31 (14) 12 (12) 9 (9) 8 (8) 71 (48)
Location outside the capi-tal city of the region
20 (18) 14 (7) 14 (8) 31 (17) 11 (11) 90 (61)
Urban Development Fund
- including: BGK 31 (23) 32 (14) 40 (26) 103 (63)
BOŚ S.A. 13 (7) 26 (20) 10 (10) 49 (37)
BZ WBK 9 (9) 9 (9)
Total (N) 31 45 26 40 19 161 Numbers of projects generating revenues are presented in parentheses. Private entities include a broad category of actors registered according to the Polish law as companies, non-governmental organisations, etc. We aggregated all beneficiaries into two main groups: public and private. The term ‘capital city’ used in the table refers, as a rule, to capital city of the particular region, however with the exception of regions, i.e. Pomorskie region and Śląskie region, where, due to their specificity and agglomerative linkages, one continuous urban area covers more than the only one main city. Thus, in Pomorskie region the term ‘capital city’ comprises three cities: Gdańsk, Gdynia, Sopot, that is, the so called Tricity, and in Śląskie region it applies to the Upper Silesian conurbation including the cities: Chorzów, Dąbrowa Górnicza, Gliwice, Katowice, Ruda Śląska, Sosnowiec, Świętochłowice, Zabrze. Source: own study.
A further interesting aspect of the analysis refers to the examination of the relation-ship between our dummy dependent variable and other variables that influence (ex-plain) whether or not the JESSICA projects have the capacity to generate revenues on the basis of their primary business activities. The final set of explanatory variables (X) used in the estimation includes the following: type of the beneficiary; company status;
local government authority status (LGA); region; urban development fund (UDF) and value of the JESSICA project. The other variables considered, as for instance location and
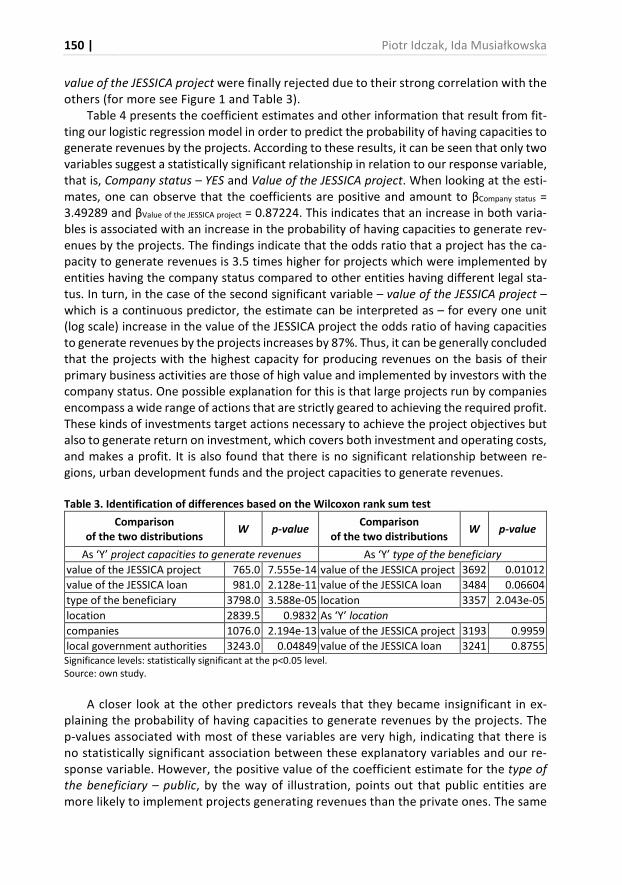
150 | Piotr Idczak, Ida Musiałkowska
value of the JESSICA project were finally rejected due to their strong correlation with the others (for more see Figure 1 and Table 3).
Table 4 presents the coefficient estimates and other information that result from fit-ting our logistic regression model in order to predict the probability of having capacities to generate revenues by the projects. According to these results, it can be seen that only two variables suggest a statistically significant relationship in relation to our response variable, that is, Company status – YES and Value of the JESSICA project. When looking at the esti-mates, one can observe that the coefficients are positive and amount to βCompany status = 3.49289 and βValue of the JESSICA project = 0.87224. This indicates that an increase in both varia-bles is associated with an increase in the probability of having capacities to generate rev-enues by the projects. The findings indicate that the odds ratio that a project has the ca-pacity to generate revenues is 3.5 times higher for projects which were implemented by entities having the company status compared to other entities having different legal sta-tus. In turn, in the case of the second significant variable – value of the JESSICA project – which is a continuous predictor, the estimate can be interpreted as – for every one unit (log scale) increase in the value of the JESSICA project the odds ratio of having capacities to generate revenues by the projects increases by 87%. Thus, it can be generally concluded that the projects with the highest capacity for producing revenues on the basis of their primary business activities are those of high value and implemented by investors with the company status. One possible explanation for this is that large projects run by companies encompass a wide range of actions that are strictly geared to achieving the required profit. These kinds of investments target actions necessary to achieve the project objectives but also to generate return on investment, which covers both investment and operating costs, and makes a profit. It is also found that there is no significant relationship between re-gions, urban development funds and the project capacities to generate revenues.
Table 3. Identification of differences based on the Wilcoxon rank sum test
Comparison of the two distributions
W p-value Comparison
of the two distributions W p-value
As ‘Y’ project capacities to generate revenues As ‘Y’ type of the beneficiary
value of the JESSICA project 765.0 7.555e-14 value of the JESSICA project 3692 0.01012
value of the JESSICA loan 981.0 2.128e-11 value of the JESSICA loan 3484 0.06604
type of the beneficiary 3798.0 3.588e-05 location 3357 2.043e-05
location 2839.5 0.9832 As ‘Y’ location
companies 1076.0 2.194e-13 value of the JESSICA project 3193 0.9959
local government authorities 3243.0 0.04849 value of the JESSICA loan 3241 0.8755 Significance levels: statistically significant at the p<0.05 level. Source: own study.
A closer look at the other predictors reveals that they became insignificant in ex-plaining the probability of having capacities to generate revenues by the projects. The p-values associated with most of these variables are very high, indicating that there is no statistically significant association between these explanatory variables and our re-sponse variable. However, the positive value of the coefficient estimate for the type of
the beneficiary – public, by the way of illustration, points out that public entities are more likely to implement projects generating revenues than the private ones. The same
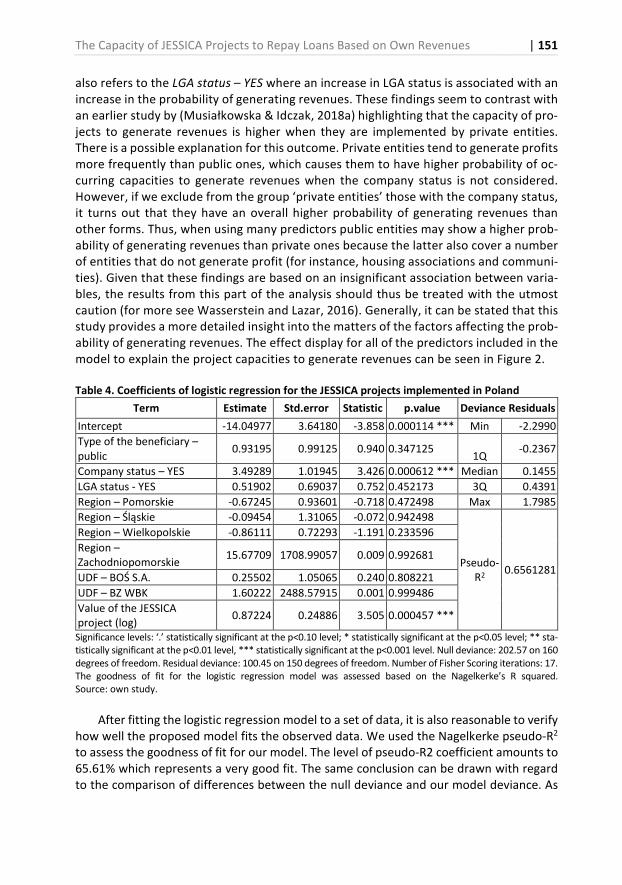
The Capacity of JESSICA Projects to Repay Loans Based on Own Revenues | 151
also refers to the LGA status – YES where an increase in LGA status is associated with an increase in the probability of generating revenues. These findings seem to contrast with an earlier study by (Musiałkowska & Idczak, 2018a) highlighting that the capacity of pro-jects to generate revenues is higher when they are implemented by private entities. There is a possible explanation for this outcome. Private entities tend to generate profits more frequently than public ones, which causes them to have higher probability of oc-curring capacities to generate revenues when the company status is not considered. However, if we exclude from the group ‘private entities’ those with the company status, it turns out that they have an overall higher probability of generating revenues than other forms. Thus, when using many predictors public entities may show a higher prob-ability of generating revenues than private ones because the latter also cover a number of entities that do not generate profit (for instance, housing associations and communi-ties). Given that these findings are based on an insignificant association between varia-bles, the results from this part of the analysis should thus be treated with the utmost caution (for more see Wasserstein and Lazar, 2016). Generally, it can be stated that this study provides a more detailed insight into the matters of the factors affecting the prob-ability of generating revenues. The effect display for all of the predictors included in the model to explain the project capacities to generate revenues can be seen in Figure 2.
Table 4. Coefficients of logistic regression for the JESSICA projects implemented in Poland
Term Estimate Std.error Statistic p.value Deviance Residuals
Intercept -14.04977 3.64180 -3.858 0.000114 *** Min -2.2990
Type of the beneficiary – public
0.93195 0.99125 0.940 0.347125 1Q
-0.2367
Company status – YES 3.49289 1.01945 3.426 0.000612 *** Median 0.1455
LGA status - YES 0.51902 0.69037 0.752 0.452173 3Q 0.4391
Region – Pomorskie -0.67245 0.93601 -0.718 0.472498 Max 1.7985
Region – Śląskie -0.09454 1.31065 -0.072 0.942498
Pseudo-R2
0.6561281
Region – Wielkopolskie -0.86111 0.72293 -1.191 0.233596
Region – Zachodniopomorskie
15.67709 1708.99057 0.009 0.992681
UDF – BOŚ S.A. 0.25502 1.05065 0.240 0.808221
UDF – BZ WBK 1.60222 2488.57915 0.001 0.999486
Value of the JESSICA project (log)
0.87224 0.24886 3.505 0.000457 ***
Significance levels: ‘.’ statistically significant at the p<0.10 level; * statistically significant at the p<0.05 level; ** sta-tistically significant at the p<0.01 level, *** statistically significant at the p<0.001 level. Null deviance: 202.57 on 160 degrees of freedom. Residual deviance: 100.45 on 150 degrees of freedom. Number of Fisher Scoring iterations: 17. The goodness of fit for the logistic regression model was assessed based on the Nagelkerke’s R squared. Source: own study.
After fitting the logistic regression model to a set of data, it is also reasonable to verify how well the proposed model fits the observed data. We used the Nagelkerke pseudo-R2 to assess the goodness of fit for our model. The level of pseudo-R2 coefficient amounts to 65.61% which represents a very good fit. The same conclusion can be drawn with regard to the comparison of differences between the null deviance and our model deviance. As
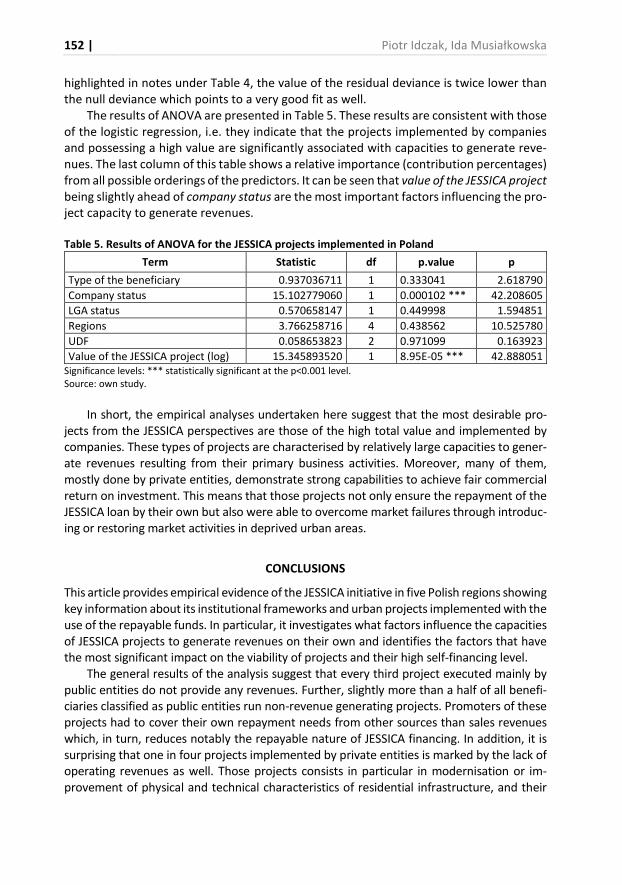
152 | Piotr Idczak, Ida Musiałkowska
highlighted in notes under Table 4, the value of the residual deviance is twice lower than the null deviance which points to a very good fit as well.
The results of ANOVA are presented in Table 5. These results are consistent with those of the logistic regression, i.e. they indicate that the projects implemented by companies and possessing a high value are significantly associated with capacities to generate reve-nues. The last column of this table shows a relative importance (contribution percentages) from all possible orderings of the predictors. It can be seen that value of the JESSICA project being slightly ahead of company status are the most important factors influencing the pro-ject capacity to generate revenues.
Table 5. Results of ANOVA for the JESSICA projects implemented in Poland
Term Statistic df p.value p
Type of the beneficiary 0.937036711 1 0.333041 2.618790
Company status 15.102779060 1 0.000102 *** 42.208605
LGA status 0.570658147 1 0.449998 1.594851
Regions 3.766258716 4 0.438562 10.525780
UDF 0.058653823 2 0.971099 0.163923
Value of the JESSICA project (log) 15.345893520 1 8.95E-05 *** 42.888051 Significance levels: *** statistically significant at the p<0.001 level. Source: own study.
In short, the empirical analyses undertaken here suggest that the most desirable pro-jects from the JESSICA perspectives are those of the high total value and implemented by companies. These types of projects are characterised by relatively large capacities to gener-ate revenues resulting from their primary business activities. Moreover, many of them, mostly done by private entities, demonstrate strong capabilities to achieve fair commercial return on investment. This means that those projects not only ensure the repayment of the JESSICA loan by their own but also were able to overcome market failures through introduc-ing or restoring market activities in deprived urban areas.
CONCLUSIONS
This article provides empirical evidence of the JESSICA initiative in five Polish regions showing key information about its institutional frameworks and urban projects implemented with the use of the repayable funds. In particular, it investigates what factors influence the capacities of JESSICA projects to generate revenues on their own and identifies the factors that have the most significant impact on the viability of projects and their high self-financing level.
The general results of the analysis suggest that every third project executed mainly by public entities do not provide any revenues. Further, slightly more than a half of all benefi-ciaries classified as public entities run non-revenue generating projects. Promoters of these projects had to cover their own repayment needs from other sources than sales revenues which, in turn, reduces notably the repayable nature of JESSICA financing. In addition, it is surprising that one in four projects implemented by private entities is marked by the lack of operating revenues as well. Those projects consists in particular in modernisation or im-provement of physical and technical characteristics of residential infrastructure, and their
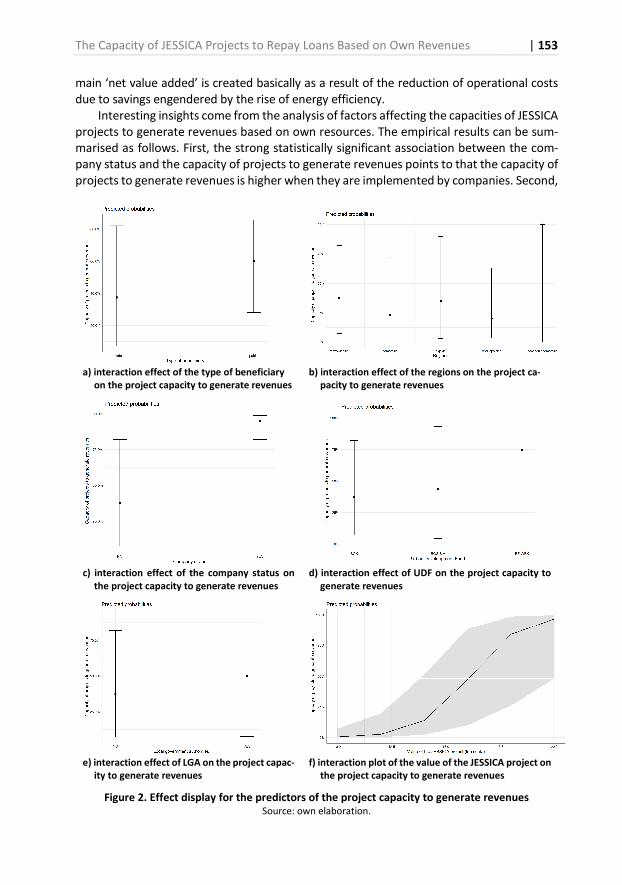
The Capacity of JESSICA Projects to Repay Loans Based on Own Revenues | 153
main ‘net value added’ is created basically as a result of the reduction of operational costs due to savings engendered by the rise of energy efficiency.
Interesting insights come from the analysis of factors affecting the capacities of JESSICA projects to generate revenues based on own resources. The empirical results can be sum-marised as follows. First, the strong statistically significant association between the com-pany status and the capacity of projects to generate revenues points to that the capacity of projects to generate revenues is higher when they are implemented by companies. Second,
a) interaction effect of the type of beneficiary
on the project capacity to generate revenues b) interaction effect of the regions on the project ca-
pacity to generate revenues
c) interaction effect of the company status on
the project capacity to generate revenues d) interaction effect of UDF on the project capacity to
generate revenues
e) interaction effect of LGA on the project capac-
ity to generate revenues f) interaction plot of the value of the JESSICA project on
the project capacity to generate revenues
Figure 2. Effect display for the predictors of the project capacity to generate revenues Source: own elaboration.
154 | Piotr Idczak, Ida Musiałkowska
the capacity of projects to generate revenues increases with the growing value of JESSICA projects. A parallel can be drawn here with the amount of the JESSICA loan which is due to strong correlations between both variables. Thus, findings emerging from the empirical analysis suggest that the most appropriate projects to be considered for JESSICA support are those of a high value and implemented by companies. Those kinds of projects covering often diversified business activities and offering a comprehensive range of services or goods are able not only to generate profits and ensure the repayment of the loan based on self-financing capacity, but also they can provide, at the same time, positive externalities for the local citizens in line with the integrated urban development plans.
Another finding from the article confirms that, despite differentiation and dissimilarity of the approach of regions to the implementation of the projects in terms of the value of the JESSICA loan and their scope, location understood as capital city/ non-capital city rela-tion is insignificant. Furthermore, it should also be stressed that only few authors have dealt with the importance of JESSICA for the transformation of urban areas, focusing at the same time mainly on qualitative research (see e.g. Dąbrowski, 2014, 2015; Fotino, 2014; Musiałkowska & Idczak, 2018b; Tarnawska & Rosiek, 2015) or examining its institu-tional framework (Bode, 2015; Nadler & Nadler, 2018). Our study provides, for the first time, empirical evidence on all projects implemented in Poland with the use of JESSICA funds and on this basis those findings have a more profound effect on the knowledge of JESSICA initiative compared to previous results reported in the literature.
It can be concluded that a clear policy implication follows from the findings of our article. The projects characterised by a high value and proposed by entities having the company status involve private capital and consequently do generate capital backflows. In this sense, they contribute to the leverage effects and thereby raise the role of JESSICA as a powerful instrument aimed at rendering existing market failures. However, this analysis can become more sophisticated if leverage effects are measured. Indeed, more research is necessary to resolve this limitation of the study. Nevertheless, these results can be con-sidered to be an important contribution to the debate on the potential solutions concern-ing the implementation of the JESSICA initiative in the current and next financial period.
REFERENCES
Arup. (2009). JESSICA Evaluation Study – West Poland. Retrieved from http://www.eib.org/ attachments/jessica-poland-west_en.pdf on December 1, 2018.
Bode, M. (2015). Financial Instruments in Cohesion Policy. European Structural and Investment
Funds Journal, 3(3), 173-186.
CCI. (2010). JESSICA Evaluation Study for Silesia. Retrieved from https://www.eib.org/attachments/ documents/jessica-evaluation-study-for-silesia-en.pdf on November 1, 2018.
Dąbrowski, M. (2014). Engineering Multilevel Governance? Joint European Support for Sustainable Investment in City Areas (JESSICA) and the Involvement of Private and Financial Actors in Urban Development Policy. Regional Studies, 48(12), 2006-2019. https://doi.org/10.1080/00343404.2014.914625
Dąbrowski, M. (2015). ‘Doing more with less’ or ‘doing less with less’? Assessing EU cohesion policy’s financial instruments for urban development. Regional Studies, Regional Science, 2(1), 73-96. https://doi.org/10.1080/21681376.2014.999107
EIB. (2010a). JESSICA – Holding Fund Handbook. Luxembourg. Retrieved from http://www.eib.org/
The Capacity of JESSICA Projects to Repay Loans Based on Own Revenues | 155
attachments/documents/jessica_holding_fund_handbook_en.pdf on November 1, 2018.
EIB. (2010b). JESSICA Evaluation Study for Pomerania. Retrieved from https://ec.europa.eu/ regional_policy/archive/funds/2007/jjj/doc/pdf/jessica/poland_evaluation_pomerania.pdf on November 1, 2018.
EIB. (2011). JESSICA Evaluation Study. Implementing JESSICA Instruments in Mazowieckie Voivodship,
Poland. Retrieved from https://ec.europa.eu/regional_policy/archive/ funds/2007/jjj/doc/pdf/ jessica/14-jessica_evaluation_study_in_mazowieckie_voivodship_en.pdf on November 5, 2018.
European Commission. (2013b). JESSICA: Joint European Support for Sustainable Investment in City Areas. Retrieved from https://ec.europa.eu/regional_policy/en/funding/special-support-instruments/ jessica/#2 on November 5, 2018.
European Commission. (2013b). How does JESSICA work?. Retrieved from https://ec.europa.eu/ regional_policy/en/funding/special-support-instruments/jessica/#3 on November 5, 2018.
European Commission. (2014). Summary of data on the progress made in financing and implementing financial
engineering instruments reported by the managing authorities n accordance with Article 67(2)(j) of
Council Regulation (EC) No 1083/2006. Retrieved from https://ec.europa.eu/regional_policy/ sources/thefunds/instruments/doc/summary_data_fei_2013.pdf on November 1, 2018.
Fotino, F. (2014). The JESSICA Action in Italy 2007-2013. Bottlenecks, Opportunities, and Directions for the Future. European Structural and Investment Funds Journal, 2(3), 245-255. Retrieved from https://estif.lexxion.eu/article/ESTIF/2014/3/9 on November 1, 2018.
Held, T., & Jakubowski, P. (2009). JESSICA und Stadtentwicklungsfonds — Neue Aufgaben für alte Landesentwicklungsgesellschaften?. Raumforschung Und Raumordnung, 67(1), 69-78. https://doi.org/10.1007/BF03183144
Lever, J., Krzywinski, M., & Altman, N. (2016). Logistic regression. Nature Methods, 13(7), 541-542. https://doi.org/10.1038/nmeth.3904
Mazars. (2013). Financial Management in JESSICA Implementation Designing. Guarantee
Products. Retrieved from http://www.eib.org/attachments/ documents/jessica_fg_final_ report_en.pdf on November 1, 2018.
Memorandum of Understanding. (2006). Memorandum of Understanding in Respect of a
Coordinated Approach to the Financing of Urban renewal and Development for Programming
Period 2007-2013 of the Community Structural Funds between the European Commission, the
European Investment Bank and the Cou. Retrieved from http://ec.europa.eu/ regional_policy/archive/funds/2007/jjj/doc/pdf/urban_mou_signed.pdf on October 15, 2018.
Musiałkowska, I., & Idczak, P. (2016). The use of repayable financial instruments in the process of regeneration of degraded urban areas on the example of the JESSICA initiative. In Changes and
Challenges in the Modern World Economy (1st ed., Vol. 1, pp. 115-136). Poznań: PUEB Press. Retrieved from https://depot.ceon.pl/handle/123456789/12083 on November 1, 2018.
Musiałkowska, I., & Idczak, P. (2018a). Is the JESSICA initiative truly repayable instrument? The Polish case study. Research Papers of Wrocław University of Economics, 536,143-151. https://doi.org/10.15611/pn.2018.536.13.
Musiałkowska, I., & Idczak, P. (2018b). Ocena dopasowania projektów realizowanych w ramach ini-cjatywy JESSICA do potrzeb występujacych na obszarach miejskich. Studia KPZK PAN, 184, 233-246.
Nadler, M., & Kreuz, C. (2011). UDF typologies and governance structures in the context of JESSICA
implementation. Brussels. Retrieved from https://ec.europa.eu/regional_ policy/archive/funds/ 2007/jjj/doc/pdf/jessica/udf_typologies.pdf on October 15, 2018.
Nadler, M., & Nadler, C. (2018). Promoting investment in sustainable urban development with JESSICA: Outcomes of a new EU policy initiative. Urban Studies, 55(9), 1839-1858.
156 | Piotr Idczak, Ida Musiałkowska
https://doi.org/10.1177/0042098017702815
R Core Team. (2018). R: A language and environment for statistical computing. R Foundation for
Statistical Computing. Retrieved from https://www.r-project.org/ on November 1, 2018.
Tarnawska, K., & Rosiek, J. (2015). The Jessica Initiative: An Instrument for Urban Sustainable Develop-ment. Examples of Urban Regeneration in Silesia (Poland) and Central Moravia (Czech Republic) / Inicjatywa Jessica Jako Instrument Wspierania Zrównoważonego Rozwoju Miast. Przykłady Re-wita. Comparative Economic Research, 18(2), 119-138. https://doi.org/10.1515/cer-2015-0015
Wasserstein, R.L., & Lazar, N.A. (2016). The ASA’s Statement on p-Values: Context, Process, and Purpose. The American Statistician, 70(2), 129-133. https://doi.org/10.1080/00031305.2016.1154108
Authors
The contribution of co-authors is diversified and can be expressed as 55% Piotr Idczak and 45% Ida Musiałkowska.
Ida Musiałkowska
Associate Professor at Department of European Studies, Poznań University of Economics and Business (Poznań, Poland). Her research interests are dynamics of regional integration and devel-opment processes in the EU and world, EU cohesion policy, European integration, Latin American integration, regional business cycles and policy transfer. Correspondence to: Dr hab. Ida Musiałkowska, prof. UEP, Poznań University of Economics and Business, Department of European Studies, al. Niepodległości 10, 61-875 Poznań, Poland; +48 61 854 33 09; e-mail: [email protected] ORCID http://orcid.org/0000-0002-7054-7648
Piotr Idczak Assistant Professor at Department of European Studies, Poznan University of Economics and Busi-ness (Poznań, Poland). His primary research interests encompass European integration, regional economic development with particular focus on the development of peripheral regions, urban regeneration, and the evaluation and analysis of financial engineering instruments used in the EU cohesion policy. Correspondence to: Dr Piotr Idczak, Poznan University of Economics and Business, Department of European Studies, al. Niepodległości 10, 61-875 Poznań, Poland; + 48 61 854 33 06; e-mail: [email protected] ORCID http://orcid.org/0000-0002-3754-8956
Acknowledgements and Financial Disclosure
The study is supported by the National Science Centre, Poland (no. 2015/19/D/HS5/01561). Pro-ject ‘Regeneration process of degraded urban areas within the framework of JESSICA initiative’.
The authors would like to acknowledge the statistical assistance of Maciej Beręsewicz, PhD. The authors would also like to thank the anonymous referees for their useful comments, which al-lowed to increase the value of this article.
This article has been presented as the academic paper at the scientific conference GLOB2018: “Globalization and Regionalization in the Contemporary World: Competitiveness, Development, Sustainability” organized in Kraków on 21-22 September 2019.
The Capacity of JESSICA Projects to Repay Loans Based on Own Revenues | 157
Copyright and License
This article is published under the terms of the Creative Commons Attribution – NoDerivs (CC BY-ND 4.0) License
http://creativecommons.org/licenses/by-nd/4.0/
Published by the Centre for Strategic and International Entrepreneurship – Krakow, Poland
This publication has been co-financed by the European Commission Representation in Poland. The European Commission, or any person acting on its behalf, is not re-sponsible for the use of the information contained in this publication. This publication reflects the views only of the authors, and the European Commission cannot be held responsible for any use which may be made of the information contained therein.
The copyediting and proofreading of articles in English is financed in the framework of contract No. 913/P-DUN/2019 by the Ministry of Science and Higher Education of the Republic of Poland committed to activities aimed at science promotion.


2019, Vol. 7, No. 2 10.15678/EBER.2019.070209
Factors Influencing
Foreign Direct Investment Flows into Turkey
Ayla Oğuş Binatlı, Niloufer Sohrabji
A B S T R A C T
Objective: Foreign direct investment (FDI) is an important determinant of develop-ment. Thus, identifying the main drivers of investment is critical especially for emerging markets. The main aim of the article is to verify factors influencing FDI flows into Turkey.
Research Design & Methods: Foreign investment can be affected by structural fac-tors, such as growth and trade openness; stability factors, such as high fiscal deficits, inflation, and exchange rate changes; and global factors, such as the EU accession and the level of global liquidity. We examine the importance of these variables in affecting FDI flows into Turkey using quarterly data from 1992 to 2010 and cointe-gration and VECM methodology.
Findings: We conclude that for Turkey (and perhaps other emerging markets) struc-tural reforms that expand market size and trade opportunities yield more capital inflows than economic stabilisation efforts that address prices, exchange rates, and budget balances. Moreover, we find that during that period in Turkey, trade and investment were substitutes.
Implications & Recommendations: Stabilisation efforts to control prices, exchange rates, and budgets matter, but not as much as structural reforms that impact market potential and trade flows.
Contribution & Value Added: Previous literature generally finds that FDI and trade are complements in emerging countries. This was the case in Turkey as well in the eighties and early nineties. We show that the EU candidacy prospects have transformed the relationship between FDI and trade in Turkey.
Article type: research article Keywords: Cointegration; VECM; EU accession; FDI; Global liquidity JEL codes: F32, F41, F43
Received: 8 November 2018 Revised: 8 March 2019 Accepted: 21 March 2019
Suggested citation:
Oğuş Binatlı, A., & Sohrabji, N. (2019). Factors Influencing Foreign Direct Investment Flows into Turkey. Entrepreneurial Business and Economics Review, 7(2), 159-174. https://doi.org/10.15678/EBER.2019.070209
160 | Ayla Oğuş Binatlı, Niloufer Sohrabji
INTRODUCTION
This article focuses on foreign direct investment flows in Turkey. On the basis of the prior research we examine the role of structural factors (market size and trade) and stability factors (inflation, exchange rates, and fiscal balances) in promoting FDI flows into Turkey during the 1990s and 2000s. Our focus on Turkey during those two decades is important for several reasons. There was an increasing reliance on capital flows as a driver of Turkey’s growth in those decades (İzmen & Yılmaz, 2009). In turn, foreign investment was affected by economic events and policy changes during those decades. The financial crises of 1994 and 2001 probably reduced capital flows. On the other hand, those events were the cata-lyst to trade liberalisation which can promote FDI inflows. Also, Turkey shifted from a fixed to a floating exchange rate regime, which increased the volatility of the Turkish lira and led to rising trade and current account deficits (Dağdeviren, Oğuş Binatlı, & Sohrabji, 2012). This instability can reduce capital flows.
Aside from the above, two other factors affected FDI flows into Turkey in that period, Turkey’s negotiations for the EU accession and the availability of global liquidity. There is empirical evidence that suggests that the EU accession could promote FDI flows. FDI flows have increased due to the EU membership (Buch et al., 2003) and the European Monetary Union participation (Schiavo, 2007; Aristotelous & Fountas, 2012). Bevan and Estrin (2004) show that FDI flows into transition countries, whose accession prospects are enhanced, increase even after controlling for proximity and labour cost. However, MacDermott (2007) finds that NAFTA negotiations did not increase FDI to the negotiating countries. We add to this literature by incorporating the impact of the EU accession negotiations begin-ning in the mid-2000s on FDI flows in Turkey.
Another important aspect of our sample period is the availability of global liquidity which was not incorporated in earlier studies. Rüffer and Stracca (2006) and others com-pute liquidity as the ratio of nominal money to nominal GDP. Using this measure, Belke, Orth and Setzer (2008) show that the 1990s were a period of low liquidity while the 2000s are a period of high liquidity. Our focus on this period, therefore, enables us to capture the impact of this external factor on FDI in Turkey.
We end our empirical analysis in 2010 because of the significant economic and polit-ical changes in Turkey1 as well as changes in the global environment (rising protectionism) and Europe (Euro crisis).
The article is organised as follows: the next section examines the discussed back-ground of foreign investment in Turkey over the last two decades. Then we present the methodology which is followed by a discussion of results. The last section concludes.
1 As of 2010, Turkey’s political and social environment started changing. In 2010 Turkey had a controversial ref-erendum after which the government gradually became more autocratic, which became faster following the September 2011 elections (Somer, 2016). Widespread street protests took place against the government in the summer of 2013 which became known as the Gezi Park Protests (Yardımcı-Geyikçi, 2014). In June 2015, another controversial election took place and the following year, Turkey witnessed the worst terrorist attacks in its his-tory, with several bomb attacks in the following year (Güneyli et al., 2017). Then, in July 2016, there was a failed coup attempt (Esen & Gümüşçü, 2017) after which a state of emergency was declared.
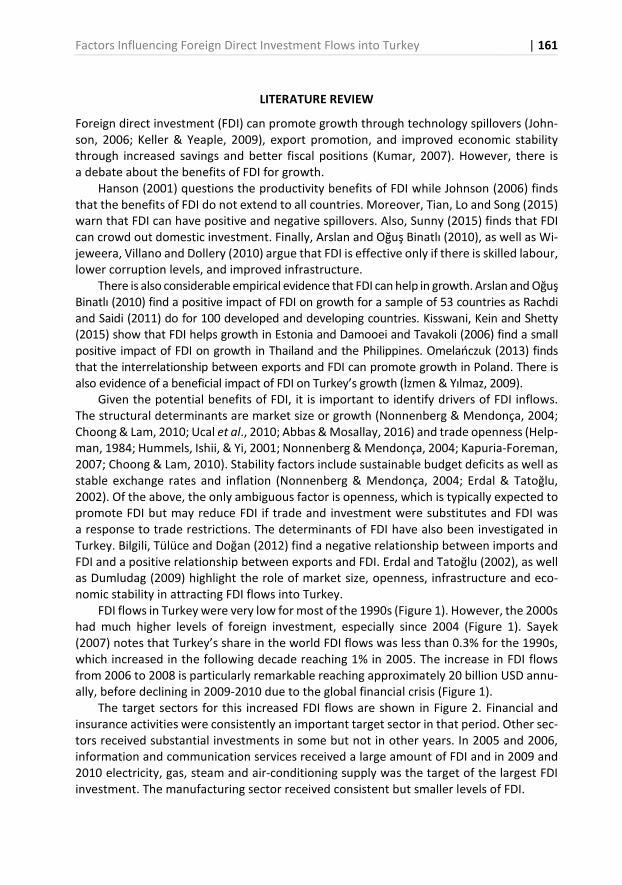
Factors Influencing Foreign Direct Investment Flows into Turkey | 161
LITERATURE REVIEW
Foreign direct investment (FDI) can promote growth through technology spillovers (John-son, 2006; Keller & Yeaple, 2009), export promotion, and improved economic stability through increased savings and better fiscal positions (Kumar, 2007). However, there is a debate about the benefits of FDI for growth.
Hanson (2001) questions the productivity benefits of FDI while Johnson (2006) finds that the benefits of FDI do not extend to all countries. Moreover, Tian, Lo and Song (2015) warn that FDI can have positive and negative spillovers. Also, Sunny (2015) finds that FDI can crowd out domestic investment. Finally, Arslan and Oğuş Binatlı (2010), as well as Wi-jeweera, Villano and Dollery (2010) argue that FDI is effective only if there is skilled labour, lower corruption levels, and improved infrastructure.
There is also considerable empirical evidence that FDI can help in growth. Arslan and Oğuş Binatlı (2010) find a positive impact of FDI on growth for a sample of 53 countries as Rachdi and Saidi (2011) do for 100 developed and developing countries. Kisswani, Kein and Shetty (2015) show that FDI helps growth in Estonia and Damooei and Tavakoli (2006) find a small positive impact of FDI on growth in Thailand and the Philippines. Omelańczuk (2013) finds that the interrelationship between exports and FDI can promote growth in Poland. There is also evidence of a beneficial impact of FDI on Turkey’s growth (İzmen & Yılmaz, 2009).
Given the potential benefits of FDI, it is important to identify drivers of FDI inflows. The structural determinants are market size or growth (Nonnenberg & Mendonça, 2004; Choong & Lam, 2010; Ucal et al., 2010; Abbas & Mosallay, 2016) and trade openness (Help-man, 1984; Hummels, Ishii, & Yi, 2001; Nonnenberg & Mendonça, 2004; Kapuria-Foreman, 2007; Choong & Lam, 2010). Stability factors include sustainable budget deficits as well as stable exchange rates and inflation (Nonnenberg & Mendonça, 2004; Erdal & Tatoğlu, 2002). Of the above, the only ambiguous factor is openness, which is typically expected to promote FDI but may reduce FDI if trade and investment were substitutes and FDI was a response to trade restrictions. The determinants of FDI have also been investigated in Turkey. Bilgili, Tülüce and Doğan (2012) find a negative relationship between imports and FDI and a positive relationship between exports and FDI. Erdal and Tatoğlu (2002), as well as Dumludag (2009) highlight the role of market size, openness, infrastructure and eco-nomic stability in attracting FDI flows into Turkey.
FDI flows in Turkey were very low for most of the 1990s (Figure 1). However, the 2000s had much higher levels of foreign investment, especially since 2004 (Figure 1). Sayek (2007) notes that Turkey’s share in the world FDI flows was less than 0.3% for the 1990s, which increased in the following decade reaching 1% in 2005. The increase in FDI flows from 2006 to 2008 is particularly remarkable reaching approximately 20 billion USD annu-ally, before declining in 2009-2010 due to the global financial crisis (Figure 1).
The target sectors for this increased FDI flows are shown in Figure 2. Financial and insurance activities were consistently an important target sector in that period. Other sec-tors received substantial investments in some but not in other years. In 2005 and 2006, information and communication services received a large amount of FDI and in 2009 and 2010 electricity, gas, steam and air-conditioning supply was the target of the largest FDI investment. The manufacturing sector received consistent but smaller levels of FDI.
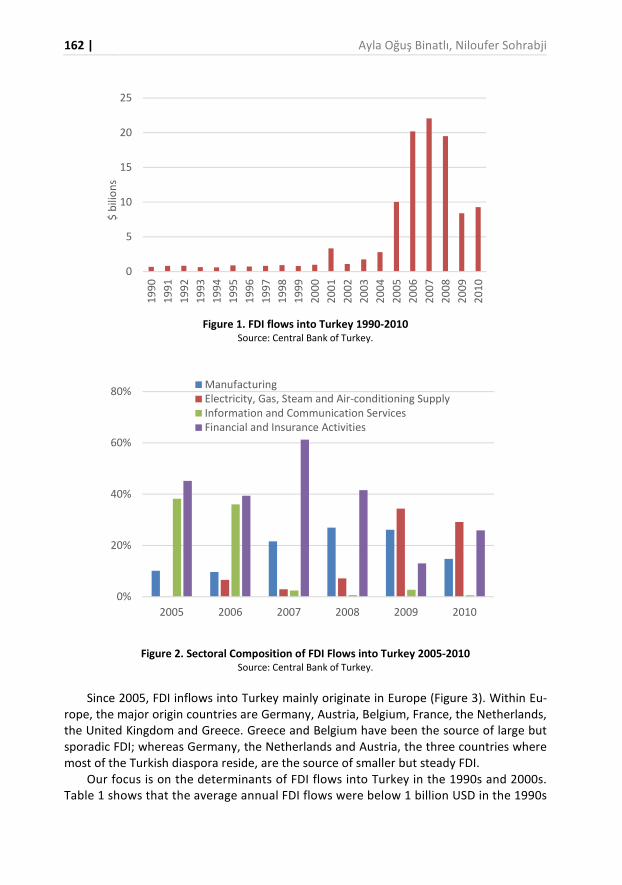
162 | Ayla Oğuş Binatlı, Niloufer Sohrabji
Figure 1. FDI flows into Turkey 1990-2010
Source: Central Bank of Turkey.
Figure 2. Sectoral Composition of FDI Flows into Turkey 2005-2010
Source: Central Bank of Turkey.
Since 2005, FDI inflows into Turkey mainly originate in Europe (Figure 3). Within Eu-rope, the major origin countries are Germany, Austria, Belgium, France, the Netherlands, the United Kingdom and Greece. Greece and Belgium have been the source of large but sporadic FDI; whereas Germany, the Netherlands and Austria, the three countries where most of the Turkish diaspora reside, are the source of smaller but steady FDI.
Our focus is on the determinants of FDI flows into Turkey in the 1990s and 2000s. Table 1 shows that the average annual FDI flows were below 1 billion USD in the 1990s
0
5
10
15
20
25
19
90
19
91
19
92
19
93
19
94
19
95
19
96
19
97
19
98
19
99
20
00
20
01
20
02
20
03
20
04
20
05
20
06
20
07
20
08
20
09
20
10
$ b
ilio
ns
0%
20%
40%
60%
80%
2005 2006 2007 2008 2009 2010
ManufacturingElectricity, Gas, Steam and Air-conditioning SupplyInformation and Communication ServicesFinancial and Insurance Activities
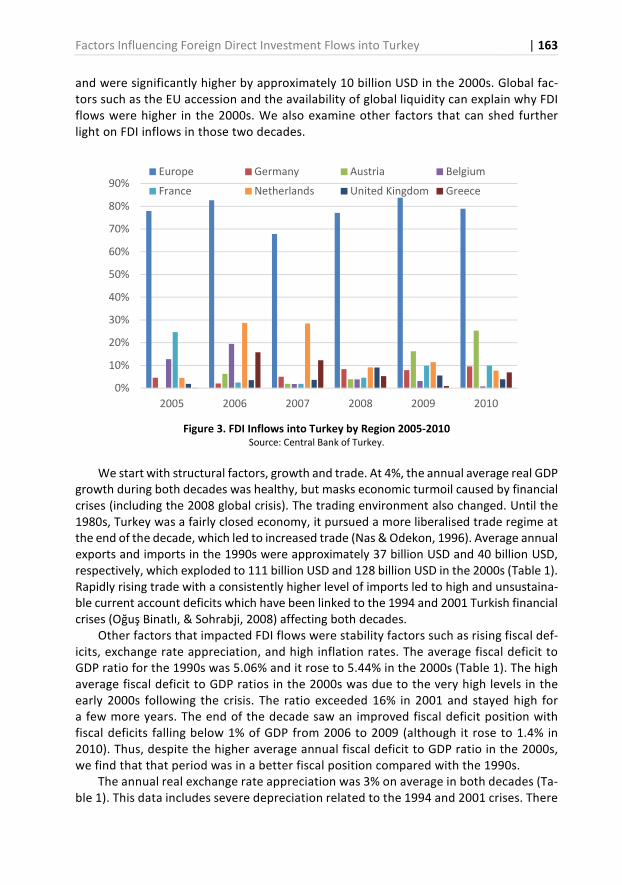
Factors Influencing Foreign Direct Investment Flows into Turkey | 163
and were significantly higher by approximately 10 billion USD in the 2000s. Global fac-tors such as the EU accession and the availability of global liquidity can explain why FDI flows were higher in the 2000s. We also examine other factors that can shed further light on FDI inflows in those two decades.
Figure 3. FDI Inflows into Turkey by Region 2005-2010
Source: Central Bank of Turkey.
We start with structural factors, growth and trade. At 4%, the annual average real GDP growth during both decades was healthy, but masks economic turmoil caused by financial crises (including the 2008 global crisis). The trading environment also changed. Until the 1980s, Turkey was a fairly closed economy, it pursued a more liberalised trade regime at the end of the decade, which led to increased trade (Nas & Odekon, 1996). Average annual exports and imports in the 1990s were approximately 37 billion USD and 40 billion USD, respectively, which exploded to 111 billion USD and 128 billion USD in the 2000s (Table 1). Rapidly rising trade with a consistently higher level of imports led to high and unsustaina-ble current account deficits which have been linked to the 1994 and 2001 Turkish financial crises (Oğuş Binatlı, & Sohrabji, 2008) affecting both decades.
Other factors that impacted FDI flows were stability factors such as rising fiscal def-icits, exchange rate appreciation, and high inflation rates. The average fiscal deficit to GDP ratio for the 1990s was 5.06% and it rose to 5.44% in the 2000s (Table 1). The high average fiscal deficit to GDP ratios in the 2000s was due to the very high levels in the early 2000s following the crisis. The ratio exceeded 16% in 2001 and stayed high for a few more years. The end of the decade saw an improved fiscal deficit position with fiscal deficits falling below 1% of GDP from 2006 to 2009 (although it rose to 1.4% in 2010). Thus, despite the higher average annual fiscal deficit to GDP ratio in the 2000s, we find that that period was in a better fiscal position compared with the 1990s.
The annual real exchange rate appreciation was 3% on average in both decades (Ta-ble 1). This data includes severe depreciation related to the 1994 and 2001 crises. There
0%
10%
20%
30%
40%
50%
60%
70%
80%
90%
2005 2006 2007 2008 2009 2010
Europe Germany Austria Belgium
France Netherlands United Kingdom Greece
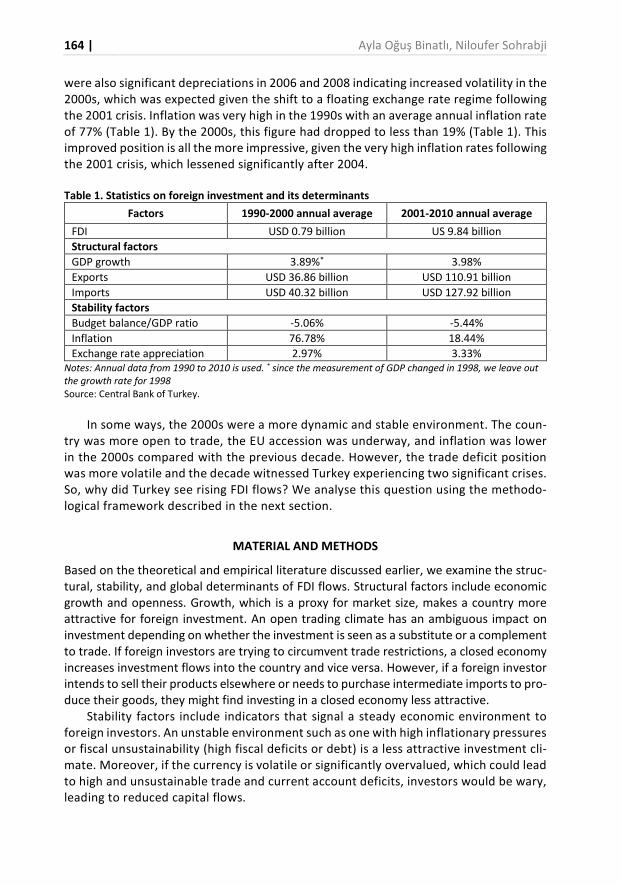
164 | Ayla Oğuş Binatlı, Niloufer Sohrabji
were also significant depreciations in 2006 and 2008 indicating increased volatility in the 2000s, which was expected given the shift to a floating exchange rate regime following the 2001 crisis. Inflation was very high in the 1990s with an average annual inflation rate of 77% (Table 1). By the 2000s, this figure had dropped to less than 19% (Table 1). This improved position is all the more impressive, given the very high inflation rates following the 2001 crisis, which lessened significantly after 2004.
Table 1. Statistics on foreign investment and its determinants
Factors 1990-2000 annual average 2001-2010 annual average
FDI USD 0.79 billion US 9.84 billion
Structural factors
GDP growth 3.89%* 3.98%
Exports USD 36.86 billion USD 110.91 billion
Imports USD 40.32 billion USD 127.92 billion
Stability factors
Budget balance/GDP ratio -5.06% -5.44%
Inflation 76.78% 18.44%
Exchange rate appreciation 2.97% 3.33% Notes: Annual data from 1990 to 2010 is used. * since the measurement of GDP changed in 1998, we leave out
the growth rate for 1998 Source: Central Bank of Turkey.
In some ways, the 2000s were a more dynamic and stable environment. The coun-try was more open to trade, the EU accession was underway, and inflation was lower in the 2000s compared with the previous decade. However, the trade deficit position was more volatile and the decade witnessed Turkey experiencing two significant crises. So, why did Turkey see rising FDI flows? We analyse this question using the methodo-logical framework described in the next section.
MATERIAL AND METHODS
Based on the theoretical and empirical literature discussed earlier, we examine the struc-tural, stability, and global determinants of FDI flows. Structural factors include economic growth and openness. Growth, which is a proxy for market size, makes a country more attractive for foreign investment. An open trading climate has an ambiguous impact on investment depending on whether the investment is seen as a substitute or a complement to trade. If foreign investors are trying to circumvent trade restrictions, a closed economy increases investment flows into the country and vice versa. However, if a foreign investor intends to sell their products elsewhere or needs to purchase intermediate imports to pro-duce their goods, they might find investing in a closed economy less attractive.
Stability factors include indicators that signal a steady economic environment to foreign investors. An unstable environment such as one with high inflationary pressures or fiscal unsustainability (high fiscal deficits or debt) is a less attractive investment cli-mate. Moreover, if the currency is volatile or significantly overvalued, which could lead to high and unsustainable trade and current account deficits, investors would be wary, leading to reduced capital flows.
Factors Influencing Foreign Direct Investment Flows into Turkey | 165
Finally, there are global factors including Turkey’s progress on the EU candidacy and the overall global liquidity environment. The EU accession prospects are expected to have a positive and statistically significant impact on FDI flows as do periods of high global li-quidity (the 2000s, based on the findings of Belke et al., (2008).
Based on the above, the determinants of FDI are market size, openness, exchange rate, inflation, deficit, the EU accession, and the availability of global liquidity. Aside from the two global factors, all the other factors affect foreign direct investment and are in turn impacted by them. Thus, estimation would require a vector autoregression (VAR) ap-proach. The structural and stability factors are part of the VAR system, the global factors are treated as exogenous.
The 6-variable vector autoregression with p-lags, denoted as VAR(p), with exogenous variables is expressed as follows:
�� = � + ∑ Γ��� ���� + Θ�� + �� (1)
where �� is a 6 x 1 vector of system variables (FDI, market size, openness, exchange rate, inflation, deficit) each with p-lags, � is a 6 x 1 vector of intercept coefficients, and �� is a 2 x 1 vector of exogenous variables (EU accession and availability of global liquid-ity). Γ�’s are the 6 x 6 coefficient matrices for the system variables and Θ is the 6 x 2 coefficient matrix for the exogenous variables.
The first step is to test for non-stationarity as a standard VAR in levels cannot be used if the variables have unit roots. We employ ADF and KPSS tests. If variables are non-sta-tionary, the analysis should search for a cointegrating relationship among FDI and its de-terminants. There are two main approaches to cointegration analysis. The Engle-Granger method is a single-equation method valid only if a single cointegrating vector exists. The Johansen (1988) approach, which estimates a vector error correction model (VECM), can handle multiple cointegrating vectors and will find a cointegrating relationship more reli-ably if it exists. Thus, following Erdal and Tatoğlu (2002), we use the Johansen cointegra-tion method to identify the main drivers of foreign direct investment in Turkey and esti-mate a VECM which provides the long-run and short-run relationship between the varia-bles. Lag length for the test is determined by AIC.
Estimation results are analysed in the following section.
RESULTS AND DISCUSSION
We use quarterly data from 1992 to 2010 to estimate the factors that affect foreign in-vestment in Turkey. FDI is measured as billions of U.S. dollars of net FDI inflows (denoted as FDI). To capture market size, we use the index of industrial production (denoted as IIP) rather than GDP. This is a good proxy for two reasons. Firstly, GDP estimation changed in Turkey in 1998, which makes this series problematic. Also, IIP captures the productive ca-pability of a country and is thus an important indicator for investors looking to invest in Turkey. The factor openness is included as the sum of exports and imports also measured in billions of U.S. dollars (denoted as Trade). For inflation, we use the consumer price index (denoted as Prices) and for the exchange rate, we use the IMF-estimated CPI-based real effective exchange rate index weighted for Turkey’s major trading partners (denoted as REER). Fiscal balance (denoted as Budget) is expressed in thousands of Turkish lira which is converted to billions of U.S. dollars using the lira-dollar market exchange rate. The base
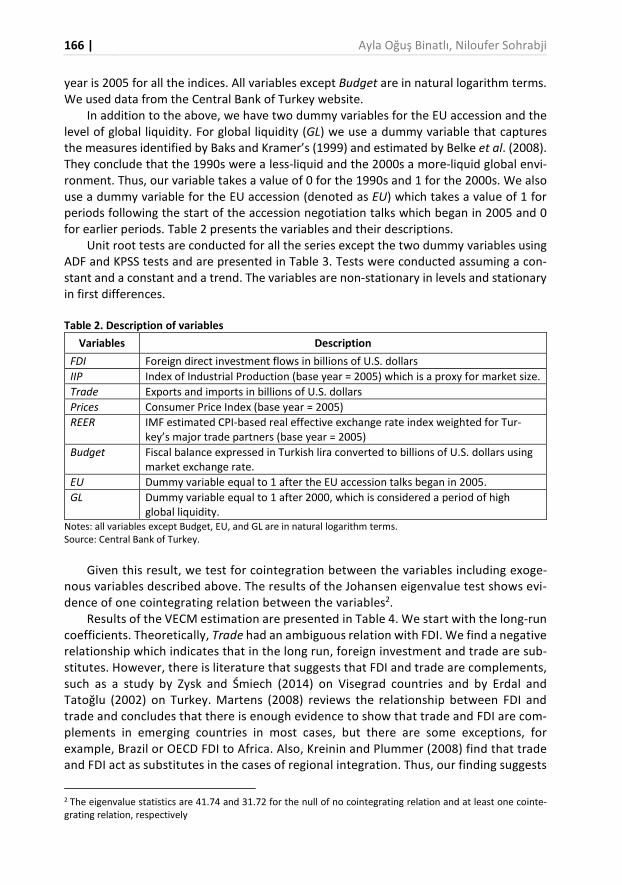
166 | Ayla Oğuş Binatlı, Niloufer Sohrabji
year is 2005 for all the indices. All variables except Budget are in natural logarithm terms. We used data from the Central Bank of Turkey website.
In addition to the above, we have two dummy variables for the EU accession and the level of global liquidity. For global liquidity (GL) we use a dummy variable that captures the measures identified by Baks and Kramer’s (1999) and estimated by Belke et al. (2008). They conclude that the 1990s were a less-liquid and the 2000s a more-liquid global envi-ronment. Thus, our variable takes a value of 0 for the 1990s and 1 for the 2000s. We also use a dummy variable for the EU accession (denoted as EU) which takes a value of 1 for periods following the start of the accession negotiation talks which began in 2005 and 0 for earlier periods. Table 2 presents the variables and their descriptions.
Unit root tests are conducted for all the series except the two dummy variables using ADF and KPSS tests and are presented in Table 3. Tests were conducted assuming a con-stant and a constant and a trend. The variables are non-stationary in levels and stationary in first differences.
Table 2. Description of variables
Variables Description
FDI Foreign direct investment flows in billions of U.S. dollars
IIP Index of Industrial Production (base year = 2005) which is a proxy for market size.
Trade Exports and imports in billions of U.S. dollars
Prices Consumer Price Index (base year = 2005)
REER IMF estimated CPI-based real effective exchange rate index weighted for Tur-key’s major trade partners (base year = 2005)
Budget Fiscal balance expressed in Turkish lira converted to billions of U.S. dollars using market exchange rate.
EU Dummy variable equal to 1 after the EU accession talks began in 2005.
GL Dummy variable equal to 1 after 2000, which is considered a period of high global liquidity.
Notes: all variables except Budget, EU, and GL are in natural logarithm terms. Source: Central Bank of Turkey.
Given this result, we test for cointegration between the variables including exoge-nous variables described above. The results of the Johansen eigenvalue test shows evi-dence of one cointegrating relation between the variables2.
Results of the VECM estimation are presented in Table 4. We start with the long-run coefficients. Theoretically, Trade had an ambiguous relation with FDI. We find a negative relationship which indicates that in the long run, foreign investment and trade are sub-stitutes. However, there is literature that suggests that FDI and trade are complements, such as a study by Zysk and Śmiech (2014) on Visegrad countries and by Erdal and Tatoğlu (2002) on Turkey. Martens (2008) reviews the relationship between FDI and trade and concludes that there is enough evidence to show that trade and FDI are com-plements in emerging countries in most cases, but there are some exceptions, for example, Brazil or OECD FDI to Africa. Also, Kreinin and Plummer (2008) find that trade and FDI act as substitutes in the cases of regional integration. Thus, our finding suggests
2 The eigenvalue statistics are 41.74 and 31.72 for the null of no cointegrating relation and at least one cointe-grating relation, respectively
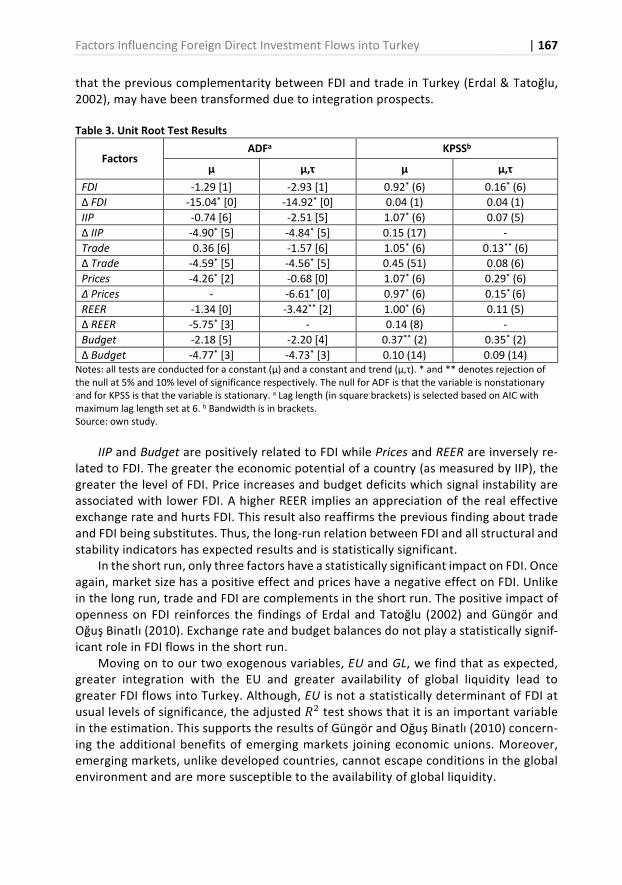
Factors Influencing Foreign Direct Investment Flows into Turkey | 167
that the previous complementarity between FDI and trade in Turkey (Erdal & Tatoğlu, 2002), may have been transformed due to integration prospects.
Table 3. Unit Root Test Results
Factors ADFa KPSSb
µ µ,τ µ µ,τ
FDI -1.29 [1] -2.93 [1] 0.92* (6) 0.16* (6)
∆ FDI -15.04* [0] -14.92* [0] 0.04 (1) 0.04 (1)
IIP -0.74 [6] -2.51 [5] 1.07* (6) 0.07 (5)
∆ IIP -4.90* [5] -4.84* [5] 0.15 (17) -
Trade 0.36 [6] -1.57 [6] 1.05* (6) 0.13** (6)
∆ Trade -4.59* [5] -4.56* [5] 0.45 (51) 0.08 (6)
Prices -4.26* [2] -0.68 [0] 1.07* (6) 0.29* (6)
∆ Prices - -6.61* [0] 0.97* (6) 0.15* (6)
REER -1.34 [0] -3.42** [2] 1.00* (6) 0.11 (5)
∆ REER -5.75* [3] - 0.14 (8) -
Budget -2.18 [5] -2.20 [4] 0.37** (2) 0.35* (2)
∆ Budget -4.77* [3] -4.73* [3] 0.10 (14) 0.09 (14) Notes: all tests are conducted for a constant (µ) and a constant and trend (µ,τ). * and ** denotes rejection of the null at 5% and 10% level of significance respectively. The null for ADF is that the variable is nonstationary and for KPSS is that the variable is stationary. a Lag length (in square brackets) is selected based on AIC with maximum lag length set at 6. b Bandwidth is in brackets. Source: own study.
IIP and Budget are positively related to FDI while Prices and REER are inversely re-lated to FDI. The greater the economic potential of a country (as measured by IIP), the greater the level of FDI. Price increases and budget deficits which signal instability are associated with lower FDI. A higher REER implies an appreciation of the real effective exchange rate and hurts FDI. This result also reaffirms the previous finding about trade and FDI being substitutes. Thus, the long-run relation between FDI and all structural and stability indicators has expected results and is statistically significant.
In the short run, only three factors have a statistically significant impact on FDI. Once again, market size has a positive effect and prices have a negative effect on FDI. Unlike in the long run, trade and FDI are complements in the short run. The positive impact of openness on FDI reinforces the findings of Erdal and Tatoğlu (2002) and Güngör and Oğuş Binatlı (2010). Exchange rate and budget balances do not play a statistically signif-icant role in FDI flows in the short run.
Moving on to our two exogenous variables, EU and GL, we find that as expected, greater integration with the EU and greater availability of global liquidity lead to greater FDI flows into Turkey. Although, EU is not a statistically determinant of FDI at usual levels of significance, the adjusted �� test shows that it is an important variable in the estimation. This supports the results of Güngör and Oğuş Binatlı (2010) concern-ing the additional benefits of emerging markets joining economic unions. Moreover, emerging markets, unlike developed countries, cannot escape conditions in the global environment and are more susceptible to the availability of global liquidity.
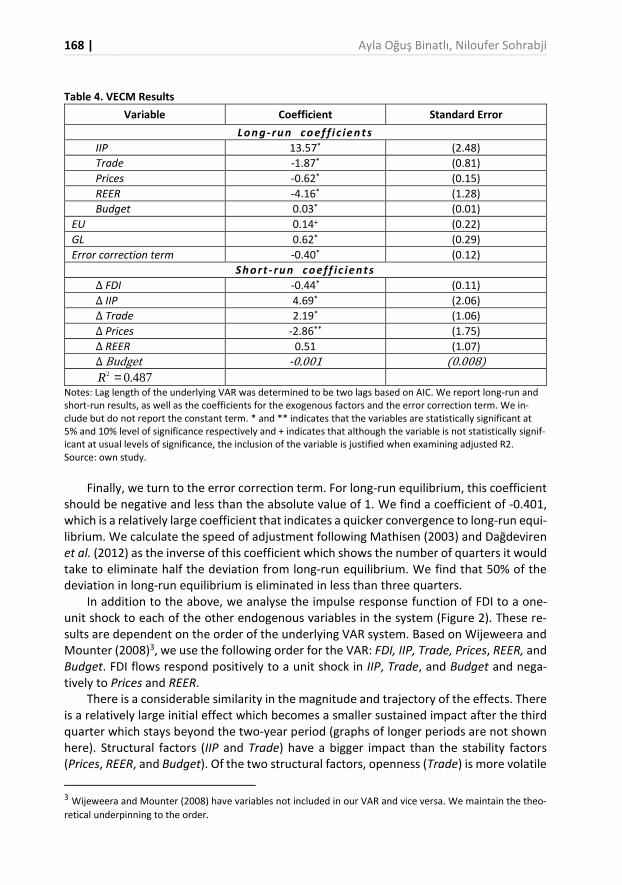
168 | Ayla Oğuş Binatlı, Niloufer Sohrabji
Table 4. VECM Results
Variable Coefficient Standard Error
Long-run coef f i c ien ts
IIP 13.57* (2.48)
Trade -1.87* (0.81)
Prices -0.62* (0.15)
REER -4.16* (1.28)
Budget 0.03* (0.01)
EU 0.14+ (0.22)
GL 0.62* (0.29)
Error correction term -0.40* (0.12)
Short - run coef f ic ients
∆ FDI -0.44* (0.11)
∆ IIP 4.69* (2.06)
∆ Trade 2.19* (1.06)
∆ Prices -2.86** (1.75)
∆ REER 0.51 (1.07)
∆ Budget -0.001 (0.008)
487.02 =R
Notes: Lag length of the underlying VAR was determined to be two lags based on AIC. We report long-run and short-run results, as well as the coefficients for the exogenous factors and the error correction term. We in-clude but do not report the constant term. * and ** indicates that the variables are statistically significant at 5% and 10% level of significance respectively and + indicates that although the variable is not statistically signif-icant at usual levels of significance, the inclusion of the variable is justified when examining adjusted R2. Source: own study.
Finally, we turn to the error correction term. For long-run equilibrium, this coefficient should be negative and less than the absolute value of 1. We find a coefficient of -0.401, which is a relatively large coefficient that indicates a quicker convergence to long-run equi-librium. We calculate the speed of adjustment following Mathisen (2003) and Dağdeviren et al. (2012) as the inverse of this coefficient which shows the number of quarters it would take to eliminate half the deviation from long-run equilibrium. We find that 50% of the deviation in long-run equilibrium is eliminated in less than three quarters.
In addition to the above, we analyse the impulse response function of FDI to a one-unit shock to each of the other endogenous variables in the system (Figure 2). These re-sults are dependent on the order of the underlying VAR system. Based on Wijeweera and Mounter (2008)3, we use the following order for the VAR: FDI, IIP, Trade, Prices, REER, and Budget. FDI flows respond positively to a unit shock in IIP, Trade, and Budget and nega-tively to Prices and REER.
There is a considerable similarity in the magnitude and trajectory of the effects. There is a relatively large initial effect which becomes a smaller sustained impact after the third quarter which stays beyond the two-year period (graphs of longer periods are not shown here). Structural factors (IIP and Trade) have a bigger impact than the stability factors (Prices, REER, and Budget). Of the two structural factors, openness (Trade) is more volatile
3 Wijeweera and Mounter (2008) have variables not included in our VAR and vice versa. We maintain the theo-
retical underpinning to the order.
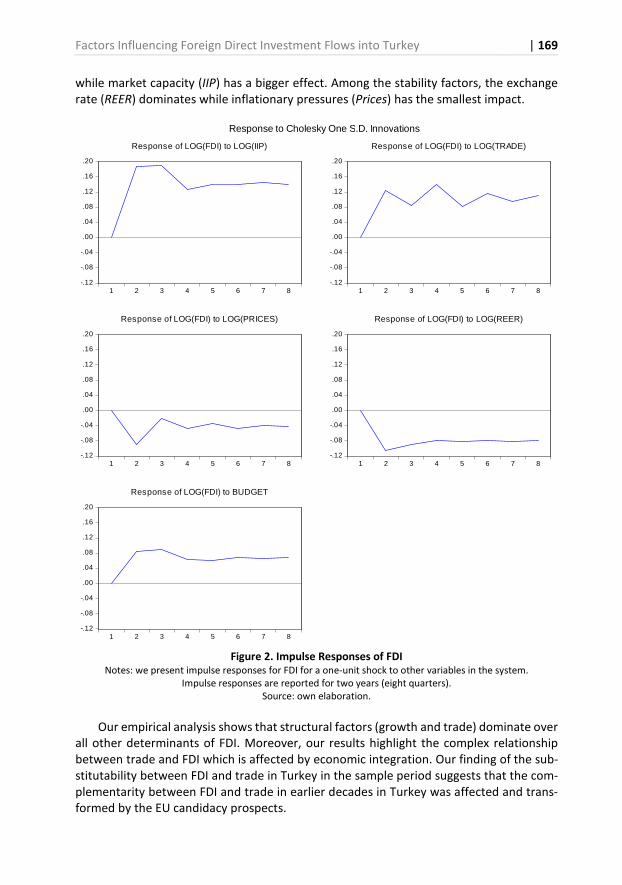
Factors Influencing Foreign Direct Investment Flows into Turkey | 169
while market capacity (IIP) has a bigger effect. Among the stability factors, the exchange rate (REER) dominates while inflationary pressures (Prices) has the smallest impact.
-.12
-.08
-.04
.00
.04
.08
.12
.16
.20
1 2 3 4 5 6 7 8
Response of LOG(FDI) to LOG(IIP)
-.12
-.08
-.04
.00
.04
.08
.12
.16
.20
1 2 3 4 5 6 7 8
Response of LOG(FDI) to LOG(TRADE)
-.12
-.08
-.04
.00
.04
.08
.12
.16
.20
1 2 3 4 5 6 7 8
Response of LOG(FDI) to LOG(PRICES)
-.12
-.08
-.04
.00
.04
.08
.12
.16
.20
1 2 3 4 5 6 7 8
Response of LOG(FDI) to LOG(REER)
-.12
-.08
-.04
.00
.04
.08
.12
.16
.20
1 2 3 4 5 6 7 8
Response of LOG(FDI) to BUDGET
Response to Cholesky One S.D. Innovations
Figure 2. Impulse Responses of FDI
Notes: we present impulse responses for FDI for a one-unit shock to other variables in the system. Impulse responses are reported for two years (eight quarters).
Source: own elaboration.
Our empirical analysis shows that structural factors (growth and trade) dominate over all other determinants of FDI. Moreover, our results highlight the complex relationship between trade and FDI which is affected by economic integration. Our finding of the sub-stitutability between FDI and trade in Turkey in the sample period suggests that the com-plementarity between FDI and trade in earlier decades in Turkey was affected and trans-formed by the EU candidacy prospects.
170 | Ayla Oğuş Binatlı, Niloufer Sohrabji
CONCLUSIONS
In this article, we analyse the factors that affect FDI flows into Turkey. Turkey’s struggles with economic instability (high prices and deficits) as well as the financial crises which led to the introduction of the new Turkish lira and the change in exchange rate regime have important implications for attracting capital flows. In addition, Turkey’s experience with reforms that liberalised the economy in response to earlier crises as well as due to the EU accession make the country an important case study.
Using cointegration and vector error correction methodology we estimate a long-run and a short-run impact of market size and openness (structural factors) and prices, exchange rates, budget balances (stability factors). Structural factors play an important role in the long- and short- run, while stability factors only matter in the long run (except prices which are also important in the short run). The EU accession and the availability of liquidity (global factors) also have an impact on FDI.
The role of trade is important and complex. Trade and foreign investment were com-plementary in the short run. This means that the reforms that have liberalised Turkey’s trade regime helped attract capital flows although the impulse responses show some volatility. A related result is that the period since the EU accession talks began (which increased trade opportunities with the EU common market) saw increased FDI flows. In the long run, however, trade is shown to be a substitute for FDI. This result is striking given that trade continues to be an integral part of Turkey’s development strategy. Our results show that short-run and long-run effects of FDI on trade could be different, which might explain some of the mixed results in the literature. On the other hand, a lot of the recent FDI into Turkey was in the services, which may be clouding our results about the impact of trade on FDI and thus needs further research.
What lessons does Turkey offer to other countries? For emerging markets trying to attract capital flows, Turkey provides a useful insight. Our study shows that emerging markets like Turkey are susceptible to global liquidity constraints. Stabilisation efforts to control prices, exchange rates, and budgets matter, but not as much as structural reforms that impact market potential and trade flows. Moreover, it confirms that there are additional benefits for emerging markets that are joining economic unions. It is im-portant to be cautious about the conclusions. While our study shows the importance of these structural, stability, and global factors on FDI flows in general, individual firms may experience the impact very differently. Thus, a micro-based firm-level analysis of FDI inflows would be a useful complement to this study.
REFERENCES
Abbas, S., & Mosallamy, D.E. (2016). Determinants of FDI flows to developing countries: An empirical study on the MENA region. Journal of Finance and Economics, 4(1), 30-38. Retrieved from http://pubs.sciepub.com/jfe/4/1/4/ on October 1, 2018 .
Aristotelous, K., & Fountas, S. (2012). What is the impact of currency unions on FDI flows? Evidence from eurozone countries. South-Eastern Europe Journal of Economics, 10(2), 87-98. Retrieved from https://EconPapers.repec.org/RePEc:mcd:mcddps:2009_10 on October 1, 2018.
Factors Influencing Foreign Direct Investment Flows into Turkey | 171
Arslan I., & Oğuş Binatlı, A. (2010). A stochastic frontier analysis of foreign direct investment and growth. Proceedings of the International Conference on International Business. Thessaloniki, 22-23 May.
Baks, K., & Kramer, C. (1999). Global liquidity and asset prices: Measurement, implications and spill-overs. IMF Working Paper, No. 168.
Belke, A., Orth, W., & Setzer, R. (2008). Liquidity and the dynamic pattern of price adjustment: A global view. Deutsche Bundesbank Eurosystem Discussion Paper Series 1: Economic Studies, No. 25. Retrieved from https://EconPapers.repec.org/RePEc:zbw:bubdp1:7564 on October 1, 2018 .
Bevan, A., & Estrin, S. (2004). The determinants of foreign direct investment into European transition econ-omies. Journal of Comparative Economics, (32), 775-787. https://doi.org/10.1016/j.jce.2004.08.006
Bilgili, F., Tülüce, N.S.H., & Doğan, İ. (2012). The determinants of FDI in Turkey: A Markov regime-switching approach. Economic Modelling, 29(4), 1161-1169. https://doi.org/10.1016/j.econmod.2012.04.009
Buch, C.M., Kokta, R.M., & Piazolo, D. (2003). Foreign direct investment in Europe: Is there redirec-tion from the South to the East?. Journal of Comparative Economics, 31(1), 94-109. https://doi.org/10.1016/S0147-5967(02)00013-6
Choong, C-K., & Lam, S-Y. (2010). The determinants of foreign direct investment in Malaysia: A re-visit. Global Economic Review, 39(2), 175-195. https://doi.org/10.1080/1226508X.2010.483837
Dağdeviren, Ş., Oğuş Binatlı, A., & Sohrabji, N. (2012). Misalignment under different exchange rate regimes: The case of Turkey. International Economics, 130, 81-98. https://doi.org/10.1016/S2110-7017(13)60045-1
Damooei, J., & Tavakoli, A. (2006). The effects of foreign direct investment and imports on economic growth: A comparative analysis of Thailand and Philippines (1970-1998). The Journal of Devel-
oping Areas, 39(2), 79-100. https://doi.org/10.1353/jda.2006.0002
Dumludag, D. (2009). An analysis of the determinants of foreign direct investment in Turkey: The role of the institutional context. Journal of Business Economics and Management, 10(1), 15-30. https://doi.org/10.3846/1611-1699
Erdal, F., & Tatoğlu, E. (2002). Locational determinants of foreign direct investment in Turkey: A time series analysis. Multinational Business Review, 10(1), 21-27. Retrieved from http://citese-erx.ist.psu.edu/viewdoc/download?doi=10.1.1.456.4487&rep=rep1&type=pdf on October 1, 2018.
Esen, B., & Gümüşçü, S. (2017). Turkey: How the coup failed. Journal of Democracy, 28(1), 59-73. https://doi.org/10.1353/jod.2017.0006
Güneyli, A., Ersoy, M., & Kiralp, Ş. (2017). Terrorism in the 2015 election period in Turkey: Content analysis of political leaders’ social media activity. Journal of Universal Computer Science, 23(3), 256-79. Retrieved from http://dx.doi.org/10.3217/jucs-023-03-0256 on October 1, 2018.
Güngör, H., & Oğuş Binatlı, A. (2010). The effect of European accession prospects on foreign direct investment flows. Izmir University of Economics Working Papers in Economics, Working Paper No. 10/06. Retrieved from https://eco.ieu.edu.tr/wp-content/wp1006.pdf on October 1, 2018.
Hanson, G. (2001). Should countries promote foreign direct investment? No 9, G-24 Discussion Pa-
pers, United Nations Conference on Trade and Development. Retrieved from https://EconPa-pers.repec.org/RePEc:unc:g24pap:9 on October 1, 2018.
Helpman, E. (1984). A simple theory of international trade with multinational corporations. Journal
of Political Economy, 92(3), 451-471. Retrieved from https://www.jstor.org/stable/1837227 on October 1, 2018.
Hummels, D., Ishii, J., & Yi, K-M. (2001). The nature and growth of vertical specialization in world trade. Journal of International Economics, 54(1), 75-96. Retrieved from https://ideas.repec.org/a/eee/inecon/v54y2001i1p75-96.html on October 1, 2018.
172 | Ayla Oğuş Binatlı, Niloufer Sohrabji
İzmen, Ü., & Yılmaz, K. (2009). Turkey’s recent trade and foreign direct investment performance. Turkey and the Global Economy. London: Routledge, 173-204.
Johnson, A. (2006). The effects of FDI inflows on host country economic growth. Working Paper Se-
ries in Economics and Institutions of Innovation 58, Royal Institute of Technology, CESIS – Centre
of Excellence for Science and Innovation Studies. Retrieved from https://econpa-pers.repec.org/RePEc:hhs:cesisp:0058 on October 1, 2018.
Kapuria-Foreman, V. (2007). Economic freedom and foreign direct investment in developing coun-tries. The Journal of Developing Areas, 41(1), 143-54. https://doi.org/10.1353/jda.2008.0024
Keller, W., & Yeaple, S.R. (2009). Multinational enterprises, international trade, and productivity growth: Firm-level evidence from the United States. The Review of Economics and Statis-
tics, 91, 821-831. https://doi.org/10.1162/rest.91.4.821
Kisswani, K.M., Klein, A., & Shetty, S. (2015). The impact of FDI inflows on real GDP in Estonia: Evi-dence from a cointegration approach and causality test. The Journal of Developing Areas, 49(4), 25-40. https://doi.org/10.1353/jda.2015.0127
Kreinin, M.E., & Plummer, M.G. (2008). Effects of regional integration on FDI: An empirical approach. Journal of Asian Economics, 19(5-6), 447-454. https://doi.org/10.1016/j.asieco.2008.09.005
Kumar, A. (2007). Does foreign direct investment help emerging economies?. Economic Letter, 2(1), 1-8.
MacDermott, R. (2007). Regional trade agreement and foreign direct investment. The North American
Journal of Economics and Finance, 18(1), 107-116. https://doi.org/10.1016/j.najef.2006.09.004
Martens, A. (2008). Trade liberalization and foreign direct investment (FDI) in emerging countries: An empirical survey. Department of Economics, University of Montreal.
Marszk, A. (2014). Economic Integration and Foreign Direct Investment: Review of Main Theoretical Concepts. Entrepreneurial Business and Economics Review, 2(3), 79-89. https://doi.org/10.15678/EBER.2014.020307
Nas, T.F., & Odekon, M. (1996). Effects of post-1980 macroeconomic policies on Turkish manufac-turing. The Journal of Developing Areas, 30(2), 211-22. Retrieved from https://www.jstor.org/stable/4192540 on October 1, 2018.
Nonnenberg, M.J.B., & Mendonça, M.J.C. (2004). The determinants of direct foreign investment in developing countries (January). Retrieved from https://doi.org/10.2139/ssrn.525462 on Octo-ber 1, 2018.
Oğuş Binatlı, A., & Sohrabji, N. (2008). Analyzing the present sustainability of Turkey’s current ac-count position. Journal of International Trade and Diplomacy, 2(2), 171-209. Retrieved from https://EconPapers.repec.org/RePEc:izm:wpaper:0803 on October 1, 2018.
Omelańczuk, M. (2013). Export Platform FDI as a Concept for Growth. Entrepreneurial Business and
Economics Review, 1(1), 91-102. https://doi.org/10.15678/EBER.2013.010107
Rachdi, H., & Saidi, H. (2011). The impact of foreign direct investment and portfolio investment on economic growth in developing and developed economies. Interdisciplinary Journal of Research
in Business, 1(6), 10-17.
Rüffer, R., & Stracca, L. (2006). What is global excess liquidity and does it matter?. European Central
Bank Working Paper Series, No. 696. Retrieved from https://EconPa-pers.repec.org/RePEc:ecb:ecbwps:2006696 on October 1, 2018.
Sayek, S. (2007). FDI in Turkey: The investment climate and EU effects. The Journal of International
Trade and Diplomacy, 1(2), 105-38.
Schiavo, S. (2007). Common currencies and FDI flows. Oxford Economic Papers, 59(3), 536-560. https://doi.org/10.1093/oep/gpl036
Factors Influencing Foreign Direct Investment Flows into Turkey | 173
Somer, M. (2016). Understanding Turkey’s democratic breakdown: Old vs. new and indigenous vs. global authoritarianism. Southeast European and Black Sea Studies, 16(4), 481-503. https://doi.org/10.1080/14683857.2016.1246548
Sunny, D. (2015). Do the FDI inflows affect domestic investment?: Issues Before India and South Asia. The Journal of Developing Areas, 49(6), 173-87. https://doi.org/10.1353/jda.2015.0108
Tian, X., Lo, V., & Song, M. (2015). FDI technology spillovers in China: Implications for developing coun-tries. The Journal of Developing Areas, 49(6), 37-48. https://doi.org/10.1353/jda.2015.0082
Ucal, M., Bilgin, M., Özcan, K., & Mungo, J. (2010). Relationship between financial crisis and foreign direct investment in developing countries using semiparametric regression approach. Journal
of Business Economics and Management, 11(1), 20-33. https://doi.org/10.3846/jbem.2010.02
Yardimci-Geyikçi, Ş. (2014). Gezi Park protests in Turkey: A party politics view. The Political Quarterly, 85(4), 445-53. https://doi.org/10.1111/1467-923X.12112
Wijeweera, A., & Mounter, S. (2008). A VAR analysis on the determinants of FDI inflows: The case of Sri Lanka. Applied Econometrics and International Development, 8(1), 189-98. Retrieved from https://EconPapers.repec.org/RePEc:eaa:aeinde:v:8:y:2008:i:1_16 on October 1, 2018.
Wijeweera, A., Villano, R., & Dollery, B. (2010). Economic growth and FDI inflows: A stochastic fron-tier analysis. The Journal of Developing Areas, 43(2), 143-58. Retrieved from http://doi.org/10.1353/jda.0.0059 on October 1, 2018.
Zysk, W., & Śmiech, S. (2014). The Influence of Foreign Direct Investment on Foreign Trade in the Visegrád Countries from 2001 to 2011. Entrepreneurial Business and Economics Review, 2(3), 7-18. https://doi.org/10.15678/EBER.2014.020302
174 | Ayla Oğuş Binatlı, Niloufer Sohrabji
Authors
The contribution share of authors is equal and amounted to 50% each of them.
Ayla Oğuş Binatlı
Bachelor of Arts in Economics (Boğaziçi University, İstanbul, Turkey); PhD in Economics (Boston College, Boston, MA, USA). Her research interests include international economics and environ-mental economics. Correspondence to: Prof. Ayla Oğuş Binatlı, PhD, İzmir University of Economics, Deptartment of Economics, 156 Sakarya Cad. 35330 Balçova, İzmir, Turkey, e-mail: [email protected] ORCID http://orcid.org/0000-0002-8291-0010
Niloufer Sohrabji
Bachelor of Arts in Economics (St. Xavier’s College, Mumbai, India); PhD in Economics (Boston College, Boston, MA, USA). Her research interests include international economics and develop-ment economics. Correspondence to: Prof. Niloufer Sohrabji, PhD, Simmons University, Department of Economics, 300 Fenway, Boston, MA 02115, USA, e-mail: [email protected] ORCID http://orcid.org/ 0000-0003-4154-4568
Acknowledgements and Financial Disclosure
The authors would like to thank anonymous referees for their useful comments, which have im-proved the quality of this article.
Copyright and License
This article is published under the terms of the Creative Commons Attribution – NoDerivs (CC BY-ND 4.0) License
http://creativecommons.org/licenses/by-nd/4.0/
Published by the Centre for Strategic and International Entrepreneurship – Krakow, Poland
The copyediting and proofreading of articles in English is financed in the framework of contract No. 913/P-DUN/2019 by the Ministry of Science and Higher Education of the Republic of Poland committed to activities aimed at science promotion.
2019, Vol. 7, No. 2 10.15678/EBER.2019.070210
Progress of the V4 Countries towards the EU’s Energy
and Climate Targets in the Context of Energy
Security Improvement
Agnieszka Pach-Gurgul, Marta Ulbrych
A B S T R A C T
Objective: The aim of this article is to conduct an empirical verification of progress in im-plementing the provisions of the EU Energy Package and to assess this process in the con-text of opportunities to boost the energy security of the V4 countries by more efficient energy consumption, using renewable energy and reducing emission of greenhouse gases.
Research Design & Methods: The diagnosis is based on the determination of a taxo-nomic measure using Hellwig’s multidimensional comparative analysis method. Then, a linear grouping of objects is used on the basis of changes in the value of indicators in order to prepare a ranking of the EU member states.
Findings: Considering all EU member countries, the V4 economies record an average rating in the implementation of the energy and climate framework. Slovakia and Hun-gary are ranked the highest, Poland and the Czech Republic – the lowest.
Implications & Recommendations: The research and discussion might be interesting for policymakers and may have an application value for institutions dealing with energy security and climate policy in the V4 countries.
Contribution & Value Added: The study measures progress in the implementation of the energy and climate package in the context of its importance for the energy security of the V4 economies. The work also presents the results of our own research based on taxonomic methods. Using a synthetic variable, a ranking of the EU members and their classification is elaborated according to the level of the indicators studied.
Article type: research article
Keywords: The EU’s Energy Package; energy security; Visegrad group countries JEL codes: K32, Q56
Received: 30 August 2018 Revised: 2 March 2019 Accepted: 4 March 2019
Suggested citation:
Pach-Gurgul, A., & Ulbrych, M. (2019). Progress of V4 Countries towards the EU’s Climate and Energy Targets in the Context of the Energy Supply Security Improvement. Entrepreneurial Business and
Economics Review, 7(2), 175-197. https://doi.org/10.15678/EBER.2019.070210
176 | Agnieszka Pach-Gurgul, Marta Ulbrych
INTRODUCTION
The countries of the European Union are striving to diversify the structure of their en-ergy sources by looking for solutions which would be both economically efficient and environmentally friendly. The European Union is undertaking a number of initiatives to promote the modernisation of the energy sector, a fact that is manifested in numerous directives regulating the functioning of the sector. This study focuses on the climate and energy framework adopted in 2008, which comprises a body of binding regulations aimed at carrying out tasks related to climate and energy challenges by 2020. The initi-ative concentrates on three key objectives, including the reduction of greenhouse gas emissions by 20%, an increase of renewable sources in the EU energy balance by 20%, and a growth of energy efficiency by 20% (20-20-20). The objectives, defined in such a way, are based on the three pillars of the EU energy policy, i.e. energy security, com-petitive markets, and sustainable development.
This research is focused primarily on the dimension of energy security which, in a long-term perspective, deals with timely investments to supply energy in line with economic developments and sustainable environmental needs (International Energy Agency: IEA, 2019). Hence, rationalising the consumption of energy and improving the energy efficiency of the generation and transmission systems are to provide a guarantee of strengthening the energy security of the European economies (Simanaviciene, Volochovic, & Cibinskiene, 2016). The need to accomplish these tasks is clear in the context of a general downward trend in primary energy production – in 2016, the European Union countries produced 14.7% less energy than a decade before. Decreasing production of primary energy results in a situation where meeting the EU demand increasingly depends on energy imports. This dependence grew from 40% of energy gross consumption in 1990, to 53.6% in 2016 (Eu-rostat, t2020_rd320). Naturally, the conditions of the member countries in this respect are varied; nevertheless, security of energy supply poses a significant problem for all econo-mies, including the Visegrad Group countries (V4) (Czech, 2017). A study conducted by the Kosciuszko Institute in 2011 contains a comparative analysis of the V4 countries’ energy security and indicates that these countries experience similar energy related problems which stem from being dependent on import resources from one direction, apparent di-versification, illusory coal-based energy security and the need to significantly reduce CO2
emissions (Kovács et al., 2011). Currently, Slovakia and Hungary, despite a reduction in recent years, are economies whose dependence on energy imports is above average com-pared to the EU. On the other hand, Poland and the Czech Republic are relatively less de-pendent, and yet, their dependence is growing.
The adopted energy targets should contribute to making the EU less dependent on energy imports as the consumption of fossil fuels is reduced to limit greenhouse emissions (Siddi, 2016, p. 135) and the share of renewable energy sources is increased (Slaboch & Hálová, 2016). Assuming that the 2020 targets are compatible with an improvement in the V4 economies’ energy security, the main aims of the study is to diagnose the degree of 20-20-20 strategy realisation. Moreover, this article is a chance to fill a gap in research into the energy and climate package in the context of its significance for the energy security of the Visegrad Group countries, which gives an innovative character to the current studies.
Progress of the V4 Countries towards the EU’s Energy and Climate Targets… | 177
The grounds for the choice of research problem allowed us to formulate the following hypothesis: a systematic execution of the objectives of the package will allow the V4 countries to increase the level of energy security in their economies by means of rationalising their en-ergy consumption, and also by increasing the share of renewable energy sources in their total energy consumption and by reducing the emission of greenhouse gases. The objective of this article is to evaluate the degree of implementation of the 20-20-20 objectives by the V4 coun-tries, and to assess the possibility of comparing the achievements of these countries in this area. This is meant to result in formulating conclusions with an applicable value for institutions involved in energy security, energy or climate policy in these countries.
In order to rank the implementation of the strategy as adopted in the EU member countries, Hellwig’s multivariate analysis method is used. Hellwig’s taxonomic develop-ment measure synthesises information in a sequence of diagnostic variables and attributes aggregate one measure to the analysed phenomenon. Indicators related to energy use, the share of renewable sources and emissions of greenhouse gases have been considered as key factors to monitoring changes. The research is based on an analysis of the EU source documentation and a statistical study of the analysed phenomena.
The structure of this article is organised as follows: the first section presents a litera-ture review and a development of energy security theory. Then the essence of the energy and climate package in the context of the energy security of the V4 countries is explained. In section 2, the procedure for the selection of diagnostic variables, the taxonomic method and a preliminary analysis of the statistical information collected are presented. In the next, third section, the focus is on a presentation of the empirical results of the study, and subsequently, conclusions and implications are developed.
LITERATURE REVIEW
In Abraham Maslow’s theory of needs, the second level in the fulfilment hierarchy, imme-diately above physiological needs, is occupied by safety needs. Once these are satisfied, a human being thinks about the fulfilment of higher needs (Mitchell & Moudgill, 1976). In safety typology, energy security is regarded as a very important type of safety, making up an essential constituent of a generally understood safety defined as the national security of a country (Chester, 2010; Dyer & Trombetta, 2013).
The source literature presents a variety of definitions of energy security. This multi-tude of definitions is continually evolving with regards to the changing character of safety as an entity, condition, process or phenomenon. The literature on the subject contains a debate about both the object and the subject of safety. Safety can be defined with regards to an individual, a local and regional community, a state and the international community. Many researchers, such as Kruyt et al., (2009), Winzer (2012) and Narula and Reddy (2015) agree that no consensus exists around one complete and universal definition of energy se-curity, as it is an equivocal, multifaceted dynamic term. Currently, it is closely connected with the policy of sustainable development, economic factors, the development of energy markets and socio-economic changes in IT technologies or in transport, facts which are clearly stressed in the research by Radovanović, Filipović and Pavlovićc (2017).
The simplest definition refers to energy security as: ‘the availability of sufficient sup-plies at an affordable price’ (Yergin, 2006). The constituents of such security comprise: market integration (crude oil, gas, electricity), diversification of resources, safety margin
178 | Agnieszka Pach-Gurgul, Marta Ulbrych
(e.g. in a form of the reserves of energy raw materials). A detailed definition covers, with its scope, ‘the availability of energy at any time, in various forms, in sufficient quantity and at a reasonable price and/or an affordable price’ (Månsson et al. 2014; Nyga-Łukaszewska & Chilimoniuk-Przeździecka, 2017). Energy security can also be defined as ‘the availability of adequate energy at an affordable and reliable price, necessary both from the technological point of view and also from the perspectives of human security’ (Wang et al., 2018; Sovacool, 2013, Augutis et al., 2012).
In practice, energy security concerns many aspects, not only of a strategic and geopolitical character, referring first of all to the effects of the dependence on the import of raw materials and those resources of which an entity is in possession (Chalvatzis & Ioannidis, 2017; Kiriyama & Kajikawa, 2014; Semenenko, 2016; Gunnar Austvik, 2016), but also to other aspects (Dannreuhter, 2017; Jamasb & Pollit, 2008; Xia et al., 2011; Zajączkowska, 2016), namely:
− economic – for a consumer, this means the ability to purchase necessary energy at an affordable price,
− ecological – concerning respect for the natural environment, among other things, by means of the limitation of the use of conventional fuels, which is meant to reduce the emission of CO2, or the use of new environment-friendly technologies, e.g. CCS (carbon capture and storage),
− infrastructural – as the condition of infrastructure, the lack of financing and investments into infrastructure have a direct impact on the energy security of a given country.
According to the IEA, energy security in practice should be perceived as a problem per-taining to risk management, i.e. ‘the reduction of risk and consequences of disruptions to an acceptable level’ (IEA, 2007). The condition of energy security may be described as the unin-terrupted/continual possibility to access energy at an affordable price, taking account, at the same time, of issues related to the protection of the natural environment. The IEA differen-tiates between energy security in a long-term and short-term context. Energy security in a long-term context is strongly connected with planned or executed investments (into infra-structure in particular) which are meant to facilitate the energy supply, and, at the same time, energy security is strongly correlated with the economic development of a given coun-try and the needs of the natural environment. Short-term energy security, then, in the view of the IEA, is seen as the capability of a prompt reaction of the energy system to sudden changes in energy demand and supply. Such an understanding of energy security is also re-ferred to in various academic publications and research projects (Sovacool et al., 2011, Cherp & Jewell, 2011). Thus, it can be observed that a number of research projects emphasise an interdisciplinary approach to energy security (Månsson, 2014; Cipollaro & Lomonaco, 2016; Löschel, Moslener, & Rübbelke, 2010; Kapustová, Kapusta, & Bielik, 2018).
The problem of energy security was treated as a political issue for many years, with lesser significance for the economy of a given country. After the end of WWII, the general accessibility of energy raw materials and their relatively low prices resulted in the fact that the problem of supplying economies with energy was not perceived in strategic terms. Yet, such events as the oil crisis of 1973, the end of the cold war, or the sudden increase in the prices of energy raw materials resulted in a change of approach towards the theory of energy security and heated up the debate on this subject, in particular in the context of crude oil substitutes or the diversification of the methods of its acquisition, which has been observed by Proskuryakova (2011) or Markandya and Pemberton (2010). However, even
Progress of the V4 Countries towards the EU’s Energy and Climate Targets… | 179
so this issue was still not a priority in the policy of the majority of world countries. It was only the record-breaking prices of crude oil in the summer of 2008, the second war in Iraq, the problem of global warming, the world economic crisis and its consequences for the prices of raw materials and for investments in the energy sector that brought the debate on energy security back onto the table. It was then that priority and strategic significance for the functioning of particular states was attributed to the above issue, a fact that is confirmed in the studies by Goldthau (2011), and also Zhou et al. (2018).
With the progress of time, the subject of energy security has become essential for the European Union, which is currently the world’s largest importer of primary energy, as more than half of the energy consumed in the EU (53.6%) is imported (European Commis-sion, 2018). At the same time, this is an import from a relatively small number of suppliers which implies a potential threat to energy security. The fact that about 30% of each of the key energy carriers today (crude oil, natural gas or coal) imported into the EU, is purchased from Russia (European Commission, 2018) is especially disadvantageous. Unfortunately, this dependence has persisted for many years, a fact which is observed in many research analyses (Costantini et al., 2006; Jääskeläinen et al., 2018). The breakthrough in the Euro-pean Union in the perception of energy security came with the gas crises between Russia and Ukraine in January 2006, and in particular, in January 2009. These conflicts delineated the importance of the energy security of the EU and the threats which existed in energy supply and distribution. As a result of the crisis in 2009, gas supply to a total 300 million cubic meters per day was cut off for 14 days, and as a result, in the period between 6th and 20th January, the EU countries were deprived of 20% of their gas, a fact which had grave economic consequences. The loss sustained by the EU countries was estimated to be 1.6 billion EUR (Lee, 2017). Many researchers point out that concerns about energy security began to grow even more in the face of the new political conflict between Russia and Ukraine in 2014 (Van de Graaf & Colgan, 2017; Goldthau & Boersma, 2014).
As a result of the gas crises, the Visegrad Group countries also sustained a lot of harm. Their sense of energy security was strongly shaken. The source literature and academic analyses point to the fact that these countries still have a poorly developed gas pipeline infrastructure in directions other than east-west and they are strongly dependent on the import of Russian gas, which is supplied through Ukraine (Gálová, 2013). These countries experienced significant disturbances in the supply of gas during that period. Only the Czech Republic imported some amount of gas through the system of the German gas supply net-work, which compensated for the shortages in Russian supplies. All the other countries could only rely on their strategic reserves. The country that suffered the most as a result of the supply cut-off was Slovakia (Muller-Kraenner, 2007). It was for the first time in its history that it was completely cut off from external gas supplies. Poland did not receive 80% of its planned supplies and Hungary 60%.
This is why, over the course of time, the EU leaders have undertaken efforts aimed at the limitation of the dependence on imports of raw materials and at strengthening the energy security of the EU in all other aspects. This is why actions were initiated aimed at a broadly defined diversification of the new suppliers of energy raw materials, such as Canada, the USA or China. At the same time, solutions influencing the EU energy security in many aspects have been sought (Marquina, 2008). This was the context of the prepara-tion of the energy and climate package, not only in this strategic and political aspect, but
180 | Agnieszka Pach-Gurgul, Marta Ulbrych
also in an economic, ecological and infrastructural one, a fact which is also pointed out in the studies by Skjærseth (2013), Helm, (2014) and also Christa Uusi-Rauva (2010).
The Essence of the Energy and Climate Package in the Context
of the Energy Situation of the Visegrad Group Countries
On 23rd January 2008, the European Commission presented the energy and climate pack-age, which constitutes a collection of objectives and goals which are intended to be achieved by 2020 by the European Union in its energy and climate policy. This Package is known as 3x20% or 20-20-20 by 2020, with its main objectives being:
1. An increase of the share of the energy obtained from renewable sources of energy (RSE) to 20% in the total energy balance of the European Union by 2020.
2. A limitation of the primary energy consumption in the European Union by 20% in com-parison with the prognosis made for 2020, and presented in 2005.
3. A reduction of CO2 emission by 20%, in comparison with the level of emissions from 1990.
This undertaking put an obligation on the member states to implement the main Di-rectives in this respect (European Commission, 2012; European Commission, 2013; Euro-pean Parliament and the Council of the European Union, 2009), and thus to amend their national energy policies, which is by no means an easy task due to the diversity of the energy cultures of these countries, a fact which is pointed out in the research of Stephen-son et al. (2010), Love, Rupp and Strauss (2013), Tapio et al. (2007), and Campbell (2002). The objectives of the energy and climate package have become so significant that they were also confirmed in the ‘Europe 2020’ Strategy (European Commission, 2010). The lit-erature on this subject shows a dispute as to whether this document really makes any contribution to the energy security of the EU (Henriksen, Hussey, & Holm, 2011), or whether it rather implies unnecessary costs for these countries and should rather be simply amended (McKillop, 2012). The package defines the main objectives for the entire European Union: 3x20% by 2020, consisting of individual objectives concerning the share of renewable energy in their energy mixes and also the reduction of CO2 emission and a decrease in the primary or final energy consumption. These objectives vary between the member states with regards to the diversity of their raw material supplies, their national energy mixes, the energy consumption level of their industries, their GDP per capita, their national energy policy, etc. (Pach-Gurgul, 2016).
The execution of the provisions of the energy and climate package poses a significant challenge for all the EU countries. There are many academic and research papers concern-ing the execution of the energy and climate package by specific EU member states, such as Germany (Eikeland, 2014) or the Netherlands (Gulbrandsen, Skjærseth, & Birger, 2014), or discussing the subject in the context of their economic growth (Smiech & Papież, 2014). There is, however, no research concerning the execution of the objectives of the energy and climate package by the Visegrad Group countries, which have a very specific energy situation, especially in the context of their energy security which was the main motivation for the Authors of this study to take up this subject.
These countries, after the Second World War, found themselves under the hegemony of the Soviet Union, with very strong connections to that country, resulting from economic treaties and military pacts. The common historic heritage of these countries with centrally
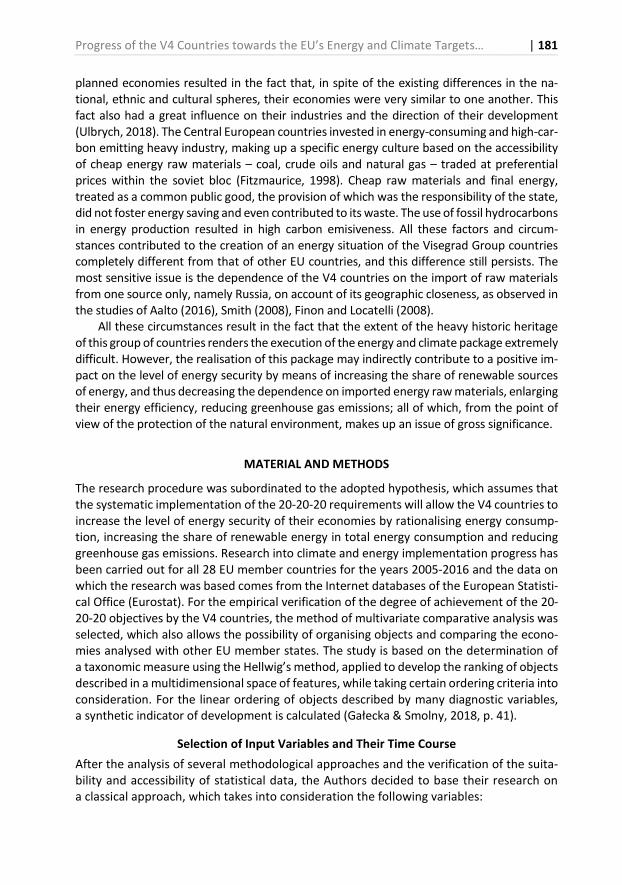
Progress of the V4 Countries towards the EU’s Energy and Climate Targets… | 181
planned economies resulted in the fact that, in spite of the existing differences in the na-tional, ethnic and cultural spheres, their economies were very similar to one another. This fact also had a great influence on their industries and the direction of their development (Ulbrych, 2018). The Central European countries invested in energy-consuming and high-car-bon emitting heavy industry, making up a specific energy culture based on the accessibility of cheap energy raw materials – coal, crude oils and natural gas – traded at preferential prices within the soviet bloc (Fitzmaurice, 1998). Cheap raw materials and final energy, treated as a common public good, the provision of which was the responsibility of the state, did not foster energy saving and even contributed to its waste. The use of fossil hydrocarbons in energy production resulted in high carbon emisiveness. All these factors and circum-stances contributed to the creation of an energy situation of the Visegrad Group countries completely different from that of other EU countries, and this difference still persists. The most sensitive issue is the dependence of the V4 countries on the import of raw materials from one source only, namely Russia, on account of its geographic closeness, as observed in the studies of Aalto (2016), Smith (2008), Finon and Locatelli (2008).
All these circumstances result in the fact that the extent of the heavy historic heritage of this group of countries renders the execution of the energy and climate package extremely difficult. However, the realisation of this package may indirectly contribute to a positive im-pact on the level of energy security by means of increasing the share of renewable sources of energy, and thus decreasing the dependence on imported energy raw materials, enlarging their energy efficiency, reducing greenhouse gas emissions; all of which, from the point of view of the protection of the natural environment, makes up an issue of gross significance.
MATERIAL AND METHODS
The research procedure was subordinated to the adopted hypothesis, which assumes that the systematic implementation of the 20-20-20 requirements will allow the V4 countries to increase the level of energy security of their economies by rationalising energy consump-tion, increasing the share of renewable energy in total energy consumption and reducing greenhouse gas emissions. Research into climate and energy implementation progress has been carried out for all 28 EU member countries for the years 2005-2016 and the data on which the research was based comes from the Internet databases of the European Statisti-cal Office (Eurostat). For the empirical verification of the degree of achievement of the 20-20-20 objectives by the V4 countries, the method of multivariate comparative analysis was selected, which also allows the possibility of organising objects and comparing the econo-mies analysed with other EU member states. The study is based on the determination of a taxonomic measure using the Hellwig’s method, applied to develop the ranking of objects described in a multidimensional space of features, while taking certain ordering criteria into consideration. For the linear ordering of objects described by many diagnostic variables, a synthetic indicator of development is calculated (Gałecka & Smolny, 2018, p. 41).
Selection of Input Variables and Their Time Course
After the analysis of several methodological approaches and the verification of the suita-bility and accessibility of statistical data, the Authors decided to base their research on a classical approach, which takes into consideration the following variables:
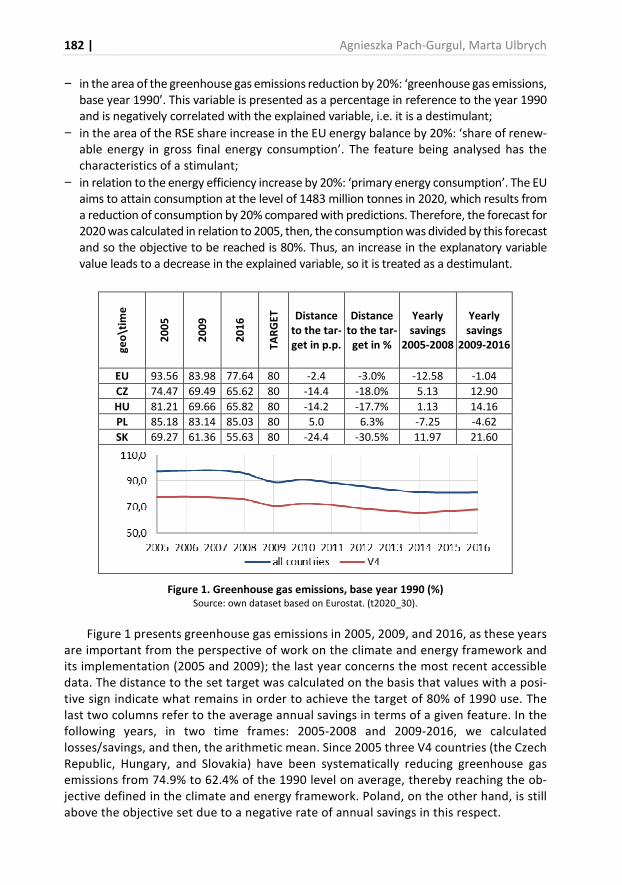
182 | Agnieszka Pach-Gurgul, Marta Ulbrych
− in the area of the greenhouse gas emissions reduction by 20%: ‘greenhouse gas emissions, base year 1990’. This variable is presented as a percentage in reference to the year 1990 and is negatively correlated with the explained variable, i.e. it is a destimulant;
− in the area of the RSE share increase in the EU energy balance by 20%: ‘share of renew-able energy in gross final energy consumption’. The feature being analysed has the characteristics of a stimulant;
− in relation to the energy efficiency increase by 20%: ‘primary energy consumption’. The EU aims to attain consumption at the level of 1483 million tonnes in 2020, which results from a reduction of consumption by 20% compared with predictions. Therefore, the forecast for 2020 was calculated in relation to 2005, then, the consumption was divided by this forecast and so the objective to be reached is 80%. Thus, an increase in the explanatory variable value leads to a decrease in the explained variable, so it is treated as a destimulant.
ge
o\t
ime
20
05
20
09
20
16
TA
RG
ET
Distance
to the tar-
get in p.p.
Distance
to the tar-
get in %
Yearly
savings
2005-2008
Yearly
savings
2009-2016
EU 93.56 83.98 77.64 80 -2.4 -3.0% -12.58 -1.04
CZ 74.47 69.49 65.62 80 -14.4 -18.0% 5.13 12.90
HU 81.21 69.66 65.82 80 -14.2 -17.7% 1.13 14.16
PL 85.18 83.14 85.03 80 5.0 6.3% -7.25 -4.62
SK 69.27 61.36 55.63 80 -24.4 -30.5% 11.97 21.60
Figure 1. Greenhouse gas emissions, base year 1990 (%) Source: own dataset based on Eurostat. (t2020_30).
Figure 1 presents greenhouse gas emissions in 2005, 2009, and 2016, as these years are important from the perspective of work on the climate and energy framework and its implementation (2005 and 2009); the last year concerns the most recent accessible data. The distance to the set target was calculated on the basis that values with a posi-tive sign indicate what remains in order to achieve the target of 80% of 1990 use. The last two columns refer to the average annual savings in terms of a given feature. In the following years, in two time frames: 2005-2008 and 2009-2016, we calculated losses/savings, and then, the arithmetic mean. Since 2005 three V4 countries (the Czech Republic, Hungary, and Slovakia) have been systematically reducing greenhouse gas emissions from 74.9% to 62.4% of the 1990 level on average, thereby reaching the ob-jective defined in the climate and energy framework. Poland, on the other hand, is still above the objective set due to a negative rate of annual savings in this respect.
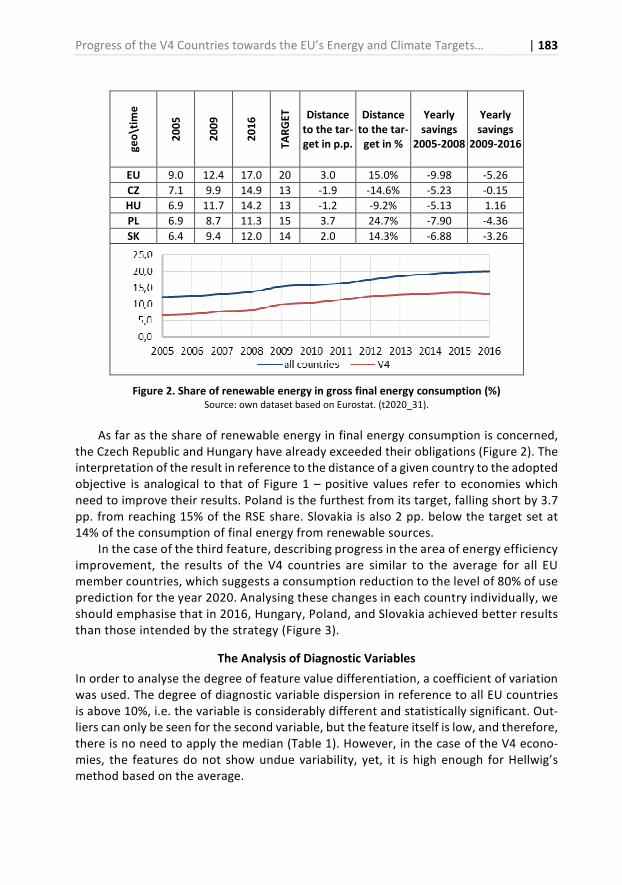
Progress of the V4 Countries towards the EU’s Energy and Climate Targets… | 183
ge
o\t
ime
20
05
20
09
20
16
TA
RG
ET
Distance
to the tar-
get in p.p.
Distance
to the tar-
get in %
Yearly
savings
2005-2008
Yearly
savings
2009-2016
EU 9.0 12.4 17.0 20 3.0 15.0% -9.98 -5.26
CZ 7.1 9.9 14.9 13 -1.9 -14.6% -5.23 -0.15
HU 6.9 11.7 14.2 13 -1.2 -9.2% -5.13 1.16
PL 6.9 8.7 11.3 15 3.7 24.7% -7.90 -4.36
SK 6.4 9.4 12.0 14 2.0 14.3% -6.88 -3.26
Figure 2. Share of renewable energy in gross final energy consumption (%)
Source: own dataset based on Eurostat. (t2020_31).
As far as the share of renewable energy in final energy consumption is concerned, the Czech Republic and Hungary have already exceeded their obligations (Figure 2). The interpretation of the result in reference to the distance of a given country to the adopted objective is analogical to that of Figure 1 – positive values refer to economies which need to improve their results. Poland is the furthest from its target, falling short by 3.7 pp. from reaching 15% of the RSE share. Slovakia is also 2 pp. below the target set at 14% of the consumption of final energy from renewable sources.
In the case of the third feature, describing progress in the area of energy efficiency improvement, the results of the V4 countries are similar to the average for all EU member countries, which suggests a consumption reduction to the level of 80% of use prediction for the year 2020. Analysing these changes in each country individually, we should emphasise that in 2016, Hungary, Poland, and Slovakia achieved better results than those intended by the strategy (Figure 3).
The Analysis of Diagnostic Variables
In order to analyse the degree of feature value differentiation, a coefficient of variation was used. The degree of diagnostic variable dispersion in reference to all EU countries is above 10%, i.e. the variable is considerably different and statistically significant. Out-liers can only be seen for the second variable, but the feature itself is low, and therefore, there is no need to apply the median (Table 1). However, in the case of the V4 econo-mies, the features do not show undue variability, yet, it is high enough for Hellwig’s method based on the average.
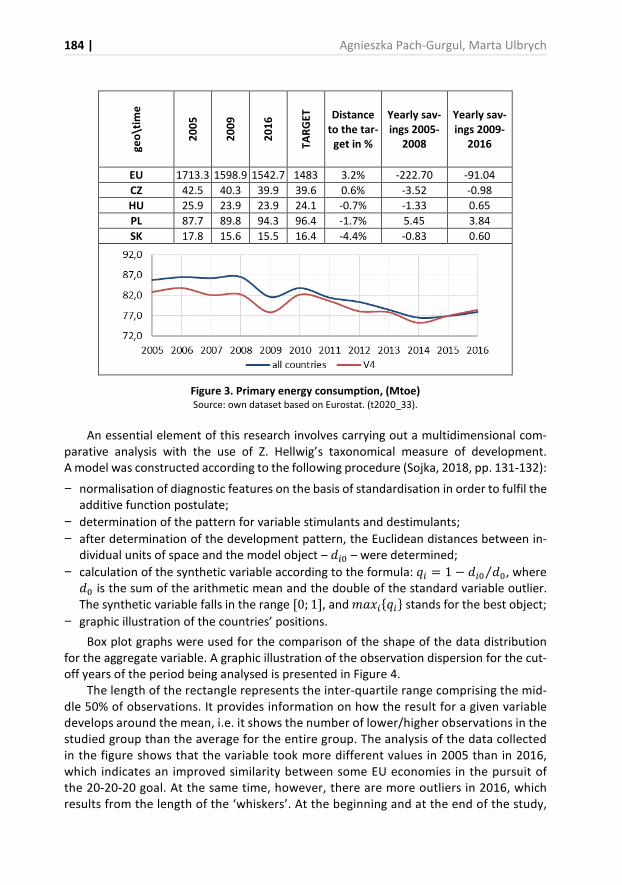
184 | Agnieszka Pach-Gurgul, Marta Ulbrych
ge
o\t
ime
20
05
20
09
20
16
TA
RG
ET
Distance
to the tar-
get in %
Yearly sav-
ings 2005-
2008
Yearly sav-
ings 2009-
2016
EU 1713.3 1598.9 1542.7 1483 3.2% -222.70 -91.04
CZ 42.5 40.3 39.9 39.6 0.6% -3.52 -0.98
HU 25.9 23.9 23.9 24.1 -0.7% -1.33 0.65
PL 87.7 89.8 94.3 96.4 -1.7% 5.45 3.84
SK 17.8 15.6 15.5 16.4 -4.4% -0.83 0.60
Figure 3. Primary energy consumption, (Mtoe)
Source: own dataset based on Eurostat. (t2020_33).
An essential element of this research involves carrying out a multidimensional com-parative analysis with the use of Z. Hellwig’s taxonomical measure of development. A model was constructed according to the following procedure (Sojka, 2018, pp. 131-132):
− normalisation of diagnostic features on the basis of standardisation in order to fulfil the additive function postulate;
− determination of the pattern for variable stimulants and destimulants;
− after determination of the development pattern, the Euclidean distances between in-dividual units of space and the model object – ��� – were determined;
− calculation of the synthetic variable according to the formula: �� = 1 − ��� ��⁄ , where �� is the sum of the arithmetic mean and the double of the standard variable outlier. The synthetic variable falls in the range [0; 1], and ������� stands for the best object;
− graphic illustration of the countries’ positions.
Box plot graphs were used for the comparison of the shape of the data distribution for the aggregate variable. A graphic illustration of the observation dispersion for the cut-off years of the period being analysed is presented in Figure 4.
The length of the rectangle represents the inter-quartile range comprising the mid-dle 50% of observations. It provides information on how the result for a given variable develops around the mean, i.e. it shows the number of lower/higher observations in the studied group than the average for the entire group. The analysis of the data collected in the figure shows that the variable took more different values in 2005 than in 2016, which indicates an improved similarity between some EU economies in the pursuit of the 20-20-20 goal. At the same time, however, there are more outliers in 2016, which results from the length of the ‘whiskers’. At the beginning and at the end of the study,
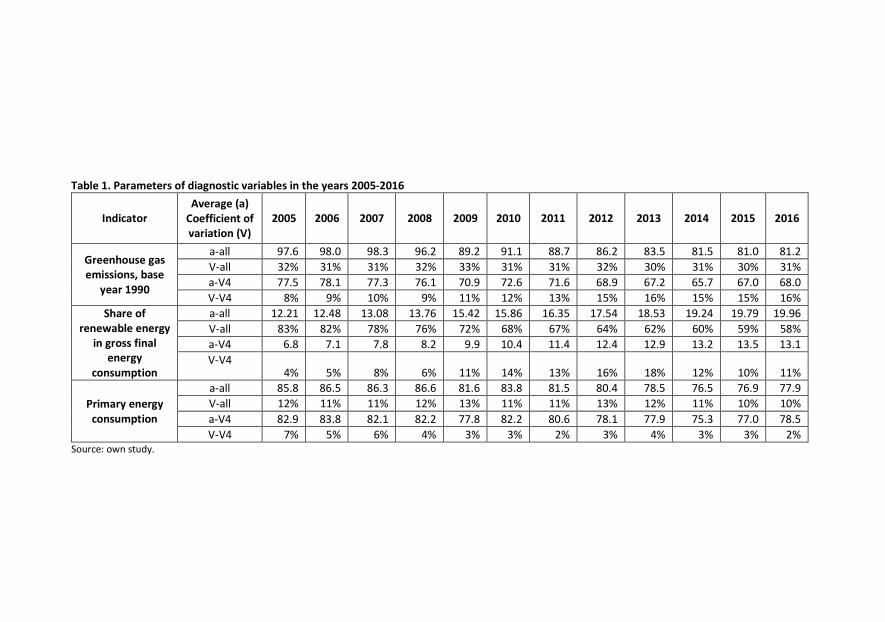
Table 1. Parameters of diagnostic variables in the years 2005-2016
Indicator
Average (a)
Coefficient of
variation (V)
2005 2006 2007 2008 2009 2010 2011 2012 2013 2014 2015 2016
Greenhouse gas
emissions, base
year 1990
a-all 97.6 98.0 98.3 96.2 89.2 91.1 88.7 86.2 83.5 81.5 81.0 81.2
V-all 32% 31% 31% 32% 33% 31% 31% 32% 30% 31% 30% 31%
a-V4 77.5 78.1 77.3 76.1 70.9 72.6 71.6 68.9 67.2 65.7 67.0 68.0
V-V4 8% 9% 10% 9% 11% 12% 13% 15% 16% 15% 15% 16%
Share of
renewable energy
in gross final
energy
consumption
a-all 12.21 12.48 13.08 13.76 15.42 15.86 16.35 17.54 18.53 19.24 19.79 19.96
V-all 83% 82% 78% 76% 72% 68% 67% 64% 62% 60% 59% 58%
a-V4 6.8 7.1 7.8 8.2 9.9 10.4 11.4 12.4 12.9 13.2 13.5 13.1
V-V4 4% 5% 8% 6% 11% 14% 13% 16% 18% 12% 10% 11%
Primary energy
consumption
a-all 85.8 86.5 86.3 86.6 81.6 83.8 81.5 80.4 78.5 76.5 76.9 77.9
V-all 12% 11% 11% 12% 13% 11% 11% 13% 12% 11% 10% 10%
a-V4 82.9 83.8 82.1 82.2 77.8 82.2 80.6 78.1 77.9 75.3 77.0 78.5
V-V4 7% 5% 6% 4% 3% 3% 2% 3% 4% 3% 3% 2% Source: own study.
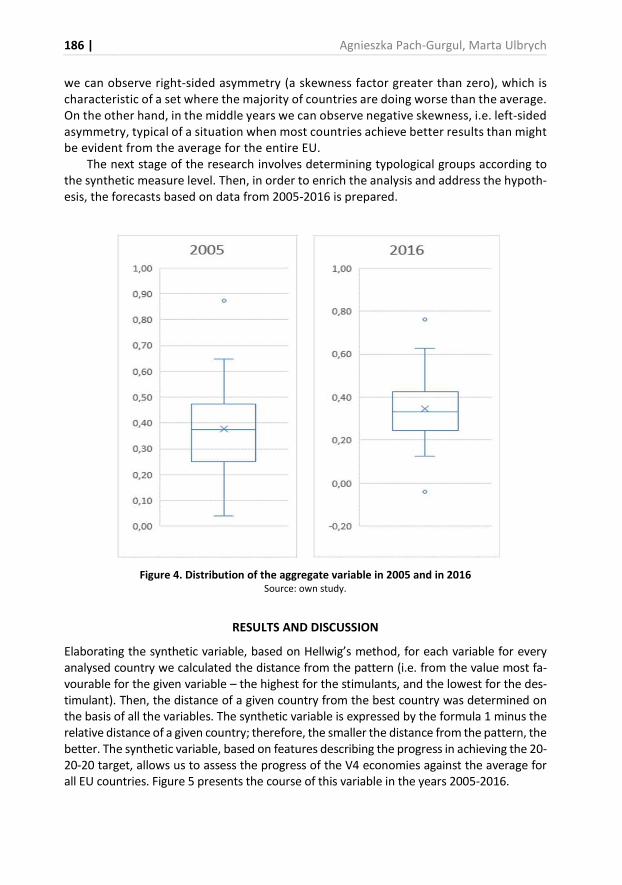
186 | Agnieszka Pach-Gurgul, Marta Ulbrych
we can observe right-sided asymmetry (a skewness factor greater than zero), which is characteristic of a set where the majority of countries are doing worse than the average. On the other hand, in the middle years we can observe negative skewness, i.e. left-sided asymmetry, typical of a situation when most countries achieve better results than might be evident from the average for the entire EU.
The next stage of the research involves determining typological groups according to the synthetic measure level. Then, in order to enrich the analysis and address the hypoth-esis, the forecasts based on data from 2005-2016 is prepared.
Figure 4. Distribution of the aggregate variable in 2005 and in 2016 Source: own study.
RESULTS AND DISCUSSION
Elaborating the synthetic variable, based on Hellwig’s method, for each variable for every analysed country we calculated the distance from the pattern (i.e. from the value most fa-vourable for the given variable – the highest for the stimulants, and the lowest for the des-timulant). Then, the distance of a given country from the best country was determined on the basis of all the variables. The synthetic variable is expressed by the formula 1 minus the relative distance of a given country; therefore, the smaller the distance from the pattern, the better. The synthetic variable, based on features describing the progress in achieving the 20-20-20 target, allows us to assess the progress of the V4 economies against the average for all EU countries. Figure 5 presents the course of this variable in the years 2005-2016.
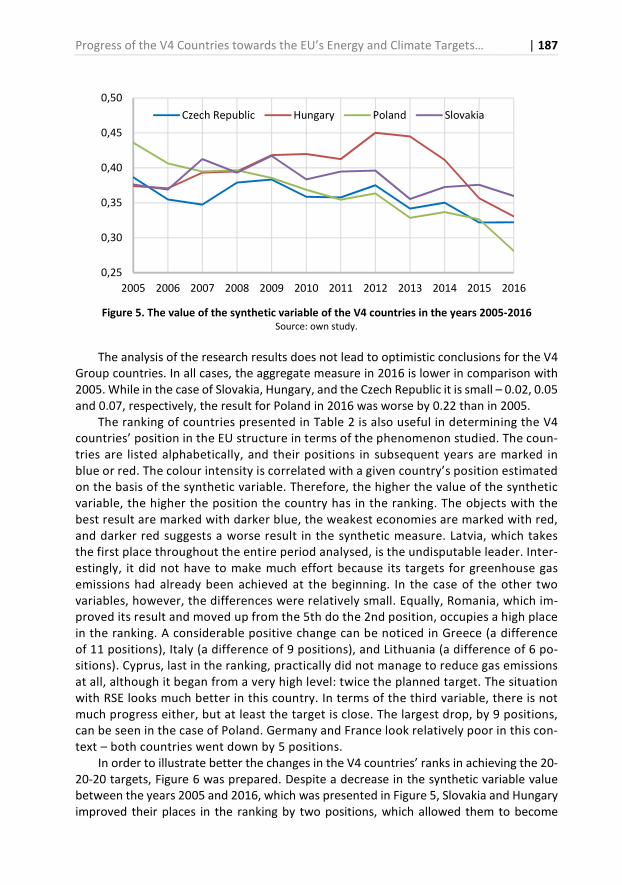
Progress of the V4 Countries towards the EU’s Energy and Climate Targets… | 187
Figure 5. The value of the synthetic variable of the V4 countries in the years 2005-2016 Source: own study.
The analysis of the research results does not lead to optimistic conclusions for the V4 Group countries. In all cases, the aggregate measure in 2016 is lower in comparison with 2005. While in the case of Slovakia, Hungary, and the Czech Republic it is small – 0.02, 0.05 and 0.07, respectively, the result for Poland in 2016 was worse by 0.22 than in 2005.
The ranking of countries presented in Table 2 is also useful in determining the V4 countries’ position in the EU structure in terms of the phenomenon studied. The coun-tries are listed alphabetically, and their positions in subsequent years are marked in blue or red. The colour intensity is correlated with a given country’s position estimated on the basis of the synthetic variable. Therefore, the higher the value of the synthetic variable, the higher the position the country has in the ranking. The objects with the best result are marked with darker blue, the weakest economies are marked with red, and darker red suggests a worse result in the synthetic measure. Latvia, which takes the first place throughout the entire period analysed, is the undisputable leader. Inter-estingly, it did not have to make much effort because its targets for greenhouse gas emissions had already been achieved at the beginning. In the case of the other two variables, however, the differences were relatively small. Equally, Romania, which im-proved its result and moved up from the 5th do the 2nd position, occupies a high place in the ranking. A considerable positive change can be noticed in Greece (a difference of 11 positions), Italy (a difference of 9 positions), and Lithuania (a difference of 6 po-sitions). Cyprus, last in the ranking, practically did not manage to reduce gas emissions at all, although it began from a very high level: twice the planned target. The situation with RSE looks much better in this country. In terms of the third variable, there is not much progress either, but at least the target is close. The largest drop, by 9 positions, can be seen in the case of Poland. Germany and France look relatively poor in this con-text – both countries went down by 5 positions.
In order to illustrate better the changes in the V4 countries’ ranks in achieving the 20-20-20 targets, Figure 6 was prepared. Despite a decrease in the synthetic variable value between the years 2005 and 2016, which was presented in Figure 5, Slovakia and Hungary improved their places in the ranking by two positions, which allowed them to become
0,25
0,30
0,35
0,40
0,45
0,50
2005 2006 2007 2008 2009 2010 2011 2012 2013 2014 2015 2016
Czech Republic Hungary Poland Slovakia
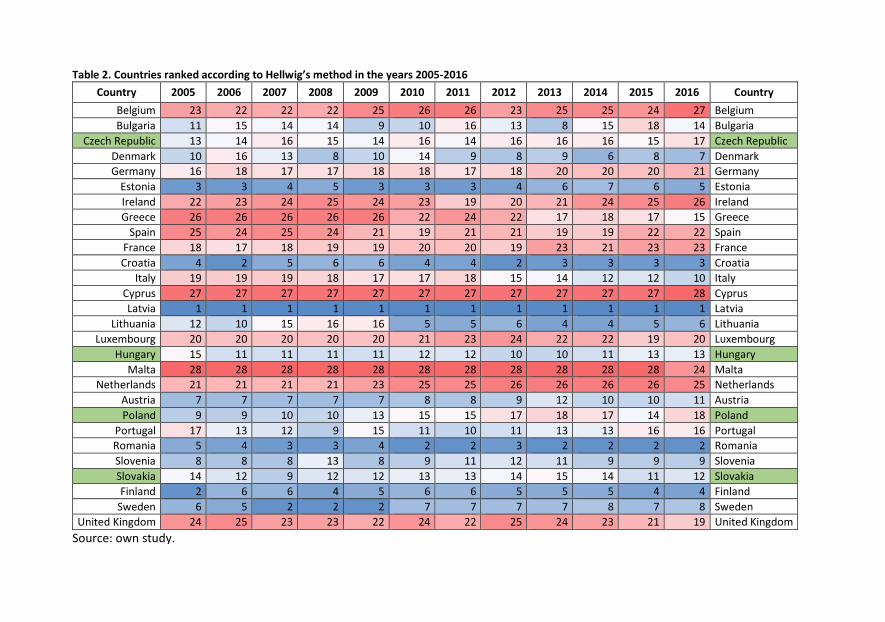
Table 2. Countries ranked according to Hellwig’s method in the years 2005-2016
Country 2005 2006 2007 2008 2009 2010 2011 2012 2013 2014 2015 2016 Country
Belgium 23 22 22 22 25 26 26 23 25 25 24 27 Belgium
Bulgaria 11 15 14 14 9 10 16 13 8 15 18 14 Bulgaria
Czech Republic 13 14 16 15 14 16 14 16 16 16 15 17 Czech Republic
Denmark 10 16 13 8 10 14 9 8 9 6 8 7 Denmark
Germany 16 18 17 17 18 18 17 18 20 20 20 21 Germany
Estonia 3 3 4 5 3 3 3 4 6 7 6 5 Estonia
Ireland 22 23 24 25 24 23 19 20 21 24 25 26 Ireland
Greece 26 26 26 26 26 22 24 22 17 18 17 15 Greece
Spain 25 24 25 24 21 19 21 21 19 19 22 22 Spain
France 18 17 18 19 19 20 20 19 23 21 23 23 France
Croatia 4 2 5 6 6 4 4 2 3 3 3 3 Croatia
Italy 19 19 19 18 17 17 18 15 14 12 12 10 Italy
Cyprus 27 27 27 27 27 27 27 27 27 27 27 28 Cyprus
Latvia 1 1 1 1 1 1 1 1 1 1 1 1 Latvia
Lithuania 12 10 15 16 16 5 5 6 4 4 5 6 Lithuania
Luxembourg 20 20 20 20 20 21 23 24 22 22 19 20 Luxembourg
Hungary 15 11 11 11 11 12 12 10 10 11 13 13 Hungary
Malta 28 28 28 28 28 28 28 28 28 28 28 24 Malta
Netherlands 21 21 21 21 23 25 25 26 26 26 26 25 Netherlands
Austria 7 7 7 7 7 8 8 9 12 10 10 11 Austria
Poland 9 9 10 10 13 15 15 17 18 17 14 18 Poland
Portugal 17 13 12 9 15 11 10 11 13 13 16 16 Portugal
Romania 5 4 3 3 4 2 2 3 2 2 2 2 Romania
Slovenia 8 8 8 13 8 9 11 12 11 9 9 9 Slovenia
Slovakia 14 12 9 12 12 13 13 14 15 14 11 12 Slovakia
Finland 2 6 6 4 5 6 6 5 5 5 4 4 Finland
Sweden 6 5 2 2 2 7 7 7 7 8 7 8 Sweden
United Kingdom 24 25 23 23 22 24 22 25 24 23 21 19 United Kingdom
Source: own study.
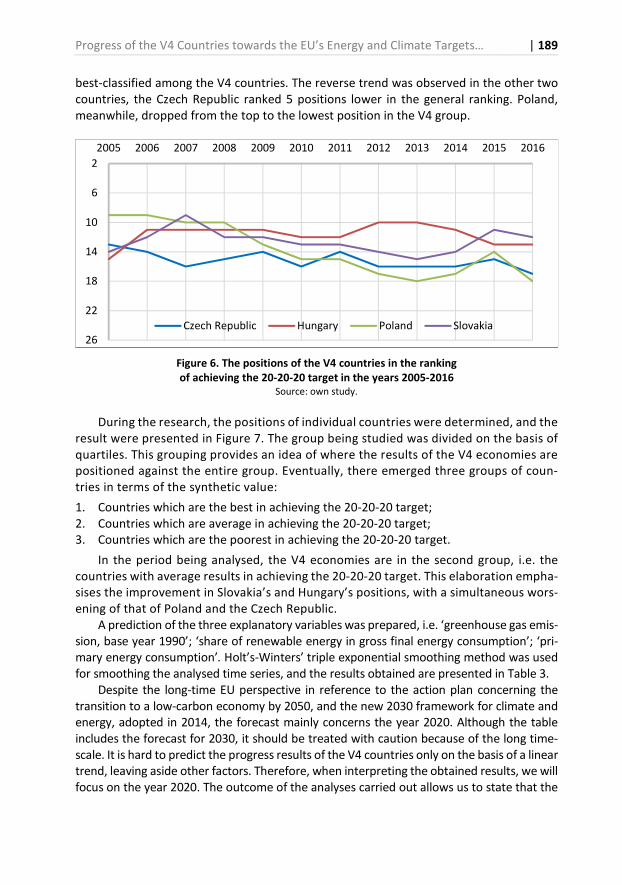
Progress of the V4 Countries towards the EU’s Energy and Climate Targets… | 189
best-classified among the V4 countries. The reverse trend was observed in the other two countries, the Czech Republic ranked 5 positions lower in the general ranking. Poland, meanwhile, dropped from the top to the lowest position in the V4 group.
Figure 6. The positions of the V4 countries in the ranking
of achieving the 20-20-20 target in the years 2005-2016 Source: own study.
During the research, the positions of individual countries were determined, and the result were presented in Figure 7. The group being studied was divided on the basis of quartiles. This grouping provides an idea of where the results of the V4 economies are positioned against the entire group. Eventually, there emerged three groups of coun-tries in terms of the synthetic value:
1. Countries which are the best in achieving the 20-20-20 target;2. Countries which are average in achieving the 20-20-20 target;3. Countries which are the poorest in achieving the 20-20-20 target.
In the period being analysed, the V4 economies are in the second group, i.e. thecountries with average results in achieving the 20-20-20 target. This elaboration empha-sises the improvement in Slovakia’s and Hungary’s positions, with a simultaneous wors-ening of that of Poland and the Czech Republic.
A prediction of the three explanatory variables was prepared, i.e. ‘greenhouse gas emis-sion, base year 1990’; ‘share of renewable energy in gross final energy consumption’; ‘pri-mary energy consumption’. Holt’s-Winters’ triple exponential smoothing method was used for smoothing the analysed time series, and the results obtained are presented in Table 3.
Despite the long-time EU perspective in reference to the action plan concerning the transition to a low-carbon economy by 2050, and the new 2030 framework for climate and energy, adopted in 2014, the forecast mainly concerns the year 2020. Although the table includes the forecast for 2030, it should be treated with caution because of the long time-scale. It is hard to predict the progress results of the V4 countries only on the basis of a linear trend, leaving aside other factors. Therefore, when interpreting the obtained results, we will focus on the year 2020. The outcome of the analyses carried out allows us to state that the
2
6
10
14
18
22
26
2005 2006 2007 2008 2009 2010 2011 2012 2013 2014 2015 2016
Czech Republic Hungary Poland Slovakia
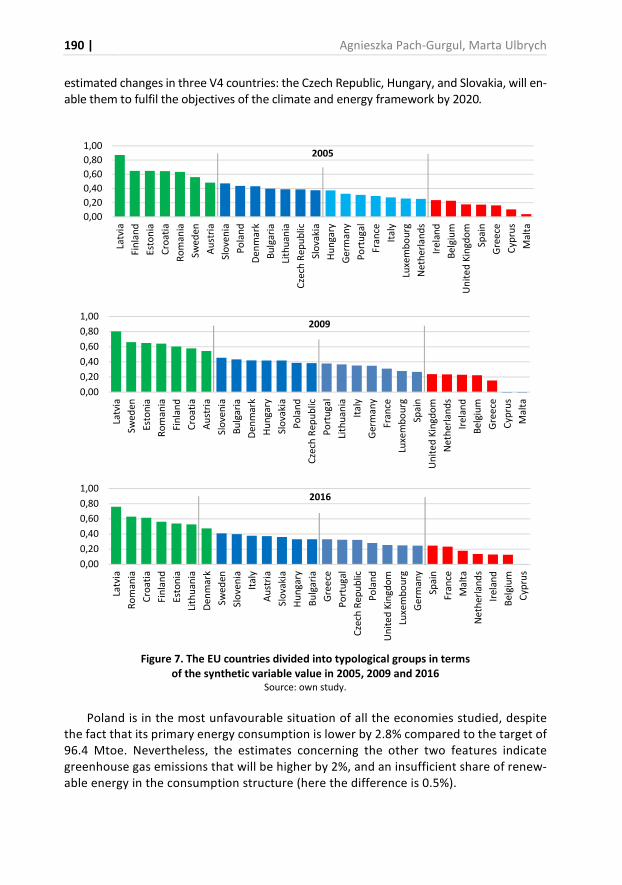
190 | Agnieszka Pach-Gurgul, Marta Ulbrych
estimated changes in three V4 countries: the Czech Republic, Hungary, and Slovakia, will en-able them to fulfil the objectives of the climate and energy framework by 2020.
Figure 7. The EU countries divided into typological groups in terms
of the synthetic variable value in 2005, 2009 and 2016 Source: own study.
Poland is in the most unfavourable situation of all the economies studied, despite the fact that its primary energy consumption is lower by 2.8% compared to the target of 96.4 Mtoe. Nevertheless, the estimates concerning the other two features indicate greenhouse gas emissions that will be higher by 2%, and an insufficient share of renew-able energy in the consumption structure (here the difference is 0.5%).
0,00
0,20
0,40
0,60
0,80
1,00
Latv
ia
Fin
lan
d
Esto
nia
Cro
atia
Ro
man
ia
Swed
en
Au
stri
a
Slo
ven
ia
Po
lan
d
Den
mar
k
Bu
lgar
ia
Lith
uan
ia
Cze
ch R
epu
blic
Slo
vaki
a
Hu
nga
ry
Ger
man
y
Po
rtu
gal
Fran
ce
Ital
y
Luxe
mb
ou
rg
Net
her
lan
ds
Irel
and
Bel
giu
m
Un
ite
d K
ingd
om
Spai
n
Gre
ece
Cyp
rus
Mal
ta
2005
0,00
0,20
0,40
0,60
0,80
1,00
Latv
ia
Swed
en
Esto
nia
Ro
man
ia
Fin
lan
d
Cro
atia
Au
stri
a
Slo
ven
ia
Bu
lgar
ia
Den
mar
k
Hu
nga
ry
Slo
vaki
a
Po
lan
d
Cze
ch R
epu
blic
Po
rtu
gal
Lith
uan
ia
Ital
y
Ger
man
y
Fran
ce
Luxe
mb
ou
rg
Spai
n
Un
ite
d K
ingd
om
Net
her
lan
ds
Irel
and
Bel
giu
m
Gre
ece
Cyp
rus
Mal
ta
2009
0,00
0,20
0,40
0,60
0,80
1,00
Latv
ia
Ro
man
ia
Cro
atia
Fin
lan
d
Esto
nia
Lith
uan
ia
Den
mar
k
Swed
en
Slo
ven
ia
Ital
y
Au
stri
a
Slo
vaki
a
Hu
nga
ry
Bu
lgar
ia
Gre
ece
Po
rtu
gal
Cze
ch R
epu
blic
Po
lan
d
Un
ite
d K
ingd
om
Luxe
mb
ou
rg
Ger
man
y
Spai
n
Fran
ce
Mal
ta
Net
her
lan
ds
Irel
and
Bel
giu
m
Cyp
rus
2016
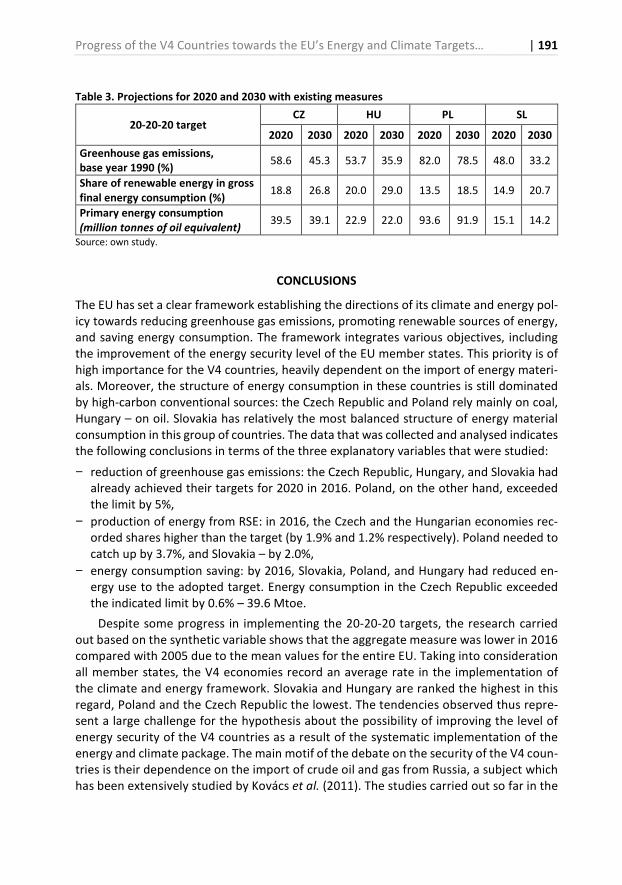
Progress of the V4 Countries towards the EU’s Energy and Climate Targets… | 191
Table 3. Projections for 2020 and 2030 with existing measures
20-20-20 target CZ HU PL SL
2020 2030 2020 2030 2020 2030 2020 2030
Greenhouse gas emissions,
base year 1990 (%) 58.6 45.3 53.7 35.9 82.0 78.5 48.0 33.2
Share of renewable energy in gross
final energy consumption (%) 18.8 26.8 20.0 29.0 13.5 18.5 14.9 20.7
Primary energy consumption
(million tonnes of oil equivalent) 39.5 39.1 22.9 22.0 93.6 91.9 15.1 14.2
Source: own study.
CONCLUSIONS
The EU has set a clear framework establishing the directions of its climate and energy pol-icy towards reducing greenhouse gas emissions, promoting renewable sources of energy, and saving energy consumption. The framework integrates various objectives, including the improvement of the energy security level of the EU member states. This priority is of high importance for the V4 countries, heavily dependent on the import of energy materi-als. Moreover, the structure of energy consumption in these countries is still dominated by high-carbon conventional sources: the Czech Republic and Poland rely mainly on coal, Hungary – on oil. Slovakia has relatively the most balanced structure of energy material consumption in this group of countries. The data that was collected and analysed indicates the following conclusions in terms of the three explanatory variables that were studied:
− reduction of greenhouse gas emissions: the Czech Republic, Hungary, and Slovakia hadalready achieved their targets for 2020 in 2016. Poland, on the other hand, exceeded the limit by 5%,
− production of energy from RSE: in 2016, the Czech and the Hungarian economies rec-orded shares higher than the target (by 1.9% and 1.2% respectively). Poland needed to catch up by 3.7%, and Slovakia – by 2.0%,
− energy consumption saving: by 2016, Slovakia, Poland, and Hungary had reduced en-ergy use to the adopted target. Energy consumption in the Czech Republic exceeded the indicated limit by 0.6% – 39.6 Mtoe.
Despite some progress in implementing the 20-20-20 targets, the research carried out based on the synthetic variable shows that the aggregate measure was lower in 2016 compared with 2005 due to the mean values for the entire EU. Taking into consideration all member states, the V4 economies record an average rate in the implementation of the climate and energy framework. Slovakia and Hungary are ranked the highest in this regard, Poland and the Czech Republic the lowest. The tendencies observed thus repre-sent a large challenge for the hypothesis about the possibility of improving the level of energy security of the V4 countries as a result of the systematic implementation of the energy and climate package. The main motif of the debate on the security of the V4 coun-tries is their dependence on the import of crude oil and gas from Russia, a subject which has been extensively studied by Kovács et al. (2011). The studies carried out so far in the
192 | Agnieszka Pach-Gurgul, Marta Ulbrych
context of the challenges connected with the energy security of the V4 countries, con-centrated first of all on the bottlenecks in energy infrastructure and infrastructure pro-jects in the region (Siddi, 2016). Such a vision of energy security is definitely caused by the gas crises between Russia and Ukraine from 2006 and 2009, during which the V4 countries suffered a lot. However, in the debate over energy security, it must be stressed that this is a multi-aspect phenomenon which cannot be described with one single defi-nition – see Kruyt et al., (2009), Winzer (2012) and Narula and Reddy (2015). Therefore, it seems that the V4 countries might treat the execution of the energy and climate pack-age not only as a controversial and costly requirement of the EU energy policy – which is underlined by McKillop (2012), but also as a chance to increase this security in its all as-pects. The studies carried out for this article show the necessity of the rationalisation of energy consumption and of an increase in the share of renewable sources of energy in the energy mix and the reduction of greenhouse gases in this context.
The forecasted chances of fulfilling the obligations for the year 2020 show that all the economies analysed except Poland will meet the objectives. The forecast for the structure of generation capacity in the V4 countries indicates an increase in the share of renewable energy in total consumption between 2005 and 2020 by 13.1% in Hungary, 11.7% in the Czech Republic, 8.5% in Slovakia, and 6.6% in Poland. Nevertheless, the improvement in the last two countries is not sufficient to meet the framework guidelines in this respect. However, as far as energy efficiency improvement is concerned, based on the predictions for the year 2020, we can indicate a reduction of energy consumption by 3% in the Czech and Hungarian economies, and by 2.7% in Slovakia compared to 2005. For Poland, how-ever, a result worse by 5.9% is estimated, but even this enables the country to meet its reduction objective adopted in the framework. Therefore, it is necessary in these econo-mies, and especially in Poland, to promote and support a number of initiatives aimed at, among other things, developing Clean Coal Technology, increasing the share of eco-fuels in transport, modernising the construction sector, developing low-carbon energy sources, etc. These actions are of crucial importance as the total abandonment of coal is currently impossible in Poland’s energy mix. The worrying results of these studies concerning Po-land’s execution of the objectives of the energy and climate package, against the back-ground of the remaining V4 countries, will become an inspiration for the Authors to take up, in the future, research aimed at the identification of the causes of this situation in Poland. Furthermore, the research period ends in 2016 with respect to the availability of the statistical data, yet it is worthwhile to observe that similar studies should be re-initi-ated, especially with regards to the end of the 2020 perspective.
REFERENCES
Augutis, J., Krikstolaitis, J., Martisauskas, L., & Peciulyte, S. (2012). Energy security level assessment technology. Applied Energy, 97, 143- 149. https://doi.org/10.1016/j.apenergy.2011.11.032
Chalvatzis, K., & Ioannidis, A. (2017). Energy supply security in the EU: Benchmarking diversity and dependence of primary energy. Applied Energy, 207, 465-476. https://doi.org/10.1016/j.apenergy.2017.07.010
Cherp, A., & Jewel, J. (2011). The three perspectives on energy security: intellectual history, discipli-nary roots and the potential for integration. Current Opinion in Environmental Sustainability, 3(4), 202-221. https://doi.org/10.1016/j.cosust.2011.07.001
Progress of the V4 Countries towards the EU’s Energy and Climate Targets… | 193
Chester, L. (2010). Conceptualising energy security and making explicit its polysemic nature. Energy
Policy, 38(2), 887-895. https://doi.org/10.1016/j.enpol.2009.10.039
Cipollaro, A., & Lomonaco, G. (2016). Contributing to the nuclear 3S’s via a methodology aiming at enhancing the synergies between nuclear security and safety. Progress in Nuclear. Energy, 86, 31-39. https://doi.org/10.1016/j.pnucene.2015.09.013
Costantini, V., Gracceva, F., Markandya, A., & Vicini, G. (2006). Security of energy supply: compar-ing scenarios from a European perspective. Energy Policy, 35, 210-226. https://doi.org/10.1016/j.enpol.2005.11.002
Czech, A. (2017). Economic dimension of Polish energy security. Oeconomia Copernicana, 8(3), 383-399. https://doi.org/10.24136/oc.v8i3.24
Dannreuhter, R. (2017). Energy security. Polity Press, 10-25.
Dyer, H., & Trombetta, M.J. (2013). The concept of energy security: broadening, deepening trans-
forming. International handbook of energy security (pp. 3-18). Northampton, USA: Edward Elgar Publishing Limited.
Eikeland, P.O. (2014). Implementing the EU 2020. Energy and Climate Package in Germany. FNI Re-
ports. 12/30/2014, preceding, 1-101. Retrieved on December, 2018 from https://www.fni.no/publications/implementing-the-eu-2020-energy-and-climate-package-in-germany-green-champion-struggling-to-adapt-article875-290.html
European Commission. (2010). Communication from the Commission. Europe 2020, A strategy for smart, sustainable and inclusive growth, Brussels, 3.3.2010, COM(2010) 2020. Retrieved from http://eur-lex.europa.eu/LexUriServ/LexUriServ.do?uri=COM:2010: 2020:FIN:EN:PDF on December 10, 2018.
European Commission. (2012). Directive 2012/27/EU of the European Parliament and of the Council of 25 October 2012 on energy efficiency, amending Directives 2009/125/EC and 2010/30/EU and re-pealing Directives 2004/8/EC and 2006/32/EC Text with EEA relevance, OJ L 315, 14.11.2012, 1-56. Retrieved from: http://data.europa.eu/eli/dir/2012/27/oj on December 10, 2018.
European Commission. (2013). Council Directive 2013/12/EU of 13 May 2013 adapting Directive 2012/27/EU of the European Parliament and of the Council on energy efficiency, by reason of the accession of the Republic of Croatia, OJ L 141, 28.5.2013, 28-29. Retrieved from https://eur-lex.europa.eu/legal-content/EN/TXT/?uri=celex%3A32013L0012 on December 10, 2018.
European Commission. (2018). Energy Statistical Pocketbook. Luxembourg: Publications Office of Eu-ropean Union, 24-26. Retrieved from https://publications.europa.eu/en/ publication-detail/-/publication/99fc30eb-c06d-11e8-9893-01aa75ed71a1/language-en on December 10, 2018.
European Parliament and the Council of the European Union. (2009). Decision No 406/2009/EC of the European Parliament and the Council of the European Union of 23 April 2009 on the effort of Member States to reduce their greenhouse gas emissions to meet the Community’s green-house gas emission reduction commitments up to 2020 (OJ L 140/136), 06.2009. Retrieved from https://eur-lex.europa.eu/eli/dec/2009/406/oj on December 10, 2018.
Eurostat. Europe 2020 indicators - climate change and energy. Retrieved from https://ec.europa.eu/ eurostat/statistics-explained/index.php/Europe_2020_indicators_-_climate_change_and_en-ergy on December 10, 2018.
Finon, D., & Locatelli, C. (2008). Russian and European gas interdependence: Could contractual trade channel geopolitics?. Energy Policy, 36(1), 423 -442. https://doi.org/10.1016/j.enpol.2007.08.038
Fitzmaurice, J. (1998). Politics and Government in the Visegrad Countries: Poland, Hungary, the Czech
Republic and Slovakia (pp. 21-23). Macmillan Press.
Gałecka, M., & Smolny, K. (2018). Evolution of Theater Activity Using Hellwig’s method. Optimus.
Economic Srudies. 2(92), 38-50. https://doi.org/10.15290/oes.2018.02.92.04
194 | Agnieszka Pach-Gurgul, Marta Ulbrych
Gálová, J. (2013). Opportunities for Doing Business with Countries Neighbouring V4 The Case of Ukraine’. Entrepreneurial Business and Economics Review, 1(1), 77-90. https://doi.org/ 10.15678/EBER.2013.010106
Goldthau, A. (2011). Governing global energy: existing approaches and discourses. Current Opinion
in Environmental Sustainability, 3(4), 213-217. https://doi.org/10.1016/j.cosust.2011.06.003
Goldthau, A., & Boersma, T. (2014). The 2014 Ukraine-Russia crisis: Implications for energy markets and scholarship. Energy Research & Social Science, 3, 13-15. https://doi.org/10.1016/j.erss.2014.05.001
Gulbrandsen, L., & Skjærseth, J.B. (2014). Implementing the EU 2020 Climate and Energy Package in the Netherlands. Mixed Instruments, Mixed Results. FNI Reports. 12/15/2014, preceding 1-46. Retrieved from https://www.fni.no/publications/implementing-the-eu-2020-climate-and-energy-package-in-the-netherlands-mixed-instruments-mixed-results-article876-290.html on December 10, 2018.
Gunnar Austvik, O. (2016). The Energy Union and security-of-gas supply. Energy Policy, 96, 372-382. https://doi.org/10.1016/j.enpol.2016.06.013
Helm, D. (2014). European framework for energy and climate policies, Energy Policy, 64, 29-35. https://doi.org/10.1016/j.enpol.2013.05.063
Henriksen, C.B, Hussey, K., & Holm, P. (2011). Exploiting Soil-Management Strategies for Climate Mitigation in the European Union: Maximizing ‘Win-Win’ Solutions across Policy Regimes. Ecology & Society. 2011, 16(4), 1-17. https://doi.org/ 10.5751/ES-04176-160422
International Energy Agency. (2007). World Energy Outlook 2007, Paris 2007, 161-162. Retrieved from:https://www.iea.org/publications/freepublications/publication/weo2007.pdf on De-cember 10, 2018.
International Energy Agency. (2018). What is energy security. Retrieved from https://www.iea.org/topics/energysecurity/whatisenergysecurity/ on February 15, 2019.
Jääskeläinen, J., Höysniemi, S., Syri S., & Tynkkynen, V.P. (2018). Finland’s Dependence on Russian Energy—Mutually Beneficial Trade Relations or an Energy Security Threat. Sustainability, 10, 1-25. https://doi.org/10.3390/su10103445
Jamasb, T., & Pollit, M. (2008). Security of supply and regulation of energy networks. Energy Policy, 36(12), 4584-4589. https://doi.org/10.1016/j.enpol.2008.09.007
Kapustová, Z., Kapusta, J., & Bielik, P. (2018). Food-biofuels interactions: The case of the U.S. biofuels market. Agris On-line Papers in Economics and Informatics 10(4), 27-38.
Kiriyama, E., & Kajikawa, Y. (2014). A multilayered analysis of energy security research and the en-ergy supply process. Applied Energy, 123, 415-423. https://doi.org/10.1016/j.ape-nergy.2014.01.026
Kovács, P., Szczerski, K., Binhack, P., Farkas, M., Jaroš, J., Kołaczkowski, M., Ruszel, M., Szlagowski, P., Szolnoki, E., Ševce, P., & Albrycht, I. (2011). Energy security of the V4 countries. How do energy relations change in Europe. The Kosciuszko Institute. Retrieved from http://www.pssi.cz/down-load/docs/117_energy-security-of-the-v4-countries.pdf on February 15, 2019.
Kruyt, B., van Vuuren, D.P., de Vries, H.J.M., & Groenenberg, H. (2009). Indicators for energy security. Energy Policy, 37, 2166-2181. https://doi.org/10.1016/j.enpol.2009.02.006
Lee, Y. (2017). Interdependence, issue importance, and the 2009 Russia-Ukraine gas conflict. Energy
Policy. 102, 199-209. https://doi.org/10.1016/j.enpol.2016.11.038
Love, T.F., Rupp, S., & Strauss, S. (2013). Cultures of Energy: Power, Practices, Technologies. The
Australian Journal of Anthropology, 27(3), 1-60. https://doi.org/10.1111/taja.12212
Löschel, A., Moslener, U., & Rübbelke, D. (2010). Indicators of energy security in industrialised coun-tries. Energy Policy, 38(4), 1665-1671. https://doi.org/10.1016/j.enpol.2009.03.061
Progress of the V4 Countries towards the EU’s Energy and Climate Targets… | 195
Månsson, A., Johansson, B., & Nilsson, L. (2014). Assessing energy security: An overview of commonly usedmethodologies. Energy, 73(14), 1-14. https://doi.org/10.1016/j.energy.2014.06.073
Månsson, A. (2014). Energy, conflict and war: towards a conceptual framework. Energy Research
and Social Science, 4, 106-116. https://doi.org/10.1016/j.erss.2014.10.004
Markandya, A., & Pemberton, M. (2010). Energy security, energy modelling and uncertainty. Energy
Policy, 38(4), 1609-1613. https://doi.org/10.1016/j.enpol.2009.01.046
Marquina, A. (2008). Energy Security. Visions from Asia and Europe. Basingstoke (pp. 34-53), New York: Palgrave Macmillan.
McKillop, A. (2012). Europe’s Climate Energy Package Must Be Reformed or Abandoned. Energy &
Environment, 23(5), 837-848. https://doi.org/10.1260/0958-305X.23.5.837
Mitchell, V., & Moudgill, P. (1976). Measurement of Maslow’s Need Hierarchy. Organizational Behavior
and Human Performance, 16(2), 334-349. https://doi.org/10.1016/0030-5073(76)90020-9
Narula, K., & Reddy, B. (2015). Three blind men and an elephant: The case of energy indices to measure energy security and energy sustainability. Energy, 80, 148-158. https://doi.org/10.1016/j.energy.2014.11.055
Nyga-Łukaszewska, H., & Chilimoniuk-Przeździecka, E. (2017). Modelling Energy Security and Inter-national Competitiveness: The Export Perspective. Entrepreneurial Business and Economics Re-
view, 5(2), 71-84. https://doi.org/10.15678/EBER.2017.050204
Pach-Gurgul, A. (2016). Europeanisation of Energy Policy: Progress in Spite of Divergent Interest. In P. Stanek & K. Wach (Eds.), Macro-, Meso-, and Microeconomic Dimensions of Europeanisation
(pp. 141-164). Warsaw: PWN.
Proskuryakova, L. (2018). Updating energy security and environmental policy: Energy security theo-ries revisited. Journal of Environmental Management, 223(2018), 203-214. https://doi.org/10.1016/j.jenvman.2018.06.016
Pach-Gurgul, A. (2018). The Possibilities of Gas and Oil Export to the Visegrad Group Countries in the Context of CETA. In Proceedings of the 18th International Joint Conference Central and Eastern Europe in the Changing Business Environment, (pp. 308-319). Prague: Oeconomica Publishing House, University of Economics.
Radovanovića, M., Filipović, S., & Pavlovićc, D. (2017). Energy security measurement – A sustainable approach. Renewable and Sustainable Energy Reviews, 68(2017), 1020-1032. https://doi.org/10.1016/j.rser.2016.02.010
Semenenko, I. (2016). Energy security of Ukraine in the context of its sustainable development. Equi-librium. Quarterly Journal of Economics and Economic Policy, 11(3), 537-555. https://doi.org/10.12775/EQUIL.2016.024
Siddi, M. (2016). The EU’s Energy Union: A Sustainable Path to Energy Security?. The International
Spectator. 51(1), 131-144. https://doi.org/:10.1080/03932729.2016.1090827
Simanaviciene, Z., Volochovic, A., & Cibinskiene, A. (2016). Features of energy saving potential in Lithuanian households. Equilibrium. Quarterly Journal of Economics and Economic Policy, 11(1), 145-157. https://doi.org/10.12775/EQUIL.2016.007
Slaboch, J., & Hálová, P. (2016). The influence of investment costs on biogas station development and their impact on greenhouse gas emissions from czech agriculture. Agris On-line Papers in
Economics and Informatics 8(4), 143-151.
Sojka, E. (2018). Poland in socio-economic development ranking of the EU countries. In W. Szkutnik, A. Sączewska-Piotrowska, M. Hadaś-Dyduch, & J. Acedański (Eds.). 9th International Scientific
196 | Agnieszka Pach-Gurgul, Marta Ulbrych
Conference Analysis of International Relations 2018. Methods and Models of Regional Develop-
ment. Winter Edition. Conference Proceedings (pp. 130-139). Katowice: Publishing House of the University of Economics in Katowice.
Sovacool, B., Mukherjee, I., Drupady, I., & D’Agostino, A. (2011). Evaluating energy security perfor-mance from 1990 to 2010 for eighteen countries’ Energy. 36(10), 5846-5853. https://doi.org/10.1016/j.energy.2011.08.040
Sovacool, B.K. (2013). An international assessment of energy security performance. Ecological Eco-
nomics, 88, 148-158. https://doi.org/10.1016/j.ecolecon.2013.01.019
Stephenson, J., Barton, B., Carrington, G., Gnoth, D., Lawson, R., & Thorsnes, P. (2010). Energy Cul-tures: A framework for understanding energy behaviours. Energy Policy, 38, 6120-6129. https://doi.org/10.1016/j.enpol.2010.05.069
Śmiech, S., & Papież, M. (2014). Energy Consumption and Economic Growth in the Light of Meeting the Targets of Energy Policy in the EU: The Bootstrap Panel Granger Causality Approach. En-
ergy Policy, 71, 118-29. https://doi.org/10.1016/j.enpol.2014.04.005
Tapio, T., Banister, D., Luukkanen, J., Vehmas, J., & Willamo, R. (2007). Energy and Transport in Com-parison: Immaterialisation, Dematerialization and Decarbonisation in the EU 15 between 1970 and 2000. Energy Policy, 35, 433-451. https://doi.org/10.1016/j.enpol.2005.11.031
Ulbrych, M. (2016). Europeanisation of Industrial Policy: Towards a Re-Industrialisation of Europe. In P. Stanek & K. Wach (Eds.), Macro-, Meso-, and Microeconomic Dimensions of Europeanisa-
tion (pp. 121-140). Warsaw: PWN.
Ulbrych, M. (2018). The Role and Importance of Manufacturing Trade Cooperation of the Visegrad. In
Proceedings of the 18th International Joint Conference Central and Eastern Europe in the Changing
Business Environment. Prague: Oeconomica Publishing House, University of Economics.
Uusi-Rauva, Ch. (2010). The EU energy and climate package: a showcase for European environmental leadership?. Environmental Policy and Governance, 20(2), 73-88. https://doi.org/10.1002/eet.535
Van de Graaf, T., & Colgan, J. (2017). Russian gas games or well-oiled conflict? Energy security and the 2014. Ukraine crisis. Energy Research & Social Science, 24, 59-64, https://doi.org/10.1016/j.erss.2016.12.01
Xia, X.H., Huang, G.T., Chen, G.Q., Zhang, B., Chen, Z.M., & Yang, Q. (2011). Energy security, efficiency and carbon emission of Chinese industry. Energy Policy, 39(6), 3520-3528. https://doi.org/10.1016/j.enpol.2011.03.051
Yergin, D. (2006). Ensuring Energy Security. Foreign Affairs, 85(2), 70-71.
Wang, B., Wang, Q., Wei, Y.-M., & Li, Z.-P. (2018). Role of renewable energy in China’s energy security and climate change mitigation: an index decomposition analysis. Renewables Sustainability En-
ergy Review, 90, 187-194. https://doi.org/10.1016/j.rser.2018.03.012
Winzer, Ch. (2012). Conceptualizing Energy Security. Energy Policy, 46, 36-48. https://doi.org/10.1016/j.enpol.2012.02.067
Zajączkowska, M. (2016). Prospects for the development of prosumer energy in Poland. Oeconomia
Copernicana, 7(3), 439-449. https://doi.org/10.12775/OeC.2016.025
Zhou, W., Kou, A., Chen, J., & Ding, B. (2018). A retrospective analysis with bibliometric of energy security in 2000- 2017. Energy Reports, 4, 724-732, https://doi.org/10.1016/j.egyr.2018.10.01
Progress of the V4 Countries towards the EU’s Energy and Climate Targets… | 197
Authors
The contribution share of authors is equal and amounted to 50% each of them.
Agnieszka Pach-Gurgul
Master in Economics (Faculty of Economics, specialisation: World Economy, Cracow Univer-sity of Economics); PhD in Economics (Cracow University of Economics). Her research inter-ests include EU energy policy, energy security, sustainable development, climate policy , in-ternational commodity markets. Correspondence to: Agnieszka Pach-Gurgul, PhD, International Economics Department, Cracow University of Economics, ul. Rakowicka 27, 31-510 Kraków, Poland, e-mail: [email protected] ORCID http://orcid.org/0000-0003-1917-4679
Marta Ulbrych
Master in Economics (Faculty of Economics, specialisation: Foreign Trade, Cracow University of Economics); PhD in Economics (Cracow University of Economics). Her research interests include the theory and practice of international economic integration and the role of industry/manufac-turing and industrial policy in the globalisation era. Correspondence to: Marta Ulbrych, PhD, International Economics Department, Cracow Univer-sity of Economics, ul. Rakowicka 27, 31-510 Kraków, Poland, e-mail: [email protected] ORCID http://orcid.org/0000-0003-3886-371X
Acknowledgements and Financial Disclosure
This publication received financial support from the resources granted to the Faculty of Economics and International Relations of the Cracow University of Economics as part of the subsidy for the maintenance of the research potential.
This article has been presented as the academic paper at the scientific conference GLOB2018: “Globalization and Regionalization in the Contemporary World: Competitiveness, Development, Sustainability” organized in Kraków on 21-22 September 2019.
Copyright and License
This article is published under the terms of the Creative Commons Attribution – NoDerivs (CC BY-ND 4.0) License
http://creativecommons.org/licenses/by-nd/4.0/
Published by the Centre for Strategic and International Entrepreneurship – Krakow, Poland
The copyediting and proofreading of articles in English is financed in the framework of contract No. 913/P-DUN/2019 by the Ministry of Science and Higher Education of the Republic of Poland committed to activities aimed at science promotion.
This publication has been co-financed by the European Commission Representation in Poland. The European Commission, or any person acting on its behalf, is not re-sponsible for the use of the information contained in this publication. This publication reflects the views only of the authors, and the European Commission cannot be held responsible for any use which may be made of the information contained therein.

2019, Vol. 7, No. 2 10.15678/EBER.2019.070211
Strategic Challenges of Mergers and Acquisitions
in the Higher Education Sector
Łukasz Sułkowski, Robert Seliga, Andrzej Woźniak
A B S T R A C T
Objective: The aim of the article is to present the issue of mergers and acquisitions of universities with reference to academic entrepreneurship.
Research Design & Methods: The research methodology in the article was based on comparative analysis of case studies of universities mergers. The article is of an illustra-tive nature and constitutes a starting point for further in-depth research in the field of university mergers and academic entrepreneurship.
Findings: One of the consolidation motivations in France was to build strong links be-tween universities and enterprises, which is supposed to fuel economic, scientific and technological development. Key mechanisms to drive a wave of strategic mergers in the public university sector that is sweeping through the world are global rankings.
Implications & Recommendations: Consolidations of HEIs should also based on effec-tive human capital management and entrepreneurial organisational culture. Nowa-days, in the process of university merger research, we are at the induction stage, where hundreds of case studies and few comparative studies have been gathered that draw a complex picture of mergers and can serve as a source of practical guidance.
Contribution & Value Added: International comparison of mergers of Polish and French public universities that lead to recommendations on macro level of public policy and on mezzo and micro level of university management.
Article type: research article
Keywords:
university mergers; public university; university management; mer-gers and acquisitions (M&A); higher education sector; academic en-trepreneurship
JEL codes: M0
Received: 25 June 2018 Revised: 31 October 2018 Accepted: 5 November 2018
Suggested citation:
Sułkowski, Ł., Seliga, R., & Woźniak, A. (2019). Strategic Challenges of Mergers and Acquisitions in Higher Education Sector. Entrepreneurial Business and Economics Review, 7(2), 199-215. https://doi.org/10.15678/EBER.2019.070211
200 | Łukasz Sułkowski, Robert Seliga, Andrzej Woźniak
INTRODUCTION
A characteristic feature of modern economy is the existence of many different eco-nomic entities that can be grouped according to the type of their business activity. Business entities, most often enterprises, operate within the framework of meso-struc-tures taking a competitive (competitive sector) and sometimes a synergistic form (clus-ter). The higher education sector is atypical because it is dominated by non-enterprise economic entities, and competitiveness is regulated and limited by state intervention. The rapid development of the higher education sectors all over the world is, moreover, associated with the growing importance of intellectual capital and the transfer of knowledge that distinguishes modern economies from industrial economies (Mačerin-skienė & Aleknavičiūtė, 2017). In this sense, the higher education sector is the backbone and the source of most modern production and service sectors. The issue of competi-tiveness is a strategic problem both from the point of view of the development of the entire sector and the market players operating in it. M.E. Porter analyses the relation between the competitiveness and profitability of an economic entity and the attrac-tiveness of the sector in which this entity operates.
The merger process that is currently taking place in the higher education sector can be called ‘merger-mania’. In an attempt to analyse literature and research results in the field of university mergers, it can be noted that in some educational systems it is already an advanced process of a hundred years or more. Extensive merger pro-grammes are or have been implemented in China, South Africa, the USA, France and Norway, among others. In many countries strategic mergers of large public universities are being implemented. It happened in Finland, Sweden, France and even Vietnam (Pin-heiro, Geschwind, & Aarrevaara, 2016). In most countries the consolidation of univer-sities is a bottom up process, but the tendencies to connect at the central level are reflected in public policies. In some countries, for example in South Africa, Russia, China and Norway, top-down consolidations, which are more controversial, are also con-ducted (Karodia, Shaikh, & Soni, 2015). The objectives of mergers are therefore diverse and may include: entry into the ‘world league of universities’, rationalisation of educa-tion and research networks, as well as restructuring aimed at increasing the efficiency of the education process (Cai, 2016). A specific objective pursued through mergers may be to increase the access and quality of higher education addressed to disadvantaged groups. This was the idea of consolidation and transformation of higher education in South Africa.
The aim of the article is to present the issue of mergers and acquisitions of univer-sities with reference to academic entrepreneurship. The research methodology in the article was based on a case study of the university. The article is of an illustrative nature and constitutes a starting point for further in-depth research in the field of university mergers and academic entrepreneurship.
The structure of the article is organised in the following way. In first part literature review about mergers and acquisitions in higher education sector was conducted. Sec-ondly, the methodology was described. Thirdly, results and discussion were presented. The article ends with the conclusion.
Strategic Challenges of Mergers and Acquisitions in the Higher Education… | 201
LITERATURE REVIEW
When attempting to analyse management processes at universities, it can be noticed that many classical management concepts have been implemented into these processes. This implementation has the characteristics of adaptation, which takes into account the broad specifics of educational services at the higher level. Universities provide educational ser-vices and operate in an environment that has a major impact on their activities (Soni & Govender, 2018). Therefore, the choice of strategy depends to a large extent on such fac-tors as the legal form of the university or its specialisation (Mihi-Ramirez, 2016).
Looking forward, it can be stated that the university of the future will largely rely on strategies that will be integrated with the university’s organisation, will be supported by analytical and IT tools and programmes and which will more and more accurately allow the verification of key areas of the university, e.g. the science area – evaluation of the scientific achievements of the entity. Strategies will include scientific, educational, imple-mentation as well as organisational, market and financial activities. The management in-formation systems at universities are already developing at the moment, enabling quick market and strategic analyses. The management and administration of higher education institutions increasingly use new tools of controlling, process and project management that serve the decision-making process (Hladchenko, 2015).
Strategic management plays a key role in consolidation processes (Pinheiro & Sten-saker, 2014). First of all, the decision about consolidation itself should be preceded by a strategic analysis of the organisation and the environment, which is the premise for mak-ing the decision on the merger (Andriuskevicius & Ciegis, 2017). There should be consulta-tions with various stakeholder and due diligence groups. In the case of a non-public univer-sity, making merger decisions is usually faster and simpler. In public universities the deci-sion-making process is usually complex and requires the participation of various stake-holder groups. The strategic objectives of the merger should be set, which will be the basis for the preparation of the strategic plan (planning stage). The adoption of the strategic mer-ger plan is related to the transition to the process of strategic coordination of the merger (implementation stage). Strategic management at this stage consists in drawing conclusions from due diligence and participating in negotiations and concluding contracts (Sulkowski, 2016). Institutionalisation of the merger – in the form of signing agreements and validating the decisions on the consolidation of entities – closes the implementation stage and con-stitutes the transition to the integration stage (Sarkar & Perenyi, 2017).
Strategic management consists in planning and implementing decisions regarding the allocation of the entity’s resources, aimed at: (1) implementing the strategic goals of the entity, (2) implementing the strategic plan, and (3) increasing the adaptation degree of the entity’s activities to the environment. Strategic management of a university, a public one in particular, will serve to achieve goals that are determined by the type of organisation and key stakeholders (Mokhuba & Govender, 2016). In the case of private entities the founding structure is the decisive body in determining the strategic objectives, while in the case of public universities – university managers, representatives of the staff and students along with political decision-makers (Vilys, Jakubavičius, & Žemaitis, 2015).
The level of autonomy in making strategic decisions depends on the type of univer-sity, its statute and structure of power. Undoubtedly, decisions about mergers belong
202 | Łukasz Sułkowski, Robert Seliga, Andrzej Woźniak
to the strategic level due to their importance and a long time horizon of implementation. Mergers should not be a strategic goal but only a method of achieving it or, possibly, a tactical goal. Strategic goals are the achievements of key importance for the organisa-tion in the long term. The mission of an organisation should reflect the sense of its ex-istence. It is intended to justify the role of the entity both from the point of view of its founders, as well as society, employees and other key stakeholders. The strategic goals and the mission of the university are determined to a large extent by the type of organ-isation that usually performs a scientific and educational mission and cooperates with the environment (the so-called ‘third mission’).The mission and strategic goals of a pub-lic university include the implementation of mainly non-commercial aspects of its activ-ity, while non-public, and in particular private, profit-making universities pursue com-mercial goals (Van der Wende, 2014). According to the assumptions of the planning school, the strategy should be reflected in the strategic plan. The strategic plan includes: (1) strategic objectives, (2) time perspective of the implementation of activities, (3) a sequence of steps (stages) leading to the achievement of the objectives, (4) defining the resources necessary to achieve the objectives and the way they will be used.
MATERIAL AND METHODS
The research methodology used is of a qualitative nature and is based on a comparative analysis of merger studies between universities. A comparative analysis of university merger cases was conducted on the basis of a set of research indicators developed in the study. In the encoded material from in-depth interviews, statements were sought reflecting the di-verse opinions of respondents in relation to research indicators. 13 areas and 31 research indicators were proposed. Then an attempt was made to synthetically compare the cases using all available data obtained with the following techniques: in-depth interviews, docu-mentation analysis, participant observation, auto-ethnography and duo-ethnography. Data obtained from in-depth interviews, the comparison of which made it possible to draw con-clusions, turned out to be of key importance. The research presented in the article is of a pilot nature and serves as a preliminary answer to the key questions for the value of the article and effective ways of implementing the consolidation of the university. The attempt of two cases of consolidation of the university was selected on purpose, the choice was based on the criteria of: data availability, literature on the subject and the experience of its authors. The sample is heterogeneous, as it describes university mergers: carried out at dif-ferent times, between different types of universities, in two countries.
RESULTS AND DESCUSSION
Case Study 1: Strategic consolidation and the establishment
of Université Grenoble Alpes (UGA)
Characteristics of the Universities
Université Joseph Fourier
UJF, also known as Université Grenoble I, was established in 1971 from the transfor-mation of the faculty of science founded in Grenoble by Joseph Fourier in 1811. The name of Joseph Fourier was born by the university since 1987. This oldest university in
Strategic Challenges of Mergers and Acquisitions in the Higher Education… | 203
Grenoble existed until the end of 2015, until it merged with two other universities form-ing UGA. The University educated 15 000-18 000 students, mainly in the natural, tech-nical and medical sciences, such as: chemistry, biology, geography, physics, computer science, mathematics, medicine and pharmacy.
UJF occupied fairly high positions among French universities in international rank-ings. In THE ranking in 2012, it ranked 180th and 155th in 2013. It was also in the group of the first 150 world universities and the first ten French universities. Under the decree on the merger of three Universities of Grenoble, which entered into force on January 1, 2016, it became part of the Université Grenoble Alpes.
Université Pierre Mendès France
Université Pierre Mendès France – Grenoble, operated also under the name Grenoble II and the abbreviation UPMF in 1970-2015. Grenoble II was established in 1970 by the law on higher education from 1968. One of the tendencies that resulted from this regulation was the appearance in France of more specialised research institutes and, at the same time, universities. Grenoble II arose from the separation of a part of the department of humanities and social sciences, including: psychology, sociology and history.
The amendment to the act regulating the functioning of the university in 1984 caused the change of the university statute in the next year. The name ‘Pierre Mendès France’ (UPMF) was in force since 1991, when the first contract was signed with the Ministry of Higher Education. In 2009, by the agreement in the consortium of PRES Université de Gre-noble, UPMF became a member of the Université Grenoble Alpes university group. Ac-cording to the decree of 2015, the university ceased to exist on January 1, 2016, forming part of a consolidated university under the name Université Grenoble Alpes (UGA).
Université Stendhal
Université Stendhal (Grenoble III) existed in the years 1970-2015. It was created in 1970 and from the beginning it was named after the famous French writer Stendhal. The university originated from the division of a large department of humanities and social sciences at the University of Grenoble. Grenoble III specialised in research and higher education in the fields of humanities and the fields of art, such as: philology, linguistics, literary studies, cultural studies, social communication, journalism and theatrology. The most important educational programmes were: English philology, French and other philologies, linguistics and other hu-manities. The university was also traditionally involved in the education of secondary and primary school teachers in the humanities. At the turn of the 20th and 21st centuries, Gre-noble III educated about 4 000 to 5 000 students and about 3 000 more in its branches.
The Course of the Merger
The University of Grenoble was founded in the 14th century (1339) and survived, repeat-edly transformed, until 1968. The introduction of a reform strengthening the autonomy of research and teaching centres led to the division of the university into four specialised sister colleges according to the department key. The beginning of the 21st century in France brought ‘Shanghai shock’, which was associated with the poor positions of French universities in arising and gaining importance in international rankings. Positive consolida-tion experiences in higher education in many countries encouraged the universities of Gre-noble to undertake the pioneering task of joining the universities, which began with the
204 | Łukasz Sułkowski, Robert Seliga, Andrzej Woźniak
creation of a strategic alliance. In 2002, a cooperation was established under the name of Grenoble Universités, which covered all four public universities in Grenoble. In the nego-tiation process, the University of Technology decided not to move towards the consolida-tion, while the others planned, communicated and effectively implemented the merger. The Grenoble Universités consortium became an umbrella that enabled the development of cooperation as well as consolidation. In 2003, the ministry proposed a programme of cooperation between the university and the environment, including a consolidation con-cept. In 2004 Minister Jean Marc-Monteil wrote a letter to the university encouraging the creation of local partnerships with universities and promoting integration. Then, improve-ment programmes were centrally implemented, which also promoted consolidation.
In 2009, as part of the implementation of the ministerial PRES programme (research and higher education centres), the merger of Universities with Grenoble was an-nounced, which was supposed to start from January 1, 2016. A negotiation and integra-tion team was established, in which representatives of all universities, as well as central and local authorities and external stakeholders participated. Consolidation received strong financial and substantive support from the French Ministry of Higher Education. As a result of strategic analyses, research and negotiations, the following were agreed: the strategy and stages of the merger, the structure of the consolidated university, the new name and the authorities of the consolidated university.
On September 11, 2015 a decree on the merger of three universities in Grenoble was signed, which entered into force on January 1, 2016. By virtue of the decree, the Université Grenoble Alpes was created, which merged three Grenoble universities into one. The uni-versity’s rector was Lise Dumasy, the rector of Université Stendhal for three tenures. Vice-rectors were the managers representing the merging universities. In the restructuring pro-cess, a new strategy and organisational structure was created. The new strategy is focused on cooperation with the environment, innovation and implementation, as well as interna-tionalisation and development of high quality research and didactics within a comprehen-sive university. The mission underlines the growing role of international interdependence, innovation, interdisciplinary research and implementation. It also confirms that the heart of the university’s activity is the combination of education and research.
In the consolidation process, a new information system was also implemented, cover-ing the university management, but also the entire scientific output of employees and units, international relations and education quality management. New websites for the university and all units were also created, which was coupled with marketing activities, oriented towards the Internet and social networking sites in particular.
During the consolidation, changes were also made in the area of HR management. A deepened specialisation between research and teaching staff was introduced. Also, evaluation, remuneration and development systems rewarding higher productivity (per-formance based systems) were introduced. The positions, salaries and development op-portunities of employees from different disciplines are differentiated. Representatives of exact, natural and technical sciences gained the greatest chances of development, and humanities and social sciences – slightly smaller.
Merger Barriers
According to information taken from interviews, the most important barriers to mergers included psychological, social, organisational and legal constraints. From the beginning of
Strategic Challenges of Mergers and Acquisitions in the Higher Education… | 205
the process of formalised cooperation, the concerns of the academic staff and administra-tion that consolidation may worsen working conditions or lead to weakening of influence arose. The way to dispel these fears was communication, consultation and providing em-ployees with working conditions that were at least on the same level as before the merger. The staff participated in the preparation of the merger through systematic meetings in the framework of inter-university integration teams for several years. The involvement of em-ployees in the merger was quite high due to the ‘Shanghai shock’, the chances of using central programmes and the sense of creating a valuable and to some extent pioneering organisational solution in France. A certain social barrier was the formation of groups dis-turbed by the merger and the conservative attitude of trade unions. Long negotiations, which allowed for a compromise, were necessary. The Technical University of Grenoble, although initially discussed the merger, retreated in the course, mainly due to social re-sistance. The polytechnic staff did not know if the merger would bring them sufficient ben-efits to compensate for the partial loss of independence. The merger planning was carried out carefully, as was due diligence. Among the organisational barriers, the key role was played by attachment to the organisational structures and cultures of the universities. The impact of this obstacle was stopped by limiting the restructuring of scientific and didactic units. Departments, institutes, and even chairs remained largely without major changes. The deep transformation concerned support structures. A favourable factor was the early announcement of the consolidation date (2009). Political barriers were rather absent, both the ministry and local authorities favoured consolidation and actively supported it. Some legal limitation was the need to implement many laws and regulations that required time. Financial barriers practically did not appear, because the consolidation was co-fi-nanced under the Ministry’s programmes.
Merger Effects
Université Grenoble Alpes currently educates over 45 000 students and employs 5 500 employees in over 80 organisational units. The merger brought first results in the form of: intensification of scientific activities, improvement of organisational and managerial efficiency and generation of savings from consolidated processes and structures. Natu-rally, it is difficult to assess the effects of the merger due to the short time of its imple-mentation, but the mere comparison between international rankings before and after the consolidation provides valuable information.
In eight scientific disciplines, UGA is in the world top 50, and in the next nine in the first hundred. In the Leiden (CWTS) ranking, UGA was classified on the 159th place and on the 7th in France. The position in the field of publications in physics, technical sciences, life sciences, earth sciences, mathematics and computer science is particularly high. In the Times Higher Education (THE) ranking, UGA was ranked 52nd in 2017. The QS World Uni-versity Rankings ranking places UGA in the group of the best universities in 13 scientific disciplines. UGA also received the IDEX scientific excellence certificate. In the Thomson Reuters classification ‘Reuters Top 100: The World's Most Innovative Universities’ UGA achieved 93th position in the world and 6th in France and 20th in Europe.
Prospects
The first, positive effects of the consolidation create the prospects for achieving the stra-tegic goals of consolidation in the coming years. UGA implements mechanisms that dyna-
206 | Łukasz Sułkowski, Robert Seliga, Andrzej Woźniak
mise scientific activity, which has improved its position in national and international rank-ings in the last two years. Much effort was required from the employees to adapt to the new situation, which means that the results of scientific and didactic activities should im-prove year by year. The interviews indicate improvement of consolidated university man-agement through: more effective strategic management, real emphasis on international cooperation and cooperation with the environment, effective marketing communication and more advanced financial management and accounting. Employees mention faster and more efficient operation of administrative units compared to the situation before the mer-ger. There is a gradual increase in the number of English-speaking students and pro-grammes, which favours the internationalisation of the university. The UGA didactic offer was expanded, and at the same time unified and modernised.
Case Study 2: The merger ‘out of sectoral, stimulated from the top necessity’
– the Medical University is being created
Characteristics of the Universities
Medical Academy in Łódź
The Medical Academy in Łódź functioned in the years 1949-2002, at the end of its activities the active departments were: medical (including a nursing unit), dental, public health and pharmaceutical (including a branch of medical analytics).
The establishment of the Academy was made possible by the following legal act: Reg-ulation of the Council of Ministers of October 24, 1949 on the creation of medical acade-mies in Warsaw, Krakow, Poznań, Lublin, Łódź and Wrocław. On its basis, the departments operating at the University of Łódź: pharmaceutical, medicine and dentistry joined into an independent university at the beginning of the 1950s. The university ceased to exist in accordance with the Act of the Sejm of the Republic of Poland dated July 27, 2002 on the establishment of the Medical University in Łódź.
Military Medical Academy
In 1946, the Military and Medical School of Feldshers was established in Łódź, which took over the function of the Chair of Military Medicine, operating in the years 1944-1946 at the Maria Curie-Skłodowska University in Lublin. In 1950, the Military-Medical Faculty for military doctors was established in the structures of the Medical Academy in Łódź, as the foundation for the future Military Academy.
From July 1958, the Military Medical Academy (WAM) existed on the basis of Resolution No. 477/57 of the Council of Ministers of the Polish People’s Republic of November 7, 1957 until 2003. It was attended by soldiers – military medical officers (doctors, pharmacists, den-tists and psychologists), not only for the needs of the Polish armed forces, but also for forces belonging to other states. The base was the Central Clinical Hospital of the Ministry of Na-tional Defence in Łódź. The Academy used the resources of the Medical Academy in Łódź, numerous clinics and chairs were established on the basis of the Academy's civil structure units. Twenty-three independent academics from the Medical Academy were employed at WAM, which also received auxiliary scientific workers, lab technicians and a technical em-ployee. In 1958, the ‘Principles of cooperation between the Medical Academy and the Mili-tary Medical Academy’ were implemented. They regulated the teaching of WAM students
Strategic Challenges of Mergers and Acquisitions in the Higher Education… | 207
in medicine and in the field of pharmaceutical studies, employing Medical Academy employ-ees in the Military Medical Academy, sharing facilities needed for conducting classes and research, providing medical equipment, participating in exams and student recruitment. The order of the Ministry of National Defence from May 19, 1958, according to which from the beginning of July the Military Medical Academy, based on the Military Medical Training Cen-tre, was to be created, was also of great importance.
The Academy changed under the influence of the restructuring of the Polish Armed Forces that was taking place since the 1990s. The number of employees, units and students decreased, and there were significant budget restrictions. Under the influence of these changes, WAM became a military-civil university, in 1998-1999 civilians were offered two fields of study: public health and physiotherapy in part-time mode. In view of the reform of the higher military education introduced by the Ministry of National Defence, the Academy actually had to cease to exist, because there was no longer a ministerial training system for military doctors. The Academy authorities began to strive to connect with the Medical Uni-versity in Łódź to save the status of the university and years of academic work and research.
The Course of the Merger
Preparations for the merger of universities lasted from 2000. In December that year, the Inter-University Team for Integration was set up, in which the authorities of the University of Łódź participated together with the representatives of the Medical Academy and the Mil-itary Medical Academy. Originally, it was planned to combine these three universities in the structures of the Department of Health Sciences of the University of Łódź. This project, how-ever, was not implemented, mainly due to resistance from the medical community and the lack of a solution to the difficult financial situation of many clinical hospitals in Łódź. On the side of the Medical Academy in Łódź, there were concerns that competition in the form of medical departments at the University of Łódź may arise, hence the MA authorities adopted a much more open attitude towards the merger. At the same time, WAM lost its funding base due to a departure from medical military education. This created a compulsory situa-tion in WAM, when the top-down financial pressure forced the university to connect with the other one. The advantage of the merger for both universities was the possibility of pres-tigious and scientific promotion to the level of the Medical University. On April 8, 2002, a letter of intent was signed regarding the merger of the Medical Academy and the Military Medical Academy and the establishment of the Medical University of Łódź.
Merger Barriers
The factor conducive to the merger was raising the rank of the consolidated university. Thanks to the merger two academies have become a university. However, despite the prestige promotion, the merger was accompanied by many tensions that had financial, organisational, cultural, social and even personal sources.
Conducted interviews indicate four most important sources of consolidation barriers that occurred during the merger of MA with WAM.
1. Forced and top-down nature of the merger. 2. Problematic situation of a deficit in the activity of many clinical hospitals. 3. Poor preparation for the consolidation process. 4. A sense of threat among scientific, didactic and administrative employees.
208 | Łukasz Sułkowski, Robert Seliga, Andrzej Woźniak
5. Organisational, cultural and personal tensions between universities. 6. Poor financing of the merger and lack of central support in the integration process.
Most of the respondents from the former WAM emphasize that the merger was prac-tically forced, although of course it required the consent of the senates of both universi-ties. WAM could not remain an autonomous university because it did not have adequate sources of central financing. On the other hand, the respondents from former MA empha-size the compulsion of their own situation, because the prospect of establishing medical departments at the University of Łódź was a great source of danger. The merger was top-down, it took place with considerable participation of the central government, because the decisions were taken by the ministers of health and national defence, of course with the approval of both universities. The situation of ‘forced consolidation’, which resulted from changes in the methods of financing military medical education, created pressure on WAM, which had to make a decision about entering the MA structure. The consequence of this was the negotiation process that led to the creation of the Military and Medical Department. This created the situation of an apparent unification merger. The Medical University was supposed to have a unified, not federal structure, but internal tensions led to the creation of the aforementioned department. The department along with the WAM hospital are the main units employing the staff from the former WAM.
Deficit clinical hospitals strengthened the problem of the merger and practically prevented a wider regional merger between regional universities with the participation of the University of Łódź.
Poor preparation for the consolidation was associated with the lack of analytical and preparatory processes. Before the merger, no strategic analyses had been carried out, and due diligence was lacking. The employees were informed about the merger, but it was not a consultation process. Strategic integration planning was also lacking. The consolidation took place through a one-time parliamentary law and hurried out organisational transfor-mations, which resulted in a smouldering conflict between the group holding power in the former Medical Academy and a group of influence from the Military Medical Academy.
The sense of threat among the scientific-didactic and administrative staff was born out of uncertainty and organisational activities accompanying the merger. The consolidation did not improve the financial position of the consolidated university, which for many years after the merger experienced financial problems related to the construction costs of the Clinic and Didactic Centre (CKD) started in mid-1970s, as well as the deficit related to the operation of clinical hospitals. The consequence were low wages at the Medical University and cost cut-ting processes that included various groups of employees, including administration and sen-ior lecturers. These were restructurings forced by the financial situation, which increased efficiency, but reinforced the sense of threat for some employees. Low wages meant that the vast majority of teaching staff also worked in other places outside the university.
Organisational, cultural and personal tensions between the employees of the former academies have been going on till this day. Despite 15 years after the merger, interviews with university staff reveal a tension manifested in the antagonism: us and them. It is vis-ible in situations where the most important decisions are taken, for example about choos-ing the rector. It also involves seeking by the group of influential WAM professors the pos-sibility of making the military-medical structure independent from the Medical University.
Strategic Challenges of Mergers and Acquisitions in the Higher Education… | 209
One of the sources of the antagonism is also the great solidarity of the milieu of military doctors, which was strengthened by the ‘forced’ solution of merger processes.
The consolidation was not accompanied by significant central support. On the con-trary, in the following years, the financial pressure on the Medical University increased, related to the costs of completion of the CKD construction and the deficit related to the operation of clinical hospitals. The implemented restructuring was of the cost cutting char-acter, but it did not involve the creation of efficient controlling.
Merger Effects
Thanks to the merger, the Medical Academy in Łódź became the Medical University, which was a prestigious promotion, resulting from an increase in the scientific and didactic po-tential. The direct effect was also the broadening of the clinical and didactic base. The merger contributed to improving the rankings, both domestic and international ones. On the other hand, the effect of the merger is the strategic, structural and cultural tension, as well as lasting personal tensions. According to the worldwide ranking of universities, Webometrics Ranking of World Universities in 2013, developed by the Spanish institute Consejo Superior de Investigaciones Científicas, the university took the 7th place in Poland among medical universities, and 2707 in the world from all types of universities.
Prospects
The integration of both universities is relatively slow and there is a clear distinction be-tween them. The ‘military’ personnel form their own Military and Medical Department. Ideas are also sought for the possibility of rebuilding and re-separation of military med-ical education. Quite clear, though remaining within the Medical University, are also tensions between these two groups of influence. The merger did not lead to full integra-tion. The University representatives emphasize that the Military-Medical Department has poor results in the Medical Final Examination, while the graduates of the Depart-ment of Medicine of the Medical University have good results.
Mergers between universities, just like in business, do not easily succumb to manage-rial control and project management, which would enable full implementation of the ob-jectives. Table 1 presents factors determining mergers in higher education.
CONCLUSIONS
The consolidation of universities is a major theoretical and practical challenge. There is a very large number of practical examples of university mergers in the world, but at the same time a shortage of theory that would help manage consolidations. One of the prom-ising concepts is the social identity approach, other concepts are: M&A strategic and pro-cess theories (Gleibs, Tauber, Viki, & Giessner, 2013; Cai, 2006). In the public sector, the basis for analysing the concept of consolidation are the theories of new public management (NPM) and public value management (PVM). Nowadays, in the process of university merger research, we are at the induction stage, where hundreds of case studies and few compara-tive studies have been gathered that draw a complex picture of mergers and can serve as a source of practical guidance. In an attempt to take advantage of these experiences, ten principles of effective management of university mergers that cover the entire process, from planning, through implementation to integration, can be proposed (Figure 1).
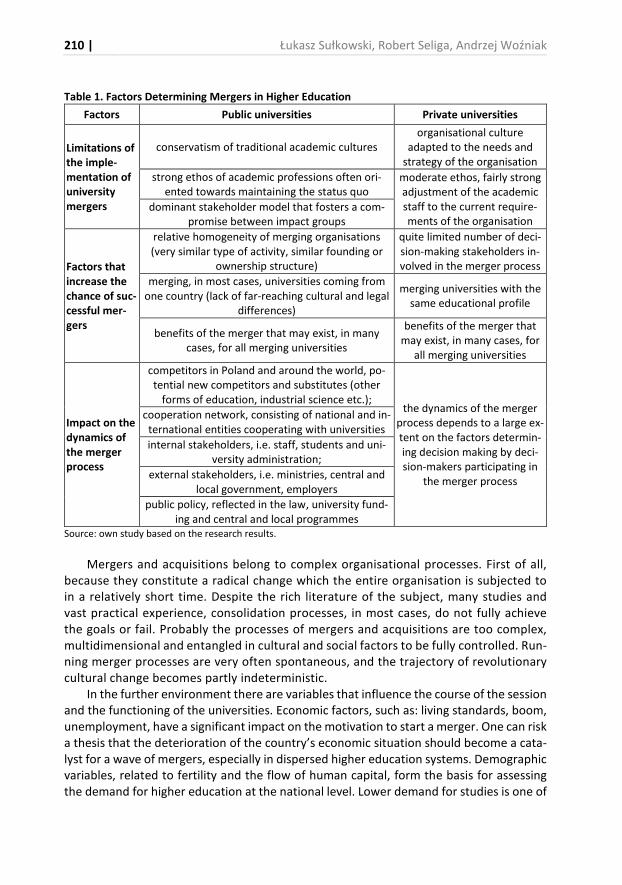
210 | Łukasz Sułkowski, Robert Seliga, Andrzej Woźniak
Table 1. Factors Determining Mergers in Higher Education
Factors Public universities Private universities
Limitations of
the imple-
mentation of
university
mergers
conservatism of traditional academic cultures organisational culture
adapted to the needs and strategy of the organisation
strong ethos of academic professions often ori-ented towards maintaining the status quo
moderate ethos, fairly strong adjustment of the academic staff to the current require-ments of the organisation
dominant stakeholder model that fosters a com-promise between impact groups
Factors that
increase the
chance of suc-
cessful mer-
gers
relative homogeneity of merging organisations (very similar type of activity, similar founding or
ownership structure)
quite limited number of deci-sion-making stakeholders in-volved in the merger process
merging, in most cases, universities coming from one country (lack of far-reaching cultural and legal
differences)
merging universities with the same educational profile
benefits of the merger that may exist, in many cases, for all merging universities
benefits of the merger that may exist, in many cases, for
all merging universities
Impact on the
dynamics of
the merger
process
competitors in Poland and around the world, po-tential new competitors and substitutes (other
forms of education, industrial science etc.); the dynamics of the merger
process depends to a large ex-tent on the factors determin-ing decision making by deci-sion-makers participating in
the merger process
cooperation network, consisting of national and in-ternational entities cooperating with universities
internal stakeholders, i.e. staff, students and uni-versity administration;
external stakeholders, i.e. ministries, central and local government, employers
public policy, reflected in the law, university fund-ing and central and local programmes
Source: own study based on the research results.
Mergers and acquisitions belong to complex organisational processes. First of all, because they constitute a radical change which the entire organisation is subjected to in a relatively short time. Despite the rich literature of the subject, many studies and vast practical experience, consolidation processes, in most cases, do not fully achieve the goals or fail. Probably the processes of mergers and acquisitions are too complex, multidimensional and entangled in cultural and social factors to be fully controlled. Run-ning merger processes are very often spontaneous, and the trajectory of revolutionary cultural change becomes partly indeterministic.
In the further environment there are variables that influence the course of the session and the functioning of the universities. Economic factors, such as: living standards, boom, unemployment, have a significant impact on the motivation to start a merger. One can risk a thesis that the deterioration of the country’s economic situation should become a cata-lyst for a wave of mergers, especially in dispersed higher education systems. Demographic variables, related to fertility and the flow of human capital, form the basis for assessing the demand for higher education at the national level. Lower demand for studies is one of
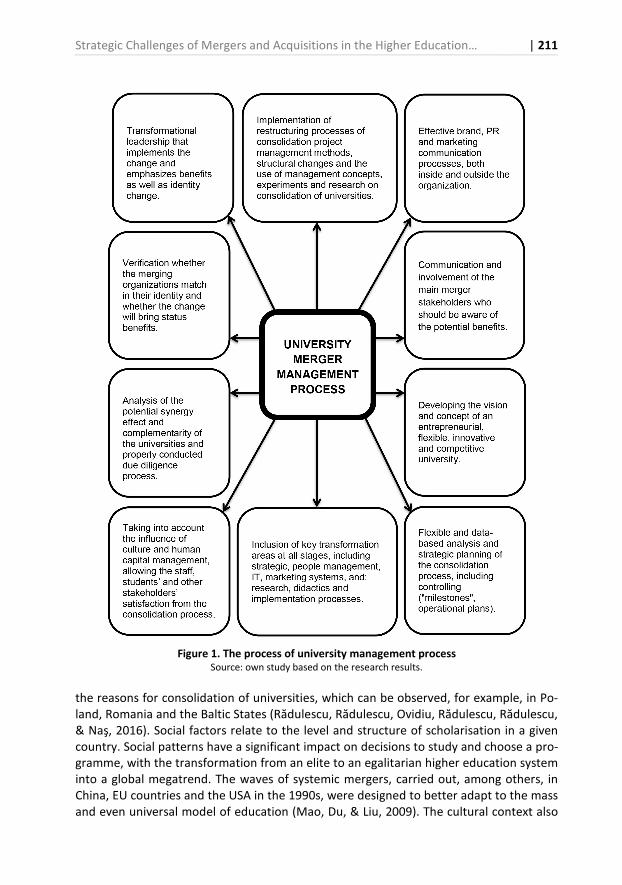
Strategic Challenges of Mergers and Acquisitions in the Higher Education… | 211
Figure 1. The process of university management process
Source: own study based on the research results.
the reasons for consolidation of universities, which can be observed, for example, in Po-land, Romania and the Baltic States (Rădulescu, Rădulescu, Ovidiu, Rădulescu, Rădulescu, & Naş, 2016). Social factors relate to the level and structure of scholarisation in a given country. Social patterns have a significant impact on decisions to study and choose a pro-gramme, with the transformation from an elite to an egalitarian higher education system into a global megatrend. The waves of systemic mergers, carried out, among others, in China, EU countries and the USA in the 1990s, were designed to better adapt to the mass and even universal model of education (Mao, Du, & Liu, 2009). The cultural context also
212 | Łukasz Sułkowski, Robert Seliga, Andrzej Woźniak
has a significant impact on consolidation processes, although the assessment of its impact is very difficult. Culture not only shapes the organisations themselves and the behaviour of people in organisations, but also affects the functioning of the entire education system, and even the dynamics of the consolidation process. In countries with high levels of social capital, with developed civic culture, university mergers are more likely to be successful. However, there are positive and negative examples that contradict this thesis. Successful centralist mergers in China, on the one hand, prove that even in a society with a relatively low civic culture, it is possible to effectively implement the consolidation of universities (Cai & Yang, 2016). On the other hand, some failed mergers in the UK and Australia prove that culture is only one of the variables in the complex mosaic of impact factors (Martin, 1996). An important role in the processes of university consolidation is also played by the scientific and technological environment. It is connected with the progress of science re-quiring the reorganisation of research units, which takes place through internal restruc-turing, the creation of cooperation networks and mergers. The general tendency is the concentration of scientific units, which leads to the creation of a ‘critical mass’ that allows the implementation of ambitious research projects and the development of renowned sci-entific schools. New technologies emerge in the cooperation of universities with the in-dustry and through the creation of spin-offs. One of the consolidation motivations in France was to build strong links between universities and enterprises, which is supposed to fuel economic, scientific and technological development. New communication and net-work technologies also have direct impact on conducting research (e.g. methods, labora-tories) and education (e.g. on-line education). Distance education opportunities were one of the motives for combining even distant campuses and colleges. Global variables are related to the internationalisation of science and higher education and the development of global competition. One of the key mechanisms to drive a wave of strategic mergers in the public university sector that is sweeping through the world are global rankings, such as: Academic Ranking of World Universities – Shanghai Ranking Consultancy, World’s Best Universities Ranking – US News & World, THE World University Ranking – Times Higher Education, U-Multirank. In globalisation, English-speaking countries (USA, United King-dom, Australia) have a competitive advantage due to the international role of English and the academic and educational position of their universities. In many countries, mergers are carried out to internationalise the university by: opening joint programmes (joint, dual and double degrees) and English-language programmes, attracting foreign students, strengthening academic and didactic exchange. Knowledge capital means the develop-ment of competences regarding the consolidation of universities based on research pro-jects taken not only from the education sector, but also from business, as well as from experience and studies of merger cases. The growing number of publications, research and cooperation projects convinces that consolidations may lead to the implementation of many strategic goals and may affect both private and public universities. Knowledge about potential risks and threats of consolidation processes is also better, which allows to plan future mergers more effectively.
The example of consolidation – Grenoble – indicates that the return to the identity and heritage of the University of Grenoble from over 40 years was a strong integrator. The op-posite situation occurred in the case of the second described study – AM with WAM. In this case, the merger did not lead to full integration. In the case of UGA mergers, all support
Strategic Challenges of Mergers and Acquisitions in the Higher Education… | 213
structures have been designed and implemented as university-wide and integrated units. There was also a high degree of interaction and cooperation within the inter-faculty matrix structures. Consolidations should also develop effective human capital management. An example is the diversification of career paths, which occurred, for example, in UGA during consolidation. In the case of the merger of AM with WAM there were many barriers affect-ing the merger. Some of them concerned the area of human resources (organisational, cul-tural and personnel tensions between universities) and the finances of entities.
REFERENCES
Andriuskevicius, K., & Ciegis, R. (2017). Developments and challenges of measuring M&A perfor-mance on a corporate and macroeconomic levels. Oeconomia Copernicana, 8(2), 199-220. https://doi.org/10.24136/oc.v8i2.13
Benington, J., & Sørensen, E. (2017). Towards a multi-actor theory of public value co-creation. Public
Management Review, 19(5). https://doi.org/10.1080/14719037.2016.1192164
Cai, Y. (2006). A case study of academic staff integration in a post-merger Chinese university. Tertiary
Education and Management, 12(3). https://doi.org/10.1007/s11233-006-9002-7
Cai, Y. (2016). Towards a novel conceptual framework for understanding mergers in higher education. European Journal of Higher Education, 6(1), 7-24. https://doi.org/10.1080/21568235.2015.1099457
Cai, Y., & Yang, X. (2016). Mergers in Chinese higher education: lessons for studies in a global context. European Journal of Higher Education, 6(1), 71-85. https://doi.org/10.1080/21568235.2015.1099458
Gleibs, I.H., Tauber, S., Viki, G.T., & Giessner, S.R. (2013). When What We Get Is Not What We Want The Role of Implemented Versus Desired Merger Patterns in Support for Mergers. Social Psy-
chology, 44(3), 215-226. https://doi.org/10.1027/1864-9335/a000102
Hartleyi, J. (2017). Towards an empirical research agenda for public value theory. Public
Management Review, 19(5), 670-685. https://doi.org/10.1080/14719037.2016.1192166
Hladchenko, M. (2015). Balanced Scorecard – a strategic management system of the higher educa-tion institution. International Journal of Educational Management, 29(2), 167-176. https://doi.org/10.1108/IJEM-11-2013-0164
Karodia, A.M., Shaikh, A., & Soni, D. (2015). The South African universities post-merger mess: Prob-lems and challenges of transformation. Mediterranean Journal of Social Sciences, 6(3), S1. https://doi.org/10.5901/mjss.2015.v6n3s1p326
Mačerinskienė, I., & Aleknavičiūtė, R. (2017). National intellectual capital influence on economic growth in the European Union countries. Equilibrium. Quarterly Journal of Economics and Eco-
nomic Policy, 12(4), 573-592. https://doi.org/10.24136/eq.v12i4.30
Mao, Y., Du Y., & Liu J. (2009). The effects of university mergers in China since 1990s: From the perspective of knowledge production. International Journal of Educational Management, 23(1). https://doi.org/10.1108/09513540910926402
Martin, C.D. (1996). The involuntary push: University mergers and their effect on post-graduate management education in South Australia. Journal of Educational Administration, 34(3), 83-91.
Mihi-Ramírez, A. (2016). Trends in the International Academic Migration: A Case of Spain. Entrepreneurial
Business and Economics Review, 4(1), 113-128. https://doi.org/10.15678/EBER.2016.040108
Mokhuba, D.K., & Govender K. (2016). The merger of historically disadvantaged tertiary institu-tions in South Africa: A case study of the University of Limpopo. Cogent Business & Manage-
ment, 3(1), 125-133.
214 | Łukasz Sułkowski, Robert Seliga, Andrzej Woźniak
Pinheiro, R., & Stensaker, B. (2014). Strategic Actor-Hood and Internal Transformation. In B. Jelena, M. Klemenčić, P. Lažetić, & P. Zgaga (Eds.), Global Challenges, Local Responses in Higher Educa-
tion (pp. 171-189), Sense Publishers. https://doi.org/10.1007/978-94-6209-581-6
Pinheiro, R., Geschwind, L., & Aarrevaara, T. (2016). Mergers in Higher Education. European Journal
of Higher Education, 6(1), 2-6. https://doi.org/10.1007/978-3-319-21918-9
Rădulescu, C., Rădulescu, G.M.T., Ovidiu, S., Rădulescu, A.T.G.M., Rădulescu, V.M.G.M., & Naş, S. (2016). The Access to Performance in Romanian Academic System Possibilities for iliescu the
Competitiveness of Universities in Romania. DEStech Transactions on Social Science, Education and Human Science.
Sarkar, Á., & Perényi, A. (2017). Education Agents as Competitiveness Enhancers of Australian Uni-versities by Internationalisation Facilitation. Entrepreneurial Business and Economics Review, 5(4), 61-89. https://doi.org/10.15678/EBER.2017.050403
Seliga, R., Sulkowski, L., & Wozniak, A. (2019). Barriers to University Mergers – Comparative analysis of Universities in Europe. Advances in Intelligent Systems and Computing, vol. 783, AHFE. 558-567. https://doi.org/10.1007/978-3-319-94709-9_55
Soni, S., & Govender, K. (2018). The Relationship between Service Quality Dimensions and Brand Eq-uity: Higher Education Students’ Perceptions. Journal of Management and Business Administra-
tion. Central Europe, 26(3), 71-87.
Sułkowski, Ł. (2016). Accountability of University: Transition of Public Higher Education. Entrepreneurial
Business and Economics Review, 4(1), 9-21. https://doi.org/10.15678/EBER.2016.040102
Tourish, D., Craig, R., & Amernic, J. (2017). A mania for assessment. The Corporatization of the Busi-
ness School: Minerva Meets the Market, 34.
Van der Wende, M.C. (2014). On mergers and missions: Implications for institutional governance and government steering. In Q. Wang, Y. Cheng, & N. Cai Liu (Eds.), Global Outreach of World-
Class Universities: How It is Affecting Higher Education Systems (pp. 137-153). Centre for World-Class Universities, Jiao Tong University, Shanghai, Sense Publishers.
Vilys, M., Jakubavičius, A., & Žemaitis, E. (2015). Public Innovation Support Index for Impact Assess-ment in the European Economic Area. Entrepreneurial Business and Economics Review, 3(4), 123-138. https://doi.org/10.15678/EBER.2015.030408
Strategic Challenges of Mergers and Acquisitions in the Higher Education… | 215
Authors
The contribution share of authors is equal and amounted to 33,3% each of them.
Łukasz Sułkowski
Professor of economics and humanities. Chair of HEI Management Department at Jagiellonian University in Cracow, at Clark University (USA) and at the University of Social Sciences. He was the main investigator of 11 research grants (including grants from the State Committee for Scien-tific Research, the National Science Centre and European Union). Holds numerous awards from the Rector of the Jagiellonian University, Clark University and University of Social Sciences. Łukasz Sułkowski specialises in management sciences. Correspondence to: Prof. Łukasz Sułkowski, Jagiellonian University, Institute of Public Affairs, ul. prof. St. Łojasiewicza 4, 30-348 Kraków, Poland, e-mail: [email protected] ORCID http://orcid.org/0000-0002-1248-2743
Robert Seliga
Assistant Professor, He obtained his master’s degree in management and marketing from the University of Social Sciences in Lodz. In 2009 he obtained his PhD in economic sciences. Robert Seliga specialises in management sciences. Correspondence to: Dr Robert Seliga, University of Social Sciences in Lodz, ul. Sienkiewicza 9, 90-113 Łódź, Poland, e-mail: [email protected] ORCID http://orcid.org/0000-0003-3306-904X
Andrzej Wozniak
Assistant Professor, He obtained his master’s degree in management and marketing from the University of Social Sciences in Lodz. In 2013 he obtained his PhD in economic sciences. An-drzej Wozniak specialises in management sciences. Correspondence to: Dr Andrzej Wozniak, University of Social Sciences in Lodz, ul. Sienkiewicza 9, 90-113 Łódź, Poland, e-mail: [email protected] ORCID http://orcid.org/0000-0002-9816-047X
Acknowledgements and Financial Disclosure
The article is financed from the project DIALOG no. 0146/2017 entitled „Doskonalenie organi-zacyjne uczelni przyszłości (UNIFUT.PL)” (University of the Future).
Copyright and License
This article is published under the terms of the Creative Commons Attribution – NoDerivs (CC BY-ND 4.0) License
http://creativecommons.org/licenses/by-nd/4.0/
Published by the Centre for Strategic and International Entrepreneurship – Krakow, Poland
The copyediting and proofreading of articles in English is financed in the framework of contract No. 845/P-DUN/2018 by the Ministry of Science and Higher Education of the Republic of Poland committed to activities aimed at science promotion.

2019, Vol. 7, No. 2 10.15678/EBER.2019.070212
Positive Deviance as a Mediator in the Relationship
Between High Performance Indicators and
Entrepreneurial Orientation
Przemysław Zbierowski
A B S T R A C T
Objective: The purpose of the article is to investigate positive deviance as a mediator
in the effect of high performance indicators on organisational entrepreneurship.
Research Design & Methods: The research was carried out on a representative and
random sample of 406 enterprises using multi-source cross-sectional design. The main
analytical technique is structural equations modelling.
Findings: The impact of high performance indicators on positive deviance is somehow
ambiguous. Some of the factors influence positive deviance in a positive way (continu-
ous improvement, openness and action orientation, management quality) and some in
a negative way (workforce quality, long-term orientation). Positive deviance has a pos-
itive effect on all three dimensions of entrepreneurial orientation. However, rather un-
expectedly, the effect is the weakest for innovativeness. The study revealed general
indirect effect of high performance factors on dimensions of entrepreneurial orienta-
tion with the mediation of positive deviance.
Implications & Recommendations: The study has implications for research and prac-
tice. It partly explains the effects of high performance indicators for organisational en-
trepreneurship. Companies that are in pursuit of higher organisational entrepreneur-
ship can use it as a good way of supporting it.
Contribution & Value Added: The study contributes to research on high performance
and entrepreneurship mainly by drawing attention to positive deviance as a mediator
in the effect of high performance factors on organisational entrepreneurship.
Article type: research article
Keywords: high performance organisation; entrepreneurial orientation; positive
deviance
JEL codes: L26
Received: 6 November 2018 Revised: 21 Match 2019 Accepted: 1 April 2019
Suggested citation:
Zbierowski, P. (2019). Positive Deviance as a Mediator in the Relationship Between High Perfor-
mance Indicators and Entrepreneurial Orientation. Entrepreneurial Business and Economics Review,
7(2), 217-233. https://doi.org/10.15678/EBER.2019.070212
218 | Przemysław Zbierowski
INTRODUCTION
High organisational performance is one of the end results that are investigated in manage-
ment science (De Waal, 2012). Scholars and practitioners for decades have tried to unlock
the mystery of extraordinary outcomes and answered the question why some organisations
are extremely successful while others fail. One of the most coherent frameworks of high
performance indicators has been presented by De Waal (2012). However, the author claims
that it only answers the question ‘what’ high performers do to be successful and not ‘how’
they do it. Therefore, the article is placed in the research stream that attempts to uncover
the mechanism underlying the activities of market leaders. The study argues that a lot of
explanation in that regard could be proposed by another dynamic research notion – posi-
tive organisational scholarship (POS). It draws attention to phenomena that are normatively
positive and extraordinarily effective. One of the most interesting of them is positive devi-
ance. Therefore, this study examines its role in organisational processes and the purpose of
the article is to investigate if positive deviance is the mediator in the relationship between
high performance indicators and organisational entrepreneurship. The reason behind the
choice to include the latter construct is twofold. That relationship was researched previ-
ously only in direct manner and organisational entrepreneurship (conceptualised as entre-
preneurial orientation) has been positively linked to high performance.
To test the mediation effect the present study uses the random and representative sam-
ple of 406 organisations and test the hypotheses using structural equations modelling. The
research is novel in its approach to putting positive deviance at the heart of high perfor-
mance processes within the organisation. The contribution that it is trying to make is three-
fold. First, it explains the way in which positive deviance has effect on organisational entre-
preneurship processes within an organisation. Second, it contributes to entrepreneurial ori-
entation literature by explaining its antecedents. Finally, it contributes to high performance
organisation literature by answering the question how high performance characteristics cre-
ate the actual organisational performance. The research was carried out within the research
project 2014/13/B/HS4/01618 funded by the National Science Centre, Poland.
LITERATURE REVIEW
High Performance Organisation
The beginning of the notion of a high performance organisation might be dated back to
the early 1980s. Perhaps the first publication that can be entirely placed within that no-
tion is the work by Peters and Waterman (1982). It describes the behaviours of most
successful American companies. Peters and Waterman (1982) discovered that they
share a couple of common phenomena: action orientation, being close to the customer,
autonomy and entrepreneurship, productivity thanks to employees, strong values,
a clear profile of activity, a simple form and low employment and reconciling the con-
tradiction between centralising and decentralising. Moreover, the key aspect that Peters
and Waterman (1982) highlight is organisational alignment.
Other significant contributions to the notion that have to be mentioned are by Collins
and Porras (1994) and Collins (2001). Collins and Porras (1994) state that there are nine
factors that distinguish leaders from other companies: continuity and change, key values
Positive Deviance as a Mediator in the Relationship Between High… | 219
and mobilising goals, stability and non-linearity, ‘cult’ culture and specific people, conse-
quence and innovations, discipline and creativity, systematic methods and experimental
approaches, meaning and achievements, maintaining the core activities and stimulation
of growth. The notion of a high performance organisation was later continued by Holbeche
(2005), Light (2005), Miller and Le Breton-Miller (2005), Lawler and Worley (2006). For
instance, Light (2005) presents the list of four main traits of successful organisations: (1)
alertness achieved by thinking in future terms, (2) agility in empowering members of the
organisation achieved by supporting communication and organising, (3) adaptation
achieved by building freedom in learning and imagination, using all available measures to
avoid lack of precision, (4) alignment achieved by leading towards vision and mission.
All of the above considerations are however not methodologically robust, they lack
a clear methodological approach. Moreover, the considerations of various authors are not
consistent in their approaches, which makes it difficult to compare the results of their re-
search (Peters & Waterman, 1982; Collins & Porras, 1994). The above limitations were taken
into consideration by De Waal (2012) who proposed a coherent framework of 35 high perfor-
mance indicators grouped within five high performance factors that are described below.
‘Continuous improvement’ includes adopting a strategy that sets the organisation
apart from others. Moreover, the organisation makes a constant effort to develop, the
organisation’s processes are continuously improved, simplified and aligned. For continu-
ous improvement, it is also important that everything that matters to performance is ex-
plicitly reported and both financial and non-financial information is reported to organisa-
tional members (De Waal, 2012, p. 34). Finally, for continuous improvement it is important
to constantly innovate, high performers continuously innovate their competencies, prod-
ucts, processes and services (De Waal, van Nierop, & Sloot, 2017).
‘Openness and action orientation’ is the factor that stresses the constant drive towards
activity and performance (De Waal, 2010, p. 87). For that reason, the whole organisation
must be performance-driven. It is based on a frequent dialogue of the management with the
employees. Organisational members spend a lot of time on communication, knowledge ex-
change and learning. Moreover, they are always involved in important processes. Openness
and action orientation also require certain style from the management (De Waal & Heijtel,
2017) – managers must allow employees to make mistakes and welcome change.
The style of leadership is more broadly described in the ‘management quality’ factor. In
high performing organisations leaders have integrity, they are role models for organisational
members (De Waal, 2012, p. 33). Moreover, they are fast both in decision making and taking
a necessary action. Leaders are very effective, but they also focus on achieving results and
coach organisational members to do the same. Leaders are also decisive with regard to non-
performers (De Waal, van Nierop, & Sloot, 2017). Leadership in high performing organisa-
tions is strong, leaders are confident and are trusted by organisational members.
Management quality is also reflected in ‘workforce quality’ (De Waal & Meingast,
2017). That is achieved by holding organisational members responsible for their results.
Management inspires organisational members to accomplish extraordinary results, organ-
isational members are trained to be resilient and flexible and the organisation has diverse
and complementary workforce (De Waal & Heijtel, 2017).
Finally, high performing organisations are oriented at being successful in the long run
(De Waal, 2012). That is achieved in several ways. High performers maintain good and

220 | Przemysław Zbierowski
long-term relationships with all stakeholders (De Waal & Meingast, 2017). They are aimed
at servicing their customers as effectively as possible. The organisation grows through
partnerships with suppliers and customers (De Waal, Mroueh, & Schiavo, 2017). Long-
term orientation is also achieved by a specific approach to human resource management.
It aims at keeping managers and employees in the organisation for a long time which
makes it a secure workplace for organisational members (De Waal & Heijtel, 2017). More-
over, new managers are in most cases promoted from within the organisation rather than
being hired from the outside (De Waal, van Nierop, & Sloot, 2017).
Entrepreneurial Orientation
The base assumption for entrepreneurial orientation scale is that entrepreneurial firms differ
from other types of firms (Khandwalla, 1977). They tend to take more risk than other types
of firms, proactively search for new business opportunities and have strong emphasis on
new product innovation (Khandwalla, 1977; Miller & Friesen, 1982; Mintzberg, 1973). Some
researchers operationalised the behaviour of entrepreneurial firms as consisting of product-
market innovation, proactiveness of decision making, and risk-taking (Lumpkin & Dess,
1996). They maintained that the level of entrepreneurship presented by a firm is the aggre-
gate total of these three sub-dimensions: ‘the extent to which top managers are inclined to
take business-related risks (the risk-taking dimension), to favour change and innovation in
order to obtain a competitive advantage for their firm (the innovative dimension), and to
compete aggressively with other firms (the proactive dimension)’ (Covin & Slevin, 1988,
p. 218) These scholars also argued that a firm that is truly entrepreneurial should exhibit high
levels of each dimension and that entrepreneurial orientation is linked to deeply stored cog-
nitive processes (Palmié, Huerzeler, Grichnik, Keupp, & Gassmann, 2019).
The most widely used operationalisation of the entrepreneurial orientation construct
comes from Covin and Slevin (1989), based on Khandwalla (1977) and Miller and Friesen
(1982). They stated that innovativeness, proactiveness and risk-taking act together creating
uni-dimensional strategic orientation, and should be aggregated together. This assumption
and the operationalisation itself proved reliable and valid in many studies, however, later
works raised concern pertaining to the dimensionality of the measure and the independ-
ence of the sub-dimensions (Dess, Lumpkin, & McGee, 1999; Lumpkin & Dess, 1996; Zahra,
1993). As opposite to the unidimensional measure as constructed by Covin and Slevin
(1989), a multi-dimensional measure reflecting each of the sub-dimensions was proposed
(e.g. Lumpkin & Dess, 1996). Proponents of the later approach argued that each sub-dimen-
sion of the entrepreneurial orientation construct uniquely contributes to the entrepreneur-
ial process. They highlight the potential of each sub-dimension to have a different impact
for key outcome variables such as firm performance (Lumpkin & Dess, 2001).
Another important issue concerning entrepreneurial orientation is its validity for re-
search in different countries. Formerly used constructs were developed originally for stud-
ies in the United States and then utilised for research in international entrepreneurship
without adequately examining their validity. Steensma, Marino, Weaver and Dickson
(2000) found that contemporary management theories may not be applicable in all inter-
national research contexts due to differences in national culture. Following this concern,
Kreiser, Marino, and Weaver (2002) employed a multi-country sample to explore the
cross-cultural validity of the entrepreneurial orientation construct. Their study provided
strong support for the cross-cultural validity of this scale. Also Luu and Ngo (2019) found
Positive Deviance as a Mediator in the Relationship Between High… | 221
the entrepreneurial construct to be applicable in various cultural contexts, especially in
transition economies. Moreover, EO has been successfully applied in various types of or-
ganisations, including public enterprises (Tremml, 2019) and also at an individual level
(Kollmann, Stöckmann, Meves, & Kensbock, 2017).
Positive Deviance and its Capacity to Mediate The Relationship Between
High Performance Indicators and Entrepreneurial Orientation
Positive deviance is strongly grounded in ‘positive’ notions of the research: positive psy-
chology and positive organisational scholarship. It has to be said that the expression ‘de-
viance’ is negatively attributed, which was highlighted by Dodge (1985). Deviations from
norms can, however, be both positive and negative (Warren, 2003). The expression ‘posi-
tive deviance’ was originally used to describe the behaviour that was different from the
standard one, contradictory to social norms, however socially desirable (Warren, 2003). In
management science, it was used in a metaphorical way, in contrast to medical sciences,
especially nutrition science, where the precise conceptualisations of positive deviance had
been developed. In a POS perspective, positive deviance is a focus on extremely affirma-
tive phenomena, significant exceptions from the norms to the positive side. It can refer to
performance (individual or organisational) and ethical and moral positivity – behaviours
that depart from norms but are perceived as positive (Spreitzer & Sonnenshein, 2004).
Positive deviance has not been yet sufficiently conceptualised. It is also used by schol-
ars in rather a loose manner (Vadera, Pratt, & Mishra, 2013), ranging from describing
departure from norms (Warren, 2003) to outcomes of certain type of leadership (Cam-
eron, 2008; Williamson, Buchard, Winner, & Winston, 2017). The critical role in concep-
tualising positive deviance is played by the work by Spreitzer and Sonenshein (2003;
2004). The explanation of positive deviance, its definition and operationalisation open
the ground for further scholarly investigations. They claim that positive deviance is linked
with meaning, prosocial motivation, self-determination, individual performance and
courage and define it as ’intentional behaviour that significantly departs from norms of
referent group in a way that is perceived as positive’ (Spreitzer & Sonenshein, 2004, 828).
Positive scholars are consistent in a view that positive deviance has to be constructed in
normative terms – to qualify the behaviour as positively deviant there has to be a group
of people that consider that behaviour as positive from the point of view of their value
system. There is, however, a problem with defining the point of reference – a social group
that will value the behaviour. That problem concerns social groups at various levels of
which some may consider the behaviour as positively deviant and other may not consider
the behaviour as deviant at all (Kim & Choi, 2018).
Spreitzer and Sonenshein (2003) also consider the contextual factors supporting pos-
itive deviance, such as transformational leadership or crisis management. Both seem to
have positive influence on positively deviant behaviour. Some scholars also draw atten-
tion to possible consequences of positive deviance, such as subjective well-being, quality
of relationship between a positive deviant and the recipient(s) of positively deviant be-
haviour, and individual and organisational performance (Cameron, 2008). Positive devi-
ance plays also a role in changing the social norms (Kim & Choi, 2018). Spreitzer and
Sonenshein (2003) state that positively deviant behaviour creates a new norm, and be-
haviours that were in line with the previous norm begin to be perceived as negatively
deviant. This way there is a shift in the norm towards the positive side. As a consequence,
222 | Przemysław Zbierowski
positive deviance has the potential to change not only the internal organisational reality
but also external world through the connections of the organisations with stakeholders.
It is also important to stress that positive deviance can be collective. Spreitzer and
Sonenshein (2003) claim that it can be contagious and transfer from one person to an-
other apart from creating new, more positive norms.
A completely different approach to positive deviance is presented by Cameron (2008)
who presents a model of positive deviance with four dimensions: positive climate, posi-
tive relations, positive communication, positive meaning. Each of the components is cre-
ated by certain activities: positive climate by fostering compassion, forgiveness and grat-
itude, positive relations by building energy networks and supporting strengths, positive
communication by obtaining self-feedback and using supportive communication and pos-
itive meaning by creating well-being, appealing to personal values, promoting extended
influence and building community. Cameron’s concept, however interesting, is rather
practical and business oriented as it lacks clarity and methodological rigour. Positive de-
viance has a wide meaning in this approach, it extends to a diversity of positive behav-
iours at work. However, what is unique in Cameron’s concept is drawing attention to the
significance of a leader in creating positive deviance.
There is some evidence that positive deviance might be linked to high performance
factors. Cameron (2008) states that the process of organising itself is aimed at reducing
deviance, therefore it is reasonable to assume that positive deviance will be supported
by those of high performance indicators that stress constant change and development
as opposite to maintaining status quo and stability. First of all, high performance factor
‘continuous improvement’ stresses the unique strategy, mission and vision and differ-
entiation from other organisations that, by proxy, is deviant. High performing organisa-
tions are even different from others in terms of their perception of the purpose of their
existence. Moreover, continuous improvement assumes introducing changes and inno-
vations that also reflect positive deviance. Furthermore, factor ‘openness and action
orientation’ promotes deviance as it stresses the permission to make mistakes and being
open to change. Therefore, it can be hypothesised:
H1: High performance indicators positively influence positive deviance.
It is also very relevant to ask a question about the impact of positive deviance on or-
ganisational entrepreneurship. Intuitively, deviance is at the heart of entrepreneurship as
it involves introducing changes, rapid changes in the way of thinking about the market and
competition (Covin & Slevin, 1988). Deviance is additionally related to all three dimensions
of entrepreneurial orientation: innovativeness, proactiveness and risk taking (Lumpkin &
Dess, 2001). Especially innovativeness benefits from positively deviant behaviours, but
also proactiveness is about doing things in a new way that is surprising for the competition
and gaining competitive advantage this way (DeGraff & Nathan-Roberts, 2012).
The relationship between positive deviance and organisational entrepreneurship
and their components has been partly researched before. DeGraff and Nathan-Roberts
(2012) claim that positive deviance is the essence of innovativeness. In addition, Nam,
Parboteeah, Cullen and Johnson (2014) state that positive deviance is the antecedents
of innovativeness. They also argue that some institutions at the country level can mod-
erate that relationship. Kibirango, Munene, Balunywa and Obbo (2017) state that the
Positive Deviance as a Mediator in the Relationship Between High… | 223
relationship between positive deviance and organisational entrepreneurship is medi-
ated by the ecosystem of novelty. Furthermore, Hartman, Wilson and Arnold (2005) link
positive deviance to entrepreneurship and prove that two other phenomena are im-
portant for the co-existence of those two variables: visionary leadership and structures
and actions that support the vision. It is consistent with the presented view that vision
is the key to apply positive deviance at the strategic level. Hartman, Wilson and Arnold
(2005) also highlight the role that is played by entrepreneurial firms using positive devi-
ance. They state that those companies have a potential to change the rules of market
competition and to rebuild the institutions in order to create new, higher ethical norms
and better market standards. All of the above allow to hypothesise:
H2: Positive deviance positively influences entrepreneurial orientation.
The direct impact of high performance indicators on entrepreneurial orientation has
been researched and proven before (Zbierowski, 2012). However, the hypothesised di-
rect effect of high performance factors on positive deviance (Cameron, 2008; De Waal,
2012) and the hypothesised direct effect of positive deviance on entrepreneurial orien-
tation (DeGraff & Nathan-Roberts, 2012; Kibirango, Munene, Balunywa, & Obbo, 2017)
lead to formulating the hypothesis on the indirect impact of high performance indicators
on organisational entrepreneurship:
H3: Positive deviance is the mediator in the relationship between high performance
indicators and entrepreneurial orientation.
MATERIAL AND METHODS
Research Design, Sample, Variables and Measures, Analytical Techniques
The research was carried out in cross-sectional design on a random and representative sam-
ple of 406 Polish enterprises in 2017 and 2018. The research was carried out using the tech-
nique of personal interview (CAPI). In each enterprise two people were surveyed: senior
manager (owner-manager or a member of the board if possible) and the direct subordinate
of that person. Sampling was random and the sample frame was the database of Polish en-
terprises employing from 50 to 1000 employees. The choice to exclude small and very large
enterprises was caused by the nature of the researched relationships. A couple of industries
were excluded from the sampling: section A (PKD – Polish Classification of Activity) – farming,
forestry, hunting and fishing, section B – mining and extraction of natural resources, section
E – water supply, sewage and waste management, recultivation, section O – public admin-
istration, national defence, obligatory social security, section Q – healthcare and social sup-
port, section T – households employing workers, households producing goods and serving
services for their own needs, section U – exterritorial organisations and groups. Organisa-
tions in those sections run specific activity that could distort the research results.
To measure high performance factors the measure created by De Waal (2012) was
used. Each of the dimensions was measured using three questions. Following Cronbach
alpha reliability coefficients were calculated: continuous improvement (0.877), openness
and action orientation (0.762), management quality (0.836), workforce quality (0.825),
long-term orientation (0.791). Positive deviance was measured using a simplified version
of the measure proposed by Spreitzer and Sonenshein (2004). Each of the dimensions was
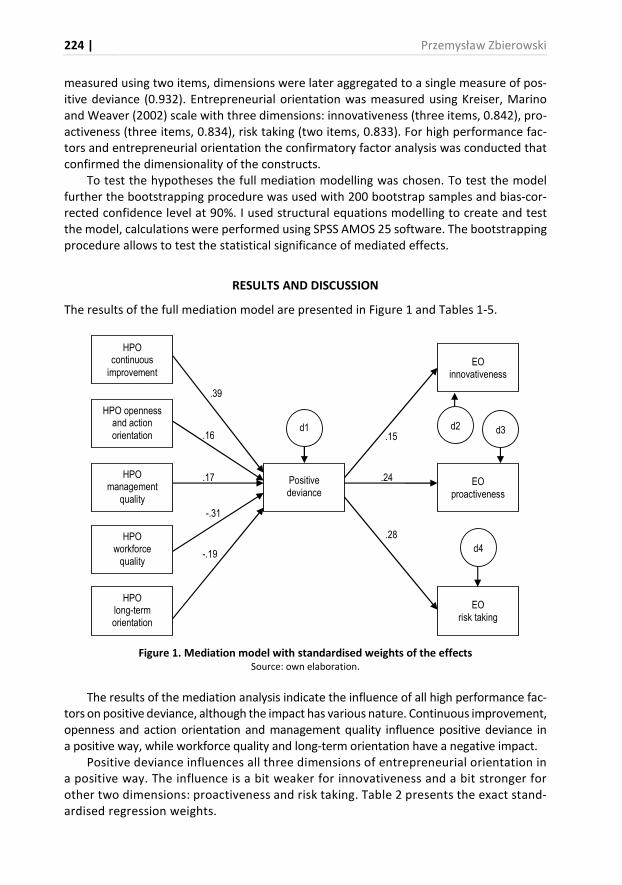
224 | Przemysław Zbierowski
measured using two items, dimensions were later aggregated to a single measure of pos-
itive deviance (0.932). Entrepreneurial orientation was measured using Kreiser, Marino
and Weaver (2002) scale with three dimensions: innovativeness (three items, 0.842), pro-
activeness (three items, 0.834), risk taking (two items, 0.833). For high performance fac-
tors and entrepreneurial orientation the confirmatory factor analysis was conducted that
confirmed the dimensionality of the constructs.
To test the hypotheses the full mediation modelling was chosen. To test the model
further the bootstrapping procedure was used with 200 bootstrap samples and bias-cor-
rected confidence level at 90%. I used structural equations modelling to create and test
the model, calculations were performed using SPSS AMOS 25 software. The bootstrapping
procedure allows to test the statistical significance of mediated effects.
RESULTS AND DISCUSSION
The results of the full mediation model are presented in Figure 1 and Tables 1-5.
Figure 1. Mediation model with standardised weights of the effects
Source: own elaboration.
The results of the mediation analysis indicate the influence of all high performance fac-
tors on positive deviance, although the impact has various nature. Continuous improvement,
openness and action orientation and management quality influence positive deviance in
a positive way, while workforce quality and long-term orientation have a negative impact.
Positive deviance influences all three dimensions of entrepreneurial orientation in
a positive way. The influence is a bit weaker for innovativeness and a bit stronger for
other two dimensions: proactiveness and risk taking. Table 2 presents the exact stand-
ardised regression weights.
HPO continuous
improvement
HPO openness and action
orientation
HPO management
quality
HPO workforce
quality
HPO long-term
orientation
Positive
deviance EO
proactiveness
EO
innovativeness
EO
risk taking
d1 d2 d3
d4
.39
.16
.17
-.31
-.19
.15
.24
.28
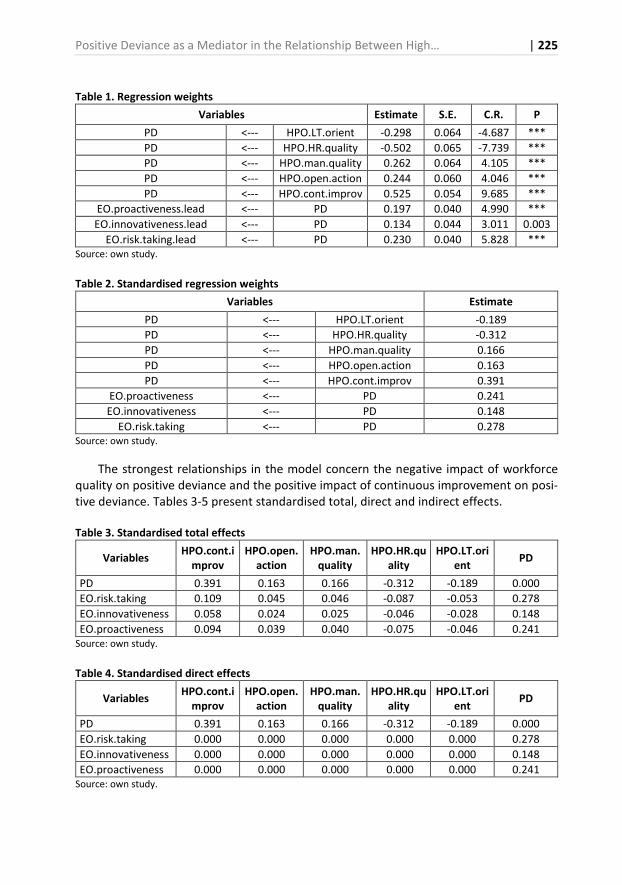
Positive Deviance as a Mediator in the Relationship Between High… | 225
Table 1. Regression weights
Variables Estimate S.E. C.R. P
PD <--- HPO.LT.orient -0.298 0.064 -4.687 ***
PD <--- HPO.HR.quality -0.502 0.065 -7.739 ***
PD <--- HPO.man.quality 0.262 0.064 4.105 ***
PD <--- HPO.open.action 0.244 0.060 4.046 ***
PD <--- HPO.cont.improv 0.525 0.054 9.685 ***
EO.proactiveness.lead <--- PD 0.197 0.040 4.990 ***
EO.innovativeness.lead <--- PD 0.134 0.044 3.011 0.003
EO.risk.taking.lead <--- PD 0.230 0.040 5.828 ***
Source: own study.
Table 2. Standardised regression weights
Variables Estimate
PD <--- HPO.LT.orient -0.189
PD <--- HPO.HR.quality -0.312
PD <--- HPO.man.quality 0.166
PD <--- HPO.open.action 0.163
PD <--- HPO.cont.improv 0.391
EO.proactiveness <--- PD 0.241
EO.innovativeness <--- PD 0.148
EO.risk.taking <--- PD 0.278
Source: own study.
The strongest relationships in the model concern the negative impact of workforce
quality on positive deviance and the positive impact of continuous improvement on posi-
tive deviance. Tables 3-5 present standardised total, direct and indirect effects.
Table 3. Standardised total effects
Variables HPO.cont.i
mprov
HPO.open.
action
HPO.man.
quality
HPO.HR.qu
ality
HPO.LT.ori
ent PD
PD 0.391 0.163 0.166 -0.312 -0.189 0.000
EO.risk.taking 0.109 0.045 0.046 -0.087 -0.053 0.278
EO.innovativeness 0.058 0.024 0.025 -0.046 -0.028 0.148
EO.proactiveness 0.094 0.039 0.040 -0.075 -0.046 0.241
Source: own study.
Table 4. Standardised direct effects
Variables HPO.cont.i
mprov
HPO.open.
action
HPO.man.
quality
HPO.HR.qu
ality
HPO.LT.ori
ent PD
PD 0.391 0.163 0.166 -0.312 -0.189 0.000
EO.risk.taking 0.000 0.000 0.000 0.000 0.000 0.278
EO.innovativeness 0.000 0.000 0.000 0.000 0.000 0.148
EO.proactiveness 0.000 0.000 0.000 0.000 0.000 0.241
Source: own study.
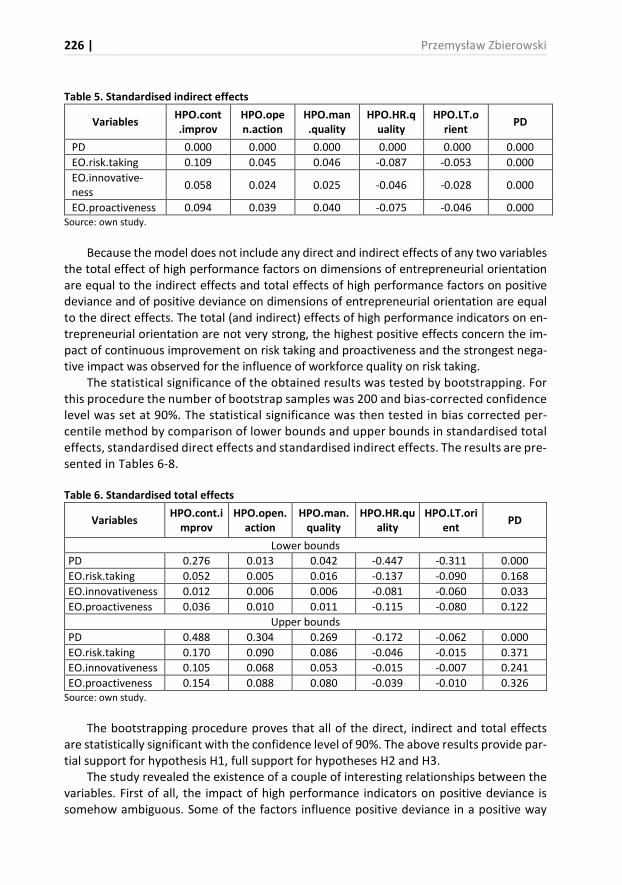
226 | Przemysław Zbierowski
Table 5. Standardised indirect effects
Variables HPO.cont
.improv
HPO.ope
n.action
HPO.man
.quality
HPO.HR.q
uality
HPO.LT.o
rient PD
PD 0.000 0.000 0.000 0.000 0.000 0.000
EO.risk.taking 0.109 0.045 0.046 -0.087 -0.053 0.000
EO.innovative-
ness 0.058 0.024 0.025 -0.046 -0.028 0.000
EO.proactiveness 0.094 0.039 0.040 -0.075 -0.046 0.000
Source: own study.
Because the model does not include any direct and indirect effects of any two variables
the total effect of high performance factors on dimensions of entrepreneurial orientation
are equal to the indirect effects and total effects of high performance factors on positive
deviance and of positive deviance on dimensions of entrepreneurial orientation are equal
to the direct effects. The total (and indirect) effects of high performance indicators on en-
trepreneurial orientation are not very strong, the highest positive effects concern the im-
pact of continuous improvement on risk taking and proactiveness and the strongest nega-
tive impact was observed for the influence of workforce quality on risk taking.
The statistical significance of the obtained results was tested by bootstrapping. For
this procedure the number of bootstrap samples was 200 and bias-corrected confidence
level was set at 90%. The statistical significance was then tested in bias corrected per-
centile method by comparison of lower bounds and upper bounds in standardised total
effects, standardised direct effects and standardised indirect effects. The results are pre-
sented in Tables 6-8.
Table 6. Standardised total effects
Variables HPO.cont.i
mprov
HPO.open.
action
HPO.man.
quality
HPO.HR.qu
ality
HPO.LT.ori
ent PD
Lower bounds
PD 0.276 0.013 0.042 -0.447 -0.311 0.000
EO.risk.taking 0.052 0.005 0.016 -0.137 -0.090 0.168
EO.innovativeness 0.012 0.006 0.006 -0.081 -0.060 0.033
EO.proactiveness 0.036 0.010 0.011 -0.115 -0.080 0.122
Upper bounds
PD 0.488 0.304 0.269 -0.172 -0.062 0.000
EO.risk.taking 0.170 0.090 0.086 -0.046 -0.015 0.371
EO.innovativeness 0.105 0.068 0.053 -0.015 -0.007 0.241
EO.proactiveness 0.154 0.088 0.080 -0.039 -0.010 0.326
Source: own study.
The bootstrapping procedure proves that all of the direct, indirect and total effects
are statistically significant with the confidence level of 90%. The above results provide par-
tial support for hypothesis H1, full support for hypotheses H2 and H3.
The study revealed the existence of a couple of interesting relationships between the
variables. First of all, the impact of high performance indicators on positive deviance is
somehow ambiguous. Some of the factors influence positive deviance in a positive way
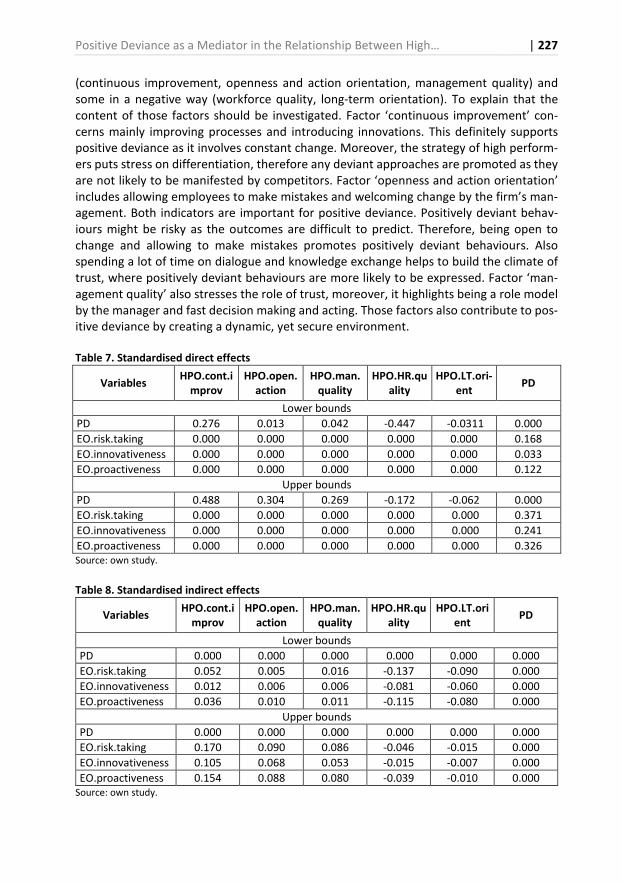
Positive Deviance as a Mediator in the Relationship Between High… | 227
(continuous improvement, openness and action orientation, management quality) and
some in a negative way (workforce quality, long-term orientation). To explain that the
content of those factors should be investigated. Factor ‘continuous improvement’ con-
cerns mainly improving processes and introducing innovations. This definitely supports
positive deviance as it involves constant change. Moreover, the strategy of high perform-
ers puts stress on differentiation, therefore any deviant approaches are promoted as they
are not likely to be manifested by competitors. Factor ‘openness and action orientation’
includes allowing employees to make mistakes and welcoming change by the firm’s man-
agement. Both indicators are important for positive deviance. Positively deviant behav-
iours might be risky as the outcomes are difficult to predict. Therefore, being open to
change and allowing to make mistakes promotes positively deviant behaviours. Also
spending a lot of time on dialogue and knowledge exchange helps to build the climate of
trust, where positively deviant behaviours are more likely to be expressed. Factor ‘man-
agement quality’ also stresses the role of trust, moreover, it highlights being a role model
by the manager and fast decision making and acting. Those factors also contribute to pos-
itive deviance by creating a dynamic, yet secure environment.
Table 7. Standardised direct effects
Variables HPO.cont.i
mprov
HPO.open.
action
HPO.man.
quality
HPO.HR.qu
ality
HPO.LT.ori-
ent PD
Lower bounds
PD 0.276 0.013 0.042 -0.447 -0.0311 0.000
EO.risk.taking 0.000 0.000 0.000 0.000 0.000 0.168
EO.innovativeness 0.000 0.000 0.000 0.000 0.000 0.033
EO.proactiveness 0.000 0.000 0.000 0.000 0.000 0.122
Upper bounds
PD 0.488 0.304 0.269 -0.172 -0.062 0.000
EO.risk.taking 0.000 0.000 0.000 0.000 0.000 0.371
EO.innovativeness 0.000 0.000 0.000 0.000 0.000 0.241
EO.proactiveness 0.000 0.000 0.000 0.000 0.000 0.326
Source: own study.
Table 8. Standardised indirect effects
Variables HPO.cont.i
mprov
HPO.open.
action
HPO.man.
quality
HPO.HR.qu
ality
HPO.LT.ori
ent PD
Lower bounds
PD 0.000 0.000 0.000 0.000 0.000 0.000
EO.risk.taking 0.052 0.005 0.016 -0.137 -0.090 0.000
EO.innovativeness 0.012 0.006 0.006 -0.081 -0.060 0.000
EO.proactiveness 0.036 0.010 0.011 -0.115 -0.080 0.000
Upper bounds
PD 0.000 0.000 0.000 0.000 0.000 0.000
EO.risk.taking 0.170 0.090 0.086 -0.046 -0.015 0.000
EO.innovativeness 0.105 0.068 0.053 -0.015 -0.007 0.000
EO.proactiveness 0.154 0.088 0.080 -0.039 -0.010 0.000
Source: own study.
228 | Przemysław Zbierowski
The negative impact of two of high performance factors on positive deviance is some-
how unexpected. However, a closer look at the content of two high performance factors
helps to uncover the meaning of the relationship. In ‘workforce quality’ the stress is put
on taking responsibility by employees and being resilient. This promotes rather a static
view of organisational activities and does not support positive deviance very well. Simi-
larly, for ‘long-term orientation’ it is critical that the organisation maintains good relation-
ships with the stakeholders and that the organisation is a secure workplace (including
keeping employees for a long time and internal selection of managers). I argue that good
relationships with the stakeholders are based on predictability that contradicts positive
deviance. Also job security is not well suited with positively deviant behaviours.
As predicted, positive deviance positively influences all three dimensions of entrepre-
neurial orientation. However, rather unexpectedly, it has the weakest influence on inno-
vativeness, which relationship is most evidenced in the literature. The impact of positive
deviance on proactiveness and risk taking is less documented but the conducted research
shows that it is stronger. Positively deviant behaviours might be surprising for competitors,
they constitute new ways of thinking not known to other companies. Therefore, proac-
tiveness may have its source in them. Positively deviant behaviours are also risky as they
may require the allocation of resources and the final result is rather difficult to predict.
Therefore, positive deviance results in higher risk.
The study revealed a general indirect effect of high performance factors on dimensions
of entrepreneurial orientation with the mediation of positive deviance. All of the mediated
relationships are statistically significant, however, all of them are rather weak. However,
some of them are worth discussing. The strongest positive impact (0.109) is by ‘continuous
improvement’ on risk taking. Similarly to positive deviance, constant improvement involves
taking decisions on the allocation of resources that are risky and new solutions are not guar-
anteed to be successful. ‘Continuous improvement’ has also a positive impact on proactive-
ness (0.094). Introducing changes leads to gaining competitive advantage not necessarily by
product innovation but also by improving, simplifying and aligning processes.
The strongest negative indirect impact of high performance factors on entrepreneurial
orientation dimensions was observed for ‘workforce quality’ and risk taking (-0.087) and pro-
activeness (-0.075). Both relationships are caused by stability and security that are promoted
in that high performance factor. They prevent both taking risk and proactive behaviours of
employees and the whole organisation. To sum up, the influence of high performance factors
on entrepreneurial orientation is mixed with the slight dominance of the positive impact.
CONCLUSIONS
The research on positive deviance is growing especially in relation to leadership and team-
work (Cameron, 2008; Williamson, Buchard, Winner, & Winston, 2017; Kim & Choi, 2018).
The present study contributes to this line of literature by pointing to the role of positive
deviance in mediating between operational strategies employed by companies and out-
comes, such as entrepreneurial orientation that leads to higher performance (Lumpkin &
Dess, 1996). The contribution is especially relevant in considering the organisation-level
effects of positive deviance, contrary to the effect at the team level, most commonly in-
vestigated recently (Williamson, Buchard, Winner, & Winston, 2017; Kim & Choi, 2018).
Positive Deviance as a Mediator in the Relationship Between High… | 229
Another contribution is the discovery of ambiguities regarding the outcomes of high per-
formance indicators. Until now, all of them have been presented as resulting in positive
consequences and higher performance (De Waal, 2012). The results contradict that view
and point to some possible negative outcomes of being driven by high performance. More-
over, it seems that the construct of high performance indicators is internally contradictory
and demands agility to be properly implemented.
The study also contributes to the stream of research on entrepreneurial orientation at
organisational level, and more broadly to research on organisational entrepreneurship, cor-
porate entrepreneurship and intrapreneurship. The results contribute especially to re-
search on cognition and behaviours related to entrepreneurial orientation (Palmié et al.,
2019) by pointing to some effects of positively deviant cognitive and behavioural processes
on entrepreneurial orientation. Furthermore, the present study is relevant for the configu-
ration of high performance features and entrepreneurial orientation in some specific types
of organisations, such as public enterprises (Tremml, 2019). The results of the study are
especially relevant for developing and transition economies (Luu & Ngo, 2019).
Finally, the study contributes to the development of research stream of high perfor-
mance organisation attributes (De Waal, 2010; De Waal, 2012; De Waal, van Nierop, &
Sloot, 2017; De Waal & Heijtel, 2017; De Waal & Meingast, 2017; De Waal, Mroueh, &
Schiavo, 2017), especially by at least partly explaining how high performance characteris-
tics drive entrepreneurial orientation, and ultimately, high performance.
The key recipients of the results of the study are CEOs and senior managers involved in
day-to-day running of businesses. In their interest is the enhancement of entrepreneurial
orientation as a tool to gain competitive advantage and high performance (Lumpkin & Dess,
1996). There are a couple of practical recommendations that can be drawn from the results
of the study. First of all, positive deviance is a good way of supporting entrepreneurial orien-
tation. Therefore, companies that are in pursuit of higher organisational entrepreneurship
can use it as a good way of supporting it. It concerns all aspects of entrepreneurial orienta-
tion, especially proactiveness. By promoting non-standard behaviours companies can there-
fore surprise customers and gain first-mover advantage. Another practical recommendation
concerns shaping the high performance factors to support both positive deviance and organ-
isational entrepreneurship. It seems that some of them should be maximised, like constant
improvement, creating extraordinary vision, mission and strategy, allowing to make mis-
takes, welcoming change, fast decision making and action and integral, strong and confident
leadership. All of the above behaviours support positive deviance and, in consequence, or-
ganisational entrepreneurship. By contrast, organisations should be careful with using some
other high performance indicators grouped in factors ‘workforce quality’ and ‘long-term ori-
entation’. It seems that those factors introduce high level of stability that can be harmful to
positively deviant behaviours. The answer to that might be the reconciliation of contradic-
tion between stability and flexibility, organisations should make the environment as friendly
to employees and at the same time encourage them to be flexible.
Apart from CEOs and senior managers the stakeholders of the present study results
are employees. Positive deviance is associated with a wide range of other positive behav-
iours, such as taking charge, creative performance, expressing voice, whistle-blowing, ex-
tra-role behaviours, prosocial behaviors, prosocial rule breaking, counter-role behaviours,
and issue selling (Vadera, Pratt, & Mishra, 2013). Therefore, promoting positive deviance
230 | Przemysław Zbierowski
by using high performance characteristics will lead not only to higher levels of entrepre-
neurial orientation but also to positive workplace actions that ultimately lead to higher
satisfaction and well-being (Weinstein & Ryan, 2010).
There are some limitations to the study. One of them is of conceptual nature: the pro-
posed model does not include any direct relationships between high performance indica-
tors and dimensions of entrepreneurial orientation. The reason for that is twofold. First,
that relationship has been researched before (Zbierowski, 2012) and second, including di-
rect relationships would blur the model by adding 15 additional effects which would make
the framework difficult to comprehend and interpret. However, as a result of that, it is im-
possible to predict if indirect relationships are stronger than direct ones and therefore if
the relationship is fully or only partially mediated. The other limitation is the sample that is
homogeneous in terms of nationality which might make the results country specific and
difficult to generalise. Therefore, future empirical investigations in that notion could take
into consideration larger, international samples and/or replicating the research. Moreover,
in spite of the question about ‘how’ high performance indicators work there is still space to
investigate possible mediators in the relationships between them and their outcomes.
REFERENCES
Cameron, K.S. (2008). Positive leadership. Strategies for extraordinary performance. San Francisco:
Berrett Koehler.
Collins, J.C., & Porras, J.I. (1994). Built to last. Successful habits of visionary companies. New York:
Harper Business.
Collins, J.C. (2001). Good to great: why some companies make the leap… and others don’t. New York:
Harper Business.
Covin, J.G., & Slevin, D.P. (1988). The influence of organisation structure on the utility of an entre-
preneurial top management style. Journal of Management Studies, 25(3), 217-234.
Covin, J.G., & Slevin, D.P. (1989) Strategic management of small firms in hostile and benign environ-
ments. Strategic Management Journal, 10(1), 75-87.
De Waal, A.A. (2010). Achieving high performance in the public sector: What needs to be done?.
Public Performance & Management Review, 34(1), 81-103.
De Waal, A.A. (2012). Characteristics of high performance organisations. Business Management and
Strategy, 3(1), 28-45.
De Waal, A., van Nierop, E., & Sloot, L. (2017). Analysing supermarket performance with the high-
performance organisation framework. International Journal Of Retail & Distribution Manage-
ment, 45(1), 57-70.
De Waal, A., & Heijtel, I. (2017). Developing a change approach for the transition to a high perfor-
mance organization. Measuring Business Excellence, 21(2), 101-116.
De Waal, A., & Meingast, A. (2017). Applying the high performance organisation framework in the
horticulture and greenhouse sector. Measuring Business Excellence, 21(2), 136-151.
De Waal, A., Mroueh, M., & Schiavo, L. (2017). Analyzing performance in the UAE manufacturing
industry using the high performance organization framework. Middle East Journal of Busi-
ness, 12(1), 3-11.
DeGraff, J., & Nathan-Roberts, D. (2012). Innovativeness as positive deviance. Identifying and oper-
ationalizing the attributes, functions and dynamics that create growth. In K.S. Cameron, J.E.
Positive Deviance as a Mediator in the Relationship Between High… | 231
Dutton & R.E. Quinn (Eds.) Positive organisational Scholarship, Foundations of a new discipline
(pp. 703-714), San Francisco: Berrett-Koahler Publishers, Inc.
Dodge, D. (1985). The over-negativized conceptualization of deviance: A programmatic exploration.
Deviant Behaviour, 6(1), 17-37.
Hartman, L., Wilson, F., & Arnold, D. (2005). Positive ethical deviance inspired by moral imagination.
Zeitschrift Fuer Wirtschafts- Und Unternehmensethik, 6(3), 343-358.
Holbeche, L. (2005). The high performance organisation. Creating dynamic stability and sustainable
success. Oxford: Elsevier/Butherworth Heinemann.
Khandwalla, P.N. (1977). The design of organisations. New York: Harcourt Brace Janovich.
Kibirango, M., Munene, J., Balunywa, W., & Obbo, J. (2017). Mediation effect of novelty ecosystems
on intrapreneurial behaviour process within an organisational dynamic environment among
Kenyan universities. Journal Of Organisational Change Management, 30(6), 957-977.
Kim, M.J., & Choi, J.N. (2018). Group identity and positive deviance in work groups. Journal of Social
Psychology, 158(6), 730-743.
Kollmann, T., Stöckmann, C., Meves, Y., & Kensbock, J. (2017). When members of entrepreneurial
teams differ: linking diversity in individual-level entrepreneurial orientation to team perfor-
mance. Small Business Economics, 48(4), 843-859.
Kreiser, P.M., Marino L., & Weaver, K.M. (2002). Assessing the psychometric properties of the en-
trepreneurial orientation scale: A multi-country analysis. „Entrepreneurship Theory and Prac-
tice, 26(4), 71-94.
Lawler, E.E. III, & Worley, C.G. (2006). Built to change. How to achieve sustained organisational ef-
fectiveness. San Francisco: Jossey-Bass.
Light, P.C. (2005). The four pillars of high performance. How robust organisations achieve extraordi-
nary results. New York: McGraw-Hill.
Lumpkin, G.T., & Dess G.G. (2001). Linking two dimensions of entrepreneurial orientation to firm
performance: The moderating role of environment and industry life cycle. Journal of Business
Venturing, 16(5), 429-451.
Lumpkin, G.T., & Dess, G.G. (1996). Clarifying the entrepreneurial orientation construct and linking
it to performance. Academy of Management Journal, 21(1), 135-172.
Luu, N., & Ngo, L.V. (2019). Entrepreneurial orientation and social ties in transitional economies.
Long Range Planning, 52(1), 103-116
Miller, D., & Friesen, P.H. (1982). Innovation in conservative and entrepreneurial firms: Two models
of strategic momentum. Strategic Management Journa, 3(1), 1-25.
Miller, D., & Le Breton-Miller, J. (2005). Managing for long run. Lessons in competitive advantage
from great family businesses. Boston: Harvard Business School Press.
Mintzberg, H. (1973). Strategy-making in three modes. California Management Review, 16(2), 44-53.
Nam, D., Parboteeah, K., Cullen, J., & Johnson, J. (2014). Cross-national differences in firms under-
taking innovation initiatives: An application of institutional anomie theory. Journal of Interna-
tional Management, 20(2), 91-106.
Palich, L.E., & Bagby, D.R. (1995). Using cognitive theory to explain entrepreneurial risk-taking: Chal-
lenging conventional wisdom. Journal of Business Venturing, 10(6), 425-438.
Palmié, M., Huerzeler, P., Grichnik, D., Keupp, M.M., & Gassmann, O. (2019). Some principles are
more equal than others: Promotion- versus prevention-focused effectuation principles and
their disparate relationships with entrepreneurial orientation. Strategic Entrepreneurship Jour-
nal, 13(1), 93-117.
232 | Przemysław Zbierowski
Peters, T.J., & Waterman, R.H. (1982). In search of excellence: Lessons from America’s best-run com-
panies. New York: Harper & Row.
Spreitzer, G., & Sonenshein, S. (2004). Toward a construct definition of positive deviance. American
Behavioural Scientist, 47(6), 828-847.
Spreitzer, G.M., & Sonenshein, S. (2003). Positive deviance and extraordinary organizing. In K.S. Cam-
eron, J.E. Dutton, & R.E. Quinn (Eds.), Positive organisational Scholarship. Foundations of a new
discipline (pp. 207-224), San Francisco: Berrett-Koahler Publishers, Inc.
Tremml, T. (2019). Linking Two Worlds? Entrepreneurial Orientation in Public Enterprises: A System-
atic Review and Research Agenda. Annals of Public & Cooperative Economics, 90(1), 25-51.
Vadera, A.K., Pratt, M.G., & Mishra, P. (2013). Constructive Deviance in Organizations: Integrating
and Moving Forward. Journal of Management, 39(5), 1221-1276.
Warren, D. (2003). Constructive and destructive deviance in organisations. Academy of Manage-
ment Review, 28(4), 622-632.
Weinstein, N., & Ryan, R.M. (2010). When Helping Helps: Autonomous Motivation for Prosocial Be-
havior and Its Influence on Well-Being for the Helper and Recipient. Journal of Personality &
Social Psychology, 98(2), 222-244.
Williamson, B., Buchard, M., Winner, W.D., & Winston, B.E. (2017). Internal Factors That Enable Pos-
itive Deviance to Occur in Leaders: A Phenomenological Description. International Leadership
Journal, 9(1), 30-55.
Zbierowski, P. (2012). Orientacja pozytywna organizacji wysokiej efektywności. Warszawa: Wolters
Kluwer.
Positive Deviance as a Mediator in the Relationship Between High… | 233
Author
Przemysław Zbierowski
Associate Professor at the Department of Human Resource Management, Faculty of Manage-
ment, University of Economics in Katowice. Research focus: entrepreneurship, psychology of en-
trepreneurship, positive organizational behaviour.
Correspondence to: Prof. UE, dr hab. Przemysław Zbierowski, University of Economics in Kato-
wice, Department of Human Resources Management, ul. Bogucicka 3a (Building B, office 412),
40-226 Katowice, Poland, e-mail: [email protected]
ORCID http://orcid.org/0000-0001-6144-1940
Acknowledgements and Financial Disclosure
The research was carried out within the research project 2014/13/B/HS4/01618 funded by the
National Science Centre, Poland.
Copyright and License
This article is published under the terms of the Creative Commons
Attribution – NoDerivs (CC BY-ND 4.0) License
http://creativecommons.org/licenses/by-nd/4.0/
Published by the Centre for Strategic and International Entrepreneurship – Krakow, Poland
The copyediting and proofreading of articles in English is financed in the framework
of contract No. 913/P-DUN/2019 by the Ministry of Science and Higher Education
of the Republic of Poland committed to activities aimed at science promotion.

2019, Vol. 7, No. 2 10.15678/EBER.2019.070213
Comparative International Entrepreneurship:
Theoretical Framework and Research Development
Agnieszka Głodowska
A B S T R A C T
Objective: The aim of the article is to recognise the scientific identity of comparative international entrepreneurship (CIE) and to review the literature on this problem in the perspective of international entrepreneurship (IE).
Research Design & Methods: The applied research method is the analysis of theoretical and empirical articles on comparative international entrepreneurship published in the years 1989-2018. On this basis, the Author formulates propositions of problems suitable for the scientific exploration in the future in the stream of comparative research.
Findings: Comparative international entrepreneurship is one of three research domains of international entrepreneurship. We can identify here a few important problems for future research, which concern institutional and cultural conditionings of entrepre-neurship, the operationalisation of entrepreneurship and the assessment of the effects of entrepreneurship for the economic growth and development.
Implications & Recommendations: It is recommended to conduct theoretical and em-pirical in-depth research into international entrepreneurship in the comparative ap-proach. It is of great cognitive importance for the development of the discipline and of utilitarian importance both for entrepreneurs – the micro level and economic decision-makers – the macro level.
Contribution & Value Added: The article fills a research gap related to the conceptual embedment of comparative international entrepreneurship and is one of the first arti-cles to review the literature concerning this problem.
Article type: conceptual article
Keywords:
comparative international entrepreneurship; international entrepre-neurship; comparative research; international comparison; entrepre-neurial internationalisation
JEL codes: L26, O57, P52
Received: 13 January 2019 Revised: 24 March 2019 Accepted: 12 April2019
Suggested citation:
Głodowska, A. (2019). Comparative International Entrepreneurship: Theoretical Framework and Research Development. Entrepreneurial Business and Economics Review, 7(2), 235-248. https://doi.org/10.15678/EBER.2019.070213
236 | Agnieszka Głodowska
INTRODUCTION
Comparative international entrepreneurship (CIE) is one of three research domains of in-ternational entrepreneurship (IE), in addition to entrepreneurial internationalisation and comparisons of entrepreneurial internationalisation. International entrepreneurship is a relatively new research area which was initiated by the end of 1980s, and its real devel-opment took place a decade later (Wach, 2018). It is understood as discovering, enacting, assessing and using opportunities beyond state borders in order to create future goods and services. International entrepreneurship includes both research into entrepreneur-ship in the sense of internationalisation and international comparisons of domestic entre-preneurship in many countries (McDougall & Oviatt, 2005). The problem most often dis-cussed in its stream is entrepreneurial internationalisation (McDougall & Oviat, 1994; Jones & Coviello, 2004; Cavusgil & Knight, 2015; Autio, 2018). International entrepreneur-ship is mainly associated with the internationalisation process. The other two research areas: comparative international entrepreneurship and comparisons of entrepreneurial internationalisation are less recognized or completely disregarded in international litera-ture. On the other hand, growing interest in domestic entrepreneurship has been visible for a few years (Coviello, McDougall, & Oviatt, 2011 Beynon, Jones, & Pickernell, 2018), which may be the contribution to the development of international research in this direc-tion. Therefore, conceptual embedment of this type of research in theory, as well as the summary of the existing output are worth considering. The validity of combining compar-ative research and international entrepreneurship was already articulated in its first defi-nitions (McDougall & Oviatt, 2000; 2003; 2005).
The aim of the article is to recognise the affinity and scientific identity of the compar-isons of international entrepreneurship and to make the systematic literature review in this area. Through the realisation of the aim thus defined it is possible to formulate prop-ositions of problems recommended for the development of comparative research into in-ternational entrepreneurship. Due to the character of the article, research methods ap-plied in the work are the analysis of the content of theoretical and empirical publications in the area of international entrepreneurship in the years 1989-2018.
The article is divided into interrelated sections. First section describes the applied re-search methods, the scope of research and sources of information. Second section pre-sents the review of literature, based on which thematic areas for further research were identified. In the third section a discussion is conducted on the indicated research areas.
MATERIAL AND METHODS
The aim of the article is the recognition of the scientific identity and conceptual embed-ment in research problems of comparative international entrepreneurship. Moreover, the article attempts to sum up the existing scientific output in comparative research on inter-national entrepreneurship. The approach provides a firm theoretical framework for future research into comparative entrepreneurship in the comparative approach, through pro-posing research problems which can be developed in future empirical studies. The main research method used in the article is a critical analysis of literature on international en-trepreneurship and its synthesis. In the first place, the scientific affinity of comparative

Comparative International Entrepreneurship: Theoretical Framework… | 237
international entrepreneurship is recognized. Then, attention is paid to the scientific iden-tity of this research area. In the next part of the article there is a literature review in the search for an answer to the question about the theoretical bases of international compar-ative research into entrepreneurship. Finally, the quantitative and qualitative analysis of the existing output on comparative international entrepreneurship is conducted.
The bibliometric analysis was conducted based on renowned, international bases of publishers: Emerald Insight, Jstor, Science Direct, Springer, Willey Online Library. In ad-dition, the abstract and citation base Scopus was used. The choice of the above sources arose from their position in international rankings of such centres as: Australian Political Studies Association (APSA), Socio – Economic and Natural Sciences of the Environment (SENSE), Centre for Resource Studies for Human Development (CERES). The adopted pe-riod for the analysis are the years 1989-2018. The adoption of this research period re-sulted from two assumptions: 1) the assumption concerns the year 1989, which is re-lated to the period of the initiation of research into international entrepreneurship. It was then when the ground-breaking publication by McDougall (1989) on domestic and international ventures was published 2) the assumption concerns the year 2018, which was chosen as the final year to present the most current state of knowledge on interna-tional entrepreneurship in the comparative approach.
LITERATURE REVIEW AND THEORY DEVELOPMENT
The Affiliation and Scientific Identity of Comparative International Entrepreneurship
Comparative international entrepreneurship belongs to the stream of research into inter-national entrepreneurship. International entrepreneurship is a relatively young research area, developed within research combining entrepreneurship and international business (Wach, 2018). According to McDougall and Oviatt (1994), Knight and Cavusgil (2004), and Perényi and Lansocz (2018), it can aspire to be called an independent scientific discipline. According to the first definitions, international entrepreneurship is understood as the de-velopment of new ventures or start-ups which from the very beginning engage in interna-tional activity and thus perceive their international activities from their inception (McDou-gall, 1989). In the course of deepening the research into international entrepreneurship, the Author reviewed her conceptual approach indicating that in addition to innovative, proactive and risky behaviours, research into international entrepreneurship includes also comparative research into entrepreneurial behaviours in numerous countries, thus em-phasizing the comparative dimension in the perspective of international entrepreneurship (McDougall & Oviatt, 2000). The final legitimisation of comparative research within inter-national entrepreneurship was made by Jones, Coviello and Tang (2011), who, based on 232 scientific publications, made the typisation of the research areas of international en-trepreneurship mentioning three research domains defined as research types:
− Type A: Entrepreneurial internationalisation.
− Type B: International comparisons of entrepreneurship (countries and cultures).
− Type C: Comparative entrepreneurial internationalisation.
According to Table 1, we can identify comparative research within international en-trepreneurship research in two ways. Firstly, we can indicate that there are two funda-mental research problems in entrepreneurship: 1) internationalisation, 2) comparative
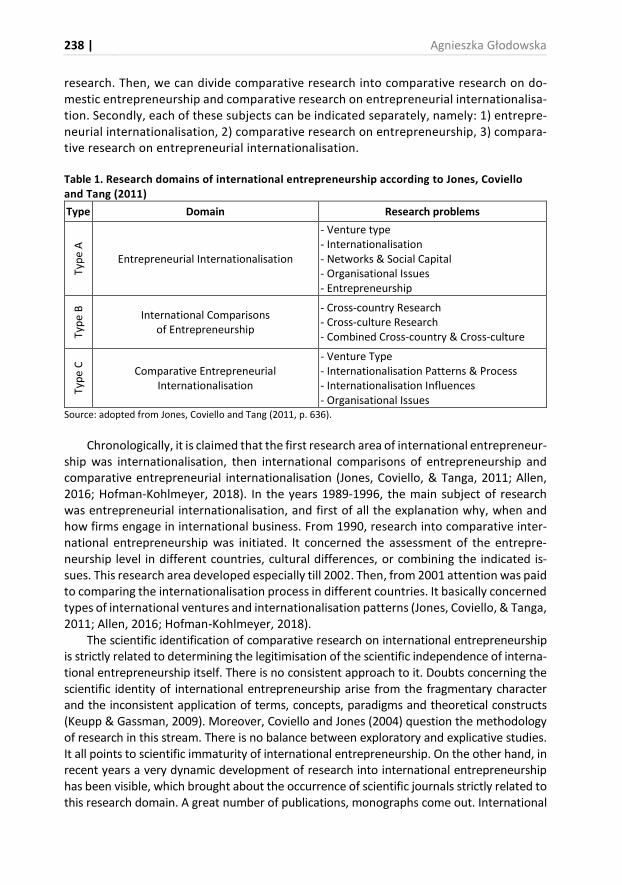
238 | Agnieszka Głodowska
research. Then, we can divide comparative research into comparative research on do-mestic entrepreneurship and comparative research on entrepreneurial internationalisa-tion. Secondly, each of these subjects can be indicated separately, namely: 1) entrepre-neurial internationalisation, 2) comparative research on entrepreneurship, 3) compara-tive research on entrepreneurial internationalisation.
Table 1. Research domains of international entrepreneurship according to Jones, Coviello
and Tang (2011)
Type Domain Research problems
Typ
e A
Entrepreneurial Internationalisation
- Venture type - Internationalisation - Networks & Social Capital - Organisational Issues - Entrepreneurship
Typ
e B
International Comparisons of Entrepreneurship
- Cross-country Research - Cross-culture Research - Combined Cross-country & Cross-culture
Typ
e C
Comparative Entrepreneurial Internationalisation
- Venture Type - Internationalisation Patterns & Process - Internationalisation Influences - Organisational Issues
Source: adopted from Jones, Coviello and Tang (2011, p. 636).
Chronologically, it is claimed that the first research area of international entrepreneur-ship was internationalisation, then international comparisons of entrepreneurship and comparative entrepreneurial internationalisation (Jones, Coviello, & Tanga, 2011; Allen, 2016; Hofman-Kohlmeyer, 2018). In the years 1989-1996, the main subject of research was entrepreneurial internationalisation, and first of all the explanation why, when and how firms engage in international business. From 1990, research into comparative inter-national entrepreneurship was initiated. It concerned the assessment of the entrepre-neurship level in different countries, cultural differences, or combining the indicated is-sues. This research area developed especially till 2002. Then, from 2001 attention was paid to comparing the internationalisation process in different countries. It basically concerned types of international ventures and internationalisation patterns (Jones, Coviello, & Tanga, 2011; Allen, 2016; Hofman-Kohlmeyer, 2018).
The scientific identification of comparative research on international entrepreneurship is strictly related to determining the legitimisation of the scientific independence of interna-tional entrepreneurship itself. There is no consistent approach to it. Doubts concerning the scientific identity of international entrepreneurship arise from the fragmentary character and the inconsistent application of terms, concepts, paradigms and theoretical constructs (Keupp & Gassman, 2009). Moreover, Coviello and Jones (2004) question the methodology of research in this stream. There is no balance between exploratory and explicative studies. It all points to scientific immaturity of international entrepreneurship. On the other hand, in recent years a very dynamic development of research into international entrepreneurship has been visible, which brought about the occurrence of scientific journals strictly related to this research domain. A great number of publications, monographs come out. International
Comparative International Entrepreneurship: Theoretical Framework… | 239
conferences are organised, and majors with its name are introduced at universities. It all indicates the delimitation between international entrepreneurship and other scientific disci-plines, thus meaning its scientific independence. There are also premises enabling to ques-tion the accusation of the lack of theoretical bases identifying international entrepreneur-ship. International entrepreneurship derives from the internationalisation theory (Kraśnicka, 2012; Wach, 2018), however, distinguishing entrepreneurial internationalisation from other internationalisation forms arises from the cognitive approach (Jones & Coviello, 2004; Etemad, 2018). Moreover, the contribution of entrepreneurship, and, to be more exact, clas-sical and neoclassical concepts of entrepreneurship discussed in economics, the Austrian school and entrepreneurial orientation is also important. Within international entrepreneur-ship entrepreneurial mechanisms arising from entrepreneurship theory are discussed at the international level, therefore the scope changes from the domestic to the international one (Daszkiewicz, 2014). Theoretical bases for international entrepreneurship create the concep-tual framework for comparative research. The institutional approach is of special significance here, and it is considered in the majority of papers on international entrepreneurship (Zuc-chella & Magniani, 2016). Moreover, the theoretical framework for comparative research into entrepreneurship set international business concepts, e.g. transaction cost theory (Brouthers & Nakos, 2004). Also, we cannot skip the resource-based theory and economic entrepreneurship concepts (van Stel, Carree, & Thurik, 2005).
From those two different perspectives of perceiving international entrepreneurship in the scientific space the need for an interdisciplinary but holistic approach to the the-oretical framework and the methodology of research into international entrepreneur-ship arises, which should be treated as a natural process of the formation of a new sci-entific discipline (Jones & Coviello, 2011).
Proposition 1: Comparative international entrepreneurship should be developed as one of research domains of international entrepreneurship, which is at the stage of for-mation as an independent scientific discipline.
Comparative International Entrepreneurship in Prior Research
The analysis of the existing output on international comparisons of entrepreneurship boils down to the search for papers according to the adopted key words ‘comparative interna-tional entrepreneurship’. In the first place, the bibliometric analysis was presented, and then the analysis of the content was made. The results of the search for publications in the bases of publishers according to the applied key words were similar: Emerald Insight (n=7,338), Jstor (n=4,784), Science Direct (n=5,252), Springer (n=14,521), Willey Online Library (n=14,803). The biggest number of publications on international comparisons of entrepre-neurship was published by Springer and Wiley Online Library. In total, in the period of the analysed almost 30 years 30 thousand publications were identified which included the key words ‘Comparative international entrepreneurship’. We should remember that the statis-tics include a great variety of scientific disciplines and research areas. Every publisher auton-omously defines the thematic scope and nomenclature, therefore, the identification is not identical: Emerald Insight (strategic management, entrepreneurship, education, human re-sources, international business, economics), Jstor (business, economics, management and organisational behaviours, developmental research), Springer (business and management,
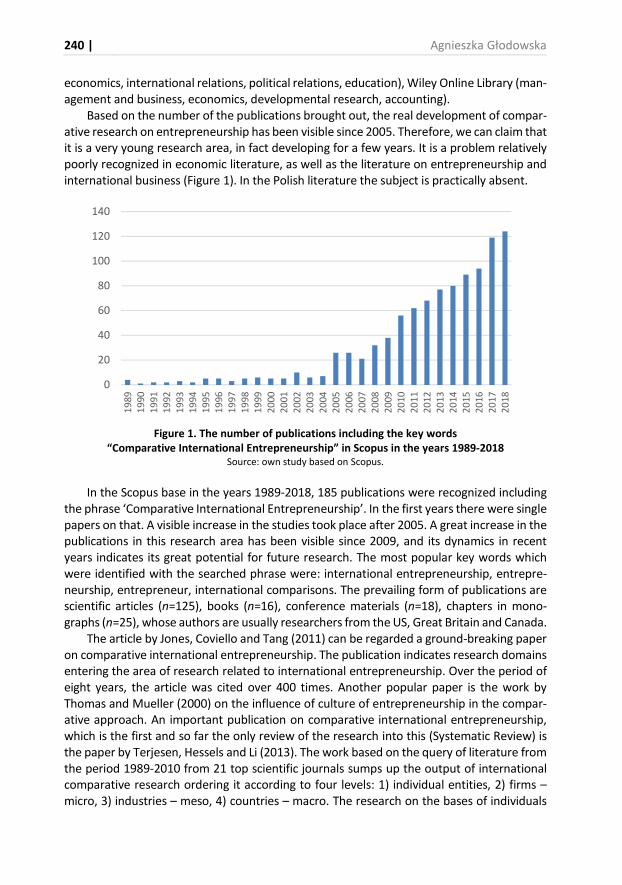
240 | Agnieszka Głodowska
economics, international relations, political relations, education), Wiley Online Library (man-agement and business, economics, developmental research, accounting).
Based on the number of the publications brought out, the real development of compar-ative research on entrepreneurship has been visible since 2005. Therefore, we can claim that it is a very young research area, in fact developing for a few years. It is a problem relatively poorly recognized in economic literature, as well as the literature on entrepreneurship and international business (Figure 1). In the Polish literature the subject is practically absent.
Figure 1. The number of publications including the key words
“Comparative International Entrepreneurship” in Scopus in the years 1989-2018
Source: own study based on Scopus.
In the Scopus base in the years 1989-2018, 185 publications were recognized including the phrase ‘Comparative International Entrepreneurship’. In the first years there were single papers on that. A visible increase in the studies took place after 2005. A great increase in the publications in this research area has been visible since 2009, and its dynamics in recent years indicates its great potential for future research. The most popular key words which were identified with the searched phrase were: international entrepreneurship, entrepre-neurship, entrepreneur, international comparisons. The prevailing form of publications are scientific articles (n=125), books (n=16), conference materials (n=18), chapters in mono-graphs (n=25), whose authors are usually researchers from the US, Great Britain and Canada.
The article by Jones, Coviello and Tang (2011) can be regarded a ground-breaking paper on comparative international entrepreneurship. The publication indicates research domains entering the area of research related to international entrepreneurship. Over the period of eight years, the article was cited over 400 times. Another popular paper is the work by Thomas and Mueller (2000) on the influence of culture of entrepreneurship in the compar-ative approach. An important publication on comparative international entrepreneurship, which is the first and so far the only review of the research into this (Systematic Review) is the paper by Terjesen, Hessels and Li (2013). The work based on the query of literature from the period 1989-2010 from 21 top scientific journals sumps up the output of international comparative research ordering it according to four levels: 1) individual entities, 2) firms – micro, 3) industries – meso, 4) countries – macro. The research on the bases of individuals
0
20
40
60
80
100
120
140
19
891
990
19
911
992
19
931
994
19
951
996
19
971
998
19
992
000
20
012
002
20
032
004
20
052
006
20
072
008
20
092
010
20
112
012
20
132
014
20
152
016
20
172
018

Comparative International Entrepreneurship: Theoretical Framework… | 241
concerns the characteristics and definition of the properties of individuals – entrepreneurs: gender, education, social capital, psychological attributes, entrepreneurial orientation (Ter-jesen, Hessels, & Li, 2013). Studies concerning firms are most numerous and concern inter-nationalisation, comparisons of firms, business models, entrepreneurial orientation, re-sources and effects of entrepreneurship on the micro level (Terjesen, Hessels, & Li, 2013). Comparative research on industries is, on the other hand, the lowest percentage of papers. It concerns small and medium-sized enterprises, enterprises of increased risk, the informal sector (Terjesen, Hessels, & Li, 2013). One-fourth of comparative research on entrepreneur-ship concerns the macro-level. These are papers discussing the subject of the determinants of domestic entrepreneurship and its effects. Entrepreneurship is perceived as a stimulant of growth and economic development (Terjesen, Hessels, & Li, 2013).
Figure 2. Most frequently cited publications on comparative
international entrepreneurship in Scopus in the years 1989-2018
Source: own study based on Scopus.
The analysis of the content of publications on comparative international entrepreneur-ship allows to notice some issues which seem to be particularly important in the area of comparative research on international entrepreneurship. In the initial years of the interest in this domain, the problems of culture and institutional conditionings of entrepreneurship in the comparative approach were discussed. Based on the institutional theory, the creation and formation of entrepreneurship were analysed. The subjects are still being developed (Richet, 1993; Chang & Kozul-Wright, 1994; Kshetri, 2009). Nowadays, research is under-taken into institutional, financial, human or logistical infrastructure in the context of entre-preneurship and mutual relationships between these categories (Manolova, Brush, Edel-man, Robb, & Welter, 2017). It is a very important issue to understand entrepreneurial ca-pabilities, recognition and use of opportunities of different economies and societies. The re-
415 403
295258
223186 169
11793 91
050
100150200250300350400450
242 | Agnieszka Głodowska
search points to the feedback-type relation between the institutional environment and en-trepreneurship. Particularly important is research into the influence of institutional condi-tionings on small and medium-sized enterprises (Acs, Morck, & Yeung, 2001; Stephan & Uh-laner, 2010). Similar research was conducted from the point of view of cultural conditionings (Holt, 1997; Tiessen, 1997; Thomas, Mueller, & Jaeger, 2002; Lombardi, Lardo, Cuozzo, & Treguattrini, 2017). The influence of different cultures on the level of entrepreneurship and various entrepreneurial qualities were verified (Thomas & Mueller, 2000).
Proposition 2: The papers realised within international comparative research on entre-preneurship showed the co-dependence of institutional and cultural conditionings and entrepreneurship in different countries.
An important problem recognized in international comparative research is the domes-tic entrepreneurship measurement. There are more and more publications on the meas-urement of domestic entrepreneurship and its international comparisons, in which au-thors try to create authorial entrepreneurship measures on the macro-level. So far, the most popular measure created within works by the representatives of Bobson College and London Business School is Global Entrepreneurship Monitor (GEM). The report includes a great variety of aspects related to entrepreneurship in the international dimension: measuring entrepreneurial activity in countries, identifying factors determining the entre-preneurship level of economies (Àlvarez, Urbano, & Amorós 2014). Another measure ap-plied to determine entrepreneurship at a country level is the proposition of the World Bank – the World Bank Group Entrepreneurship Survey (WBGES). In the research the benchmark of the economic activity in the group of developed and developing countries is sought in order to build a database on the typology and characteristics of international business activity based on data obtained directly from institutions registering business ac-tivity in different countries (Ács, Desai, & Klapper, 2008). An alternative approach to the measurement of the entrepreneurship of countries was proposed within the collaboration of the European Statistical Office (Eurostat) with the Organization for Economic Coopera-tion and Development (OECD) in the Entrepreneurship Indicator Programme (EIP) pro-gramme. As a result, a database was developed to conduct comparative research on en-trepreneurship in three dimensions (Eurostat, 2018): 1) conditionings of entrepreneur-ship, 2) results of entrepreneurship, 3) effects of entrepreneurship. Attempts to opera-tionalise domestic entrepreneurship for the needs of international comparative research can be also found in works by van Stel (2006), Ács, Szerb and Autio (2014).
Proposition 3: One of the key research problems recognized within comparative inter-national entrepreneurship is the operationalisation of domestic entrepreneurship – that is, at the macro-level.
Conducting research into the operationalisation of a country’s entrepreneurship for the needs of international comparisons has a cognitive and utilitarian value. It can be a starting point to carry out in-depth research into changes, development, dynamics and causative factors of entrepreneurship of different countries, the identification of dispro-portions between economies and the sources of their occurrence. It can be also used to assess the effects of entrepreneurship of different countries. It concerns the recognition of the significance of entrepreneurship for economic growth, development and human welfare. Not only in the economic but also in the behavioural sense entrepreneurship is
Comparative International Entrepreneurship: Theoretical Framework… | 243
related to the search for and implementation of new forms of development and a change in the social status by active individuals, societies and nations (Klonowska – Matynia & Palinkiewicz, 2013). Focus on the effects of entrepreneurship which are positive for econ-omy, and the purposefulness of entrepreneurial activities can be seen in works of interna-tional institutions and organisations (OECD, 2008; 2017; European Commission, 2018). In the majority of studies, the positive impact of entrepreneurship on economic growth is confirmed (Audretsch, 2007; Baumol & Strom, 2007; Ács, Audretsch, Braunerhjelm, & Carlsson, 2009; Olaison & Sorensen 2014). According to the research by Sternberg and Wnnekers (2005), the impact of entrepreneurship on economic development is evident and depends on the level of development of a given economy. It is also confirmed in other papers (Valliere & Peterson, 2009; Ferreira, Fayolle, Fernandes, & Raposo, 2017).
Proposition 4: Comparative international entrepreneurship in the context of the assess-ment of the effects of entrepreneurship has shown the relationship between the level of entrepreneurship of a country and its economic growth.
DISCUSSION
Based on the analysis of the content of papers created so far on comparative international entrepreneurship, we can claim that it is a very prospective research area with high potential for future research. The problem is not recognized properly and there are a lot of opportu-nities to conduct research in the stream of international entrepreneurship. Recently, a lot of pressure is put on the need to develop research concerning the Central and Eastern Europe region (Andersson, Evers, & Kuivalainen, 2014; Terjesen, Hessels, & Li, 2013; Perényi & Losoncz, 2018). In fact, there are papers undertaking the problem of the influence of the political transformation in central and Eastern Europe on entrepreneurship (Richet, 1993) or on forms of business activity in post-socialist economies (Kshetri, 2009), but conducting re-search on entrepreneurial processes taking place in that region is still desirable.
There is a very clear space of scientific exploration in the area of international com-parisons of cultural conditionings of entrepreneurship. Holt (2017) attempted to com-pare two contrasting societies in terms of culture in order to verify the impact of Chi-nese and American cultures on entrepreneurship. The research findings proved obvious differences but also some similarities of the studied societies. According to the author, cultural differences result from Confucian influences in China. On the other hand, sim-ilarities arise from the progressing globalisation. Similar findings are presented by Tiessen (1997) on the example of American and Japanese societies. Verification of the impact of culture on entrepreneurship may concern various areas. At present, the prob-lem is still very important, especially comparative research may focus on associating culture with entrepreneurial processes, immigrant entrepreneurship and education for entrepreneurship (Lombardi, Lardo, Cuozzo, & Treguattrini, 2017).
It is necessary to search further for an appropriate measure of a country’s entrepre-neurship for international comparisons. Empirical research often boils down to the selec-tion of one representative entrepreneurship indicator, such as: the number of newly-estab-lished firms, the saturation with firms, survival of businesses, firms’ growth dynamics, the percentage of the self-employed (Valdez & Richardson, 2013; Canever & Menezes, 2017; Dvouletý, 2017). There is a need to build a measure which would consider all dimensions of
244 | Agnieszka Głodowska
entrepreneurship. Among the presented aggregated measures, the most popular one is the GEM approach. It is based on institutional bases of entrepreneurship, which does not show the multidimensionality of the category which a country’s entrepreneurship is. Institutions and the institutional environment are very important for entrepreneurship, but we cannot also skip the behavioural, economic, sociological and psychological approaches. GEM Mon-itor is too focused on the aspect of creating new businesses, leaving aside the assessment of the permanence of ventures (Audritsch, 2003; Hindle, 2010). In spite of those limitations, GEM indices have a substantial informative value. Research in this direction is worth con-tinuing, which is necessary for the intensification of research into entrepreneurship in rela-tion to other areas of socio-economic life. It is particularly important to recognize the im-pact of entrepreneurship on the condition of economy and inducing its economic growth. Declaratively, the European Commission (2018) indicates that economic growth in Europe and employment depend on the development of enterprises. Entrepreneurship stands for new firms, new markets and new opportunities. Encouragement for entrepreneurship, es-tablishing firms, promotion of small and medium-sized enterprises are the key objectives of the EU activities. On the other hand, the World Bank (2013) regards innovations and entrepreneurship as the fundamental factors of a competitive and dynamic economy. Countries and regions characterised by innovativeness and entrepreneurship are charac-terised by higher productivity, which, as a result, leads to an increase in employment and then to economic growth and welfare of citizens. However, empirical research does not provide uniform results in this area, which may be an impulse for conducting in-depth re-search in this issue (Sternberg & Wennekers, 2005; Valliere & Peterson, 2009; van Stel, Thu-rik, Stam, & Hartog, 2010; Ferreira, Fayolle, Fernandes, & Raposo, 2017).
Other research problems which may be recommended for further research in the area of international entrepreneurship in the comparative approach are: entrepreneur-ship of women, entrepreneurial orientation, social entrepreneurship and comparison of entrepreneurial internationalisation.
CONCLUSIONS
International comparisons of entrepreneurship are one of three research domains of in-ternational entrepreneurship. It is a relatively new research area, which has been devel-oping since 1980s. Comparative research within international entrepreneurship is not, however, popularised in empirical research, and entrepreneurship itself is first of all asso-ciated with internationalisation. Comparative international entrepreneurship is part of the research into international entrepreneurship, which arises from its theoretical bases. For a few years, growing interest in international entrepreneurship in the comparative ap-proach has been observed, which can be understood as a kind of a future, emerging trend of research. Based on the analysis of the content of existing papers we can claim that this direction of research will be developed and has a lot of potential. We can identify a few important problems for empirical verification, which concern institutional and cultural conditionings of entrepreneurship, operationalisation of entrepreneurship, and the as-sessment of the effects of entrepreneurship for economic growth and development.
This article can be treated as an initial study on the comparative research in inter-national entrepreneurship. However, it has some limitations, which can be seen at the same time as recommendations for future research. Undoubtedly, there is a need to
Comparative International Entrepreneurship: Theoretical Framework… | 245
conduct in-depth theoretical and empirical research in this stream. An important limita-tion in this article is the lack of application of more advanced research tools for the anal-ysis of the content. It is recommended to apply appropriate software dedicated strictly to bibliometric analysis that allows for in-depth analysis. On this basis the bibliographic relations recognition would be possible. In addition, it is worth to take into account a larger range of available databases. The limitation of the study may also seem to be the recognition of only research trends without indicating the links between them, which should definitely be examined in the future.
Theoretical studies are desired, which would verify the scientific identity of interna-tional entrepreneurship, thus, international comparative research into entrepreneurship. What also seems to be important are systematic papers of literature review. To date, there is practically only one such a paper on comparative international entrepreneurship. Also empirical research should be developed. There are a lot of possibilities to conduct com-parative research of various dimensions, types and conditionings of entrepreneurship in the international scale. Recommended research contributes to the development of the scientific discipline and can be used in practice both at the micro-level by entrepreneurs and managers, and at the macro-level, by economic and political decision makers.
REFERENCES
Ács, Z.J., Morck, R.K., & Yeung, B.(2001). Entrepreneurship, globalization, and public policy. Journal of International Management, 7(3), 235-251.
Ács, Z.J., Desai, S., & Klapper, L.F. (2008) What does ‘entrepreneurship’ data really show? Small Business Economics, 31(3), 265-281.
Ács, Z.J., Audretsch, D.B., Braunerhjelm, P., & Carlsson, B. (2009). The knowledge spillover theory of entrepreneurship. Small Business Economics, 32(1), 15-30.
Ács, Z.J., Autio, E., & Szerb, L. (2014). National Systems of Entrepreneurship: Measurement issues and policy implications, Research Policy, 43(3), 476-494.
Allen, I. (2016). International Entrepreneurship Theory: Past, Present and Way Forward. Entrepreneur-ial Business and Economics Review, 4(4), 93-203. https://doi.org/10.15678/EBER.2016.040406
Álvarez, C., Amorós, J.E., & Urbano, D. (2014). Regulations and entrepreneurship: Evidence from developed and Developing countries. Innovar, 24, Edición Especial, 81-89.
Andersson, S., Evers, N., & Kuivalainen, O. (2014). International new ventures: rapid internationali-zation across different industry contexts. European Business Review, 26(5), 390-405.
Audretsch, Z.J. (2003). Entrepreneurship A survey of the literature. Enterprise Papers, 14. Re-trieved from: http://ec.europa.eu/DocsRoom/documents/2977/attachments/1/transla-tions/en/renditions/pdf on January 24, 2019
Audretsch, D.B. (2007). Entrepreneurship capital and economic growth. Oxford Review of Eco-nomic Policy, 23(1), 63-78. https://doi.org/10.1093/oxrep/grm001
Baumol, W.J., & Strom, R.J. (2007). Entrepreneurship and economic growth. Strategic Entrepre-neurship Journal, 1, 233-237.
Autio, E. (2018). Creative Tension: The Significance of Ben Oviatt’s and Patricia McDougall’s Article ‘Toward a Theory of International New Ventures’. In R. Reuber (Ed.), International Entrepreneurship. The Pur-suit of Opportunities across National Borders (pp. 59-81). Gewerbestrasse: Palgrave Macillan.

246 | Agnieszka Głodowska
Beynon, M.M., Jones, P., & Pickernell, D. (2018). Country-based comparison analysis using fsQCA inves-tigating entrepreneurial attitudes and activity. Journal of Business Research, 69(4), 1271-1276.
Brouthers, K.D., & Nakos, G. (2004). SME entry mode choice and performance: A transaction cost perspective. Entrepreneurship Theory & Practice, 28, 229-247.
Canever, G., & Menezes, M. (2017). New firm formation, spatial trends and economic performance: ev-idences from Rio Grande do Sul, Brazil. Revista Brasileira De Economia De Empresesas, 17(1), 39-53.
Chang, H.J., & Kozul-Wright, R. (1994). Organising Development: Comparing the National Systems of En-trepreneurship in Sweden and South Korea. The Journal of Development Studies, 30(4), 859-891.
Coviello, N.E., McDougall, P.P., & Oviatt, B.M. (2011). The emergence, advance and future of inter-national entrepreneurship research – An introduction to the special forum. Journal of Business Venturing, 26(6), 625-631.
Daszkiewicz, N. (2014). Przedsiębiorczość międzynarodowa jako nowy obszar badań w teorii internacjo-nalizacji. In A. Budnikowski & A. Kuźniar (Eds.), Nowe Procesy w Gospodarcze Światowej: Wnioski dla Polski (pp. 207-220). Warszawa: Oficyna Wydawnicza Szkoły Głównej Handlowej w Warszawie.
Dvouletý O. (2017). Determinants of Nordic entrepreneurship. Journal of Small Business and Enter-prise Development, 24(1), 12-33.
Etemad, H. (2018). The essence of entrepreneurial internationalization: Managing the dynamic com-plexity of interactive relationship and reflective adaptations. Journal o International Entre-pre-neurship, 16(3), 325-337. https://doi.org/10.1007/s10843-018-0237-4
European Commission (2018). The Entrepreneurship 2020 Action Plan (Analytical Report). Retrieved from https://ec.europa.eu/growth/smes/promoting-entrepreneurship/action-plan_en on February 10, 2019.
Eurostat (2018). Entrepreneurship indicators. Retrieved from https://ec.europa.eu/euro-stat/web/structural-busoniness-statistics/entrepreneurship/indicators on February 10, 2019.
Ferreira, J.J., Fayolle, A., Fernandes, C., & Raposo, M. (2017). Effects of Schumpeterian and Kirznerian entrepreneurship on economic growth: panel data evidence. Entrepreneurship & Regional De-velopment, 29(1-2), 27-50.
Hindle, K. (2010). How community context affects entrepreneurial process: A diagnostic framework. Entrepreneurship & Regional Development, 9, 599-647.
Hofman-Kohlmeyer, M. (2018). Przedsiębiorczość międzynarodowa w świetle badań naukowych – przegląd literatury. Studia Ekonomiczne, 352, 100-110.
Holt, D.H. (1997). A comparative study of values among Chinese and U.S. entrepreneurs: Pragmatic convergence between contrasting cultures. Journal of Business Venturing, 12(6), 483-505.
Jones, M.V., & Coviello, N.E. (2004). Methodological issues in international entrepreneurship re-search. Journal of Business Venturing, 19, 485-508.
Keupp, M.M., & Gassman, O. (2009). The Past and the Future of International Entrepreneurship: A Review and Suggestions for Developing the Field. Journal of Management, 35(3), 600-633.
Klonowska-Matynia, M., & Palinkiewicz, J. (2013). Przedsiębiorczość w teorii ekonomicznej. Zeszyty Naukowe Wydziału Nauk Ekonomicznych Politechniki Koszalińskiej, 17, 29-40.
Knight, G.A., & Cavusgil, S.T. (2004). Innovation, organizational capabilities, and the born global firm. Journal of International Business Studies, 35, 124-141, https://doi.org/10.1057/pal-grave.jibs.8400071
Kraśnicka, T. (2012). Przedsiębiorczość międzynarodowa jako odrębny obszar badań. In T. Kraśnicka (Ed.), Przedsiębiorczość międzynarodowa. Aspekty teoretyczne i praktyczne (pp. 11-19). Kato-wice: Wydawnictwo AE w Katowicach.
Comparative International Entrepreneurship: Theoretical Framework… | 247
Kshetri, N. (2009). Entrepreneurship in post-socialist economies: A typology and institutional con-texts for market entrepreneurship. Journal of International Entrepreneurship, 7(3), 236-259.
Lombardi, R., Lardo, A., Cuozzo, B., & Trequattrini, R. (2017). Emerging trends in entrepreneurial universities within Mediterranean regions: An international comparison. EuroMed Journal of Business, 12(2), 130-145.
Manolova, T.S., Brush, C.G., Edelman, L.F., Robb, A., & Welter, F. (2017). Entrepreneurial ecosys-tems and growth of women’s entrepreneurship: A comparative analysis. Cheltenham: Ed-ward Elgar Publishing Ltd.
McDougall, P.P. (1989). International versus domestic entrepreneurship: New venture strategic be-havior and industry structure. Journal of Business Venturing, 4, 387-400.
McDougall, P.P., & Oviatt, B.M. (1994). Toward a theory of international new ventures. Journal of International Business Studies, 25(1), 45-64.
McDougall, P.P., & Oviatt, B.M. (2000). International Entrepreneurship: The Intersection of Two Re-search Paths. The Academy of Management Journal, 43(5), 902-906.
McDougall, P.P., & Oviatt, B.M. (2003). Some Fundamental Issues in International Entrepreneur-ship. Entrepreneurship Theory & Practice, 8, 1-27. https://doi=10.1.1.210.861&rep=rep1&type=pdf
McDougall, P.P., & Oviatt, B.M. (2005). Defining international entrepreneurship and modeling the Speed of Internationalization. Entrepreneurship Theory and Practice, 29(5), 537-554. https://doi.org/10.1111/j.1540-6520.2005.00097.x
OECD. (2008). Measuring Entrepreneurship: A Digest of Indicators. Paris: OECD Publishing.
OECD. (2017). Entrepreneurship at Glance 2017. Paris: OECD Publishing.
Olaison, L., & Sørensen, B.M. (2014). The object of entrepreneurship: failure, fiasco, fraud. Interna-tional Journal of Entrepreneurial Behaviour & Research, 20(2), 193-211.
Perényi, A., & Losoncz, M. (2018). A Systematic Review of International Entrepreneurship Special Issue Articles. Sustainability, 10(10), 3476, 1-26. https://doi:10.3390/su10103476
Richet, X. (1993). Transition Towards the Market in Eastern Europe; Privatisation, Industrial Restructur-ing and Entrepreneurship. Communist Economies and Economic Transformation, 5(2), 229-243.
Stephan, U., & Uhlaner, L.M. (2010). Performance – based vs socially supportive culture: A cross – national study of descriptive norms and entrepreneurship. Journal of International Business Studies, 41(8), 1347-1364.
Sternberg, R., & Wennekers, S. (2005). Determinants and Effects of New Business Creation Using Global Entrepreneurship Monitor Data. Small Business Economics, 24, 193-203. http://dx.doi.org/10.1007/s11187-005-1974-z
Terjesen, S., Hessels, J., & Li, D. (2013). Comparative international entrepreneurship: A review and re-search agenda. Journal of Management, 42, 299-234. http://doi.org/10.1177/0149206313486259
Thomas, A.S., & Mueller, S.L. (2000). A case for comparative entrepreneurship: Assessing the rele-vance of culture. Journal of International Business Studies, 31(2), 287-301.
Thomas, A.S., Mueller, S.L., & Jaeger, A.M. (2002). National entrepreneurial potential: The role of culture, economic development, and political history. Advances in Comparative International Management, 14, 221-257.
Tiessen, J.H. (1997). Individualism, collectivism, and entrepreneurship: A framework for interna-tional comparative research. Journal of Business Venturing, 12(5), 367-384.
Valdez, M., & Richardson, E.J. (2013). Institutional Determinants of Macro-Level Entrepreneurship. Entrepreneurship Theory and Practice, 37(5), 1149-1175.
248 | Agnieszka Głodowska
Valliere, D., & Peterson, R. (2009). Entrepreneurship and economic growth: Evidence from emerging and developed countries. Entrepreneurship & Regional Development, 21(5-6), 459-480.
Van Stel, A., Carree, M., & Thurik, A.R. (2005). The effect of entrepreneurial activity on national eco-nomic growth. Small Business Economics, 24(3), 311-321.
Van Stel, A. (2006). Empirical Analysis of Entrepreneurship and Economic Growth. Berlin: Springer.
Van Stel, A., Thurik, R., Stam, & Hartog, C. (2010). Ambitious entrepreneurship, high growth firms and macroeconomic growth (EIM Research Reports). Retrieved from http://citeseerx.ist.psu.edu/view-doc/download?doi=10.1.1.502.6357&rep=rep1&type=pdf on January 10, 2019.
Wach, K. (2018). Theoretical foundations for international entrepreneurship. In K. Wach (Ed.), Internationalization of Firms in the Perspective of International Entrepreneurship (pp. 63-96). Warszawa: PWN.
World Bank. (2013). World Bank Group Support for Innovation and Entrepreneurship (An Independ-ent Evaluation Report). Retrieved from http://ieg.worldbankgroup.org/sites/de-fault/files/Data/Evaluation/files/innovation_eval.pdf on November 2, 2019.
Zucchella, A., & Magniani, G. (2016). Entrepreneurship. Theoretical Foundations and Practices. 2nd edition. New York: Palgrave Macmillan.
Author
Agnieszka Głodowska
Assistant Professor in the Department of International Trade, PhD in economics, author of the publications on international business and international entrepreneurship, member of editorial boards of ‘Entrepreneurial Business and Economics Review’ (Scopus, ESCI WoS), ‘International Journal of Managerial Studies and Research’ (USA), ‘International Entrepreneurship’ (Poland). Re-search interests: international entrepreneurship, finance and risk in international business. Correspondence to: Dr Agnieszka Głodowska, Cracow University of Economics, ul. Rakowicka 27, 31-510 Kraków, Poland, e-mail: [email protected] ORCID http://orcid.org/0000-0002-5317-8625
Acknowledgements and Financial Disclosure
This publication is financed from the funds allocated to the Faculty of Economics and International Relations of the Cracow University of Economics in the framework of grants for maintaining re-search potential.
Copyright and License
This article is published under the terms of the Creative Commons Attribution – NoDerivs (CC BY-ND 4.0) License
http://creativecommons.org/licenses/by-nd/4.0/
Published by the Centre for Strategic and International Entrepreneurship – Krakow, Poland
The copyediting and proofreading of articles in English is financed in the framework of contract No. 913/P-DUN/2019 by the Ministry of Science and Higher Education of the Republic of Poland committed to activities aimed at science promotion.
2019, Vol. 7, No. 2 10.15678/EBER.2019.070214
The Similarity of the Demand Structure
as a Determinant of the Commodity Structure
of Bilateral Trade in the European Union Countries
Marek Maciejewski
A B S T R A C T
Objective: The aim of the article is to determine the influence of the process of con-vergence of the demand structure in the European Union countries on the share in the export structure of groups of products distinguished due to the share of the technological factor.
Research Design & Methods: A dynamic analysis of the similarity of the demand struc-ture of the EU countries was made in the article. The interdependence between the con-vergence of the demand structure and the reduction of distance in the economic devel-opment level was presented. An analysis of the commodity structure of bilateral trade of the EU countries was conducted and the gravity model of foreign trade was used.
Findings: Similarity in the demand structure of trade partners influences the commod-ity structure of trade between them. The effects of this influence are different for trade relations of countries which are on a different level of economic development.
Implications & Recommendations: Conclusions drawn from the article are useful for the economic policy and support for exports. The research is worth continuing and completing with methods enabling the reference to more complex dependencies influ-encing the process of the demand structure convergence.
Contribution & Value Added: The article fills the research gap with regard to determin-ing the influence of the alignment of the level of economic development on the con-vergence of the demand structure and referring this process to changes in the com-modity structure of exports.
Article type: research article
Keywords: commodity structure; demand structure; exports; gravity model; in-ternational trade
JEL codes: E21, F14, F43
Received: 11 January 2019 Revised: 13 April 2019 Accepted: 15 April 2019
Suggested citation:
Maciejewski, M. (2019). The Similarity of the Demand Structure as a Determinant of the Commodity Structure of Bilateral Trade in the European Union Countries. Entrepreneurial Business and Econom-
ics Review, 7(2), 249-262. https://doi.org/10.15678/EBER.2019.070214
250 | Marek Maciejewski
INTRODUCTION
Among international trade theories there are those which focus on the determination of the significance of demand and supply for the exchange with abroad. The significance of differences in equipping countries with factors of production is emphasized by the Heckscher-Ohlin theory. From it we can conclude that the development of bilateral trade will take place in the first place between countries with a different level of economic de-velopment, which translates into the resources of production factors being at the disposal. On the other hand, Linder’s preference similarity theory (1961) resigns from associating trade with equipping countries with factors of production, as it marginalises the supply side to the benefit of the demand approach, according to which trade cooperation will develop mainly between countries with a similar demand structure, thus, on a similar level of economic development. A country exports mainly such goods for which there is already demand on the internal market. It guarantees undertaking profitable production and con-ducting effective competition with producers of identical or similar goods on foreign mar-kets. It allows to increase the production scale based on the experience gained so far.
In spite of the fact that Heckscher-Ohlin theory and Linder’s theory were created sev-eral dozen years ago, authors still write new papers (Lai et al., 2016; Görkemli et al., 2018) which attempt to diagnose the export development path, opposing these theories. In nu-merous works Linder’s theory is empirically tested (McPherson et al., 2001; Dhakal et al., 2011; Viciu et al., 2016), referring it, however, only to the difference in the level of GDP per capita and skipping the issues of the difference in the trade commodity structure. I decided to fill this research gap, completing the deliberations with a real analysis of the process of convergence of the demand structure. The aim of the article is to determine the impact of this process on the share in the export structure of groups of products dis-tinguished for the share of the technological factor. And here we can put forward the hy-pothesis that greater sensitivity to the distance between trade partners will be character-istic for goods with a low share of technology.
In the research part I focused in the first place on the analysis of the demand struc-ture of the European Union countries. Then I conducted a dynamic comparative analysis of the demand structures of each pair of those countries. I distinguished in it the EU member states before the enlargement in 2004 (EU15) and new member states (EU10, as I excluded Croatia, Cyprus, Malta from the analysis, due to lack of data or their in-completeness). In the first part I conducted an analysis of the correlation between the convergence process of the demand structure and shortening the distance in the eco-nomic development level of the countries, measured with GDP per capita. Then, using the gravity model of foreign trade, I analysed the influence of selected factors, with spe-cial consideration to the convergence process of the demand structure, on the commod-ity structure of exports of the EU states in their bilateral trade.
LITERATURE REVIEW
The empirical verification of Linder’s theory, observed in the literature of the subject, does not bring explicit conclusions. Its confirmation based on the analysis of the impact of dif-ferences in the value of GDP per capita on streams of trade can be found already in the
The Similarity of the Demand Structure as a Determinant of the… | 251
works by Sailors et al. (1973), Thursby and Thursby (1987), but also in more recent publi-cations which include works by such authors as Fink et al. (2005) or Faustino and Leitão (2006) with regard to Portuguese industry products, and Çağlayan-Akay and Oskonbaeva (2018) for trade of selected OECD countries. Some of the studies (Chow et al., 1999) indi-cate limitations of the verifiability of the theory to entities on a higher level of economic development. For example, Hanink (1988) observed that a high level of trade between similar but poor countries is unlikely. The theory was not confirmed in the results obtained for individual countries of East Africa (McPherson et al., 2001), or in research findings for East Asia countries (Dhakal et al., 2011) or Romania (Viciu et al., 2016).
It seems that the role of territorial distance when conducting cross-border activity is quite important. It is a factor which may disturb or weaken the trend of export growth arising from similarity of the demand structure. Although Cairncross (2001) observes that at present geographical distance is not important in the era of global markets, Ellis (2007)emphasizes the fact that empirical evidence indicates that distance still matters, also in hi-tech goods trade. A lot of research points to a negative relationship of trade and distance (Batra, 2006; Ravishankar & Stack, 2014; Maciejewski, 2017). The research by Linnemann (1966), as well as Frankel et al. (1997) emphasize major costs affecting trade, namely physical shipment cost, cost related to time and cost of the ignorance of culture (Lai et al., 2016).
MATERIAL AND METHODS
According to Linder’s theory (1961), the alignment of the level of GDP per capita of coun-tries leads to the standardisation of their demand structure. To determine the demand structure of the European Union countries I initially adopted three methods based on:
− global demand structure (GDP_demand),
− the structure of demand for products according to their durability level (Durable_demand),
− the structure of consumption expenses according to COICOP (COICOP_demand).
In the analysis of the global demand structure (GDP_demand) I used a four-element system including the demand of the state, private consumption demand, private invest-ment demand and net exports (Malmberg & Power, 2005). In the literature there is an emphasis on the significance of the impact of changes in the level of economic develop-ment on shifts in the global demand structure between its elements (Cavallo, 2005; Wło-darczyk, 2015). It is related to transformations in the production structure, the growth of the importance of the services sector and the use of modern technologies.
In the structure of demand for products according to their durability level (Dura-ble_demand) there are also four elements distinguished: durable goods, semi-durable goods, non-durable goods and services. In the demand structure there is a shift towards durable goods in response to rising incomes (Lee, 1964; Conrad & Schroeder, 1991). Possessing durable goods is regarded the indicator of the economic development level of a country (Beerli, 2010).
The most extended demand structure is included in the classification of consump-tion expenses according to COICOP (COICOP_demand). The Classification of Individual Consumption by Purpose (COICOP) was developed by the United Nations Statistical Di-vision for the classification and analysis of individual consumption expenses incurred
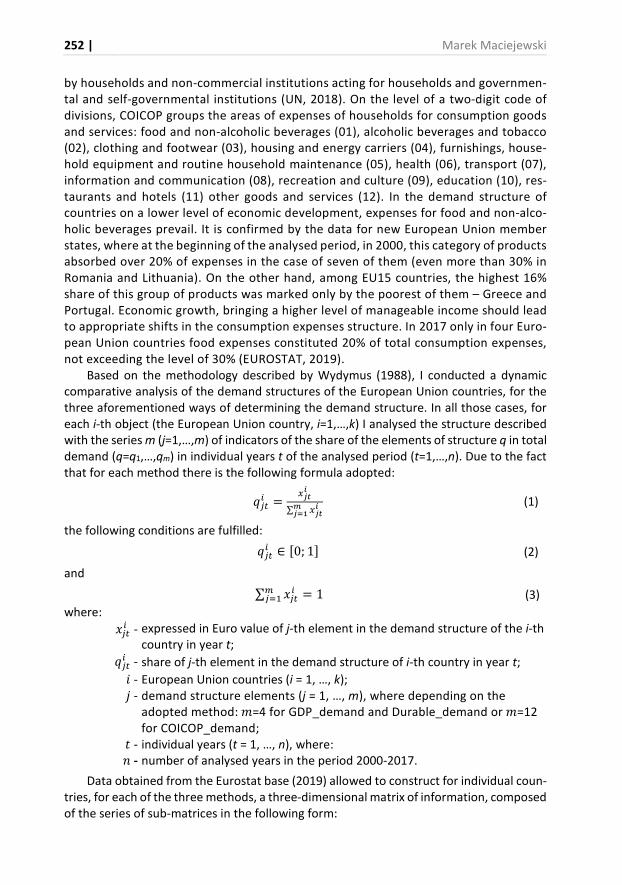
252 | Marek Maciejewski
by households and non-commercial institutions acting for households and governmen-tal and self-governmental institutions (UN, 2018). On the level of a two-digit code of divisions, COICOP groups the areas of expenses of households for consumption goods and services: food and non-alcoholic beverages (01), alcoholic beverages and tobacco (02), clothing and footwear (03), housing and energy carriers (04), furnishings, house-hold equipment and routine household maintenance (05), health (06), transport (07), information and communication (08), recreation and culture (09), education (10), res-taurants and hotels (11) other goods and services (12). In the demand structure of countries on a lower level of economic development, expenses for food and non-alco-holic beverages prevail. It is confirmed by the data for new European Union member states, where at the beginning of the analysed period, in 2000, this category of products absorbed over 20% of expenses in the case of seven of them (even more than 30% in Romania and Lithuania). On the other hand, among EU15 countries, the highest 16% share of this group of products was marked only by the poorest of them – Greece and Portugal. Economic growth, bringing a higher level of manageable income should lead to appropriate shifts in the consumption expenses structure. In 2017 only in four Euro-pean Union countries food expenses constituted 20% of total consumption expenses, not exceeding the level of 30% (EUROSTAT, 2019).
Based on the methodology described by Wydymus (1988), I conducted a dynamic comparative analysis of the demand structures of the European Union countries, for the three aforementioned ways of determining the demand structure. In all those cases, for each i-th object (the European Union country, i=1,…,k) I analysed the structure described with the series m (j=1,…,m) of indicators of the share of the elements of structure q in total demand (q=q1,…,qm) in individual years t of the analysed period (t=1,…,n). Due to the fact that for each method there is the following formula adopted:
���� = ���∑ ������ (1)
the following conditions are fulfilled: ���� ∈ �0; 1� (2)
and ∑ �������� = 1 (3)
where: ���� - expressed in Euro value of j-th element in the demand structure of the i-thcountry in year t; ���� - share of j-th element in the demand structure of i-th country in year t;� - European Union countries (i = 1, …, k); � - demand structure elements (j = 1, …, m), where depending on the adopted method: �=4 for GDP_demand and Durable_demand or �=12 for COICOP_demand; � - individual years (t = 1, …, n), where: � - number of analysed years in the period 2000-2017.
Data obtained from the Eurostat base (2019) allowed to construct for individual coun-tries, for each of the three methods, a three-dimensional matrix of information, composed of the series of sub-matrices in the following form:
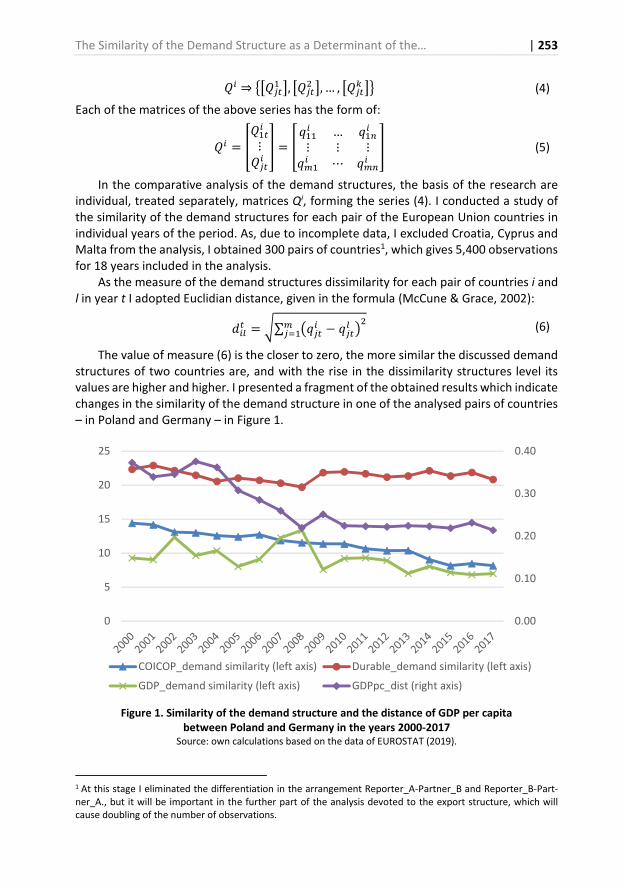
The Similarity of the Demand Structure as a Determinant of the… | 253
�� ⇒ !���� ", !���$ ", … , !���& "' (4)
Each of the matrices of the above series has the form of:
�� = (����⋮���� * = ( ���� … ��+�⋮ ⋮ ⋮���� ⋯ ��+� * (5)
In the comparative analysis of the demand structures, the basis of the research are individual, treated separately, matrices Qi, forming the series (4). I conducted a study of the similarity of the demand structures for each pair of the European Union countries in individual years of the period. As, due to incomplete data, I excluded Croatia, Cyprus and Malta from the analysis, I obtained 300 pairs of countries1, which gives 5,400 observations for 18 years included in the analysis.
As the measure of the demand structures dissimilarity for each pair of countries i and
l in year t I adopted Euclidian distance, given in the formula (McCune & Grace, 2002):
-�.� = /∑ 0���� − ���. 2$���� (6)
The value of measure (6) is the closer to zero, the more similar the discussed demand structures of two countries are, and with the rise in the dissimilarity structures level its values are higher and higher. I presented a fragment of the obtained results which indicate changes in the similarity of the demand structure in one of the analysed pairs of countries – in Poland and Germany – in Figure 1.
Figure 1. Similarity of the demand structure and the distance of GDP per capita
between Poland and Germany in the years 2000-2017
Source: own calculations based on the data of EUROSTAT (2019).
1 At this stage I eliminated the differentiation in the arrangement Reporter_A-Partner_B and Reporter_B-Part-ner_A., but it will be important in the further part of the analysis devoted to the export structure, which will cause doubling of the number of observations.
0.00
0.10
0.20
0.30
0.40
0
5
10
15
20
25
COICOP_demand similarity (left axis) Durable_demand similarity (left axis)
GDP_demand similarity (left axis) GDPpc_dist (right axis)
254 | Marek Maciejewski
What results from Chart 1 is that the highest level of dissimilarity in the demand structures in Poland and Germany refers to the structure basing on the demand for products according to their durability level. On a lower level, with a declining trend, dis-similarity forms in the global demand structure and the structure of consumption ex-penses according to COICOP. I obtained similar comparisons, which I am not able to place here, for all pairs of the European Union countries.
As it was mentioned before, Linder’s theory indicates close relationship between the alignment of the economic development level of countries, whose measure is GDP per capita, and the convergence of the demand structure. I decided to leave in the further analysis in the area of interest, only this form of the presentation of the demand structure whose changes in similarity are correlated to the highest extent with changes in the dis-tance in the GDP level per capita of the analysed pairs of countries.
For this purpose I calculated the indicator of a relative difference in the level of GDP per capita of entities i and l belonging to the analysed pairs of countries (GDPpc_distil) in individual years by means of the formula (Somma, 1994): 34567_-�9��.� = 1 + (<).+(<)>(�?<).+(�?<).+($) (7)
where:
@ = ABCDE�ABCDE�>ABCDEF� (8)
whereas: 34567��; 34567.� - mean, respectively, GDP per capita in country i and l in year t.
The indicator is a normalised measure adopting values from the range [0,1], where zero means identical GDP per capita of countries, and approximation to one is equal to the growth of the difference between their GDP per capita.
In Figure 1 the broken line stands for a change in the distance in GDP per capita between Poland and Germany in the period 2000-2017. Its run shows the gradual reduc-tion of this distance and the highest convergence of this process with the convergence of consumption expenses structure according to COICOP (a correlation coefficient be-tween these variables in the period 2000-2017 was 0.821). The convergence is high also with regard to the other pairs of the European Union countries. Table 1 presents a cor-relation coefficient between changes in the distance of GDP per capita and changes in the level of similarity of the demand structure for the European Union countries and the groups of countries distinguished from them (EU10 and EU15).
The analysis of the data from Table 1 allows to prove positive correlation between reduction of the distance of GDP per capita and the process of convergence of the de-mand structures for pairs of countries in all the analysed groups of the European Union countries. This correlation the strongest when changes in the demand structure are represented by shifts in consumption expenses classified according to COICOP. Only within mutual relations of countries from the EU15 group transformations in the global demand structure were more significant. Changes in the distance of GDP per capita and convergences in the demand structures within EU 10 countries, characterised by a lower, similar within the group, level of economic development, were the most poorly correlated. It lets us think that they are oriented to the consumption level of more highly developed countries.

The Similarity of the Demand Structure as a Determinant of the… | 255
Table 1. Correlation coefficient between changes in the distance of GDP per capita and similarity
of the demand structure for the group of the European Union countries in the years 2000-2017
Group of countries Number of Correlation coefficient: GDPpc_dist and
Reporter Partner Countries
pairs Observations
COICOP_
Demand
similarity
Durable_
Demand
similarity
GDP_
demand
similarity
EU10 EU10 45 810 0.4127 0.0762 0.3615
EU10 EU15 150 2700 0.6226 0.1181 0.5622
EU10 EU28 195 3510 0.6463 0.3276 0.5674
EU15 EU15 105 1890 0.5134 0.1973 0.7624
EU15 EU28 255 4590 0.6959 0.5039 0.3972
EU28 EU28 300 5400 0.6801 0.5053 0.4361 Source: own calculations based on the data of EUROSTAT (2019).
In the light of the above, I decided to relate the analysis of bilateral trade of the Euro-pean Union countries to changes in the structure of their demand expressed in the level of consumption expenses classified according to COICOP.
In order to do this, I used the gravity model of foreign trade, whose idea referring to Newton’s gravitation law assumes that the value of trade exchange between two coun-tries is proportional to the product of income of those countries, thus, to their masses, and inversely proportional to the distance between them, which translated into the costs of transport, diminishing the attractiveness of trade exchange (Tinbergen, 1962). The con-cept has become a popular instrument of trade modelling, mainly due to the possibility to develop a formula with new variables for the needs of testing their impact on trade streams (Maciejewski & Wach, 2019). In the group of model variables explaining bilateral trade of the European Union countries I decided to include the measure of similarity of their demand structure based on consumption expenses classified according to COICOP (COICOP demand similarity, COICOP_DSil). In the group of the remaining explanatory vari-ables I included the basic data of the gravity model:
− GDP of exporter (GDPi) and GDP of its trade partner (GDPl) based on UNCTADdata (2019),
− distance in kilometres between trade partners’ capital cities (Distil) based on CEPIIbase (2019)
and
− distance between the value of GDP of the exporter and its trade partner (GDP_distil),calculated in accordance with formulas (7) and (8),
− value of GDP per capita of the country of exporter (GDPpci) and its trade partner(GDPpcl) based on UNCTAD data (2019),
− dummy variable which indicates the possession of a common border by a pair ofcountries (Borderil).
The dependent variable in the model is the share in the structure of the exports of products classified based on their technological advancement on the basis of the method-ology proposed by Lall (2000). In this approach, we distinguish in the export structure:
256 | Marek Maciejewski
− primary products (PP) with scarce technological advancement,
− resource based products (RB) primarily using local abundance of natural resources,
− low technology products (LT) mainly using technologies included in capital equipment,
− medium technology products (MT), which use technologies with moderate engage-ment of R&D,
− high technology products (HT) using advanced and fast changing technologies, andthose requiring investment in R&D.
Therefore, I estimated parameters of five models for the share in the exports share (Exil) of individual categories of products j (j=1,…m). Models of bilateral trade of countries i, l, take on the following form: G��.�� = HI + H�JKLJK5_4M�.�� + H$345��� + HN345.�� + HN4�9��.�� +HNOPQ-RQ�.�� + HS345_-�9��.�� + HT34567��� + HU345.�� + V�.�� (9)
In order to consider the specific character of trade between partner in sa similar and on different levels of economic development, I estimated four time in the Reporter-Partner arrangement:
− EU10-EU10 – exports of EU10 countries to the market of the remaining countries of thisgroup (90 pairs of countries, 1,620 observations in the period of the analysed 18 years),
− EU10-EU15 – exports of EU10 countries to the market of EU15 countries (150 pairs ofcountries, 2,700 observations),
− EU15-EU10 – exports of EU15 countries to the market of the remaining countries of thisgroup (150 pairs of countries, 2,700 observations)
− EU15-EU15 – exports of EU15 countries to the market of the remaining countries of thisgroup (210 pairs of countries, 3,780 observations).
RESULTS AND DISCUSSION
I estimated the values of the models’ parameters with the panel regression method in Gretl software. Wald test and Breusch-Pagan test (Zaman, 2000) excluded the possibility of correct deduction based on the classical least squares method (pooled OLS), and in all the cases Hausman test indicated the superiority of fixed effects estimator (FE) over the random effects estimator (RE). However, FE estimator, due to collinearity, does not allow to use the variables whose values are fixed in time for each pair of countries. In the con-ducted analysis it concerned the variables which are crucial for gravity models, such as geographical distance and the common border. In those cases I applied two-level regres-sion (Chenga & Walla, 2005), on the second stage making the regression of those variables on the absolute term which were obtained on the first stage, including the remaining data (I presented the results obtained in this way in the summary below in italics). I conducted the diagnosis of the models with regard to the normality of the distribution of residuals and heteroscedasticity based on Doornik-Hansen and Wald test.
In Table 2 I present the results of the estimation for the whole model only for trade within EU15 countries, and in Table 3 I presented the results obtained from all the models, but only with reference to variable COICOP_DSil, as the parameter estimated for this vari-able is the main area of interest in this article.
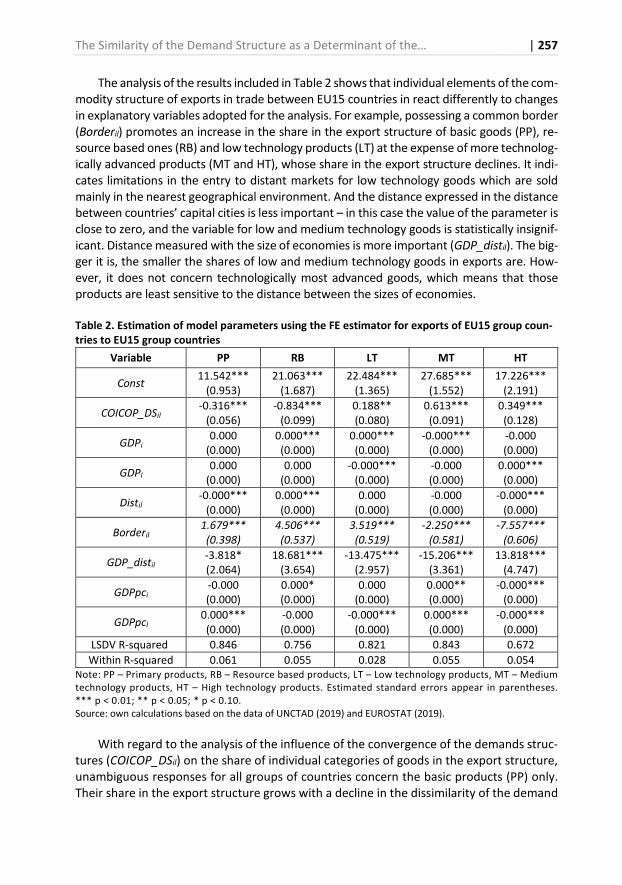
The Similarity of the Demand Structure as a Determinant of the… | 257
The analysis of the results included in Table 2 shows that individual elements of the com-modity structure of exports in trade between EU15 countries in react differently to changes in explanatory variables adopted for the analysis. For example, possessing a common border (Borderil) promotes an increase in the share in the export structure of basic goods (PP), re-source based ones (RB) and low technology products (LT) at the expense of more technolog-ically advanced products (MT and HT), whose share in the export structure declines. It indi-cates limitations in the entry to distant markets for low technology goods which are sold mainly in the nearest geographical environment. And the distance expressed in the distance between countries’ capital cities is less important – in this case the value of the parameter is close to zero, and the variable for low and medium technology goods is statistically insignif-icant. Distance measured with the size of economies is more important (GDP_distil). The big-ger it is, the smaller the shares of low and medium technology goods in exports are. How-ever, it does not concern technologically most advanced goods, which means that those products are least sensitive to the distance between the sizes of economies.
Table 2. Estimation of model parameters using the FE estimator for exports of EU15 group coun-
tries to EU15 group countries
Variable PP RB LT MT HT
Const 11.542***
(0.953) 21.063***
(1.687) 22.484***
(1.365) 27.685***
(1.552) 17.226***
(2.191)
COICOP_DSil-0.316***
(0.056) -0.834***
(0.099) 0.188** (0.080)
0.613*** (0.091)
0.349*** (0.128)
GDPi0.000
(0.000) 0.000*** (0.000)
0.000*** (0.000)
-0.000*** (0.000)
-0.000 (0.000)
GDPl0.000
(0.000) 0.000
(0.000) -0.000***
(0.000) -0.000 (0.000)
0.000*** (0.000)
Distil-0.000***
(0.000) 0.000*** (0.000)
0.000 (0.000)
-0.000 (0.000)
-0.000*** (0.000)
Borderil 1.679***
(0.398)
4.506***
(0.537)
3.519***
(0.519)
-2.250***
(0.581)
-7.557***
(0.606)
GDP_distil-3.818* (2.064)
18.681*** (3.654)
-13.475*** (2.957)
-15.206*** (3.361)
13.818*** (4.747)
GDPpci -0.000 (0.000)
0.000* (0.000)
0.000 (0.000)
0.000** (0.000)
-0.000*** (0.000)
GDPpcl 0.000*** (0.000)
-0.000 (0.000)
-0.000*** (0.000)
0.000*** (0.000)
-0.000*** (0.000)
LSDV R-squared 0.846 0.756 0.821 0.843 0.672
Within R-squared 0.061 0.055 0.028 0.055 0.054 Note: PP – Primary products, RB – Resource based products, LT – Low technology products, MT – Medium technology products, HT – High technology products. Estimated standard errors appear in parentheses. *** p < 0.01; ** p < 0.05; * p < 0.10. Source: own calculations based on the data of UNCTAD (2019) and EUROSTAT (2019).
With regard to the analysis of the influence of the convergence of the demands struc-tures (COICOP_DSil) on the share of individual categories of goods in the export structure, unambiguous responses for all groups of countries concern the basic products (PP) only. Their share in the export structure grows with a decline in the dissimilarity of the demand
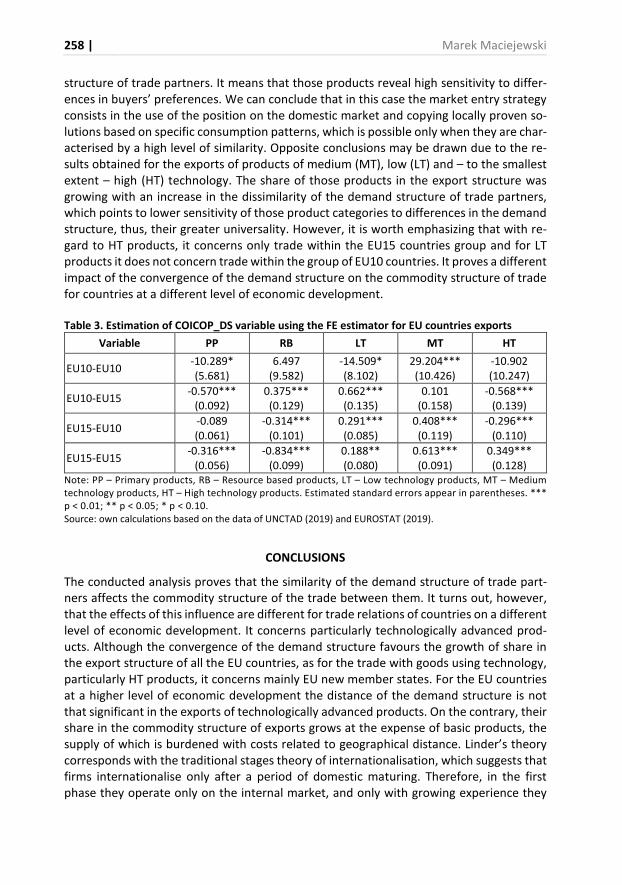
258 | Marek Maciejewski
structure of trade partners. It means that those products reveal high sensitivity to differ-ences in buyers’ preferences. We can conclude that in this case the market entry strategy consists in the use of the position on the domestic market and copying locally proven so-lutions based on specific consumption patterns, which is possible only when they are char-acterised by a high level of similarity. Opposite conclusions may be drawn due to the re-sults obtained for the exports of products of medium (MT), low (LT) and – to the smallest extent – high (HT) technology. The share of those products in the export structure was growing with an increase in the dissimilarity of the demand structure of trade partners, which points to lower sensitivity of those product categories to differences in the demand structure, thus, their greater universality. However, it is worth emphasizing that with re-gard to HT products, it concerns only trade within the EU15 countries group and for LT products it does not concern trade within the group of EU10 countries. It proves a different impact of the convergence of the demand structure on the commodity structure of trade for countries at a different level of economic development.
Table 3. Estimation of COICOP_DS variable using the FE estimator for EU countries exports
Variable PP RB LT MT HT
EU10-EU10 -10.289* (5.681)
6.497 (9.582)
-14.509* (8.102)
29.204*** (10.426)
-10.902 (10.247)
EU10-EU15 -0.570***
(0.092) 0.375*** (0.129)
0.662*** (0.135)
0.101 (0.158)
-0.568*** (0.139)
EU15-EU10 -0.089 (0.061)
-0.314*** (0.101)
0.291*** (0.085)
0.408*** (0.119)
-0.296*** (0.110)
EU15-EU15 -0.316***
(0.056) -0.834***
(0.099) 0.188** (0.080)
0.613*** (0.091)
0.349*** (0.128)
Note: PP – Primary products, RB – Resource based products, LT – Low technology products, MT – Medium technology products, HT – High technology products. Estimated standard errors appear in parentheses. *** p < 0.01; ** p < 0.05; * p < 0.10. Source: own calculations based on the data of UNCTAD (2019) and EUROSTAT (2019).
CONCLUSIONS
The conducted analysis proves that the similarity of the demand structure of trade part-ners affects the commodity structure of the trade between them. It turns out, however, that the effects of this influence are different for trade relations of countries on a different level of economic development. It concerns particularly technologically advanced prod-ucts. Although the convergence of the demand structure favours the growth of share in the export structure of all the EU countries, as for the trade with goods using technology, particularly HT products, it concerns mainly EU new member states. For the EU countries at a higher level of economic development the distance of the demand structure is not that significant in the exports of technologically advanced products. On the contrary, their share in the commodity structure of exports grows at the expense of basic products, the supply of which is burdened with costs related to geographical distance. Linder’s theory corresponds with the traditional stages theory of internationalisation, which suggests that firms internationalise only after a period of domestic maturing. Therefore, in the first phase they operate only on the internal market, and only with growing experience they
The Similarity of the Demand Structure as a Determinant of the… | 259
gradually enter foreign markets. The most known stages model is regarded to be the Upp-sala model by Johanson and Vahlne (1977), assuming the stepwise internationalisation process, starting from the lack of regular exports activity, through exports with the use of intermediaries, trade affiliates, and ending with manufacturing affiliates characterised by the highest level of engagement on foreign markets. In the stages approach, the interna-tionalisation of firms is perceived as an effect of the learning process, with which the en-gagement of resources on foreign markets is growing (Wach, 2014). However, we can as-sume that such an internationalisation model is adopted mainly in traditional industries. Firms operating in high tech industries usually skip individual stages of internationalisa-tion, they undertake activity on international markets from inception or soon after their establishment (Daszkiewicz, 2019). Their offer is more universal and less prone to an in-fluence of the differences in the demand structure.
The conducted analysis is based only on macro-economic data, which is a limitation, as decisions about undertaking trade exchange in a specific industry and geographical di-rection are taken on the firm’s level. However, the problem is worth further research to be conducted. A method which should be used in it is the structural modelling method – SEM, which allows to draw conclusions with reference to more complex dependencies, which would enable to consider a number of other factors in addition to GDP per capita, affecting the process of the demand structure convergence.
REFERENCES
Batra, A. (2006). India’s global trade potential: The gravity model approach. Global Economic Review, 35(3), 327-361.
Beerli, A. (2010). The Evolution of Durable Goods Demand During China’s Transition. Institute for
Empirical Research in Economics University of Zurich Working Paper, 494, 1-68.
Çağlayan-Akay, E., & Oskonbaeva, Z. (2018). Empirical Analysis of the Linder Hypothesis: A Random- Effects Tobit Model. The Empirical Economics Letters, 17(1), 87-97.
Cairncross, F. (2001). The death of distance: How the communications revolution is changing our
lives. Boston: Harvard Business School Press.
Cavallo, M. (2005). Government Consumption Expenditures and the Current Account. FRB of San
Francisco Working Paper, (2005)03, 1-26.
CEPII. (2019). CEPII database. Retrieved from http://www.cepii.fr/cepii/en/bdd_modele/bdd.asp. on April 20, 2019.
Cheng, I.H., & Wall, H.J. (2005). Controlling for Heterogeneity in Gravity Models of Trade and Inte-gration. Federal Reserve Bank of St. Louis Review, 87(1), 49-63.
Chow, P., Kellman, M., & Shachmurove, Y. (1999). A Test of the LinderHypothesis in Pacific NIC Trade 1965-1990. Applied Economics, 31(2), 175-182.
Conrad, K., & Schroder, M. (1991). Demand for Durable and Nondurable Goods, Environmental Pol-icy and Consumer Welfare. Journal of Applied Econometrics, 6(3), 271-286.
Daszkiewicz, N. (Ed.) (2019). Internationalization of High-Tech Firms: Patterns, Innovation and Re-
search and Development. Cambridge: Cambridge Scholars Publishing.
Dhakal, D., Pradhan, G., & Upadhyaya, K.P. (2011). Another Empirical Look at the Theory of Overlap-ping Demands. International Economics, 64(1), 103-113.
260 | Marek Maciejewski
Ellis, P.D. (2007). Paths to foreign markets: Does distance to market affect firm internationalisation?. International Business Review, 16(5), 573-593.
EUROSTAT (2019). Eurostat Database. Retrieved from https://ec.europa.eu/eurostat/data/database on April 20, 2019.
Fink, C., Javorcik, B.S., & Spatareanu, M. (2005). Income-Related Biases in International Trade: What do Trademark Registration Data Tell Us?. Review of World Economics, 141(1), 79-103.
Görkemli, K., Altuğ, K., & Tamer, S. (2018). Bilateral Trade in European Sports Industry: Linder versus Hecksher-Ohlin-Samuelson. International Journal of Economics and Financial Issues, 8(1), 48-53.
Hanink, D.M. (1988). An extended Linder model of international trade. Economic Geography, 64(4), 322-334.
Johanson, J., & Vahlne, J.-E. (1977). The Internationalization Process of the Firms – A Model of Knowledge Development and Increasing Foreign Market Commitments. Journal of International
Business Studies, 8(1), 23-32.
Lai, A.A., Lai, M.F., & Bujang, I. (2016). The Heckscher-Ohlin versus Linder’s Theory: evidence from Malaysian exports. Journal of Business and Retail Management Research, 10(2), 85-93.
Lall, S. (2000). The Technological Structure and Performance of Developing Country Manufactured Exports, 1985-98. Oxford Development Studies, 28(3), 337-369.
Lee, M.A. (1964). Income, Income Change, and Durable Goods Demand. Journal of the American
Statistical Association, 59(308), 1194-1202.
Faustino, H., & Leitão, N.C. (2007). Country-Specific Determinants of Intra-Industry Trade in Portu-gal. Working Papers Department of Economics, (2007)/27, 1-23.
Frankel, J.A., Stein, E., & Wei, S.J. (1997). Regional trading blocs in the world economic system. Wash-ington: Institute for International Economics.
Linder, S.B. (1961). An Essay on Trade and Transformation. Uppsala: Almqvist & Wiksells Boktryckeri AB.
Linnemann, H. (1966). An econometric study of international trade flows. Amsterdam: North-Holland Publishing Company.
Maciejewski, M. (2017). Determinanty wykorzystania czynników wytwórczych w strukturze eksportu państw Unii Europejskiej. Horyzonty Polityki, 8(22), 131-149.
Maciejewski, M., & Wach, K. (2019). What determines export structure in the EU countries? The use of gravity model in international trade based on the panel data for the years 1995-2015. Journal
of International Studies, 12(1), 151-167. https://doi.org/10.14254/2071-8330. 2019/12-1/10
Malmberg, A., & Power, D. (2005). On the role of global demand in local innovation processes. In G. Fuchs & Ph. Shapira (Eds.), Rethinking regional innovation and change, (pp. 273-290). New York: Springer.
McCune, B., & Grace, J.B. (2002). Analysis of Ecological Communities. Gleneden Beach, Oregon: MjM Software Design.
McPherson, M.A., Redfearn, M.R., & Tieslau, M.A. (2001). International trade and developing coun-tries: an empirical investigation of the Linder hypothesis. Applied Economics, 33(5), 649-657.
Ravishankar, G., & Stack, M.M. (2014). The Gravity Model and Trade Efficiency: A Stochastic Frontier Analysis of Eastern European Countries’ Potential Trade. The World Economy, 37(5), 690-704.
Sailors, J., Qureshi, U., & Cross, E. (1973). An Empirical Verification of Linder’s Trade Thesis. Southern
Economic Journal, 40(2), 262-268.
Somma, E. (1994). Intra-industry trade in the European computers industry. Weltwirtschaftliches
Archiv, 130(4), 784-799.
Thursby, J., & Thursby, M., (1987). Bilateral Trade Flows, the Linder Hypothesis, and Exchange Risk. The Review of Economics and Statistics, 69(3), 488-495.
The Similarity of the Demand Structure as a Determinant of the… | 261
Tinbergen, J. (1962). Shaping the World Economy; Suggestions for an International
Economic Policy. New York: Twentieth Century Fund. Retrieved from http://hdl.han-dle.net/1765/16826, on May 10, 2019.
UN. (2018). Classification of Individual Consumption According to Purpose (COICOP) 2018. Statistical Paper, 99. New York: United Nations.
UNCTAD. (2019). UNCTADStat. Retrieved from https://unctadstat.unctad.org on April 10, 2019.
Viciu, T.G., Mihoreanu, L., & Costea, C. (2016). An Essay on the Applicability of the Linder Hypothesis in Determining the Patterns of the Romanian International Trade. Journal of Economic Develop-
ment, Environment and People, 5(1), 52-62.
Wach, K. (2014). The Role of Knowledge in the Internationalisation Process: An Empirical Investiga-tion among Polish Businesses (chapter 7). In D. Kiendl-Wendner & K. Wach (Eds), International
Competitiveness in Visegrad Countries: Macro and Micro Perspectives, (pp. 143-158). Graz: Fachhochschule Joanneum.
Włodarczyk, R.W. (2015). Struktura popytu globalnego a wzrost gospodarczy w krajach Europy Środ-kowej i Wschodniej. Optimum. Studia Ekonomiczne, 3(75), 3-19.
Wydymus, S. (1988). Analiza porównawcza struktur gospodarczych. In A. Zeliaś (Ed.), Metody staty-
styki międzynarodowej, (pp. 162-199). Warszawa: Państwowe Wydawnictwo Ekonomiczne.
Zaman, A. (2000). The Inconsistency of the Breusch-Pagan Test. Journal of Economic and Social Re-
search, 2(1), 1-11.
262 | Marek Maciejewski
Author
Marek Maciejewski
Assistant Professor in the Department of International Trade, PhD in economics, author of publi-cations on international trade, scientific secretary of the journal ‘International Entrepreneurship’. He was the chairman and member of the organizing committees of many national and interna-tional conferences. He is a member of international scientific societies, including Academy of In-ternational Business (AIB) and European International Business Academy (EIBA). Correspondence to: Dr Marek Maciejewski, Cracow University of Economics, ul. Rakowicka 27, 31-510 Kraków, Poland, e-mail: [email protected] ORCID http://orcid.org/0000-0003-1343-3764
Acknowledgements and Financial Disclosure
This article is financed from the funds allocated to the Faculty of Economics and International Relations of the Cracow University of Economics in the framework of grants for maintaining research potential.
The author would like to thank the anonymous referees for their useful comments, which al-lowed to increase the value of this article.
Copyright and License
This article is published under the terms of the Creative Commons Attribution – NoDerivs (CC BY-ND 4.0) License
http://creativecommons.org/licenses/by-nd/4.0/
Published by the Centre for Strategic and International Entrepreneurship – Krakow, Poland
The copyediting and proofreading of articles in English is financed in the framework of contract No. 913/P-DUN/2019 by the Ministry of Science and Higher Education of the Republic of Poland committed to activities aimed at science promotion.
EBER and Its Editorial Announcements | 233
Aim and Scope of EBER
Entrepreneurial Business and Economics Review (EBER) was established in 2013 as
a peer review scientific journal published quarterly by Cracow University of Econom-
ics (Poland). EBER provides immediate open access to its content on the principle that
making research freely available to the public supports a greater global exchange of
knowledge.
‘Entrepreneurial Business and Economics Review’ (EBER), as multi-disciplinary and
multi-contextual journal, is dedicated to serve as a broad and unified platform for re-
vealing and spreading economics and management research focused on entrepreneur-
ship, individual entrepreneurs as well as particular entrepreneurial aspects of business.
It attempts to link theory and practice in different sections of economics and manage-
ment by publishing various types of articles, including mainly research papers, but
sometimes also conceptual papers and literature reviews.
Our geographical scope of interests include Central and Eastern Europe (CEE) as well as
South-East Europe (SEE) and emerging markets in general, however, we also welcome
articles beyond this scope.
The Journal accepts the articles from the following fields:
Entrepreneurship and Business Studies (in particular entrepreneurship and innova-
tion, strategic entrepreneurship, corporate entrepreneurship, entrepreneurship meth-
odology, promoting entrepreneurship, innovation, R&D and SMEs, education for entrepre-
neurship, entrepreneurial management, entrepreneurial business, management
methodology, modern trends in business studies and organization theory, new
trends in HRM and HRD as well as organizational behaviour),
International Business and Global Entrepreneurship (in particular international entre-
preneurship (IE), international business (IB), new trends in IB, international management,
international marketing, global strategy, European business),
International Economics and Applied Economics (in particular the role of entrepre-
neurship and the entrepreneur in the economy – microeconomics and macroeconom-
ics, international economics including the economics of the European Union and emerg-
ing markets, as well as Europeanization, new trends in economics).
234 | EBER and Its Editorial Announcements
Guidelines for Authors
We accept articles proposals if they fit the aim and scope of our journal. We accept
submissions on the ‘first come, first served’ base in the constant mode.
The articles must be between 20 000 and 40 000 characters (including spaces as well
as all necessary tables, figures, graphs and illustrations, the list of used references and
any appendixes if needed). No article submission or article processing fees are
charged, however we if the article exceeds the given limit of characters we apply a
fee (see our website for details).
The articles must be prepared with accordance to our technical requirements and taking
our academic ethics code into account. The articles must be prepared in our template.
We will reject submissions not prepared according to our requirements.
Before submitting your article, please read and apply the following rules:
EASE Guidelines for Authors of Scientific Articles to be Published in English (ver-
sion of November 2016) explaining in details how to compose a scientific article
according to international standards.
APA Style Manual (6th edition of June 2009) explaining in details how to use and cite
references and how to apply linguistic rules while writing in English.
For very detailed submission instructions, including guidelines for authors, and all other
information visit our website at: www.eber.uek.krakow.pl – please read there the follow-
ing documents very carefully before your submission:
Guidelines for Authors (*.pdf),
Template for Articles (*.docx, *.dotx, *.rtf, *.pdf),
Internal Review Form – Checklist of the Article(*.docx),
Copyright Transfer(*.docx).
Submission of the Manuscripts
We use the OJS system for submissions. After having finished your article, when your files
are ready, visit the online submission website. You will need to log into the system:
If you know your login details, use your user ID and password to log on.
If you do not know your login details, check to see if you are already registered by click-
ing on the 'Forgot your password?' button and following the on-screen instructions.
If you are not already registered, you can register by clicking on the 'Not a user?
Register with this site' button on the login screen and following the on-screen in-
structions. Please remember you should register as ‘Author’, however, we advise
you to register also as ‘Reader’ and ‘Reviewer’. If you don’t mark ‘Author’ status,
you will not be able to submit your article.
EBER and Its Editorial Announcements | 235
Reviewing Policy and Procedures
1. The editor-in-chief or another member of the editorial team will make a preliminary
decision to either accept the paper for further review or reject the paper (desk‘s re-
jection) if the submitted article doesn’t meet our editorial requirements or is out of
our aim and scope. The author will be notified of the decision as soon as possible. In
certain situations, this decision will be made following consultation with a member of
the editorial council specializing in a given area of research.
2. The reviews are prepared by at least 2 independent reviewers indicated by the edito-
rial board. The independent reviewers are not associated with the author’s parent
institution (external reviewers to the author).
3. Reviews are prepared using a double-blind peer review. This process is based on the
rule that the reviewer does not know the identity of the author and vice versa.
4. Each review is issued in written form (later revealed to the Author) and ends with
a recommendation for or against publication.
5. In addition to the recommendations made by reviewers, the Author may receive ad-
ditional editorial suggestions from:
the editor-in-chief, only in urgent cases,
an issue editor as the executive editor responsible for the issue,
an associate editor or a guest editor if there is a special need,
a layout editor for technical and editorial comments,
a statistics editor if the paper contains statistics.
6. The author must reply to all comments and suggestions (a special form is required to
be filled in and to be sent back).
7. The editor-in-chief provides the final opinion based on a very detailed process.
8. Before submitting your article, please make familiar with the following forms and
evaluation criteria, which must be applied by Authors (files are available at our web-
site for downloading after logging in):
Internal Review Form – Checklist of the Article (*.docx),
External Review Form (*.docx),
Statistical Review Form (*.docx),
Technical Review Form (*.docx),
Author's Statement after the Reviews (must be attached to the revised article),
Copyright Transfer (must be signed before publishing).
9. Before publishing each article is proofread by a language editor (a native speaker or
a bilingual speaker). Authors are obliged to apply all necessary changes, however,
they can negotiate special terminology use.
10. Prior to publishing, the Corresponding Author must sign and submit the Copyright
Transfer, otherwise we will not be able to publish the given article.
11. Each Author must follow the principles of transparency and best practices in scholarly
publishing (see our website for details). Editors and the Publisher will be documenting
all forms of scientific misconduct and malpractice, particularly violations of ethics and
violations of science principles. Any such cases will be reported to the employer of
the author and to the relevant public and state institutions.
236 | EBER and Its Editorial Announcements
Thematic issues of EBER in the years 2013-2018
Since 2019 we have been publishing regular issues of EBER including various topic arti-
cles. In the years 2013-2018 we published the following thematic issues of EBER:
2013, 1(1) Global Opportunities and Local Businesses
2013, 1(2) Modern Challenges for International Business in Europe
2013, 1(3) Contemporary Issues in International Economics
2013, 1(4) Modern Challenges for Business and Economy in CEE Countries
2014, 2(1) Global Entrepreneurship from the European Perspective
2014, 2(2) Globalisation of Economies and Industries
2014, 2(3) FDI in Central Europe
2014, 2(4) New Developments in International Business and Economics in CEECs
2015, 3(1) Social Entrepreneurship and Socio-Economic Development
2015, 3(2) International Entrepreneurial Orientation: Theoretical Perspective
2015, 3(3) Immigrant and Ethnic Entrepreneurship
2015, 3(4) Dilemmas of Modern Economy and Business
2016, 4(1) Economics of Higher Education
2016, 4(2) Real Estate and Construction Economics
2016, 4(3) Advancing Research in Entrepreneurship
2016, 4(4) Entrepreneurship in the Global Context
2017, 5(1) Retailing and Innovation
2017, 5(2) International Trade and Global Business
2017, 5(3) International Entrepreneurship: New Perspectives in IB Research
2017, 5(4) International Competitiveness
2018, 6(1) Social Entrepreneurship in the Global Context
2018, 6(2) Exporting, International Cooperation and FDI
2018, 6(3) Economic Implications of the Global Financial Crisis
2018, 6(4) Foreign Entrepreneurs in China
eISSN 2353-8821
Visit us at www.eber.uek.krakow.pl
9 772353 883005
ISSN 2353-883X
CRACOWUNIVERSITYOF ECONOMICS
Top Related
Copyright © 2022 FDOKUMEN

