


Bahasa
Halaman
Hukum


INSTITUTIONAL INVESTOR PRESENTATIONFIRST QUARTER 2019

Contents
Company Overview & 1Q19 Results 4
Recent Developments 6
Investment Thesis 11
Portfolio Diversification 20
Defensive Retail Portfolio 25
Asset Management & Real Estate Operations 30
Investment Strategy 33
Capital Structure & Scalability 40
Dependable Dividends 44
Summary 46
Appendix
- Superior Performance During Great Recession
- Top Industries Overview
47
48
53
All data as of March 31, 2019 unless otherwise specified 2

Safe Harbor For Forward-Looking Statements
Statements in this investor presentation that are not strictly historical are "forward-looking"statements. Forward-looking statements involve known and unknown risks, which may cause thecompany‘s actual future results to differ materially from expected results. These risks include,among others, general economic conditions, domestic and foreign real estate conditions, tenantfinancial health, the availability of capital to finance planned growth, continued volatility anduncertainty in the credit markets and broader financial markets, property acquisitions and thetiming of these acquisitions, charges for property impairments, and the outcome of any legalproceedings to which the company is a party, as described in the company's filings with theSecurities and Exchange Commission. Consequently, forward-looking statements should beregarded solely as reflections of the company's current operating plans and estimates. Actualoperating results may differ materially from what is expressed or forecast in this investorpresentation. The company undertakes no obligation to publicly release the results of any revisionsto these forward-looking statements that may be made to reflect events or circumstances after thedate these statements were made.
3

Realty Income Company Overview
4
S&P 500 REAL ESTATE COMPANY
DIVERSIFIED, HIGH-QUALITY“NET LEASE” PORTFOLIO
TRACK RECORD OF SAFETY AND CONSISTENCY
$29B enterprise value
1 of only 2 REITs in both categories
Member of S&P High-Yield Dividend Aristocrats® index
1 of 8 U.S. REITs with at least two A3/A- ratings
5,876commercial real estate properties
82% of rent generated
from retail properties
261 commercial tenants
48 industries
49 states represented
A3 / A-
(1) AFFO through most recent calendar year/ Excludes earnings from Crest Net Lease, a subsidiary of Realty Income, as earnings do not reflect recurring business operations
16.9%TSR since 1994
NYSE listing
$1.3B annualized rental
revenue
50years of operating
history
credit ratings by Moody’s and S&P
22 OF 23years of positive earnings
per share(1) growth
9.2years weighted
average remaining lease term
0.4beta vs. S&P 500 since 1994 NYSE
listing
5.1%median
earnings per share(1) growth
51%of rent from
investment-grade rated tenants
94.2%adjusted EBITDAremargin

Our Approach and 1Q19 Results
5
Acquire well-located commercial properties
✓ ~$519 million in acquisitions1
Remain disciplined in our acquisition underwriting
✓ Acquired ~4% of sourced volume2
Execute long-term net lease agreements
✓ Recaptured 104.7% of expiring rent3
Actively manage portfolio to maximize value
✓ Ended quarter at 98.3% occupancy4
Maintain a conservative balance sheet
✓ Ended quarter with Debt / Adjusted EBITDAre ratio of 5.5x5
Grow per share earnings and dividends
✓ AFFO/sh growth: +3.8% | Dividend/sh growth: +3.2%

Recent Developments
6
Estimated size of the commercial real estate market in Europe is ~$11 trillion, with $30-$35 billion of annual single-tenant transaction volume in our core verticals
~
~
~
Expanding to Europe is a natural extension of Realty Income’s business model, with a focus on long-term triple net leases with annual growth
~
We intend to establish an office in London, and to judiciously grow our portfolio in Europe over time as we have done in the US
~
First International Transaction: Sainsbury’s SLB
✓ AFFO accretion(2): $0.04/sh | Base-case USD IRR(3): 6.6%
Realty Income will expand to international markets starting with strategic sale-leaseback with Sainsbury’s
Realty Income Announces International Expansion:
£429 Million Sale-Leaseback with Sainsbury’s(1)
We believe there is demand from high quality tenants in Europe for sale-leaseback capital on reasonable terms
Realty Income is well-positioned to build an international platform leveraging its scale, size, and sector-leading cost of capital
(1) Expected to close on or around 5/22/19(2) Annualized leverage-neutral AFFO accretion(3) Unlevered IRR. Key assumptions: contractual annual fixed rent increases, residual value at 100% of purchase price, GBP/USD FX curve as of 4/19/19

7
Europe Presents Compelling Market OpportunityRealty Income’s portable business model, cost of capital and scalability represent core competitive advantages
(1) Property owned for the primary purpose of benefitting from investment returns, as distinct from owner-occupied and non-investment leased real estate (2) Includes owner-occupied and non-investment leased real estate
Sources: CBRE, MSCI, Bloomberg, Realty Income estimates
US vs. Europe Comparison: Estimated Commercial Real Estate Market Value
CRE owned by Real Estate
Companies(1)
All Other Commercial
Real Estate(2)
Total Investable Commercial
Real Estate
US $4 Trillion $4 Trillion $8 Trillion
Europe $3 Trillion $8 Trillion $11 Trillion
US + Europe $7 Trillion $12 Trillion $19 Trillion
~ Ripe for sale-leaseback consolidation: We estimate $11 trillion of commercial real estate stock in the European market, only $3 trillion of which is owned by professional real estate firms
~ Additive to Realty Income’s addressable market: We estimate that corporate-owned commercial real estate stock is 2x greater in Europe than in the US, representing a void for a well-capitalized, sizable and scalable institutional investor like Realty Income to fill
Median EBITDA Multiple Comparisons • Similar to the US, public companies in Europe can unlock trapped RE value through sale-leasebacks
• We expect market-ascribed valuation differentials between real estate and operating businesses to benefit us
• We estimate annualized single-tenant real estate transaction volume in Europe to be between $30 and $35 billion in our target verticals
16.7x14.6x
11.1x6.4x 6.3x
Illustrative SLB
Multiple
(at 6% cap
rate)
Europe Ex-UK
Real Estate
Companies
(~700)
UK-Domiciled
Real Estate
Companies
(~90)
UK-Domiciled
Operating
Companies
(~1,500)
Europe Ex-UK
Companies
(~3,700)

56.1
76.6 80.7
72.7
31.8 33.0
47.1 44.7 43.8
71.6
82.9
94.6
67.9
85.9 81.3
2004 2005 2006 2007 2008 2009 2010 2011 2012 2013 2014 2015 2016 2017 2018
Estimated UK Commercial Real Estate Annual Investment Volume(1)
USD in billions(2)
Average = 64.7
UK is a Highly Liquid And Logical CRE Market For Our Initial Entry to Europe
Historically, ~$65 billion of CRE has traded on an annual basis in the United Kingdom
8
Global
Financial
Crisis
Post-Brexit
Referendum
(1) Property types include office, shopping centers, retail, industrial, leisure and alternative / mixed(2) Assuming GBP/USD spot rate as of 4/19/19Source: Savills, CBRE, MSCI, Realty Income estimates
Investment volumes
have held steady post-
Brexit referendum
despite political and
economic uncertainty
Incumbent competition is modest:
Enterprise value of the public REIT market in the UK estimated to be approximately $115 billion -- roughly the size of the publicly traded net lease REIT universe in the US
Of the $81 billion of
CRE transaction volume
in 2018, we estimate
$6 - $8 billion of single-
tenant volume in our
core verticals

9
Sainsbury’s Sale-Leaseback HighlightsAccretive transaction establishes international growth platform with leading UK grocer
£429
million Transaction size(1)
5.3%GBP 1st-year cash
cap rate
5.8%USD-equivalent
1st-year cap
rate(2)
>200 bpsEffective 1st-year
spread to
leverage-neutral
nominal WACC
12Assets acquired
6.6%Base-case
unlevered USD
IRR
15 yearsWeighted-average
lease term
$0.04 per
shareAnnualized
leverage-neutral
AFFO accretion
(1) Excluding acquisition transaction costs of approximately £4.2 million / transaction expected to close on or around 5/22/19(2) Reflects effective 1st-year USD cap rate net of annual cash flow FX hedge

10
Sainsbury’s Sale-Leaseback: Investment Rationale Realty Income’s first international acquisition represents natural evolution and execution of strategy
Congruent with
existing investment
criteria
Accretive returns,
minimal FX risk
UK is an attractive
market with sizable
opportunity for
strategic growth
~ Tenant operates in defensive, non-discretionary industry
~ “Blue Chip” grocery operator with seasoned and highly-regarded management team
~ Proven strength through multiple economic cycles
~ 15-year triple-net leases, attractive rent growth
~ Annualized AFFO accretion of ~$0.04/sh from Sainsbury’s transaction
~ Base-case 15-year unlevered USD IRR of 6.6% is attractive given tenant, asset quality
~ ~85% of FX risk on GBP cash flows to be hedged for 15 years through currency swap
~ Limited retail real estate supply per capita, healthy market fundamentals
~ Void of large-scale, pure-play net lease institutional competition
~ Significant demand for expansion capital from UK operators
~ Estimated >$1 trillion potential sale-leaseback market opportunity
Realty Income’s sector-leading cost of capital, size and scale are competitive advantages portable to the UK

Investment Thesis
(1) Consistent Earnings Growth
(2) Predictable Business Model
(3) Track Record of TSR Outperformance

Consistent Annual Earnings Growth Since NYSE ListingPositive earnings growth(1) in 22 out of 23 years as a public company
5.1%
6.8%6.4%
6.0%
1.6%
3.2%
5.4% 5.1% 4.9%
6.0%
9.4%
3.4%
4.4%
-2.1%
0.5%
8.1%
2.5%
17.0%
6.6% 6.6%
5.1%
6.3%
4.2%
1996 1997 1998 1999 2000 2001 2002 2003 2004 2005 2006 2007 2008 2009 2010 2011 2012 2013 2014 2015 2016 2017 2018
(1) AFFO / Excludes earnings from Crest Net Lease, a subsidiary of Realty Income, as earnings do not reflect recurring business operations(2) FFO / Through 2018 / Includes all REITs currently included in MSCI REIT Index with earnings history since 2000 / Source: SNL
Historical Earnings Growth Rates (Median)
Realty Income (1): 5.1%
Current REITs (2): 3.2%
Compares favorably to REIT
median growth rates:
2008: -5.1%
2009: -6.9%
2010: -8.1%
12

✓ Annual same-store rent growth run rate of ~1.0%
✓ Long lease terms limit annual volatility
1.5%
1.1%1.3%
1.8%
1.5%1.4%1.4%
1.7%
1.4%1.5%
1.1%1.3%1.3%1.4%
1.1%0.9%
1.6%
0.4%
1.0%1.0%1.0%1.0%1.0%0.8%
1.5%
Consistency: Steady Portfolio, Solid FundamentalsFocus on quality underwriting and real estate supports predictable cash flow generation
Consistent Occupancy Levels, Never Below 96%
Steady Same-Store Rent Growth
˃ Careful underwriting at acquisition
˃ Solid retail store performance
˃ Strong underlying real estate quality
˃ Healthy tenant industries
˃ Prudent disposition activity
˃ Proactive management of rollovers
Tenets of Consistency:
13

Investment Spreads Maintain Even with Rising Interest RatesRising interest rates do not pose a significant earnings headwind to the net lease business model
0%
2%
4%
6%
8%
10%
12%
1996 1997 1998 1999 2000 2001 2002 2003 2004 2005 2006 2007 2008 2009 2010 2011 2012 2013 2014 2015 2016 2017 2018
Acquisition Cap Rate
Avg US 10Y Yield
R2 = 0.88
Acquisition cap rates highly correlated to changing interest rates…
…which contributes to strong earnings growth during periods of rising rates
5.1%6.8% 6.4% 6.0%
1.6%3.2%
5.4% 5.1% 4.9%6.0%
9.4%
3.4%4.4%
-2.1%
0.5%
8.1%
2.5%
17.0%
6.6% 6.6%5.1%
6.3%4.2%
1996 1997 1998 1999 2000 2001 2002 2003 2004 2005 2006 2007 2008 2009 2010 2011 2012 2013 2014 2015 2016 2017 2018
Annual AFFO/sh
Growth Rate(1):
(1) Excludes earnings from Crest Net Lease, a subsidiary of Realty Income, as earnings do not reflect recurring business operations14

Snapshot vs. S&P 500 REIT Peers
Tenets of Consistency:
Superior stability: Favorable occupancy, dividend growth, credit rating and total return metrics
98.3%96.6%
93.7%
91.2%
Historical Median Lowest Year-End
Portfolio Occupancy
O S&P 500 REIT Median
0%
4.6%
8%
2.9%
% of Years w/ Negative
Growth
Dividend CAGR
Dividend Growth(1)
O S&P 500 REIT Median
100%
200%
300%
400%
500%
0 10 20 30
Avg. Credit Rating (S&P/Moody’s)
BBB- / Baa3
BBB / Baa2
BBB+ / Baa1
A- / A3
A / A2
● ● S&P 500 REIT Peer
0
1
2
3
4
5
6
7
8
# of Years with TSR < -10%(1)
S&P 500 REIT Peer●●
Sources: SNL, Bloomberg | Excludes specialty REITs (i.e. infrastructure, timber, information services)(1) Since 1995. Excludes REITs with fewer years of history than Realty Income 15

Track Record of Favorable Risk-Adjusted Returns to Shareholders Since 1994 NYSE listing, Realty Income shares have outperformed benchmark indices while exhibiting lower volatility
16.9%
10.7% 10.6%9.9% 9.7%
O Equity REIT Index DJIA Nasdaq S&P 500
14.9%16.0%
18.0% 18.4%
28.6%
O DJIA S&P 500 Equity REIT
Index
Nasdaq
Standard Deviation of
Annual Returns Since 1994
Compound Average Annual Total
Shareholder Return Since 1994
Standard deviation of total returns measures deviation from average annual total returns since 1994 16

-10%
-5%
0%
5%
10%
15%
20%
25%
30%
35%
0.00.30.50.81.01.31.51.82.02.3
Tota
l R
etu
rn C
AG
R
Beta
Attractive Risk/Reward vs. S&P 500 CompaniesHigher returns and lower volatility than majority of S&P 500 companies since 1994 NYSE listing
Realty Income return per
unit of market risk in the
98th percentile of all S&P
500 companies(1):
Beta: 0.39
Return: 16.4%
(1) n=316 / Excludes companies without trading histories dating to 1994 Beta measured using monthly frequency
Source: Bloomberg
Realty Income return per unit of market risk is in the 98th
percentile of all S&P 500 companies(1)::
Return: 16.9%Beta: 0.38
17

O
JNJ
WMT
XOM
AAPL
PG
VZ
REITs
MSFT
INTC
S&P 500
JPM
BAC
0%
5%
10%
15%
20%
25%
0.00.20.40.60.81.01.21.41.61.82.0
Tota
l R
etu
rn C
AG
R
Beta
Attractive Risk/Reward vs. Blue Chip S&P 500 Equities
Realty Income: Greater
return per unit of
market risk than each
of top 10 largest S&P
constituents(1) since
1994 NYSE listing
(1) Excludes companies without trading histories since 10/18/1994 / Constituents plotted include S&P 500 and FTSE NAREIT US Equity REIT Index
Beta measured using monthly frequency
Source: Bloomberg
Historically, more return per unit of risk vs. the 10 largest S&P 500 constituents
18

Attractive Risk/Reward vs. Blue Chip REITsHistorically, more return per unit of risk vs. S&P 500 REITs
O
PSA
ESS
WELL
FRT
SPGAVB
VTR
EQR
HCP
REG
VNOAIV
KIM
MAC
WY
HST
UDR
MAA
0%
2%
4%
6%
8%
10%
12%
14%
16%
18%
20%
0.00.20.40.60.81.01.21.41.61.82.0
Tota
l R
etu
rn C
AG
R
Beta
(1) Excludes companies without trading histories since 10/18/1994
Beta measured using monthly frequency
Source: Bloomberg
Realty Income: Greater
return per unit of
market risk than S&P
500 REITs(1) since
1994 NYSE listing
19

PORTFOLIO DIVERSIFICATION

Portfolio Diversification: TenantDiverse tenant roster, investment grade concentration reduces overall portfolio risk
21
Orange represents investment grade tenants that are defined as tenants with a credit rating of Baa3/BBB- or higher from one of the three major rating agencies (Moody’s/S&P/Fitch).
51% of our annualized rental revenue is generated from properties leased to investment grade tenants, including approximately 8% from properties leased to subsidiaries of
investment grade companies.
TOP 20
TENANTS REPRESENT
54%
Of annualized rental revenue
11Different industries
Investment grade rated tenants
6.1%
5.4%
4.7%
4.0%
3.6%
3.4%
3.2%
2.7%
2.4%
2.3%
2.0%
1.9%
1.8%
1.8%
1.7%
1.7%
1.6%
1.5%
1.3%
1.2%
12

Service-Oriented
Non-Discretionary
N/A (Non-Retail Exposure
Portfolio Diversification: IndustryExposure to 48 industries enhances predictability of cash flow (See Appendix for Industry Theses)
Exposure to defensive industries:96% of total portfolio rent is protected against retail e-commerce threats and economic downturns
Non-Discretionary
Service-Oriented
Non-Discretionary, Low Price Point
Low Price Point
❶Convenience Stores: 12.2%Service-oriented
❷ Drug Stores: 9.8%Non-discretionary
❹ Dollar Stores : 7.4%Non-discretionary, Low price point
❸ Health & Fitness: 7.7%Non-discretionary, Service-oriented
❺Quick-Service Restaurants: 6.4%Low price point, Service-oriented
❻ Theaters: 5.2%Low price point, Service-oriented
❼ Grocery: 4.8%Non-discretionary
22
78% of Total Rent:
Retail with at least one of the following components:
Non-Discretionary(Low cash flow volatility)
Low Price-Point(Counter-cyclical)
Service-Oriented(E-commerce resilient)
18%Non-retail
(E-commerce resilient)4% Other

Portfolio Diversification: Property TypeCore exposure in retail and industrial single-tenant freestanding net lease properties
23
RETAIL (82.4%)
Number of Properties: 5,702
Average Leasable Square Feet: 11,400
Percentage of Rental Revenue
from Investment Grade Tenants: 46.3%
OFFICE (4.0%)
Number of Properties: 42
Average Leasable Square Feet: 73,910
Percentage of Rental Revenue
from Investment Grade Tenants: 86.1%
INDUSTRIAL (11.6%)
Number of Properties: 117
Average Leasable Square Feet: 229,000
Percentage of Rental Revenue
from Investment Grade Tenants: 78.3%
AGRICULTURE (2.0%)
Number of Properties: 15
Average Leasable Square Feet: 12,300
Percentage of Rental Revenue
from Investment Grade Tenants: -

Portfolio Diversification: GeographyBalanced presence in 49 states and Puerto Rico
<1
<1
<1
<1
<1
<1
<1
2.1
<1
1.7
<1
<1
<1
1.6
1.6
3.1
1.3
2.6
<1
1.6
1.6 1.8 4.1
2.6
3.0
3.6
1.92.1
2.7
1.4
3.3
<13.1
<1
Puerto Rico <1
<1<1<1
1.1
<1
<1
1.7
<1
1.5
8.7
11.6
6.0
4.9
4.6
5.5
Texas 11.6%
California 8.7%
Illinois 6.0%
Florida 5.5%
Ohio 4.9%
New York 4.6%
Top 6 States
% of Rental Revenue
Figures represents percentage of rental revenue
24

DEFENSIVE RETAIL PORTFOLIO

Low Price Point
Service / Experiential
Top 20 Tenants Highly Insulated from Changing Consumer Behavior
All top 20 tenants fall into at least one category (Service, Non-Discretionary, Low Price Point Retail or Non-Retail)
Non-Retail
Walmart represented by Neighborhood Markets and Sam’s Club 26
Non-Discretionary

Total % of Rent - Top 15 Tenants 47.0%
Investment Grade % - Top 15 Tenants 32.1%
#1 Industry – Convenience Stores 12.2%
#2 Industry – Drug Stores 9.8%
Total % of Rent - Top 15 Tenants 53.0%
Investment Grade % - Top 15 Tenants 3.2%
#1 Industry – Restaurants 21.3%
#2 Industry – Convenience Stores 17.0%
Top Tenant Exposure: 2009 vs. TodayLess cyclicality and superior credit and diversification vs. prior downturn
27
TOP 15 TENANTS AS OF YE 2009 TOP 15 TENANTS AS OF 1Q 2019
Tenant Industry % of Rent
Hometown Buffet Casual Dining 6.0%
Kerasotes Showplace
TheatresTheatres 5.3%
L.A. Fitness Health & Fitness 5.3%
The Pantry Convenience Stores 4.3%
Friendly’s Casual Dining 4.1%
Rite Aid Drug Stores 3.4%
La Petite Academy Child Care 3.3%
TBC Corporation Auto Tire Services 3.2%
Boston Market QSR 3.1%
Couche-Tard / Circle K Convenience Stores 3.0%
NPC / Pizza Hut QSR 2.6%
FreedomRoads / Camping
WorldSporting Goods 2.6%
KinderCare Child Care 2.5%
Regal Cinemas Theatres 2.3%
Sports Authority Sporting Goods 2.0%
Tenant Industry % of Rent
Walgreens Drug Stores 6.1%
7-Eleven Convenience Stores 5.4%
FedEx (Non-Retail) Transportation 4.7%
Dollar General Dollar Stores 4.0%
LA Fitness Health & Fitness 3.6%
Dollar Tree / Family Dollar Dollar Stores 3.4%
AMC Theaters Theaters 3.2%
Walmart / Sam’s Club Grocery / Wholesale 2.7%
Life Time Fitness Health & Fitness 2.4%
Circle K / Couche-Tard Convenience Stores 2.3%
BJ’s Wholesale Clubs Wholesale Clubs 2.0%
Treasury Wine Estates
(Non-Retail)Beverages 1.9%
CVS Pharmacy Pharmacy 1.8%
Regal Cinemas Theaters 1.8%
Kroger Grocery 1.7%
Bold tenants represent investment-grade rated credit

Differentiated Business Model from “Traditional” Retail REITsLease structure and growth drivers support predictable revenue stream relative to other forms of retail real estate
Initial Length of Lease 15+ Years < 10 Years
Remaining Avg Term ~ 10 Years ~ 5-7 Years
Responsibility for Property Expenses Tenant Landlord
Gross Margin > 98% ~ 75%
Volatility of Rental Revenue Low Modest / High
Maintenance Capital Expenditures Low Modest / High
Reliance on Anchor Tenant(s) None High
Average Retail Property Size / Fungibility 12k sf / High 150k–850k sf / Low
Target Markets Many Few
External Acquisition Opportunities High Low
Institutional Buyer Competition Modest High
Ample external growth opportunities
Unique “net lease” structure drives lower cash flow volatility Shopping Centers
and Malls
Shopping Centers
and Malls
28
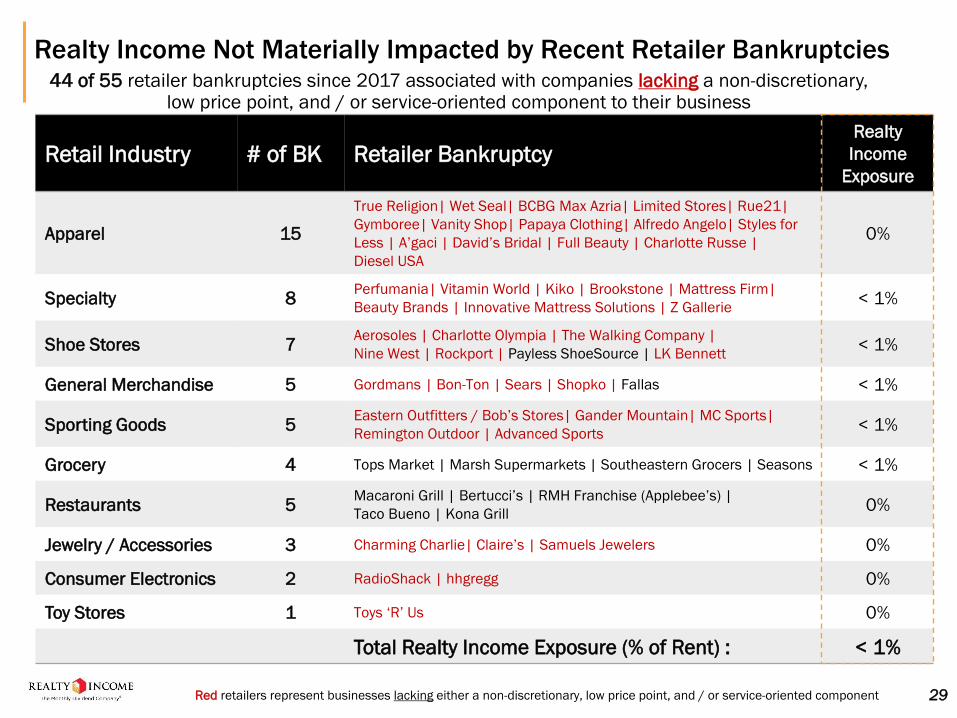
Realty Income Not Materially Impacted by Recent Retailer Bankruptcies
Retail Industry # of BK Retailer BankruptcyRealty
Income
Exposure
Apparel 15
True Religion| Wet Seal| BCBG Max Azria| Limited Stores| Rue21|
Gymboree| Vanity Shop| Papaya Clothing| Alfredo Angelo| Styles for
Less | A’gaci | David’s Bridal | Full Beauty | Charlotte Russe |
Diesel USA
0%
Specialty 8Perfumania| Vitamin World | Kiko | Brookstone | Mattress Firm|
Beauty Brands | Innovative Mattress Solutions | Z Gallerie< 1%
Shoe Stores 7Aerosoles | Charlotte Olympia | The Walking Company |
Nine West | Rockport | Payless ShoeSource | LK Bennett< 1%
General Merchandise 5 Gordmans | Bon-Ton | Sears | Shopko | Fallas < 1%
Sporting Goods 5Eastern Outfitters / Bob’s Stores| Gander Mountain| MC Sports|
Remington Outdoor | Advanced Sports< 1%
Grocery 4 Tops Market | Marsh Supermarkets | Southeastern Grocers | Seasons < 1%
Restaurants 5Macaroni Grill | Bertucci’s | RMH Franchise (Applebee’s) |
Taco Bueno | Kona Grill0%
Jewelry / Accessories 3 Charming Charlie| Claire’s | Samuels Jewelers 0%
Consumer Electronics 2 RadioShack | hhgregg 0%
Toy Stores 1 Toys ‘R’ Us 0%
Total Realty Income Exposure (% of Rent) : < 1%
44 of 55 retailer bankruptcies since 2017 associated with companies lacking a non-discretionary, low price point, and / or service-oriented component to their business
Red retailers represent businesses lacking either a non-discretionary, low price point, and / or service-oriented component 29

ASSET MANAGEMENT &
REAL ESTATE OPERATIONS

Active Real Estate Management: Re-leasing ExperienceSince 1996, Realty Income has achieved 100.3% recapture of prior rent on re-leasing activity
Recapture vs. Prior Rent: (All Re-Leasing Activity)
102.4%
95.6%
95.9%
2013 - Present
2006 - 2012
1996 - 2005
2,975Lease Expirations since 1996
2,586Re-Leased at 100.3% rent recapture(1)
389Sold and proceeds reinvested into higher
quality assets
(1) Reflects cash rent recapture inclusive of tenant improvement spend (immaterial)
31

Actively-Managed Real Estate PortfolioProven track record of value creation, cash flow preservation and risk mitigation
✓ Largest department in the company
✓ Distinct management verticals
✓ Retail
✓ Non-Retail
✓ Leasing & dispositions
✓ Maximizing value of real estate
✓ Strategic and opportunistic dispositions
✓ Value-creating development
✓ Risk mitigation
Healthy Leasing Results
6.9%7.6% 7.3% 7.1%
11.5%11.6% 12.1%
8.5%9.9%
8.1%
2014 2015 2016 2017 2018
Cap Rate on Occupied Dispositions
Unlevered IRR on All Dispositions
32
93.0%
% Re-leased to Existing Tenants
% Re-leased to New Tenants
Blended rent recapture
rate of 104.7% on
expired leases
YTD 2019
Renewal / New Lease Split
Favorable Returns on Dispositions
Asset Management &
Real Estate Operations

INVESTMENT STRATEGY

Investment Strategy: Key ConsiderationsCost of capital advantage, size, track record represent competitive advantage
34
COMPETITIVE ADVANTAGES VS. NET LEASE PEERS
Supports investment selectivity
Drives faster earnings growth (wider margins)
Critical in industry reliant on external growth
Ability to buy “wholesale” (at a discount) without creating tenant concentration issues
Access to liquidity ($3 billion revolver)
Relationships developed since 1969
1
2
3
1
2
3
SIZE AND TRACK RECORDLOWEST COST OF CAPITAL

Investment Strategy: Aim to Exceed Long-Term WACCWACC viewpoint balances near-term earnings per share growth with long-term value accretion
35
Cost of capital information uses illustrative assumptions only (as of 4/30/2019)(1) 7% FCF weight assumes current acquisition guidance ($2.25 billion)
Long-term Weighted Average Cost of Capital “Nominal” 1st-Year Weighted Average Cost of Capital
• Drives investment decision-
making at the property level
• Considers required “growth”
component of equity returns
• Long-term WACC is the hurdle
rate (no spread required) for
acquisitions
• Focus on higher long-term
IRR discourages risk-taking
• Used to measure initial
(year one) earnings accretion
• Higher stock price (lower cost)
supports faster growth
• Spread on short-term WACC
required to generate accretion
• Unwilling to sacrifice quality
to generate wider spreads
Key Assumptions & Calculation – Nominal 1st-Year WACC
58% Equity: AFFO Yield (Midpoint of 2019 guidance) 4.7%
7% Free Cash Flow(1): Free cash flow reinvested 0%
35% Debt: 10-year, fixed-rate unsecured 3.6%
Nominal 1st-Year WACC 4.0%
Key Assumptions & Calculation – Long-Term Cost of Equity
Historical Beta (vs. S&P 500) 0.38
Assumed long-term 10-year U.S. yield 4.0%
Equity market risk premium 4.7%
Long-Term Cost of Equity (CAPM methodology) 5.8%
Dividend yield 3.8%
Compound average annual dividend growth since 1994 listing 4.6%
Long-Term Cost of Equity (Yield + Growth methodology) 8.4%
Long-Term Cost of Equity (Average of two methodologies) 7.1%
Key Assumptions & Calculation – Long-Term WACC
65% Weight: Long-Term cost of equity 7.1%
35% Weight: Cost of debt (10-year, fixed-rate unsecured) 3.6%
Long-Term WACC 5.9%
LOW NOMINAL WACC LONG-TERM WACC
supports ability to spread invest with high-quality acquisitions
considers growth requirements of equity and supports focus on
residual value of acquisitions

1.5%
1.8%
2.1%
2.4%
2.7%
2.9%
3.2%
3.5%
3.8%
4.1%
4.4%
4.7%
5.0%
5.3%
0%
1%
2%
3%
4%
5%
6%0 b
ps
25 b
ps
50 b
ps
75 b
ps
100 b
ps
125 b
ps
150 b
ps
175 b
ps
200 b
ps
225 b
ps
250 b
ps
275 b
ps
300 b
ps
325 b
ps
An
nu
alize
d A
FFO
/sh
Gro
wth
Investment Spread vs. Nominal 1st-Year WACC
Lower cost of capital
Wider spreads
Higher growth
rate
Higher stock price
Investment Strategy: Benefits of Low Cost of CapitalLow cost of capital is the most important competitive advantage in the net lease industry
Assumptions and Footnotes:
1) Assumes $2.25 billion in acquisition volume
2) Assumes ratable timing of acquisitions over next 12 months
3) Growth based on TTM AFFO/sh ($3.22/sh)
4) Growth rates include organic same-store rent growth of ~1.0% (unlevered)
Cost of capital information uses illustrative assumptions only
Reduces need to pursue lower-
quality, higher-yielding investments
to generate growth
36

5.0%
5.5%
6.0%
6.5%
7.0%
7.5%
8.0%
4.0
0%
4.2
5%
4.5
0%
4.7
5%
5.0
0%
5.2
5%
5.5
0%
5.7
5%
6.0
0%
6.2
5%
Acq
uis
itio
n C
ap
Ra
te t
o A
ch
ieve
15
0 b
ps S
pre
ad
s
Nominal 1st-Year WACC
Lower cost of capital allows Realty
Income to invest in higher quality
opportunities to derive the same spread
“High Quality” Investment Characteristics (lower cap rates):
• At or below-market rents
• Strong credit / proven sponsors & tenants
• Above-average rent coverage
• Flexible alternative use
• Long lease terms
• Stable industries
Investment Strategy: Utilizing Low Cost of Capital AdvantageLow cost of capital allows Realty Income to acquire the highest quality assets in the net lease industry
Cost of capital information uses illustrative assumptions only 37
“High Yield” Investment Characteristics (higher cap rates):
• Above-market rents / financially-engineered cap rates
• Poor credit or limited credit availability and track record
• Thin industry-specific rent coverage
• Poor real estate (low residual value)
• Short lease terms
• Volatile industries
Higher cost of capital forces
companies to invest in riskier
investment opportunities to
derive 150 bps of spread

Investment Strategy: The Importance of Market RentsRealty Income avoids lease structures with above-market rents, which can inflate initial cap rates
38
Illustrative Sale-Leaseback ExampleAssumptions
Annual EBITDAR (000s) $8,500 Replacement cost (psf) $200
Total square footage (000s) 175 Market rent (psf) $15
Assuming identical real estate portfolio, consider two different lease structure scenarios….
Buyer and Seller Motivations:
Higher Risk & Cap Rate Lower Risk & Cap Rate
1. Maximize proceeds for seller 1. Maximize EBITDAR rent coverage
2. Maximize cap rate for buyer 2. Match purchase price w/ replacement cost
Implied Sale Price (000s) $42,000 $35,000
Implied Cap Rate 7.5% 6.5%
Implied Rent (000s) $3,150 $2,267
Implied Rent (psf) $18.00 $12.95
Premium/(Discount) to Market Rent 20% (14%)
Implied EBITDAR rent coverage 2.7x 3.75x
Implied premium to replacement cost 20% 0%
Lower cap rates often imply:
✓ Lower purchase price
✓ Lower risk
✓ Higher residual value
✓ Higher IRR
• Above-market rents
• Lower rent coverage
• Lower residual value
• Higher default risk
• Lower long-term IRR
• Below-market rents
• Higher rent coverage
• Higher residual value
• Lower default risk
• Higher long-term IRRResults
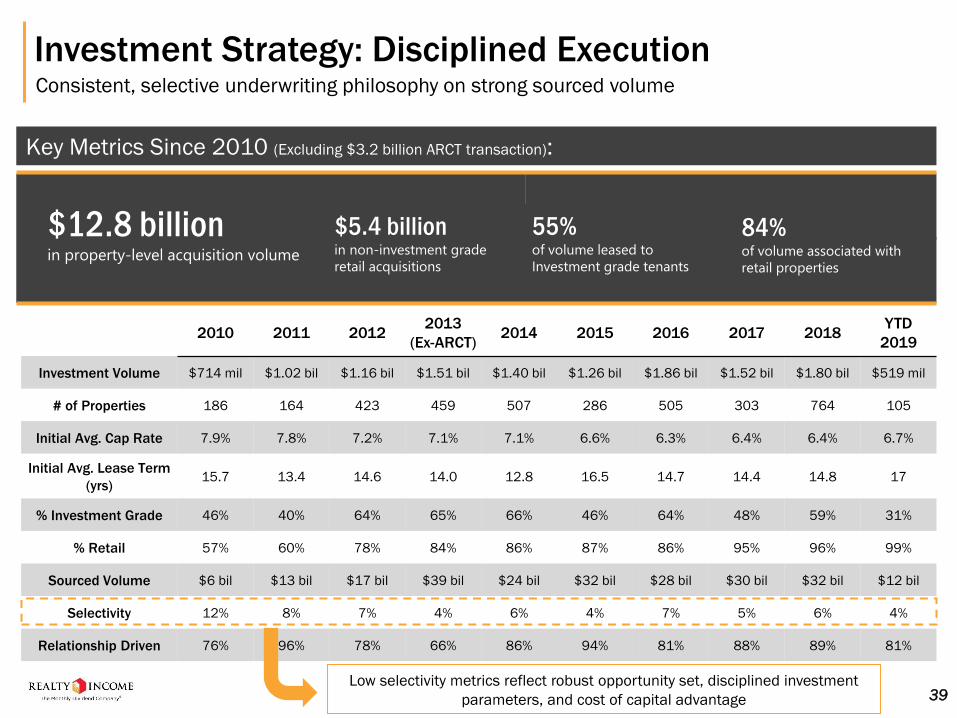
$12.8 billionin property-level acquisition volume
$5.4 billionin non-investment grade
retail acquisitions
84%of volume associated with
retail properties
55%of volume leased to
Investment grade tenants
Investment Strategy: Disciplined ExecutionConsistent, selective underwriting philosophy on strong sourced volume
2010 2011 20122013
(Ex-ARCT)2014 2015 2016 2017 2018
YTD
2019
Investment Volume $714 mil $1.02 bil $1.16 bil $1.51 bil $1.40 bil $1.26 bil $1.86 bil $1.52 bil $1.80 bil $519 mil
# of Properties 186 164 423 459 507 286 505 303 764 105
Initial Avg. Cap Rate 7.9% 7.8% 7.2% 7.1% 7.1% 6.6% 6.3% 6.4% 6.4% 6.7%
Initial Avg. Lease Term
(yrs)15.7 13.4 14.6 14.0 12.8 16.5 14.7 14.4 14.8 17
% Investment Grade 46% 40% 64% 65% 66% 46% 64% 48% 59% 31%
% Retail 57% 60% 78% 84% 86% 87% 86% 95% 96% 99%
Sourced Volume $6 bil $13 bil $17 bil $39 bil $24 bil $32 bil $28 bil $30 bil $32 bil $12 bil
Selectivity 12% 8% 7% 4% 6% 4% 7% 5% 6% 4%
Relationship Driven 76% 96% 78% 66% 86% 94% 81% 88% 89% 81%
Key Metrics Since 2010 (Excluding $3.2 billion ARCT transaction):
39Low selectivity metrics reflect robust opportunity set, disciplined investment
parameters, and cost of capital advantage

CAPITAL STRUCTURE &SCALABILITY

Conservative Capital StructureModest leverage, low cost of capital, ample liquidity provides financial flexibility
Common Stock: 76%
Debt: 24%
Common Stock: $22.4 billion – 76%
• Shares/Units outstanding – 304 million
Debt: $7.0 billion – 24%
• Unsecured Notes/Bonds - $5.4 billion
• Unsecured Term Loans - $500 million
• Mortgages - $297 million
• Revolving Credit Facility - $838 million
Total Capitalization: $29.4 billion
Unsecured Debt Ratings: Moody’s A3 | S&P A- | Fitch BBB+
41Numbers may not foot due to rounding

Well-Laddered Debt Maturity ScheduleLimited re-financing and variable interest rate risk throughout debt maturity schedule
Key Metrics
• 88% fixed rate debt
• Weighted average rate
of 3.94% on debt(1)
• Staggered, 8.5-year weighted
average term for notes/bonds
• Ample liquidity with $2.16 bil
available on revolver (L+77.5bps)
• Free cash flow of ~$170mm/yr
4.5%
3.2% 5.7%
3.4%
3.9%
3.9%
3.9%
4.1%3.0%
3.7%
5.0%
$0
$200
$400
$600
$800
$1,000
$1,200
$1,400
$1,600
$1,800
2019 2020 2021 2022 2023 2024 2025 2026 2027 2028 2029+
Unsecured Notes Mortgages Revolver Term Loan
Weighted average interest rate(1)
Deb
t M
atu
riti
es (
$m
m)
(1) Weighted average interest rates reflect variable-
to-fixed interest rate swaps on term loans and
revolver interest rate as of 3/31/2019
42

Scalability as a Competitive AdvantageLeaders in the net lease industry in efficiency and ability to buy in bulk
5.8%
4.5%
G&A as % of Rental Revenue(1)
(1) G&A excludes $18.7 million severance to former CEO paid in 4Q18 | percentage of rental revenue calculation excludes tenant reimbursements
64 bps
38 bps
G&A as % of Gross RE Book Value (bps)
92.4%94.2%
Adjusted EBITDAre Margin
Larger Size Drives Superior Overhead Efficiency
43
Larger Size Provides Growth Optionality
$100 $200 $300 $400 $500 $1,000
$200 3% 6% 9% 12% 14% 25%
$400 2% 3% 5% 6% 8% 14%
$600 1% 2% 3% 4% 5% 10%
$800 1% 2% 2% 3% 4% 8%
$1,000 1% 1% 2% 3% 3% 6%
$1,300 1% 1% 2% 2% 2% 5%
Transaction Size & Impact(2) to Rent Concentration
Current
Rent
Size allows Realty Income to pursue large sale-
leaseback transactions without compromising prudent
tenant and industry diversification metrics
(2) Assumes 6.5% cap rate
in millions
Current Net Lease Peer Median: 9.0%
Current Net Lease Peer Median: 88.5%
Current Net Lease Peer Median: 77 bps

DEPENDABLE DIVIDENDS
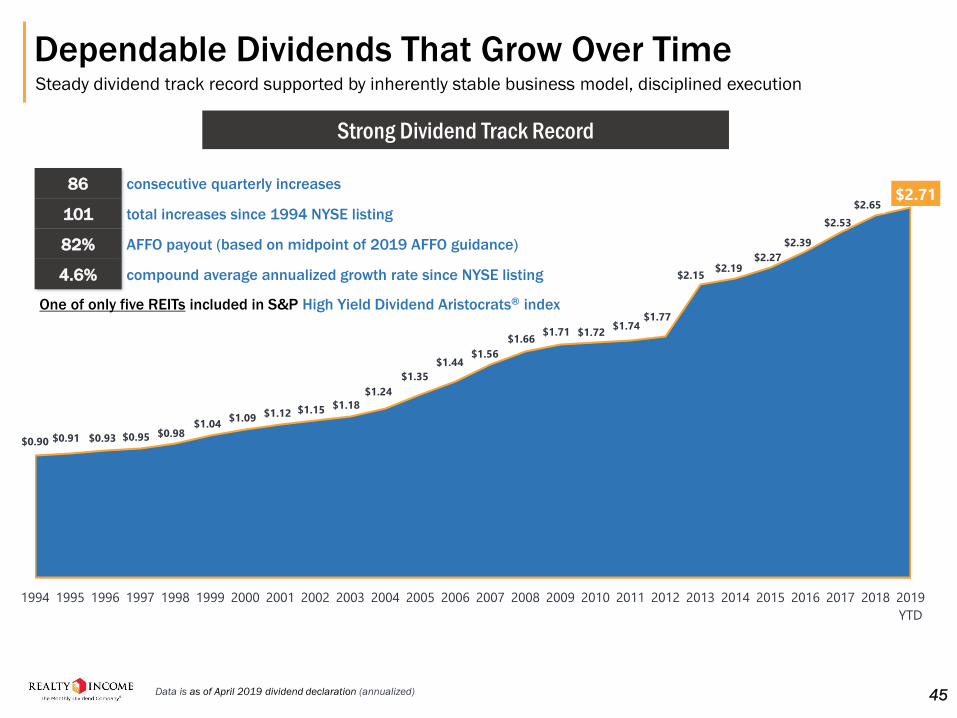
Dependable Dividends That Grow Over TimeSteady dividend track record supported by inherently stable business model, disciplined execution
$0.90 $0.91 $0.93 $0.95 $0.98 $1.04
$1.09 $1.12 $1.15 $1.18
$1.24
$1.35
$1.44 $1.56
$1.66 $1.71 $1.72
$1.74 $1.77
$2.15 $2.19
$2.27
$2.39
$2.53
$2.65 $2.71
1994 1995 1996 1997 1998 1999 2000 2001 2002 2003 2004 2005 2006 2007 2008 2009 2010 2011 2012 2013 2014 2015 2016 2017 2018 2019
YTD
Strong Dividend Track Record
86 consecutive quarterly increases
101 total increases since 1994 NYSE listing
82% AFFO payout (based on midpoint of 2019 AFFO guidance)
4.6% compound average annualized growth rate since NYSE listing
One of only five REITs included in S&P High Yield Dividend Aristocrats® index
Data is as of April 2019 dividend declaration (annualized) 45

Summary
˃ Long term-focused business strategy
˃ Diversified and actively managed portfolio
˃ Proven and disciplined relationship-driven acquisition strategy
˃ Conservative capital structure able to withstand economic volatility
˃ Precedent of outperforming S&P 500 and REITs since 1994 listing
˃ Attractive risk/reward vs. other REITs and blue chip equities
˃ Dependable monthly dividends with long track record of growth
46
APPENDIX
47

SUPERIOR PERFORMANCE DURING GREAT RECESSION

14.7%
-28.3%
2007-2009 Total Return
49
Superior Earnings Growth and TSR During Great Recession1 of 2 S&P 500 REITs with positive earnings growth, dividend growth, and TSR during Great Recession
9.0%
-20.6%
2007-2009 Dividend Growth
Realty Income S&P 500 REITs
2.1%
-2.3%
2007-2009 Earnings CAGR(1)
(1) FFO/sh or operating FFO/sh (if available) used as proxy for earnings growth(2) Median of S&P 500 REITs, excludes non-property REITs AMT, CCI, WY, EQIX, IRM, PCL
All data is for the period between 1/1/2007 and 12/31/2009
Source: Bloomberg, SNL
(2)
1 of only 11 S&P 500 REITs with
positive earnings growth
1 of only 9 S&P 500 REITs without a
dividend cut
1 of only 5 S&P 500 REITs with
positive total shareholder return

-45%
-30%
-15%
0%
15%
30%
45%
Jan-07 Jun-07 Nov-07 Apr-08 Sep-08 Feb-09 Jul-09 Dec-09
Historical Premium / (Discount) to NAV
Realty Income S&P 500 REITs
50
NAV Premium Persisted Through Great RecessionCost of capital advantage (measured by premium to NAV) remained stable during recession
(1) Median premium / (discount) of S&P 500 REITs, excludes non-property REITs AMT, CCI, WY, EQIX, IRM, PCL
Source: SNL
Realty Income’s median NAV premium was 10% during the downturn
(1 of only 6 S&P 500 REITs trading at a premium to NAV during this time period)
(1)

5.7x
5.2x
3.1x
0.7x
S&P 500 REIT
Median
Realty Income
Leverage(1) Ratio Range (2007-2009)
Min Leverage Spread
51
Stable Leverage and Coverage Ratios During DownturnLower credit metric volatility during Great Recession relative to other blue-chip REITs
5.9x
8.8x
Max Leverage
(1) Calculated using year-end debt and preferred equity for leverage, and annual EBITDA(2) Median of maximum and minimum ratios of S&P 500 REITs, excludes non-property REITs AMT, CCI, WY, EQIX, IRM, PCL
Source: SNL
(2)
2.2x
2.5x
0.9x
0.5x
S&P 500 REIT
Median
Realty Income
Fixed Charge Coverage Ratio Range (2007-2009)
Min FCCR Spread Max FCCR
(2)
3.0x
3.1x
Tighter metric
ranges reflect:
1) Inherently stable net
lease business model
2) Disciplined capital
allocation
3) Responsible balance
sheet management

52
Superior Relative Volatility Metrics vs. A-Rated REITs During Recession2007 – 2009 relative rankings
0.3% 0.3% 0.4%
7.4%
0.1x 0%
0.2%0.7%
3.1%
3.7%
4.0%
4.2%
9.7%
0.5%
1.1%
1.4%
1.7%
1.7%
9.4%
0.6%
0.6%
3.8%
4.3%
5.7%
9.7%
31.9%
0.8%
1.3%
2.0%
2.2%
20.3%
0.3x
0.5x
2.2x
1.5x
2.2x
3.3x
2.2%
2.0%
1.2%
1.5%
2.8%
4.9%
0.3%
0.3%
0.7%
0.1%
3.4%
N/A(3)
Rental Revenue(1) Gross Margin(1) EBITDA(1) EBITDA Margin(1) Debt/EBITDA(2) Unsecured/Total Debt(1) Occupancy Rate(1)
Mo
re V
ola
tile
L
ess V
ola
tile 1
2
3
4
5
6
7
Realty Income; Other colored ovals represent REITs that currently have at least two A-/A3 credit ratings or better
(1) Downside Volatility calculated as the standard deviation around zero of quarterly percentage changes in each metric shown, where positive changes are replaced with zero(2) Upside Volatility calculated as the standard deviation around zero of quarterly percentage changes, where negative changes are replaced with zero(3) Company did not report consolidated quarterly portfolio occupancy during 2007-2009
Source: SNL
Rank

TOP INDUSTRIES OVERVIEW

Convenience Stores (12.2% of Rent)Quality real estate locations with strong store-level performance
Industry Considerations
(1) Strong performance independent of gas sales: ~70% of
inside sales are generated by customers not buying gas(1)
(2) Larger-format stores provide stability: Larger format stores
(average size ~3,200 sf) allow for increased food options
which carry higher margins
(3) Electric vehicles’ market penetration presents minimal risk
• EVs = Only 1% of all vehicles in US and 2% of new sales(2)
• Cost, limited infrastructure/range present headwinds
$31.1 $45.8
$63.3 $78.1 $15.7
$23.5
$26.0
$31.9
2001 2006 2011 2016
Convenience Store Gross Profit(3)
(in billions)Fuel (4.8% CAGR since 2001)
Merchandise Sales (6.3% CAGR since 2001)
70% of gross profit generated from inside sales which is generally not impacted by gasoline demand
(1) Realty Income estimates based on industry component data(2) US Energy Information Administration, InsideEVs(3) National Association of Convenience Stores
54

Drug Stores (9.8% of Rent)Industry tailwinds, high barriers to entry, key real estate presence
Industry Considerations
(1) Consumer preference skews towards physical drug stores:
Prescription volumes have shifted away from mail order
(2) Positive brick-and-mortar fundamentals: 23 of 24 quarters
of positive pharmacy SS sales growth for Walgreens(2)
(3) High barriers to entry: Difficult for new entrants to achieve
necessary scale and PBM partnerships to compete on price
(4) Bundled service partnerships and vertical integration
among incumbents insulates industry from outside threats
(5) Real estate presence matters: Estimated 80% of U.S.
population lives within 5-mile radius of Walgreens or CVS(2)
21% 21%12%
3%
(33%)Chain
Drugstores
Mass
Merchants
Supermarkets Independent
Pharmacies
Pharmacies
Δ in 30-day Prescriptions by Pharmacy Format
(2012 – 2017)(1)
(1) Source: Pembroke Consulting(2) Source: Company Documents
2.0%
6.4%
7.2%
5.8%
6.3%
7.8%
8.1%
9.7%
9.1% 9.3%
9.3%
3.7%
6.0%
5.0%
2.0%
4.2%
5.8%
5.6%
7.4%
5.1%
0.0%
1.3%
2.8%1.9%
3Q
13
4Q
13
1Q
14
2Q
14
3Q
14
4Q
14
1Q
15
2Q
15
3Q
15
4Q
15
1Q
16
2Q
16
3Q
16
4Q
16
1Q
17
2Q
17
3Q
17
4Q
17
1Q
18
2Q
18
3Q
18
4Q
18
1Q
19
2Q
19
Walgreens: 23 of 24 Quarters of Positive
Same-Store Pharmacy Sales Growth(2)
55

Drug Stores: Challenges Facing E-Commerce DisruptorsPharmaceutical supply chain carries significant barriers-to-entry
56
50%
72%90%
Drug Stores Pharmacy Benefit Managers Wholesalers
Combined Market Share of Top 3 Incumbents(1)
Source: IQVIA, Pembroke Consulting, RBC Capital Markets(1) Drug store market share by Rx dispensed
PBM market share by total equivalent Rx claims managed
Wholesale market share by drug distribution and related revenues
23.6%25.9%
28.4% 29.9%34.0%
2013 2014 2015 2016 2021E
Prescription Mix with $0 Copay
+ Heavily concentrated market share
+ Efficient supply chain & logistics
+ Captive pricing model
+ 30% of the market has no out-of-
pocket responsibility, thereby limiting
the value proposition of an
E-commerce operator
21%33%
47%
2012 2017 2022E
Specialty Drugs Are a Growing Component of the Market+ High-margin specialty drugs (i.e.
oncology, hormonal therapy, immune
deficiencies, etc.) are heavily regulated
+ Network distribution is highly
concentrated with the top PBMs

Health & Fitness (7.7% of Rent)E-commerce resilient supported by favorable demographic trends
Industry Considerations
(1) Favorable consumer trends and demographic tailwinds:
Growing market as consumers increasingly value health / Baby
Boomer age group has the highest attendance frequency
(2) E-Commerce resilient: Service-oriented business model
makes the core real estate essential to operations
(3) Attractive margin of safety, top operators: Average CFC of
portfolio(1) allows for 40% sales drop to breakeven. Top
exposure is with #1 operator (L.A. Fitness) and premium
provider that performed well during recession (Life Time
Fitness)
Illustrative Gym Rent Coverage Sensitivity Life Time Fitness: Same-Center Revenue Growth Thru Downturn(2)
7.7% 7.3%6.1%
2.8%
(3.1%)
5.0% 5.1%4.3% 4.0%
2005 2006 2007 2008 2009 2010 2011 2012 2013
For stores open 13 months or longer
Modest revenue volatility during
economic downturns provides
ample margin of safety to landlord
57(1) Average CFC of portfolio based on locations that report sales(2) Life Time Fitness 10-K

Dollar Stores (7.4% of Rent)Counter-cyclical protection and E-commerce resilient
Industry Considerations
(1) Consistent long-term performance: 29 and 13 consecutive
years of positive same-store sales growth for Dollar General and
Dollar Tree / Family Dollar, respectively
(2) E-commerce resilient:
• 75% of US population lives within 5 miles of a Dollar General
• Average basket size is $11 - $12
• Dollar store consumers primarily pay with cash
(3) Well-performing locations: Average CFC of dollar store
portfolio is above total portfolio average
0.9%
7.3%
5.7%
4.0%
3.2%
2.0%
3.3%
2.1%
9.0%
9.5%
4.9%
6.0%
4.7%
3.3%
2.8%2.8%
0.9%
2.7% 3.2%
20
00
20
01
20
02
20
03
20
04
20
05
20
06
20
07
20
08
20
09
20
10
20
11
20
12
20
13
20
14
20
15
20
16
20
17
20
18
Dollar General: 29 Consecutive Years of Positive
Same-Store Sales Growth
5.7%
0.1%
1.0%
2.9%
0.5%
-0.8%
4.6%
2.7%
4.1%
7.2%
6.3%6.0%
3.4%
2.4%
4.3%
2.1%1.8% 1.9%
1.7%
20
00
20
01
20
02
20
03
20
04
20
05
20
06
20
07
20
08
20
09
20
10
20
11
20
12
20
13
20
14
20
15
20
16
20
17
20
18
Dollar Tree / Family Dollar: 13 Consecutive Years
of Positive Same-Store Sales Growth
Recession
Counter-cyclical sales growth trends supports portfolio during recessionary periods
Source: Company Filings 58

Quick-Service Restaurants (6.4% of Rent)High-quality real estate, reliable sales growth
Industry Considerations
(1) Consistent demand: Approximately 75 million Americans
eat fast food every day(1) / positive trend of same-store sales
growth supported by value-seeking consumers
(2) Fungibility of real estate: Positive re-leasing results on QSR
locations due to convenience of real estate location and
modest space footprint
(3) Less volatility than higher price point concepts: Weakness
during economic downturns limited due to “trade down” effect
from casual dining consumers
0.2%
-3.0%
1.1%
5.1%
3.1%
6.3%
2.3%
0.4%
0.7%
-0.4%
-6.6%
2.2%3.3%
1.6%
2.3%
-0.5%-2.0%
1.7%
QSR SSS Growth
Casual Dining SSS Growth
Same-Store Sales Growth Trends: QSR Industry Exhibits Lower Downside Volatility, Stronger Growth vs. Casual Dining(2)
(1) Source: Statista(2) Represents average same-store sales growth for constituents in each group ; Source: Restaurant Research LLC, FactSet
59

Theaters (5.2% of Rent)Stability throughout economic cycles / Experiential component supports e-commerce resiliency
Industry Considerations
(1) Historical U.S. box office receipts illustrate stability: 3.8%
CAGR since 1981 / no year worse than -7.0%
(2) High variable cost structure limits rent coverage volatility:
Theaters in our portfolio require ~40% drop in sales to reach
breakeven on rent coverage
(3) Premium video on demand (PVOD) threat is minimal:
• Studios hesitant to cannibalize theatrical window
• Concentrated industry preserves negotiating leverage
• 95% of box office revenue made within 45 days of release(1)
• PVOD offering lacks experiential component of theaters
7.9%
16.4%
9.1%
7.0%
-7.0%
0.8%
12.6%
4.8%
12.9%
-0.2%
-4.4%
1.4%
5.8%4.7%
1.8%
7.6%7.7%9.2%
7.2%
2.9%
9.8%8.8%
0.9%1.5%
-5.8%
4.2%4.9%
-0.3%
10.0%
-0.3%
-3.7%
6.5%
0.8%
-5.2%
7.4%
2.2%
-2.7%
7.4%
Annual Growth in U.S. Box Office Receipts: Stability through economic cycles
Growth During Recession Record U.S.
box office
(1) Based on top 20 movies in 2018
Source: Box Office Mojo as of December 31, 2018 60
E.T.
BatmanIndiana Jones
Titanic
Harry Potter
Lord of the Rings
Spider-Man
Star Wars Episode II
Avatar
Transformers Star Wars
Jurassic World
➢ Industry is structurally healthy / Strong content drives annual growth
Black Panther
Avengers
Incredibles 2

Grocery (4.8% of Rent)
Exposure to top operators in a largely e-commerce resistant industry
Industry Considerations
(1) Stable, necessity-based industry: Total food expenditure
accounts for 12.3% of US average spending and has been
growing at 3% annually for the past decade(1)
(2) Resiliency to Economic Downturns: Flat Food At Home
expenditure during Great Recession (2009)(1)
(3) Partnership with top operators:
• Top two tenants (Walmart Neighborhood Markets and
Kroger) are the two leading operators with differentiated
business models
• Both operators are major omni-channel players (MRQ online
sales up 43% at Walmart & 60% at Kroger)
Walmart,
25%
Kroger,
13%
Costco, 8%
Albertsons, 7%
Ahold,
6%
Amazon,
2%
Other, 39%
Walmart Neighborhood
Markets:17 consecutive
quarters of same-store sales
growth > 5%
Kroger:Strong
“experiential” component,
particularly with Mariano’s concept
U.S. Grocery Market Share(2)
Realty Income’s
top two grocery
tenants control
over 1/3 of U.S.
grocery market
share
(1) U.S. Census Bureau(2) Wall Street Research, Company filings
61
64%
35%
24%20%
9%3%
Media Consumer
Electronics
Sporting
Goods
Apparel Home
Goods
Grocery
Grocery E-Commerce Market Share
Remains Modest(2)
Top Related
Copyright © 2022 FDOKUMEN

