


Bahasa
Halaman
Hukum

Individual Information Systems – Design, Use, and
a Negative Outcome in the Business and Private Domain
DISSERTATION
to obtain the doctoral degree of Economic Sciences (Dr. oec.)
Faculty of Business, Economics and Social Sciences
University of Hohenheim
Institute of Marketing & Management
submitted by
Julia Lanzl (M. Sc.)
From Burghausen
2021
Date of Disputation: October 20, 2021
Supervisor and First Reviewer: Prof. Dr. Henner Gimpel
Second Reviewer: Prof. Dr. Caroline Ruiner
Exam Chairperson: Prof. Dr. Bernd Ebersberger
Dean of Faculty: Prof. Dr. Karsten Hadwich
Abstract III
Abstract
Digitalization increasingly changes individuals’ business and private lives. Today, individuals
build and use ever more complex individual information systems (IIS) composed of privately-
owned and business-owned components. The COVID-19 pandemic has accelerated this devel-
opment since individuals were forced to work from home due to the social distancing measures
associated with the pandemic. The ongoing digitalization comes with great opportunities for
individuals, such as higher mobility and flexibility, as well as for organizations, such as lower
costs and increased productivity. However, the increased use of IIS at the workplace also bears
risks for individuals. Such risks include technostress, which refers to stress that is caused by
digital technologies. Technostress, in turn, can lead to health-related issues, reduced productiv-
ity, and higher turnover intentions. Thus, to leverage the positive opportunities of digitalization
while reducing its associated risk of technostress, a better understanding of IIS, their use, and
its effect on technostress, and of individual resources that may affect this relationship is needed.
In information systems (IS) literature, the person-environment fit approach is a well-known
theoretical basis for examining the use of digital technologies and its associated outcomes. It
states that next to digital technologies in a person’s environment, personal resources are crucial
for the analysis. Compatibility between an individual’s resources and environment, including
its IIS, is associated with positive outcomes, whereas a lack of fit causes adverse outcomes.
Correspondingly, this dissertation investigates the use of IIS and its outcomes and regards the
interplay of an individual’s resources and the IIS.
The aim of this dissertation is threefold: First, to contribute to a better understanding of layers
of IIS and their different components. Second, since a negative outcome of IIS use can be tech-
nostress, this dissertation seeks to advance knowledge on technostress creators and how they
can be influenced by IIS use and by various IIS characteristics. Third, this dissertation aims to
reveal which resources of individuals may help mitigate technostress. This dissertation uses
quantitative methods, such as online surveys and structural equation modeling, and qualitative
methods, such as literature analyses and semi-structured interviews. Thereby, the methodolog-
ical focus lies on quantitative data collection and analysis, while some papers use a mixed-
methods approach as a combination of quantitative and qualitative methods.
Chapter 2 of this dissertation aims at providing a better understanding of IIS by investigating
its various components. Therefore, Chapter 2.1 conceptualizes four layers of IIS: devices, dig-
ital identities, relationships, and information. It also considers that IIS have two more or less
Abstract IV
integrated subsystems: the business information systems with business-owned components and
the private information systems with privately-owned components. An empirical validation
supports this four-layer conceptualization as well as the definition of integration between the
two sub-systems on each of the four layers. Chapter 2.2 studies IT consumerization, which re-
fers to the use of private IIS components in the business domain and applies a risk-benefit con-
sideration. The results imply that benefits of consumerization of IT services, such as better
functionalities of a private IT service outweigh risks, such as the threat of sanctions for the use
of private IT services in the business domain.
Chapter 3 focuses on the phenomenon of technostress as a negative outcome of the increased
IIS use. Chapter 3.1 analyzes how IT consumerization is related to perceived unreliability of
digital technologies, which is a well-known technostress creator. The results reveal a positive
relationship between IT consumerization and unreliability and show that unreliability is per-
ceived higher when the IT portfolio integration and the individual’s computer self-efficacy are
low. Chapter 3.2 proceeds with studying general characteristics of digital technologies and how
these are related to technostress. It presents ten characteristics that are associated with at least
one technostress creator. Chapter 3.3 extends the concept of technostress and introduces a
framework of twelve different technostress creators. In doing so, Chapter 3.3 also reveals four
second-order factors underlying the twelve technostress creators and brings them into relation
with work- and health-related effects.
Chapter 4 also deals with technostress and investigates resources that help mitigate tech-
nostress. Chapter 4.1 focuses on organizational measures that can be introduced in the business
domain and finds different relationships of the investigated measures with different technostress
creators. While some of the technostress creators can be inhibited by the implementation of
organizational measures, others are found to be even intensified by the organizational measures.
Chapter 4.2 focuses on social mechanisms that function as technostress inhibitors. Findings
differ between technostress creators and the investigated social support dimensions. Further-
more, the results highlight the fact that some of the social support dimensions gain even greater
importance in light of increasing telework.
In summary, this dissertation provides new insights into IIS and their use, the emergence of
technostress in digitalized workplaces, and organizational as well as social mechanisms that
help mitigate technostress. Hence, this dissertation supports current efforts in both research and
practice to reduce technostress while leveraging the positive opportunities of workplace digi-
talization.
Zusammenfassung V
Zusammenfassung
Die Digitalisierung verändert unser berufliches und privates Leben zunehmend und hat dazu
geführt, dass Individuen heute immer komplexere individuelle Informationssysteme (IIS) nut-
zen. Die COVID-19-Pandemie hat diese Entwicklung zusätzlich beschleunigt, da Beschäftigte
durch die Social-Distancing-Maßnahmen gezwungen waren, von zu Hause aus zu arbeiten. Die
fortschreitende Digitalisierung der Arbeitswelt bringt sowohl für Individuen als auch für Orga-
nisationen große Chancen mit sich. Dazu gehören eine höhere Mobilität und Flexibilität für
Beschäftigte sowie geringere Kosten und eine gesteigerte Produktivität für Unternehmen. Al-
lerdings birgt die verstärkte Nutzung von IIS am Arbeitsplatz auch Risiken. Zu diesen Risiken
gehört Technostress, also Stress, der durch digitale Technologien verursacht wird. Technostress
wiederum kann zu gesundheitlichen Problemen, verringerter Produktivität sowie einer höheren
Fluktuationsrate führen. Um die Chancen der Digitalisierung nutzen und gleichzeitig die Risi-
ken des Technostresses reduzieren zu können, ist ein besseres Verständnis über IIS, deren Nut-
zung und deren Auswirkung auf Technostress erforderlich sowie darüber, welche individuellen
Ressourcen diesen Zusammenhang beeinflussen.
Der Person-Environment-Fit-Ansatz ist in der Wirtschaftsinformatik-Literatur eine bekannte
theoretische Grundlage, auf der die Nutzung digitaler Technologien und die damit verbundenen
Folgen untersucht werden können. Er besagt, dass neben digitalen Technologien, von denen
eine Person umgeben ist, die individuellen Ressourcen wichtig sind. Kompatibilität zwischen
individuellen Ressourcen mit der Umwelt, einschließlich des IIS, ist mit positiven Folgen as-
soziiert. Ein Mangel an Kompatibilität bringt dagegen negative Folgen mit sich. Dementspre-
chend werden in dieser Dissertation die Nutzung von IIS und deren Folgen untersucht und es
wird dabei das Zusammenspiel der individuellen Ressourcen und des IIS betrachtet.
Die vorliegende Dissertation verfolgt drei Ziele: Erstens soll zu einem besseren Verständnis
über die Ebenen eines IIS und deren Komponenten beigetragen werden. Zweitens soll das Wis-
sen über Auslöser von Technostress erweitert werden sowie darüber, wie Technostress durch
die Nutzung von IIS und durch verschiedene IIS-Charakteristika beeinflusst werden kann. Drit-
tens strebt die Dissertation an, aufzuzeigen, welche individuellen Ressourcen helfen können,
Technostress zu verringern. Zu diesem Zweck werden quantitative Methoden, wie z. B. Online-
Befragungen und Strukturgleichungsmodellierung, und qualitative Methoden, wie z. B. Litera-
turanalysen und semi-strukturierte Interviews, eingesetzt. Der methodische Schwerpunkt liegt
dabei auf der quantitativen Datenerhebung und -analyse, wobei teilweise ein Mixed-Methods-
Ansatz als Kombination von quantitativen und qualitativen Methoden verwendet wird.
Zusammenfassung VI
Kapitel 2 dieser Dissertation zielt darauf ab, ein besseres Verständnis über IIS und deren ver-
schiedene Komponenten zu erlangen. Dafür werden in Kapitel 2.1 vier Ebenen eines IIS kon-
zeptualisiert: Devices, Digital Identities, Beziehungen und Informationen. Zudem berücksich-
tigt die Konzeptualisierung, dass ein IIS aus zwei mehr oder weniger integrierten Teilsystemen
besteht: dem beruflichen und dem privaten Informationssystem. Eine empirische Validierung
unterstützt die Vier-Ebenen-Konzeptualisierung sowie die Definition der Integration zwischen
den beiden Subsystemen auf jeder der vier Ebenen. Kapitel 2.2 analysiert IT-Consumerization
– also die Nutzung privater IIS-Komponenten im beruflichen Kontext. Die Ergebnisse zeigen,
dass der relative Nutzen, wie z. B. bessere Funktionalitäten des privaten IT-Services, die wahr-
genommenen Risiken, wie z. B. die Androhung von Sanktionen für die Nutzung privater IT-
Services im beruflichen Kontext, überwiegt.
Kapitel 3 beschäftigt sich mit Technostress als negativer Folge der verstärkten IIS-Nutzung. In
Kapitel 3.1 wird analysiert, wie IT-Consumerization mit wahrgenommener Unzuverlässigkeit
digitaler Technologien, einem bekannten digitalen Belastungsfaktor, zusammenhängt. Die Er-
gebnisse zeigen einen positiven Zusammenhang zwischen IT-Consumerization und Unzuver-
lässigkeit. Diese wird stärker wahrgenommen, wenn die IT-Portfolio-Integration und die Com-
puter-Selbstwirksamkeit des Individuums niedrig sind. Kapitel 3.2 untersucht Charakteristika
digitaler Technologien und deren Zusammenhang mit Technostress. Es werden zehn Charakte-
ristika gesammelt, die mit mindestens einem digitalen Belastungsfaktor zusammenhängen. Ka-
pitel 3.3 erweitert das Technostress-Konzept und präsentiert zwölf digitale Belastungsfaktoren.
Zudem werden vier Faktoren aufgedeckt, die den zwölf Belastungsfaktoren zugrunde liegen,
und mit arbeits- und gesundheitsbezogenen Folgen in Zusammenhang gebracht.
Kapitel 4 beschäftigt sich weiter mit Technostress und untersucht Ressourcen, die helfen, Tech-
nostress zu mindern. Kapitel 4.1 untersucht organisatorische Maßnahmen und findet unter-
schiedliche Zusammenhänge der untersuchten Maßnahmen mit verschiedenen digitalen Belas-
tungsfaktoren. Während einige der Belastungsfaktoren durch die organisatorischen Maßnah-
men gehemmt werden können, werden andere sogar verstärkt. Kapitel 4.2 untersucht soziale
Mechanismen, die Technostress verringern können. Die Ergebnisse zeigen unterschiedliche
Auswirkungen der untersuchten Dimensionen sozialer Unterstützung auf die digitalen Belas-
tungsfaktoren. Darüber hinaus wird deutlich, dass einige der Dimensionen sozialer Unterstüt-
zung angesichts der zunehmenden Arbeit von zuhause eine noch größere Bedeutung erlangen.
Zusammenfassend liefert die vorliegende Dissertation neue Erkenntnisse über IIS und deren
Nutzung, die Entstehung von Technostress und über organisatorische sowie soziale
Zusammenfassung VII
Mechanismen, die helfen, Technostress zu mindern. Damit leistet die Dissertation einen Beitrag
zu den aktuellen Initiativen in Forschung und Praxis, Technostress zu reduzieren und gleich-
zeitig die Chancen der Digitalisierung der Arbeit zu realisieren.
Content Overview VIII
Content Overview
Abstract .................................................................................................................................... III
Zusammenfassung ..................................................................................................................... V
Content Overview ................................................................................................................. VIII
Table of Contents ..................................................................................................................... IX
List of Figures ....................................................................................................................... XIII
List of Tables ......................................................................................................................... XIV
1 Introduction ........................................................................................................................ 1
2 Individual Information Systems and their Use ................................................................. 19
3 Technostress as a Negative Outcome of Individual Information Systems Use ............. 102
4 Organizational and Social Mechanisms as Technostress Inhibitors .............................. 218
5 General Discussion and Conclusion ............................................................................... 274
Table of Contents IX
Table of Contents
Abstract .................................................................................................................................... III
Zusammenfassung ..................................................................................................................... V
Content Overview ................................................................................................................. VIII
Table of Contents ..................................................................................................................... IX
List of Figures ....................................................................................................................... XIII
List of Tables ......................................................................................................................... XIV
1 Introduction ........................................................................................................................ 1
1.1 Motivation .................................................................................................................. 1
1.2 Ongoing Digitalization of Individuals and its Consequences .................................... 2
1.3 Aim and Outline of this Thesis .................................................................................. 5
1.3.1 Individual Information Systems and their Use (Chapter 2) ................................... 9
1.3.2 Technostress as a Negative Outcome of Individual Information Systems Use
(Chapter 3) ........................................................................................................................ 10
1.3.3 Organizational and Social Mechanisms as Technostress Inhibitors (Chapter 4) . 12
1.4 References ................................................................................................................ 14
2 Individual Information Systems and their Use ................................................................. 19
2.1 Conceptualizing the Integration of Business and Private Components in Individual
Information Systems ............................................................................................................ 19
2.1.1 Introduction .......................................................................................................... 20
2.1.2 Theoretical Background ....................................................................................... 22
2.1.3 Conceptualizing IIS Integration ........................................................................... 26
2.1.4 Empirical Assessment .......................................................................................... 31
2.1.5 Discussion and Conclusion .................................................................................. 39
2.1.6 References ............................................................................................................ 43
2.1.7 Appendix .............................................................................................................. 48
2.2 Understanding Employees’ IT Service Consumerization Behavior: How Post-
adoptive Reasoning Drives Use ........................................................................................... 52
Table of Contents X
2.2.1 Introduction .......................................................................................................... 53
2.2.2 Theoretical Background ....................................................................................... 55
2.2.3 Method and Model Development ......................................................................... 60
2.2.4 Empirical Analysis ............................................................................................... 65
2.2.5 Discussion ............................................................................................................ 75
2.2.6 Limitations and Future Work ............................................................................... 79
2.2.7 Conclusion ............................................................................................................ 80
2.2.8 References ............................................................................................................ 81
2.2.9 Appendix .............................................................................................................. 88
3 Technostress as a Negative Outcome of Individual Information Systems Use ............. 102
3.1 A Dark Side of IT Consumerization: How Mixed IT Portfolios with Private and
Business IT Components Cause Unreliability ................................................................... 102
3.1.1 Introduction ........................................................................................................ 103
3.1.2 Theoretical Background ..................................................................................... 104
3.1.3 Mixed-Methods Design and Pre-Study .............................................................. 107
3.1.4 Hypotheses Development ................................................................................... 108
3.1.5 Quantitative Empirical Analysis ........................................................................ 111
3.1.6 Discussion .......................................................................................................... 116
3.1.7 Limitations and Conclusion ............................................................................... 119
3.1.8 References .......................................................................................................... 121
3.1.9 Appendix ............................................................................................................ 125
3.2 Considering Characteristic Profiles of Technologies at the Digital Workplace: The
Influence on Technostress .................................................................................................. 127
3.2.1 Introduction ........................................................................................................ 128
3.2.2 Theoretical Background and Related Work ....................................................... 130
3.2.3 Research Process ................................................................................................ 132
3.2.4 The Development of Digital Technology Profiles ............................................. 133
3.2.5 The Influence of Technology Profiles on Technostress ..................................... 143
Table of Contents XI
3.2.6 Discussion and Conclusion ................................................................................ 144
3.2.7 References .......................................................................................................... 149
3.2.8 Appendix ............................................................................................................ 153
3.3 Extending the Concept of Technostress: The Hierarchical Structure of Digital Stress
166
3.3.1 Introduction ........................................................................................................ 167
3.3.2 Conceptual Foundation ...................................................................................... 170
3.3.3 Research Process ................................................................................................ 172
3.3.4 Qualitative Phase ................................................................................................ 174
3.3.5 Quantitative Phase .............................................................................................. 180
3.3.6 Discussion .......................................................................................................... 189
3.3.7 Conclusion .......................................................................................................... 198
3.3.8 References ........................................................................................................ 199
3.3.9 Appendix ............................................................................................................ 207
4 Organizational and Social Mechanisms as Technostress Inhibitors .............................. 218
4.1 Technostress and Digitalization: Evidence from German Employees ................... 218
4.1.1 Introduction ........................................................................................................ 219
4.1.2 Theoretical Background ..................................................................................... 221
4.1.3 Hypotheses Linking the Degree of Workplace Digitalization, Technostress
Creators, and Technostress Inhibitors ............................................................................ 223
4.1.4 Research Methodology, Analysis, and Results .................................................. 228
4.1.5 Discussion .......................................................................................................... 237
4.1.6 Limitations and Conclusion ............................................................................... 240
4.1.7 References .......................................................................................................... 241
4.1.8 Appendix ............................................................................................................ 245
4.2 Social Support as Technostress Inhibitor: Even More Important During the COVID-
19 Pandemic? ..................................................................................................................... 253
4.2.1 Introduction ........................................................................................................ 254
Table of Contents XII
4.2.2 Theoretical Background ..................................................................................... 255
4.2.3 Hypotheses Development ................................................................................... 257
4.2.4 Study Design and Procedures ............................................................................. 259
4.2.5 Results ................................................................................................................ 259
4.2.6 Discussion .......................................................................................................... 264
4.2.7 Conclusion .......................................................................................................... 266
4.2.8 References .......................................................................................................... 267
4.2.9 Appendix ............................................................................................................ 271
5 General Discussion and Conclusion ............................................................................... 274
5.1 Summary of Results and Meta-Inferences ............................................................. 274
5.1.1 Results of Chapter 2: Individual Information Systems and their Use ................ 274
5.1.2 Results of Chapter 3: Technostress as a Negative Outcome of Individual
Information Systems Use ............................................................................................... 276
5.1.3 Results of Chapter 4: Organizational and Social Mechanisms as Technostress
Inhibitors ........................................................................................................................ 278
5.2 Future Research ...................................................................................................... 280
5.2.1 Future Research on the Topics of Chapter 2: Individual Information Systems and
their Use ......................................................................................................................... 280
5.2.2 Future Research on the Topics of Chapter 3: Technostress as a Negative Outcome
of Individual Information Systems Use ......................................................................... 281
5.2.3 Future Research on the Topics of Chapter 4: Organizational and Social
Mechanisms as Technostress Inhibitors ......................................................................... 282
5.3 Conclusion .............................................................................................................. 282
List of Figures XIII
List of Figures
Figure 1.2-1: Theoretical Process on IIS Use and its Consequences ......................................... 3
Figure 1.3-1: Structure of this Doctoral Dissertation ................................................................. 6
Figure 2.1-1: The Four Layers of IIS ....................................................................................... 28
Figure 2.1-2: Four Layers of IIS from the Example of Bob..................................................... 29
Figure 2.1-3: Integration of IIS from the Example of Bob ...................................................... 30
Figure 2.1-4: Histograms for Degree of Integration for the Four Layers (n = 205) ................. 36
Figure 2.1-5: Model Results ..................................................................................................... 38
Figure 2.2-1: Interplay of Related Research Streams and Positioning of this Paper ............... 57
Figure 2.2-2: Research Model .................................................................................................. 62
Figure 2.2-3: Histograms for Use of IT Consumerization of the Two Services (n = 221) in the
Previous Three Weeks on a Six-Point Scale Ranging from “not at all” to “very many times” 67
Figure 2.2-4: Model Results for Consumerization of Instant Messaging ................................ 69
Figure 2.2-5: Model Results for Consumerization of File Sharing .......................................... 70
Figure 3.1-1: Research Model ................................................................................................ 111
Figure 3.1-2: Model Results ................................................................................................... 113
Figure 3.2-1: Technostress Framework by Ayyagari et al. (2011) ........................................ 131
Figure 3.2-2: Profiles of Five Different Digital Technologies Based on their Characteristics
................................................................................................................................................ 143
Figure 3.3-1: Research Process of the Mixed-Methods Research Paradigm ......................... 173
Figure 3.3-2: Possible Models Based on Rindskopf and Rose (1988) ................................... 183
Figure 3.3-3: Nomological Net of Digital Work Demands and their Consequences ............. 189
Figure 4.1-1: Research Model ................................................................................................ 227
Figure 4.1-2: Histogram of the Degree of Workplace Digitalization..................................... 230
Figure 4.1-3: Results of Research Models ............................................................................. 233
Figure 4.1-4: Linear Effects of the Degree of Digitalization on Technostress and its Dimensions
................................................................................................................................................ 234
List of Tables XIV
List of Tables
Table 1.3-1: Overview of Research Papers Included in this Dissertation .................................. 8
Table 2.1-1: Definitions of Constructs ..................................................................................... 33
Table 2.1-2: Descriptive Statistics, Main Factor Loadings, Internal Consistency, and Average
Variance Extracted ................................................................................................................... 36
Table 2.1-3: Mean, Standard Deviation, and Results of Tests for Significant Differences of
Degree of Integration ............................................................................................................... 37
Table 2.2-1: Descriptive Statistics, Main Factor Loadings, Internal Consistency, and Average
Variance Extracted for Consumerization of Instant Messaging ............................................... 68
Table 2.2-2: Descriptive Statistics, Main Factor Loadings, Internal Consistency, and Average
Variance Extracted for Consumerization of File Sharing ........................................................ 68
Table 2.2-3: Overview of Hypotheses and Empirical Results ................................................. 70
Table 2.2-4: Qualitative Insights and Meta-Inferences ............................................................ 74
Table 2.2-5: Meta-Inferences of the Qualitative and Quantitative Strand of the Study ........... 76
Table 3.1-1: Overview of Mixed-Methods Design ................................................................ 107
Table 3.1-2: Results of Qualitative User Interviews .............................................................. 108
Table 3.1-3: Descriptive Statistics, Main Factor Loadings, Internal Consistency, and Average
Variance Extracted ................................................................................................................. 113
Table 3.1-4: Explained Variance in the Structural Equation Model ...................................... 113
Table 3.1-5: Overview of Hypotheses and Empirical Results ............................................... 114
Table 3.1-6: Coding Scheme of Qualitative Survey Data ...................................................... 115
Table 3.2-1: Characteristics of Digital Technologies, their Source, and Definition .............. 135
Table 3.2-2: Statistical Quality of the Measures used in the Study: Descriptive Statistics, Item
Reliabilities, Internal Consistency, and AVE ......................................................................... 138
Table 3.2-3: Nested-Model Comparison of the Measurement Model for the Technology
Characteristics ........................................................................................................................ 140
Table 3.2-4: Profiles of Digital Technologies: Mean and Standard Deviation for each
Characteristic for each Digital Technology............................................................................ 142
Table 3.2-5: Digital Workplace Portfolio: The Influence of the Characteristic Profiles of Digital
Technologies on the Five Technostress Creators ................................................................... 144
Table 3.2-6: Item Means, Standard Deviation and Factor Loadings oft he Final Scales Used in
the Main Study (N = 4,560) ................................................................................................... 160
Table 3.3-1: List of Experts and their Function ..................................................................... 175
List of Tables XV
Table 3.3-2: Overview of the Participants from the Focus Groups........................................ 176
Table 3.3-3: Definition of the Twelve Digital Work Demands ............................................. 180
Table 3.3-4: Factor Loadings for Four Second-Order Factors ............................................... 184
Table 3.3-5: Explanation, Definition, and Interpretation of Higher-Order Factors ............... 185
Table 3.3-6: Demographic Properties of the Validation Sample (n3 = 3,000) ....................... 186
Table 3.3-7: Fit Measures for the Different Model from a CFA on the Validation
Sample (n3 = 3,000) ................................................................................................................ 187
Table 3.3-8: Exemplary Definitions of Technostress and Digital Stress ............................... 193
Table 3.3-9: Evaluation of our Contribution to Digital Stress Theory according to
Weber’s (2012) Guidelines .................................................................................................... 197
Table 3.3-10: Demographic Properties of the Developmental Sample (n2 = 1,560) ............. 210
Table 3.3-11: Item loadings from EFA on Data from the Pre-Test Sample (n1 = 445) ......... 211
Table 3.3-12: Fit Measures from a CFA Using the Developmental Sample (n2 = 1,560) ..... 212
Table 3.3-13: Descriptive Statistics, Internal Consistency, AVE, and Factor Loadings from the
Developmental Sample (n2 = 1,560) ...................................................................................... 213
Table 3.3-14: Discriminant Validity According to Fornell-Larcker for the Developmental
Sample (n2 = 1,560) ................................................................................................................ 213
Table 3.3-15: Items of the Final Scale to Assess Digital Work Demands ............................. 215
Table 3.3-16: Scales and Items Used to Measure the Outcomes in the Nomological Net ..... 216
Table 3.3-17: Descriptive Statistics, Internal Consistency, AVE, and Factor Loadings for the
Validation Sample (n3 = 3,000) .............................................................................................. 216
Table 3.3-18: Discriminant Validity According to Fornell-Larcker for the Validation
Sample (n3 = 3,000) ................................................................................................................ 217
Table 4.1-1: Demographics of the Sample ............................................................................. 230
Table 4.1-2: Mean, SD, Loadings, Cronbach’s α and AVE of each Construct after CFA .... 231
Table 4.1-3: Inter-Factor-Correlations (square root of the AVE in the diagonal) ................. 231
Table 4.1-4: Fit Indices for the Three Research Models ........................................................ 232
Table 4.1-5: Overview of Hypotheses and Empirical Results ............................................... 235
Table 4.1-6: Estimates for Model 4 ........................................................................................ 237
Table 4.2-1: Results of Paired t-tests ..................................................................................... 260
Table 4.2-2: Descriptive Statistics, Main Factor Loadings, Cronbach’s Alpha, and AVE at T1
................................................................................................................................................ 261
Table 4.2-3: Descriptive Statistics, Main Factor Loadings, Cronbach’s Alpha, and AVE at T2
................................................................................................................................................ 261
List of Tables XVI
Table 4.2-4: Fit Indices for the Research Models at T1 and T2 ............................................. 261
Table 4.2-5: Results of Structural Models ............................................................................. 262
Table 4.2-6: Results of the Interaction Analyses ................................................................... 263
Introduction 1
1 Introduction
1.1 Motivation1
Digitalization has long since entered individuals’ lives. Today, more than 90 % of people in
Germany use the Internet (Statistisches Bundesamt et al. 2021). This high degree of digitaliza-
tion affects the business as well as the private domain of modern life. The business world is
adjusting to the increasing availability and use of digital technologies. This opens up an im-
mense potential that far surpasses established boundaries as novel digital technologies facilitate
higher control of work activities along with new forms of communication and collaboration
(Cascio and Montealegre 2016). Furthermore, ever more routine activities in the workplace are
being automated and tasks that require cognitive capabilities are rising (Manyika et al. 2017).
In the private domain, there have also been rapid changes. Since the release of the first Apple
iPhone in 2007, the share of people using smartphones in 2020 has reached 78 % in Germany
and even 82 % in the United States (Newzoo 2020). In 2020, the digitalization of business and
private lives was further accelerated through the emergence of the COVID-19 pandemic. Due
to social distancing measures, many individuals started working from home, which expedited
digital adoption in developed countries such as Germany (Richter and Mohr 2020).
Richard Baskerville (2011a, 2011b) was one of the first to track this ongoing digitalization of
individuals and pointed out that they build and manage their own increasingly powerful indi-
vidual information systems (IIS). Such IIS can be even larger and more complex than the or-
ganizational information systems that, in the past, have been managed by entire IT departments
(Baskerville and Lee 2013). The intensive use of IIS in both the private and the business context
has positive as well as negative outcomes for individuals. On the one hand, it opens up new
opportunities like better access to information and higher flexibility (Colbert et al. 2016). On
the other hand, the increased use of digital technologies can also lead to negative outcomes,
such as stress (Tarafdar et al. 2019). Stress at the workplace caused by digital technologies has
been referred to as technostress. Studies in this area can be traced back to the clinical psycholo-
gist Craig Brod (1982) who coined the term and described the phenomenon as an individual’s
inability to deal with new technology in a healthy manner.
1 Since it is in the nature of a cumulative dissertation that it consists of individual research papers, parts of this
section and the final Section 5 comprise content taken from the research papers included in this thesis. To improve
the readability of the text, I omit the standard labeling of these citations.
Introduction 2
The mandate of our times is to leverage the positive opportunities of the ongoing digitalization
of individuals while reducing the risk of technostress. To accomplish this, organizations, indi-
viduals, and designers of digital technologies must gain a better understanding of IIS in general
but also of IIS use and its effect on technostress, and of individual resources that may affect this
relationship. Only then can we develop effective measures to ensure the successful digitaliza-
tion of individuals.
1.2 Ongoing Digitalization of Individuals and its Consequences
For a long time, literature on information systems (IS) has focused on the organizational per-
spective so as to assess how IS can contribute to organizational success. However, through
intensified digitalization of individuals due to the low-cost availability and ever-greater reach
of information and communication technology, individuals have built their own IIS. Baskerville
(2011a, p. 1) defines an IIS as “an activity system in which individual persons, according to
idiosyncratic needs and preferences, perform processes and activities using information, tech-
nology, and other resources to produce informational products and/or services for use by them-
selves or others.” To date, much research has been conducted on the features of IIS, on their
use by individuals for private and business purposes, and on the associated outcomes of this
use.
While increased use of IIS can be associated with positive outcomes for the individual, there
are also several negative outcomes. Pirkkalainen and Salo (2016) summarized four areas on the
“dark side” of IIS: technostress, information overload, IT addiction, and IT anxiety. The first
one – technostress – is of great interest in IS research. According to the topical literature, tech-
nostress is born from a lack of balance between the demands of digital technologies and the
resources of individuals to meet those demands (Tarafdar et al. 2019). In psychology literature,
Lazarus and Folkman (1984) define stress as a result of an interplay between environmental
demands and personal resources, which is “appraised by the person as taxing or exceeding his
or her resources and endangering his or her well-being” (Lazarus and Folkman 1984, p. 19). In
the case of technostress, such demands result from IIS use (Tarafdar et al. 2019). At times,
technostress can be framed as positive, for instance, when digital technologies are appraised as
challenging or thrilling, but for the main part, the term is perceived as negative in the sense that
digital technologies can be appraised as a threat (Tarafdar et al. 2019). In the pages of this
dissertation, the term technostress refers to this negative meaning.
Introduction 3
A well-known theoretical basis on which to examine IS use in different contexts and its associ-
ated outcomes is the person-environment fit approach (Kristof-Brown et al. 2005). It states that
analysis must not stop at the IS itself but rather extend to the individual’s resources. Person-
environment fit refers to a “compatibility between an individual and a work environment that
occurs when their characteristics are well matched” (Kristof-Brown et al. 2005, p. 281). Person-
environment fit is generally associated with positive outcomes, whereas a lack of fit causes
negative outcomes for the individual. The person-environment fit approach has lent itself to
research on IS use as well as to stress studies, which is why it serves as the theoretical frame-
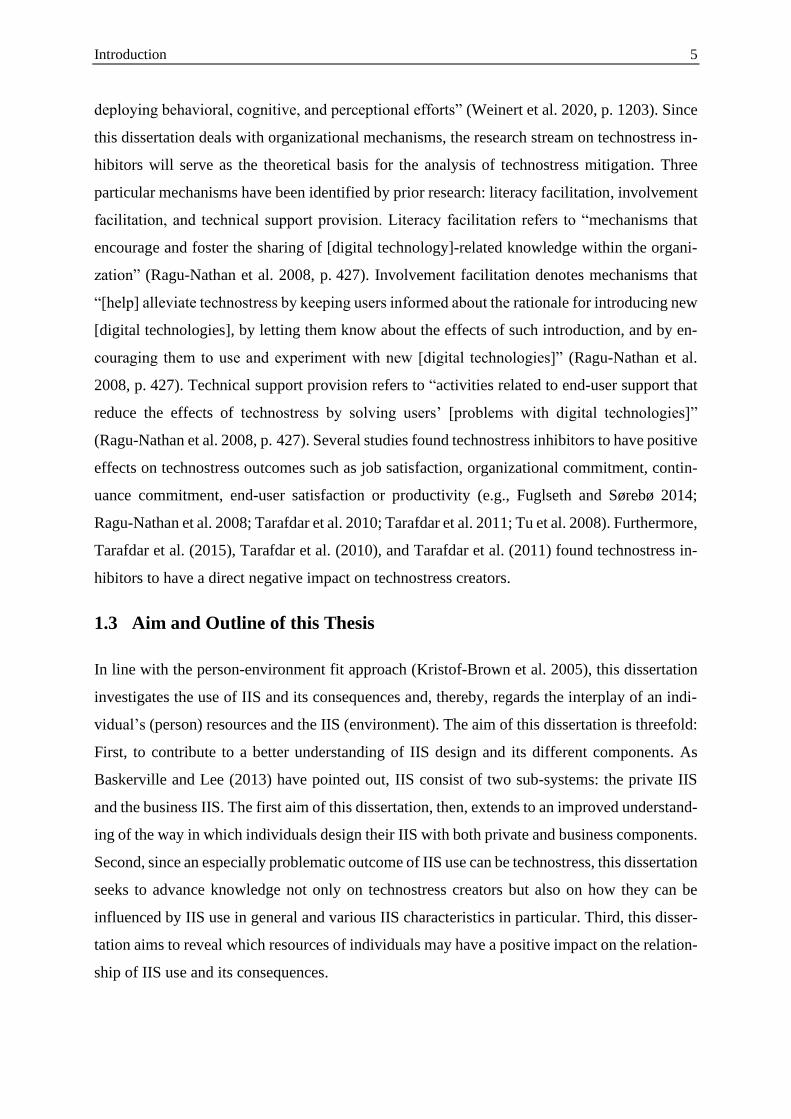
work of this dissertation. Figure 1.2-1 illustrates the simplified process of IIS use as an interplay
between the IIS and individual resources, which produces technostress as a negative outcome.
Figure 1.2-1: Theoretical Process on IIS Use and its Consequences
Different areas of IS research inspire this dissertation, such as studies of the general character-
istics of IIS, research of IIS use at the intersection of business and private domains, and exam-
inations of technostress that also account for the resources of individuals. Therefore, short in-
troductions to all three of these key areas are provided in the following paragraphs.
Research on IIS in general and IIS use in particular began about ten years ago with the work of
Richard Baskerville (2011a, 2011b). Speaking of the components of IIS, he states that two sub-
systems of IIS have to be considered (Baskerville 2011b): one, the “business information sys-
tem” (BIS), which has components of the business domain of the individual, and two, the “pri-
vate information systems” (PIS), which has components of the private domain. However, indi-
viduals do not exclusively use the BIS for business purposes and the PIS for private purposes.
Rather, there can be an overlap in the use of BIS and PIS.
In the discussion of IIS use at the intersection of BIS and PIS, one concept that has received a
lot of attention is IT consumerization (Niehaves et al. 2012). This concept is defined as the use
of privately-owned IIS components for business purposes (Niehaves et al. 2012). This is one
area in which BIS and PIS overlap – the use of the PIS in the business domain. Much research
has been conducted to investigate the benefits due to which individuals engage in IT consum-
erization, and further studies have focused on the benefits and risks for organizations. For indi-
viduals, IT consumerization has been associated with increased creativity and innovative
Introduction 4
qualities as well as greater satisfaction, flexibility, mobility, and improved job performance
(Behrens 2009; Harris et al. 2012; Weeger et al. 2015). However, it is also associated with a
higher workload and blurred boundaries between the business and private domains (Weeger et
al. 2015). As far as organizations are concerned, IT consumerization provides opportunities like
reduced costs for digital technologies and higher employer attractiveness (Harris et al. 2012;
Weeger et al. 2015), but these benefits also come with certain risks, such as IT security issues
and a loss of control over digital technologies (Ortbach 2015; Weeger et al. 2015).
Research on technostress differentiates between different aspects of technostress: the creators,
the outcomes, the antecedents, and the mitigation with the help of different resources. With
regard to the former, five factors have been studied extensively: techno-invasion, techno-over-
load, techno-complexity, techno-insecurity, and techno-uncertainty. These technostress crea-
tors were first defined and analyzed by Tarafdar et al. (2007) and Ragu-Nathan et al. (2008).
Regarding the outcomes of technostress, organizational as well as individual well-being- and
health-related consequences have been identified. Ragu-Nathan et al. (2008) found decreased
job satisfaction, organizational commitment, and continuance commitment as outcomes of
technostress. Meanwhile, lowered job performance and productivity have also been associated
with technostress (Tarafdar et al. 2007; Tarafdar et al. 2015; Tu et al. 2005). As for the health
of individuals, technostress is related to increased exhaustion and burnout (Day et al. 2012;
Galluch et al. 2015; Srivastava et al. 2015) along with higher rates of headaches and sleeping
difficulties (Gimpel et al. 2018).
Regarding the antecedents of technostress, several researchers have investigated how it is af-
fected when different components of IIS are used. Ayyagari et al. (2011) found technology use
in general and various characteristics of digital technologies to be associated with technostress
creators. Other studies revealed the relationship between single digital technologies and tech-
nostress. Maier et al. (2015) found a link to certain characteristics of ERP systems, such as
usefulness and reliability. Salo et al. (2019) examined aspects of social network services, Stich
et al. (2019) analyzed the extent of email use and its effect on technostress, and Galluch et al.
(2015) found that frequent interruptions while using digital technologies increase stress.
Regarding the potential mitigation of technostress, researchers have looked at multiple re-
sources that individuals can use to mitigate technostress. These fall into two broad categories:
technostress inhibitors and coping mechanisms. The former are “organizational mechanisms
that have the potential to reduce the effects of technostress” (Ragu-Nathan et al. 2008, p. 422).
The latter are mechanisms with which “users themselves aim to reduce technostress by
Introduction 5
deploying behavioral, cognitive, and perceptional efforts” (Weinert et al. 2020, p. 1203). Since
this dissertation deals with organizational mechanisms, the research stream on technostress in-
hibitors will serve as the theoretical basis for the analysis of technostress mitigation. Three
particular mechanisms have been identified by prior research: literacy facilitation, involvement
facilitation, and technical support provision. Literacy facilitation refers to “mechanisms that
encourage and foster the sharing of [digital technology]-related knowledge within the organi-
zation” (Ragu-Nathan et al. 2008, p. 427). Involvement facilitation denotes mechanisms that
“[help] alleviate technostress by keeping users informed about the rationale for introducing new
[digital technologies], by letting them know about the effects of such introduction, and by en-
couraging them to use and experiment with new [digital technologies]” (Ragu-Nathan et al.
2008, p. 427). Technical support provision refers to “activities related to end-user support that
reduce the effects of technostress by solving users’ [problems with digital technologies]”
(Ragu-Nathan et al. 2008, p. 427). Several studies found technostress inhibitors to have positive
effects on technostress outcomes such as job satisfaction, organizational commitment, contin-
uance commitment, end-user satisfaction or productivity (e.g., Fuglseth and Sørebø 2014;
Ragu-Nathan et al. 2008; Tarafdar et al. 2010; Tarafdar et al. 2011; Tu et al. 2008). Furthermore,
Tarafdar et al. (2015), Tarafdar et al. (2010), and Tarafdar et al. (2011) found technostress in-
hibitors to have a direct negative impact on technostress creators.
1.3 Aim and Outline of this Thesis
In line with the person-environment fit approach (Kristof-Brown et al. 2005), this dissertation
investigates the use of IIS and its consequences and, thereby, regards the interplay of an indi-
vidual’s (person) resources and the IIS (environment). The aim of this dissertation is threefold:
First, to contribute to a better understanding of IIS design and its different components. As
Baskerville and Lee (2013) have pointed out, IIS consist of two sub-systems: the private IIS
and the business IIS. The first aim of this dissertation, then, extends to an improved understand-
ing of the way in which individuals design their IIS with both private and business components.
Second, since an especially problematic outcome of IIS use can be technostress, this dissertation
seeks to advance knowledge not only on technostress creators but also on how they can be
influenced by IIS use in general and various IIS characteristics in particular. Third, this disser-
tation aims to reveal which resources of individuals may have a positive impact on the relation-
ship of IIS use and its consequences.
Introduction 6
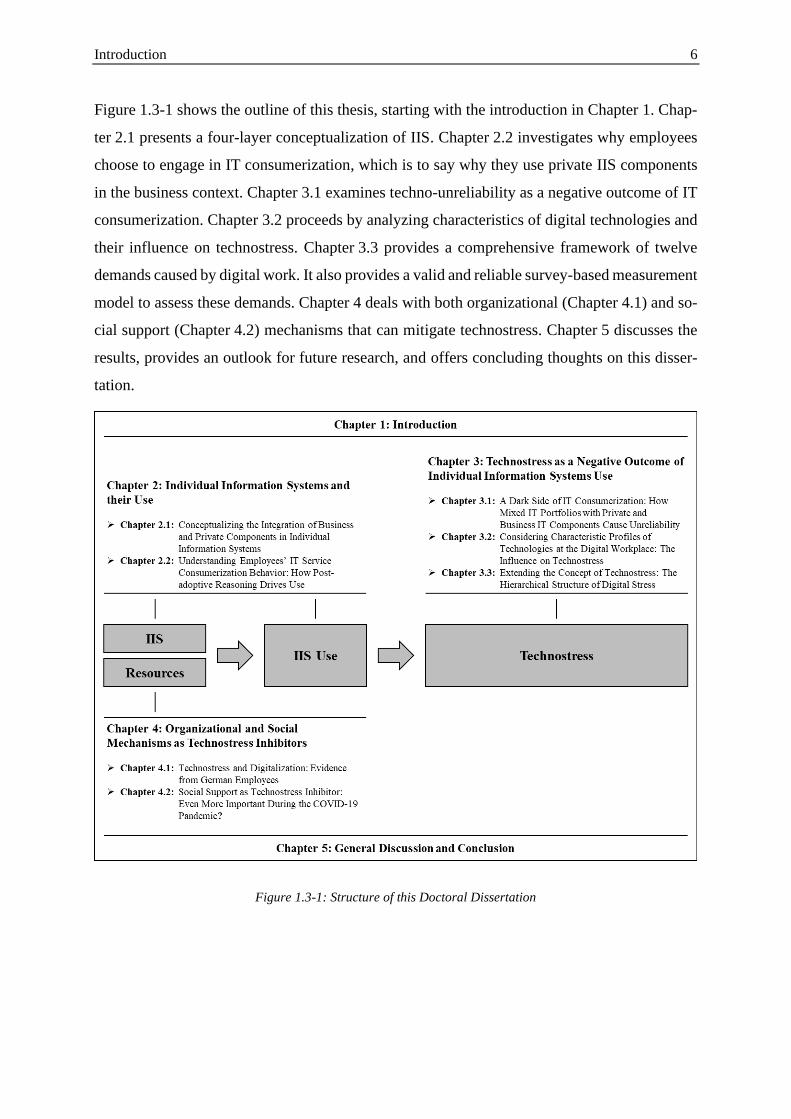
Figure 1.3-1 shows the outline of this thesis, starting with the introduction in Chapter 1. Chap-
ter 2.1 presents a four-layer conceptualization of IIS. Chapter 2.2 investigates why employees
choose to engage in IT consumerization, which is to say why they use private IIS components
in the business context. Chapter 3.1 examines techno-unreliability as a negative outcome of IT
consumerization. Chapter 3.2 proceeds by analyzing characteristics of digital technologies and
their influence on technostress. Chapter 3.3 provides a comprehensive framework of twelve
demands caused by digital work. It also provides a valid and reliable survey-based measurement
model to assess these demands. Chapter 4 deals with both organizational (Chapter 4.1) and so-
cial support (Chapter 4.2) mechanisms that can mitigate technostress. Chapter 5 discusses the
results, provides an outlook for future research, and offers concluding thoughts on this disser-
tation.
Figure 1.3-1: Structure of this Doctoral Dissertation

Introduction 7
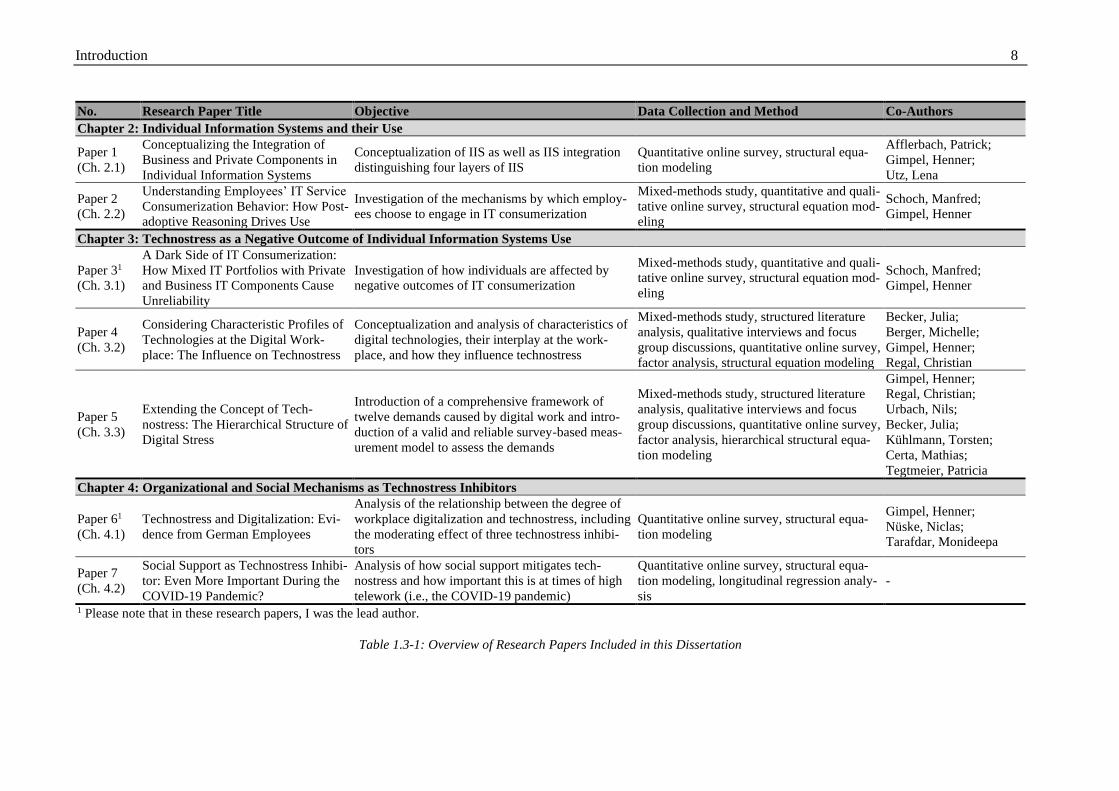
Table 1.3-1 gives an overview of the structure of this dissertation along with the research arti-
cles included therein. Chapter 2 illustrates IIS and their use (Paper 1 and Paper 2), Chapter 3
addresses technostress as a negative outcome of IIS use (Paper 3, Paper 4, and Paper 5), and
Chapter 4 deals with certain organizational and social mechanisms as potential technostress
inhibitors. Furthermore, the table presents the titles, co-authors, objectives, data collection, and
research methods of the research articles. In the following, each part of this dissertation will be
introduced whereupon the aims and research questions (RQ) of each of the papers will be out-
lined in more detail.
Introduction 8
No. Research Paper Title Objective Data Collection and Method Co-Authors
Chapter 2: Individual Information Systems and their Use
Paper 1
(Ch. 2.1)
Conceptualizing the Integration of
Business and Private Components in
Individual Information Systems
Conceptualization of IIS as well as IIS integration
distinguishing four layers of IIS
Quantitative online survey, structural equa-
tion modeling
Afflerbach, Patrick;
Gimpel, Henner;
Utz, Lena
Paper 2
(Ch. 2.2)
Understanding Employees’ IT Service
Consumerization Behavior: How Post-
adoptive Reasoning Drives Use
Investigation of the mechanisms by which employ-
ees choose to engage in IT consumerization
Mixed-methods study, quantitative and quali-
tative online survey, structural equation mod-
eling
Schoch, Manfred;
Gimpel, Henner
Chapter 3: Technostress as a Negative Outcome of Individual Information Systems Use
Paper 31
(Ch. 3.1)
A Dark Side of IT Consumerization:
How Mixed IT Portfolios with Private
and Business IT Components Cause
Unreliability
Investigation of how individuals are affected by
negative outcomes of IT consumerization
Mixed-methods study, quantitative and quali-
tative online survey, structural equation mod-
eling
Schoch, Manfred;
Gimpel, Henner
Paper 4
(Ch. 3.2)
Considering Characteristic Profiles of
Technologies at the Digital Work-
place: The Influence on Technostress
Conceptualization and analysis of characteristics of
digital technologies, their interplay at the work-
place, and how they influence technostress
Mixed-methods study, structured literature
analysis, qualitative interviews and focus
group discussions, quantitative online survey,
factor analysis, structural equation modeling
Becker, Julia;
Berger, Michelle;
Gimpel, Henner;
Regal, Christian
Paper 5
(Ch. 3.3)
Extending the Concept of Tech-
nostress: The Hierarchical Structure of
Digital Stress
Introduction of a comprehensive framework of
twelve demands caused by digital work and intro-
duction of a valid and reliable survey-based meas-
urement model to assess the demands
Mixed-methods study, structured literature
analysis, qualitative interviews and focus
group discussions, quantitative online survey,
factor analysis, hierarchical structural equa-
tion modeling
Gimpel, Henner;
Regal, Christian;
Urbach, Nils;
Becker, Julia;
Kühlmann, Torsten;
Certa, Mathias;
Tegtmeier, Patricia
Chapter 4: Organizational and Social Mechanisms as Technostress Inhibitors
Paper 61
(Ch. 4.1)
Technostress and Digitalization: Evi-
dence from German Employees
Analysis of the relationship between the degree of
workplace digitalization and technostress, including
the moderating effect of three technostress inhibi-
tors
Quantitative online survey, structural equa-
tion modeling
Gimpel, Henner;
Nüske, Niclas;
Tarafdar, Monideepa
Paper 7
(Ch. 4.2)
Social Support as Technostress Inhibi-
tor: Even More Important During the
COVID-19 Pandemic?
Analysis of how social support mitigates tech-
nostress and how important this is at times of high
telework (i.e., the COVID-19 pandemic)
Quantitative online survey, structural equa-
tion modeling, longitudinal regression analy-
sis
-
1 Please note that in these research papers, I was the lead author.
Table 1.3-1: Overview of Research Papers Included in this Dissertation
Introduction 9
1.3.1 Individual Information Systems and their Use (Chapter 2)
Chapter 2 of this dissertation aims at providing a better understanding of IIS by investigating
its various components. It includes two research articles that analyze IIS with regard to different
layers of IIS and the two different domains of life in which IIS can be of use: the business and
the private domain. To be more specific, Paper 1 conceptualizes and validates four layers of IIS
while taking into account that IIS have two subsystems: the BIS and the PIS. Both may be
integrated to some extent. Correspondingly, Paper 2 deals with IT consumerization, which re-
fers to the use of private IIS components in the business domain.
Paper 1 addresses the ongoing digitalization, the associated ever-greater mobile accessibility,
and how this, in turn, leads to increasingly blurred boundaries between the business and the
private domains of modern life. In the social sciences, proponents of boundary theory state that
individuals create boundaries around different domains of life in order to simplify their envi-
ronment (Ashforth et al. 2000). IIS have been regarded as a new boundary management tactic
(e.g., Golden and Geisler 2007) as individuals build their own IIS with the subsystems BIS and
PIS (Baskerville 2011b). These subsystems can be completely integrated, which means that
components from the BIS are used for both business and private purposes while components
from the PIS are used for both private and business purposes. Also, the subsystems can be
completely segmented. Alternatively, they can be in a state between complete segmentation and
complete integration (Köffer et al. 2015). Prior research on IIS as a boundary management
tactic has largely focused on the smartphone as a component of IIS, rather than on the IIS as a
whole (Duxbury et al. 2014; Yun et al. 2012). Therefore, Paper 1 aims to make two key contri-
butions to literature: First, Paper 1 conceptualizes IIS as a composite of four layers: devices,
digital identities, relationships, and information. Second, Paper 1 looks at IIS integration on
each of the layers, which broadens the perspective of prior research by taking a holistic view of
IIS, rather than investigating single components. To validate this conceptualization, Paper 1
presents an empirical study testing a theoretical model that includes IIS integration on multiple
layers. In short, Paper 1 addresses the following research question:
RQ1: How can IIS integration be conceptualized and which components of an IIS have
to be considered?
Paper 2 further analyzes the use of IIS at the intersection of the business and private domains.
It further investigates reasons why individuals use private components of IIS for business pur-
poses. This phenomenon is called IT consumerization (Niehaves et al. 2012) and is associated
Introduction 10
with benefits for both organizations and individuals, such as increased creativity, innovative-
ness, mobility, flexibility, and productivity (e.g., Behrens 2009; Ortbach 2015; Weeger et al.
2015). However, it is also associated with significant risks like IT security breaches and data
privacy implications as well as a loss of organizational control (Behrens 2009; Crossler et al.
2014; Gewald et al. 2017). While it has become rather easy for individuals to use private IT
services like messenger apps that run on their private smartphones, it has also become rather
difficult for IT departments to manage IT service consumerization and the associated risks. By
drawing on post-adoption literature and conducting a quantitative survey, Paper 2 seeks to pro-
vide a detailed understanding of why individuals engage in IT service consumerization. Such
an understanding is required to tailor bespoke initiatives with which organizations can balance
IT consumerization benefits and risks. This aim is reflected in the following research question:
RQ2: What rationales drive IT service consumerization post-adoptive user behavior?
1.3.2 Technostress as a Negative Outcome of Individual Information Systems Use (Chap-
ter 3)
Chapter 3 focuses on the phenomenon of technostress as a negative outcome of the increased
digitalization of individuals. Paper 3 picks up where Paper 2 left off, analyzing how IT con-
sumerization is related to different technostress creators. Paper 4 proceeds with a study of gen-
eral characteristics of digital technologies and how these are related to technostress. Paper 5
further extends the concept of technostress and introduces a framework of twelve different tech-
nostress creators.
A lot of the literature on IT consumerization focuses on why individuals use private IIS com-
ponents for business purposes. This trend has also seen researchers look at the positive out-
comes of IT consumerization for individuals, far more so than they look at negative conse-
quences. Indeed, those have largely been ignored. Two exceptions are Niehaves et al. (2012),
who found some indication that stress might be an outcome of IT consumerization, and Köffer
et al. (2014), who observed that organizational encouragement of IT consumerization leads to
a work overload and work-to-life conflict. However, studies at the intersection of those two
research streams – IT consumerization and technostress – are rare. Thus, Paper 3 provides a
mixed-methods study that examines how IT consumerization and technostress are related. By
way of a qualitative pre-study, the paper first identifies technostress creators that may have their
roots in IT consumerization. Building on the results with a quantitative main study, Paper 3
analyzes the relationship between IT consumerization and the technostress creator unreliability.
Introduction 11
Paper 3 thus has a joint focus. It examines IT consumerization behavior, particularly how IT
consumerization, the extent of integration of an individual’s IT portfolio and the individual’s
computer self-efficacy affect unreliability. It also examines negative outcomes of this unrelia-
bility. The aim of Paper 3, then, is to answer the following research question:
RQ3: How does IT consumerization behavior affect the negative side of technostress
and what factors drive the relationship?
Further on the topic of IT portfolios, Paper 4 collects and analyzes characteristics of digital
technologies in the workplace. Given the rise of digital technologies, organizations and indi-
viduals hope to realize positive outcomes, such as increased productivity, by designing a digital
workplace that facilitates efficient and effective ways of working (Gartner 2020; Köffer 2015).
This increased digitalization, however, has also been associated with technostress. Much of the
research in this area has been concerned with the various technostress creators and potential
outcomes of technostress as well as technostress inhibitors and coping mechanisms
(e.g., Galluch et al. 2015; Ragu-Nathan et al. 2008; Tarafdar et al. 2007; Tarafdar et al. 2010;
Weinert et al. 2020). To date, however, hardly any studies have examined how different digital
technologies and their characteristics impact technostress (e.g., Ayyagari et al. 2011; Maier et
al. 2015; Salo et al. 2019), and at the time of writing, there is no research on the characteristics
of an entire IT portfolio in a digital workplace and how these relate to technostress. To close
this research gap with a mixed-methods approach, Paper 4 deals with the following three re-
search questions:
RQ4.1: Which characteristics of digital technologies with relation to technostress exist?
RQ4.2: How does the characteristic profile of specific digital technologies look like?
RQ4.3: What is the influence of characteristic profiles of digital technologies used at
the workplace on technostress?
Starting with the seminal papers of Tarafdar et al. (2007) and Ragu-Nathan et al. (2008), tech-
nostress research began to investigate five creators of technostress: techno-invasion, techno-
overload, techno-complexity, techno-insecurity, and techno-uncertainty. More than a decade
after these studies, however, the development of digital technologies has continued and other
demands of digital work have been identified in research (e.g., Adam et al. 2017; Ayyagari et
al. 2011; Galluch et al. 2015). Against this background, Fischer et al. (2019) have posed the
question of whether these five much-discussed technostress creators are still current or whether
others have to be considered. Paper 5 revisits the existing concept of technostress and extends
Introduction 12
it by shedding light on the further demands that result from digital work and providing and
understanding of the underlying structure. The methodology used for this purpose brings to-
gether a structured literature review, qualitative expert and focus group interviews, and a large-
scale quantitative study. The aim of Paper 5 is summarized in the following two research ques-
tions:
RQ5.1: What demands from contemporary work practices relating to digital technolo-
gies cause stress for employees?
RQ5.2: How do these different demands relate to each other?
1.3.3 Organizational and Social Mechanisms as Technostress Inhibitors (Chapter 4)
Chapter 4 deals with technostress as a negative outcome of IIS use and considers resources that
help mitigate this kind of stress. It includes two papers that investigate different technostress
inhibitors that may help to reduce technostress creators. Paper 6 focuses on organizational
measures that can be introduced in the business world, whereas Paper 7 focuses on social mech-
anisms that function as technostress inhibitors and may gain a greater significance in light of
today’s increasing amount of telework.
Paper 6 focuses on the organizational perspective in the mitigation of technostress. While or-
ganizations aim to benefit from the introduction of new digital technologies in the business lives
of their employees, they also have to consider technostress associated with the digitalization of
workplaces. However, the relationship between workplace digitalization and technostress has
hardly been investigated, a prominent exception being Ayyagari et al. (2011). With this in mind,
Paper 6 is conceived as a contribution to literature since it investigates how the degree of work-
place digitalization is linked with technostress in general and with various technostress creators
in particular. As for the mitigation of these negative outcomes of workplace digitalization, Pa-
per 6 builds on three well-known technostress inhibitors: literacy facilitation, involvement fa-
cilitation, and technical support provision (Ragu-Nathan et al. 2008). All three of these mecha-
nisms can be implemented by organizations. Plenty of studies have analyzed the effect of these
three technostress inhibitors on outcomes of technostress, such as Ahmad et al. (2014), Fuglseth
and Sørebø (2014), Ragu-Nathan et al. (2008), and Tarafdar et al. (2011). Other studies have
investigated whether technostress inhibitors have a direct inhibiting effect on technostress cre-
ators or rather a moderating effect on the relationship between workplace digitalization and
technostress creators. Examples of these studies include Tarafdar et al. (2010), Tarafdar et al.
(2011), and Tarafdar et al. (2015). The second aim of Paper 6, then, is to analyze these
Introduction 13
relationships in a quantitative survey with structural equation modeling. Both aims of Paper 6
are summarized in two research questions:
RQ6.1: How is the degree of workplace digitalization linked to technostress?
RQ6.2: How do the technostress inhibitors literacy facilitation, involvement facilitation,
and technical support provision moderate the relationship of the degree of workplace
digitalization and technostress?
The COVID-19 pandemic has further fostered digitalization of workplaces since employees
were asked to engage in telework so as to comply with social distancing measures. As a result,
not only has digital work increased, but working conditions like the availability of organiza-
tional support have changed due to the physical distance between employees and offices. Indi-
viduals have had to find other sources of support to mitigate the technostress associated with
increased digital work. In the field of psychology, social support is a well-known concept for
the mitigation of work stress (Barrera 1986) and has been found to decrease work stress or
negative outcomes of work stress (e.g., Barnett et al. 2012; Barrera 1986; McCarty et al. 2007;
Sass et al. 2011; Wolgast and Fischer 2017). Potential sources of social support include people
in the environment of individuals like supervisors, co-workers, or family members. Paper 7
transfers the social support dimensions – supervisor support, co-worker support, sense of com-
munity at work, and family support – to technostress research. By means of a longitudinal quan-
titative study, Paper 7 analyzes whether these four dimensions of social support can inhibit
technostress creators and whether social support is even more important at times when telework
is high. With this, Paper 7 aims to shed light on the following research questions:
RQ7.1: Are different dimensions of social support effective technostress inhibitors?
RQ7.2: Is social support as technostress inhibitor more important during the COVID-
19 pandemic?
Introduction 14
1.4 References
Adam, M. T. P., Gimpel, H., Mädche, A., and Riedl, R. 2017. “Design Blueprint for Stress-
Sensitive Adaptive Enterprise Systems,” Business & Information Systems Engineering
(59:4), pp. 277-291.
Ahmad, U. N. U., Amin, S. M., and Ismail, W. K. W. 2014. “Moderating Effect of Technostress
Inhibitors on the Relationship between Technostress Creators and Organisational Commit-
ment,” Jurnal Teknologi (67:1), pp. 51-62.
Ashforth, B. E., Kreiner, G. E., and Fugate, M. 2000. “All in a Day’s Work: Boundaries and
Micro Role Transitions,” The Academy of Management Review (25:3), pp. 472-491.
Ayyagari, R., Grover, V., and Purvis, R. 2011. “Technostress: Technological Antecedents and
Implications,” Management Information Systems Quarterly (35:4), pp. 831-858.
Barnett, R. C., Brennan, R. T., Gareis, K. C., Ertel, K. A., Berkman, L. F., and Almeida, D. M.
2012. “Conservation of Resources Theory in the Context of Multiple Roles: An Analysis of
Within- and Cross-Role Mediational Pathways,” Community, Work & Family (15:2),
pp. 131-148.
Barrera, M. 1986. “Distinctions Between Social Support Concepts, Measures, and Models,”
American Journal of Community Psychology (14:4), pp. 413-445.
Baskerville, R. L. 2011a. “Design Theorizing Individual Information Systems,” in Proceedings
of the 15th Pacific Asia Conference on Information Systems, Brisbane, Australia, pp. 1-13.
Baskerville, R. L. 2011b. “Individual Information Systems as a Research Arena,” European
Journal of Information Systems (20:3), pp. 251-254.
Baskerville, R. L., and Lee, A. S. 2013. “Individual Organizational Bindpoints: A Design The-
ory for Bring-Your-Own-System,” in Proceedings of the 17th Pacific Asia Conference on
Information Systems, Jeju Island, Korea, pp. 1-12.
Behrens, S. 2009. “Shadow Systems: The Good, the Bad and the Ugly,” Communications of
the ACM (52:2), pp. 124-129.
Brod, C. 1982. “Managing Technostress: Optimizing the Use of Computer Technology,” Per-
sonnel Journal (61:10), pp. 753-757.
Cascio, W. F., and Montealegre, R. 2016. “How Technology Is Changing Work and Organiza-
tions,” Annual Review of Organizational Psychology and Organizational Behavior (3:1),
pp. 349-375.
Colbert, A., Yee, N., and George, G. 2016. “The Digital Workforce and the Workplace of the
Future,” Academy of Management Journal (59:3), pp. 731-739.
Introduction 15
Crossler, R. E., Long, J. H., Loraas, T. M., and Trinkle, B. S. 2014. “Understanding Compliance
with Bring Your Own Device Policies Utilizing Protection Motivation Theory: Bridging the
Intention-Behavior Gap,” Journal of Information Systems (28:1), pp. 209-226.
Day, A., Paquet, S., Scott, N., and Hambley, L. 2012. “Perceived Information and Communi-
cation Technology (ICT) Demands on Employee Outcomes: the Moderating Effect of Or-
ganizational ICT Support,” Journal of Occupational Health Psychology (17:4), pp. 473-
491.
Duxbury, L., Higgins, C., Smart, R., and Stevenson, M. 2014. “Mobile Technology and Bound-
ary Permeability,” British Journal of Management (25:3), pp. 570-588.
Fischer, T., Pehböck, A., and Riedl, R. 2019. “Is the Technostress Creators Inventory Still an
Up-To-Date Measurement Instrument?: Results of a Large-Scale Interview Study,” in Pro-
ceedings of the 14th International Conference on Wirtschaftsinformatik, Siegen, Germany,
pp. 1820-1831.
Fuglseth, A. M., and Sørebø, Ø. 2014. “The Effects of Technostress within the Context of Em-
ployee Use of ICT,” Computers in Human Behavior (40), pp. 161-170.
Galluch, P. S., Grover, V., and Thatcher, J. B. 2015. “Interrupting the Workplace: Examining
Stressors in an Information Technology Context,” Journal of the Association for Infor-
mation Systems (16:1), pp. 1-47.
Gartner 2020. Gartner IT Glossary > Digital Workplace. http://www.gartner.com/it-glos-
sary/digital-workplace. Accessed 29 March 2020.
Gewald, H., Wang, X., Weeger, A., Raisinghani, M. S., Grant, G., Sanchez, O., and Pittayacha-
wan, S. 2017. “Millennials’ Attitudes Toward IT Consumerization in the Workplace,” Com-
munications of the ACM (60:10), pp. 62-69.
Gimpel, H., Lanzl, J., Manner-Romberg, T., and Nüske, N. 2018. “Digitaler Stress in Deutsch-
land: Eine Befragung von Erwerbstätigen zu Belastung und Beanspruchung durch Arbeit
mit digitalen Technologien,” Hans Böckler Stiftung (ed.).
Golden, A. G., and Geisler, C. 2007. “Work-Life Boundary Management and the Personal Dig-
ital Assistant,” Human Relations (60:3), pp. 519-551.
Harris, J. G., Ives, B., and Junglas, I. 2012. “IT Consumerization: When Gadgets Turn Into
Enterprise IT Tools,” Management Information Systems Quarterly Executive (11:3), pp. 99-
112.
Köffer, S. 2015. “Designing the Digital Workplace of the Future: What Scholars Recommend
to Practitioners,” in Proceedings of the 36th International Conference on Information Sys-
tems, Fort Worth, Texas, USA, pp. 1-21.
Introduction 16
Köffer, S., Anlauf, L., Ortbach, K., and Niehaves, B. 2015. “The Intensified Blurring of Bound-
aries Between Work and Private Life through IT Consumerisation,” in Proceedings of the
23rd European Conference on Information Systems, Muenster, Germany, pp. 1-17.
Köffer, S., Junglas, I., Chiperi, C., and Niehaves, B. 2014. “Dual Use of Mobile IT and Work-
to-Life Conflict in the Context of IT Consumerization,” in Proceedings of the 35th Interna-
tional Conference on Information Systems, Auckland, New Zealand, pp. 1-19.
Kristof-Brown, A. L., Zimmerman, R. D., and Johnson, E. C. 2005. “Consequences of Individ-
uals’ Fit at Work: A Meta-Analysis of Person-Job, Person-Organization, Person-Group, and
Person-Supervisor Fit,” Personnel Psychology (58:2), pp. 281-342.
Lazarus, R. S., and Folkman, S. 1984. Stress, Appraisal, and Coping, New York: Springer Pub-
lishing Company.
Maier, C., Laumer, S., and Weinert, C. 2015. “Enterprise Resource Planning systems Induced
Stress: A Comparative Empirical Analysis with Young and Elderly SAP Users,” in Pro-
ceedings of the 12th International Conference on Wirtschaftsinformatik, Osnabrueck, Ger-
many, pp. 1-16.
Manyika, J., Chui, M., Miremadi, M., Bughin, J., George, K., Willmott, P., and Dewhurst, M.
2017. “A Future that Works: Automation, Employment, and Productivity,” McKinsey &
Company.
McCarty, W. P., Zhao, J. “., and Garland, B. E. 2007. “Occupational Stress and Burnout Be-
tween Male and Female Police Officers: Are There Any Gender Differences?” Policing: An
International Journal of Police Strategies & Management (30:4), pp. 672-691.
Newzoo (ed.) 2020. “Global Mobile Market Report 2020: Key Trends, Market Sizing & Fore-
casts, Special Focus Topics, Rankings,” Global Mobile Market Report.
Niehaves, B., Köffer, S., and Ortbach, K. 2012. “IT Consumerization: A Theory and Practice
Review,” in Proceedings of the 18th Americas Conference on Information Systems, Seattle,
Washington, USA, pp. 1-9.
Ortbach, K. 2015. “Unraveling the Effect of Personal Innovativeness on Bring-Your-Own-De-
vice (BYOD) Intention: The Role of Perceptions towards Enterprise-Provided and Pri-
vately-Owned Technologies,” in Proceedings of the 23rd European Conference on Infor-
mation Systems, Muenster, Germany, pp. 1-17.
Pirkkalainen, H., and Salo, M. 2016. “Two Decades of the Dark Side in the Information Sys-
tems Basket: Suggesting Five Areas for Future Research,” in Proceedings of the 24th Eu-
ropean Conference on Information Systems, Istanbul, Turkey, pp. 1-16.
Introduction 17
Ragu-Nathan, T. S., Tarafdar, M., Ragu-Nathan, B. S., and Tu, Q. 2008. “The Consequences
of Technostress for End Users in Organizations: Conceptual Development and Empirical
Validation,” Information Systems Research (19:4), pp. 417-433.
Richter, G., and Mohr, N. 2020. “Digital Sentiment Survey Germany: Understanding the New
Digital User,” McKinsey & Company.
Salo, M., Pirkkalainen, H., and Koskelainen, T. 2019. “Technostress and Social Networking
Services: Explaining Users’ Concentration, Sleep, Identity, and Social Relation Problems,”
Information Systems Journal (29:2), pp. 408-435.
Sass, D. A., Seal, A. K., and Martin, N. K. 2011. “Predicting Teacher Retention Using Stress
and Support Variables,” Journal of Educational Administration (49:2), pp. 200-215.
Srivastava, S. C., Chandra, S., and Shirish, A. 2015. “Technostress Creators and Job Outcomes:
Theorising the Moderating Influence of Personality Traits,” Information Systems Journal
(25:4), pp. 355-401.
Statistisches Bundesamt, Wissenschaftszentrum Berlin für Sozialforschung, and Bundesinstitut
für Bevölkerungsforschung (eds.) 2021. “Datenreport 2021: Ein Sozialbericht für die Bun-
desrepublik Deutschland,” Bonn.
Stich, J.-F., Tarafdar, M., Stacey, P., and Cooper, C. L. 2019. “Appraisal of Email Use as a
Source of Workplace Stress: A Person-Environment Fit Approach,” Journal of the Associ-
ation for Information Systems (20:2), pp. 132-160.
Tarafdar, M., Cooper, C. L., and Stich, J.-F. 2019. “The Technostress Trifecta: Techno Eustress,
Techno Distress and Design: Theoretical Directions and an Agenda for Research,” Infor-
mation Systems Journal (29:1), pp. 6-42.
Tarafdar, M., Pullins, E. B., and Ragu-Nathan, T. S. 2015. “Technostress: Negative Effect on
Performance and Possible Mitigations,” Information Systems Journal (25:2), pp. 103-132.
Tarafdar, M., Tu, Q., Ragu-Nathan, B. S., and Ragu-Nathan, T. S. 2007. “The Impact of Tech-
nostress on Role Stress and Productivity,” Journal of Management Information Systems
(24:1), pp. 301-328.
Tarafdar, M., Tu, Q., and Ragu-Nathan, T. S. 2010. “Impact of Technostress on End-User Sat-
isfaction and Performance,” Journal of Management Information Systems (27:3), pp. 303-
334.
Tarafdar, M., Tu, Q., Ragu-Nathan, T. S., and Ragu-Nathan, B. S. 2011. “Crossing to the Dark
Side: Examining Creators, Outcomes, and Inhibitors of Technostress,” Communications of
the ACM (54:9), pp. 113-120.
Introduction 18
Tu, Q., Tarafdar, M., Ragu-Nathan, T. S., and Ragu-Nathan, B. S. 2008. “Improving End-User
Satisfaction through Techno-Stress Prevention: Some Empirical Evidences,” in Proceed-
ings of the 14th Americas Conference on Information Systems, Toronto, Canada, pp. 1-8.
Tu, Q., Wang, K., and Shu, Q. 2005. “Computer-Mediated Technostress in China,” Communi-
cations of the ACM (48:4), pp. 77-81.
Weeger, A., Wang, X., and Gewald, H. 2015. “IT Consumerization: BYOD-Program Ac-
ceptance and its Impact on Employer Attractiveness,” Journal of Computer Information
Systems (56:1), pp. 1-10.
Weinert, C., Maier, C., Laumer, S., and Weitzel, T. 2020. “Technostress Mitigation: An Exper-
imental Study of Social Support During a Computer Freeze,” Journal of Business Econom-
ics (90:8), pp. 1199-1249.
Wolgast, A., and Fischer, N. 2017. “You Are Not Alone: Colleague Support and Goal-Oriented
Cooperation as Resources to Reduce Teachers’ Stress,” Social Psychology of Education
(20:1), pp. 97-114.
Yun, H., Kettinger, W. J., and Lee, C. C. 2012. “A New Open Door: The Smartphone’s Impact
on Work-to-Life Conflict, Stress, and Resistance,” International Journal of Electronic
Commerce (16:4), pp. 121-152.
Individual Information Systems and their Use 19
2 Individual Information Systems and their Use
2.1 Conceptualizing the Integration of Business and Private Components in
Individual Information Systems
Abstract
Individuals build their individual information system (IIS) with which they manage the bound-
ary between different domains of their lives. Developments like permanent mobile accessibility
lead to a blurring boundary between the private and business domains of life. Some highly
integrate the two IIS sub-systems (the private and the business information system), while oth-
ers keep them more separate. Understanding IIS integration is essential as it affects well-being
and performance in both domains. We introduce a conceptualization of IIS and IIS integration
that distinguishes four layers of IIS: devices, digital identities, relationships, and information.
To measure IIS integration, we develop a method based on the IIS components’ usage frequen-
cies in either domain. We aim to verify our conceptualization and the measurement method by
empirically testing a theoretical model that includes IIS integration on multiple layers. We find
empirical support for the theoretically hypothesized relationships within the model. This em-
pirical evidence supports our conceptualization. Individuals, organizations, and IT designers
striving to manage IIS integration for individual and organizational benefits may use these re-
sults.
Keywords: Individual Information Systems, Boundary Theory, IIS Integration, Structural
Equation Modeling
Authors: Dr. Patrick Afflerbach, Prof. Dr. Henner Gimpel, Julia Lanzl (M. Sc.), Lena Utz
(M. Sc. with honors)
Status: Working paper under review for publication.
Individual Information Systems and their Use 20
2.1.1 Introduction
Since Apple released the iPhone in 2007, smartphone use has increased rapidly. Until 2016, the
share of adults who owned a smartphone reached 60 % in Germany and even 72 % in the U.S.
(Poushter 2016). Besides smartphones, individuals today use a range of digital technologies,
such as computers, tablets, and smartwatches. Owing to the variety of mobile devices, social
networking sites, media streaming, online shopping, and other online services have also in-
creased (vor dem Esche and Hennig-Thurau 2014). This development leads to greater mobility
and increasing work outside offices (Global Workplace Analytics 2016) for which people use
both business and private devices (Harris et al. 2012). The efforts to contain the spread of the
SARS-CoV-2 virus and COVID-19 led to a rapid increase of employees working from home
using devices, digital identities, and the like stemming from both the private and the business
domain of their lives. The consequences of this ongoing digitalization stand to reason: private
and business life increasingly tend to overlap (Köffer et al. 2015; Middleton et al. 2014; Scheep-
ers and Middleton 2013).
The social sciences have been dealing with the integration of different domains of life for dec-
ades. According to boundary theory, individuals create boundaries around domains of life (e.g.,
the private and business domains) to simplify their environment (Ashforth et al. 2000). People
use different tactics (e.g., time, space, physical artifacts) to manage their boundaries (Nippert-
Eng 1996). Boundary management leads to domain integration, segmentation, or a stage be-
tween these two extremes. Boundary theory researchers investigated the creation of boundaries
and the consequences of integration or segmentation. The main consequences of higher inte-
gration are domain blurring and more cross-domain interruptions (Ashforth et al. 2000). Fur-
ther, work-life conflict can arise if one domain’s responsibilities interfere with another’s
(Desrochers et al. 2005; Greenhaus and Beutell 1985).
Via ongoing digitalization, individual information systems (IIS) developed as a new possible
boundary management tactic. This new tactic attracts much attention in boundary theory re-
search (e.g., Golden and Geisler 2007). Further, IIS researchers have transferred constructs
from boundary theory to explain the consequences of IIS integration or segmentation (e.g.,
Köffer et al. 2014a). People build their own IIS, which leads to more or less overlap between
private and business life. An IIS has two sub-systems, which either serve us as a business person
or as a private person (Baskerville 2011b). We call these sub-systems the “business information
system” (BIS) and the “private information systems” (PIS). Notably, BIS and enterprise infor-
mation systems (EIS) differ: BIS is a system of an individual in the business domain, while EIS
Individual Information Systems and their Use 21
refers to an entire organization. To date, most studies on IIS as a boundary management tactic
concentrate on the technical artifact smartphone as a representative of a socio-technical IIS,
which fosters integration, but have not investigated IISs as a whole (Duxbury et al. 2014; Yun
et al. 2012). Moreover, IIS researchers have not yet explored that integration lies on a contin-
uum between complete integration and complete segmentation (Köffer et al. 2015). We extend
the literature by taking a holistic view on IIS and address the following research question:
How can IIS integration be conceptualized and which components of an IIS have to be
considered?
Researchers proposed different IIS conceptualizations varying in the sub-layers of an IIS, re-
spectively, its sub-systems (e.g., Gaß et al. 2015; Lee et al. 2015). As the first contribution of
this paper, we aim to combine the different views and propose a four-layer conceptualization
of IIS. The four layers in this conceptualization are devices (i.e., the hardware tool like
smartphones or laptops), digital identities (i.e., the representation of the individual in different
IT services like the email address or phone number), relationships (i.e., the social ties which are
connected via the technology layers of the IIS like colleagues or friends), and information
(i.e., the information that is being processed by use of the technology layers of the IIS).
The second contribution of this paper is the conceptualization of IIS integration on each of the
layers. By different use behaviors of their IIS on the different layers of the IIS, individuals can
influence the amount of integration and segmentation of their private and business lives. When
keeping their PIS and BIS apart, the overlap of both domains of life tends to be smaller. On the
other hand, individuals can integrate the systems into the opposite domains – which, for exam-
ple, means using the private devices and digital identities for both private and business matters –
to integrate their private and business lives intentionally. We extend the literature by taking a
holistic view of IIS and present a conceptualization of IIS integration regarding all four layers
of IIS.
Sub-optimal integration of BIS and PIS as IIS sub-systems can lead to excessive degrees of
work-life conflict, reduce individual well-being, and reduce work performance. Our conceptu-
alization of IIS and IIS integration is a step towards supporting individuals, organizations, and
IT designers in striving for (individually) optimal IIS integration levels to lessen the adverse
effects arising from sub-optimal integration.
To empirically test our concept of IIS integration on the four layers and the measurement
method, we build a research model based on Ashforth et al. (2000). We test the model empiri-
cally based on survey data and thereby follow the guidelines of MacKenzie et al. (2011) for
Individual Information Systems and their Use 22
construct measurement and validation. We find support for IIS integration on the four layers
and the measurement method and find that IIS integration is highest at the device level and
lowest at the relationship level. Our results support the relevance of considering IIS integration
and provide a frame of reference for the analysis and management of IIS integration.
This paper’s remainder is structured as follows: Section 2.1.2 sets up the theoretical foundation
on boundary theory and IIS. Section 2.1.3 introduces the four layers of IIS and our conceptual-
ization of IIS integration. Section 2.1.4 develops a research model and describes the design and
operationalization of the survey and its results. Section 2.1.5 discusses the findings, theoretical
contributions, and practical implications for individuals, organizations, and IT designers. The
section also provides an outlook for future research.
2.1.2 Theoretical Background
2.1.2.1 Boundary Theory
Boundary theory emerged from social psychology and the organizational sciences. Individuals
face and enact different roles, defined as “the building block of social systems and the summa-
tion of the requirements with which such systems confront their members as individuals” (Katz
and Kahn 1978, pp. 219-220). To simplify the environment, individuals create and negotiate
boundaries between their roles. These boundaries lead to creating fragments of life, or domains,
each containing one or more roles. The two major domains are the private and the business
domain (Ashforth et al. 2000; Nippert-Eng 1996; Rothbard et al. 2005).
Boundaries are everything that delimits a domain’s scope (Ashforth et al. 2000). Individuals
use different tools and tactics to manage their boundaries; this can be time, space, behaviors, or
physical artifacts such as calendars, keys, or clothes. Teleworkers, for instance, often use time
to divide their day into private time and business time or use space and set up one room solely
for business matters (Fonner and Stache 2012; Jahn et al. 2016; Kreiner 2006; Nippert-Eng
1996; Park and Jex 2011).
Creating boundaries leads to higher domain segmentation. Domain segmentation describes the
state in which individuals create boundaries that are inflexible and impermeable. Domains are
separated without any overlaps in time, space, artifacts, and activities. At the other extreme,
domain integration describes the state in which individuals deliberately design boundaries as
flexible and permeable. This state implies that individuals make “no distinction […] between
what belongs to ‘home’ or ‘work’ and when and where [one domain’s roles] are engaged” (Nip-
pert-Eng 1996, p. 567). Time, space, artifacts, and activities of the domains overlap entirely.
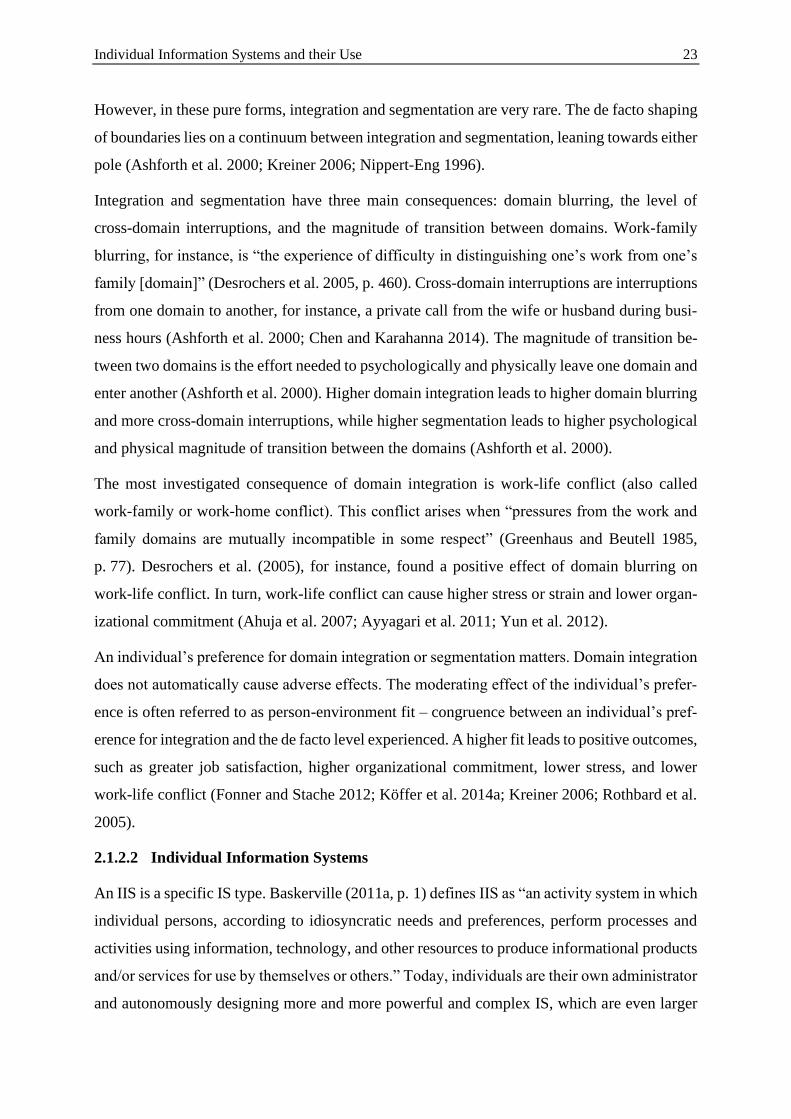
Individual Information Systems and their Use 23
However, in these pure forms, integration and segmentation are very rare. The de facto shaping
of boundaries lies on a continuum between integration and segmentation, leaning towards either
pole (Ashforth et al. 2000; Kreiner 2006; Nippert-Eng 1996).
Integration and segmentation have three main consequences: domain blurring, the level of
cross-domain interruptions, and the magnitude of transition between domains. Work-family
blurring, for instance, is “the experience of difficulty in distinguishing one’s work from one’s
family [domain]” (Desrochers et al. 2005, p. 460). Cross-domain interruptions are interruptions
from one domain to another, for instance, a private call from the wife or husband during busi-
ness hours (Ashforth et al. 2000; Chen and Karahanna 2014). The magnitude of transition be-
tween two domains is the effort needed to psychologically and physically leave one domain and
enter another (Ashforth et al. 2000). Higher domain integration leads to higher domain blurring
and more cross-domain interruptions, while higher segmentation leads to higher psychological
and physical magnitude of transition between the domains (Ashforth et al. 2000).
The most investigated consequence of domain integration is work-life conflict (also called
work-family or work-home conflict). This conflict arises when “pressures from the work and
family domains are mutually incompatible in some respect” (Greenhaus and Beutell 1985,
p. 77). Desrochers et al. (2005), for instance, found a positive effect of domain blurring on
work-life conflict. In turn, work-life conflict can cause higher stress or strain and lower organ-
izational commitment (Ahuja et al. 2007; Ayyagari et al. 2011; Yun et al. 2012).
An individual’s preference for domain integration or segmentation matters. Domain integration
does not automatically cause adverse effects. The moderating effect of the individual’s prefer-
ence is often referred to as person-environment fit – congruence between an individual’s pref-
erence for integration and the de facto level experienced. A higher fit leads to positive outcomes,
such as greater job satisfaction, higher organizational commitment, lower stress, and lower
work-life conflict (Fonner and Stache 2012; Köffer et al. 2014a; Kreiner 2006; Rothbard et al.
2005).
2.1.2.2 Individual Information Systems
An IIS is a specific IS type. Baskerville (2011a, p. 1) defines IIS as “an activity system in which
individual persons, according to idiosyncratic needs and preferences, perform processes and
activities using information, technology, and other resources to produce informational products
and/or services for use by themselves or others.” Today, individuals are their own administrator
and autonomously designing more and more powerful and complex IS, which are even larger
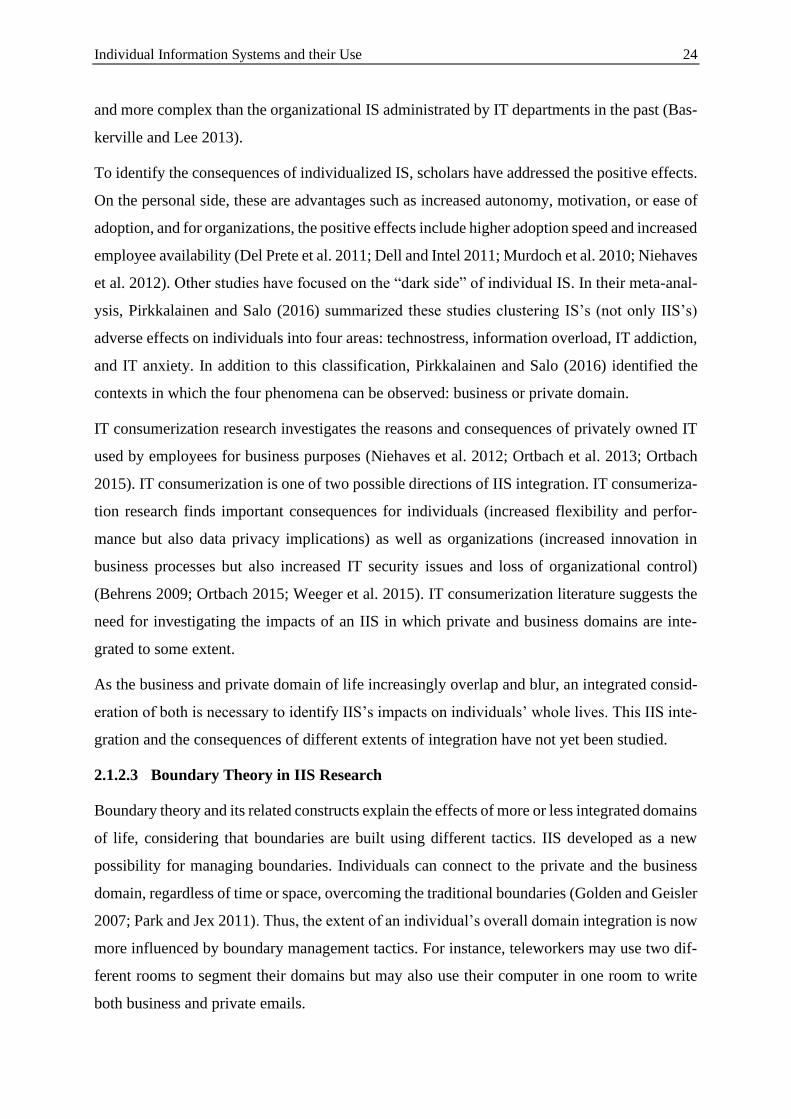
Individual Information Systems and their Use 24
and more complex than the organizational IS administrated by IT departments in the past (Bas-
kerville and Lee 2013).
To identify the consequences of individualized IS, scholars have addressed the positive effects.
On the personal side, these are advantages such as increased autonomy, motivation, or ease of
adoption, and for organizations, the positive effects include higher adoption speed and increased
employee availability (Del Prete et al. 2011; Dell and Intel 2011; Murdoch et al. 2010; Niehaves
et al. 2012). Other studies have focused on the “dark side” of individual IS. In their meta-anal-
ysis, Pirkkalainen and Salo (2016) summarized these studies clustering IS’s (not only IIS’s)
adverse effects on individuals into four areas: technostress, information overload, IT addiction,
and IT anxiety. In addition to this classification, Pirkkalainen and Salo (2016) identified the
contexts in which the four phenomena can be observed: business or private domain.
IT consumerization research investigates the reasons and consequences of privately owned IT
used by employees for business purposes (Niehaves et al. 2012; Ortbach et al. 2013; Ortbach
2015). IT consumerization is one of two possible directions of IIS integration. IT consumeriza-
tion research finds important consequences for individuals (increased flexibility and perfor-
mance but also data privacy implications) as well as organizations (increased innovation in
business processes but also increased IT security issues and loss of organizational control)
(Behrens 2009; Ortbach 2015; Weeger et al. 2015). IT consumerization literature suggests the
need for investigating the impacts of an IIS in which private and business domains are inte-
grated to some extent.
As the business and private domain of life increasingly overlap and blur, an integrated consid-
eration of both is necessary to identify IIS’s impacts on individuals’ whole lives. This IIS inte-
gration and the consequences of different extents of integration have not yet been studied.
2.1.2.3 Boundary Theory in IIS Research
Boundary theory and its related constructs explain the effects of more or less integrated domains
of life, considering that boundaries are built using different tactics. IIS developed as a new
possibility for managing boundaries. Individuals can connect to the private and the business
domain, regardless of time or space, overcoming the traditional boundaries (Golden and Geisler
2007; Park and Jex 2011). Thus, the extent of an individual’s overall domain integration is now
more influenced by boundary management tactics. For instance, teleworkers may use two dif-
ferent rooms to segment their domains but may also use their computer in one room to write
both business and private emails.
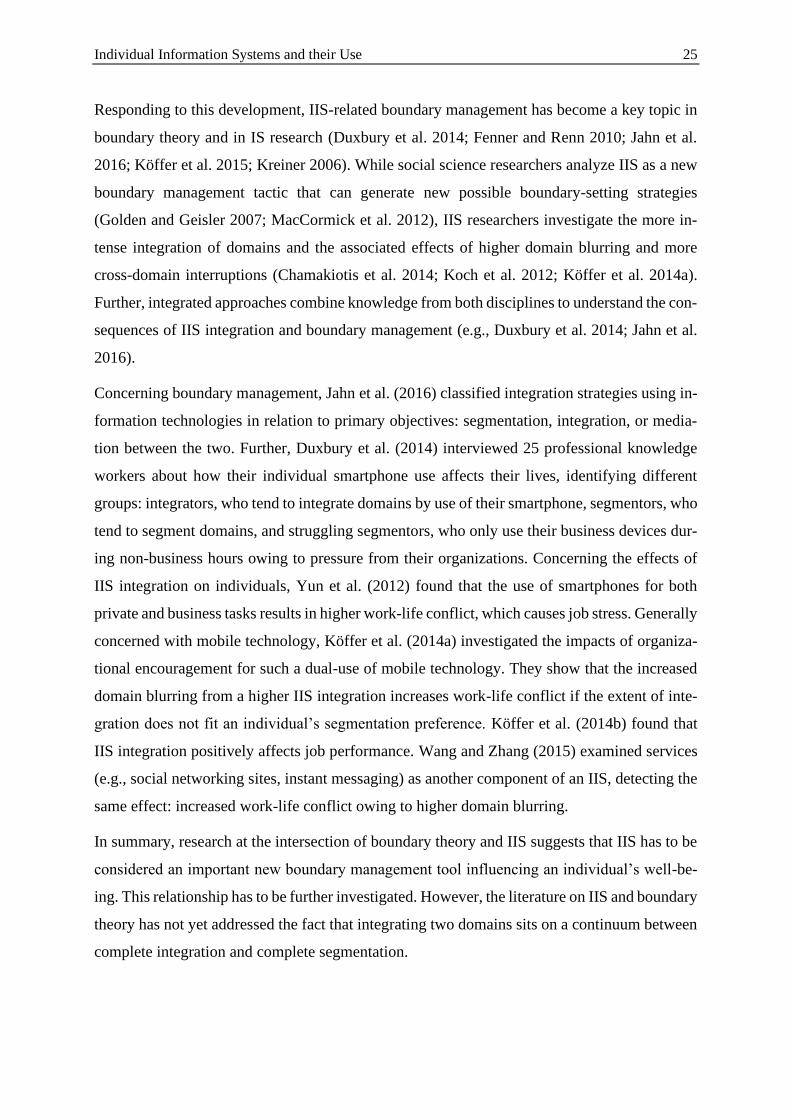
Individual Information Systems and their Use 25
Responding to this development, IIS-related boundary management has become a key topic in
boundary theory and in IS research (Duxbury et al. 2014; Fenner and Renn 2010; Jahn et al.
2016; Köffer et al. 2015; Kreiner 2006). While social science researchers analyze IIS as a new
boundary management tactic that can generate new possible boundary-setting strategies
(Golden and Geisler 2007; MacCormick et al. 2012), IIS researchers investigate the more in-
tense integration of domains and the associated effects of higher domain blurring and more
cross-domain interruptions (Chamakiotis et al. 2014; Koch et al. 2012; Köffer et al. 2014a).
Further, integrated approaches combine knowledge from both disciplines to understand the con-
sequences of IIS integration and boundary management (e.g., Duxbury et al. 2014; Jahn et al.
2016).
Concerning boundary management, Jahn et al. (2016) classified integration strategies using in-
formation technologies in relation to primary objectives: segmentation, integration, or media-
tion between the two. Further, Duxbury et al. (2014) interviewed 25 professional knowledge
workers about how their individual smartphone use affects their lives, identifying different
groups: integrators, who tend to integrate domains by use of their smartphone, segmentors, who
tend to segment domains, and struggling segmentors, who only use their business devices dur-
ing non-business hours owing to pressure from their organizations. Concerning the effects of
IIS integration on individuals, Yun et al. (2012) found that the use of smartphones for both
private and business tasks results in higher work-life conflict, which causes job stress. Generally
concerned with mobile technology, Köffer et al. (2014a) investigated the impacts of organiza-
tional encouragement for such a dual-use of mobile technology. They show that the increased
domain blurring from a higher IIS integration increases work-life conflict if the extent of inte-
gration does not fit an individual’s segmentation preference. Köffer et al. (2014b) found that
IIS integration positively affects job performance. Wang and Zhang (2015) examined services
(e.g., social networking sites, instant messaging) as another component of an IIS, detecting the
same effect: increased work-life conflict owing to higher domain blurring.
In summary, research at the intersection of boundary theory and IIS suggests that IIS has to be
considered an important new boundary management tool influencing an individual’s well-be-
ing. This relationship has to be further investigated. However, the literature on IIS and boundary
theory has not yet addressed the fact that integrating two domains sits on a continuum between
complete integration and complete segmentation.
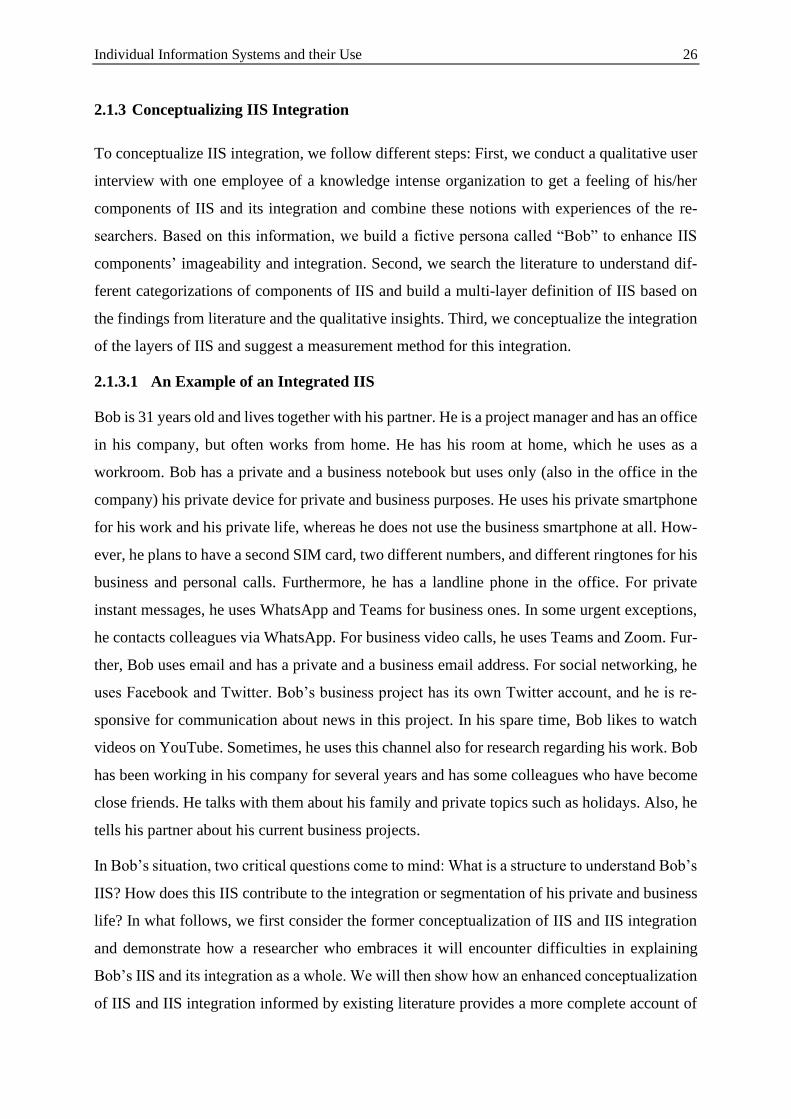
Individual Information Systems and their Use 26
2.1.3 Conceptualizing IIS Integration
To conceptualize IIS integration, we follow different steps: First, we conduct a qualitative user
interview with one employee of a knowledge intense organization to get a feeling of his/her
components of IIS and its integration and combine these notions with experiences of the re-
searchers. Based on this information, we build a fictive persona called “Bob” to enhance IIS
components’ imageability and integration. Second, we search the literature to understand dif-
ferent categorizations of components of IIS and build a multi-layer definition of IIS based on
the findings from literature and the qualitative insights. Third, we conceptualize the integration
of the layers of IIS and suggest a measurement method for this integration.
2.1.3.1 An Example of an Integrated IIS
Bob is 31 years old and lives together with his partner. He is a project manager and has an office
in his company, but often works from home. He has his room at home, which he uses as a
workroom. Bob has a private and a business notebook but uses only (also in the office in the
company) his private device for private and business purposes. He uses his private smartphone
for his work and his private life, whereas he does not use the business smartphone at all. How-
ever, he plans to have a second SIM card, two different numbers, and different ringtones for his
business and personal calls. Furthermore, he has a landline phone in the office. For private
instant messages, he uses WhatsApp and Teams for business ones. In some urgent exceptions,
he contacts colleagues via WhatsApp. For business video calls, he uses Teams and Zoom. Fur-
ther, Bob uses email and has a private and a business email address. For social networking, he
uses Facebook and Twitter. Bob’s business project has its own Twitter account, and he is re-
sponsive for communication about news in this project. In his spare time, Bob likes to watch
videos on YouTube. Sometimes, he uses this channel also for research regarding his work. Bob
has been working in his company for several years and has some colleagues who have become
close friends. He talks with them about his family and private topics such as holidays. Also, he
tells his partner about his current business projects.
In Bob’s situation, two critical questions come to mind: What is a structure to understand Bob’s
IIS? How does this IIS contribute to the integration or segmentation of his private and business
life? In what follows, we first consider the former conceptualization of IIS and IIS integration
and demonstrate how a researcher who embraces it will encounter difficulties in explaining
Bob’s IIS and its integration as a whole. We will then show how an enhanced conceptualization
of IIS and IIS integration informed by existing literature provides a more complete account of
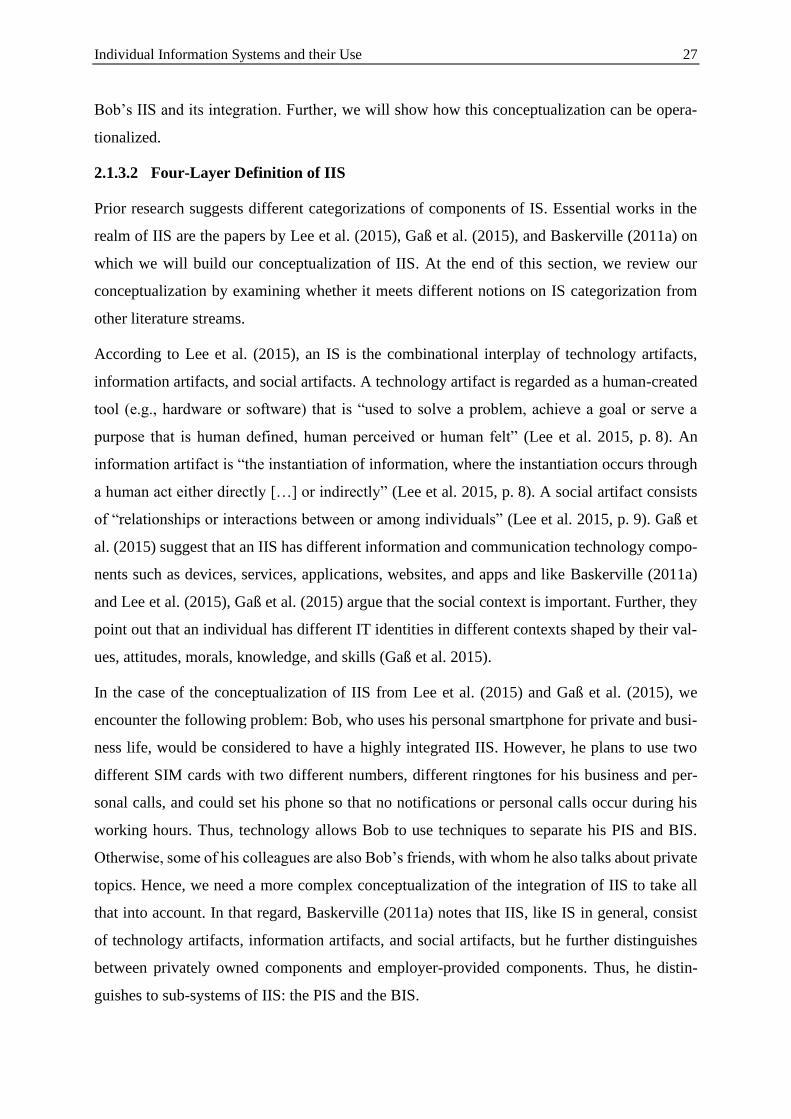
Individual Information Systems and their Use 27
Bob’s IIS and its integration. Further, we will show how this conceptualization can be opera-
tionalized.
2.1.3.2 Four-Layer Definition of IIS
Prior research suggests different categorizations of components of IS. Essential works in the
realm of IIS are the papers by Lee et al. (2015), Gaß et al. (2015), and Baskerville (2011a) on
which we will build our conceptualization of IIS. At the end of this section, we review our
conceptualization by examining whether it meets different notions on IS categorization from
other literature streams.
According to Lee et al. (2015), an IS is the combinational interplay of technology artifacts,
information artifacts, and social artifacts. A technology artifact is regarded as a human-created
tool (e.g., hardware or software) that is “used to solve a problem, achieve a goal or serve a
purpose that is human defined, human perceived or human felt” (Lee et al. 2015, p. 8). An
information artifact is “the instantiation of information, where the instantiation occurs through
a human act either directly […] or indirectly” (Lee et al. 2015, p. 8). A social artifact consists
of “relationships or interactions between or among individuals” (Lee et al. 2015, p. 9). Gaß et
al. (2015) suggest that an IIS has different information and communication technology compo-
nents such as devices, services, applications, websites, and apps and like Baskerville (2011a)
and Lee et al. (2015), Gaß et al. (2015) argue that the social context is important. Further, they
point out that an individual has different IT identities in different contexts shaped by their val-
ues, attitudes, morals, knowledge, and skills (Gaß et al. 2015).
In the case of the conceptualization of IIS from Lee et al. (2015) and Gaß et al. (2015), we
encounter the following problem: Bob, who uses his personal smartphone for private and busi-
ness life, would be considered to have a highly integrated IIS. However, he plans to use two
different SIM cards with two different numbers, different ringtones for his business and per-
sonal calls, and could set his phone so that no notifications or personal calls occur during his
working hours. Thus, technology allows Bob to use techniques to separate his PIS and BIS.
Otherwise, some of his colleagues are also Bob’s friends, with whom he also talks about private
topics. Hence, we need a more complex conceptualization of the integration of IIS to take all
that into account. In that regard, Baskerville (2011a) notes that IIS, like IS in general, consist
of technology artifacts, information artifacts, and social artifacts, but he further distinguishes
between privately owned components and employer-provided components. Thus, he distin-
guishes to sub-systems of IIS: the PIS and the BIS.
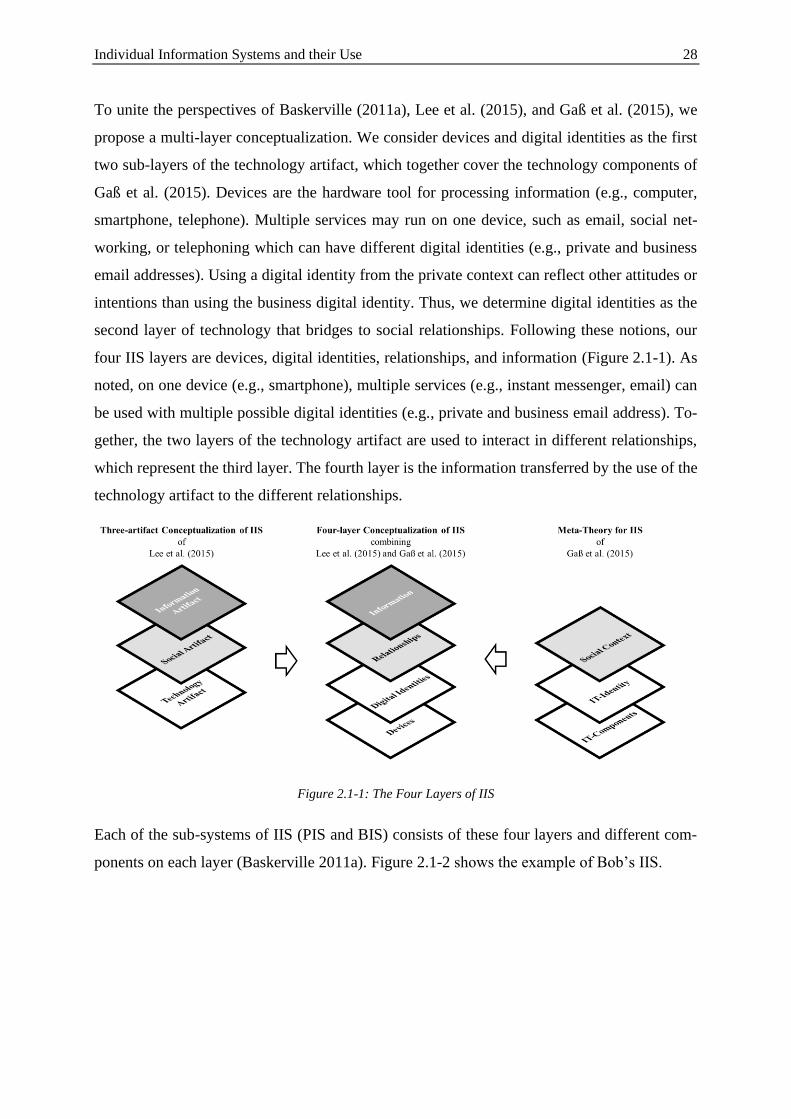
Individual Information Systems and their Use 28
To unite the perspectives of Baskerville (2011a), Lee et al. (2015), and Gaß et al. (2015), we
propose a multi-layer conceptualization. We consider devices and digital identities as the first
two sub-layers of the technology artifact, which together cover the technology components of
Gaß et al. (2015). Devices are the hardware tool for processing information (e.g., computer,
smartphone, telephone). Multiple services may run on one device, such as email, social net-
working, or telephoning which can have different digital identities (e.g., private and business
email addresses). Using a digital identity from the private context can reflect other attitudes or
intentions than using the business digital identity. Thus, we determine digital identities as the
second layer of technology that bridges to social relationships. Following these notions, our
four IIS layers are devices, digital identities, relationships, and information (Figure 2.1-1). As
noted, on one device (e.g., smartphone), multiple services (e.g., instant messenger, email) can
be used with multiple possible digital identities (e.g., private and business email address). To-
gether, the two layers of the technology artifact are used to interact in different relationships,
which represent the third layer. The fourth layer is the information transferred by the use of the
technology artifact to the different relationships.
Figure 2.1-1: The Four Layers of IIS
Each of the sub-systems of IIS (PIS and BIS) consists of these four layers and different com-
ponents on each layer (Baskerville 2011a). Figure 2.1-2 shows the example of Bob’s IIS.
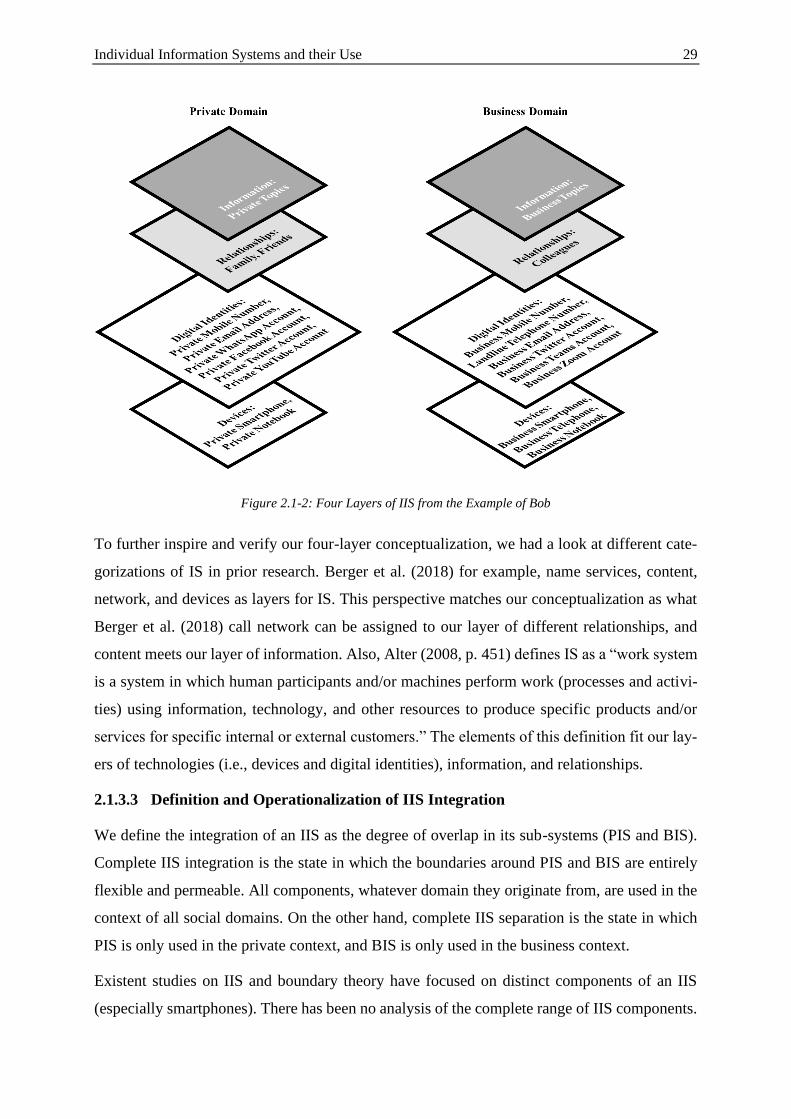
Individual Information Systems and their Use 29
Figure 2.1-2: Four Layers of IIS from the Example of Bob
To further inspire and verify our four-layer conceptualization, we had a look at different cate-
gorizations of IS in prior research. Berger et al. (2018) for example, name services, content,
network, and devices as layers for IS. This perspective matches our conceptualization as what
Berger et al. (2018) call network can be assigned to our layer of different relationships, and
content meets our layer of information. Also, Alter (2008, p. 451) defines IS as a “work system
is a system in which human participants and/or machines perform work (processes and activi-
ties) using information, technology, and other resources to produce specific products and/or
services for specific internal or external customers.” The elements of this definition fit our lay-
ers of technologies (i.e., devices and digital identities), information, and relationships.
2.1.3.3 Definition and Operationalization of IIS Integration
We define the integration of an IIS as the degree of overlap in its sub-systems (PIS and BIS).
Complete IIS integration is the state in which the boundaries around PIS and BIS are entirely
flexible and permeable. All components, whatever domain they originate from, are used in the
context of all social domains. On the other hand, complete IIS separation is the state in which
PIS is only used in the private context, and BIS is only used in the business context.
Existent studies on IIS and boundary theory have focused on distinct components of an IIS
(especially smartphones). There has been no analysis of the complete range of IIS components.
Individual Information Systems and their Use 30
We propose considering IIS integration on four layers to be essential since the different layers
can have different integration extents. Building on the example of Bob’s IIS, integration of his
IIS may be designed in the way that Bob does not have a business smartphone but uses the
private smartphone for private and business purposes. Besides, he may use an emailing service
in both contexts. However, he distinguishes between different digital identities as he only uses
the private email address for private mails and the business email address for business mes-
sages.
Furthermore, integration on the relationship layer may be there as Bob has some friends that
are colleagues at work at the same time. He may also talk with the colleagues about the upcom-
ing private vacation plans and his girlfriend about his current business projects showing the
integration of information. Only in exceptional cases, Bob’s IIS integration is at one of both
extreme points (complete integration or complete segmentation). For Bob, the information layer
is highly integrated. The other layers lie in the range between the two extrema. Figure 2.1-3
shows the example.
Figure 2.1-3: Integration of IIS from the Example of Bob
Integration and segmentation sit on a continuum. Only by determining the extrema of IIS inte-
gration we can interpret the extent of integration. With complete IIS integration, private and
business layers are used equally often for private and business-related matters and cannot be
assigned to either domain. In contrast, IIS segmentation is the absence of IIS integration. Here,
the layers are only used for matters of their domain. Thus, IIS integration is the extent to which
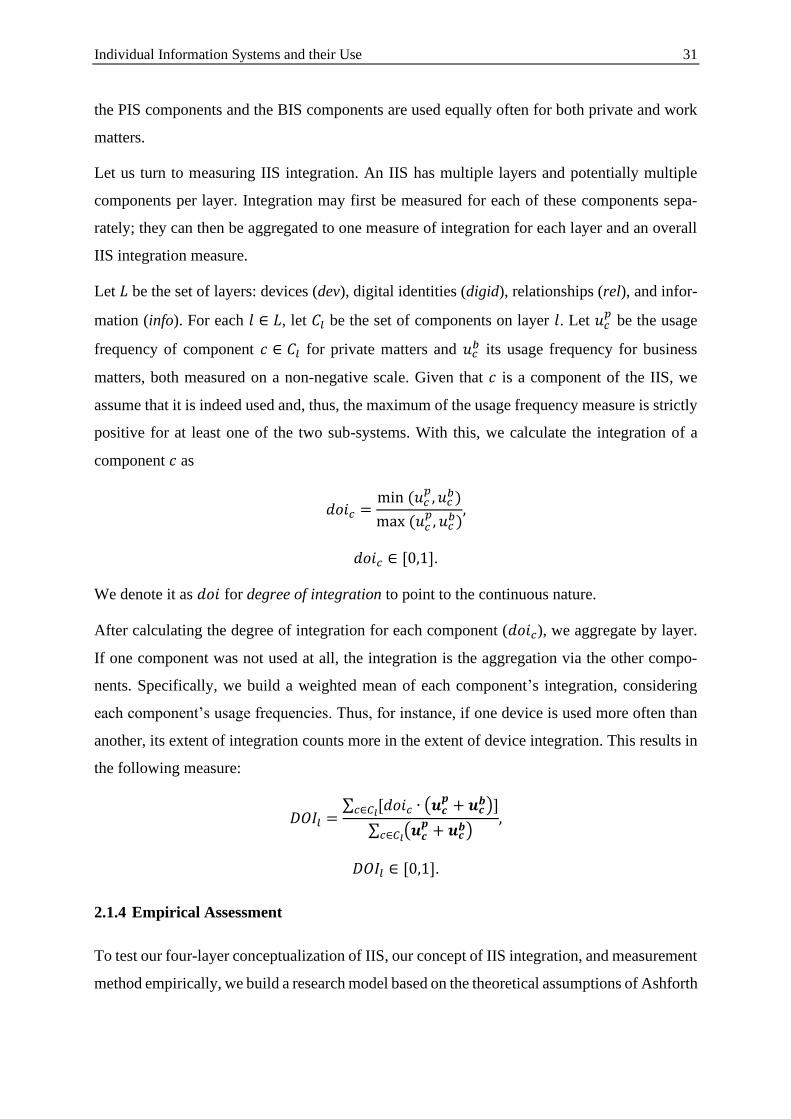
Individual Information Systems and their Use 31
the PIS components and the BIS components are used equally often for both private and work
matters.
Let us turn to measuring IIS integration. An IIS has multiple layers and potentially multiple
components per layer. Integration may first be measured for each of these components sepa-
rately; they can then be aggregated to one measure of integration for each layer and an overall
IIS integration measure.
Let 𝐿 be the set of layers: devices (dev), digital identities (digid), relationships (rel), and infor-
mation (info). For each 𝑙 ∈ 𝐿, let 𝐶𝑙 be the set of components on layer 𝑙. Let 𝑢𝑐𝑝
be the usage
frequency of component 𝑐 ∈ 𝐶𝑙 for private matters and 𝑢𝑐𝑏 its usage frequency for business
matters, both measured on a non-negative scale. Given that 𝑐 is a component of the IIS, we
assume that it is indeed used and, thus, the maximum of the usage frequency measure is strictly
positive for at least one of the two sub-systems. With this, we calculate the integration of a
component 𝑐 as
𝑑𝑜𝑖𝑐 =min(𝑢𝑐
𝑝, 𝑢𝑐𝑏)
max(𝑢𝑐𝑝, 𝑢𝑐
𝑏),
𝑑𝑜𝑖𝑐 ∈ [0,1].
We denote it as 𝑑𝑜𝑖 for degree of integration to point to the continuous nature.
After calculating the degree of integration for each component (𝑑𝑜𝑖𝑐), we aggregate by layer.
If one component was not used at all, the integration is the aggregation via the other compo-
nents. Specifically, we build a weighted mean of each component’s integration, considering
each component’s usage frequencies. Thus, for instance, if one device is used more often than
another, its extent of integration counts more in the extent of device integration. This results in
the following measure:
𝐷𝑂𝐼𝑙 =∑ [𝑑𝑜𝑖𝑐 ∙ (𝒖𝒄
𝒑+ 𝒖𝒄
𝒃)]𝑐∈𝐶𝑙
∑ (𝒖𝒄𝒑+ 𝒖𝒄
𝒃)𝑐∈𝐶𝑙
,
𝐷𝑂𝐼𝑙 ∈ [0,1].
2.1.4 Empirical Assessment
To test our four-layer conceptualization of IIS, our concept of IIS integration, and measurement
method empirically, we build a research model based on the theoretical assumptions of Ashforth
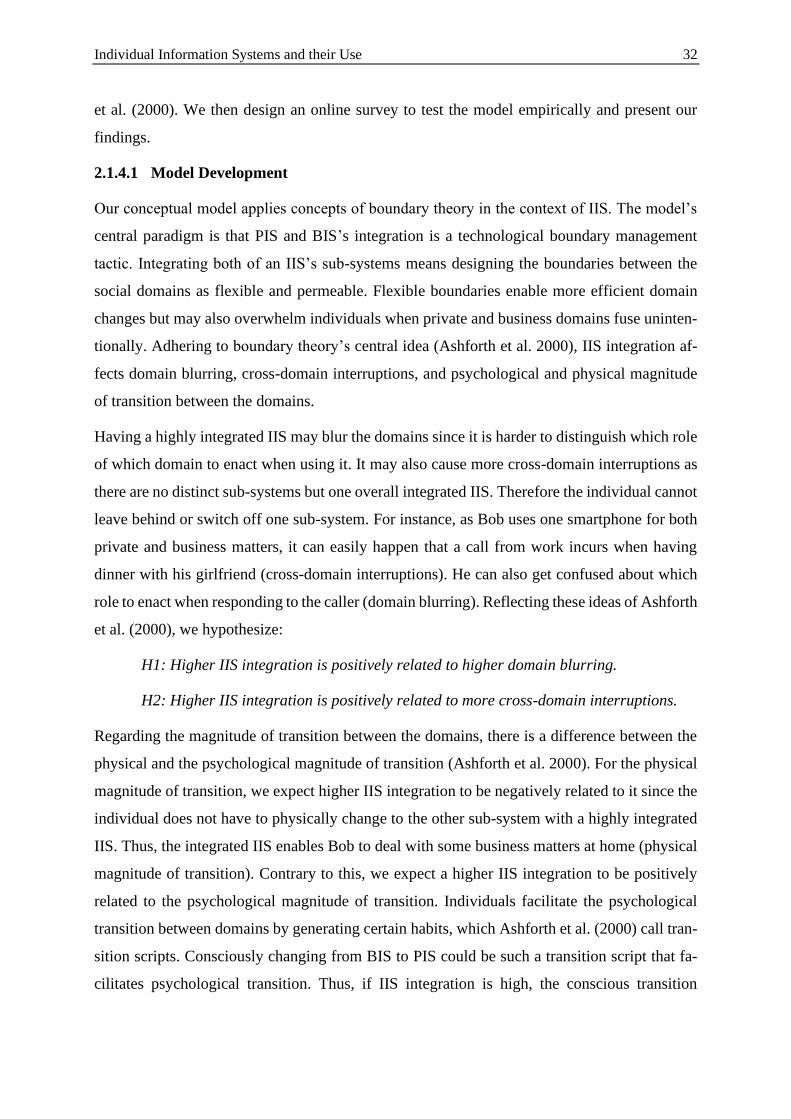
Individual Information Systems and their Use 32
et al. (2000). We then design an online survey to test the model empirically and present our
findings.
2.1.4.1 Model Development
Our conceptual model applies concepts of boundary theory in the context of IIS. The model’s
central paradigm is that PIS and BIS’s integration is a technological boundary management
tactic. Integrating both of an IIS’s sub-systems means designing the boundaries between the
social domains as flexible and permeable. Flexible boundaries enable more efficient domain
changes but may also overwhelm individuals when private and business domains fuse uninten-
tionally. Adhering to boundary theory’s central idea (Ashforth et al. 2000), IIS integration af-
fects domain blurring, cross-domain interruptions, and psychological and physical magnitude
of transition between the domains.
Having a highly integrated IIS may blur the domains since it is harder to distinguish which role
of which domain to enact when using it. It may also cause more cross-domain interruptions as
there are no distinct sub-systems but one overall integrated IIS. Therefore the individual cannot
leave behind or switch off one sub-system. For instance, as Bob uses one smartphone for both
private and business matters, it can easily happen that a call from work incurs when having
dinner with his girlfriend (cross-domain interruptions). He can also get confused about which
role to enact when responding to the caller (domain blurring). Reflecting these ideas of Ashforth
et al. (2000), we hypothesize:
H1: Higher IIS integration is positively related to higher domain blurring.
H2: Higher IIS integration is positively related to more cross-domain interruptions.
Regarding the magnitude of transition between the domains, there is a difference between the
physical and the psychological magnitude of transition (Ashforth et al. 2000). For the physical
magnitude of transition, we expect higher IIS integration to be negatively related to it since the
individual does not have to physically change to the other sub-system with a highly integrated
IIS. Thus, the integrated IIS enables Bob to deal with some business matters at home (physical
magnitude of transition). Contrary to this, we expect a higher IIS integration to be positively
related to the psychological magnitude of transition. Individuals facilitate the psychological
transition between domains by generating certain habits, which Ashforth et al. (2000) call tran-
sition scripts. Consciously changing from BIS to PIS could be such a transition script that fa-
cilitates psychological transition. Thus, if IIS integration is high, the conscious transition
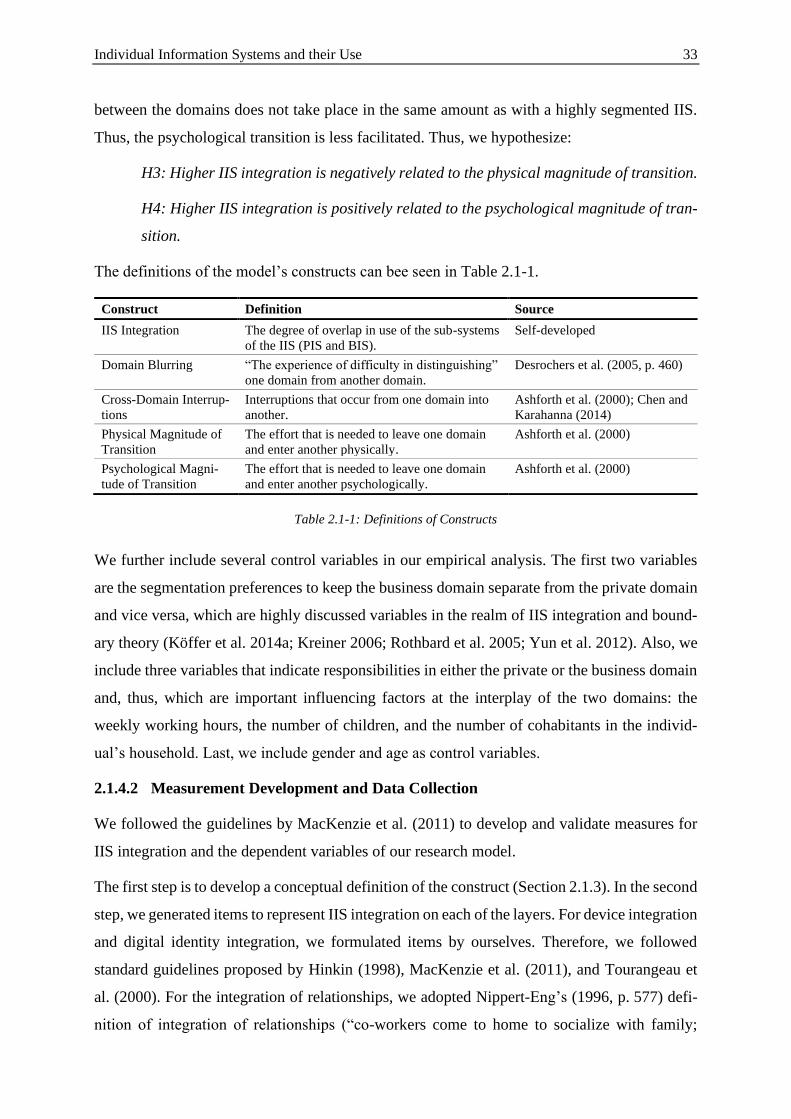
Individual Information Systems and their Use 33
between the domains does not take place in the same amount as with a highly segmented IIS.
Thus, the psychological transition is less facilitated. Thus, we hypothesize:
H3: Higher IIS integration is negatively related to the physical magnitude of transition.
H4: Higher IIS integration is positively related to the psychological magnitude of tran-
sition.
The definitions of the model’s constructs can bee seen in Table 2.1-1.
Construct Definition Source
IIS Integration The degree of overlap in use of the sub-systems
of the IIS (PIS and BIS).
Self-developed
Domain Blurring “The experience of difficulty in distinguishing”
one domain from another domain.
Desrochers et al. (2005, p. 460)
Cross-Domain Interrup-
tions
Interruptions that occur from one domain into
another.
Ashforth et al. (2000); Chen and
Karahanna (2014)
Physical Magnitude of
Transition
The effort that is needed to leave one domain
and enter another physically.
Ashforth et al. (2000)
Psychological Magni-
tude of Transition
The effort that is needed to leave one domain
and enter another psychologically.
Ashforth et al. (2000)
Table 2.1-1: Definitions of Constructs
We further include several control variables in our empirical analysis. The first two variables
are the segmentation preferences to keep the business domain separate from the private domain
and vice versa, which are highly discussed variables in the realm of IIS integration and bound-
ary theory (Köffer et al. 2014a; Kreiner 2006; Rothbard et al. 2005; Yun et al. 2012). Also, we
include three variables that indicate responsibilities in either the private or the business domain
and, thus, which are important influencing factors at the interplay of the two domains: the
weekly working hours, the number of children, and the number of cohabitants in the individ-
ual’s household. Last, we include gender and age as control variables.
2.1.4.2 Measurement Development and Data Collection
We followed the guidelines by MacKenzie et al. (2011) to develop and validate measures for
IIS integration and the dependent variables of our research model.
The first step is to develop a conceptual definition of the construct (Section 2.1.3). In the second
step, we generated items to represent IIS integration on each of the layers. For device integration
and digital identity integration, we formulated items by ourselves. Therefore, we followed
standard guidelines proposed by Hinkin (1998), MacKenzie et al. (2011), and Tourangeau et
al. (2000). For the integration of relationships, we adopted Nippert-Eng’s (1996, p. 577) defi-
nition of integration of relationships (“co-workers come to home to socialize with family;
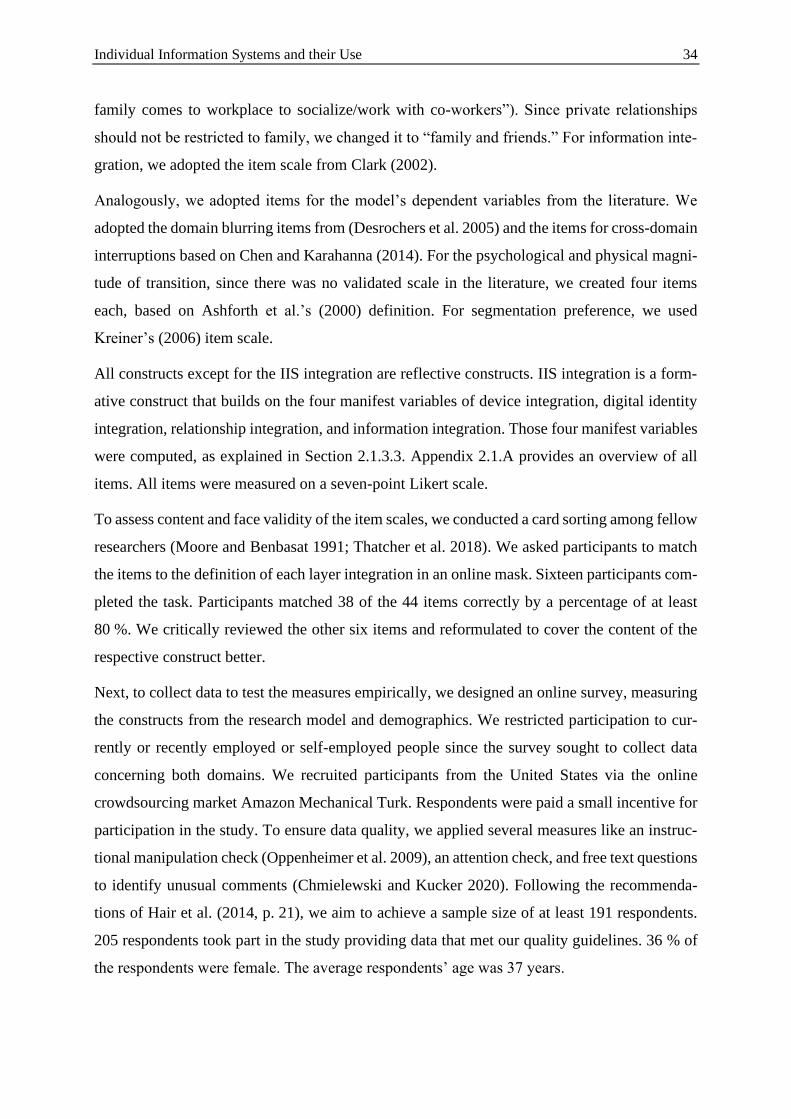
Individual Information Systems and their Use 34
family comes to workplace to socialize/work with co-workers”). Since private relationships
should not be restricted to family, we changed it to “family and friends.” For information inte-
gration, we adopted the item scale from Clark (2002).
Analogously, we adopted items for the model’s dependent variables from the literature. We
adopted the domain blurring items from (Desrochers et al. 2005) and the items for cross-domain
interruptions based on Chen and Karahanna (2014). For the psychological and physical magni-
tude of transition, since there was no validated scale in the literature, we created four items
each, based on Ashforth et al.’s (2000) definition. For segmentation preference, we used
Kreiner’s (2006) item scale.
All constructs except for the IIS integration are reflective constructs. IIS integration is a form-
ative construct that builds on the four manifest variables of device integration, digital identity
integration, relationship integration, and information integration. Those four manifest variables
were computed, as explained in Section 2.1.3.3. Appendix 2.1.A provides an overview of all
items. All items were measured on a seven-point Likert scale.
To assess content and face validity of the item scales, we conducted a card sorting among fellow
researchers (Moore and Benbasat 1991; Thatcher et al. 2018). We asked participants to match
the items to the definition of each layer integration in an online mask. Sixteen participants com-
pleted the task. Participants matched 38 of the 44 items correctly by a percentage of at least
80 %. We critically reviewed the other six items and reformulated to cover the content of the
respective construct better.
Next, to collect data to test the measures empirically, we designed an online survey, measuring
the constructs from the research model and demographics. We restricted participation to cur-
rently or recently employed or self-employed people since the survey sought to collect data
concerning both domains. We recruited participants from the United States via the online
crowdsourcing market Amazon Mechanical Turk. Respondents were paid a small incentive for
participation in the study. To ensure data quality, we applied several measures like an instruc-
tional manipulation check (Oppenheimer et al. 2009), an attention check, and free text questions
to identify unusual comments (Chmielewski and Kucker 2020). Following the recommenda-
tions of Hair et al. (2014, p. 21), we aim to achieve a sample size of at least 191 respondents.
205 respondents took part in the study providing data that met our quality guidelines. 36 % of
the respondents were female. The average respondents’ age was 37 years.
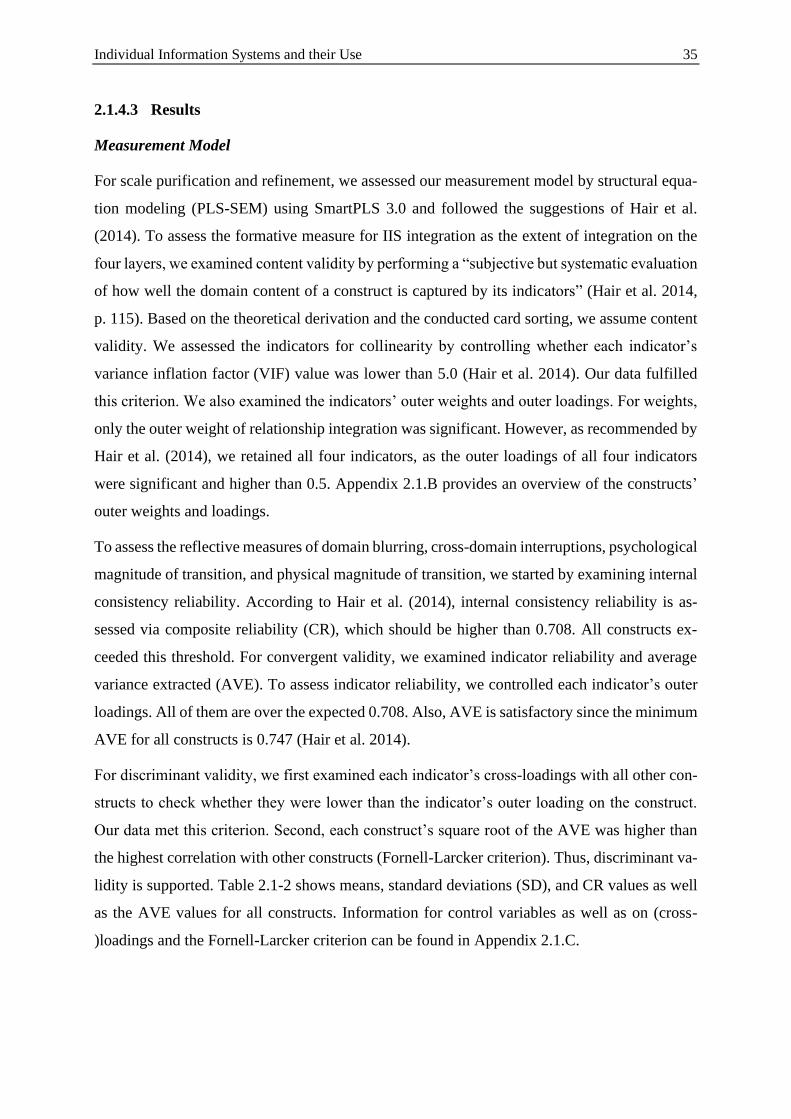
Individual Information Systems and their Use 35
2.1.4.3 Results
Measurement Model
For scale purification and refinement, we assessed our measurement model by structural equa-
tion modeling (PLS-SEM) using SmartPLS 3.0 and followed the suggestions of Hair et al.
(2014). To assess the formative measure for IIS integration as the extent of integration on the
four layers, we examined content validity by performing a “subjective but systematic evaluation
of how well the domain content of a construct is captured by its indicators” (Hair et al. 2014,
p. 115). Based on the theoretical derivation and the conducted card sorting, we assume content
validity. We assessed the indicators for collinearity by controlling whether each indicator’s
variance inflation factor (VIF) value was lower than 5.0 (Hair et al. 2014). Our data fulfilled
this criterion. We also examined the indicators’ outer weights and outer loadings. For weights,
only the outer weight of relationship integration was significant. However, as recommended by
Hair et al. (2014), we retained all four indicators, as the outer loadings of all four indicators
were significant and higher than 0.5. Appendix 2.1.B provides an overview of the constructs’
outer weights and loadings.
To assess the reflective measures of domain blurring, cross-domain interruptions, psychological
magnitude of transition, and physical magnitude of transition, we started by examining internal
consistency reliability. According to Hair et al. (2014), internal consistency reliability is as-
sessed via composite reliability (CR), which should be higher than 0.708. All constructs ex-
ceeded this threshold. For convergent validity, we examined indicator reliability and average
variance extracted (AVE). To assess indicator reliability, we controlled each indicator’s outer
loadings. All of them are over the expected 0.708. Also, AVE is satisfactory since the minimum
AVE for all constructs is 0.747 (Hair et al. 2014).
For discriminant validity, we first examined each indicator’s cross-loadings with all other con-
structs to check whether they were lower than the indicator’s outer loading on the construct.
Our data met this criterion. Second, each construct’s square root of the AVE was higher than
the highest correlation with other constructs (Fornell-Larcker criterion). Thus, discriminant va-
lidity is supported. Table 2.1-2 shows means, standard deviations (SD), and CR values as well
as the AVE values for all constructs. Information for control variables as well as on (cross-
)loadings and the Fornell-Larcker criterion can be found in Appendix 2.1.C.
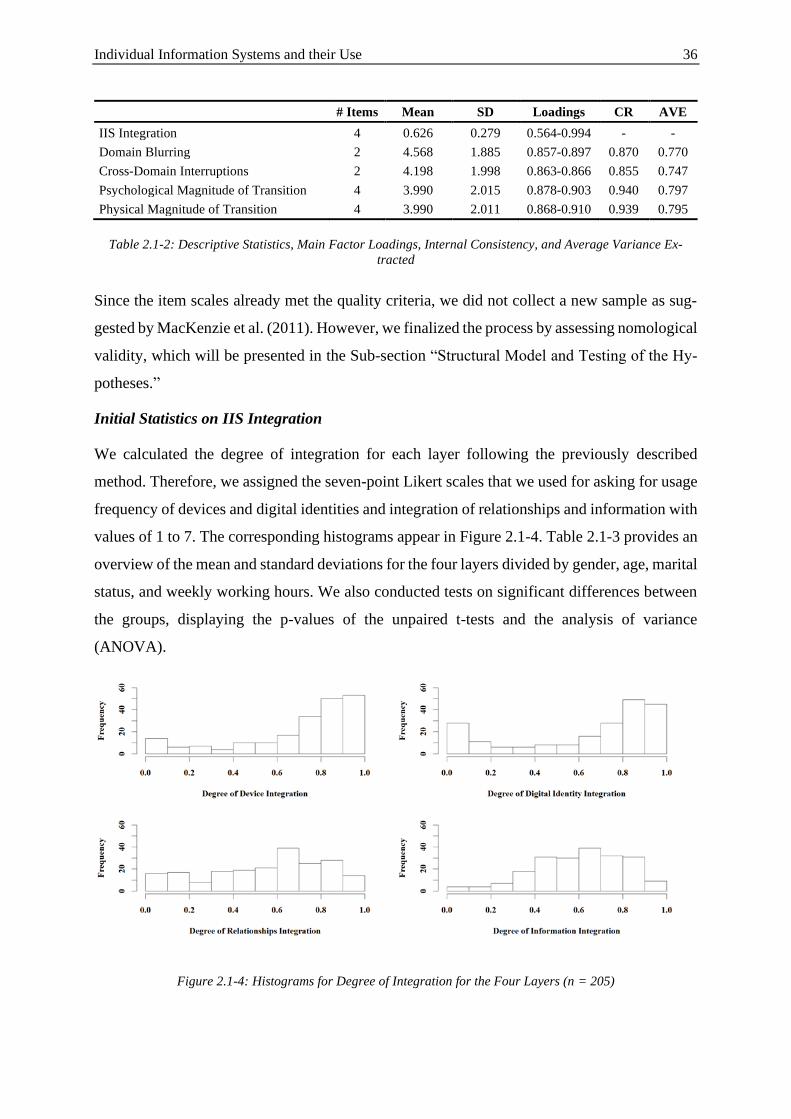
Individual Information Systems and their Use 36
# Items Mean SD Loadings CR AVE
IIS Integration 4 0.626 0.279 0.564-0.994 - -
Domain Blurring 2 4.568 1.885 0.857-0.897 0.870 0.770
Cross-Domain Interruptions 2 4.198 1.998 0.863-0.866 0.855 0.747
Psychological Magnitude of Transition 4 3.990 2.015 0.878-0.903 0.940 0.797
Physical Magnitude of Transition 4 3.990 2.011 0.868-0.910 0.939 0.795
Table 2.1-2: Descriptive Statistics, Main Factor Loadings, Internal Consistency, and Average Variance Ex-
tracted
Since the item scales already met the quality criteria, we did not collect a new sample as sug-
gested by MacKenzie et al. (2011). However, we finalized the process by assessing nomological
validity, which will be presented in the Sub-section “Structural Model and Testing of the Hy-
potheses.”
Initial Statistics on IIS Integration
We calculated the degree of integration for each layer following the previously described
method. Therefore, we assigned the seven-point Likert scales that we used for asking for usage
frequency of devices and digital identities and integration of relationships and information with
values of 1 to 7. The corresponding histograms appear in Figure 2.1-4. Table 2.1-3 provides an
overview of the mean and standard deviations for the four layers divided by gender, age, marital
status, and weekly working hours. We also conducted tests on significant differences between
the groups, displaying the p-values of the unpaired t-tests and the analysis of variance
(ANOVA).
Figure 2.1-4: Histograms for Degree of Integration for the Four Layers (n = 205)
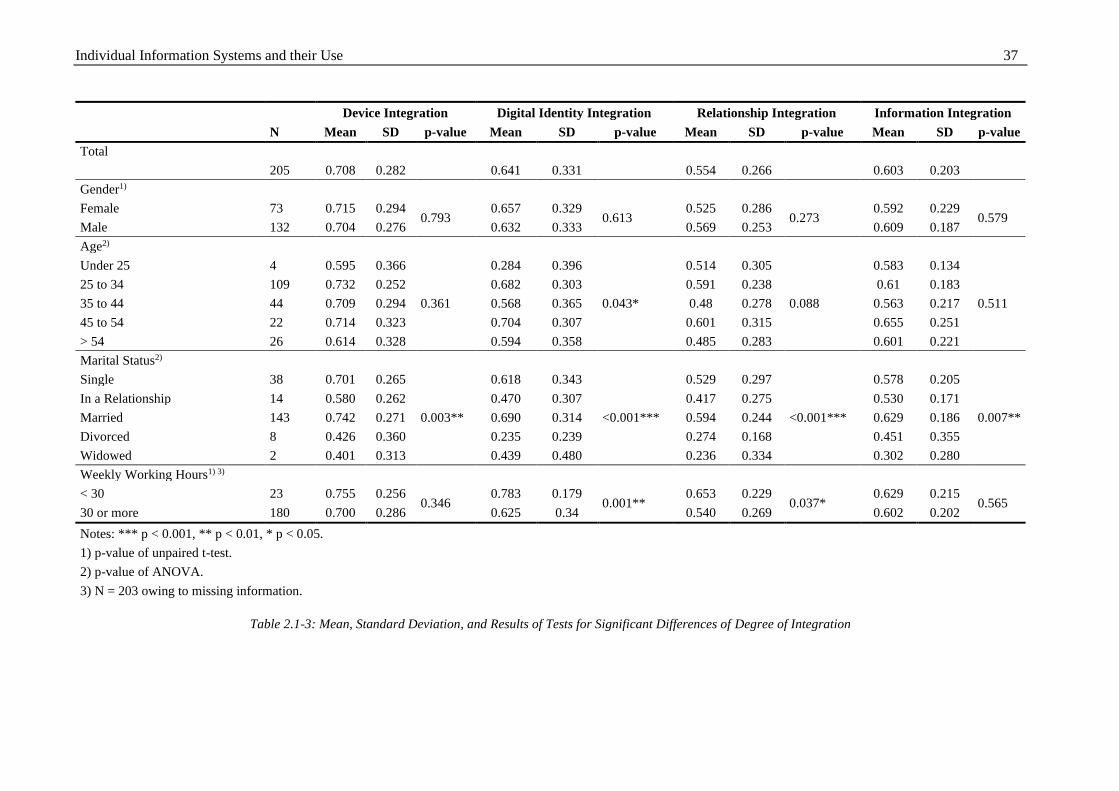
Individual Information Systems and their Use 37
Device Integration Digital Identity Integration Relationship Integration Information Integration
N Mean SD p-value Mean SD p-value Mean SD p-value Mean SD p-value
Total
205 0.708 0.282 0.641 0.331 0.554 0.266 0.603 0.203
Gender1)
Female 73 0.715 0.294 0.793
0.657 0.329 0.613
0.525 0.286 0.273
0.592 0.229 0.579
Male 132 0.704 0.276 0.632 0.333 0.569 0.253 0.609 0.187
Age2)
Under 25 4 0.595 0.366
0.361
0.284 0.396
0.043*
0.514 0.305
0.088
0.583 0.134
0.511
25 to 34 109 0.732 0.252 0.682 0.303 0.591 0.238 0.61 0.183
35 to 44 44 0.709 0.294 0.568 0.365 0.48 0.278 0.563 0.217
45 to 54 22 0.714 0.323 0.704 0.307 0.601 0.315 0.655 0.251
> 54 26 0.614 0.328 0.594 0.358 0.485 0.283 0.601 0.221
Marital Status2)
Single 38 0.701 0.265
0.003**
0.618 0.343
<0.001***
0.529 0.297
<0.001***
0.578 0.205
0.007**
In a Relationship 14 0.580 0.262 0.470 0.307 0.417 0.275 0.530 0.171
Married 143 0.742 0.271 0.690 0.314 0.594 0.244 0.629 0.186
Divorced 8 0.426 0.360 0.235 0.239 0.274 0.168 0.451 0.355
Widowed 2 0.401 0.313 0.439 0.480 0.236 0.334 0.302 0.280
Weekly Working Hours1) 3)
< 30 23 0.755 0.256 0.346
0.783 0.179 0.001**
0.653 0.229 0.037*
0.629 0.215 0.565
30 or more 180 0.700 0.286 0.625 0.34 0.540 0.269 0.602 0.202
Notes: *** p < 0.001, ** p < 0.01, * p < 0.05.
1) p-value of unpaired t-test.
2) p-value of ANOVA.
3) N = 203 owing to missing information.
Table 2.1-3: Mean, Standard Deviation, and Results of Tests for Significant Differences of Degree of Integration
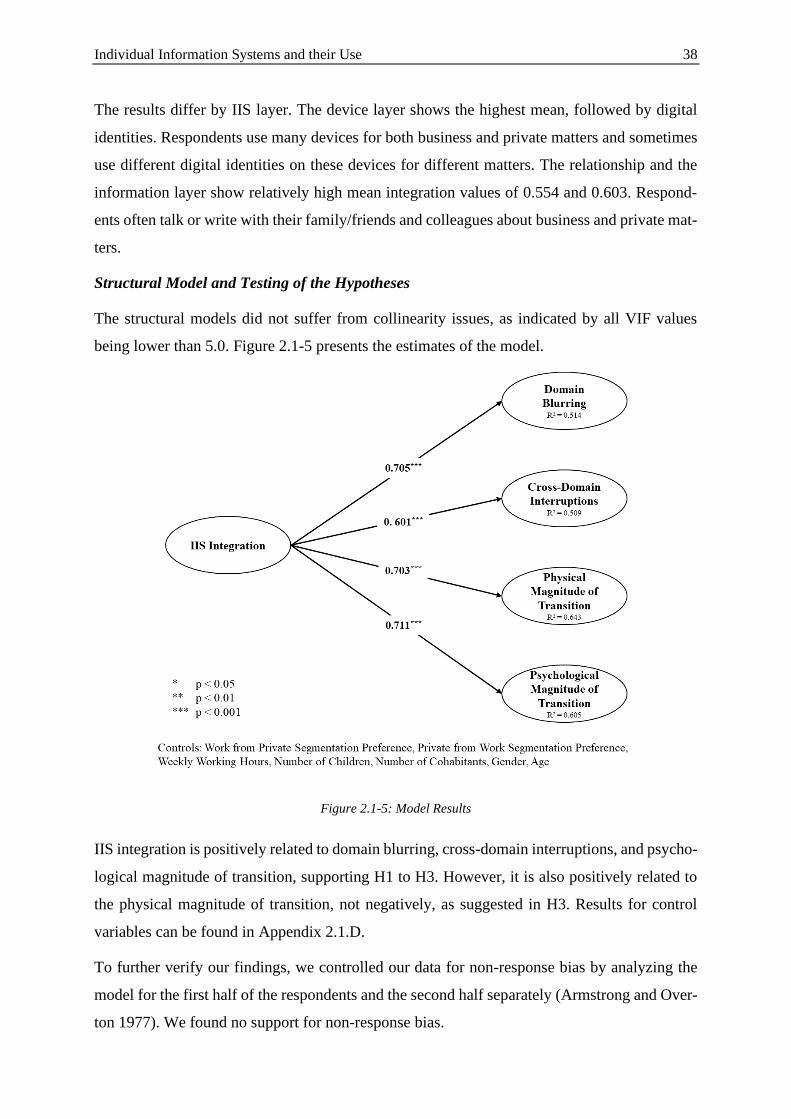
Individual Information Systems and their Use 38
The results differ by IIS layer. The device layer shows the highest mean, followed by digital
identities. Respondents use many devices for both business and private matters and sometimes
use different digital identities on these devices for different matters. The relationship and the
information layer show relatively high mean integration values of 0.554 and 0.603. Respond-
ents often talk or write with their family/friends and colleagues about business and private mat-
ters.
Structural Model and Testing of the Hypotheses
The structural models did not suffer from collinearity issues, as indicated by all VIF values
being lower than 5.0. Figure 2.1-5 presents the estimates of the model.
Figure 2.1-5: Model Results
IIS integration is positively related to domain blurring, cross-domain interruptions, and psycho-
logical magnitude of transition, supporting H1 to H3. However, it is also positively related to
the physical magnitude of transition, not negatively, as suggested in H3. Results for control
variables can be found in Appendix 2.1.D.
To further verify our findings, we controlled our data for non-response bias by analyzing the
model for the first half of the respondents and the second half separately (Armstrong and Over-
ton 1977). We found no support for non-response bias.
Individual Information Systems and their Use 39
Second, we checked for common method variance (CMV) by employing the correlational
marker technique as a post hoc test (Lindell and Whitney 2001; Richardson et al. 2009). We
partialled out the smallest and the second-smallest shared variance in bivariate correlations
among substantive exogenous latent variables. Since we found only minor changes in signifi-
cance of the bivariate correlation among these variables, we assume that CMV is not a concern
in this study. Also, we implemented the correlational marker technique with a theoretically
unrelated marker variable (Lindell and Whitney 2001; Richardson et al. 2009). Again, partial-
ling out the smallest and second-smallest shared variance between the marker and the substan-
tive exogenous variables resulted in no substantial changes in significance of bivariate correla-
tions. Thus, we do not find evidence that would point at CMV in our study.
Third, we did a robustness check on our measurement method by changing one of its specifi-
cations. As proposed, we calculated the DOI by weighting the partial integrations (doi) with the
usage frequency. For the robustness check, we built an unweighted mean. We ran the PLS al-
gorithm with the unweighted DOIs and found the same significant relationships. This finding
further verifies the core of our measurement method, which is to calculate the extent of IIS
integration by putting each component’s usage frequency for one domain into a relationship
with the other domain’s usage frequency, since changing one subordinate specification did not
change the results.
2.1.5 Discussion and Conclusion
We proposed a conceptualization for IIS and IIS integration. Thus, we defined four layers of
IIS, IIS integration as the overlap of IIS sub-systems from the private and business domains,
and developed a measurement method to quantify the integration. We also developed a theo-
retical model on the effects of IIS integration, which we tested in an empirical study to assess
our conceptualization. We found results that support the conceptualization of four IIS layers,
IIS integration, and the measurement method.
2.1.5.1 Discussion of Results
Our results support the definition of four layers of IIS: devices, digital identities, relationships,
and information. Since we derived the four layers from qualitative insights and prior literature
and assessed the construct for collinearity and content validity in our empirical analysis, we
found a substantial impact of each layer. Further, nomological validity was confirmed. Nomo-
logical validity implies that a construct’s validity “is demonstrated when the empirical relation-
ships observed with a measure match the theoretically postulated nomological net of the
Individual Information Systems and their Use 40
construct” (Judd et al. 1991, pp. 56-57). It was confirmed since we can put the construct into a
relationship with the theoretical constructs based on boundary theory and found statistically
significant relationships, most as expected. Further, except for the digital identities layer, all
layers’ outer loadings were significant, strengthening verification. Hence, we found a valid
specification of IIS integration and supports our conceptualization based on Baskerville
(2011a), Lee et al. (2015), and Gaß et al. (2015).
Support for the conceptualization of IIS integration also supports the method of measuring IIS
integration by aggregating usage overlap over components and putting the sub-systems’ usage
frequencies into a relationship with one another. Since we found the relationships of IIS inte-
gration derived from boundary theory already confirmed in research, we have support for the
method.
2.1.5.2 Theoretical Contributions
Our first theoretical contribution is the definition of four IIS layers. Thereby, we build upon
Baskerville’s (2011a) work and definition of IIS. Furthermore, our definition applies and ex-
tends Lee et al.’s (2015) three-layer definition of IS to IIS and includes the notions of Gaß et
al. (2015). This definition will help researchers understand IIS better since the four layers can
be analyzed and designed separately. Overall, these contributions add to the young yet sparse
literature stream on IIS and will strengthen its importance within IS research.
Second, we make an important contribution to the literature by conceptualizing IIS integration.
With our definition, we extend prior notions of IIS integration that investigate the integration
of only parts of an IIS and neglect the fact that integration may differ between the layers. Dif-
ferent layers of an IIS may have different consequences on the individual. We extend these
notions taking a holistic view of IIS and present a conceptualization of IIS integration regarding
all four layers of IIS. This will help future research better understand the effects of different
kinds of IIS integration and give more exact suggestions for building IISs with an individually
optimal extent of integration on the different layers. Our investigation focuses on the two major
domains of life: private and business. However, our conceptualization can be adopted to other
domains as well. Accordingly, it can be used to investigate different sub-domains of the private
domain (e.g., family domain and the domain of the engagement in charity) or different sub-
domains of the business domain (e.g., the domains of different organizational teams of which
the individual is a member).
Third, the measurement method contributes to future studies. Thus, researchers can investigate
the consequences of different degrees of IIS integration. This ability better meets the notion of
Individual Information Systems and their Use 41
a continuum between complete integration and segmentation than, for instance, sorting individ-
uals into three groups with different integration states, as per Jahn et al. (2016) and Duxbury et
al. (2014).
Fourth, by being able to confirm IIS integration’s effect on the boundary theory constructs (e.g.,
blurring and interruptions), we found support for the transfer of boundary theory to IIS research.
Since we investigated IIS as a whole, we extend the work of Köffer et al. (2014a), Wang et al.
(2016), and Yun et al. (2012), who focused only on smartphones and instant messaging. Future
research should take up this finding and further investigate the reasons and consequences of IIS
integration. Further, we contribute to boundary theory since we point out and demonstrate IIS’s
relevance as a boundary management tactic along with the more traditional tactics.
We also provide exploratory findings on the relationship between the extent of IIS integration
by layer with gender, age, marital status, and working hours. These findings may inspire and
inform future theorizing.
2.1.5.3 Practical Implications
Our results suggest different practical implications for individuals, organizations, and IT de-
signers. Individuals must understand the different implications of IIS’s design affecting its in-
tegration, like blurring and cross-domain interruptions. However, individuals differ in their ex-
tent of integration that is ideal and most efficient for them. Thus, individuals should explore the
different consequences to be able to construct an IIS as suitable for themselves and as their
organization or social environment allow.
Organizations should be aware that their employees differ in the optimal extent of integration
and should enable them to create their IIS as integrated or segmented as they prefer. Bring your
own device policies, allowing private use of business email, and clearly defining which work-
related information may be shared with family and friends are possible ways to facilitate IIS
integration. However, organizations should also allow for keeping the IIS segmented. If em-
ployees can optimize their individual extent of IIS integration they may bring the highest benefit
for the organization.
IT designers can support constructing an individual’s optimal IIS by technology that allows
users to switch between integration and segmentation. For instance, smartphones should be able
to distinguish if a caller is business-related or private, so that the user can decide whether cross-
domain interruptions should be permitted or not at a given time or place.
Individual Information Systems and their Use 42
2.1.5.4 Limitations and Outlook
Our findings have limitations. We measured the integration of IIS by respondents’ self-report-
ing on the usage frequency of the IIS components. Future research could advance data collec-
tion and measure IIS integration objectively, such as via automated device and digital identity
usage measurement. Further, we did not differentiate between the direction of IIS integration
(i.e., the differentiation between private IIS components reaching into the business domain and
vice versa). Future research could pick up on that and deepen the understanding of IIS integra-
tion in that regard. Also, we restricted our data collection to communication as the main use
case of IIS. Although communication is an important use case in both the business and the
private domain, further studies should measure the integration of IIS as a whole.
Besides these limitations, we introduced four layers of IIS, conceptualized IIS integration, and
presented a measurement model for IIS integration. Since both the private and business domains
will remain important to individuals, researchers should investigate the reasons and conse-
quences of IIS integration. Further, future research should provide individuals with solutions to
handle and to be able to consciously define IIS integration on each layer in order to reduce
adverse effects.
Individual Information Systems and their Use 43
2.1.6 References
Ahuja, M. K., Chudoba, K. M., Kacmar, C. J., McKnight, D. H., and George, J. F. 2007. “IT
Road Warriors: Balancing Work-Family Conflict, Job Autonomy, and Work Overload to
Mitigate Turnover Intentions,” Management Information Systems Quarterly (31:1), pp. 1-
17.
Alter, S. 2008. “Defining Information Systems as Work Systems: Implications for the IS Field,”
European Journal of Information Systems (17:5), pp. 448-469.
Armstrong, J. S., and Overton, T. S. 1977. “Estimating Nonresponse Bias in Mail Surveys,”
Journal of Marketing Research (14:3), pp. 396-402.
Ashforth, B. E., Kreiner, G. E., and Fugate, M. 2000. “All in a Day’s Work: Boundaries and
Micro Role Transitions,” The Academy of Management Review (25:3), pp. 472-491.
Ayyagari, R., Grover, V., and Purvis, R. 2011. “Technostress: Technological Antecedents and
Implications,” Management Information Systems Quarterly (35:4), pp. 831-858.
Baskerville, R. L. 2011a. “Design Theorizing Individual Information Systems,” in Proceedings
of the 15th Pacific Asia Conference on Information Systems, Brisbane, Australia, pp. 1-13.
Baskerville, R. L. 2011b. “Individual Information Systems as a Research Arena,” European
Journal of Information Systems (20:3), pp. 251-254.
Baskerville, R. L., and Lee, A. S. 2013. “Individual Organizational Bindpoints: A Design The-
ory for Bring-Your-Own-System,” in Proceedings of the 17th Pacific Asia Conference on
Information Systems, Jeju Island, Korea, pp. 1-12.
Behrens, S. 2009. “Shadow Systems: The Good, the Bad and the Ugly,” Communications of
the ACM (52:2), pp. 124-129.
Berger, S., Denner, M.-S., and Röglinger, M. 2018. “The Nature of Digital Technologies: De-
velopment of a Multi-Layer Taxonomy,” in Proceedings of the 26th European Conference
on Information Systems, Portsmouth, UK, pp. 1-18.
Chamakiotis, P., Whiting, R., Symon, G., and Roby, H. 2014. “Exploring Transitions and
Work-Life Balance in the Digital Era,” in Proceedings of the 22nd European Conference
on Information Systems, Tel Aviv, pp. 1-9.
Chen, A., and Karahanna, E. 2014. “Boundaryless Technology: Understanding the Effects of
Technology-Mediated Interruptions across the Boundaries between Work and Personal
Life,” Transactions on Human-Computer Interaction (6:2), pp. 16-36.
Individual Information Systems and their Use 44
Chmielewski, M., and Kucker, S. C. 2020. “An MTurk Crisis?: Shifts in Data Quality and the
Impact on Study Results,” Social Psychological and Personality Science (11:4), pp. 464-
473.
Clark, S. C. 2002. “Communicating Across the Work/Home Border,” Community, Work &
Family (5:1), pp. 23-48.
Del Prete, C., Levitas, D., Grieser, T., Turner, M. J., Pucciarelli, J., and Hudson, S. 2011. IT
Consumers Transform the Enterprise: Are You Ready? Framingham, Massachusetts, USA:
IDC.
Dell and Intel (ed.) 2011. “The Evolving Workforce: Expert Insights,”
Desrochers, S., Hilton, J. M., and Larwood, L. 2005. “Preliminary Calidation of the Work-
Family Integration-Blurring Scale,” Journal of Family Issues (26:4), pp. 442-466.
Duxbury, L., Higgins, C., Smart, R., and Stevenson, M. 2014. “Mobile Technology and Bound-
ary Permeability,” British Journal of Management (25:3), pp. 570-588.
Fenner, G. H., and Renn, R. W. 2010. “Technology-Assisted Supplemental Work and Work-
to-Family Conflict: The Role of Instrumentality Beliefs, Organizational Expectations and
Time Management,” Human Relations (63:1), pp. 62-82.
Fonner, K. L., and Stache, L. C. 2012. “All in a Day’s Work, at Home: Teleworkers’ Manage-
ment of Micro Role Transitions and the Work-Home Boundary,” New Technology, Work
and Employment (27:3), pp. 242-257.
Gaß, O., Ortbach, K., Kretzer, M., Mädche, A., and Niehaves, B. 2015. “Conceptualizing Indi-
vidualization in Information Systems: A Literature Review,” Communications of the Asso-
ciation for Information Systems (37:1), pp. 64-88.
Global Workplace Analytics 2016. Latest Telecommuting Statistics - Global Workplace Ana-
lytics. http://globalworkplaceanalytics.com/telecommuting-statistics. Accessed Accessed
19 December 2016.
Golden, A. G., and Geisler, C. 2007. “Work-Life Boundary Management and the Personal Dig-
ital Assistant,” Human Relations (60:3), pp. 519-551.
Greenhaus, J. H., and Beutell, N. J. 1985. “Sources of Conflict between Work and Family
Roles,” The Academy of Management Review (10:1), pp. 76-88.
Hair, J. F., Hult, G. T. M., Ringle, C. M., and Sarstedt, M. 2014. A Primer on Partial Least
Squares Structural Equation Modeling (PLS-SEM), Thousand Oaks: Sage Publications.
Harris, J. G., Ives, B., and Junglas, I. 2012. “IT Consumerization: When Gadgets Turn Into
Enterprise IT Tools,” Management Information Systems Quarterly Executive (11:3), pp. 99-
112.
Individual Information Systems and their Use 45
Hinkin, T. R. 1998. “A Brief Tutorial on the Development of Measures for Use in Survey Ques-
tionnaires,” Organizational Research Methods (1:1), pp. 104-121.
Jahn, K., Klesel, M., Lemmer, K., Weigel, A., and Niehaves, B. 2016. “Individual Boundary
Management: An Empirical Investigation on Technology-Related Tactics,” in Proceedings
of the 20th Pacific Asia Conference on Information Systems, Chiayi, Taiwan, pp. 1-12.
Judd, C. M., Smith, E. R., and Kidder, L. H. 1991. Research Methods in Social Relations, Fort
Worth: Holt, Rinehart, and Winston.
Katz, D., and Kahn, R. L. 1978. The Social Psychology of Organizations, New York: Wiley.
Koch, H., Gonzalez, E., and Leidner, D. 2012. “Bridging the Work/Social Divide: The Emo-
tional Response to Organizational Social Networking Sites,” European Journal of Infor-
mation Systems (21:6), pp. 699-717.
Köffer, S., Anlauf, L., Ortbach, K., and Niehaves, B. 2015. “The Intensified Blurring of Bound-
aries Between Work and Private Life through IT Consumerisation,” in Proceedings of the
23rd European Conference on Information Systems, Muenster, Germany, pp. 1-17.
Köffer, S., Junglas, I., Chiperi, C., and Niehaves, B. 2014a. “Dual Use of Mobile IT and Work-
to-Life Conflict in the Context of IT Consumerization,” in Proceedings of the 35th Interna-
tional Conference on Information Systems, Auckland, New Zealand, pp. 1-19.
Köffer, S., Ortbach, K., and Niehaves, B. 2014b. “Exploring the Relationship between IT Con-
sumerization and Job Performance: A Theoretical Framework for Future Research,” Com-
munications of the Association for Information Systems (35:1), pp. 261-283.
Kreiner, G. E. 2006. “Consequences of Work-Home Segmentation or Integration: A Person-
Environment Fit Perspective,” Journal of Organizational Behavior (27:4), pp. 485-507.
Lee, A. S., Thomas, M., and Baskerville, R. L. 2015. “Going Back to Basics in Design Science:
From the Information Technology Artifact to the Information Systems Artifact,” Infor-
mation Systems Journal (25:1), pp. 5-21.
Lindell, M. K., and Whitney, D. J. 2001. “Accounting for Common Method Variance in Cross-
Sectional Research Designs,” The Journal of Applied Psychology (86:1), pp. 114-121.
MacCormick, J. S., Dery, K., and Kolb, D. G. 2012. “Engaged or Just Connected?: Smartphones
and Employee Engagement,” Organizational Dynamics (41:3), pp. 194-201.
MacKenzie, S. B., Podsakoff, P. M., and Podsakoff, N. P. 2011. “Construct Measurement and
Validation Procedures in MIS and Behavioral Research: Integrating New and Existing
Techniques,” Management Information Systems Quarterly (35:2), pp. 293-334.
Individual Information Systems and their Use 46
Middleton, C., Scheepers, R., and Tuunainen, V. K. 2014. “When Mobile is the Norm: Re-
searching Mobile Information Systems and Mobility as Post-Adoption Phenomena,” Euro-
pean Journal of Information Systems (23:5), pp. 503-512.
Moore, G. C., and Benbasat, I. 1991. “Development of an Instrument to Measure the Percep-
tions of Adopting an Information Technology Innovation,” Information Systems Research
(2:3), pp. 192-222.
Murdoch, R., Harris, J. G., and Devore, G. 2010. “Can Enterprise IT Survive the Meteor of
Consumer Technology?” Accenture Institute for High Performance, pp. 1-8.
Niehaves, B., Köffer, S., and Ortbach, K. 2012. “IT Consumerization: A Theory and Practice
Review,” in Proceedings of the 18th Americas Conference on Information Systems, Seattle,
Washington, USA, pp. 1-9.
Nippert-Eng, C. 1996. “Calendars and Keys: The Classification of “Home” and “Work”,” So-
ciological Forum (11:3), pp. 563-582.
Oppenheimer, D. M., Meyvis, T., and Davidenko, N. 2009. “Instructional Manipulation
Checks: Detecting Satisficing to Increase Statistical Power,” Journal of Experimental Social
Psychology (45:4), pp. 867-872.
Ortbach, K. 2015. “Unraveling the Effect of Personal Innovativeness on Bring-Your-Own-De-
vice (BYOD) Intention: The Role of Perceptions towards Enterprise-Provided and Pri-
vately-Owned Technologies,” in Proceedings of the 23rd European Conference on Infor-
mation Systems, Muenster, Germany, pp. 1-17.
Ortbach, K., Köffer, S., Bode, M., and Niehaves, B. 2013. “Individualization of Information
Systems: Analyzing Antecedents of IT Consumerization Behavior,” in Proceedings of the
34th International Conference on Information Systems, Milan, Italy, pp. 1-18.
Park, Y., and Jex, S. M. 2011. “Work-Home Boundary Management Using Communication
and Information Technology,” International Journal of Stress Management (18:2), pp. 133-
152.
Pirkkalainen, H., and Salo, M. 2016. “Two Decades of the Dark Side in the Information Sys-
tems Basket: Suggesting Five Areas for Future Research,” in Proceedings of the 24th Eu-
ropean Conference on Information Systems, Istanbul, Turkey, pp. 1-16.
Poushter, J. 2016. “Smartphone Ownership and Internet Usage Continues to Climb in Emerging
Economies,” PewResearchCenter (ed.).
Richardson, H. A., Simmering, M. J., and Sturman, M. C. 2009. “A Tale of Three Perspectives:
Examining Post Hoc Statistical Techniques for Detection and Correction of Common
Method Variance,” Organizational Research Methods (12:4), pp. 762-800.
Individual Information Systems and their Use 47
Rothbard, N. P., Phillips, K. W., and Dumas, T. L. 2005. “Managing Multiple Roles: Work-
Family Policies and Individuals’ Desires for Segmentation,” Organization Science (16:3),
pp. 243-258.
Scheepers, R., and Middleton, C. 2013. “Personal ICT Ensembles and Ubiquitous Information
Systems Environments: Key Issues and Research Implications,” Communications of the As-
sociation for Information Systems (33), pp. 381-392.
Thatcher, J. B., Wright, R. T., Sun, H., Zagenczyk, T. J., and Klein, R. 2018. “Mindfulness in
Information Technology Use: Definitions, Distinctions, and a New Measure,” Management
Information Systems Quarterly (42:3), pp. 831-847.
Tourangeau, R., Rips, L. J., and Rasinski, K. 2000. The Psychology of Survey Response, Cam-
bridge: Cambridge University Press.
vor dem Esche, J., and Hennig-Thurau, T. 2014. “German Digitalization Consumer Report
2014,” Digitalization Think:Lab (ed.).
Wang, C.-C., Yang, Y. Y.-H., and Tseng, C.-Y. 2016. “Always on Duty?: The Positive and
Negative Effects of Using Mobile Social Networking Tools for Work,” in Proceedings of
the 20th Pacific Asia Conference on Information Systems, Chiayi, Taiwan, pp. 1-16.
Wang, W., and Zhang, Y. 2015. “From IT Satisfaction to Job Satisfaction: Understanding the
Role of User-Technology Fit,” in Proceedings of the 19th Pacific Asia Conference on In-
formation Systems, Singapore, pp. 1-15.
Weeger, A., Wang, X., and Gewald, H. 2015. “IT Consumerization: BYOD-Program Ac-
ceptance and its Impact on Employer Attractiveness,” Journal of Computer Information
Systems (56:1), pp. 1-10.
Yun, H., Kettinger, W. J., and Lee, C. C. 2012. “A New Open Door: The Smartphone’s Impact
on Work-to-Life Conflict, Stress, and Resistance,” International Journal of Electronic
Commerce (16:4), pp. 121-152.
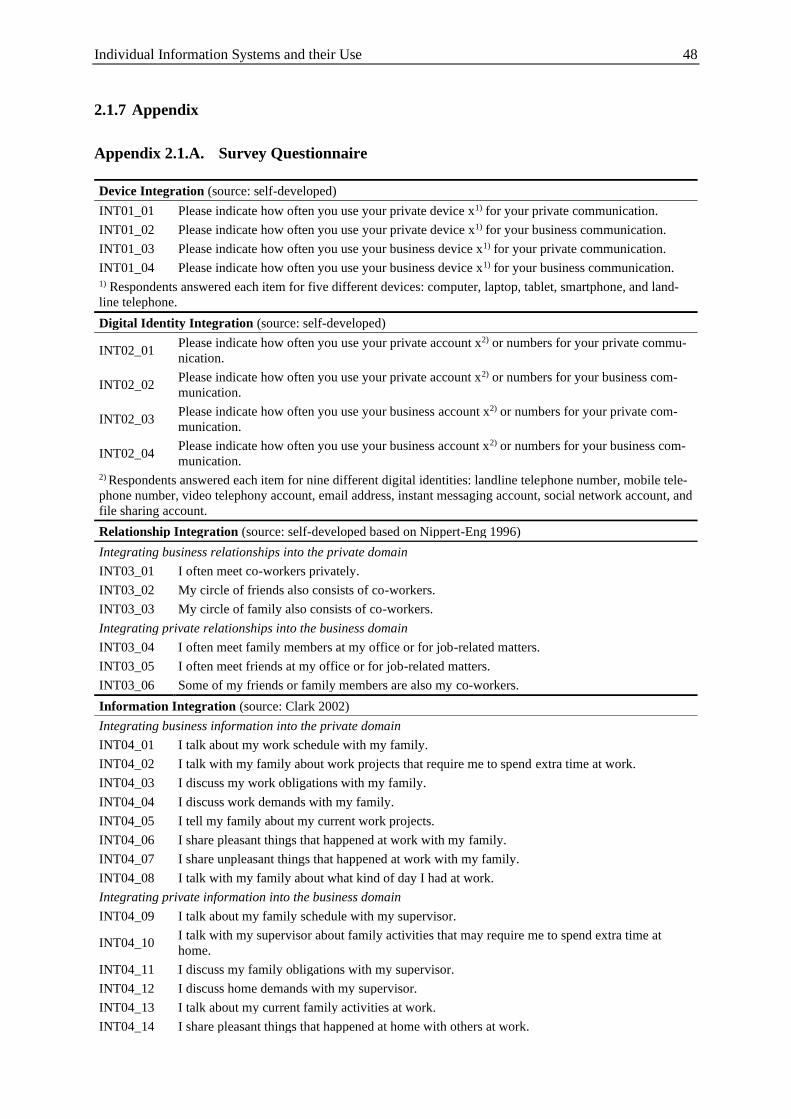
Individual Information Systems and their Use 48
2.1.7 Appendix
Appendix 2.1.A. Survey Questionnaire
Device Integration (source: self-developed)
INT01_01 Please indicate how often you use your private device x1) for your private communication.
INT01_02 Please indicate how often you use your private device x1) for your business communication.
INT01_03 Please indicate how often you use your business device x1) for your private communication.
INT01_04 Please indicate how often you use your business device x1) for your business communication. 1) Respondents answered each item for five different devices: computer, laptop, tablet, smartphone, and land-
line telephone.
Digital Identity Integration (source: self-developed)
INT02_01 Please indicate how often you use your private account x2) or numbers for your private commu-
nication.
INT02_02 Please indicate how often you use your private account x2) or numbers for your business com-
munication.
INT02_03 Please indicate how often you use your business account x2) or numbers for your private com-
munication.
INT02_04 Please indicate how often you use your business account x2) or numbers for your business com-
munication. 2) Respondents answered each item for nine different digital identities: landline telephone number, mobile tele-
phone number, video telephony account, email address, instant messaging account, social network account, and
file sharing account.
Relationship Integration (source: self-developed based on Nippert-Eng 1996)
Integrating business relationships into the private domain
INT03_01 I often meet co-workers privately.
INT03_02 My circle of friends also consists of co-workers.
INT03_03 My circle of family also consists of co-workers.
Integrating private relationships into the business domain
INT03_04 I often meet family members at my office or for job-related matters.
INT03_05 I often meet friends at my office or for job-related matters.
INT03_06 Some of my friends or family members are also my co-workers.
Information Integration (source: Clark 2002)
Integrating business information into the private domain
INT04_01 I talk about my work schedule with my family.
INT04_02 I talk with my family about work projects that require me to spend extra time at work.
INT04_03 I discuss my work obligations with my family.
INT04_04 I discuss work demands with my family.
INT04_05 I tell my family about my current work projects.
INT04_06 I share pleasant things that happened at work with my family.
INT04_07 I share unpleasant things that happened at work with my family.
INT04_08 I talk with my family about what kind of day I had at work.
Integrating private information into the business domain
INT04_09 I talk about my family schedule with my supervisor.
INT04_10 I talk with my supervisor about family activities that may require me to spend extra time at
home.
INT04_11 I discuss my family obligations with my supervisor.
INT04_12 I discuss home demands with my supervisor.
INT04_13 I talk about my current family activities at work.
INT04_14 I share pleasant things that happened at home with others at work.
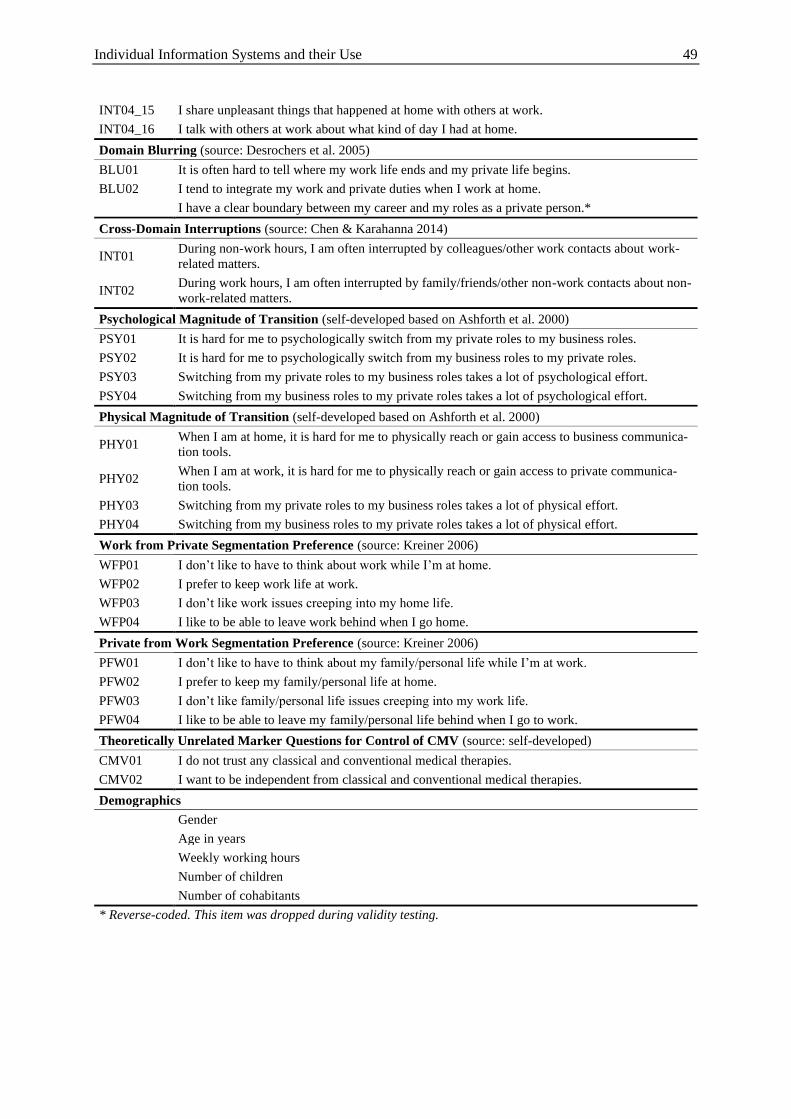
Individual Information Systems and their Use 49
INT04_15 I share unpleasant things that happened at home with others at work.
INT04_16 I talk with others at work about what kind of day I had at home.
Domain Blurring (source: Desrochers et al. 2005)
BLU01 It is often hard to tell where my work life ends and my private life begins.
BLU02 I tend to integrate my work and private duties when I work at home.
I have a clear boundary between my career and my roles as a private person.*
Cross-Domain Interruptions (source: Chen & Karahanna 2014)
INT01 During non-work hours, I am often interrupted by colleagues/other work contacts about work-
related matters.
INT02 During work hours, I am often interrupted by family/friends/other non-work contacts about non-
work-related matters.
Psychological Magnitude of Transition (self-developed based on Ashforth et al. 2000)
PSY01 It is hard for me to psychologically switch from my private roles to my business roles.
PSY02 It is hard for me to psychologically switch from my business roles to my private roles.
PSY03 Switching from my private roles to my business roles takes a lot of psychological effort.
PSY04 Switching from my business roles to my private roles takes a lot of psychological effort.
Physical Magnitude of Transition (self-developed based on Ashforth et al. 2000)
PHY01 When I am at home, it is hard for me to physically reach or gain access to business communica-
tion tools.
PHY02 When I am at work, it is hard for me to physically reach or gain access to private communica-
tion tools.
PHY03 Switching from my private roles to my business roles takes a lot of physical effort.
PHY04 Switching from my business roles to my private roles takes a lot of physical effort.
Work from Private Segmentation Preference (source: Kreiner 2006)
WFP01 I don’t like to have to think about work while I’m at home.
WFP02 I prefer to keep work life at work.
WFP03 I don’t like work issues creeping into my home life.
WFP04 I like to be able to leave work behind when I go home.
Private from Work Segmentation Preference (source: Kreiner 2006)
PFW01 I don’t like to have to think about my family/personal life while I’m at work.
PFW02 I prefer to keep my family/personal life at home.
PFW03 I don’t like family/personal life issues creeping into my work life.
PFW04 I like to be able to leave my family/personal life behind when I go to work.
Theoretically Unrelated Marker Questions for Control of CMV (source: self-developed)
CMV01 I do not trust any classical and conventional medical therapies.
CMV02 I want to be independent from classical and conventional medical therapies.
Demographics
Gender
Age in years
Weekly working hours
Number of children
Number of cohabitants
* Reverse-coded. This item was dropped during validity testing.
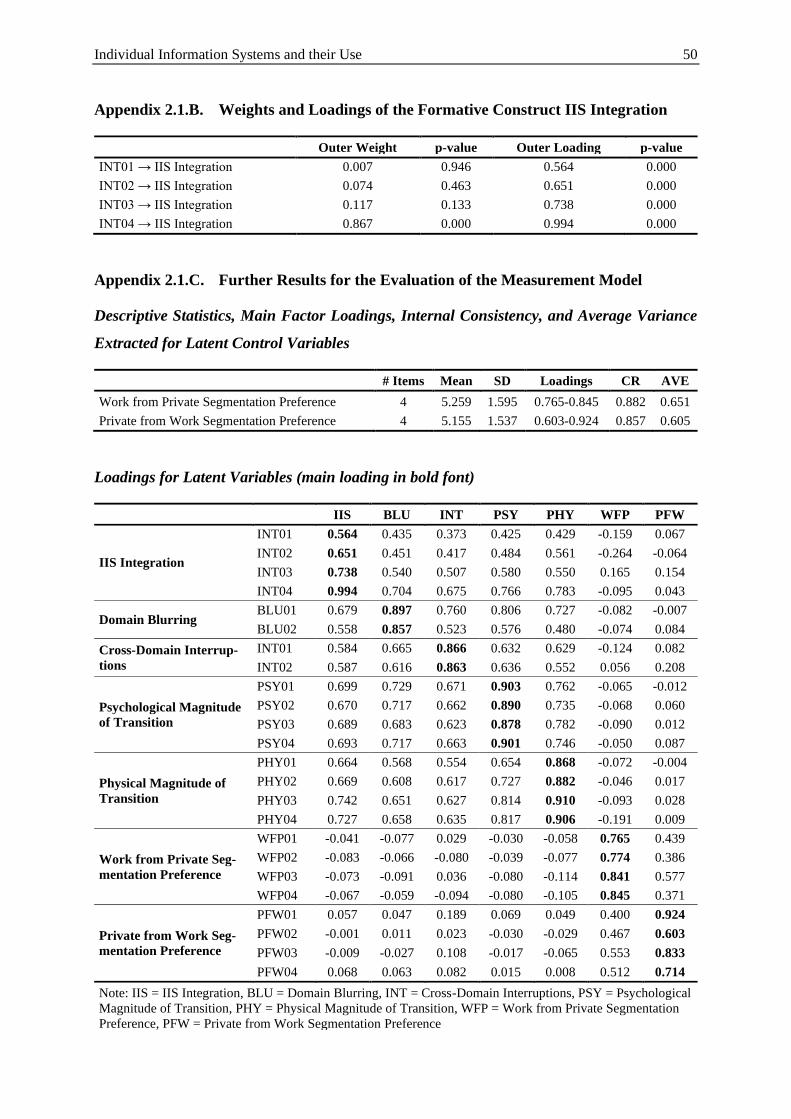
Individual Information Systems and their Use 50
Appendix 2.1.B. Weights and Loadings of the Formative Construct IIS Integration
Outer Weight p-value Outer Loading p-value
INT01 → IIS Integration 0.007 0.946 0.564 0.000
INT02 → IIS Integration 0.074 0.463 0.651 0.000
INT03 → IIS Integration 0.117 0.133 0.738 0.000
INT04 → IIS Integration 0.867 0.000 0.994 0.000
Appendix 2.1.C. Further Results for the Evaluation of the Measurement Model
Descriptive Statistics, Main Factor Loadings, Internal Consistency, and Average Variance
Extracted for Latent Control Variables
# Items Mean SD Loadings CR AVE
Work from Private Segmentation Preference 4 5.259 1.595 0.765-0.845 0.882 0.651
Private from Work Segmentation Preference 4 5.155 1.537 0.603-0.924 0.857 0.605
Loadings for Latent Variables (main loading in bold font)
IIS BLU INT PSY PHY WFP PFW
IIS Integration
INT01 0.564 0.435 0.373 0.425 0.429 -0.159 0.067
INT02 0.651 0.451 0.417 0.484 0.561 -0.264 -0.064
INT03 0.738 0.540 0.507 0.580 0.550 0.165 0.154
INT04 0.994 0.704 0.675 0.766 0.783 -0.095 0.043
Domain Blurring BLU01 0.679 0.897 0.760 0.806 0.727 -0.082 -0.007
BLU02 0.558 0.857 0.523 0.576 0.480 -0.074 0.084
Cross-Domain Interrup-
tions
INT01 0.584 0.665 0.866 0.632 0.629 -0.124 0.082
INT02 0.587 0.616 0.863 0.636 0.552 0.056 0.208
Psychological Magnitude
of Transition
PSY01 0.699 0.729 0.671 0.903 0.762 -0.065 -0.012
PSY02 0.670 0.717 0.662 0.890 0.735 -0.068 0.060
PSY03 0.689 0.683 0.623 0.878 0.782 -0.090 0.012
PSY04 0.693 0.717 0.663 0.901 0.746 -0.050 0.087
Physical Magnitude of
Transition
PHY01 0.664 0.568 0.554 0.654 0.868 -0.072 -0.004
PHY02 0.669 0.608 0.617 0.727 0.882 -0.046 0.017
PHY03 0.742 0.651 0.627 0.814 0.910 -0.093 0.028
PHY04 0.727 0.658 0.635 0.817 0.906 -0.191 0.009
Work from Private Seg-
mentation Preference
WFP01 -0.041 -0.077 0.029 -0.030 -0.058 0.765 0.439
WFP02 -0.083 -0.066 -0.080 -0.039 -0.077 0.774 0.386
WFP03 -0.073 -0.091 0.036 -0.080 -0.114 0.841 0.577
WFP04 -0.067 -0.059 -0.094 -0.080 -0.105 0.845 0.371
Private from Work Seg-
mentation Preference
PFW01 0.057 0.047 0.189 0.069 0.049 0.400 0.924
PFW02 -0.001 0.011 0.023 -0.030 -0.029 0.467 0.603
PFW03 -0.009 -0.027 0.108 -0.017 -0.065 0.553 0.833
PFW04 0.068 0.063 0.082 0.015 0.008 0.512 0.714
Note: IIS = IIS Integration, BLU = Domain Blurring, INT = Cross-Domain Interruptions, PSY = Psychological
Magnitude of Transition, PHY = Physical Magnitude of Transition, WFP = Work from Private Segmentation
Preference, PFW = Private from Work Segmentation Preference
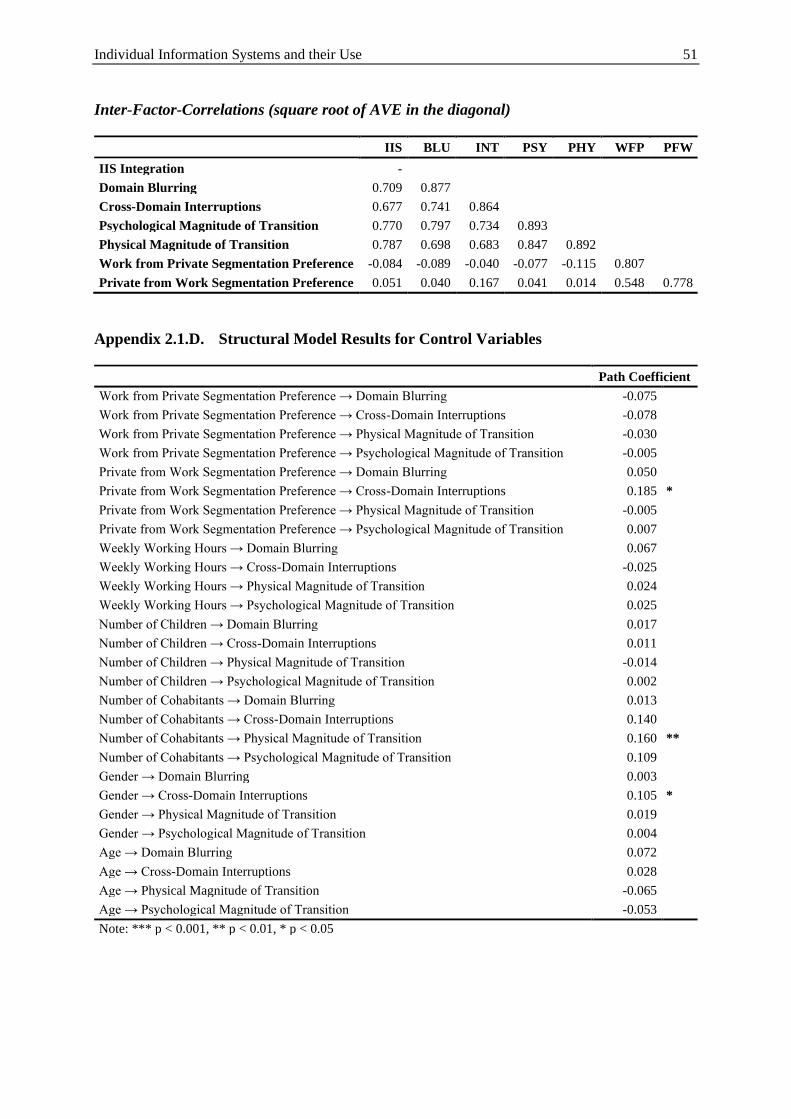
Individual Information Systems and their Use 51
Inter-Factor-Correlations (square root of AVE in the diagonal)
IIS BLU INT PSY PHY WFP PFW
IIS Integration -
Domain Blurring 0.709 0.877
Cross-Domain Interruptions 0.677 0.741 0.864
Psychological Magnitude of Transition 0.770 0.797 0.734 0.893
Physical Magnitude of Transition 0.787 0.698 0.683 0.847 0.892
Work from Private Segmentation Preference -0.084 -0.089 -0.040 -0.077 -0.115 0.807
Private from Work Segmentation Preference 0.051 0.040 0.167 0.041 0.014 0.548 0.778
Appendix 2.1.D. Structural Model Results for Control Variables
Path Coefficient
Work from Private Segmentation Preference → Domain Blurring -0.075
Work from Private Segmentation Preference → Cross-Domain Interruptions -0.078
Work from Private Segmentation Preference → Physical Magnitude of Transition -0.030
Work from Private Segmentation Preference → Psychological Magnitude of Transition -0.005
Private from Work Segmentation Preference → Domain Blurring 0.050
Private from Work Segmentation Preference → Cross-Domain Interruptions 0.185 *
Private from Work Segmentation Preference → Physical Magnitude of Transition -0.005
Private from Work Segmentation Preference → Psychological Magnitude of Transition 0.007
Weekly Working Hours → Domain Blurring 0.067
Weekly Working Hours → Cross-Domain Interruptions -0.025
Weekly Working Hours → Physical Magnitude of Transition 0.024
Weekly Working Hours → Psychological Magnitude of Transition 0.025
Number of Children → Domain Blurring 0.017
Number of Children → Cross-Domain Interruptions 0.011
Number of Children → Physical Magnitude of Transition -0.014
Number of Children → Psychological Magnitude of Transition 0.002
Number of Cohabitants → Domain Blurring 0.013
Number of Cohabitants → Cross-Domain Interruptions 0.140
Number of Cohabitants → Physical Magnitude of Transition 0.160 **
Number of Cohabitants → Psychological Magnitude of Transition 0.109
Gender → Domain Blurring 0.003
Gender → Cross-Domain Interruptions 0.105 *
Gender → Physical Magnitude of Transition 0.019
Gender → Psychological Magnitude of Transition 0.004
Age → Domain Blurring 0.072
Age → Cross-Domain Interruptions 0.028
Age → Physical Magnitude of Transition -0.065
Age → Psychological Magnitude of Transition -0.053
Note: *** p < 0.001, ** p < 0.01, * p < 0.05
Individual Information Systems and their Use 52
2.2 Understanding Employees’ IT Service Consumerization Behavior: How
Post-adoptive Reasoning Drives Use
Abstract
Though IT consumerization brings chances for individuals and organizations, some important
risks, such as information security and privacy issues, arise. With mobile devices and private
mobile data plans widely available, employees can use private consumer IT services for busi-
ness purposes with little to no dependencies to the existing organizational infrastructure. This
complicates the possibilities for governance of IT use by organizations and makes it increas-
ingly difficult to control the disadvantages of IT consumerization. Therefore, an understanding
of the mechanisms by which employees choose to engage in IT consumerization is necessary.
Existing studies on IT consumerization focus primarily on the adoption of private IT devices,
rather than on IT services, like file sharing or instant messaging. However, a detailed view of
the relative advantages presented by these services is essential to understand the usage decisions
in a post-adoptive phase. As a complementary perspective, this paper thus investigates reasons
for IT service consumerization behavior using a mixed-methods approach. We use a net-va-
lence model to analyze benefits and risks of IT service consumerization. Building on knowledge
from post-adoption literature, survey data shows evidence that on the benefit side, functionali-
ties of IT services matter. On the risk side, IT policies may be an effective way to manage IT
service consumerization – but only if policy breaches lead to perceived sanctions for the indi-
vidual. These quantitative results are enhanced by qualitative findings that amongst others give
further insights on the effect of functionalities of IT services on IT service consumerization
behavior. This paper adds to the scientific body of knowledge by detailing the understanding
of IT consumerization on a service layer and derives practical implications for IT departments
on how to manage IT service consumerization more efficiently, that is, organizations have to
provide high functionality in their own IT services to retain control over the used IT services.
Keywords: IT Consumerization, IT Services, Individual Information Systems, Technology Ac-
ceptance, Communication, Collaboration, Survey Research, Structural Equation Modeling
Authors: Manfred Schoch (M. Sc.), Julia Lanzl (M. Sc.), Prof. Dr. Henner Gimpel
Status: Working paper under review for publication.
Individual Information Systems and their Use 53
2.2.1 Introduction
With the rise of portable and mobile IT devices such as laptops, tablets, and smartphones, con-
sumers have increasingly started to bring their own consumer IT into their workplaces which
introduces potential chances as well as risks to the organizations (Harris et al. 2012). The trend
towards work from home and mobile work during the COVID-19 pandemic has further
strengthened the use of employees’ consumer IT for work purposes. As Baskerville (2011b)
pointed out, the digitization of the individual has increased to the point where individuals op-
erate, run, and administrate vast parts of their increasingly complex individual information sys-
tems (IIS) by themselves.
Many companies have adopted bring your own device (BYOD) policies in the hopes of reduc-
ing their information technology expenses and increasing productivity and convenience (Lee et
al. 2017). With consumer software and mobile applications widely available at low cost, em-
ployees also start to bring their privately-owned applications and services. IT services provide
aspects of different layers of an IS such as infrastructure, platforms, and software (Demirkan et
al. 2008) and are often agile, scalable, and innovative and, thus, have been associated with
advantages for their users, such as increased creativity, innovativeness, mobility, flexibility,
and productivity (e.g., Behrens 2009; Ortbach 2015; Weeger et al. 2015). However, emerging
risks, such as IT security and data privacy implications (e.g., Crossler et al. 2014; Gewald et al.
2017; Ortbach et al. 2013; Weeger et al. 2015), and a loss of organizational control (Behrens
2009) arise. In that regard, researchers and practitioners see the usage of consumer IT as a
contributor to shadow IT systems (e.g., Chua et al. 2014; Haag and Eckhardt 2017). However,
as such services mainly run on private devices and access the internet through private data plans,
it is increasingly difficult for organizations to govern them. Thus, understanding the technology
usage and its reasons as well as spill-over effects into the organizational context have become
paramount to managing the benefits and risks of IT consumerization.
In the past, IT departments of organizations were able to exclude personal devices from their
network through technical measures to control unauthorized IT consumerization and therefore
control for unforeseeable threats. For IT services geared towards communication and collabo-
ration, such as instant messaging and file sharing, controlling such activities is less feasible.
This is because private IT services are not operated on the business computing and network
infrastructure. To regain control, companies embrace policies and demand their employees to
install mobile device management (MDM) software to ensure data privacy and security (Lee et
al. 2017). However, an effective enforcement is only possible for organizational resources
Individual Information Systems and their Use 54
accessed through such consumer IT (Putri and Hovav 2014). Yet, many employees today use
private instant messaging services (such as WhatsApp, Facebook Messenger, and WeChat) or
private file sharing services (such as Dropbox and Google Drive), which are beyond the reach
and control of the organizations’ IT departments, to communicate and collaborate with their
colleagues, business partners, and customers.
Previous studies have analyzed the antecedents of IT consumerization using a technology adop-
tion lens (cf. Ortbach 2015). However, many contributions focus on bring-you-own-device pro-
grams, with some exceptions that deal with IT consumerization as a whole. IT services, on the
other hand, represent a different phenomenon. Because such IT services have been previously
used by the users in the private context, the users are in a post-adoptive phase where they have
learned about the concrete features of the IT services. The decision is thus between two alter-
natives that the users carefully assess. Understanding these rationales for user behavior is par-
amount regarding IT service consumerization, where users are highly autonomous and technical
efforts to govern its usage are not applicable. Yet, to the best of our knowledge, no research
endeavor has aimed to answer this important question regarding IT service consumerization:
What rationales drive IT service consumerization post-adoptive user behavior?
To address the issue, we use a feature-centric post-adoption perspective, which builds on and
extends previous research on IT consumerization. Accordingly, our study investigates ration-
ales of IT service consumerization behavior based on a benefit-risk assessment. In particular,
we investigate the effect of functionalities of IT services as well as the effects of perceived
sanctions of IT policy breaches and information privacy concerns. We focus on communication
and collaboration services, specifically on instant messaging and file sharing services as exem-
plars. We use a mixed-methods approach to collect quantitative as well as qualitative data in
order to provide a credible and complete picture of the phenomenon and to derive stronger
inferences.
With this paper, we advance the theoretical understanding of IT service consumerization, in
particular the factors that influence why users opt to use or decide not to use individual con-
sumer IT services for the purpose of communication and collaboration on a feature-level. For
practitioners, we improve the understanding of IT service consumerization which helps them
tailor initiatives (such as the introduction of new functionalities or additional IT security
measures) to more efficiently reach their own targets of balancing and managing IT consumer-
ization benefits and risks.
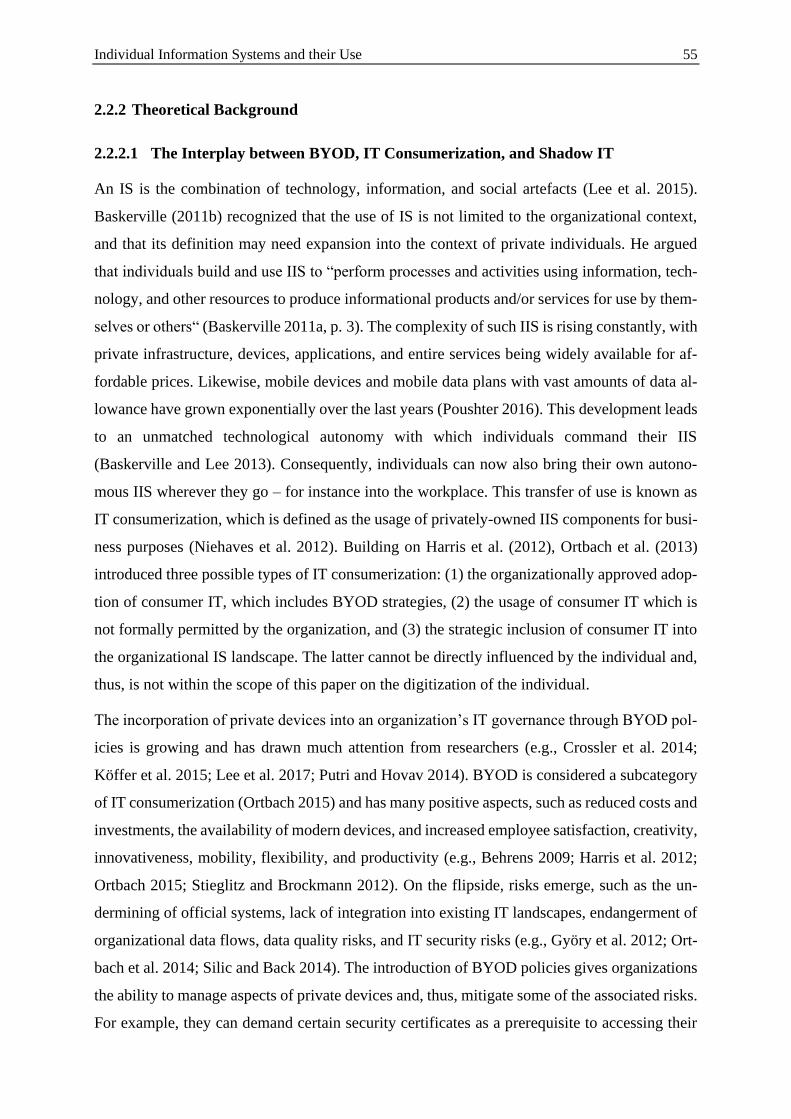
Individual Information Systems and their Use 55
2.2.2 Theoretical Background
2.2.2.1 The Interplay between BYOD, IT Consumerization, and Shadow IT
An IS is the combination of technology, information, and social artefacts (Lee et al. 2015).
Baskerville (2011b) recognized that the use of IS is not limited to the organizational context,
and that its definition may need expansion into the context of private individuals. He argued
that individuals build and use IIS to “perform processes and activities using information, tech-
nology, and other resources to produce informational products and/or services for use by them-
selves or others“ (Baskerville 2011a, p. 3). The complexity of such IIS is rising constantly, with
private infrastructure, devices, applications, and entire services being widely available for af-
fordable prices. Likewise, mobile devices and mobile data plans with vast amounts of data al-
lowance have grown exponentially over the last years (Poushter 2016). This development leads
to an unmatched technological autonomy with which individuals command their IIS
(Baskerville and Lee 2013). Consequently, individuals can now also bring their own autono-
mous IIS wherever they go – for instance into the workplace. This transfer of use is known as
IT consumerization, which is defined as the usage of privately-owned IIS components for busi-
ness purposes (Niehaves et al. 2012). Building on Harris et al. (2012), Ortbach et al. (2013)
introduced three possible types of IT consumerization: (1) the organizationally approved adop-
tion of consumer IT, which includes BYOD strategies, (2) the usage of consumer IT which is
not formally permitted by the organization, and (3) the strategic inclusion of consumer IT into
the organizational IS landscape. The latter cannot be directly influenced by the individual and,
thus, is not within the scope of this paper on the digitization of the individual.
The incorporation of private devices into an organization’s IT governance through BYOD pol-
icies is growing and has drawn much attention from researchers (e.g., Crossler et al. 2014;
Köffer et al. 2015; Lee et al. 2017; Putri and Hovav 2014). BYOD is considered a subcategory
of IT consumerization (Ortbach 2015) and has many positive aspects, such as reduced costs and
investments, the availability of modern devices, and increased employee satisfaction, creativity,
innovativeness, mobility, flexibility, and productivity (e.g., Behrens 2009; Harris et al. 2012;
Ortbach 2015; Stieglitz and Brockmann 2012). On the flipside, risks emerge, such as the un-
dermining of official systems, lack of integration into existing IT landscapes, endangerment of
organizational data flows, data quality risks, and IT security risks (e.g., Györy et al. 2012; Ort-
bach et al. 2014; Silic and Back 2014). The introduction of BYOD policies gives organizations
the ability to manage aspects of private devices and, thus, mitigate some of the associated risks.
For example, they can demand certain security certificates as a prerequisite to accessing their
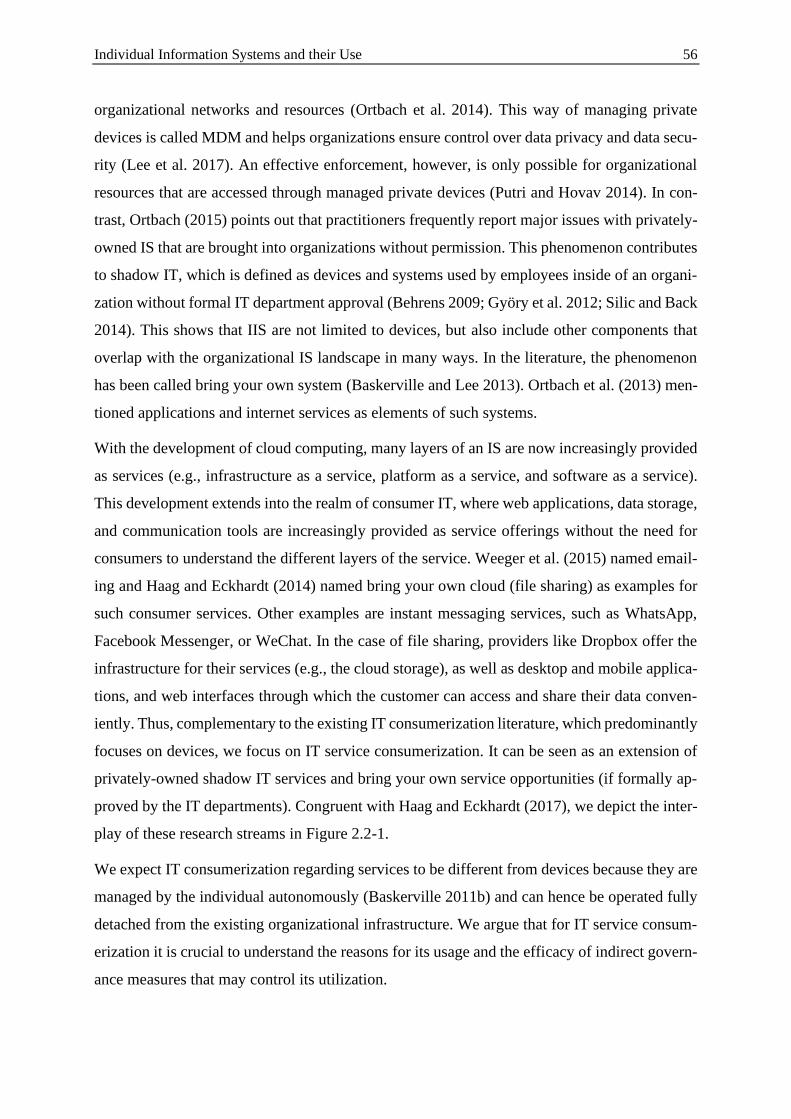
Individual Information Systems and their Use 56
organizational networks and resources (Ortbach et al. 2014). This way of managing private
devices is called MDM and helps organizations ensure control over data privacy and data secu-
rity (Lee et al. 2017). An effective enforcement, however, is only possible for organizational
resources that are accessed through managed private devices (Putri and Hovav 2014). In con-
trast, Ortbach (2015) points out that practitioners frequently report major issues with privately-
owned IS that are brought into organizations without permission. This phenomenon contributes
to shadow IT, which is defined as devices and systems used by employees inside of an organi-
zation without formal IT department approval (Behrens 2009; Györy et al. 2012; Silic and Back
2014). This shows that IIS are not limited to devices, but also include other components that
overlap with the organizational IS landscape in many ways. In the literature, the phenomenon
has been called bring your own system (Baskerville and Lee 2013). Ortbach et al. (2013) men-
tioned applications and internet services as elements of such systems.
With the development of cloud computing, many layers of an IS are now increasingly provided
as services (e.g., infrastructure as a service, platform as a service, and software as a service).
This development extends into the realm of consumer IT, where web applications, data storage,
and communication tools are increasingly provided as service offerings without the need for
consumers to understand the different layers of the service. Weeger et al. (2015) named email-
ing and Haag and Eckhardt (2014) named bring your own cloud (file sharing) as examples for
such consumer services. Other examples are instant messaging services, such as WhatsApp,
Facebook Messenger, or WeChat. In the case of file sharing, providers like Dropbox offer the
infrastructure for their services (e.g., the cloud storage), as well as desktop and mobile applica-
tions, and web interfaces through which the customer can access and share their data conven-
iently. Thus, complementary to the existing IT consumerization literature, which predominantly
focuses on devices, we focus on IT service consumerization. It can be seen as an extension of
privately-owned shadow IT services and bring your own service opportunities (if formally ap-
proved by the IT departments). Congruent with Haag and Eckhardt (2017), we depict the inter-
play of these research streams in Figure 2.2-1.
We expect IT consumerization regarding services to be different from devices because they are
managed by the individual autonomously (Baskerville 2011b) and can hence be operated fully
detached from the existing organizational infrastructure. We argue that for IT service consum-
erization it is crucial to understand the reasons for its usage and the efficacy of indirect govern-
ance measures that may control its utilization.
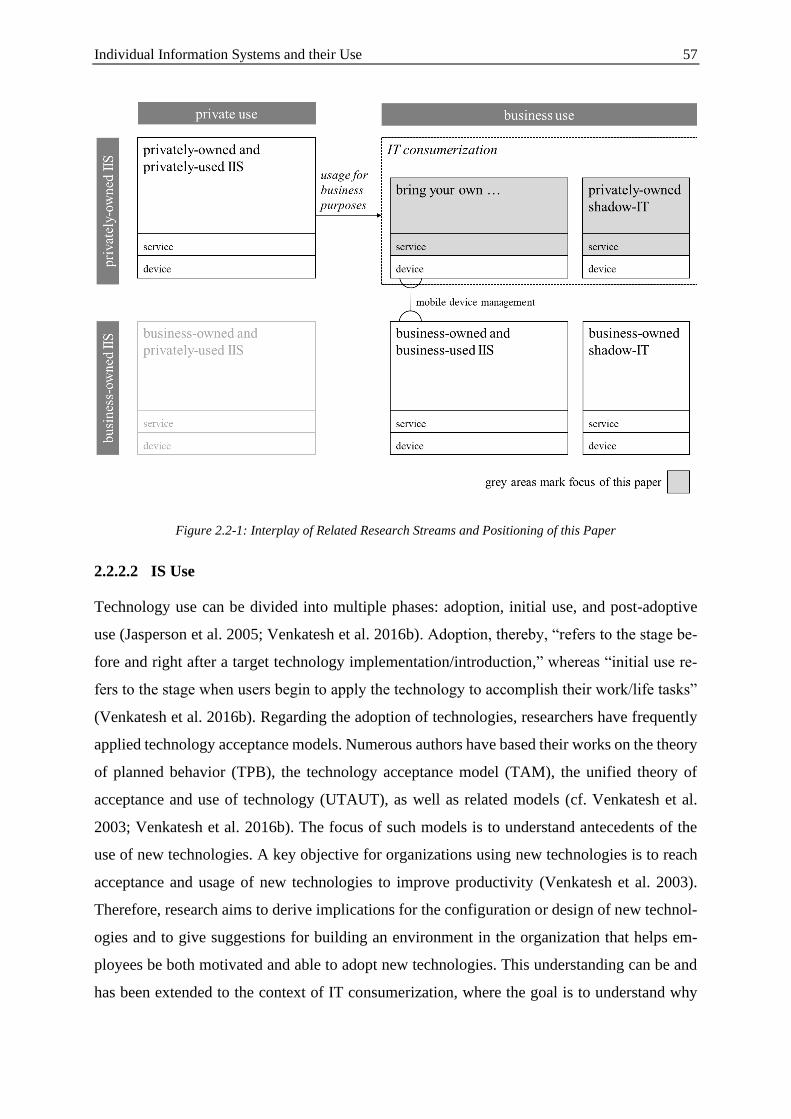
Individual Information Systems and their Use 57
Figure 2.2-1: Interplay of Related Research Streams and Positioning of this Paper
2.2.2.2 IS Use
Technology use can be divided into multiple phases: adoption, initial use, and post-adoptive
use (Jasperson et al. 2005; Venkatesh et al. 2016b). Adoption, thereby, “refers to the stage be-
fore and right after a target technology implementation/introduction,” whereas “initial use re-
fers to the stage when users begin to apply the technology to accomplish their work/life tasks”
(Venkatesh et al. 2016b). Regarding the adoption of technologies, researchers have frequently
applied technology acceptance models. Numerous authors have based their works on the theory
of planned behavior (TPB), the technology acceptance model (TAM), the unified theory of
acceptance and use of technology (UTAUT), as well as related models (cf. Venkatesh et al.
2003; Venkatesh et al. 2016b). The focus of such models is to understand antecedents of the
use of new technologies. A key objective for organizations using new technologies is to reach
acceptance and usage of new technologies to improve productivity (Venkatesh et al. 2003).
Therefore, research aims to derive implications for the configuration or design of new technol-
ogies and to give suggestions for building an environment in the organization that helps em-
ployees be both motivated and able to adopt new technologies. This understanding can be and
has been extended to the context of IT consumerization, where the goal is to understand why
Individual Information Systems and their Use 58
employees transfer the use of familiar technologies from the private context to the business
context (Ortbach 2015) and what factors stop them from doing so.
Post-adoptive behavior according to Jasperson et al. (2005, p. 531) is “feature use behaviors,
and feature extension behaviors made by an individual user after an IT application has been
[…] made accessible to the user, and adoption applied by the user in accomplishing his/her
work activities.” Thus, post-adoption behavior is the individual’s use of a subset of features of
a technology after it has been installed (Jasperson et al. 2005). Viewing post-adoption in the
larger context of IT adoption is generally accepted (Jasperson et al. 2005). Yet, pre-adoption
decisions are based on limited information about a technology (Griffith 1999 as cited in
Jasperson et al. 2005), while in the post-adoption phase users have already learned about the
technology and its features (Jasperson et al. 2005). Thus, in this phase users evaluate the fea-
tures and make usage decisions based on their utility. Such a feature-centric view of technology
is valuable as specific features “influence and determine work outcomes” (Jasperson et al. 2005,
p. 529). This view on post-adoption differentiates between different use behaviors, such as deep
feature usage, more distinctly to gain a more detailed understanding of the way IS is used as
well as its consequences (Burton-Jones and Straub 2006). The focus of this paper, however, lies
on understanding the drivers of usage based on a more detailed understanding of the respective
features in the post-adoption phase, rather than the efficiency of that use. This taps into the
realm of task-technology fit, which has been analyzed with a feature-centric post-adoption lens
before (Lin and Huang 2008). We proceed to analyze the theoretical lenses that have been ap-
plied in relation to IT consumerization.
2.2.2.3 Prior Use-related Research on IT Consumerization
Ortbach (2015) provided a comprehensive literature overview on existing empirical research
on IT consumerization and the analyzed antecedents. We extend upon it by identifying research
contributions published from 2014 to 2019. Our own analysis results in eleven contributions
(see Appendix 2.2.A). The results show that many studies regarding IT consumerization are
related to technology acceptance research and are based on TPB (Lee et al. 2017; Ortbach et al.
2013), TAM (e.g., Ortbach 2015) or UTAUT (e.g., Weeger et al. 2015). The main antecedents
of IS use, as unified by UTAUT, have been included in these studies.
Perceived usefulness (also referred to as performance expectancy) and other related constructs
have been shown to have the strongest impact on IT consumerization intention (e.g., Gewald et
al. 2017; Junglas et al. 2019; Lee et al. 2017; Ortbach et al. 2013). In other words, the positive
impact on work results is a main driver of IT consumerization. Ease of use (also referred to as
Individual Information Systems and their Use 59
effort expectancy) has further been consistently included and shown to have a substantial and
significant impact (e.g., Ortbach 2015; Weeger et al. 2015). The strong role of those two con-
structs is congruent with the vast majority of technology acceptance literature and therefore
integrates well with previous research on IS use (Venkatesh et al. 2003; Venkatesh et al. 2012).
Other UTAUT constructs, such as social influence (e.g., Bautista et al. 2018; Weeger et al.
2015) and facilitating conditions (e.g., Bautista et al. 2018; Hopkins et al. 2013) have been
shown to have substantial and significant impact.
Several IT consumerization papers have further introduced risk and threat constructs
(e.g., Gewald et al. 2017; Weeger et al. 2020). This is congruent with Venkatesh et al. (2016b)
who showed risk (and its counterpart trust) to be one of the most frequent endogenous mecha-
nisms extending UTAUT models in the literature. Further, several IT consumerization studies
compare these risks with the benefits of IT consumerization (such as increased performance)
and find that the benefits generally outweigh the risks. An exception is Ortbach et al. (2013)
who found that IT security risks do in fact contribute to behavioral beliefs amongst highly ed-
ucated respondents.
This taps into insights on individual differences between users. Other individual characteristics
that have been studied regarding their ability to promote IT consumerization behavior include
self-efficacy (e.g., Crossler et al. 2014; Lee et al. 2017) and personal innovativeness (e.g.,
Junglas et al. 2019; Ortbach 2015). Such characteristics have been shown to promote general
IT use as well (e.g., Venkatesh et al. 2016b).
Regarding employee expectations, Weeger et al. (2015) found evidence that employees expect
employers to allow private devices on the job. According to the study, the main reasons for this
are, again, performance related. Employers face substantial challenges with this demand, as
they must consider the increasing potential for privacy and security threats. As an effective way
of mitigating such risks, practitioners and researchers alike suggest clear BYOD policies.
Restrictive BYOD policies may demand employees to install monitoring mechanisms (such as
MDM) onto their devices in order to access organizational resources. Yet, Lee et al. (2017)
found that employees have concerns regarding such monitoring mechanisms, and thus their
personal privacy. Lebek et al. (2013) echoed this by finding that security concerns limit BYOD
adoption.
In contrast to hardware devices, the usage of consumer IT services stays largely unnoticed by
organizations and, thus, the management of IT service consumerization is much more difficult
than the management of devices that access company resources. While this aspect of the IT
Individual Information Systems and their Use 60
consumerization phenomenon is growing rapidly, it has yet to be studied. A detailed under-
standing of user behavior and the underlying rational, however, is paramount to managing and
harnessing IT service consumerization.
Previous research indicates that IT consumerization behavior heavily depends on performance
expectations. Yet, our literature analysis concludes that to this date research lacks key contri-
butions regarding the post-adoption stage and a feature-centric view of the phenomenon. How-
ever, since many private services, particularly for communication and collaboration, are already
used in the private context, we consider it necessary to view private and business services as
components of an IT portfolio where the users base their usage decisions on relative utility and
comparative advantages.
2.2.3 Method and Model Development
2.2.3.1 Mixed-Methods
This study follows a mixed-methods approach (Venkatesh et al. 2013; Venkatesh et al. 2016a).
We follow two purposes with this approach. First, corroboration: qualitative insights will help
us assess the credibility of the findings of our quantitative model. We do so concurrently and
in an embedded way through mixing in the data collection phase. This approach allows us to
provide stronger inferences and to explain our empirical findings from the quantitative strand
through qualitative insights. In doing so, we pursue the secondary purpose of completeness. In
other words, we aim to provide a more meaningful picture and richer explanations of the phe-
nomenon (Venkatesh et al. 2013). The quantitative part uses a structural equation model and
the qualitative part uses coding principles (open and axial coding) that are known from
grounded theory (Strauss and Corbin 1990). Details on the individual methods are provided
after the model development.
2.2.3.2 Pre-Test
Before our main study, we conducted a qualitative pre-study, in which 15 doctoral students
from the field of IS were asked to provide reasons for their usage of consumer IT for business
purposes. After clustering the answers, we matched most of them to existing UTAUT con-
structs. In addition, more or better features, as well as habit and experience were frequently
named. This indicates that a post-adoption view is necessary to fully understand the phenome-
non. Furthermore, and congruent with previous research on IT consumerization, privacy and
security risks were mentioned. We used these insights to develop our model which we solely
base on literature in the following.
Individual Information Systems and their Use 61
2.2.3.3 Model Development
Our research model builds on an individual’s assessment of benefits and risks of engaging in a
certain behavior. This principle is used in net-valence models, which say that for engaging in
the behavior the perceived benefits (positive valence) of the behavior have to outweigh the risks
(negative valence) (Fishbein 1967; Lewin et al. 1944). In the context of IT consumerization,
Weeger et al. (2020) and others have shown that individuals balance the perceived benefits and
risks of engaging in BYOD programs and build their behavioral intention on that assessment.
Thus, consistent with net-valence models, we suggest that individuals assess whether the ben-
efits of IT consumerization outweigh its risks (Weeger et al. 2020).
In terms of benefits and consistent with previous research regarding technology acceptance, we
propose that usefulness and ease of use are the main benefits that have to be considered. We
suggest that both constructs can be traced back to different functionalities of the technology
that make them either useful (e.g., due to functionalities that allow for more flexibility in com-
municating with colleagues) or easy to use (e.g., due to an easily understandable user interface).
Therefore, and consistent with prior work on post-adoption as well as task-technology fit, we
consider individual functionalities in our research model (Jasperson et al. 2005; Sykes and
Venkatesh 2017). In the context of IT consumerization, the assessment of benefits is always
based on the comparison of both privately-owned IT and business provided solutions as part of
a deliberate portfolio decision (Briggs et al. 1998; Harris et al. 2012; Junglas et al. 2019). This
decision is between the standard work solution provided by the organization and the individual
private solution where use could be transferred to the work context. Thus, we include relative
usefulness and relative ease of use of the consumer IT service in contrast to the business offered
IT service to our model.
In terms of risks, employees are faced with the risk of losing their job by violating the organi-
zation’s policies of IT usage with respective sanctions or by causing the organization some kind
of harm by engaging in IT consumerization. Such harm may be caused due to a loss of the
organization’s data. Furthermore, by blurring the contexts of business and private lives by using
the private IT service in the business context, individuals also risk their own private data to be
unintendedly disclosed to others.
Figure 2.2-2 provides a graphical overview of the research model. In the following sub-sections,
we derive the corresponding hypotheses in detail.
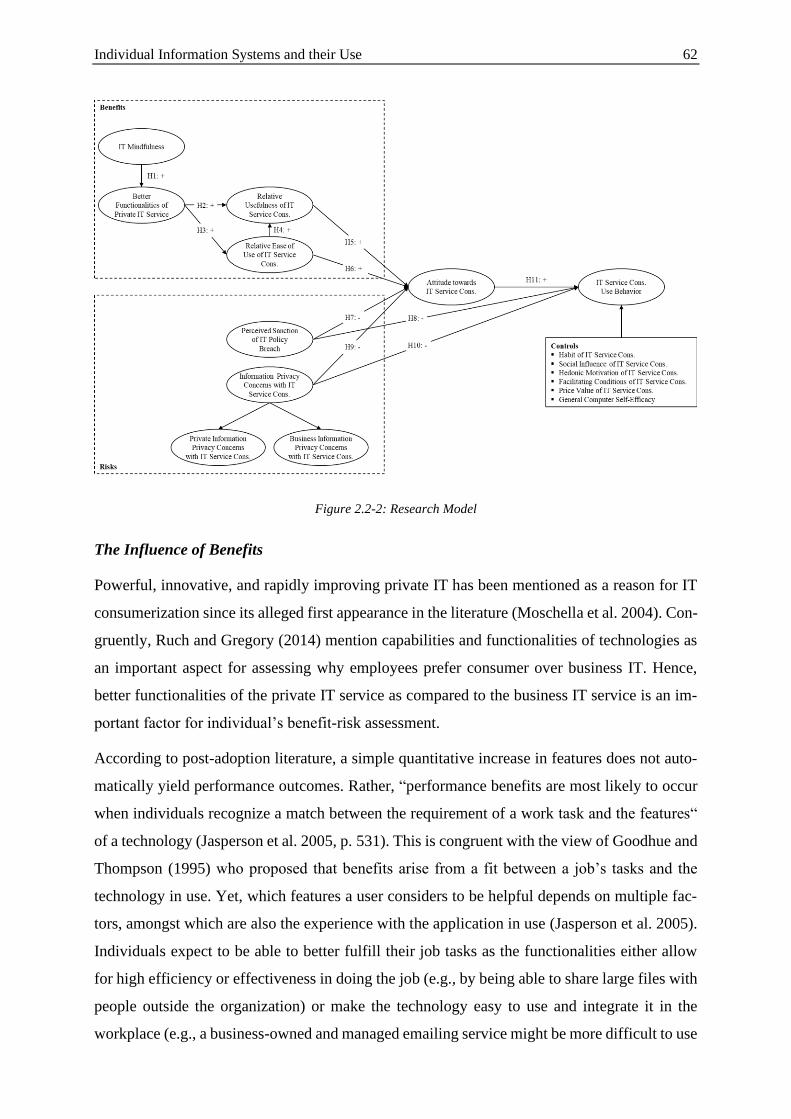
Individual Information Systems and their Use 62
Figure 2.2-2: Research Model
The Influence of Benefits
Powerful, innovative, and rapidly improving private IT has been mentioned as a reason for IT
consumerization since its alleged first appearance in the literature (Moschella et al. 2004). Con-
gruently, Ruch and Gregory (2014) mention capabilities and functionalities of technologies as
an important aspect for assessing why employees prefer consumer over business IT. Hence,
better functionalities of the private IT service as compared to the business IT service is an im-
portant factor for individual’s benefit-risk assessment.
According to post-adoption literature, a simple quantitative increase in features does not auto-
matically yield performance outcomes. Rather, “performance benefits are most likely to occur
when individuals recognize a match between the requirement of a work task and the features“
of a technology (Jasperson et al. 2005, p. 531). This is congruent with the view of Goodhue and
Thompson (1995) who proposed that benefits arise from a fit between a job’s tasks and the
technology in use. Yet, which features a user considers to be helpful depends on multiple fac-
tors, amongst which are also the experience with the application in use (Jasperson et al. 2005).
Individuals expect to be able to better fulfill their job tasks as the functionalities either allow
for high efficiency or effectiveness in doing the job (e.g., by being able to share large files with
people outside the organization) or make the technology easy to use and integrate it in the
workplace (e.g., a business-owned and managed emailing service might be more difficult to use
Individual Information Systems and their Use 63
than a consumer service, which may be easily integrated into private mobile devices) (Goodhue
and Thompson 1995; Jasperson et al. 2005). The first expectation, perceived usefulness, reflects
the degree to which individuals expect an IT service to help them improve their job performance
(Venkatesh et al. 2003). The second expectation, perceived ease of use, represents “the degree
of ease an individual associates with using a privately-owned [service] compared to one pro-
vided by an IT department” (Gewald et al. 2017, p. 64).
Jasperson et al. (2005) further suggested that the individual evaluates the features in the post-
adoption phase in a process that they refer to as “technology sensemaking.” These cognitive
processes of the individual may go beyond the mere exploitation of feature sets of a given tech-
nology and rather lead to the extension of features “that go beyond the uses intended by the
application’s designers” (Jasperson et al. 2005, p. 532). Such deliberations are said to be de-
pendent on the individual’s awareness of and openness to value added use of IT (Thatcher et
al. 2018). This shows that employees are able to assess the tools and services they utilize for
business purposes and that this assessment does influence use decisions. A constant assessment
is a key element of IT mindfulness that “refers to an individual’s continuous scrutiny and re-
finement of expectations based on new experiences, appreciation of subtleties, and identifica-
tion of novel aspects of context that can improve foresight and functioning” (Thatcher et al.
2018, p. 832). Thus, if individuals are IT mindful, they better recognize and identify IT func-
tionalities that are important for their job. Thus, we pose our first hypotheses:
H1: IT mindfulness has a positive effect on perceiving better functionalities of private
IT services as compared to business IT services.
H2: Perceiving better functionalities of private IT services as compared to business IT
services has a positive effect on the perceived relative usefulness of using a private IT
service in the business context.
H3: Perceiving better functionalities of private IT services as compared to business IT
services has a positive effect on the perceived relative ease of use of using a private IT
service in the business context.
Congruent with the TAM (Davis et al. 1989), we consider a positive effect of relative ease of
use on relative usefulness of IT service consumerization and hypothesize:
H4: Higher perceived relative ease of use of using a private IT service in the business
context has a positive effect on its perceived relative usefulness.
Individual Information Systems and their Use 64
The effect of higher usefulness and higher ease of use reflects the previously described funda-
ment of net-valence models: Perceived benefits positively influence the attitude towards IT
service consumerization. This is consistent with other studies which show that increased use-
fulness and ease of use are important reasons for IT adoption decisions in general (e.g., Davis
et al. 1989; Venkatesh et al. 2012) as well as in the IT consumerization context (Gewald et al.
2017; Ortbach 2015; Weeger et al. 2015). Thus, we formulate the following two hypotheses:
H5: Higher perceived relative usefulness of using a private IT service in the business
context has a positive effect on the attitude toward IT service consumerization.
H6: Higher perceived relative ease of use of using a private IT service in the business
context has a positive effect on the attitude toward IT service consumerization.
The Influence of Risks
To control and manage consumer IT in the workplace, some authors mentioned the prohibition
of its usage as an important factor. For example, Ortbach et al. (2013) found that organizational
policies may be able to influence consumerization behavior and that IT policies are effective in
that regard. However, such IT policies often only influence employees’ attitude towards IT
consumerization as well as the actual use behavior if a breach is perceived to have severe con-
sequences (Herath and Rao 2009; Klesel et al. 2019). In the context of net-valence assumptions,
such sanctions of IT policy breaches are assessed as risks lowering the attitude toward the be-
havior. Thus, we hypothesize:
H7: Higher perceived sanction of IT policy breach has a negative effect on the attitude
toward IT service consumerization.
H8: Higher perceived sanction of IT policy breach has a negative effect on the use of IT
service consumerization.
It has been argued that data security plays an important role in IT consumerization decisions
(Crossler et al. 2014; Niehaves et al. 2012). With the usage of private services for business
purposes the employee gives up control over information to the service provider, which should
raise concerns over the privacy of information. The unsanctioned usage of IT (shadow IT) has
been associated with an increased risk for business data loss or leaks (Silic and Back 2014).
Thus, we expect IT consumerization to be assessed as a potential information privacy risk. This
is congruent with Gewald et al. (2017) and Weeger et al. (2015) who investigated information
privacy risks – and thereby covered both private and business information – as antecedents for
IT consumerization intention and attitude. Moreover, Ortbach et al. (2013) found risking
Individual Information Systems and their Use 65
important data to be a strong inhibitor of actual IT consumerization use behavior. Hence, we
propose:
H9: Higher information privacy concerns with IT consumerization have a negative ef-
fect on the attitude toward IT service consumerization.
H10: Higher information privacy concerns with IT consumerization have a negative
effect on the use of IT service consumerization.
The Influence of Attitude
Congruent with TBP, TAM, and UTAUT, we expect a significantly positive effect of attitude
towards use on the actual use behavior (Venkatesh et al. 2003).
H11: Higher attitude towards IT Service Consumerization has a positive effect on use
of IT service consumerization.
Control Variables
As proposed in the well-studied UTAUT2 model, there are several other variables that are im-
portant antecedents of the use of technologies (Venkatesh et al. 2012). Therefore, we include
these further variables (habit, social influence, hedonic motivation, facilitating conditions, and
price value) as controls in our model. Further, we include general computer-self-efficacy (Mara-
kas et al. 2007).
2.2.4 Empirical Analysis
2.2.4.1 Survey Design and Procedures
To test the model empirically, we design an online survey. Since this survey seeks to collect
data concerning IT usage in the business context, we restrict participation to current full-time
employees. We choose instant messaging and file sharing as the analyzed consumer IT services.
Communication and collaboration do not follow the set perimeters of organization-specific
business processes and thus leave room for spontaneous personal interactions (Frank et al.
2017). Therefore, these services appear more susceptible to IT consumerization as they can
largely be operated separately from existing organizational resources. The chosen services are
important for digital communication and collaboration and provided in most commercial office
suites (Gotta et al. 2015). This approach enables us to validate the impact of the antecedents
and moderators across services, and thereby increases our study’s rigor. Thus, all participants
of the survey are asked to answer all items twice for the two services.
Individual Information Systems and their Use 66
The questionnaire starts with a detailed explanation of the scope of communication and collab-
oration services and what consumerization of such services means (see Appendix 2.2.B). Next,
participants are asked to indicate their IT consumerization behavior. For that, we use the item
from Carter and Petter (2015) who measure use behavior on a six-point Likert scale ranging
from “not at all” to “very many times”. Likewise, we use existing item scales for all our con-
structs. We use Thatcher et al.’s (2018) scale on IT mindfulness and Lin and Huang’s (2008)
scale on perceived task-technology fit to measure better functionalities of the private service in
contrast to the business service. For relative usefulness and relative ease of use, we use items
from Venkatesh et al. (2012) and for perceived sanction of IT policy breach items from Herath
and Rao (2009). We operationalize information privacy concerns as a second-order construct
of private information privacy concerns and business information privacy concerns. For those
two first-order constructs, we build on the perceived privacy risk scale from Cocosila et al.
(2009) and adapt it to the context of business and private information. For attitude, we use
Degirmenci et al.’s (2019) scale that is based on Nysveen et al. (2005) and Taylor and Todd
(1995). For the controls from UTAUT2 (i.e., habit, social influence, hedonic motivation, facil-
itating conditions, and price value), we again use items from Venkatesh et al. (2012). Lastly,
we use Marakas et al.’s (2007) scale for general computer self-efficacy. Finally, we add theo-
retically unrelated marker questions to control for common method variance (CMV) (Lindell
and Whitney 2001; Richardson et al. 2009). Where necessary, we adopt the items to the IT
consumerization context. All measurements are reflective. We measure all items on a seven-
point Likert scale. Appendix 2.2.B provides an overview of all items.
We distributed the questionnaire via the online crowdsourcing market Amazon Mechanical
Turk (MTurk). Such online crowdsourcing markets are internet-based platforms that allow re-
cruiting participants for surveys and other tasks (Steelman et al. 2014). Research on MTurk’s
participant pool indicates that it is closer to the U.S. population than participants from tradi-
tional university subject pools (Paolacci et al. 2010). Further, MTurk participants are seen to be
undistinguishable from an internet sample on several psychometric scales such as the big five
personality traits (Buhrmester et al. 2011). MTurk has also been used in IS research before
(e.g., James et al. 2019; Kehr et al. 2015; Lowry et al. 2016; Soror et al. 2015). We restricted
participation to MTurk workers from the U.S. having worked on at least 50 tasks via the plat-
form and with a work approval rate of at least 90 %. Participants received a monetary reward
of USD 2 for completing the survey (average time 12 minutes). Prior research suggests that this
level of compensation is adequate on MTurk and encourages valid responses (Buhrmester et al.
2011; Jia et al. 2017; Mason and Suri 2012; Steelman et al. 2014). To ensure data quality, we
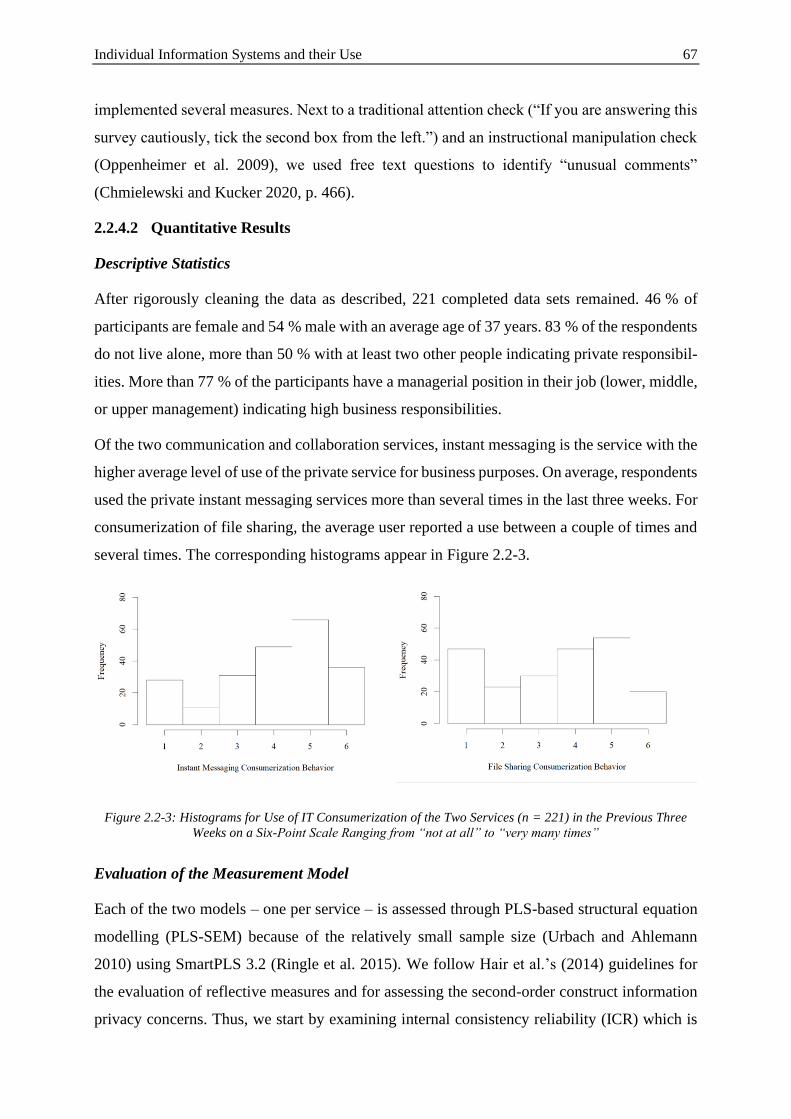
Individual Information Systems and their Use 67
implemented several measures. Next to a traditional attention check (“If you are answering this
survey cautiously, tick the second box from the left.”) and an instructional manipulation check
(Oppenheimer et al. 2009), we used free text questions to identify “unusual comments”
(Chmielewski and Kucker 2020, p. 466).
2.2.4.2 Quantitative Results
Descriptive Statistics
After rigorously cleaning the data as described, 221 completed data sets remained. 46 % of
participants are female and 54 % male with an average age of 37 years. 83 % of the respondents
do not live alone, more than 50 % with at least two other people indicating private responsibil-
ities. More than 77 % of the participants have a managerial position in their job (lower, middle,
or upper management) indicating high business responsibilities.
Of the two communication and collaboration services, instant messaging is the service with the
higher average level of use of the private service for business purposes. On average, respondents
used the private instant messaging services more than several times in the last three weeks. For
consumerization of file sharing, the average user reported a use between a couple of times and
several times. The corresponding histograms appear in Figure 2.2-3.
Figure 2.2-3: Histograms for Use of IT Consumerization of the Two Services (n = 221) in the Previous Three
Weeks on a Six-Point Scale Ranging from “not at all” to “very many times”
Evaluation of the Measurement Model
Each of the two models – one per service – is assessed through PLS-based structural equation
modelling (PLS-SEM) because of the relatively small sample size (Urbach and Ahlemann
2010) using SmartPLS 3.2 (Ringle et al. 2015). We follow Hair et al.’s (2014) guidelines for
the evaluation of reflective measures and for assessing the second-order construct information
privacy concerns. Thus, we start by examining internal consistency reliability (ICR) which is
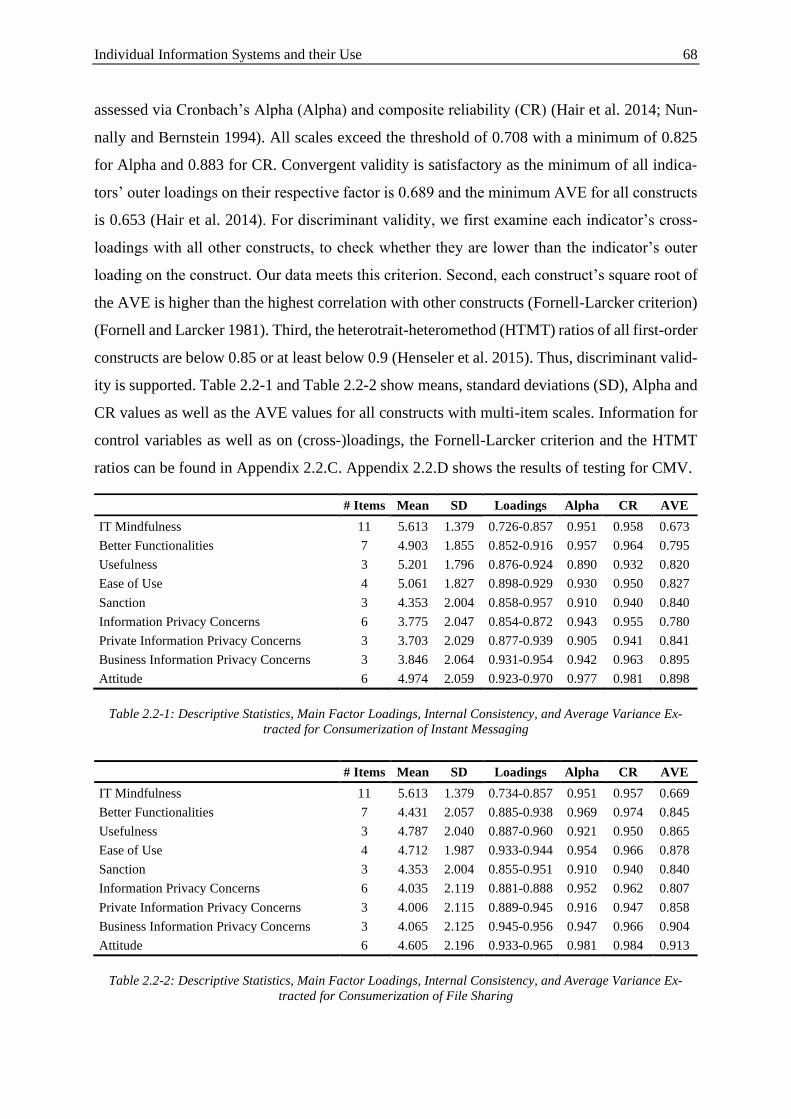
Individual Information Systems and their Use 68
assessed via Cronbach’s Alpha (Alpha) and composite reliability (CR) (Hair et al. 2014; Nun-
nally and Bernstein 1994). All scales exceed the threshold of 0.708 with a minimum of 0.825
for Alpha and 0.883 for CR. Convergent validity is satisfactory as the minimum of all indica-
tors’ outer loadings on their respective factor is 0.689 and the minimum AVE for all constructs
is 0.653 (Hair et al. 2014). For discriminant validity, we first examine each indicator’s cross-
loadings with all other constructs, to check whether they are lower than the indicator’s outer
loading on the construct. Our data meets this criterion. Second, each construct’s square root of
the AVE is higher than the highest correlation with other constructs (Fornell-Larcker criterion)
(Fornell and Larcker 1981). Third, the heterotrait-heteromethod (HTMT) ratios of all first-order
constructs are below 0.85 or at least below 0.9 (Henseler et al. 2015). Thus, discriminant valid-
ity is supported. Table 2.2-1 and Table 2.2-2 show means, standard deviations (SD), Alpha and
CR values as well as the AVE values for all constructs with multi-item scales. Information for
control variables as well as on (cross-)loadings, the Fornell-Larcker criterion and the HTMT
ratios can be found in Appendix 2.2.C. Appendix 2.2.D shows the results of testing for CMV.
# Items Mean SD Loadings Alpha CR AVE
IT Mindfulness 11 5.613 1.379 0.726-0.857 0.951 0.958 0.673
Better Functionalities 7 4.903 1.855 0.852-0.916 0.957 0.964 0.795
Usefulness 3 5.201 1.796 0.876-0.924 0.890 0.932 0.820
Ease of Use 4 5.061 1.827 0.898-0.929 0.930 0.950 0.827
Sanction 3 4.353 2.004 0.858-0.957 0.910 0.940 0.840
Information Privacy Concerns 6 3.775 2.047 0.854-0.872 0.943 0.955 0.780
Private Information Privacy Concerns 3 3.703 2.029 0.877-0.939 0.905 0.941 0.841
Business Information Privacy Concerns 3 3.846 2.064 0.931-0.954 0.942 0.963 0.895
Attitude 6 4.974 2.059 0.923-0.970 0.977 0.981 0.898
Table 2.2-1: Descriptive Statistics, Main Factor Loadings, Internal Consistency, and Average Variance Ex-
tracted for Consumerization of Instant Messaging
# Items Mean SD Loadings Alpha CR AVE
IT Mindfulness 11 5.613 1.379 0.734-0.857 0.951 0.957 0.669
Better Functionalities 7 4.431 2.057 0.885-0.938 0.969 0.974 0.845
Usefulness 3 4.787 2.040 0.887-0.960 0.921 0.950 0.865
Ease of Use 4 4.712 1.987 0.933-0.944 0.954 0.966 0.878
Sanction 3 4.353 2.004 0.855-0.951 0.910 0.940 0.840
Information Privacy Concerns 6 4.035 2.119 0.881-0.888 0.952 0.962 0.807
Private Information Privacy Concerns 3 4.006 2.115 0.889-0.945 0.916 0.947 0.858
Business Information Privacy Concerns 3 4.065 2.125 0.945-0.956 0.947 0.966 0.904
Attitude 6 4.605 2.196 0.933-0.965 0.981 0.984 0.913
Table 2.2-2: Descriptive Statistics, Main Factor Loadings, Internal Consistency, and Average Variance Ex-
tracted for Consumerization of File Sharing
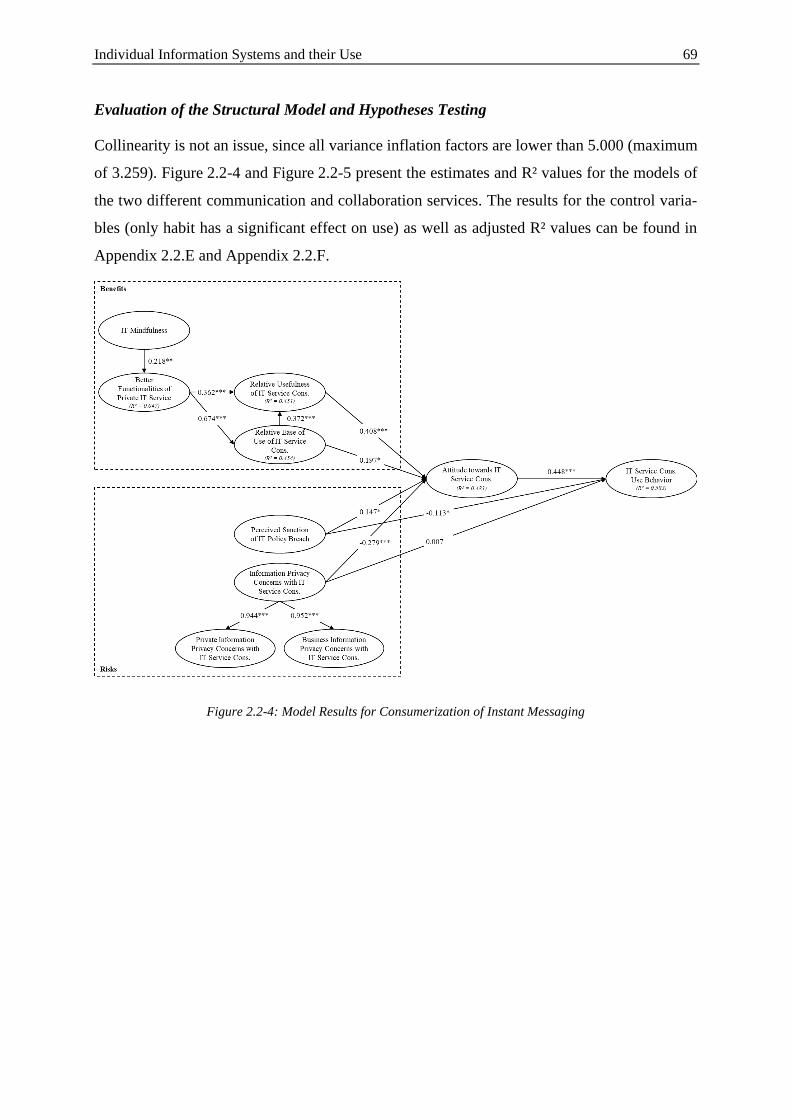
Individual Information Systems and their Use 69
Evaluation of the Structural Model and Hypotheses Testing
Collinearity is not an issue, since all variance inflation factors are lower than 5.000 (maximum
of 3.259). Figure 2.2-4 and Figure 2.2-5 present the estimates and R² values for the models of
the two different communication and collaboration services. The results for the control varia-
bles (only habit has a significant effect on use) as well as adjusted R² values can be found in
Appendix 2.2.E and Appendix 2.2.F.
Figure 2.2-4: Model Results for Consumerization of Instant Messaging
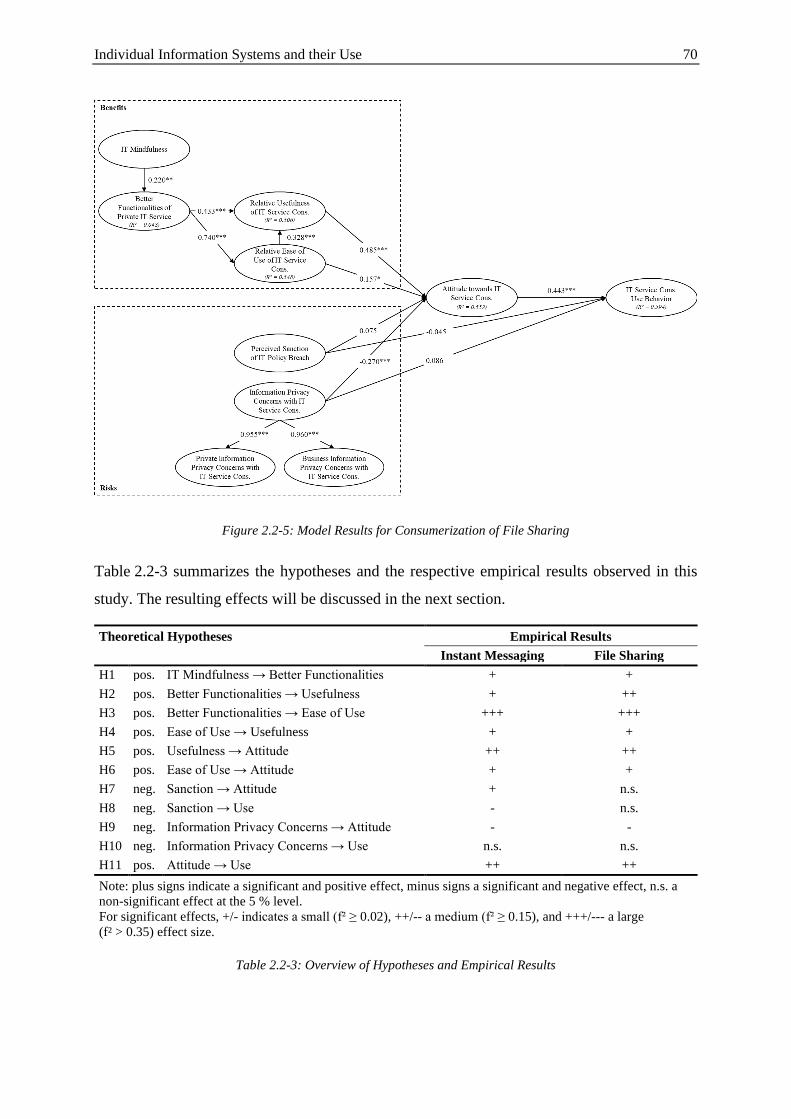
Individual Information Systems and their Use 70
Figure 2.2-5: Model Results for Consumerization of File Sharing
Table 2.2-3 summarizes the hypotheses and the respective empirical results observed in this
study. The resulting effects will be discussed in the next section.
Theoretical Hypotheses Empirical Results
Instant Messaging File Sharing
H1 pos. IT Mindfulness → Better Functionalities + +
H2 pos. Better Functionalities → Usefulness + ++
H3 pos. Better Functionalities → Ease of Use +++ +++
H4 pos. Ease of Use → Usefulness + +
H5 pos. Usefulness → Attitude ++ ++
H6 pos. Ease of Use → Attitude + +
H7 neg. Sanction → Attitude + n.s.
H8 neg. Sanction → Use - n.s.
H9 neg. Information Privacy Concerns → Attitude - -
H10 neg. Information Privacy Concerns → Use n.s. n.s.
H11 pos. Attitude → Use ++ ++
Note: plus signs indicate a significant and positive effect, minus signs a significant and negative effect, n.s. a
non-significant effect at the 5 % level.
For significant effects, +/- indicates a small (f² ≥ 0.02), ++/-- a medium (f² ≥ 0.15), and +++/--- a large
(f² > 0.35) effect size.
Table 2.2-3: Overview of Hypotheses and Empirical Results
Individual Information Systems and their Use 71
2.2.4.3 Qualitative Insights and Meta-Inferences
For the qualitative strand of our analysis, we asked the respondents to name reasons for why
they are using private IT for work purposes. This part consisted of two question, one regarding
file sharing and one regarding instant messaging. We collected 348 valid responses to this ques-
tion (192 for instant messaging, 156 for file sharing). These answers were coded using open
coding in a first step. We proceeded with axial coding to relate codes to core coding categories.
These coding categories were matched with the model constructs in a last step to integrate find-
ings from the qualitative and quantitative strand of our research in meta-findings (Venkatesh et
al. 2013). Our findings are presented in Table 2.2-4.
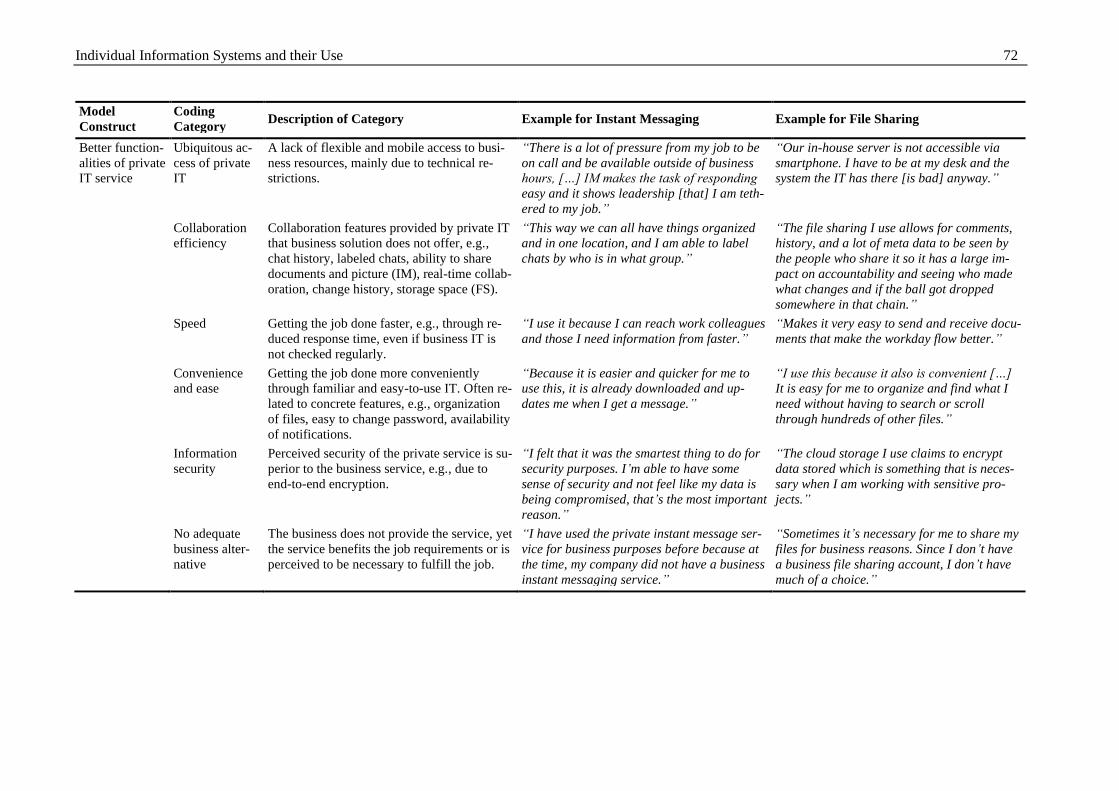
Individual Information Systems and their Use 72
Model
Construct
Coding
Category Description of Category Example for Instant Messaging Example for File Sharing
Better function-
alities of private
IT service
Ubiquitous ac-
cess of private
IT
A lack of flexible and mobile access to busi-
ness resources, mainly due to technical re-
strictions.
“There is a lot of pressure from my job to be
on call and be available outside of business
hours, […] IM makes the task of responding
easy and it shows leadership [that] I am teth-
ered to my job.”
“Our in-house server is not accessible via
smartphone. I have to be at my desk and the
system the IT has there [is bad] anyway.”
Collaboration
efficiency
Collaboration features provided by private IT
that business solution does not offer, e.g.,
chat history, labeled chats, ability to share
documents and picture (IM), real-time collab-
oration, change history, storage space (FS).
“This way we can all have things organized
and in one location, and I am able to label
chats by who is in what group.”
“The file sharing I use allows for comments,
history, and a lot of meta data to be seen by
the people who share it so it has a large im-
pact on accountability and seeing who made
what changes and if the ball got dropped
somewhere in that chain.”
Speed Getting the job done faster, e.g., through re-
duced response time, even if business IT is
not checked regularly.
“I use it because I can reach work colleagues
and those I need information from faster.”
“Makes it very easy to send and receive docu-
ments that make the workday flow better.”
Convenience
and ease
Getting the job done more conveniently
through familiar and easy-to-use IT. Often re-
lated to concrete features, e.g., organization
of files, easy to change password, availability
of notifications.
“Because it is easier and quicker for me to
use this, it is already downloaded and up-
dates me when I get a message.”
“I use this because it also is convenient […]
It is easy for me to organize and find what I
need without having to search or scroll
through hundreds of other files.”
Information
security
Perceived security of the private service is su-
perior to the business service, e.g., due to
end-to-end encryption.
“I felt that it was the smartest thing to do for
security purposes. I’m able to have some
sense of security and not feel like my data is
being compromised, that’s the most important
reason.”
“The cloud storage I use claims to encrypt
data stored which is something that is neces-
sary when I am working with sensitive pro-
jects.”
No adequate
business alter-
native
The business does not provide the service, yet
the service benefits the job requirements or is
perceived to be necessary to fulfill the job.
“I have used the private instant message ser-
vice for business purposes before because at
the time, my company did not have a business
instant messaging service.”
“Sometimes it’s necessary for me to share my
files for business reasons. Since I don’t have
a business file sharing account, I don’t have
much of a choice.”
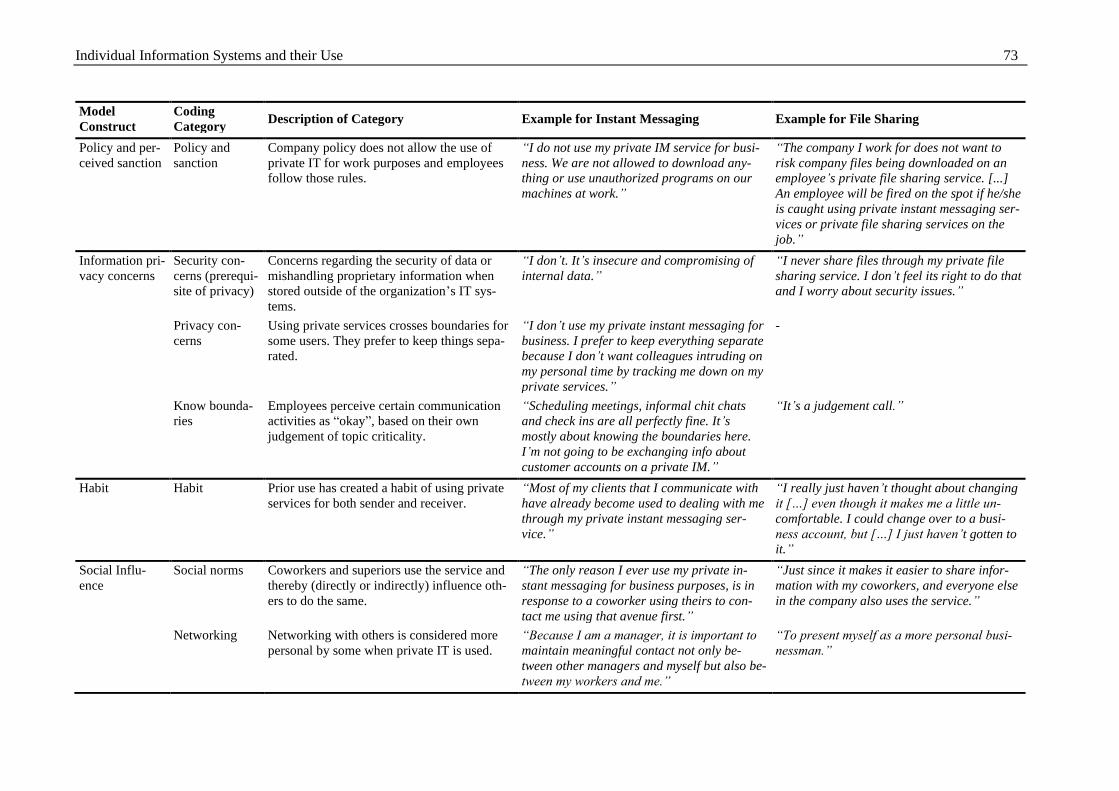
Individual Information Systems and their Use 73
Model
Construct
Coding
Category Description of Category Example for Instant Messaging Example for File Sharing
Policy and per-
ceived sanction
Policy and
sanction
Company policy does not allow the use of
private IT for work purposes and employees
follow those rules.
“I do not use my private IM service for busi-
ness. We are not allowed to download any-
thing or use unauthorized programs on our
machines at work.”
“The company I work for does not want to
risk company files being downloaded on an
employee’s private file sharing service. [...]
An employee will be fired on the spot if he/she
is caught using private instant messaging ser-
vices or private file sharing services on the
job.”
Information pri-
vacy concerns
Security con-
cerns (prerequi-
site of privacy)
Concerns regarding the security of data or
mishandling proprietary information when
stored outside of the organization’s IT sys-
tems.
“I don’t. It’s insecure and compromising of
internal data.”
“I never share files through my private file
sharing service. I don’t feel its right to do that
and I worry about security issues.”
Privacy con-
cerns
Using private services crosses boundaries for
some users. They prefer to keep things sepa-
rated.
“I don’t use my private instant messaging for
business. I prefer to keep everything separate
because I don’t want colleagues intruding on
my personal time by tracking me down on my
private services.”
-
Know bounda-
ries
Employees perceive certain communication
activities as “okay”, based on their own
judgement of topic criticality.
“Scheduling meetings, informal chit chats
and check ins are all perfectly fine. It’s
mostly about knowing the boundaries here.
I’m not going to be exchanging info about
customer accounts on a private IM.”
“It’s a judgement call.”
Habit Habit Prior use has created a habit of using private
services for both sender and receiver.
“Most of my clients that I communicate with
have already become used to dealing with me
through my private instant messaging ser-
vice.”
“I really just haven’t thought about changing
it […] even though it makes me a little un-
comfortable. I could change over to a busi-
ness account, but […] I just haven’t gotten to
it.”
Social Influ-
ence
Social norms Coworkers and superiors use the service and
thereby (directly or indirectly) influence oth-
ers to do the same.
“The only reason I ever use my private in-
stant messaging for business purposes, is in
response to a coworker using theirs to con-
tact me using that avenue first.”
“Just since it makes it easier to share infor-
mation with my coworkers, and everyone else
in the company also uses the service.”
Networking Networking with others is considered more
personal by some when private IT is used.
“Because I am a manager, it is important to
maintain meaningful contact not only be-
tween other managers and myself but also be-
tween my workers and me.”
“To present myself as a more personal busi-
nessman.”
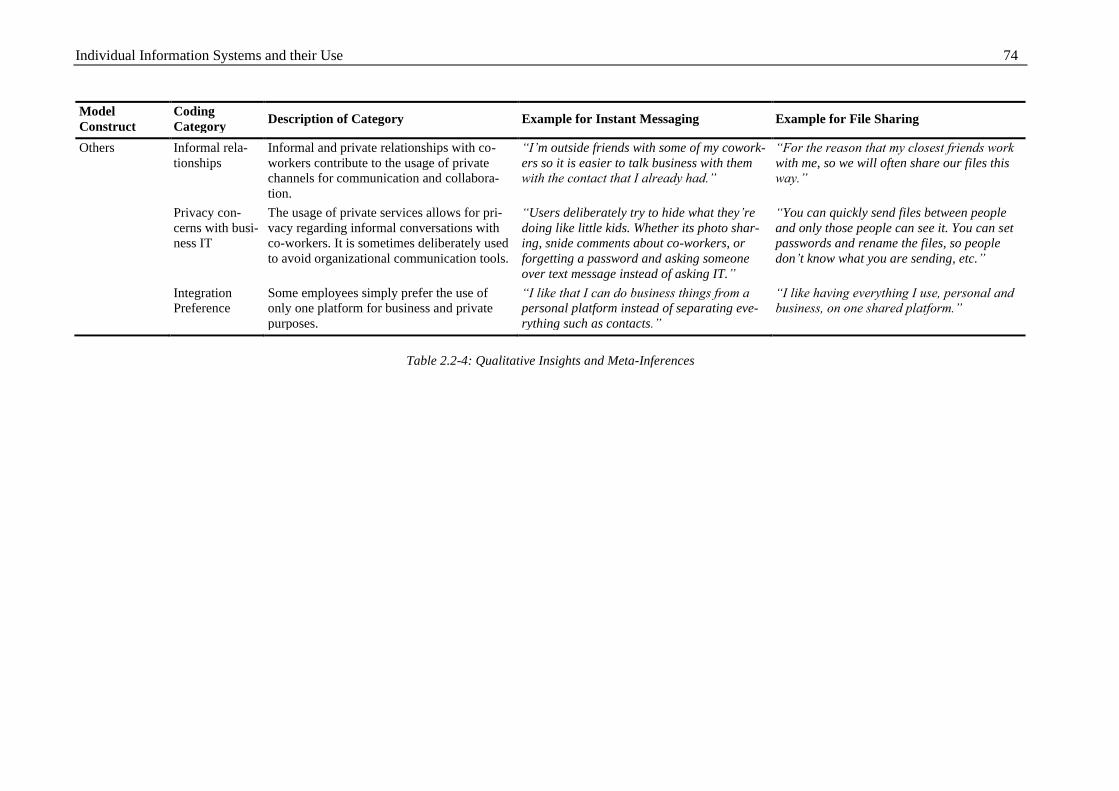
Individual Information Systems and their Use 74
Model
Construct
Coding
Category Description of Category Example for Instant Messaging Example for File Sharing
Others Informal rela-
tionships
Informal and private relationships with co-
workers contribute to the usage of private
channels for communication and collabora-
tion.
“I’m outside friends with some of my cowork-
ers so it is easier to talk business with them
with the contact that I already had.”
“For the reason that my closest friends work
with me, so we will often share our files this
way.”
Privacy con-
cerns with busi-
ness IT
The usage of private services allows for pri-
vacy regarding informal conversations with
co-workers. It is sometimes deliberately used
to avoid organizational communication tools.
“Users deliberately try to hide what they’re
doing like little kids. Whether its photo shar-
ing, snide comments about co-workers, or
forgetting a password and asking someone
over text message instead of asking IT.”
“You can quickly send files between people
and only those people can see it. You can set
passwords and rename the files, so people
don’t know what you are sending, etc.”
Integration
Preference
Some employees simply prefer the use of
only one platform for business and private
purposes.
“I like that I can do business things from a
personal platform instead of separating eve-
rything such as contacts.”
“I like having everything I use, personal and
business, on one shared platform.”
Table 2.2-4: Qualitative Insights and Meta-Inferences
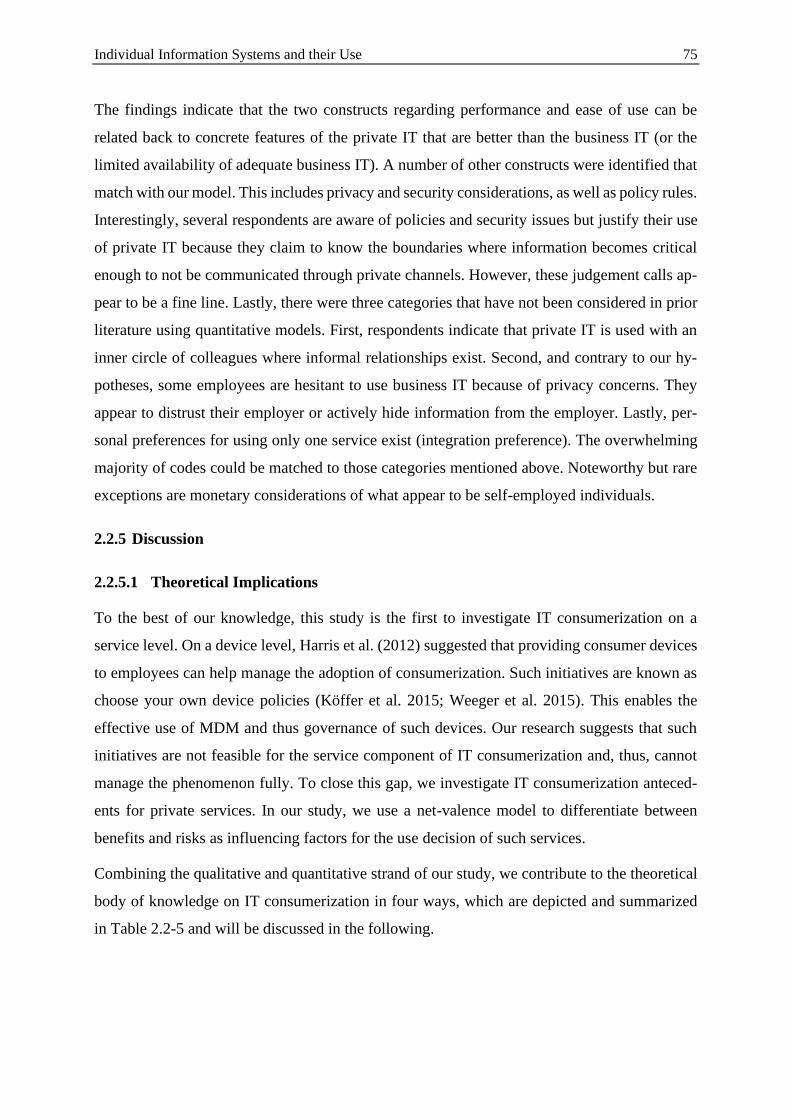
Individual Information Systems and their Use 75
The findings indicate that the two constructs regarding performance and ease of use can be
related back to concrete features of the private IT that are better than the business IT (or the
limited availability of adequate business IT). A number of other constructs were identified that
match with our model. This includes privacy and security considerations, as well as policy rules.
Interestingly, several respondents are aware of policies and security issues but justify their use
of private IT because they claim to know the boundaries where information becomes critical
enough to not be communicated through private channels. However, these judgement calls ap-
pear to be a fine line. Lastly, there were three categories that have not been considered in prior
literature using quantitative models. First, respondents indicate that private IT is used with an
inner circle of colleagues where informal relationships exist. Second, and contrary to our hy-
potheses, some employees are hesitant to use business IT because of privacy concerns. They
appear to distrust their employer or actively hide information from the employer. Lastly, per-
sonal preferences for using only one service exist (integration preference). The overwhelming
majority of codes could be matched to those categories mentioned above. Noteworthy but rare
exceptions are monetary considerations of what appear to be self-employed individuals.
2.2.5 Discussion
2.2.5.1 Theoretical Implications
To the best of our knowledge, this study is the first to investigate IT consumerization on a
service level. On a device level, Harris et al. (2012) suggested that providing consumer devices
to employees can help manage the adoption of consumerization. Such initiatives are known as
choose your own device policies (Köffer et al. 2015; Weeger et al. 2015). This enables the
effective use of MDM and thus governance of such devices. Our research suggests that such
initiatives are not feasible for the service component of IT consumerization and, thus, cannot
manage the phenomenon fully. To close this gap, we investigate IT consumerization anteced-
ents for private services. In our study, we use a net-valence model to differentiate between
benefits and risks as influencing factors for the use decision of such services.
Combining the qualitative and quantitative strand of our study, we contribute to the theoretical
body of knowledge on IT consumerization in four ways, which are depicted and summarized
in Table 2.2-5 and will be discussed in the following.
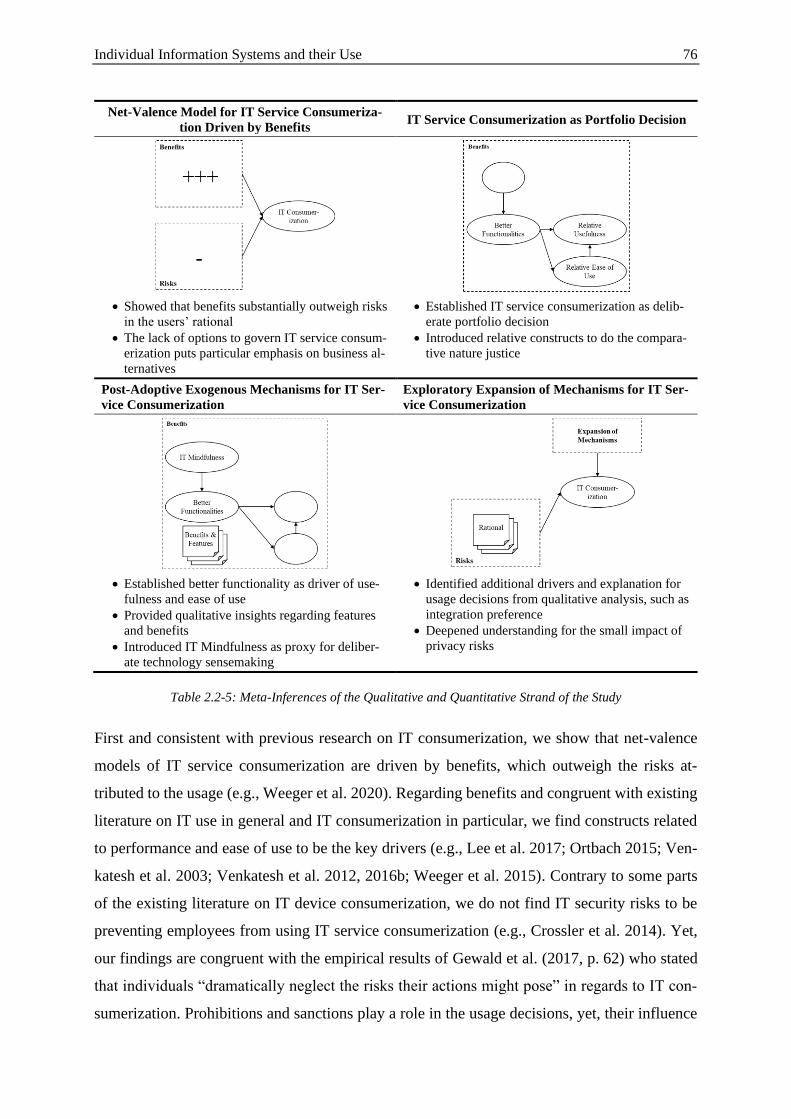
Individual Information Systems and their Use 76
Net-Valence Model for IT Service Consumeriza-
tion Driven by Benefits IT Service Consumerization as Portfolio Decision
• Showed that benefits substantially outweigh risks
in the users’ rational
• The lack of options to govern IT service consum-
erization puts particular emphasis on business al-
ternatives
• Established IT service consumerization as delib-
erate portfolio decision
• Introduced relative constructs to do the compara-
tive nature justice
Post-Adoptive Exogenous Mechanisms for IT Ser-
vice Consumerization
Exploratory Expansion of Mechanisms for IT Ser-
vice Consumerization
• Established better functionality as driver of use-
fulness and ease of use
• Provided qualitative insights regarding features
and benefits
• Introduced IT Mindfulness as proxy for deliber-
ate technology sensemaking
• Identified additional drivers and explanation for
usage decisions from qualitative analysis, such as
integration preference
• Deepened understanding for the small impact of
privacy risks
Table 2.2-5: Meta-Inferences of the Qualitative and Quantitative Strand of the Study
First and consistent with previous research on IT consumerization, we show that net-valence
models of IT service consumerization are driven by benefits, which outweigh the risks at-
tributed to the usage (e.g., Weeger et al. 2020). Regarding benefits and congruent with existing
literature on IT use in general and IT consumerization in particular, we find constructs related
to performance and ease of use to be the key drivers (e.g., Lee et al. 2017; Ortbach 2015; Ven-
katesh et al. 2003; Venkatesh et al. 2012, 2016b; Weeger et al. 2015). Contrary to some parts
of the existing literature on IT device consumerization, we do not find IT security risks to be
preventing employees from using IT service consumerization (e.g., Crossler et al. 2014). Yet,
our findings are congruent with the empirical results of Gewald et al. (2017, p. 62) who stated
that individuals “dramatically neglect the risks their actions might pose” in regards to IT con-
sumerization. Prohibitions and sanctions play a role in the usage decisions, yet, their influence
Individual Information Systems and their Use 77
is limited. While these results are somewhat consistent with IT consumerization on a device
level, they have substantially higher implications. This is because the usage of autonomous IT
services cannot be feasibly governed through technical measures. Combined with the compar-
atively low impact of sanctions (and thus prohibitions), this highlights the need to focus on
adequate business alternatives as a feasible way to govern the risks of IT service consumeriza-
tion.
Secondly, extending on previous research, we suggest that IT service consumerization decisions
are portfolio decisions where employees decide between multiple different solutions for the
same task. They can either use the standard business solution or transfer their use of a private
service to the work context. The dilemma that organizations are confronted with is that today,
employees are familiar with innovative platforms and IT services for collaboration and com-
munication from their private lives. They are aware of the productivity and performance gains
such platforms can offer and are able to compare them to the existing business alternatives
(Ortbach 2015). Thus, consistent with research on technology transition, we find that such IT
service consumerization use decisions are deliberate portfolio decisions where users carefully
analyze the comparative advantage of the alternatives that are available to them (Briggs et al.
1998; Junglas et al. 2019). Besides an overall sense of relative advantages, we show that this
deliberation happens on a feature level and includes deliberations on the task-technology fit for
the provided features (Jasperson et al. 2005).
Thirdly, in line with research on post-adoptive feature usage, we show that the assessment of
better functionality relies in part on a form of technology sensemaking, which breaks habitual
use (Jasperson et al. 2005). Post-adoption considers that the effect of intentionality on behavior
becomes less important as technology use becomes habitual (Venkatesh et al. 2012). Prior work
on post-adoption suggests that such habit can be broken through technology sensemaking,
where users reflect on their usage behavior and make deliberate decisions (Jasperson et al.
2005). We approximate this with the construct of IT mindfulness, a personal characteristic of
the individual that reflects such an awareness (Thatcher et al. 2018). By doing so, we are first
to show the construct’s role in the context of IT consumerization. We find that the extent to
which users think about their use does indeed drive the recognition of better functionality in the
services. Based in parts on our qualitative strand, we extend this understanding by identifying
an array of benefits that are driven by such better functionalities. These include added conven-
ience, higher work speed, and more collaboration efficiency. We show that the provision of an
adequate, ubiquitously accessible business solution which offers functionalities that are on par
Individual Information Systems and their Use 78
with consumer IT is the best way to govern the use private IT in the workplace. In other words,
organizations need to invest in adequate solutions for communication and collaboration or they
risk that employees take action themselves.
Fourth, our qualitative results show that aspects which are generally considered disadvantages
of IT consumerization (such as IT security, a prerequisite of information privacy) are in fact
drivers of IT consumerization for some individuals when the private IT is perceived to provide
better functionality. Such individuals report that they consider the security features of private
IT, e.g., end-to-end encryption, as reasons for their usage. A similar paradox was observed
regarding privacy concerns: Employees report that they use private IT to avoid organizational
channels and the recognition of supervisors. While this can hardly be governed it has scarcely
been considered in research in IT consumerization. We suggest that it should be recognized as
a possible factor interfering with the measurement of privacy risks, which have produced mixed
results in the IT consumerization literature (e.g., Lee et al. 2017). Several respondents also
mention that they make judgement calls based on their perception of boundaries between sen-
sitive and unproblematic communication. This is potentially problematic, as it puts the decision
of information criticality solely in the hands of the employees.
Lastly, our qualitative analysis provided hints regarding reasons for unexplained variance in
our model. In particular, these are personal preferences regarding the use of only one solution,
which we refer to as an integration preference that can be considered the opposite of a segmen-
tation preference (Kreiner et al. 2009). In addition, some employees mention increased net-
working opportunities through the informal character of private IT and existing informal rela-
tionships as drivers for communication and collaboration through private channels. These find-
ings provide avenues for future research.
2.2.5.2 Practical Implications
In an environment where IIS are largely autonomous and can be brought into the business con-
text with or without consent of the organization, it becomes increasingly important to under-
stand why users adopt private consumer IT services, rather than the provided business services.
Such knowledge can help organizations to better manage IT consumerization. To contribute to
this understanding, we examined drivers of IT service consumerization theoretically and em-
pirically.
First, we point out that IT consumerization cannot be solely managed on a device level, but that
IT services need to be considered to grasp the entire phenomenon which includes shadow IT.
This means that individuals often choose between existing private technology that can be
Individual Information Systems and their Use 79
transferred to the work context and technology provided by the businesses. They only use busi-
ness IT if they arrive at the conclusion that it is better fit from a net-valence perspective. This
is particularly important as business alternatives are usually in an uphill battle against the ha-
bitually used existing private solutions.
Second, we confirm that IT consumerization usage decisions are largely driven by perceived
benefits rather than potential risks. Still, previous research suggests that organizations define
clear policies and guidelines for the use of IT consumerization and try to create a security-aware
culture in order to control for the associated risks (Köffer 2015). However, our results indicate
that it is not sufficient to only prohibit or sanction the usage of private consumer IT services.
Although employees are aware of the risks associated with their actions, they do not comply
with the rules, but make judgements call on where the usage of private IT may be acceptable or
unproblematic. IT security literature suggests that there might be possible reasons for such a
behavior. For example, that negative business impacts are not made clear enough and, therefore,
policies are circumvented (Guo et al. 2011).
Third, to foster use, we show that organizations have to provide business alternatives for the IT
services which offer similar performance on a feature level, as employees make deliberate port-
folio decisions based on the comparison of the available alternatives. First, such alternatives
need to be accessible ubiquitously, if they are to substitute private IT services. According to our
qualitative results, they also should to provide adequate functionality to foster efficient collab-
oration, secure data transfer, and convenience of use to be assessed as the better IS.
Our findings also have implications for individuals. While it is understandable that benefits of
IT consumerization outweigh the perceived associated risks, individuals should not disregard
its risks entirely. Particularly with regards to file sharing, the storage of business data on exter-
nal servers should not be taken lightly, as the theft of such data may imply severe consequences
for the individual and the organization.
2.2.6 Limitations and Future Work
Our study has a number of limitations and leaves room for further research. In the empirical
part, we use data from a single cross-sectional survey, which leads to limitations in testing
robustness and generalizability of the results. Furthermore, we queried the participants on both
IT services in a single survey. While this accounts for unobserved participant characteristics
and increases comparability across data on the services, it might have biased the data in the
direction of unwarranted consistency across the two services. Also, we restricted our data
Individual Information Systems and their Use 80
collection to two IT services – one communication and one collaboration service. While these
are important service types available in most office suites and in many individuals’ private IS,
it does not consider additional services, such as emailing, and online social networks, which
may impair generalizability of our results.
In the qualitative part of our analysis, we identified additional mechanisms, such as the integra-
tion preference, networking, and the fostering of informal contacts using private services. This
indicates that there are more rationales focusing on individual preferences and social relation-
ships between individuals. Future work should investigate the role of different IS used to foster
such relationships in more detail. For example, moderating variables of use, such as segmenta-
tion or integration preferences concerning the private and business domain (cf. Sarker et al.
2012) may be considered.
One other particularly noteworthy observation from the qualitative part of our analysis is that
there are multiple accounts of employees who value the security features of consumer IT (such
as end-to-end encryption). Others, however, report that security concerns are strong inhibitors
of use. This duality could be due to different positions, organizational cultures, or other percep-
tions of boundaries. Investigating the root of these differences should be subject to future re-
search and would contribute to our understanding of IT policies and security related to IT con-
sumerization.
2.2.7 Conclusion
This paper contributes to the understanding of the phenomenon of IT consumerization. With a
focus on IT services, it complements extant literature on IT device consumerization. We inves-
tigated factors influencing individuals’ behavior in whether or not they use private consumer
IT services in a business context. To do so, we analyzed the relevant literature and developed a
theoretical model based on benefit-risk assessments, which we tested in an empirical study with
mixed quantitative and qualitative elements. Regarding risks, we find that a prohibition of IT
service consumerization does not prevent individuals from using their private IT services for
business purposes. Contrarily, we find benefits to be the driver of use and that users make de-
liberate decisions based on the assessment of the functionalities of the services. To this end, we
have deepened the understanding of IT service consumerization and the reasons for use behav-
ior in a post-adoptive phase. We urge practitioners to recognize the relevance of adequate busi-
ness alternatives in order to manage IT service consumerization.
Individual Information Systems and their Use 81
2.2.8 References
Baskerville, R. L. 2011a. “Design Theorizing Individual Information Systems,” in Proceedings
of the 15th Pacific Asia Conference on Information Systems, Brisbane, Australia, pp. 1-13.
Baskerville, R. L. 2011b. “Individual Information Systems as a Research Arena,” European
Journal of Information Systems (20:3), pp. 251-254.
Baskerville, R. L., and Lee, A. S. 2013. “Individual Organizational Bindpoints: A Design The-
ory for Bring-Your-Own-System,” in Proceedings of the 17th Pacific Asia Conference on
Information Systems, Jeju Island, Korea, pp. 1-12.
Bautista, J. R., Rosenthal, S., Lin, T. T., and Theng, Y. L. 2018. “Predictors and Outcomes of
Nurses’ Use of Smartphones for Work Purposes,” Computers in Human Behavior (84),
pp. 360-374.
Behrens, S. 2009. “Shadow Systems: The Good, the Bad and the Ugly,” Communications of
the ACM (52:2), pp. 124-129.
Briggs, R. O., Adkins, M., Mittleman, D., Kruse, J., Miller, S., and Nunamaker, J. F. 1998. “A
Technology Transition Model Derived from Field Investigation of GSS Use aboard the
U.S.S. CORONADO,” Journal of Management Information Systems (15:3), pp. 151-195.
Buhrmester, M., Kwang, T., and Gosling, S. D. 2011. “Amazon’s Mechanical Turk: A New
Source of Inexpensive, Yet High-Quality, Data?” Perspectives on Psychological Science
(6:1), pp. 3-5.
Burton-Jones, A., and Straub, D. W. 2006. “Reconceptualizing System Usage: An Approach
and Empirical Test,” Information Systems Research (17:3), pp. 228-246.
Carter, M., and Petter, S. 2015. “Leveraging Consumer Technologies: Exploring Determinants
of Smartphone Use Behaviors in the Workplace,” in Proceedings of the 48th Hawaii Inter-
national Conference on System Science, Kauai, Hawaii, USA, pp. 4619-4628.
Chmielewski, M., and Kucker, S. C. 2020. “An MTurk Crisis?: Shifts in Data Quality and the
Impact on Study Results,” Social Psychological and Personality Science (11:4), pp. 464-
473.
Chua, C., Storey, V., and Chen, L. 2014. “Central IT or Shadow IT?: Factors Shaping Users’
Decision to Go Rogue with IT,” in Proceedings of the 35th International Conference on
Information Systems, Auckland, New Zealand, pp. 1-14.
Cocosila, M., Archer, N., and Yuan, Y. 2009. “Early Investigation of New Information Tech-
nology Acceptance: A Perceived Risk-Motivation Model,” Communications of the Associ-
ation for Information Systems (25:1), pp. 339-358.
Individual Information Systems and their Use 82
Crossler, R. E., Long, J. H., Loraas, T. M., and Trinkle, B. S. 2014. “Understanding Compliance
with Bring Your Own Device Policies Utilizing Protection Motivation Theory: Bridging the
Intention-Behavior Gap,” Journal of Information Systems (28:1), pp. 209-226.
Davis, F. D., Bagozzi, R. P., and Warshaw, P. R. 1989. “User Acceptance of Computer Tech-
nology: A Comparison of Two Theoretical Models,” Management Science (35:8), pp. 982-
1003.
Degirmenci, K., Shim, J. P., Breitner, M. H., Nolte, F., and Passlick, J. 2019. “Future of Flexible
Work in the Digital Age: Bring Your Own Device Challenges of Privacy Protection,” in
Proceedings of the 40th International Conference on Information Systems, Munich, Ger-
many, pp. 1-17.
Demirkan, H., Kauffman, R. J., Vayghan, J. A., Fill, H.-G., Karagiannis, D., and Maglio, P. P.
2008. “Service-Oriented Technology and Management: Perspectives on Research and Prac-
tice for the Coming Decade,” Electronic Commerce Research and Applications (7:4),
pp. 356-376.
Fishbein, M. 1967. “Attitude and the Prediction of Behavior,” in Readings in Attitude Theory
and Measurement, M. Fishbein (ed.), New York: Wiley, pp. 477-492.
Fornell, C., and Larcker, D. F. 1981. “Evaluating Structural Equation Models with Unobserva-
ble Variables and Measurement Error,” Journal of Marketing Research (18:1), pp. 39-50.
Frank, L., Gimpel, H., Schmidt, M., and Schoch, M. 2017. “Emergent User Roles of a Digital
Workplace: A Network Analysis Based on Trace Data,” in Proceedings of the 38th Inter-
national Conference on Information Systems, Seoul, Korea, pp. 1-17.
Gewald, H., Wang, X., Weeger, A., Raisinghani, M. S., Grant, G., Sanchez, O., and Pittayacha-
wan, S. 2017. “Millennials’ Attitudes Toward IT Consumerization in the Workplace,” Com-
munications of the ACM (60:10), pp. 62-69.
Goodhue, D. L., and Thompson, R. L. 1995. “Task-Technology Fit and Individual Perfor-
mance,” Management Information Systems Quarterly (19:2), pp. 213-236.
Gotta, M., Drakos, N., and Mann, J. 2015. “Magic Quadrant for Social Software in the Work-
place,” Gartner (ed.).
Griffith, T. L. 1999. “Technology Features as Triggers for Sensemaking,” The Academy of
Management Review (24:3), p. 472.
Guo, K. H., Yuan, Y., Archer, N. P., and Connelly, C. E. 2011. “Understanding Nonmalicious
Security Violations in the Workplace: A Composite Behavior Model,” Journal of Manage-
ment Information Systems (28:2), pp. 203-236.
Individual Information Systems and their Use 83
Györy, A., Cleven, A., Uebernickel, F., and Brenner, W. 2012. “Exploring the Shadows: IT
Governance Approaches to User-Driven Innovation,” in Proceedings of the 20th European
Conference on Information Systems, Barcelona, Spain, pp. 1-12.
Haag, S., and Eckhardt, A. 2014. “Sensitizing Employees’ Corporate IS Security Risk Percep-
tion,” in Proceedings of the 35th International Conference on Information Systems, Auck-
land, New Zealand, pp. 1-17.
Haag, S., and Eckhardt, A. 2017. “Shadow IT,” Business & Information Systems Engineering
(59:6), pp. 469-473.
Hair, J. F., Hult, G. T. M., Ringle, C. M., and Sarstedt, M. 2014. A Primer on Partial Least
Squares Structural Equation Modeling (PLS-SEM), Thousand Oaks: Sage Publications.
Harris, J. G., Ives, B., and Junglas, I. 2012. “IT Consumerization: When Gadgets Turn Into
Enterprise IT Tools,” Management Information Systems Quarterly Executive (11:3), pp. 99-
112.
Henseler, J., Ringle, C. M., and Sarstedt, M. 2015. “A New Criterion for Assessing Discrimi-
nant Validity in Variance-Based Structural Equation Modeling,” Journal of the Academy of
Marketing Science (43:1), pp. 115-135.
Herath, T., and Rao, H. R. 2009. “Protection Motivation and Deterrence: A Framework for
Security Policy Compliance in Organisations,” European Journal of Information Systems
(18:2), pp. 106-125.
Hopkins, N., Sylvester, A., and Tate, M. 2013. “Motivations for BYOD: An Investigation of
the Contents of a 21st Century School Bag,” in Proceedings of the 21st European Confer-
ence on Information Systems, Utrecht, Netherlands, pp. 1-12.
James, T. L., Wallace, L., and Deane, J. K. 2019. “Using Organiscmic Integration Theory to
Explore the Associations Between Users’ Exercise Motivations and Fitness Technology
Feature Set Use,” Management Information Systems Quarterly (43:1), pp. 287-312.
Jasperson, J. S., Carter, P. E., and Zmud, R. W. 2005. “A Comprehensive Conceptualization of
Post-Adoptive Behaviors associated with Information Technology Enables Work Systems,”
Management Information Systems Quarterly (29:3), pp. 525-557.
Jia, R., Steelman, Z. R., and Reich, B. H. 2017. “Using Mechanical Turk Data in IS Research:
Risks, Rewards, and Recommendations,” Communications of the Association for Infor-
mation Systems (41), pp. 301-318.
Junglas, I., Goel, L., Ives, B., and Harris, J. G. 2019. “Innovation at Work: The Relative Ad-
vantage of Using Consumer IT in the Workplace,” Information Systems Journal (29:2),
pp. 317-339.
Individual Information Systems and their Use 84
Kehr, F., Kowatsch, T., Wentzel, D., and Fleisch, E. 2015. “Blissfully Ignorant: The Effects of
General Privacy Concerns, General Institutional Trust, and Affect in the Privacy Calculus,”
Information Systems Journal (25:6), pp. 607-635.
Klesel, M., Weber, S., Walsdorff, F., and Niehaves, B. 2019. “Are Employees Following the
Rules?: On the Effectiveness of IT Consumerization Policies,” in Proceedings of the 14th
International Conference on Wirtschaftsinformatik, Siegen, Germany, pp. 847-860.
Köffer, S. 2015. “Designing the Digital Workplace of the Future: What Scholars Recommend
to Practitioners,” in Proceedings of the 36th International Conference on Information Sys-
tems, Fort Worth, Texas, USA, pp. 1-21.
Köffer, S., Ortbach, K., Junglas, I., Niehaves, B., and Harris, J. G. 2015. “Innovation Through
BYOD?: The Influence of IT Consumerization on Individual IT Innovation Behavior,”
Business & Information Systems Engineering (57:6), pp. 363-375.
Kreiner, G. E., Hollensbe, E. C., and Sheep, M. L. 2009. “Balancing Borders and Bridges:
Negotiating the Work-Home Interface via Boundary Work Tactics,” Academy of Manage-
ment Journal (52:4), pp. 704-730.
Lebek, B., Degirmenci, K., and Breitner, M. H. 2013. “Investigating the Influence of Security,
Privacy, and Legal Concerns on Employees’ Intention to Use BYOD Mobile Devices,” in
Proceedings of the 19th Americas Conference on Information Systems, Chicago, Illinois,
USA, pp. 1-8.
Lee, A. S., Thomas, M., and Baskerville, R. L. 2015. “Going Back to Basics in Design Science:
From the Information Technology Artifact to the Information Systems Artifact,” Infor-
mation Systems Journal (25:1), pp. 5-21.
Lee, J., Warkentin, M., Crossler, R. E., and Otondo, R. F. 2017. “Implications of Monitoring
Mechanisms on Bring Your Own Device Adoption,” Journal of Computer Information Sys-
tems (57:4), pp. 309-318.
Lewin, K., Dembo, T., Festinger, L., and Sears, P. S. 1944. “Level of Aspiration,” in Person-
ality and the Behavior Disorders, J. M. Hunt (ed.), New York: Ronald Press, pp. 333-378.
Lin, T.-C., and Huang, C.-C. 2008. “Understanding Knowledge Management System Usage
Antecedents: An Integration of Social Cognitive Theory and Task Technology Fit,” Infor-
mation & Management (45:6), pp. 410-417.
Lindell, M. K., and Whitney, D. J. 2001. “Accounting for Common Method Variance in Cross-
Sectional Research Designs,” The Journal of Applied Psychology (86:1), pp. 114-121.
Lowry, P. B., Zhang, J., and Wang, Chuang. Siponen, Mikko 2016. “Why Do Adults Engage
in Cyberbullying on Social Media? : An Integration of Online Disinhibition and
Individual Information Systems and their Use 85
Deindividuation Effects with the Social Structure and Social Learning Model,” Information
Systems Research (27:4), pp. 962-986.
Marakas, G., Johnson, R., and Clay, P. 2007. “The Evolving Nature of the Computer Self-
Efficacy Construct: An Empirical Investigation of Measurement Construction, Validity, Re-
liability and Stability Over Time,” Journal of the Association for Information Systems (8:1),
pp. 16-46.
Mason, W., and Suri, S. 2012. “Conducting Behavioral Research on Amazon’s Mechanical
Turk,” Behavior Research Methods (44:1), pp. 1-23.
Moschella, D., Neal, D., Opperman, P., and Taylor, J. 2004. “The "Consumerization" of Infor-
mation Technology,” Computer Sciences Corporation (ed.).
Niehaves, B., Köffer, S., and Ortbach, K. 2012. “IT Consumerization: A Theory and Practice
Review,” in Proceedings of the 18th Americas Conference on Information Systems, Seattle,
Washington, USA, pp. 1-9.
Nunnally, J. C., and Bernstein, I. H. 1994. Psychometric Theory, New York: McGraw-Hill.
Nysveen, H., Pedersen, P. E., and Thorbjørnsen, H. 2005. “Intentions to Use Mobile Services:
Antecedents and Cross-Service Comparisons,” Journal of the Academy of Marketing Sci-
ence (33:3), pp. 330-346.
Oppenheimer, D. M., Meyvis, T., and Davidenko, N. 2009. “Instructional Manipulation
Checks: Detecting Satisficing to Increase Statistical Power,” Journal of Experimental Social
Psychology (45:4), pp. 867-872.
Ortbach, K. 2015. “Unraveling the Effect of Personal Innovativeness on Bring-Your-Own-De-
vice (BYOD) Intention: The Role of Perceptions towards Enterprise-Provided and Pri-
vately-Owned Technologies,” in Proceedings of the 23rd European Conference on Infor-
mation Systems, Muenster, Germany, pp. 1-17.
Ortbach, K., Brockmann, T., and Stieglitz, S. 2014. “Drivers for the Adoption of Mobile Device
Management in Organizations,” in Proceedings of the 22nd European Conference on Infor-
mation Systems, Tel Aviv, pp. 1-18.
Ortbach, K., Köffer, S., Bode, M., and Niehaves, B. 2013. “Individualization of Information
Systems: Analyzing Antecedents of IT Consumerization Behavior,” in Proceedings of the
34th International Conference on Information Systems, Milan, Italy, pp. 1-18.
Paolacci, G., Chandler, J., and Ipeirotis, P. G. 2010. “Running Experiments on Amazon Me-
chanical Turk,” Judgement and Decision Making (5:5), pp. 411-419.
Poushter, J. 2016. “Smartphone Ownership and Internet Usage Continues to Climb in Emerging
Economies,” PewResearchCenter (ed.).
Individual Information Systems and their Use 86
Putri, F. F., and Hovav, A. 2014. “Employees´ Compliance with BYOD Security Policy: In-
sights From Reactance, Organizational Justice, and Protection Motivation Theory,” in Pro-
ceedings of the 22nd European Conference on Information Systems, Tel Aviv, pp. 1-17.
Richardson, H. A., Simmering, M. J., and Sturman, M. C. 2009. “A Tale of Three Perspectives:
Examining Post Hoc Statistical Techniques for Detection and Correction of Common
Method Variance,” Organizational Research Methods (12:4), pp. 762-800.
Ringle, C. M., Wende, S., and Becker, J.-M. 2015. SmartPLS 3, Boenningstedt: SmartPLS
GmbH.
Ruch, T., and Gregory, R. 2014. “Consumerization of IT: Where is the Theory?” in Proceedings
of the 18th Pacific Asia Conference on Information Systems, Chengdu, China, pp. 1-16.
Sarker, S., Xiao, X., Sarker, S., and Ahuja, M. K. 2012. “Managing Employees’ Use of Mobile
Technologies to Minimize Work-Life Balance Impacts,” Management Information Systems
Quarterly Executive (11:4), pp. 1-15.
Silic, M., and Back, A. 2014. “Shadow IT: A View from Behind the Curtain,” Computers &
Security (45), pp. 274-283.
Soror, A. A., Hammer, B. I., Steelman, Z. R., Davis, F. D., and Limayem, M. M. 2015. “Good
Habits Gone Bad: Explaining Negative Consequences Associated with the Use of Mobile
Phones from a Dual-Systems Perspective,” Information Systems Journal (25:4), pp. 403-
427.
Steelman, Z. R., Hammer, B. I., and Limayem, M. M. 2014. “Data Collection in the Digital
Age: Innovative Alternatives to Student Samples,” Management Information Systems Quar-
terly (38:2), pp. 355-378.
Stieglitz, S., and Brockmann, T. 2012. “Increasing Organizational Performance by Transform-
ing into a Mobile Enterprise,” Management Information Systems Quarterly Executive
(11:4), pp. 189-204.
Strauss, A., and Corbin, J. M. 1990. Basics of Qualitative Research: Grounded Theory Proce-
dures and Techniques, Newbury Park, CA: Sage Publications.
Sykes, T., and Venkatesh, V. 2017. “Explaining Post-Implementation Employee System Use
and Job Performance: Impacts of the Content and Source of Social Network Ties,” Man-
agement Information Systems Quarterly (41:3), pp. 917-936.
Taylor, S., and Todd, P. A. 1995. “Understanding Information Technology Usage: A Test of
Competing Models,” Information Systems Research (6:2), pp. 144-176.
Individual Information Systems and their Use 87
Thatcher, J. B., Wright, R. T., Sun, H., Zagenczyk, T. J., and Klein, R. 2018. “Mindfulness in
Information Technology Use: Definitions, Distinctions, and a New Measure,” Management
Information Systems Quarterly (42:3), pp. 831-847.
Urbach, N., and Ahlemann, F. 2010. “Structural Equation Modeling in Information Systems
Research Using Partial Least Squares,” Journal of Information Technology Theory and Ap-
plication (11:2), pp. 5-40.
Venkatesh, V., Brown, S. A., and Bala, H. 2013. “Bridging the Qualitative-Quantitative Di-
vide: Guidelines for Conducting Mixed Methods Research in Information Systems,” Man-
agement Information Systems Quarterly (37:1), pp. 21-54.
Venkatesh, V., Brown, S. A., and Sullivan, Y. W. 2016a. “Guidelines for Conducting Mixed-
methods Research: An Extension and lllustration,” Journal of the Association for Infor-
mation Systems (17:7), pp. 435-494.
Venkatesh, V., Morris, M., Davis, G., and Davis, F. D. 2003. “User Acceptance of Information
Technology: Toward a Unified View,” Management Information Systems Quarterly (27:3),
pp. 425-478.
Venkatesh, V., Thong, J. Y. L., and Xu, X. 2012. “Consumer Acceptance and Use of Infor-
mation Technology: Extending the Unified Theory of Acceptance and Use of Technology,”
Management Information Systems Quarterly (36:1), pp. 157-178.
Venkatesh, V., Thong, J. Y. L., and Xu, X. 2016b. “Unified Theory of Acceptance and Use of
Technology: A Synthesis and the Road Ahead,” Journal of the Association for Information
Systems (17:5).
Weeger, A., Wang, X., and Gewald, H. 2015. “IT Consumerization: BYOD-Program Ac-
ceptance and its Impact on Employer Attractiveness,” Journal of Computer Information
Systems (56:1), pp. 1-10.
Weeger, A., Wang, X., Gewald, H., Raisinghani, M. S., Sanchez, O., Grant, G., and Pittayacha-
wan, S. 2020. “Determinants of Intention to Participate in Corporate BYOD-Programs: The
Case of Digital Natives,” Information Systems Frontiers (22:1), pp. 203-219.
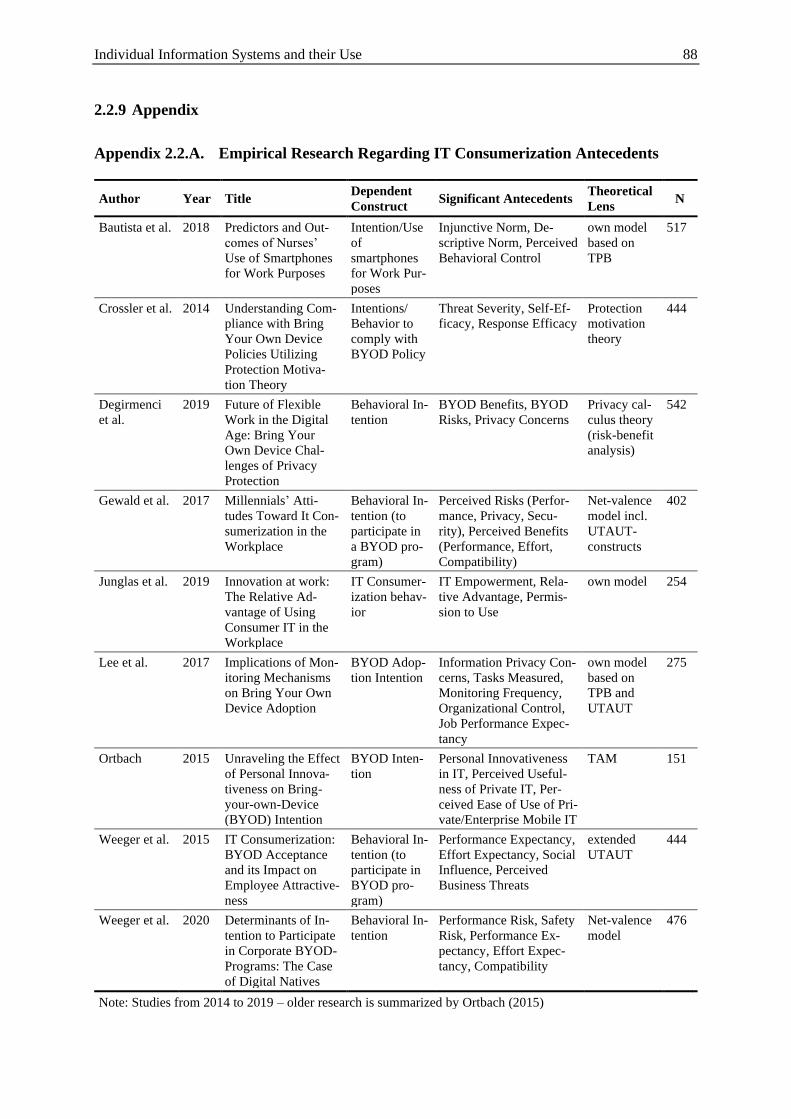
Individual Information Systems and their Use 88
2.2.9 Appendix
Appendix 2.2.A. Empirical Research Regarding IT Consumerization Antecedents
Author Year Title Dependent
Construct Significant Antecedents
Theoretical
Lens N
Bautista et al. 2018 Predictors and Out-
comes of Nurses’
Use of Smartphones
for Work Purposes
Intention/Use
of
smartphones
for Work Pur-
poses
Injunctive Norm, De-
scriptive Norm, Perceived
Behavioral Control
own model
based on
TPB
517
Crossler et al. 2014 Understanding Com-
pliance with Bring
Your Own Device
Policies Utilizing
Protection Motiva-
tion Theory
Intentions/
Behavior to
comply with
BYOD Policy
Threat Severity, Self-Ef-
ficacy, Response Efficacy
Protection
motivation
theory
444
Degirmenci
et al.
2019 Future of Flexible
Work in the Digital
Age: Bring Your
Own Device Chal-
lenges of Privacy
Protection
Behavioral In-
tention
BYOD Benefits, BYOD
Risks, Privacy Concerns
Privacy cal-
culus theory
(risk-benefit
analysis)
542
Gewald et al. 2017 Millennials’ Atti-
tudes Toward It Con-
sumerization in the
Workplace
Behavioral In-
tention (to
participate in
a BYOD pro-
gram)
Perceived Risks (Perfor-
mance, Privacy, Secu-
rity), Perceived Benefits
(Performance, Effort,
Compatibility)
Net-valence
model incl.
UTAUT-
constructs
402
Junglas et al. 2019 Innovation at work:
The Relative Ad-
vantage of Using
Consumer IT in the
Workplace
IT Consumer-
ization behav-
ior
IT Empowerment, Rela-
tive Advantage, Permis-
sion to Use
own model 254
Lee et al. 2017 Implications of Mon-
itoring Mechanisms
on Bring Your Own
Device Adoption
BYOD Adop-
tion Intention
Information Privacy Con-
cerns, Tasks Measured,
Monitoring Frequency,
Organizational Control,
Job Performance Expec-
tancy
own model
based on
TPB and
UTAUT
275
Ortbach 2015 Unraveling the Effect
of Personal Innova-
tiveness on Bring-
your-own-Device
(BYOD) Intention
BYOD Inten-
tion
Personal Innovativeness
in IT, Perceived Useful-
ness of Private IT, Per-
ceived Ease of Use of Pri-
vate/Enterprise Mobile IT
TAM 151
Weeger et al. 2015 IT Consumerization:
BYOD Acceptance
and its Impact on
Employee Attractive-
ness
Behavioral In-
tention (to
participate in
BYOD pro-
gram)
Performance Expectancy,
Effort Expectancy, Social
Influence, Perceived
Business Threats
extended
UTAUT
444
Weeger et al. 2020 Determinants of In-
tention to Participate
in Corporate BYOD-
Programs: The Case
of Digital Natives
Behavioral In-
tention
Performance Risk, Safety
Risk, Performance Ex-
pectancy, Effort Expec-
tancy, Compatibility
Net-valence
model
476
Note: Studies from 2014 to 2019 – older research is summarized by Ortbach (2015)
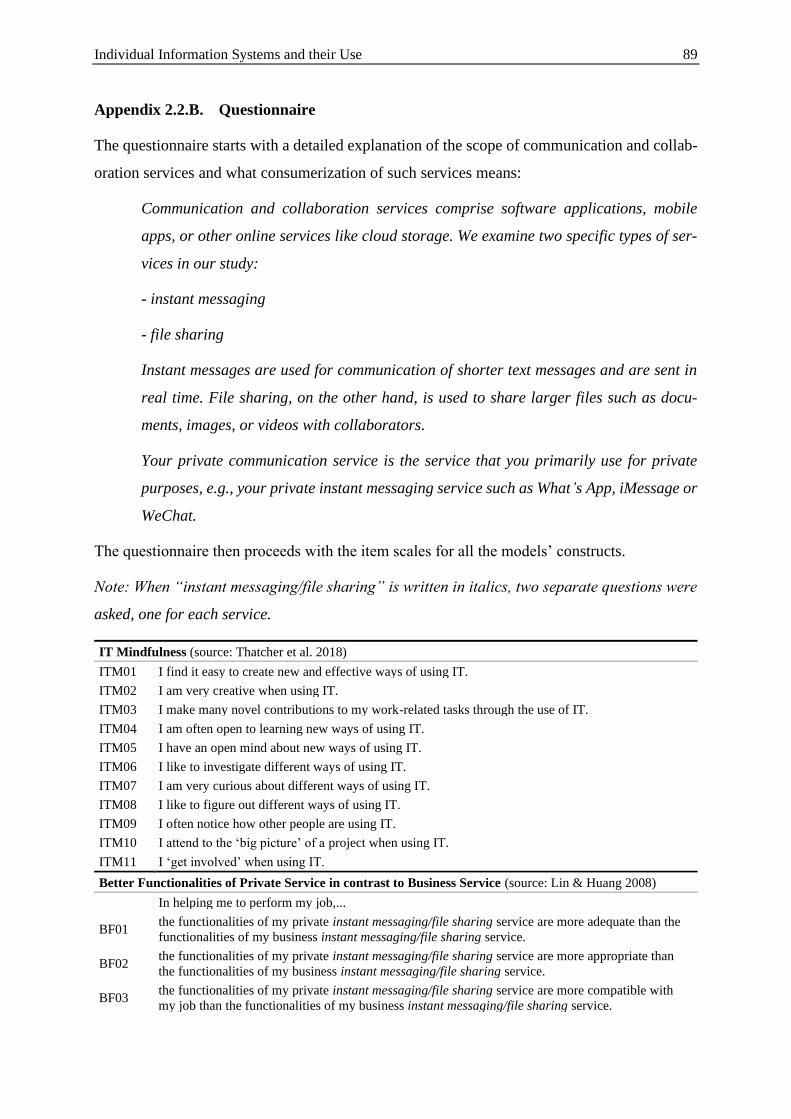
Individual Information Systems and their Use 89
Appendix 2.2.B. Questionnaire
The questionnaire starts with a detailed explanation of the scope of communication and collab-
oration services and what consumerization of such services means:
Communication and collaboration services comprise software applications, mobile
apps, or other online services like cloud storage. We examine two specific types of ser-
vices in our study:
- instant messaging
- file sharing
Instant messages are used for communication of shorter text messages and are sent in
real time. File sharing, on the other hand, is used to share larger files such as docu-
ments, images, or videos with collaborators.
Your private communication service is the service that you primarily use for private
purposes, e.g., your private instant messaging service such as What’s App, iMessage or
WeChat.
The questionnaire then proceeds with the item scales for all the models’ constructs.
Note: When “instant messaging/file sharing” is written in italics, two separate questions were
asked, one for each service.
IT Mindfulness (source: Thatcher et al. 2018)
ITM01 I find it easy to create new and effective ways of using IT.
ITM02 I am very creative when using IT.
ITM03 I make many novel contributions to my work-related tasks through the use of IT.
ITM04 I am often open to learning new ways of using IT.
ITM05 I have an open mind about new ways of using IT.
ITM06 I like to investigate different ways of using IT.
ITM07 I am very curious about different ways of using IT.
ITM08 I like to figure out different ways of using IT.
ITM09 I often notice how other people are using IT.
ITM10 I attend to the ‘big picture’ of a project when using IT.
ITM11 I ‘get involved’ when using IT.
Better Functionalities of Private Service in contrast to Business Service (source: Lin & Huang 2008)
In helping me to perform my job,...
BF01 the functionalities of my private instant messaging/file sharing service are more adequate than the
functionalities of my business instant messaging/file sharing service.
BF02 the functionalities of my private instant messaging/file sharing service are more appropriate than
the functionalities of my business instant messaging/file sharing service.
BF03 the functionalities of my private instant messaging/file sharing service are more compatible with
my job than the functionalities of my business instant messaging/file sharing service.
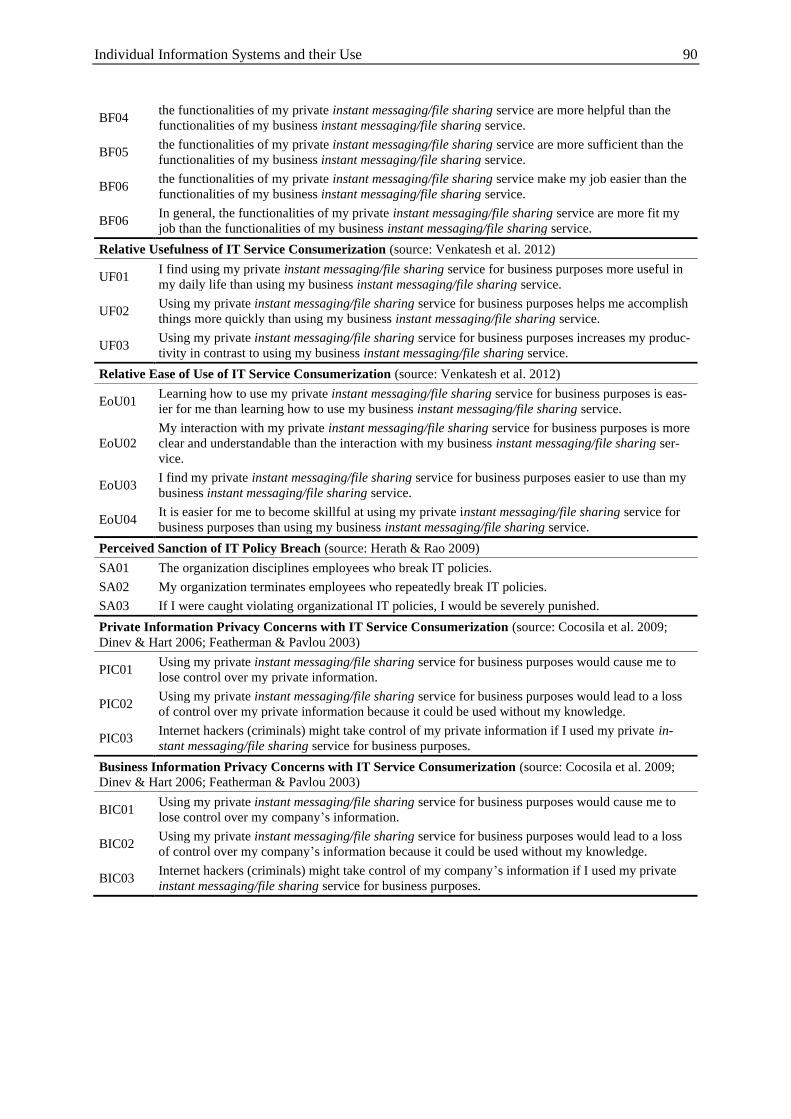
Individual Information Systems and their Use 90
BF04 the functionalities of my private instant messaging/file sharing service are more helpful than the
functionalities of my business instant messaging/file sharing service.
BF05 the functionalities of my private instant messaging/file sharing service are more sufficient than the
functionalities of my business instant messaging/file sharing service.
BF06 the functionalities of my private instant messaging/file sharing service make my job easier than the
functionalities of my business instant messaging/file sharing service.
BF06 In general, the functionalities of my private instant messaging/file sharing service are more fit my
job than the functionalities of my business instant messaging/file sharing service.
Relative Usefulness of IT Service Consumerization (source: Venkatesh et al. 2012)
UF01 I find using my private instant messaging/file sharing service for business purposes more useful in
my daily life than using my business instant messaging/file sharing service.
UF02 Using my private instant messaging/file sharing service for business purposes helps me accomplish
things more quickly than using my business instant messaging/file sharing service.
UF03 Using my private instant messaging/file sharing service for business purposes increases my produc-
tivity in contrast to using my business instant messaging/file sharing service.
Relative Ease of Use of IT Service Consumerization (source: Venkatesh et al. 2012)
EoU01 Learning how to use my private instant messaging/file sharing service for business purposes is eas-
ier for me than learning how to use my business instant messaging/file sharing service.
EoU02
My interaction with my private instant messaging/file sharing service for business purposes is more
clear and understandable than the interaction with my business instant messaging/file sharing ser-
vice.
EoU03 I find my private instant messaging/file sharing service for business purposes easier to use than my
business instant messaging/file sharing service.
EoU04 It is easier for me to become skillful at using my private instant messaging/file sharing service for
business purposes than using my business instant messaging/file sharing service.
Perceived Sanction of IT Policy Breach (source: Herath & Rao 2009)
SA01 The organization disciplines employees who break IT policies.
SA02 My organization terminates employees who repeatedly break IT policies.
SA03 If I were caught violating organizational IT policies, I would be severely punished.
Private Information Privacy Concerns with IT Service Consumerization (source: Cocosila et al. 2009;
Dinev & Hart 2006; Featherman & Pavlou 2003)
PIC01 Using my private instant messaging/file sharing service for business purposes would cause me to
lose control over my private information.
PIC02 Using my private instant messaging/file sharing service for business purposes would lead to a loss
of control over my private information because it could be used without my knowledge.
PIC03 Internet hackers (criminals) might take control of my private information if I used my private in-
stant messaging/file sharing service for business purposes.
Business Information Privacy Concerns with IT Service Consumerization (source: Cocosila et al. 2009;
Dinev & Hart 2006; Featherman & Pavlou 2003)
BIC01 Using my private instant messaging/file sharing service for business purposes would cause me to
lose control over my company’s information.
BIC02 Using my private instant messaging/file sharing service for business purposes would lead to a loss
of control over my company’s information because it could be used without my knowledge.
BIC03 Internet hackers (criminals) might take control of my company’s information if I used my private
instant messaging/file sharing service for business purposes.
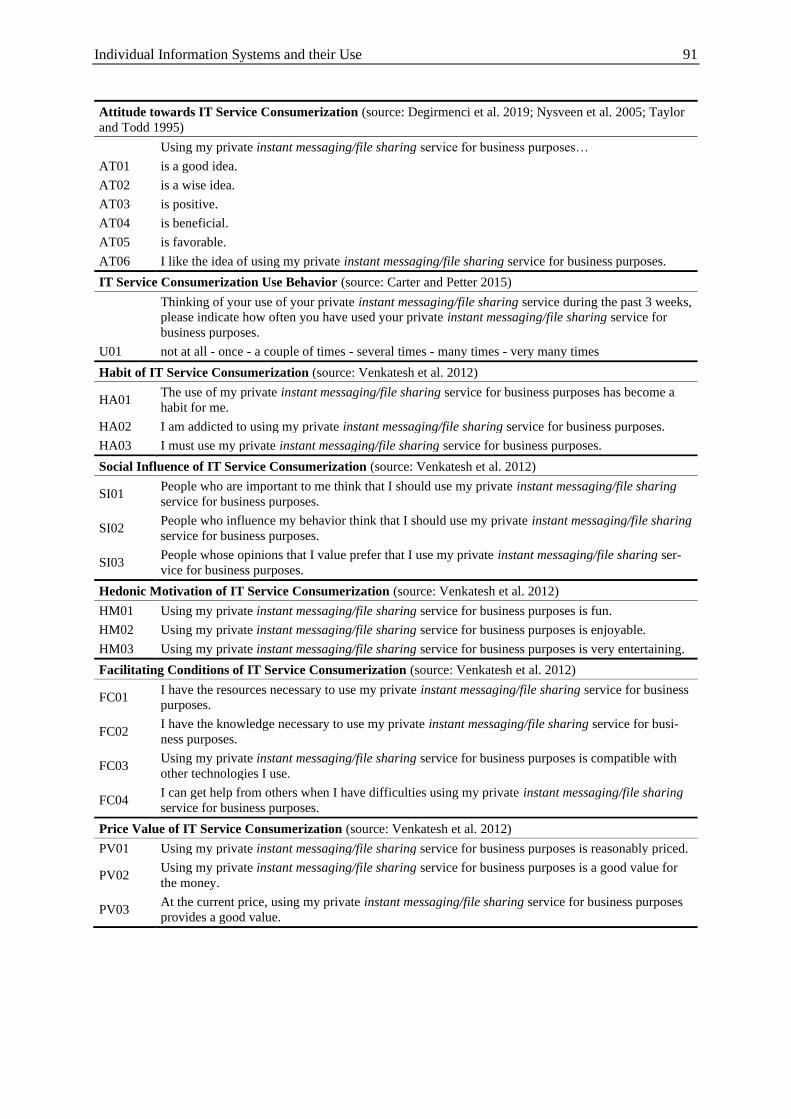
Individual Information Systems and their Use 91
Attitude towards IT Service Consumerization (source: Degirmenci et al. 2019; Nysveen et al. 2005; Taylor
and Todd 1995)
Using my private instant messaging/file sharing service for business purposes…
AT01 is a good idea.
AT02 is a wise idea.
AT03 is positive.
AT04 is beneficial.
AT05 is favorable.
AT06 I like the idea of using my private instant messaging/file sharing service for business purposes.
IT Service Consumerization Use Behavior (source: Carter and Petter 2015)
Thinking of your use of your private instant messaging/file sharing service during the past 3 weeks,
please indicate how often you have used your private instant messaging/file sharing service for
business purposes.
U01 not at all - once - a couple of times - several times - many times - very many times
Habit of IT Service Consumerization (source: Venkatesh et al. 2012)
HA01 The use of my private instant messaging/file sharing service for business purposes has become a
habit for me.
HA02 I am addicted to using my private instant messaging/file sharing service for business purposes.
HA03 I must use my private instant messaging/file sharing service for business purposes.
Social Influence of IT Service Consumerization (source: Venkatesh et al. 2012)
SI01 People who are important to me think that I should use my private instant messaging/file sharing
service for business purposes.
SI02 People who influence my behavior think that I should use my private instant messaging/file sharing
service for business purposes.
SI03 People whose opinions that I value prefer that I use my private instant messaging/file sharing ser-
vice for business purposes.
Hedonic Motivation of IT Service Consumerization (source: Venkatesh et al. 2012)
HM01 Using my private instant messaging/file sharing service for business purposes is fun.
HM02 Using my private instant messaging/file sharing service for business purposes is enjoyable.
HM03 Using my private instant messaging/file sharing service for business purposes is very entertaining.
Facilitating Conditions of IT Service Consumerization (source: Venkatesh et al. 2012)
FC01 I have the resources necessary to use my private instant messaging/file sharing service for business
purposes.
FC02 I have the knowledge necessary to use my private instant messaging/file sharing service for busi-
ness purposes.
FC03 Using my private instant messaging/file sharing service for business purposes is compatible with
other technologies I use.
FC04 I can get help from others when I have difficulties using my private instant messaging/file sharing
service for business purposes.
Price Value of IT Service Consumerization (source: Venkatesh et al. 2012)
PV01 Using my private instant messaging/file sharing service for business purposes is reasonably priced.
PV02 Using my private instant messaging/file sharing service for business purposes is a good value for
the money.
PV03 At the current price, using my private instant messaging/file sharing service for business purposes
provides a good value.
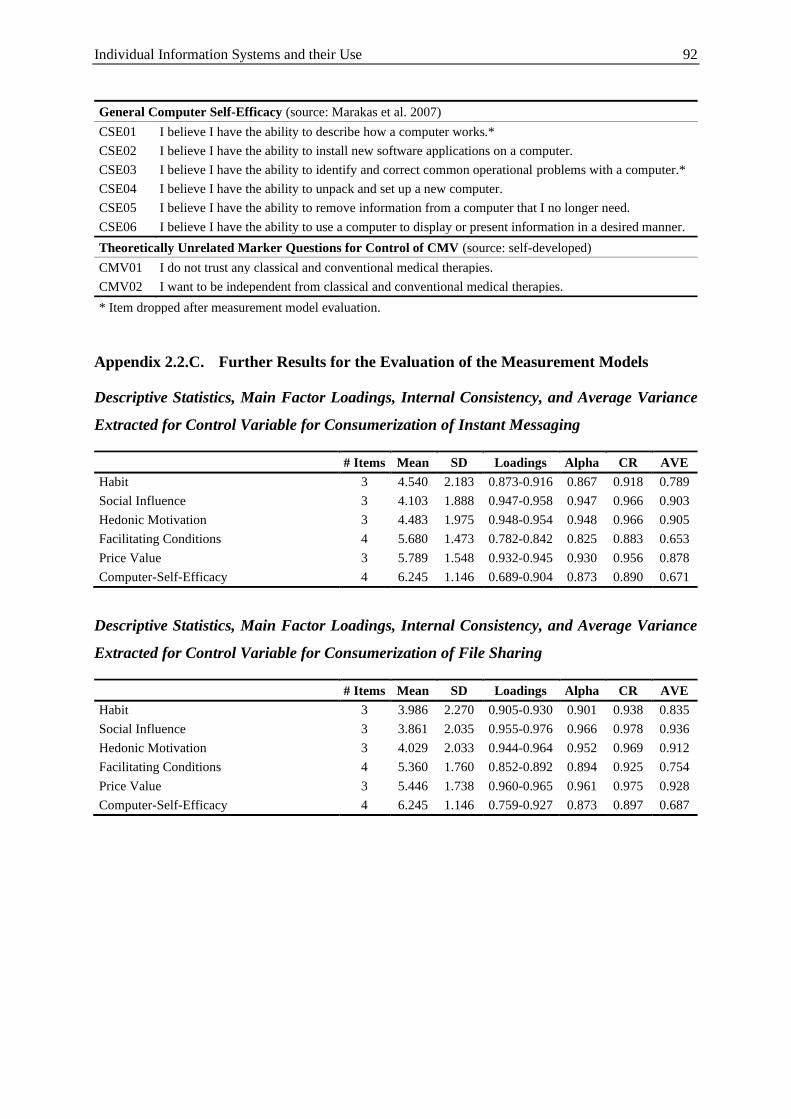
Individual Information Systems and their Use 92
General Computer Self-Efficacy (source: Marakas et al. 2007)
CSE01 I believe I have the ability to describe how a computer works.*
CSE02 I believe I have the ability to install new software applications on a computer.
CSE03 I believe I have the ability to identify and correct common operational problems with a computer.*
CSE04 I believe I have the ability to unpack and set up a new computer.
CSE05 I believe I have the ability to remove information from a computer that I no longer need.
CSE06 I believe I have the ability to use a computer to display or present information in a desired manner.
Theoretically Unrelated Marker Questions for Control of CMV (source: self-developed)
CMV01 I do not trust any classical and conventional medical therapies.
CMV02 I want to be independent from classical and conventional medical therapies.
* Item dropped after measurement model evaluation.
Appendix 2.2.C. Further Results for the Evaluation of the Measurement Models
Descriptive Statistics, Main Factor Loadings, Internal Consistency, and Average Variance
Extracted for Control Variable for Consumerization of Instant Messaging
# Items Mean SD Loadings Alpha CR AVE
Habit 3 4.540 2.183 0.873-0.916 0.867 0.918 0.789
Social Influence 3 4.103 1.888 0.947-0.958 0.947 0.966 0.903
Hedonic Motivation 3 4.483 1.975 0.948-0.954 0.948 0.966 0.905
Facilitating Conditions 4 5.680 1.473 0.782-0.842 0.825 0.883 0.653
Price Value 3 5.789 1.548 0.932-0.945 0.930 0.956 0.878
Computer-Self-Efficacy 4 6.245 1.146 0.689-0.904 0.873 0.890 0.671
Descriptive Statistics, Main Factor Loadings, Internal Consistency, and Average Variance
Extracted for Control Variable for Consumerization of File Sharing
# Items Mean SD Loadings Alpha CR AVE
Habit 3 3.986 2.270 0.905-0.930 0.901 0.938 0.835
Social Influence 3 3.861 2.035 0.955-0.976 0.966 0.978 0.936
Hedonic Motivation 3 4.029 2.033 0.944-0.964 0.952 0.969 0.912
Facilitating Conditions 4 5.360 1.760 0.852-0.892 0.894 0.925 0.754
Price Value 3 5.446 1.738 0.960-0.965 0.961 0.975 0.928
Computer-Self-Efficacy 4 6.245 1.146 0.759-0.927 0.873 0.897 0.687
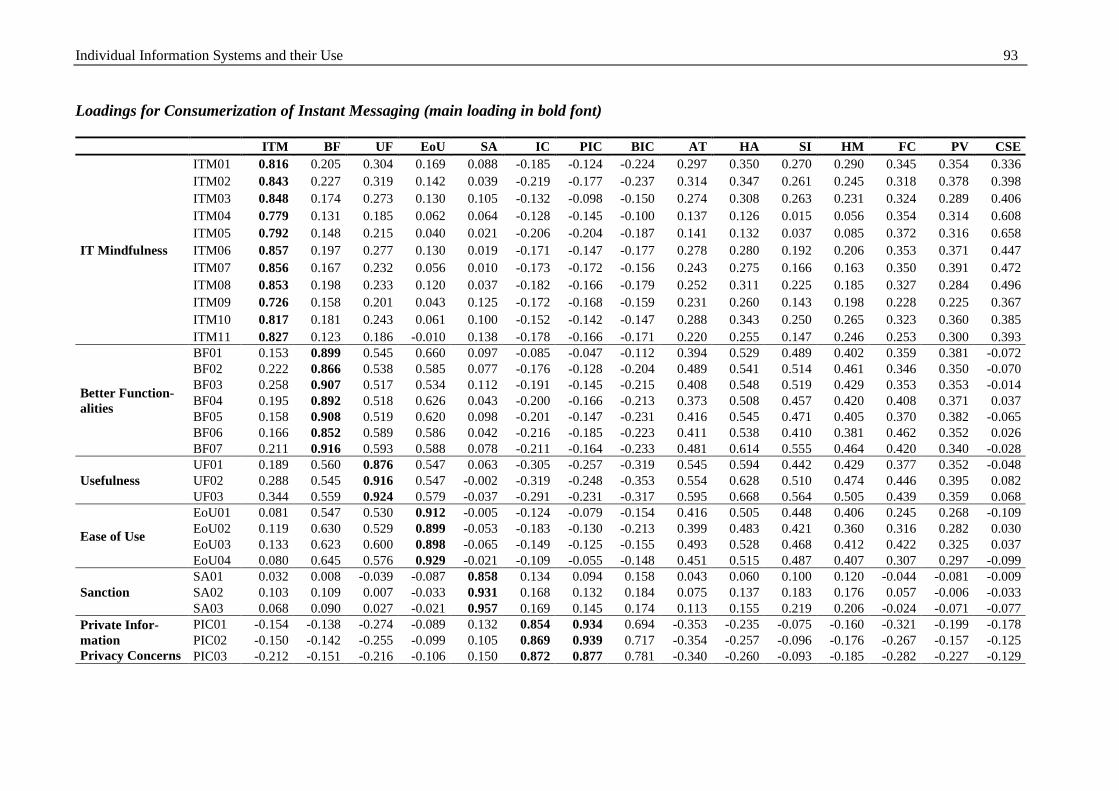
Individual Information Systems and their Use 93
Loadings for Consumerization of Instant Messaging (main loading in bold font)
ITM BF UF EoU SA IC PIC BIC AT HA SI HM FC PV CSE
IT Mindfulness
ITM01 0.816 0.205 0.304 0.169 0.088 -0.185 -0.124 -0.224 0.297 0.350 0.270 0.290 0.345 0.354 0.336
ITM02 0.843 0.227 0.319 0.142 0.039 -0.219 -0.177 -0.237 0.314 0.347 0.261 0.245 0.318 0.378 0.398
ITM03 0.848 0.174 0.273 0.130 0.105 -0.132 -0.098 -0.150 0.274 0.308 0.263 0.231 0.324 0.289 0.406
ITM04 0.779 0.131 0.185 0.062 0.064 -0.128 -0.145 -0.100 0.137 0.126 0.015 0.056 0.354 0.314 0.608
ITM05 0.792 0.148 0.215 0.040 0.021 -0.206 -0.204 -0.187 0.141 0.132 0.037 0.085 0.372 0.316 0.658
ITM06 0.857 0.197 0.277 0.130 0.019 -0.171 -0.147 -0.177 0.278 0.280 0.192 0.206 0.353 0.371 0.447
ITM07 0.856 0.167 0.232 0.056 0.010 -0.173 -0.172 -0.156 0.243 0.275 0.166 0.163 0.350 0.391 0.472
ITM08 0.853 0.198 0.233 0.120 0.037 -0.182 -0.166 -0.179 0.252 0.311 0.225 0.185 0.327 0.284 0.496
ITM09 0.726 0.158 0.201 0.043 0.125 -0.172 -0.168 -0.159 0.231 0.260 0.143 0.198 0.228 0.225 0.367
ITM10 0.817 0.181 0.243 0.061 0.100 -0.152 -0.142 -0.147 0.288 0.343 0.250 0.265 0.323 0.360 0.385
ITM11 0.827 0.123 0.186 -0.010 0.138 -0.178 -0.166 -0.171 0.220 0.255 0.147 0.246 0.253 0.300 0.393
Better Function-
alities
BF01 0.153 0.899 0.545 0.660 0.097 -0.085 -0.047 -0.112 0.394 0.529 0.489 0.402 0.359 0.381 -0.072
BF02 0.222 0.866 0.538 0.585 0.077 -0.176 -0.128 -0.204 0.489 0.541 0.514 0.461 0.346 0.350 -0.070
BF03 0.258 0.907 0.517 0.534 0.112 -0.191 -0.145 -0.215 0.408 0.548 0.519 0.429 0.353 0.353 -0.014
BF04 0.195 0.892 0.518 0.626 0.043 -0.200 -0.166 -0.213 0.373 0.508 0.457 0.420 0.408 0.371 0.037
BF05 0.158 0.908 0.519 0.620 0.098 -0.201 -0.147 -0.231 0.416 0.545 0.471 0.405 0.370 0.382 -0.065
BF06 0.166 0.852 0.589 0.586 0.042 -0.216 -0.185 -0.223 0.411 0.538 0.410 0.381 0.462 0.352 0.026
BF07 0.211 0.916 0.593 0.588 0.078 -0.211 -0.164 -0.233 0.481 0.614 0.555 0.464 0.420 0.340 -0.028
Usefulness
UF01 0.189 0.560 0.876 0.547 0.063 -0.305 -0.257 -0.319 0.545 0.594 0.442 0.429 0.377 0.352 -0.048
UF02 0.288 0.545 0.916 0.547 -0.002 -0.319 -0.248 -0.353 0.554 0.628 0.510 0.474 0.446 0.395 0.082
UF03 0.344 0.559 0.924 0.579 -0.037 -0.291 -0.231 -0.317 0.595 0.668 0.564 0.505 0.439 0.359 0.068
Ease of Use
EoU01 0.081 0.547 0.530 0.912 -0.005 -0.124 -0.079 -0.154 0.416 0.505 0.448 0.406 0.245 0.268 -0.109
EoU02 0.119 0.630 0.529 0.899 -0.053 -0.183 -0.130 -0.213 0.399 0.483 0.421 0.360 0.316 0.282 0.030
EoU03 0.133 0.623 0.600 0.898 -0.065 -0.149 -0.125 -0.155 0.493 0.528 0.468 0.412 0.422 0.325 0.037
EoU04 0.080 0.645 0.576 0.929 -0.021 -0.109 -0.055 -0.148 0.451 0.515 0.487 0.407 0.307 0.297 -0.099
Sanction
SA01 0.032 0.008 -0.039 -0.087 0.858 0.134 0.094 0.158 0.043 0.060 0.100 0.120 -0.044 -0.081 -0.009
SA02 0.103 0.109 0.007 -0.033 0.931 0.168 0.132 0.184 0.075 0.137 0.183 0.176 0.057 -0.006 -0.033
SA03 0.068 0.090 0.027 -0.021 0.957 0.169 0.145 0.174 0.113 0.155 0.219 0.206 -0.024 -0.071 -0.077
Private Infor-
mation
Privacy Concerns
PIC01 -0.154 -0.138 -0.274 -0.089 0.132 0.854 0.934 0.694 -0.353 -0.235 -0.075 -0.160 -0.321 -0.199 -0.178
PIC02 -0.150 -0.142 -0.255 -0.099 0.105 0.869 0.939 0.717 -0.354 -0.257 -0.096 -0.176 -0.267 -0.157 -0.125
PIC03 -0.212 -0.151 -0.216 -0.106 0.150 0.872 0.877 0.781 -0.340 -0.260 -0.093 -0.185 -0.282 -0.227 -0.129
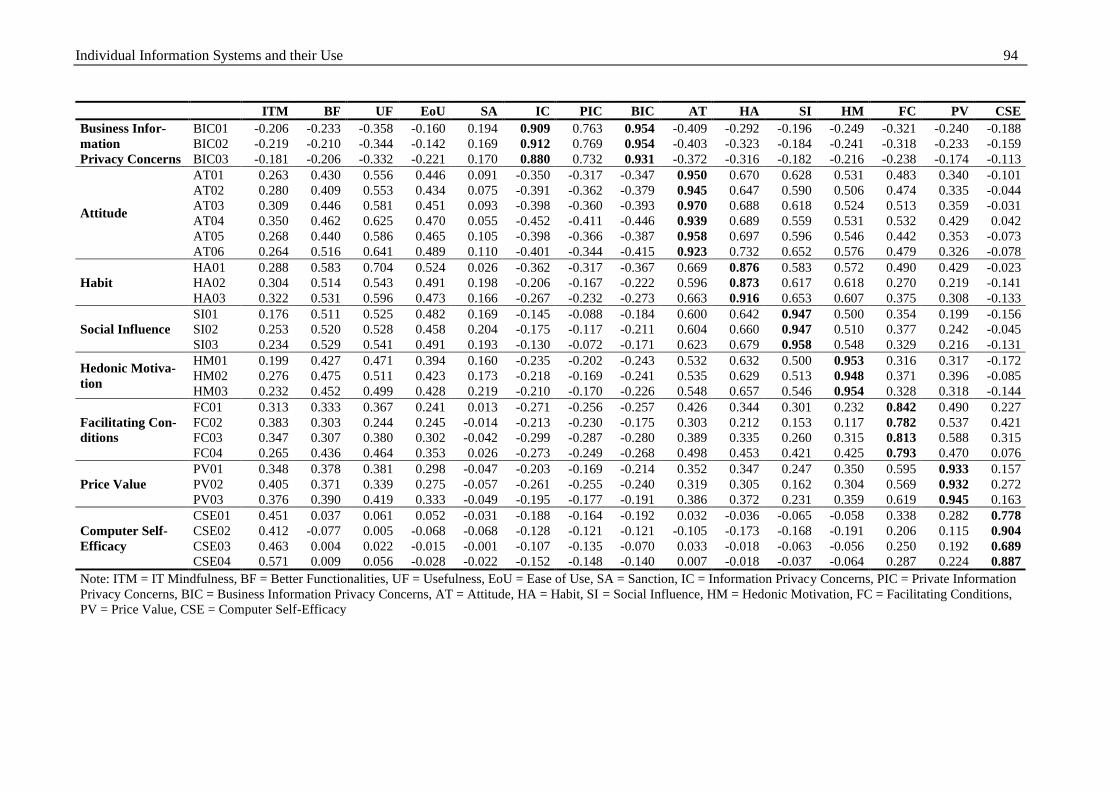
Individual Information Systems and their Use 94
ITM BF UF EoU SA IC PIC BIC AT HA SI HM FC PV CSE
Business Infor-
mation
Privacy Concerns
BIC01 -0.206 -0.233 -0.358 -0.160 0.194 0.909 0.763 0.954 -0.409 -0.292 -0.196 -0.249 -0.321 -0.240 -0.188
BIC02 -0.219 -0.210 -0.344 -0.142 0.169 0.912 0.769 0.954 -0.403 -0.323 -0.184 -0.241 -0.318 -0.233 -0.159
BIC03 -0.181 -0.206 -0.332 -0.221 0.170 0.880 0.732 0.931 -0.372 -0.316 -0.182 -0.216 -0.238 -0.174 -0.113
Attitude
AT01 0.263 0.430 0.556 0.446 0.091 -0.350 -0.317 -0.347 0.950 0.670 0.628 0.531 0.483 0.340 -0.101
AT02 0.280 0.409 0.553 0.434 0.075 -0.391 -0.362 -0.379 0.945 0.647 0.590 0.506 0.474 0.335 -0.044
AT03 0.309 0.446 0.581 0.451 0.093 -0.398 -0.360 -0.393 0.970 0.688 0.618 0.524 0.513 0.359 -0.031
AT04 0.350 0.462 0.625 0.470 0.055 -0.452 -0.411 -0.446 0.939 0.689 0.559 0.531 0.532 0.429 0.042
AT05 0.268 0.440 0.586 0.465 0.105 -0.398 -0.366 -0.387 0.958 0.697 0.596 0.546 0.442 0.353 -0.073
AT06 0.264 0.516 0.641 0.489 0.110 -0.401 -0.344 -0.415 0.923 0.732 0.652 0.576 0.479 0.326 -0.078
Habit
HA01 0.288 0.583 0.704 0.524 0.026 -0.362 -0.317 -0.367 0.669 0.876 0.583 0.572 0.490 0.429 -0.023
HA02 0.304 0.514 0.543 0.491 0.198 -0.206 -0.167 -0.222 0.596 0.873 0.617 0.618 0.270 0.219 -0.141
HA03 0.322 0.531 0.596 0.473 0.166 -0.267 -0.232 -0.273 0.663 0.916 0.653 0.607 0.375 0.308 -0.133
Social Influence
SI01 0.176 0.511 0.525 0.482 0.169 -0.145 -0.088 -0.184 0.600 0.642 0.947 0.500 0.354 0.199 -0.156
SI02 0.253 0.520 0.528 0.458 0.204 -0.175 -0.117 -0.211 0.604 0.660 0.947 0.510 0.377 0.242 -0.045
SI03 0.234 0.529 0.541 0.491 0.193 -0.130 -0.072 -0.171 0.623 0.679 0.958 0.548 0.329 0.216 -0.131
Hedonic Motiva-
tion
HM01 0.199 0.427 0.471 0.394 0.160 -0.235 -0.202 -0.243 0.532 0.632 0.500 0.953 0.316 0.317 -0.172
HM02 0.276 0.475 0.511 0.423 0.173 -0.218 -0.169 -0.241 0.535 0.629 0.513 0.948 0.371 0.396 -0.085
HM03 0.232 0.452 0.499 0.428 0.219 -0.210 -0.170 -0.226 0.548 0.657 0.546 0.954 0.328 0.318 -0.144
Facilitating Con-
ditions
FC01 0.313 0.333 0.367 0.241 0.013 -0.271 -0.256 -0.257 0.426 0.344 0.301 0.232 0.842 0.490 0.227
FC02 0.383 0.303 0.244 0.245 -0.014 -0.213 -0.230 -0.175 0.303 0.212 0.153 0.117 0.782 0.537 0.421
FC03 0.347 0.307 0.380 0.302 -0.042 -0.299 -0.287 -0.280 0.389 0.335 0.260 0.315 0.813 0.588 0.315
FC04 0.265 0.436 0.464 0.353 0.026 -0.273 -0.249 -0.268 0.498 0.453 0.421 0.425 0.793 0.470 0.076
Price Value
PV01 0.348 0.378 0.381 0.298 -0.047 -0.203 -0.169 -0.214 0.352 0.347 0.247 0.350 0.595 0.933 0.157
PV02 0.405 0.371 0.339 0.275 -0.057 -0.261 -0.255 -0.240 0.319 0.305 0.162 0.304 0.569 0.932 0.272
PV03 0.376 0.390 0.419 0.333 -0.049 -0.195 -0.177 -0.191 0.386 0.372 0.231 0.359 0.619 0.945 0.163
Computer Self-
Efficacy
CSE01 0.451 0.037 0.061 0.052 -0.031 -0.188 -0.164 -0.192 0.032 -0.036 -0.065 -0.058 0.338 0.282 0.778
CSE02 0.412 -0.077 0.005 -0.068 -0.068 -0.128 -0.121 -0.121 -0.105 -0.173 -0.168 -0.191 0.206 0.115 0.904
CSE03 0.463 0.004 0.022 -0.015 -0.001 -0.107 -0.135 -0.070 0.033 -0.018 -0.063 -0.056 0.250 0.192 0.689
CSE04 0.571 0.009 0.056 -0.028 -0.022 -0.152 -0.148 -0.140 0.007 -0.018 -0.037 -0.064 0.287 0.224 0.887
Note: ITM = IT Mindfulness, BF = Better Functionalities, UF = Usefulness, EoU = Ease of Use, SA = Sanction, IC = Information Privacy Concerns, PIC = Private Information
Privacy Concerns, BIC = Business Information Privacy Concerns, AT = Attitude, HA = Habit, SI = Social Influence, HM = Hedonic Motivation, FC = Facilitating Conditions,
PV = Price Value, CSE = Computer Self-Efficacy
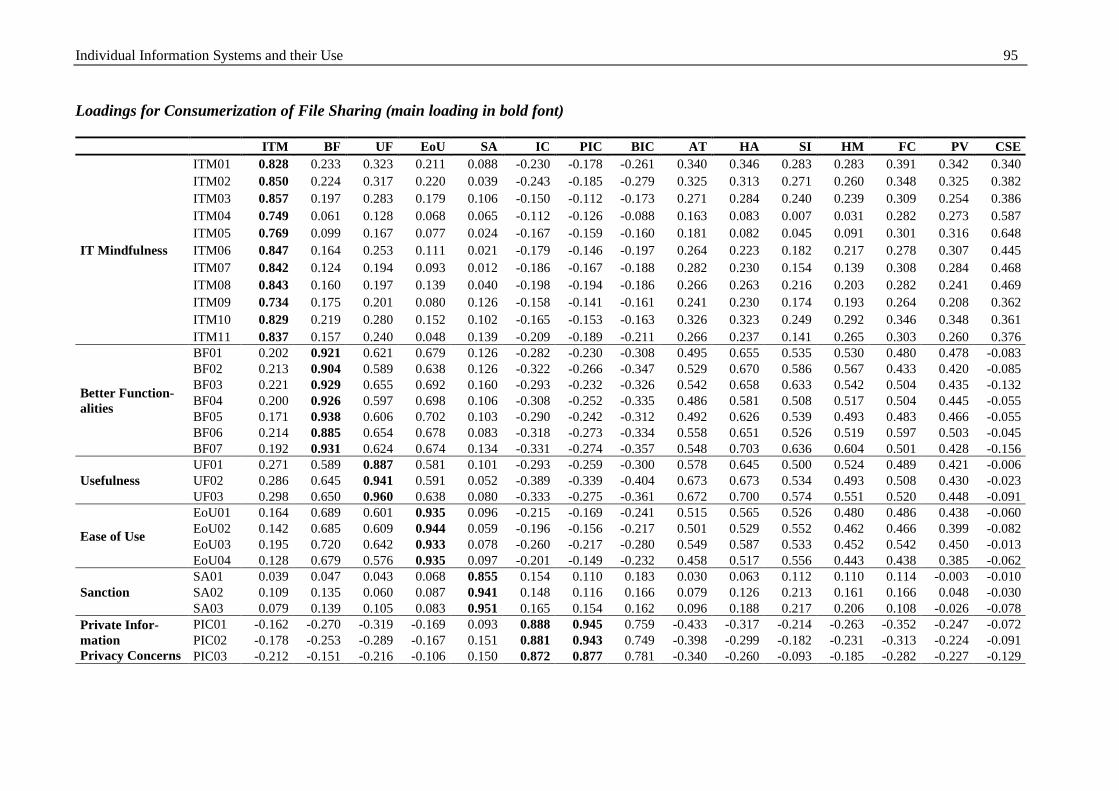
Individual Information Systems and their Use 95
Loadings for Consumerization of File Sharing (main loading in bold font)
ITM BF UF EoU SA IC PIC BIC AT HA SI HM FC PV CSE
IT Mindfulness
ITM01 0.828 0.233 0.323 0.211 0.088 -0.230 -0.178 -0.261 0.340 0.346 0.283 0.283 0.391 0.342 0.340
ITM02 0.850 0.224 0.317 0.220 0.039 -0.243 -0.185 -0.279 0.325 0.313 0.271 0.260 0.348 0.325 0.382
ITM03 0.857 0.197 0.283 0.179 0.106 -0.150 -0.112 -0.173 0.271 0.284 0.240 0.239 0.309 0.254 0.386
ITM04 0.749 0.061 0.128 0.068 0.065 -0.112 -0.126 -0.088 0.163 0.083 0.007 0.031 0.282 0.273 0.587
ITM05 0.769 0.099 0.167 0.077 0.024 -0.167 -0.159 -0.160 0.181 0.082 0.045 0.091 0.301 0.316 0.648
ITM06 0.847 0.164 0.253 0.111 0.021 -0.179 -0.146 -0.197 0.264 0.223 0.182 0.217 0.278 0.307 0.445
ITM07 0.842 0.124 0.194 0.093 0.012 -0.186 -0.167 -0.188 0.282 0.230 0.154 0.139 0.308 0.284 0.468
ITM08 0.843 0.160 0.197 0.139 0.040 -0.198 -0.194 -0.186 0.266 0.263 0.216 0.203 0.282 0.241 0.469
ITM09 0.734 0.175 0.201 0.080 0.126 -0.158 -0.141 -0.161 0.241 0.230 0.174 0.193 0.264 0.208 0.362
ITM10 0.829 0.219 0.280 0.152 0.102 -0.165 -0.153 -0.163 0.326 0.323 0.249 0.292 0.346 0.348 0.361
ITM11 0.837 0.157 0.240 0.048 0.139 -0.209 -0.189 -0.211 0.266 0.237 0.141 0.265 0.303 0.260 0.376
Better Function-
alities
BF01 0.202 0.921 0.621 0.679 0.126 -0.282 -0.230 -0.308 0.495 0.655 0.535 0.530 0.480 0.478 -0.083
BF02 0.213 0.904 0.589 0.638 0.126 -0.322 -0.266 -0.347 0.529 0.670 0.586 0.567 0.433 0.420 -0.085
BF03 0.221 0.929 0.655 0.692 0.160 -0.293 -0.232 -0.326 0.542 0.658 0.633 0.542 0.504 0.435 -0.132
BF04 0.200 0.926 0.597 0.698 0.106 -0.308 -0.252 -0.335 0.486 0.581 0.508 0.517 0.504 0.445 -0.055
BF05 0.171 0.938 0.606 0.702 0.103 -0.290 -0.242 -0.312 0.492 0.626 0.539 0.493 0.483 0.466 -0.055
BF06 0.214 0.885 0.654 0.678 0.083 -0.318 -0.273 -0.334 0.558 0.651 0.526 0.519 0.597 0.503 -0.045
BF07 0.192 0.931 0.624 0.674 0.134 -0.331 -0.274 -0.357 0.548 0.703 0.636 0.604 0.501 0.428 -0.156
Usefulness
UF01 0.271 0.589 0.887 0.581 0.101 -0.293 -0.259 -0.300 0.578 0.645 0.500 0.524 0.489 0.421 -0.006
UF02 0.286 0.645 0.941 0.591 0.052 -0.389 -0.339 -0.404 0.673 0.673 0.534 0.493 0.508 0.430 -0.023
UF03 0.298 0.650 0.960 0.638 0.080 -0.333 -0.275 -0.361 0.672 0.700 0.574 0.551 0.520 0.448 -0.091
Ease of Use
EoU01 0.164 0.689 0.601 0.935 0.096 -0.215 -0.169 -0.241 0.515 0.565 0.526 0.480 0.486 0.438 -0.060
EoU02 0.142 0.685 0.609 0.944 0.059 -0.196 -0.156 -0.217 0.501 0.529 0.552 0.462 0.466 0.399 -0.082
EoU03 0.195 0.720 0.642 0.933 0.078 -0.260 -0.217 -0.280 0.549 0.587 0.533 0.452 0.542 0.450 -0.013
EoU04 0.128 0.679 0.576 0.935 0.097 -0.201 -0.149 -0.232 0.458 0.517 0.556 0.443 0.438 0.385 -0.062
Sanction
SA01 0.039 0.047 0.043 0.068 0.855 0.154 0.110 0.183 0.030 0.063 0.112 0.110 0.114 -0.003 -0.010
SA02 0.109 0.135 0.060 0.087 0.941 0.148 0.116 0.166 0.079 0.126 0.213 0.161 0.166 0.048 -0.030
SA03 0.079 0.139 0.105 0.083 0.951 0.165 0.154 0.162 0.096 0.188 0.217 0.206 0.108 -0.026 -0.078
Private Infor-
mation
Privacy Concerns
PIC01 -0.162 -0.270 -0.319 -0.169 0.093 0.888 0.945 0.759 -0.433 -0.317 -0.214 -0.263 -0.352 -0.247 -0.072
PIC02 -0.178 -0.253 -0.289 -0.167 0.151 0.881 0.943 0.749 -0.398 -0.299 -0.182 -0.231 -0.313 -0.224 -0.091
PIC03 -0.212 -0.151 -0.216 -0.106 0.150 0.872 0.877 0.781 -0.340 -0.260 -0.093 -0.185 -0.282 -0.227 -0.129

Individual Information Systems and their Use 96
ITM BF UF EoU SA IC PIC BIC AT HA SI HM FC PV CSE
Business Infor-
mation
Privacy Concerns
BIC01 -0.206 -0.344 -0.377 -0.236 0.184 0.922 0.804 0.956 -0.469 -0.386 -0.307 -0.299 -0.331 -0.283 -0.048
BIC02 -0.249 -0.358 -0.376 -0.256 0.172 0.924 0.815 0.950 -0.493 -0.409 -0.313 -0.309 -0.343 -0.279 -0.062
BIC03 -0.234 -0.325 -0.338 -0.249 0.156 0.893 0.761 0.945 -0.391 -0.339 -0.269 -0.297 -0.259 -0.254 -0.083
Attitude
AT01 0.304 0.525 0.644 0.498 0.067 -0.445 -0.417 -0.433 0.963 0.664 0.562 0.567 0.562 0.407 -0.064
AT02 0.303 0.537 0.666 0.522 0.134 -0.425 -0.382 -0.429 0.961 0.672 0.599 0.575 0.555 0.407 -0.066
AT03 0.303 0.525 0.657 0.491 0.067 -0.458 -0.407 -0.467 0.965 0.656 0.536 0.544 0.557 0.419 -0.026
AT04 0.378 0.554 0.693 0.531 0.023 -0.445 -0.392 -0.457 0.951 0.667 0.539 0.547 0.617 0.448 0.031
AT05 0.334 0.538 0.661 0.510 0.083 -0.466 -0.427 -0.464 0.960 0.682 0.599 0.582 0.553 0.408 -0.020
AT06 0.331 0.575 0.642 0.549 0.104 -0.459 -0.403 -0.474 0.933 0.699 0.609 0.574 0.601 0.406 -0.002
Habit
HA01 0.291 0.702 0.737 0.584 0.038 -0.391 -0.345 -0.401 0.678 0.905 0.612 0.620 0.588 0.514 -0.061
HA02 0.285 0.611 0.614 0.537 0.212 -0.280 -0.214 -0.319 0.600 0.906 0.662 0.675 0.429 0.335 -0.155
HA03 0.296 0.621 0.629 0.492 0.175 -0.348 -0.298 -0.366 0.650 0.930 0.656 0.646 0.459 0.377 -0.196
Social Influence
SI01 0.285 0.603 0.573 0.563 0.215 -0.252 -0.191 -0.289 0.585 0.672 0.955 0.588 0.476 0.326 -0.061
SI02 0.236 0.587 0.552 0.551 0.203 -0.286 -0.226 -0.319 0.582 0.680 0.972 0.568 0.421 0.279 -0.156
SI03 0.200 0.600 0.553 0.565 0.197 -0.250 -0.178 -0.297 0.578 0.689 0.976 0.590 0.403 0.284 -0.200
Hedonic Motiva-
tion
HM01 0.241 0.547 0.531 0.448 0.173 -0.306 -0.274 -0.310 0.555 0.672 0.568 0.957 0.430 0.399 -0.188
HM02 0.297 0.558 0.548 0.480 0.155 -0.276 -0.236 -0.291 0.562 0.664 0.555 0.944 0.451 0.441 -0.139
HM03 0.242 0.574 0.530 0.478 0.201 -0.284 -0.234 -0.308 0.578 0.689 0.598 0.964 0.418 0.403 -0.199
Facilitating Con-
ditions
FC01 0.335 0.437 0.412 0.405 0.114 -0.320 -0.332 -0.282 0.479 0.401 0.337 0.335 0.875 0.597 0.229
FC02 0.362 0.384 0.372 0.425 0.137 -0.241 -0.261 -0.202 0.441 0.369 0.280 0.279 0.855 0.591 0.266
FC03 0.343 0.481 0.481 0.469 0.095 -0.330 -0.328 -0.305 0.532 0.498 0.385 0.413 0.892 0.613 0.127
FC04 0.309 0.546 0.565 0.477 0.144 -0.322 -0.294 -0.321 0.592 0.551 0.490 0.486 0.852 0.507 0.055
Price Value
PV01 0.341 0.459 0.439 0.417 -0.008 -0.268 -0.253 -0.261 0.398 0.425 0.289 0.399 0.634 0.960 0.170
PV02 0.335 0.481 0.454 0.445 -0.003 -0.288 -0.273 -0.279 0.423 0.420 0.273 0.412 0.619 0.964 0.137
PV03 0.345 0.486 0.452 0.430 0.029 -0.285 -0.258 -0.286 0.435 0.452 0.319 0.441 0.648 0.965 0.146
Computer Self-
Efficacy
CSE01 0.433 -0.006 0.006 0.036 -0.030 -0.078 -0.054 -0.094 0.076 -0.049 -0.079 -0.080 0.249 0.224 0.792
CSE02 0.389 -0.153 -0.088 -0.111 -0.066 -0.057 -0.069 -0.042 -0.108 -0.213 -0.196 -0.251 0.071 0.059 0.927
CSE03 0.447 -0.010 -0.007 -0.022 0.000 -0.067 -0.073 -0.057 0.035 -0.066 -0.079 -0.065 0.161 0.177 0.759
CSE04 0.551 -0.009 0.034 0.010 -0.022 -0.092 -0.113 -0.065 0.077 -0.023 -0.005 -0.038 0.264 0.226 0.828
Note: ITM = IT Mindfulness, BF = Better Functionalities, UF = Usefulness, EoU = Ease of Use, SA = Sanction, IC = Information Privacy Concerns, PIC = Private Information
Privacy Concerns, BIC = Business Information Privacy Concerns, AT = Attitude, HA = Habit, SI = Social Influence, HM = Hedonic Motivation, FC = Facilitating Conditions,
PV = Price Value, CSE = Computer Self-Efficacy
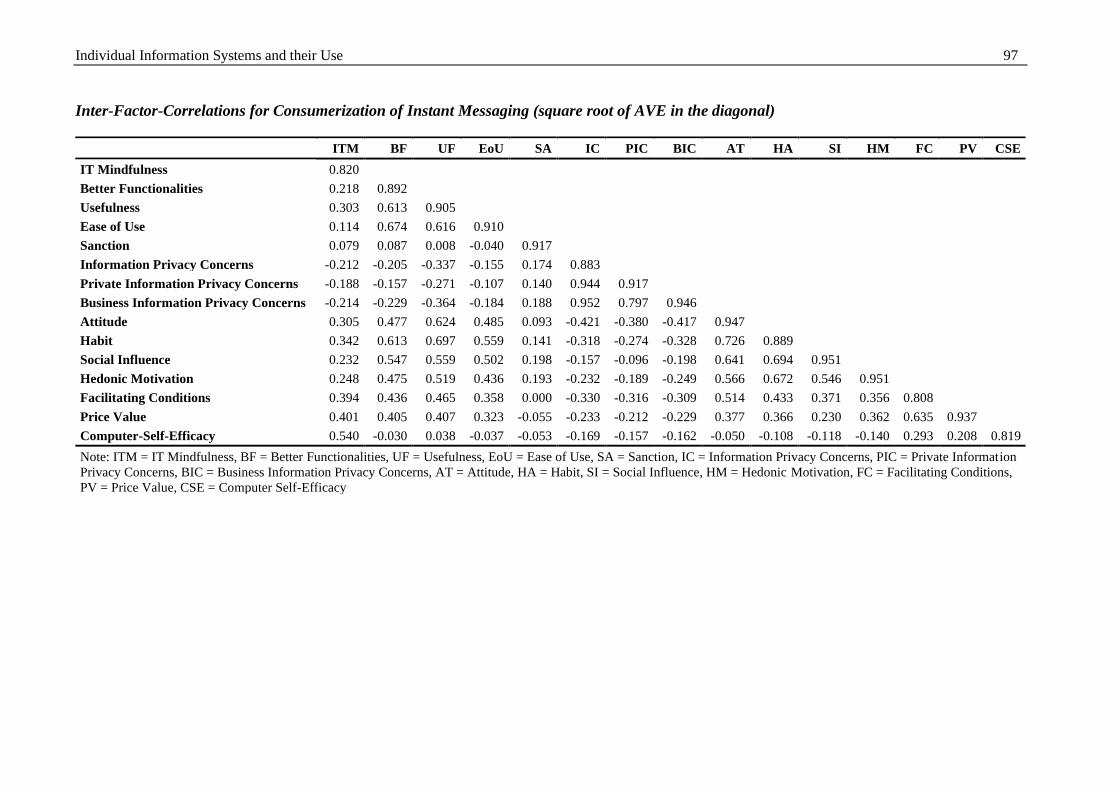
Individual Information Systems and their Use 97
Inter-Factor-Correlations for Consumerization of Instant Messaging (square root of AVE in the diagonal)
ITM BF UF EoU SA IC PIC BIC AT HA SI HM FC PV CSE
IT Mindfulness 0.820
Better Functionalities 0.218 0.892
Usefulness 0.303 0.613 0.905
Ease of Use 0.114 0.674 0.616 0.910
Sanction 0.079 0.087 0.008 -0.040 0.917
Information Privacy Concerns -0.212 -0.205 -0.337 -0.155 0.174 0.883
Private Information Privacy Concerns -0.188 -0.157 -0.271 -0.107 0.140 0.944 0.917
Business Information Privacy Concerns -0.214 -0.229 -0.364 -0.184 0.188 0.952 0.797 0.946
Attitude 0.305 0.477 0.624 0.485 0.093 -0.421 -0.380 -0.417 0.947
Habit 0.342 0.613 0.697 0.559 0.141 -0.318 -0.274 -0.328 0.726 0.889
Social Influence 0.232 0.547 0.559 0.502 0.198 -0.157 -0.096 -0.198 0.641 0.694 0.951
Hedonic Motivation 0.248 0.475 0.519 0.436 0.193 -0.232 -0.189 -0.249 0.566 0.672 0.546 0.951
Facilitating Conditions 0.394 0.436 0.465 0.358 0.000 -0.330 -0.316 -0.309 0.514 0.433 0.371 0.356 0.808
Price Value 0.401 0.405 0.407 0.323 -0.055 -0.233 -0.212 -0.229 0.377 0.366 0.230 0.362 0.635 0.937
Computer-Self-Efficacy 0.540 -0.030 0.038 -0.037 -0.053 -0.169 -0.157 -0.162 -0.050 -0.108 -0.118 -0.140 0.293 0.208 0.819
Note: ITM = IT Mindfulness, BF = Better Functionalities, UF = Usefulness, EoU = Ease of Use, SA = Sanction, IC = Information Privacy Concerns, PIC = Private Information
Privacy Concerns, BIC = Business Information Privacy Concerns, AT = Attitude, HA = Habit, SI = Social Influence, HM = Hedonic Motivation, FC = Facilitating Conditions,
PV = Price Value, CSE = Computer Self-Efficacy
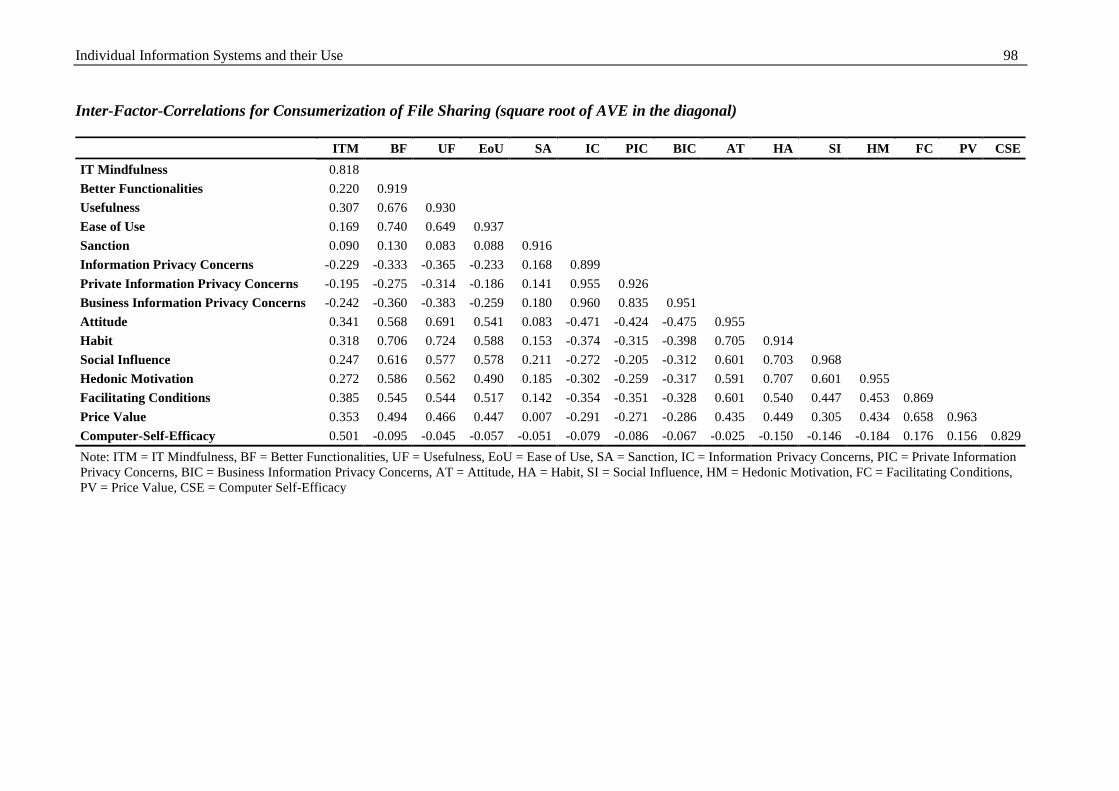
Individual Information Systems and their Use 98
Inter-Factor-Correlations for Consumerization of File Sharing (square root of AVE in the diagonal)
ITM BF UF EoU SA IC PIC BIC AT HA SI HM FC PV CSE
IT Mindfulness 0.818
Better Functionalities 0.220 0.919
Usefulness 0.307 0.676 0.930
Ease of Use 0.169 0.740 0.649 0.937
Sanction 0.090 0.130 0.083 0.088 0.916
Information Privacy Concerns -0.229 -0.333 -0.365 -0.233 0.168 0.899
Private Information Privacy Concerns -0.195 -0.275 -0.314 -0.186 0.141 0.955 0.926
Business Information Privacy Concerns -0.242 -0.360 -0.383 -0.259 0.180 0.960 0.835 0.951
Attitude 0.341 0.568 0.691 0.541 0.083 -0.471 -0.424 -0.475 0.955
Habit 0.318 0.706 0.724 0.588 0.153 -0.374 -0.315 -0.398 0.705 0.914
Social Influence 0.247 0.616 0.577 0.578 0.211 -0.272 -0.205 -0.312 0.601 0.703 0.968
Hedonic Motivation 0.272 0.586 0.562 0.490 0.185 -0.302 -0.259 -0.317 0.591 0.707 0.601 0.955
Facilitating Conditions 0.385 0.545 0.544 0.517 0.142 -0.354 -0.351 -0.328 0.601 0.540 0.447 0.453 0.869
Price Value 0.353 0.494 0.466 0.447 0.007 -0.291 -0.271 -0.286 0.435 0.449 0.305 0.434 0.658 0.963
Computer-Self-Efficacy 0.501 -0.095 -0.045 -0.057 -0.051 -0.079 -0.086 -0.067 -0.025 -0.150 -0.146 -0.184 0.176 0.156 0.829
Note: ITM = IT Mindfulness, BF = Better Functionalities, UF = Usefulness, EoU = Ease of Use, SA = Sanction, IC = Information Privacy Concerns, PIC = Private Information
Privacy Concerns, BIC = Business Information Privacy Concerns, AT = Attitude, HA = Habit, SI = Social Influence, HM = Hedonic Motivation, FC = Facilitating Conditions,
PV = Price Value, CSE = Computer Self-Efficacy

Individual Information Systems and their Use 99
Heterotrait-Monotrait Ratios for Consumerization of Instant Messaging
ITM BF UF EoU SA IC PIC BIC AT HA SI HM FC PV CSE
IT Mindfulness
Better Functionalities 0.223
Usefulness 0.320 0.663
Ease of Use 0.115 0.711 0.675
Sanction 0.092 0.082 0.052 0.059
Information Privacy Concerns 0.222 0.215 0.367 0.165 0.183
Private Information Privacy Concerns 0.204 0.169 0.302 0.116 0.148 1.024
Business Information Privacy Concerns 0.221 0.241 0.398 0.198 0.202 1.007 0.863
Attitude 0.307 0.492 0.668 0.506 0.089 0.438 0.404 0.434
Habit 0.227 0.465 0.554 0.473 0.025 0.320 0.301 0.313 0.715
Social Influence 0.365 0.670 0.786 0.621 0.158 0.346 0.303 0.358 0.785 0.725
Hedonic Motivation 0.233 0.575 0.608 0.534 0.196 0.166 0.104 0.211 0.666 0.554 0.767
Facilitating Conditions 0.253 0.499 0.565 0.464 0.196 0.245 0.204 0.263 0.588 0.433 0.743 0.577
Price Value 0.455 0.478 0.524 0.398 0.069 0.369 0.365 0.343 0.555 0.422 0.481 0.396 0.380
Computer-Self-Efficacy 0.423 0.429 0.446 0.345 0.063 0.250 0.233 0.245 0.394 0.291 0.398 0.243 0.384 0.733
Note: ITM = IT Mindfulness, BF = Better Functionalities, UF = Usefulness, EoU = Ease of Use, SA = Sanction, IC = Information Privacy Concerns, PIC = Private Information
Privacy Concerns, BIC = Business Information Privacy Concerns, AT = Attitude, HA = Habit, SI = Social Influence, HM = Hedonic Motivation, FC = Facilitating Conditions,
PV = Price Value, CSE = Computer Self-Efficacy
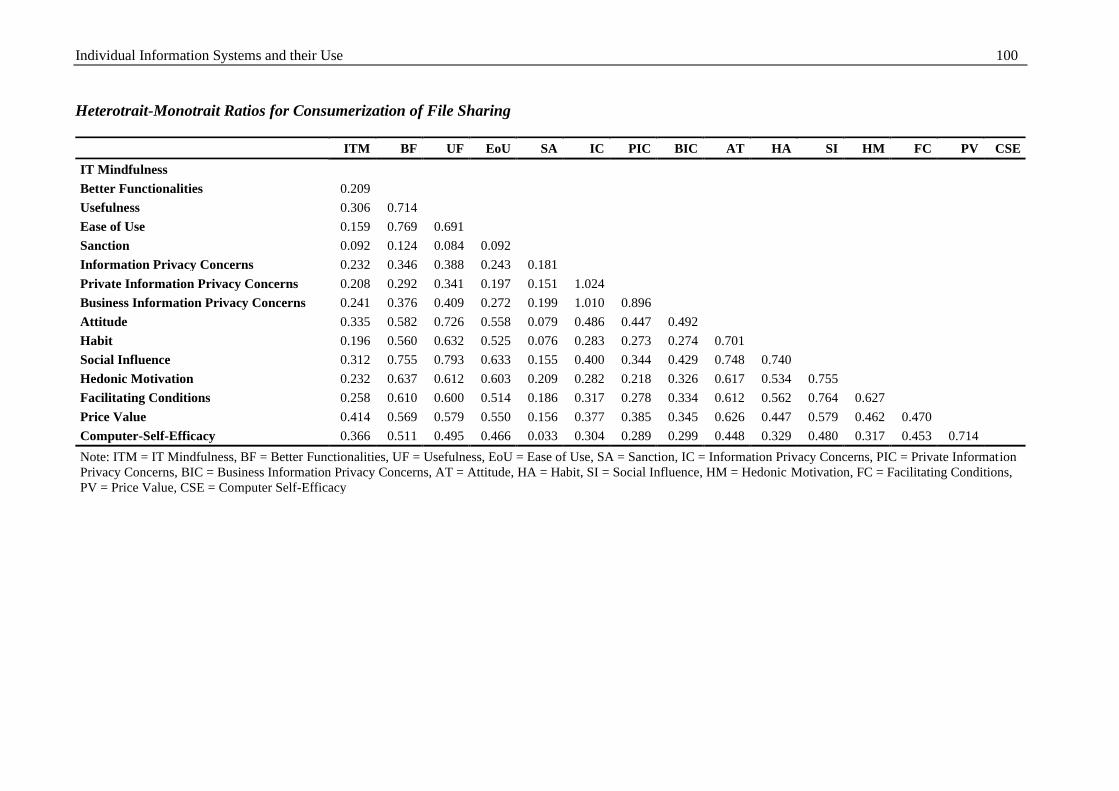
Individual Information Systems and their Use 100
Heterotrait-Monotrait Ratios for Consumerization of File Sharing
ITM BF UF EoU SA IC PIC BIC AT HA SI HM FC PV CSE
IT Mindfulness
Better Functionalities 0.209
Usefulness 0.306 0.714
Ease of Use 0.159 0.769 0.691
Sanction 0.092 0.124 0.084 0.092
Information Privacy Concerns 0.232 0.346 0.388 0.243 0.181
Private Information Privacy Concerns 0.208 0.292 0.341 0.197 0.151 1.024
Business Information Privacy Concerns 0.241 0.376 0.409 0.272 0.199 1.010 0.896
Attitude 0.335 0.582 0.726 0.558 0.079 0.486 0.447 0.492
Habit 0.196 0.560 0.632 0.525 0.076 0.283 0.273 0.274 0.701
Social Influence 0.312 0.755 0.793 0.633 0.155 0.400 0.344 0.429 0.748 0.740
Hedonic Motivation 0.232 0.637 0.612 0.603 0.209 0.282 0.218 0.326 0.617 0.534 0.755
Facilitating Conditions 0.258 0.610 0.600 0.514 0.186 0.317 0.278 0.334 0.612 0.562 0.764 0.627
Price Value 0.414 0.569 0.579 0.550 0.156 0.377 0.385 0.345 0.626 0.447 0.579 0.462 0.470
Computer-Self-Efficacy 0.366 0.511 0.495 0.466 0.033 0.304 0.289 0.299 0.448 0.329 0.480 0.317 0.453 0.714
Note: ITM = IT Mindfulness, BF = Better Functionalities, UF = Usefulness, EoU = Ease of Use, SA = Sanction, IC = Information Privacy Concerns, PIC = Private Information
Privacy Concerns, BIC = Business Information Privacy Concerns, AT = Attitude, HA = Habit, SI = Social Influence, HM = Hedonic Motivation, FC = Facilitating Conditions,
PV = Price Value, CSE = Computer Self-Efficacy
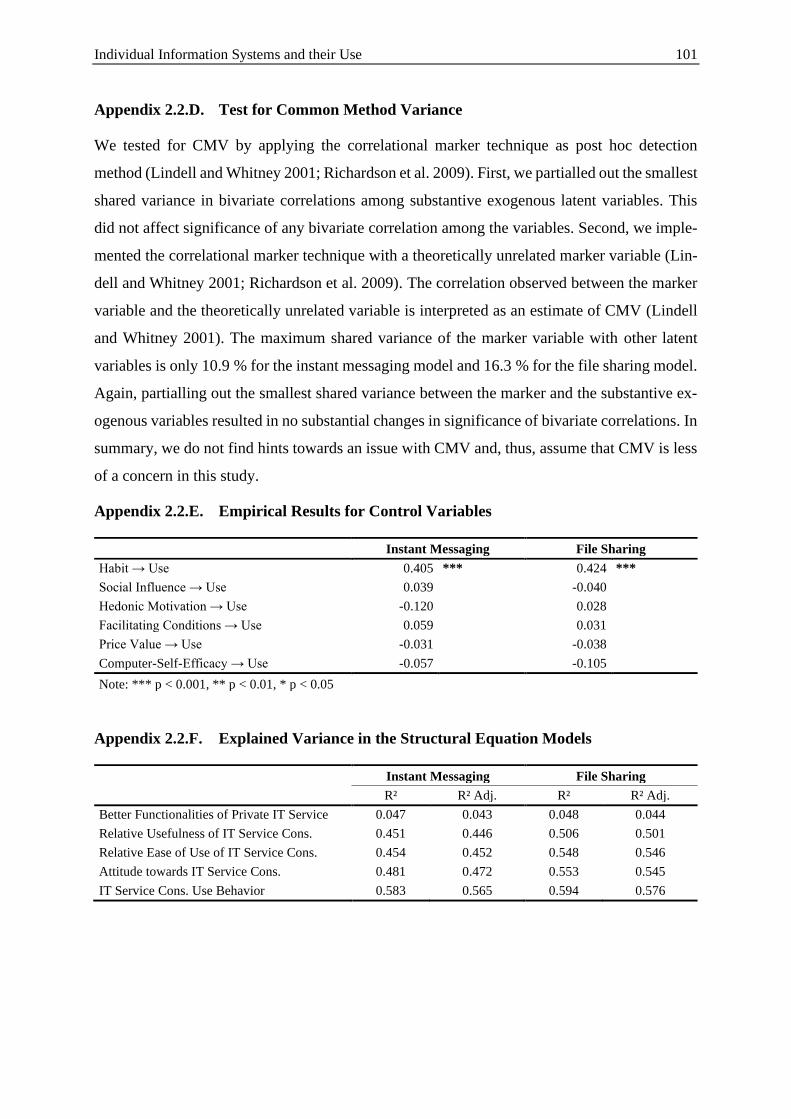
Individual Information Systems and their Use 101
Appendix 2.2.D. Test for Common Method Variance
We tested for CMV by applying the correlational marker technique as post hoc detection
method (Lindell and Whitney 2001; Richardson et al. 2009). First, we partialled out the smallest
shared variance in bivariate correlations among substantive exogenous latent variables. This
did not affect significance of any bivariate correlation among the variables. Second, we imple-
mented the correlational marker technique with a theoretically unrelated marker variable (Lin-
dell and Whitney 2001; Richardson et al. 2009). The correlation observed between the marker
variable and the theoretically unrelated variable is interpreted as an estimate of CMV (Lindell
and Whitney 2001). The maximum shared variance of the marker variable with other latent
variables is only 10.9 % for the instant messaging model and 16.3 % for the file sharing model.
Again, partialling out the smallest shared variance between the marker and the substantive ex-
ogenous variables resulted in no substantial changes in significance of bivariate correlations. In
summary, we do not find hints towards an issue with CMV and, thus, assume that CMV is less
of a concern in this study.
Appendix 2.2.E. Empirical Results for Control Variables
Instant Messaging File Sharing
Habit → Use 0.405 *** 0.424 ***
Social Influence → Use 0.039 -0.040
Hedonic Motivation → Use -0.120 0.028
Facilitating Conditions → Use 0.059 0.031
Price Value → Use -0.031 -0.038
Computer-Self-Efficacy → Use -0.057 -0.105
Note: *** p < 0.001, ** p < 0.01, * p < 0.05
Appendix 2.2.F. Explained Variance in the Structural Equation Models
Instant Messaging File Sharing
R² R² Adj. R² R² Adj.
Better Functionalities of Private IT Service 0.047 0.043 0.048 0.044
Relative Usefulness of IT Service Cons. 0.451 0.446 0.506 0.501
Relative Ease of Use of IT Service Cons. 0.454 0.452 0.548 0.546
Attitude towards IT Service Cons. 0.481 0.472 0.553 0.545
IT Service Cons. Use Behavior 0.583 0.565 0.594 0.576
Technostress as a Negative Outcome of Individual Information Systems Use 102
3 Technostress as a Negative Outcome of Individual In-
formation Systems Use
3.1 A Dark Side of IT Consumerization: How Mixed IT Portfolios with Pri-
vate and Business IT Components Cause Unreliability
Abstract
With increasing mobile work and work-from-home in the wake of the COVID-19 pandemic,
the usage and relevance of consumer IT for business purposes have substantially increased. In
many instances, the adoption of IT consumerization has been due to the bare necessity of having
no adequate alternative. In this light, an understudied area of IT consumerization, the adverse
outcomes for employees using consumer IT for business purposes, is of major importance. We
conduct a mixed-methods study to investigate the adverse outcomes of IT consumerization. We
build on prior studies and own end-user interviews to draw connections between IT consumer-
ization and techno-unreliability. A subsequent quantitative survey of 162 full-time employees
shows that IT consumerization is indeed associated with an increase in techno-unreliability.
The emergence of this type of stress is moderated by the users’ general computer-self efficacy
and leads to various job-related and health-related outcomes. We show that perceived unrelia-
bility is driven by users’ experience while trying to integrate private and business IT compo-
nents for business purposes. We follow up on this observation through a qualitative analysis of
open-ended survey questions to detail users’ experience. Our findings emphasize the need to
examine the dark side of IT consumerization, despite its well-studied positive effects. We sug-
gest that organizations should strive to integrate business and private IT as much as IT security
constraints allow for, to reduce the technostress of their employees.
Keywords: IT Consumerization, BYOD, Technostress, Self-Efficacy, Integration
Authors: Julia Lanzl (M. Sc.), Manfred Schoch (M. Sc.), Prof. Dr. Henner Gimpel
Status: Working paper under review for publication.
Technostress as a Negative Outcome of Individual Information Systems Use 103
3.1.1 Introduction
Today, many IT users are responsible for their entire individual information system. Such indi-
vidual information systems include infrastructure (e.g., WiFi, mobile data plans), devices (e.g.,
smartphones and laptops), as well as applications and services that run on these devices (e.g.,
instant messengers) (Baskerville 2011). Many times, such IT portfolios involve substantial
amounts of mobile, fast, and innovative. User experience with such privately-owned IT raises
the bar for business IT. It has long caused employees to bring their own IT into the workplace,
referred to as IT consumerization (Niehaves et al. 2012). IT consumerization has been studied
widely with an emphasis on organizational advantages, such as increased innovation and
productivity (e.g., Bautista et al. 2018; Junglas et al. 2019) and organizational disadvantages,
such as security and privacy risks (e.g., Gewald et al. 2017), as well as end-user advantages and
reasons for adoption (e.g., Ortbach 2015). Adverse outcomes for the end-users, however, have
been studied scarcely (Köffer et al. 2014). Two recent developments emphasize a renewed need
to do so.
First and foremost, we are currently experiencing a substantial increase in mobile work and
work-from-home sparked by global social distancing measures in the wake of the COVID-19
pandemic. Particularly the need for digital communication and collaboration has risen during
the pandemic. These circumstances have forced many end-users into mobile work regardless of
individual IT adoption decisions. Furthermore, this development has caught many organiza-
tions off guard and without adequate IT to meet the needs of an entire organization working
remotely. Thus, many employees have felt the need to use their private infrastructure, devices,
and applications to fill those voids. This increase of involuntary mobile work will undoubtedly
highlight the disadvantages of IT consumerization, particularly for its end-users. Two known
disadvantages are increased workload and IT-related stress (Niehaves et al. 2012). We expect
that also in post-pandemic times, we will see higher levels of mobile work and work-from-
home than we saw before COVID-19.
Second, a recent literature analysis and call for research has highlighted the need to understand
better the creative and innovative use of IT (Tarafdar et al. 2019), which has been associated
with IT consumerization (Junglas et al. 2019). While there are certainly opportunities for future
research regarding positive psychological outcomes of IT consumerization, researchers also
need to understand the potential adverse outcomes to view such opportunities in the right light.
One aspect relevant in the context is understanding the interplay between the technologies (in
this case, consumer IT) and the end-user. Research has suggested that both the mitigation of
Technostress as a Negative Outcome of Individual Information Systems Use 104
adverse effects (e.g., Shu et al. 2011; Tarafdar et al. 2015) and the fostering of positive effects
(Salo et al. 2018) are related to the individual capabilities of the end-users. Nevertheless, or-
ganizations have a responsibility to provide their employees with adequate IT.
Related to the current increase in work-from-home and the associated increase in consumer IT
use, we take a detailed look at the negative side of using mixed IT portfolios consisting of both
privately-owned and business-owned IT components. To do that, we conduct a concurrent
nested mixed-methods study with a dominant quantitative strand. With this, we aim to answer
the following research question:
How does IT consumerization use behavior affect perceived unreliability, and what fac-
tors drive the relationship?
Our study finds that poor integration between the privately-owned and business-owned compo-
nents of a mixed IT portfolio is a major driver of unreliability, leading to adverse outcomes.
These outcomes include switching exhaustion, transition costs, and dissatisfaction with the IT
portfolio. We further find that particularly users with low computer self-efficacy are prone to
experiencing such issues. In our qualitative strand, we provide concrete categories of problems
that may arise and that organizations should be aware of when designing their IT consumeriza-
tion policies.
3.1.2 Theoretical Background
3.1.2.1 IT Consumerization
An information system (IS) is a socio-technical system comprising technology, information,
and social artifacts (Lee et al. 2015). Increasingly, individuals build, administrate, and use their
own IT (Baskerville 2011). Because of this new autonomy, individuals can bring their own IT
components wherever they go, including the workplace. This phenomenon is known as IT con-
sumerization – the use of privately-owned IT components for business purposes (Niehaves et
al. 2012). There have been many studies investigating this phenomenon in the past years. Re-
search has covered four areas: advantages for employees, disadvantages for employees, organ-
izational advantages, and organizational risks (Niehaves et al. 2012).
Regarding advantages for employees, studies have focused on the antecedents of use decisions.
This focus has led to a thorough understanding of why employees participate in bring your own
device programs or bring their privately-owned devices to work. Many of these studies build
upon established technology acceptance and use literature, such as UTAUT, TAM, and TPB
Technostress as a Negative Outcome of Individual Information Systems Use 105
(e.g., Bautista et al. 2018; Gewald et al. 2017; Ortbach 2015). These studies find that primarily
the benefits for work purposes, such as increased usefulness and ease of use, drive adoption
decisions.
From an organizational perspective, outcomes of IT consumerization use behavior are increased
productivity and work quality (e.g., Bautista et al. 2018). Furthermore, advantages such as in-
creased creativity, innovativeness, mobility, and flexibility (Behrens 2009; Gewald et al. 2017;
Junglas et al. 2019; Ortbach 2015) are associated with IT consumerization. Many of these ad-
vantages are advantageous for organizations and the employees themselves. Lastly, indirect
organizational benefits, such as increased employer attractiveness (Gewald et al. 2017) and or-
ganizational commitment (Doargajudhur and Dell 2019), have been added to the list of benefits.
There is also a stream of research that has focused on the negative sides of IT consumerization
from an organizational point of view. Such risks mainly include IT security and data privacy
issues (e.g., Gewald et al. 2017) and a loss of organizational control (Behrens 2009).
Direct connections between negative consequences for the individual and IT consumerization
have been scarcely investigated. These include that organizational encouragement for IT con-
sumerization increases work-to-life conflict (Köffer et al. 2014). In addition, qualitative results
exist from user interviews (Niehaves et al. 2013b), case studies (Niehaves et al. 2013a; Ortbach
et al. 2013), and analyses of practitioner literature (Niehaves et al. 2012). All of which points
into the direction that IT consumerization indeed leads to adverse outcomes for the individual.
The studies raise evidence for an increase in stress levels regarding the use of consumer IT. An
observation that is closely related to research on technostress. To the best of our knowledge, no
empirical studies exist that have investigated the harmful effects of mixed IT portfolios con-
cerning actual use behavior quantitatively and in-depth.
3.1.2.2 A Dark Side of IT Consumerization
Studies have previously connected IT consumerization research with technostress. Early on,
evidence in practitioner literature regarding IT consumerization hints at stress as a possible
outcome (Niehaves et al. 2012). Technological ubiquity and blurring of boundaries between
private and work life were identified as potential reasons. Others found that organizational en-
couragement for dual use of mobile IT does indeed translate to both work overload and work-
to-life conflict (Köffer et al. 2014). IT consumerization may lead to a higher workload due to
ubiquitous access, resulting in stress (Niehaves et al. 2013a).
This was echoed in an interview study that found increased reachability, lack of competence,
workflow changes, and system redundancies to be drivers of adverse outcomes of IT
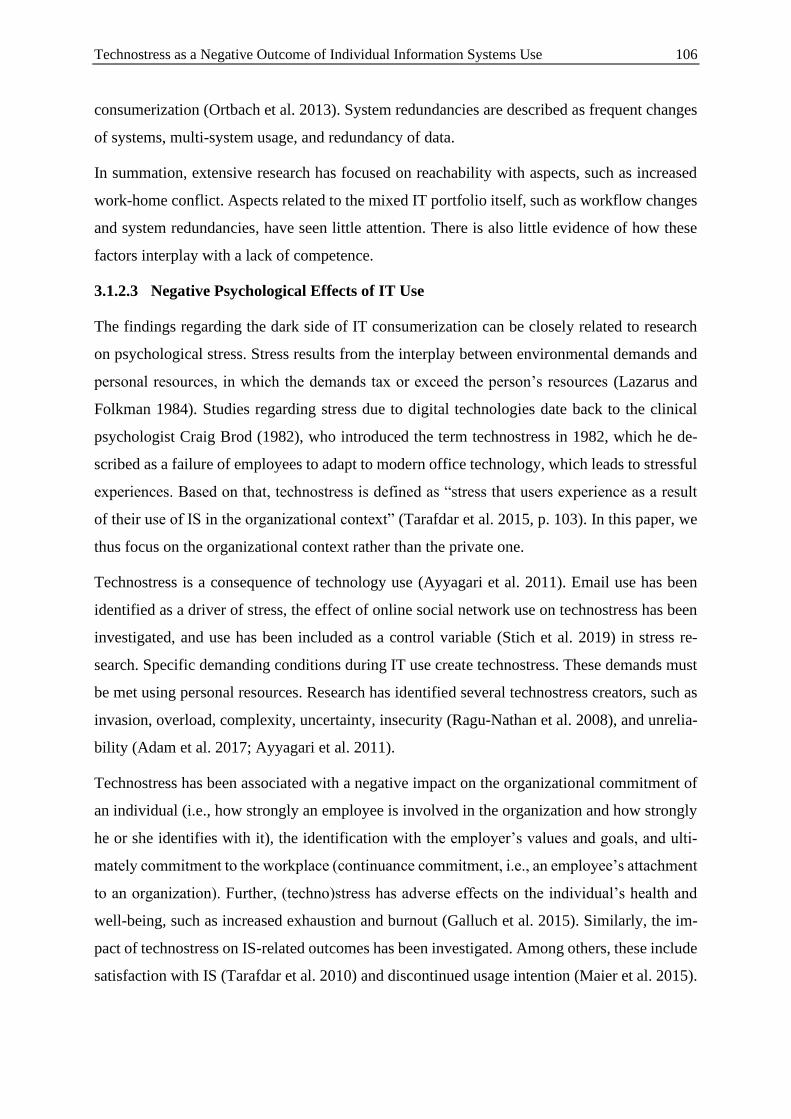
Technostress as a Negative Outcome of Individual Information Systems Use 106
consumerization (Ortbach et al. 2013). System redundancies are described as frequent changes
of systems, multi-system usage, and redundancy of data.
In summation, extensive research has focused on reachability with aspects, such as increased
work-home conflict. Aspects related to the mixed IT portfolio itself, such as workflow changes
and system redundancies, have seen little attention. There is also little evidence of how these
factors interplay with a lack of competence.
3.1.2.3 Negative Psychological Effects of IT Use
The findings regarding the dark side of IT consumerization can be closely related to research
on psychological stress. Stress results from the interplay between environmental demands and
personal resources, in which the demands tax or exceed the person’s resources (Lazarus and
Folkman 1984). Studies regarding stress due to digital technologies date back to the clinical
psychologist Craig Brod (1982), who introduced the term technostress in 1982, which he de-
scribed as a failure of employees to adapt to modern office technology, which leads to stressful
experiences. Based on that, technostress is defined as “stress that users experience as a result
of their use of IS in the organizational context” (Tarafdar et al. 2015, p. 103). In this paper, we
thus focus on the organizational context rather than the private one.
Technostress is a consequence of technology use (Ayyagari et al. 2011). Email use has been
identified as a driver of stress, the effect of online social network use on technostress has been
investigated, and use has been included as a control variable (Stich et al. 2019) in stress re-
search. Specific demanding conditions during IT use create technostress. These demands must
be met using personal resources. Research has identified several technostress creators, such as
invasion, overload, complexity, uncertainty, insecurity (Ragu-Nathan et al. 2008), and unrelia-
bility (Adam et al. 2017; Ayyagari et al. 2011).
Technostress has been associated with a negative impact on the organizational commitment of
an individual (i.e., how strongly an employee is involved in the organization and how strongly
he or she identifies with it), the identification with the employer’s values and goals, and ulti-
mately commitment to the workplace (continuance commitment, i.e., an employee’s attachment
to an organization). Further, (techno)stress has adverse effects on the individual’s health and
well-being, such as increased exhaustion and burnout (Galluch et al. 2015). Similarly, the im-
pact of technostress on IS-related outcomes has been investigated. Among others, these include
satisfaction with IS (Tarafdar et al. 2010) and discontinued usage intention (Maier et al. 2015).
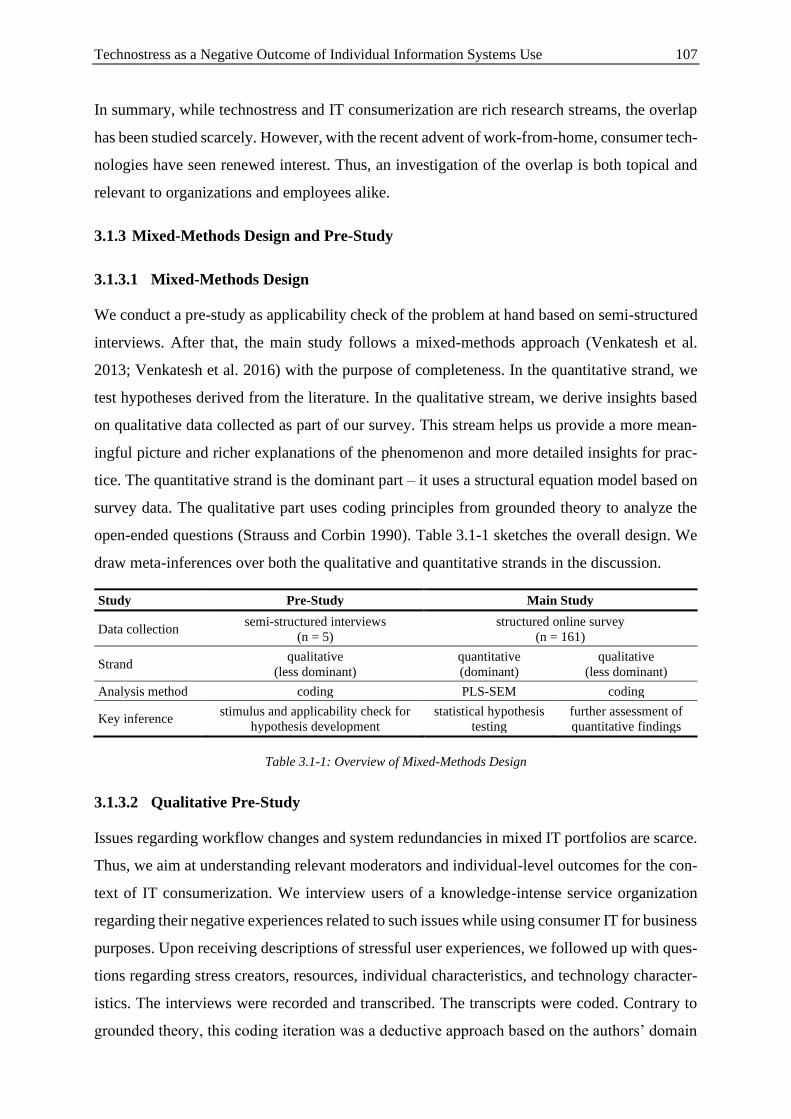
Technostress as a Negative Outcome of Individual Information Systems Use 107
In summary, while technostress and IT consumerization are rich research streams, the overlap
has been studied scarcely. However, with the recent advent of work-from-home, consumer tech-
nologies have seen renewed interest. Thus, an investigation of the overlap is both topical and
relevant to organizations and employees alike.
3.1.3 Mixed-Methods Design and Pre-Study
3.1.3.1 Mixed-Methods Design
We conduct a pre-study as applicability check of the problem at hand based on semi-structured
interviews. After that, the main study follows a mixed-methods approach (Venkatesh et al.
2013; Venkatesh et al. 2016) with the purpose of completeness. In the quantitative strand, we
test hypotheses derived from the literature. In the qualitative stream, we derive insights based
on qualitative data collected as part of our survey. This stream helps us provide a more mean-
ingful picture and richer explanations of the phenomenon and more detailed insights for prac-
tice. The quantitative strand is the dominant part – it uses a structural equation model based on
survey data. The qualitative part uses coding principles from grounded theory to analyze the
open-ended questions (Strauss and Corbin 1990). Table 3.1-1 sketches the overall design. We
draw meta-inferences over both the qualitative and quantitative strands in the discussion.
Study Pre-Study Main Study
Data collection semi-structured interviews
(n = 5)
structured online survey
(n = 161)
Strand qualitative
(less dominant)
quantitative
(dominant)
qualitative
(less dominant)
Analysis method coding PLS-SEM coding
Key inference stimulus and applicability check for
hypothesis development
statistical hypothesis
testing
further assessment of
quantitative findings
Table 3.1-1: Overview of Mixed-Methods Design
3.1.3.2 Qualitative Pre-Study
Issues regarding workflow changes and system redundancies in mixed IT portfolios are scarce.
Thus, we aim at understanding relevant moderators and individual-level outcomes for the con-
text of IT consumerization. We interview users of a knowledge-intense service organization
regarding their negative experiences related to such issues while using consumer IT for business
purposes. Upon receiving descriptions of stressful user experiences, we followed up with ques-
tions regarding stress creators, resources, individual characteristics, and technology character-
istics. The interviews were recorded and transcribed. The transcripts were coded. Contrary to
grounded theory, this coding iteration was a deductive approach based on the authors’ domain
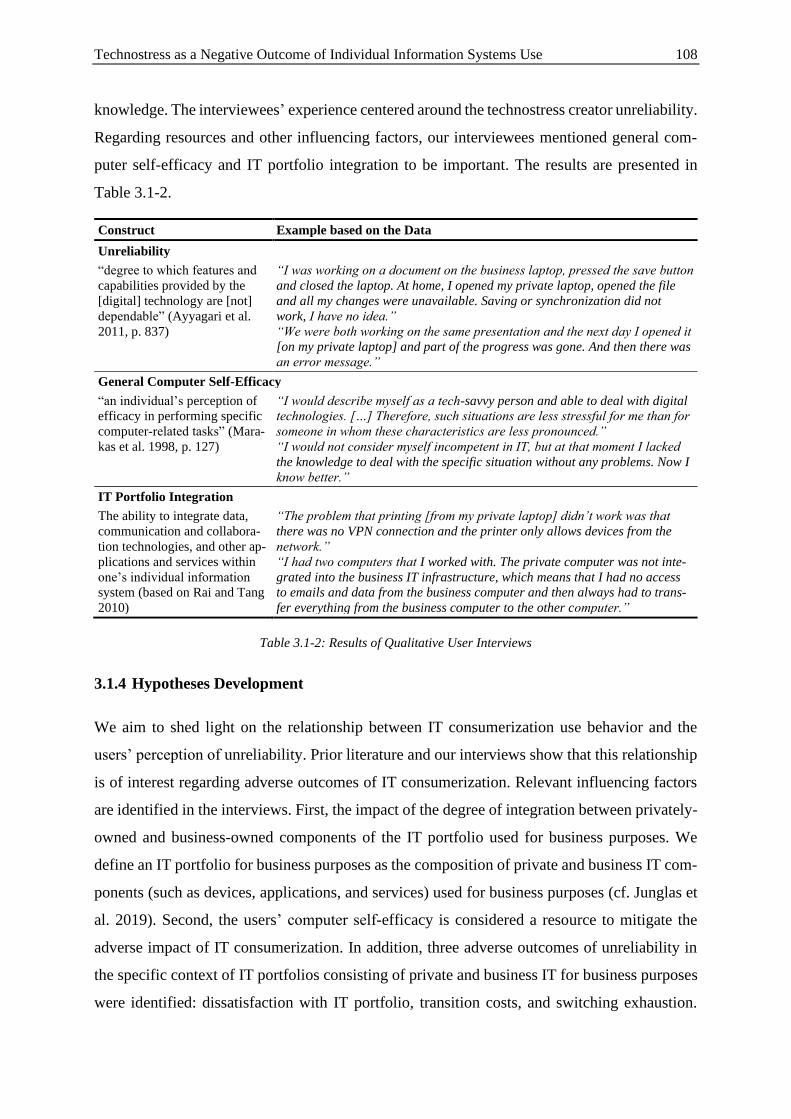
Technostress as a Negative Outcome of Individual Information Systems Use 108
knowledge. The interviewees’ experience centered around the technostress creator unreliability.
Regarding resources and other influencing factors, our interviewees mentioned general com-
puter self-efficacy and IT portfolio integration to be important. The results are presented in
Table 3.1-2.
Construct Example based on the Data
Unreliability
“degree to which features and
capabilities provided by the
[digital] technology are [not]
dependable” (Ayyagari et al.
2011, p. 837)
“I was working on a document on the business laptop, pressed the save button
and closed the laptop. At home, I opened my private laptop, opened the file
and all my changes were unavailable. Saving or synchronization did not
work, I have no idea.”
“We were both working on the same presentation and the next day I opened it
[on my private laptop] and part of the progress was gone. And then there was
an error message.”
General Computer Self-Efficacy
“an individual’s perception of
efficacy in performing specific
computer-related tasks” (Mara-
kas et al. 1998, p. 127)
“I would describe myself as a tech-savvy person and able to deal with digital
technologies. […] Therefore, such situations are less stressful for me than for
someone in whom these characteristics are less pronounced.”
“I would not consider myself incompetent in IT, but at that moment I lacked
the knowledge to deal with the specific situation without any problems. Now I
know better.”
IT Portfolio Integration
The ability to integrate data,
communication and collabora-
tion technologies, and other ap-
plications and services within
one’s individual information
system (based on Rai and Tang
2010)
“The problem that printing [from my private laptop] didn’t work was that
there was no VPN connection and the printer only allows devices from the
network.”
“I had two computers that I worked with. The private computer was not inte-
grated into the business IT infrastructure, which means that I had no access
to emails and data from the business computer and then always had to trans-
fer everything from the business computer to the other computer.”
Table 3.1-2: Results of Qualitative User Interviews
3.1.4 Hypotheses Development
We aim to shed light on the relationship between IT consumerization use behavior and the
users’ perception of unreliability. Prior literature and our interviews show that this relationship
is of interest regarding adverse outcomes of IT consumerization. Relevant influencing factors
are identified in the interviews. First, the impact of the degree of integration between privately-
owned and business-owned components of the IT portfolio used for business purposes. We
define an IT portfolio for business purposes as the composition of private and business IT com-
ponents (such as devices, applications, and services) used for business purposes (cf. Junglas et
al. 2019). Second, the users’ computer self-efficacy is considered a resource to mitigate the
adverse impact of IT consumerization. In addition, three adverse outcomes of unreliability in
the specific context of IT portfolios consisting of private and business IT for business purposes
were identified: dissatisfaction with IT portfolio, transition costs, and switching exhaustion.
Technostress as a Negative Outcome of Individual Information Systems Use 109
The following sub-sections develop our hypotheses in more detail. Figure 3.1-1 summarizes
the research model.
3.1.4.1 IT Consumerization and Unreliability
System redundancies can be a source of stress in the context of IT consumerization (Ortbach et
al. 2013). We propose that this is because they cause the perception of unreliability (Adam et
al. 2017), which is defined as the “degree to which features and capabilities provided by the
technology are [not] dependable” (Ayyagari et al. 2011, p. 837). This definition focuses on
individual technologies and not necessarily their interplay. However, in our interviews, switch-
ing between privately-owned and business-owned components of an IT portfolio for business
purposes was the most frequently reported source of stress related to IT consumerization. The
users reported occasions where the integration of data collected or processed through privately-
owned IT caused problems when they were transferred to business IT solutions and vice versa.
For example, one interviewee mentioned that using a privately-owned cloud solution was nec-
essary to transfer data, which causes technical problems and may result in the loss of work
progress. Another interviewee reported that a small computer program written for business pur-
poses using privately-owned IT could not be tested on the business-owned IT due to restrictive
security settings. Upon the analysis of these stressful situations, we suggest that this is related
to perceived unreliability. We hypothesize:
H1: IT consumerization use behavior increases unreliability.
3.1.4.2 The Effect of Portfolio Integration
Switching from privately-owned IT to business-owned IT is generally possible but associated
with data transfer or information exchange between the different components, which we refer
to as a lack of portfolio integration (Rai and Tang 2010). Our interviewees mentioned a seam-
less integration of the different components of their IT portfolio to be one of the most important
factors for effective IT consumerization. They frequently report issues regarding integration
that lead to the perception of unreliability. For example, barriers related to the transfer of data
and access to an organization’s network through private IT components were reported to create
the necessity for workarounds. Such workarounds are a source of unreliability and cause frus-
tration. Nevertheless, when organizations provide seamless integration of the various privately-
owned and business-owned components, such issues decrease. Hence, we hypothesize:
H2: IT portfolio integration reduces unreliability.
Technostress as a Negative Outcome of Individual Information Systems Use 110
3.1.4.3 The Effect of General Computer Self-Efficacy
Personal resources play an essential role in the perception of stress. Relevant personal resources
are digital literacy (Tarafdar et al. 2019) or technology competence (Tarafdar et al. 2015). This
role is echoed by IT consumerization literature that finds an association with easier problem
solving for people with high technological competence (Niehaves et al. 2013b). Further, the
lack of competence is mentioned as the most frequent antecedent of technostress when engaging
in IT consumerization (Ortbach et al. 2013).
In our interviews, respondents explained how they coped with stressful situations through cre-
ative solutions and workarounds. For example, one interviewee suggested that he lacked the
technological competence to deal with data loss while transferring files between multiple com-
ponents of his mixed IT portfolio. On the contrary, another employee stated that his background
in IT helps him be calmer and more resilient when it comes to overcoming issues with IT. Such
digital problem-solving competencies are strongly related to general computer self-efficacy
(Shu et al. 2011). This suggests a direct effect of general computer self-efficacy on technostress
creators, such as unreliability:
H3: General computer self-efficacy reduces unreliability.
3.1.4.4 The Effect of Unreliability on Outcomes
Our interviews suggest that problems arising from integrating privately-owned and business-
owned components of an IT portfolio and the resulting perception of unreliability increase the
individuals’ dissatisfaction with their IT portfolio (cf. Au et al. 2008). Dissatisfaction with IT
portfolio is the user’s affective and cognitive evaluation of a consumption-related lack of need
fulfilment experienced with the IT portfolio (Au et al. 2008). For example, one interviewee
suggested that technical restrictions are a limiting factor of successful integration and that there
would be better technical ways to facilitate it.
H4a: Unreliability increases dissatisfaction with the IT portfolio.
Another result of switching between different technologies, such as online social networks, are
heightened transition costs (Maier et al. 2015). Previous research finds that a lack of integration
between different social media sites leads to high transition costs, which reflect the time and
effort required in such situations. As pointed out, switching from privately-owned IT to busi-
ness-owned IT components is generally possible but associated with data transfer and commu-
nication efforts, referred to as portfolio integration (Rai and Tang 2010). Thus, we propose:
H4b: Unreliability increases transition costs.
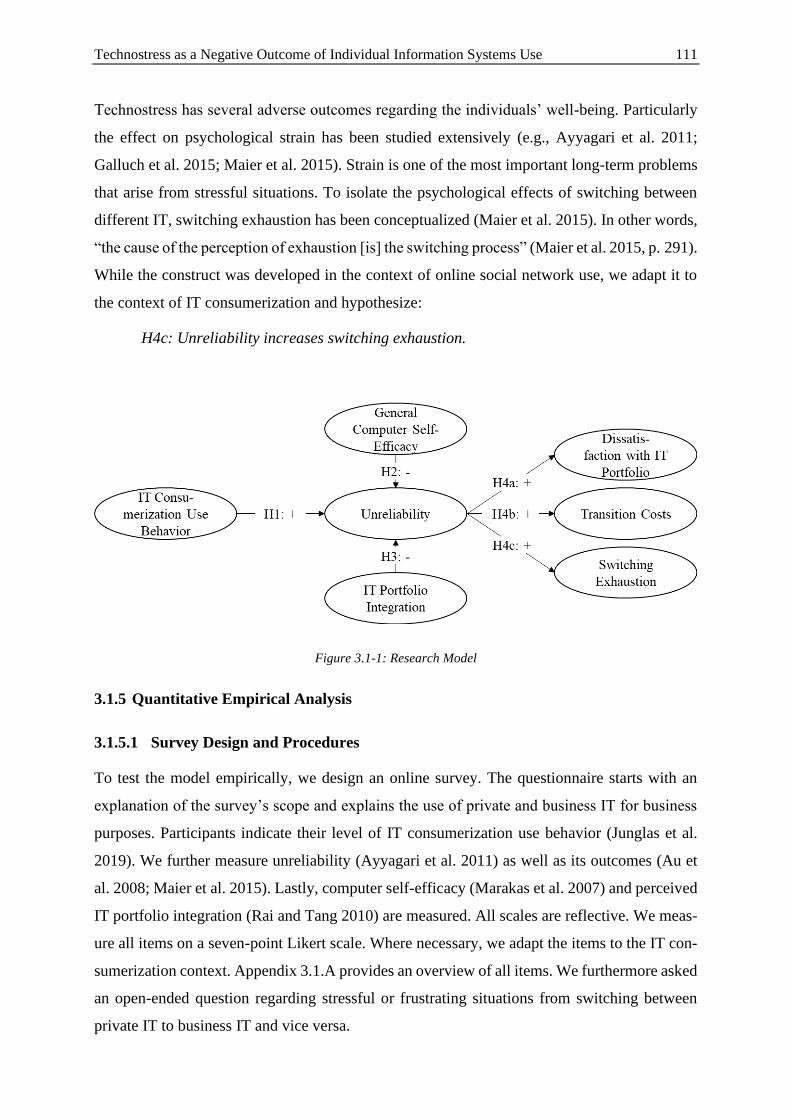
Technostress as a Negative Outcome of Individual Information Systems Use 111
Technostress has several adverse outcomes regarding the individuals’ well-being. Particularly
the effect on psychological strain has been studied extensively (e.g., Ayyagari et al. 2011;
Galluch et al. 2015; Maier et al. 2015). Strain is one of the most important long-term problems
that arise from stressful situations. To isolate the psychological effects of switching between
different IT, switching exhaustion has been conceptualized (Maier et al. 2015). In other words,
“the cause of the perception of exhaustion [is] the switching process” (Maier et al. 2015, p. 291).
While the construct was developed in the context of online social network use, we adapt it to
the context of IT consumerization and hypothesize:
H4c: Unreliability increases switching exhaustion.
Figure 3.1-1: Research Model
3.1.5 Quantitative Empirical Analysis
3.1.5.1 Survey Design and Procedures
To test the model empirically, we design an online survey. The questionnaire starts with an
explanation of the survey’s scope and explains the use of private and business IT for business
purposes. Participants indicate their level of IT consumerization use behavior (Junglas et al.
2019). We further measure unreliability (Ayyagari et al. 2011) as well as its outcomes (Au et
al. 2008; Maier et al. 2015). Lastly, computer self-efficacy (Marakas et al. 2007) and perceived
IT portfolio integration (Rai and Tang 2010) are measured. All scales are reflective. We meas-
ure all items on a seven-point Likert scale. Where necessary, we adapt the items to the IT con-
sumerization context. Appendix 3.1.A provides an overview of all items. We furthermore asked
an open-ended question regarding stressful or frustrating situations from switching between
private IT to business IT and vice versa.
Technostress as a Negative Outcome of Individual Information Systems Use 112
We restrict participation to full-time employees and distribute the survey via the online
crowdsourcing market Amazon Mechanical Turk (MTurk) in April 2020, during the first wave
of the COVID-19 pandemic. Such internet-based platforms allow the recruiting of participants
for surveys and other tasks (Steelman et al. 2014). MTurk’s participant pool is closer to the U.S.
population than traditional university subject pools (Paolacci et al. 2010). Further, MTurk has
been frequently used in IS research before (e.g., Kehr et al. 2015). Participants received a mon-
etary reward of USD 1.30 for completing the survey. To ensure data quality, we implemented
several measures. Next to a traditional attention check (“If you are answering this survey cau-
tiously, tick the second box from the left.”) and an instructional manipulation check (Oppen-
heimer et al. 2009), we assessed open-ended questions to identify “unusual comments”
(Chmielewski and Kucker 2020).
3.1.5.2 Results
162 participants completed our survey and passed our quality gates, of which 32.7 % are fe-
male, 65.4 % male. Three participants stated to be of another gender. The average age of re-
spondents was 39 years. We assess our research model through structural equation modeling
(PLS-SEM) using SmartPLS 3.2. We start with the evaluation of the measurement model before
assessing the structural model and testing our hypotheses.
Evaluation of the Measurement Model
Regarding internal consistency reliability (ICR), all scales exceed the threshold of 0.708 with a
minimum of 0.800 for Cronbach’s Alpha (Alpha) and a minimum of 0.879 for composite reli-
ability (CR). For convergent validity, we examine indicator reliability and average variance
extracted (AVE). Convergent validity is satisfactory as the minimum of all indicators’ outer
loadings is 0.780, and the minimum AVE is 0.708. For discriminant validity, we first examine
each indicator’s cross-loadings with all other constructs to check whether they are lower than
the indicator’s outer loading on the construct. Our data meets this criterion. Second, each con-
struct’s square root of the AVE is higher than the highest correlation with other constructs (For-
nell-Larcker criterion). Thus, discriminant validity is supported. Table 3.1-3 shows means,
standard deviations (SD), Alpha, CR, and AVE for all constructs. Information on (cross-)load-
ings and the Fornell-Larcker criterion can be found in Appendix 3.1.B and Appendix 3.1.C.
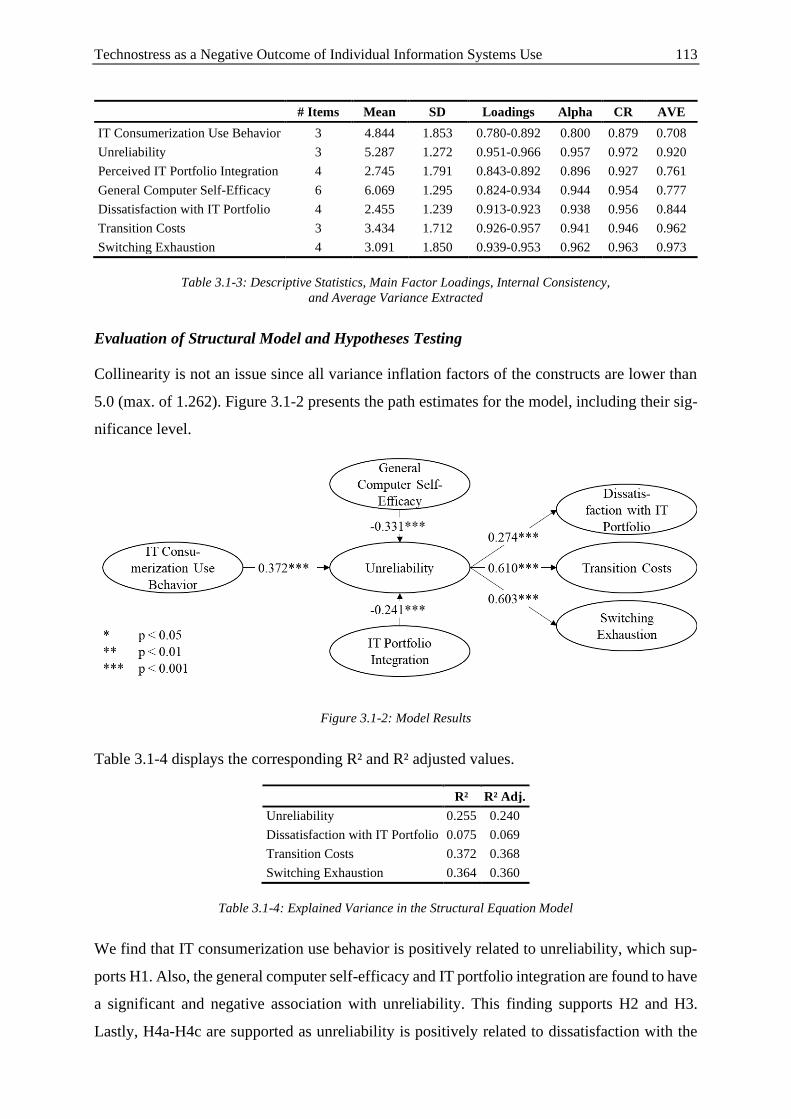
Technostress as a Negative Outcome of Individual Information Systems Use 113
# Items Mean SD Loadings Alpha CR AVE
IT Consumerization Use Behavior 3 4.844 1.853 0.780-0.892 0.800 0.879 0.708
Unreliability 3 5.287 1.272 0.951-0.966 0.957 0.972 0.920
Perceived IT Portfolio Integration 4 2.745 1.791 0.843-0.892 0.896 0.927 0.761
General Computer Self-Efficacy 6 6.069 1.295 0.824-0.934 0.944 0.954 0.777
Dissatisfaction with IT Portfolio 4 2.455 1.239 0.913-0.923 0.938 0.956 0.844
Transition Costs 3 3.434 1.712 0.926-0.957 0.941 0.946 0.962
Switching Exhaustion 4 3.091 1.850 0.939-0.953 0.962 0.963 0.973
Table 3.1-3: Descriptive Statistics, Main Factor Loadings, Internal Consistency,
and Average Variance Extracted
Evaluation of Structural Model and Hypotheses Testing
Collinearity is not an issue since all variance inflation factors of the constructs are lower than
5.0 (max. of 1.262). Figure 3.1-2 presents the path estimates for the model, including their sig-
nificance level.
Figure 3.1-2: Model Results
Table 3.1-4 displays the corresponding R² and R² adjusted values.
R² R² Adj.
Unreliability 0.255 0.240
Dissatisfaction with IT Portfolio 0.075 0.069
Transition Costs 0.372 0.368
Switching Exhaustion 0.364 0.360
Table 3.1-4: Explained Variance in the Structural Equation Model
We find that IT consumerization use behavior is positively related to unreliability, which sup-
ports H1. Also, the general computer self-efficacy and IT portfolio integration are found to have
a significant and negative association with unreliability. This finding supports H2 and H3.
Lastly, H4a-H4c are supported as unreliability is positively related to dissatisfaction with the
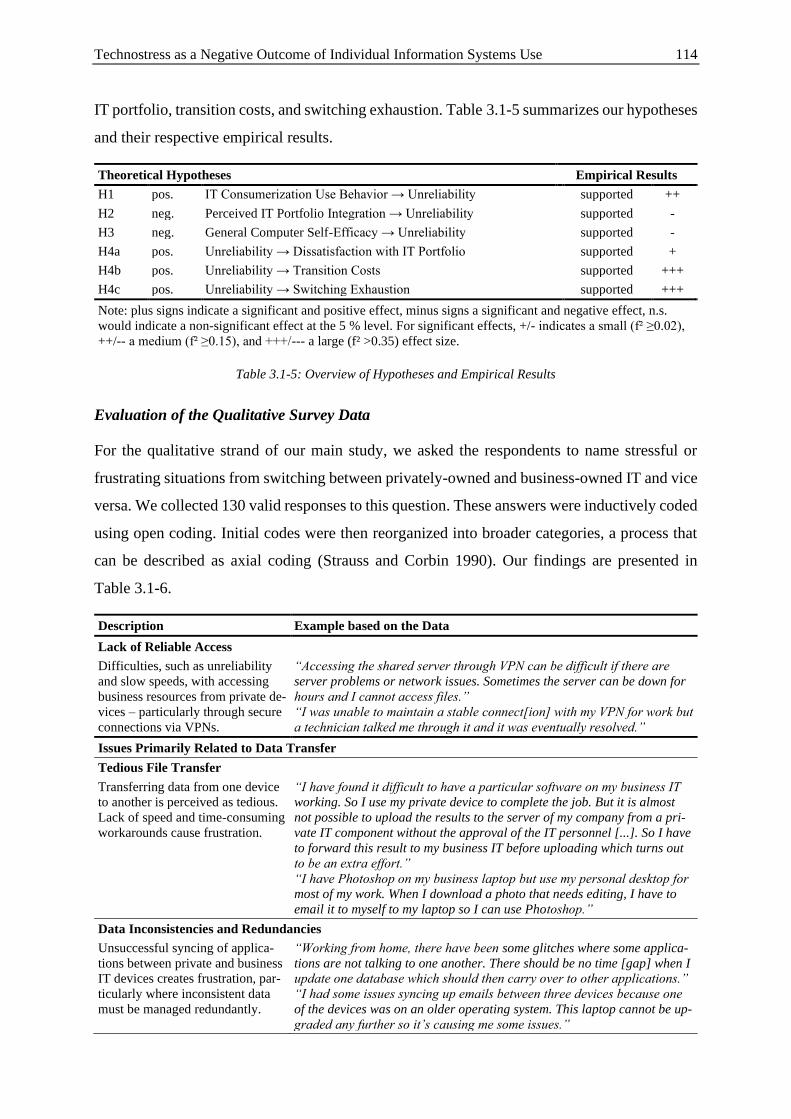
Technostress as a Negative Outcome of Individual Information Systems Use 114
IT portfolio, transition costs, and switching exhaustion. Table 3.1-5 summarizes our hypotheses
and their respective empirical results.
Theoretical Hypotheses Empirical Results
H1 pos. IT Consumerization Use Behavior → Unreliability supported ++
H2 neg. Perceived IT Portfolio Integration → Unreliability supported -
H3 neg. General Computer Self-Efficacy → Unreliability supported -
H4a pos. Unreliability → Dissatisfaction with IT Portfolio supported +
H4b pos. Unreliability → Transition Costs supported +++
H4c pos. Unreliability → Switching Exhaustion supported +++
Note: plus signs indicate a significant and positive effect, minus signs a significant and negative effect, n.s.
would indicate a non-significant effect at the 5 % level. For significant effects, +/- indicates a small (f² ≥0.02),
++/-- a medium (f² ≥0.15), and +++/--- a large (f² >0.35) effect size.
Table 3.1-5: Overview of Hypotheses and Empirical Results
Evaluation of the Qualitative Survey Data
For the qualitative strand of our main study, we asked the respondents to name stressful or
frustrating situations from switching between privately-owned and business-owned IT and vice
versa. We collected 130 valid responses to this question. These answers were inductively coded
using open coding. Initial codes were then reorganized into broader categories, a process that
can be described as axial coding (Strauss and Corbin 1990). Our findings are presented in
Table 3.1-6.
Description Example based on the Data
Lack of Reliable Access
Difficulties, such as unreliability
and slow speeds, with accessing
business resources from private de-
vices – particularly through secure
connections via VPNs.
“Accessing the shared server through VPN can be difficult if there are
server problems or network issues. Sometimes the server can be down for
hours and I cannot access files.”
“I was unable to maintain a stable connect[ion] with my VPN for work but
a technician talked me through it and it was eventually resolved.”
Issues Primarily Related to Data Transfer
Tedious File Transfer
Transferring data from one device
to another is perceived as tedious.
Lack of speed and time-consuming
workarounds cause frustration.
“I have found it difficult to have a particular software on my business IT
working. So I use my private device to complete the job. But it is almost
not possible to upload the results to the server of my company from a pri-
vate IT component without the approval of the IT personnel [...]. So I have
to forward this result to my business IT before uploading which turns out
to be an extra effort.”
“I have Photoshop on my business laptop but use my personal desktop for
most of my work. When I download a photo that needs editing, I have to
email it to myself to my laptop so I can use Photoshop.”
Data Inconsistencies and Redundancies
Unsuccessful syncing of applica-
tions between private and business
IT devices creates frustration, par-
ticularly where inconsistent data
must be managed redundantly.
“Working from home, there have been some glitches where some applica-
tions are not talking to one another. There should be no time [gap] when I
update one database which should then carry over to other applications.”
“I had some issues syncing up emails between three devices because one
of the devices was on an older operating system. This laptop cannot be up-
graded any further so it’s causing me some issues.”
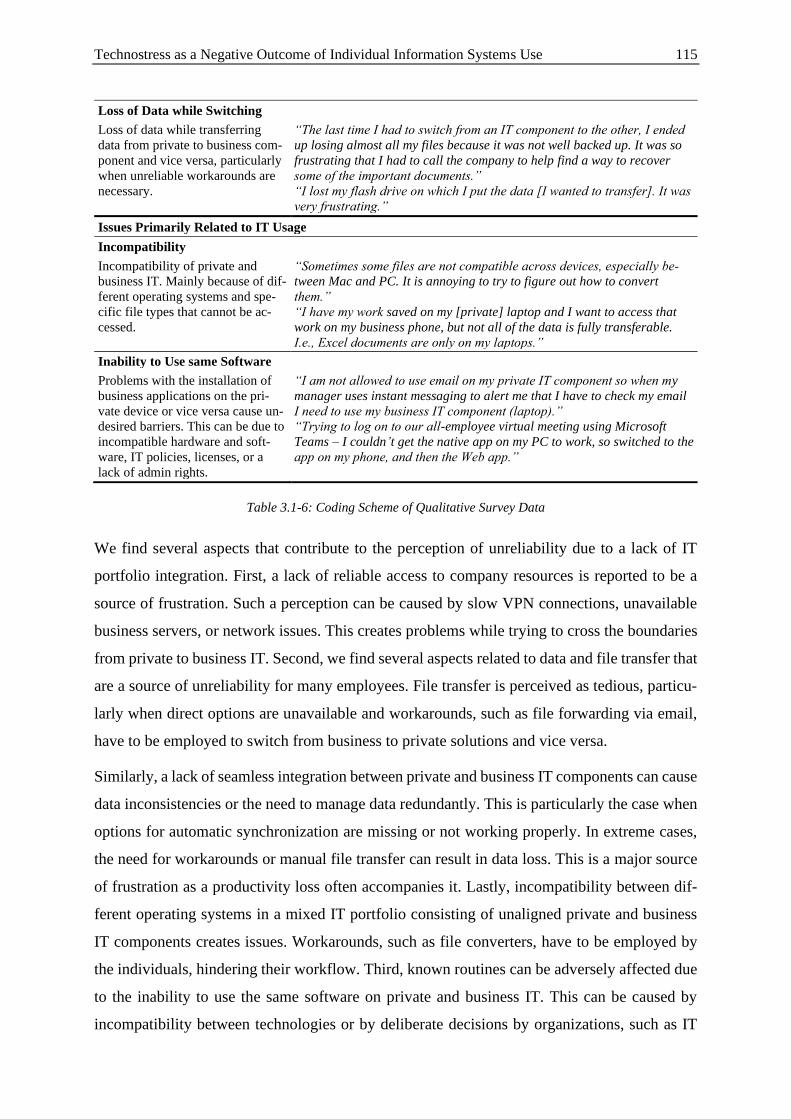
Technostress as a Negative Outcome of Individual Information Systems Use 115
Loss of Data while Switching
Loss of data while transferring
data from private to business com-
ponent and vice versa, particularly
when unreliable workarounds are
necessary.
“The last time I had to switch from an IT component to the other, I ended
up losing almost all my files because it was not well backed up. It was so
frustrating that I had to call the company to help find a way to recover
some of the important documents.”
“I lost my flash drive on which I put the data [I wanted to transfer]. It was
very frustrating.”
Issues Primarily Related to IT Usage
Incompatibility
Incompatibility of private and
business IT. Mainly because of dif-
ferent operating systems and spe-
cific file types that cannot be ac-
cessed.
“Sometimes some files are not compatible across devices, especially be-
tween Mac and PC. It is annoying to try to figure out how to convert
them.”
“I have my work saved on my [private] laptop and I want to access that
work on my business phone, but not all of the data is fully transferable.
I.e., Excel documents are only on my laptops.”
Inability to Use same Software
Problems with the installation of
business applications on the pri-
vate device or vice versa cause un-
desired barriers. This can be due to
incompatible hardware and soft-
ware, IT policies, licenses, or a
lack of admin rights.
“I am not allowed to use email on my private IT component so when my
manager uses instant messaging to alert me that I have to check my email
I need to use my business IT component (laptop).”
“Trying to log on to our all-employee virtual meeting using Microsoft
Teams – I couldn’t get the native app on my PC to work, so switched to the
app on my phone, and then the Web app.”
Table 3.1-6: Coding Scheme of Qualitative Survey Data
We find several aspects that contribute to the perception of unreliability due to a lack of IT
portfolio integration. First, a lack of reliable access to company resources is reported to be a
source of frustration. Such a perception can be caused by slow VPN connections, unavailable
business servers, or network issues. This creates problems while trying to cross the boundaries
from private to business IT. Second, we find several aspects related to data and file transfer that
are a source of unreliability for many employees. File transfer is perceived as tedious, particu-
larly when direct options are unavailable and workarounds, such as file forwarding via email,
have to be employed to switch from business to private solutions and vice versa.
Similarly, a lack of seamless integration between private and business IT components can cause
data inconsistencies or the need to manage data redundantly. This is particularly the case when
options for automatic synchronization are missing or not working properly. In extreme cases,
the need for workarounds or manual file transfer can result in data loss. This is a major source
of frustration as a productivity loss often accompanies it. Lastly, incompatibility between dif-
ferent operating systems in a mixed IT portfolio consisting of unaligned private and business
IT components creates issues. Workarounds, such as file converters, have to be employed by
the individuals, hindering their workflow. Third, known routines can be adversely affected due
to the inability to use the same software on private and business IT. This can be caused by
incompatibility between technologies or by deliberate decisions by organizations, such as IT
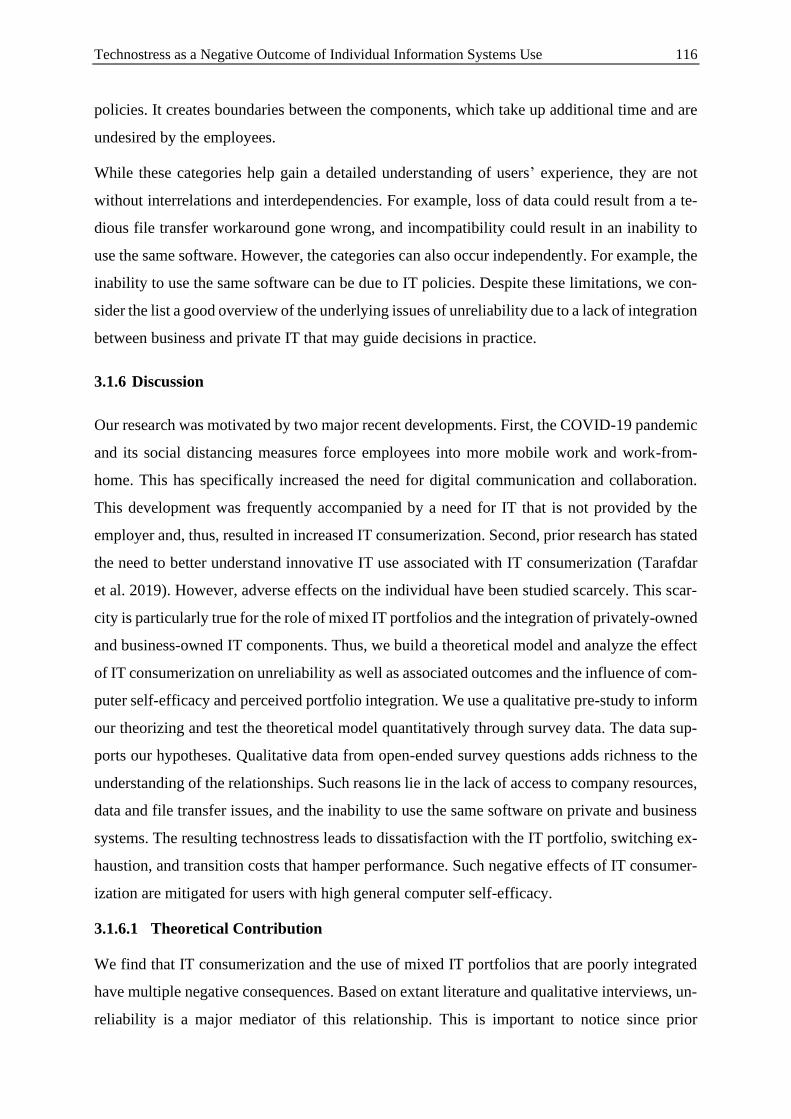
Technostress as a Negative Outcome of Individual Information Systems Use 116
policies. It creates boundaries between the components, which take up additional time and are
undesired by the employees.
While these categories help gain a detailed understanding of users’ experience, they are not
without interrelations and interdependencies. For example, loss of data could result from a te-
dious file transfer workaround gone wrong, and incompatibility could result in an inability to
use the same software. However, the categories can also occur independently. For example, the
inability to use the same software can be due to IT policies. Despite these limitations, we con-
sider the list a good overview of the underlying issues of unreliability due to a lack of integration
between business and private IT that may guide decisions in practice.
3.1.6 Discussion
Our research was motivated by two major recent developments. First, the COVID-19 pandemic
and its social distancing measures force employees into more mobile work and work-from-
home. This has specifically increased the need for digital communication and collaboration.
This development was frequently accompanied by a need for IT that is not provided by the
employer and, thus, resulted in increased IT consumerization. Second, prior research has stated
the need to better understand innovative IT use associated with IT consumerization (Tarafdar
et al. 2019). However, adverse effects on the individual have been studied scarcely. This scar-
city is particularly true for the role of mixed IT portfolios and the integration of privately-owned
and business-owned IT components. Thus, we build a theoretical model and analyze the effect
of IT consumerization on unreliability as well as associated outcomes and the influence of com-
puter self-efficacy and perceived portfolio integration. We use a qualitative pre-study to inform
our theorizing and test the theoretical model quantitatively through survey data. The data sup-
ports our hypotheses. Qualitative data from open-ended survey questions adds richness to the
understanding of the relationships. Such reasons lie in the lack of access to company resources,
data and file transfer issues, and the inability to use the same software on private and business
systems. The resulting technostress leads to dissatisfaction with the IT portfolio, switching ex-
haustion, and transition costs that hamper performance. Such negative effects of IT consumer-
ization are mitigated for users with high general computer self-efficacy.
3.1.6.1 Theoretical Contribution
We find that IT consumerization and the use of mixed IT portfolios that are poorly integrated
have multiple negative consequences. Based on extant literature and qualitative interviews, un-
reliability is a major mediator of this relationship. This is important to notice since prior
Technostress as a Negative Outcome of Individual Information Systems Use 117
research on IT consumerization has found higher usefulness and ease of use to be the key drivers
for individuals’ IT adoption decisions in general (Venkatesh et al. 2012) and IT consumeriza-
tion in particular (Ortbach 2015). The perception of IT to not behave consistently and its fea-
tures to not be dependable tends to go against classical antecedents of technology acceptance
like perceived ease of use and perceived usefulness. Here, we see a need for a deeper investi-
gation to understand this paradox.
As a first step to deepening this understanding, we find that perceived IT portfolio integration
is a crucial factor for the seamless operation of IT portfolios for business purposes, including
private IT components. To the best of our knowledge, this perception has not been considered
in the IT consumerization literature so far, and we contribute to it by raising this issue. We find
that issues with integration between multiple components of a mixed IT portfolio lead to a
higher perception of unreliability. While the duality of IT components certainly raises issues
with integration, which we show in this study, such issues can also emerge between multiple
heterogeneous IT components provided by the business. For example, different manufacturers
of IT and their respective operating systems might cause such issues, which, thus, should be
regarded in future research. While poor integration may be an issue with IT portfolios consisting
of only business-owned IT components, their management is easier and lies in the hand of IT
departments. This is different for mixed IT portfolios, where users are administrating their pri-
vately-owned components.
Thus, it is apparent that the general computer self-efficacy of the users also plays a vital role in
this relationship. We find that general computer self-efficacy influences the effect of IT con-
sumerization on technostress creators in several ways. This is congruent with the transactional
model of stress that most technostress research is based on. Here, stress emerges when external
demands tax or exceed the resources an individual can use to meet the demands (Lazarus and
Folkman 1984). General computer self-efficacy is such a resource. This finding is also im-
portant for the individuals themselves when deciding whether to engage in IT consumerization.
This yields several practical implications that we discuss in the next section.
We extend upon our findings through a qualitative analysis of users’ experience of poor inte-
gration of privately-owned and business-owned IT. We find a host of different problems that
can arise, which center around universal access to company resources, data transfer, synchro-
nization, and compatibility issues. These insights also extend our understanding of the tech-
nostress phenomenon and may guide future work on mitigating technostress related to IT con-
sumerization.
Technostress as a Negative Outcome of Individual Information Systems Use 118
3.1.6.2 Practical Implications
When employees increasingly use privately-owned IT for business purposes, it is crucial to
understand the personal consequences of this adoption decision. Our qualitative investigation
reveals several issues that employees face when business IT and private IT are poorly inte-
grated. Some of these issues can be overcome by the organization: For example, seamless so-
lutions for data transfer that employees can integrate onto their private devices may help with
issues with data loss or data redundancies. Many cloud-based office suits offer such integration
that can be made available to private devices based on the organizations’ IT policies. Several
of these changes come as a tradeoff between IT security and user-friendliness. With recent se-
curity incidents which have gained global attention, and home-office workers becoming an in-
creasingly popular gateway for hackers, many companies tend to the side of caution with their
IT policies. However, they should be aware that restricting access to company resources causes
stress in employees. This stress is associated with adverse health effects, decreased satisfaction
with IT, and decreased productivity due to transition costs.
Our findings further show that such stressful situations are particularly problematic for IT users
that lack personal IT-related resources, measured as general computer self-efficacy, to over-
come such issues. Thus, we conclude that IT consumerization is only reasonable if individuals
can handle the technologies of their IT portfolio and the complexity introduced by the interplay
of privately-owned and business IT components. Thus, IT consumerization should be cau-
tiously used by employees that lack the resources to deal with its additional demands.
Further, privately-owned IT components usually receive less organizational support, which is
an essential external resource for inhibiting technostress. In order to prevent the identified neg-
ative consequences of IT consumerization, organizations would be well-advised to start offer-
ing support for privately-owned IT. This would allow both the organization and its employees
to benefit from the advantages associated with IT consumerization without risking their em-
ployees’ well-being and productivity. Alternatively, organizations may offer all relevant IT
components, with high quality and ease of use, that their employees need for mobile work and
work-from-home to reduce IT consumerization and its adverse outcomes. Yet, this naturally
hampers its benefits.
In summation, both restrictive as well as laissez-faire IT consumerization policies may have
adverse effects on users that struggle with IT. Organizations should thus embrace IT consum-
erization, offer technical support as well as adequate technological integration of private IT
Technostress as a Negative Outcome of Individual Information Systems Use 119
devices into their portfolio in order to reap the benefits and mitigate the risks of IT consumeri-
zation.
3.1.7 Limitations and Conclusion
Our study has a number of limitations that leave room for further research. In the quantitative
empirical part, we use data from a single cross-sectional survey in times of the COVID-19
pandemic, which leads to limitations in testing the robustness and generalizability of results.
Future research should follow up with generating additional data sets to test robustness and
generalizability. Particularly the relationship between IT portfolio integration and technostress
seems promising for future research and should be further validated.
Further, in our research, we emphasize the role of unreliability, which has been scarcely studied
in the context of IT consumerization. We show that IT portfolio integration plays a significant
role in this relationship. While we elicit several reasons why IT consumerization creates such
problems, for example, through a lack of strategic alignment of the components, we do not think
that the outlined problems are limited to this domain. Poorly managed or historically grown
business IT portfolios may have similar issues. Future research could thus explore the impact
of integration on technostress within other IT portfolios.
Previous work has raised research questions regarding different types of stress, particularly
challenge stress (Tarafdar et al. 2019). One element mentioned to create challenging situations
for users is innovative work behavior (Tarafdar et al. 2019). This factor is said to be facilitated
by IT consumerization (Junglas et al. 2019). While unreliability is likely a hindrance or a threat
to most individuals, future research should look into ways that IT consumerization can contrib-
ute to the bright side of technostress. Despite these suggestions for future research, the paper at
hand contributes to the scholarly discourse on both the effects of IT consumerization and the
antecedents of technostress. It provides several suggestions for practitioners to govern and man-
age IT consumerization and mixed IT portfolios.
In conclusion, our research sheds light on the adverse effects of IT consumerization concerning
technostress and its consequences. We find unreliability to be particularly relevant in this con-
text. With a mixed-methods design, we detail why a mixed IT portfolio of business and private
IT components creates a sense of unreliability. Our research further contributes concrete issues
that users experience and suggests how these effects can be attenuated on an organizational and
individual level. We conclude that IT consumerization needs to be adequately managed and
integrated into the existing business-owned IT landscape to reduce individual exhaustion,
Technostress as a Negative Outcome of Individual Information Systems Use 120
increase satisfaction with the IT portfolio, and reduce transition costs that inhibit performance.
We further suggest that IT consumerization makes the most sense for users with a high level of
IT-related resources to successfully overcome the remaining boundaries between privately-
owned and business-owned IT.
Technostress as a Negative Outcome of Individual Information Systems Use 121
3.1.8 References
Adam, M. T. P., Gimpel, H., Mädche, A., and Riedl, R. 2017. “Design Blueprint for Stress-
Sensitive Adaptive Enterprise Systems,” Business & Information Systems Engineering
(59:4), pp. 277-291.
Au, N., Ngai, E. W. T., and Cheng, T. C. E. 2008. “Extending the Understanding of End User
Information Systems Satisfaction Formation: An Equitable Needs Fulfillment Model Ap-
proach,” Management Information Systems Quarterly (32:1), pp. 43-66.
Ayyagari, R., Grover, V., and Purvis, R. 2011. “Technostress: Technological Antecedents and
Implications,” Management Information Systems Quarterly (35:4), pp. 831-858.
Baskerville, R. L. 2011. “Individual Information Systems as a Research Arena,” European
Journal of Information Systems (20:3), pp. 251-254.
Bautista, J. R., Rosenthal, S., Lin, T. T., and Theng, Y. L. 2018. “Predictors and Outcomes of
Nurses’ Use of Smartphones for Work Purposes,” Computers in Human Behavior (84),
pp. 360-374.
Behrens, S. 2009. “Shadow Systems: The Good, the Bad and the Ugly,” Communications of
the ACM (52:2), pp. 124-129.
Brod, C. 1982. “Managing Technostress: Optimizing the Use of Computer Technology,” Per-
sonnel Journal (61:10), pp. 753-757.
Chmielewski, M., and Kucker, S. C. 2020. “An MTurk Crisis?: Shifts in Data Quality and the
Impact on Study Results,” Social Psychological and Personality Science (11:4), pp. 464-
473.
Doargajudhur, M. S., and Dell, P. 2019. “Impact of BYOD on Organizational Commitment:
An Empirical Investigation,” Information Technology & People (32:2), pp. 246-268.
Galluch, P. S., Grover, V., and Thatcher, J. B. 2015. “Interrupting the Workplace: Examining
Stressors in an Information Technology Context,” Journal of the Association for Infor-
mation Systems (16:1), pp. 1-47.
Gewald, H., Wang, X., Weeger, A., Raisinghani, M. S., Grant, G., Sanchez, O., and Pittayacha-
wan, S. 2017. “Millennials’ Attitudes Toward IT Consumerization in the Workplace,” Com-
munications of the ACM (60:10), pp. 62-69.
Junglas, I., Goel, L., Ives, B., and Harris, J. G. 2019. “Innovation at Work: The Relative Ad-
vantage of Using Consumer IT in the Workplace,” Information Systems Journal (29:2),
pp. 317-339.
Technostress as a Negative Outcome of Individual Information Systems Use 122
Kehr, F., Kowatsch, T., Wentzel, D., and Fleisch, E. 2015. “Blissfully Ignorant: The Effects of
General Privacy Concerns, General Institutional Trust, and Affect in the Privacy Calculus,”
Information Systems Journal (25:6), pp. 607-635.
Köffer, S., Junglas, I., Chiperi, C., and Niehaves, B. 2014. “Dual Use of Mobile IT and Work-
to-Life Conflict in the Context of IT Consumerization,” in Proceedings of the 35th Interna-
tional Conference on Information Systems, Auckland, New Zealand, pp. 1-19.
Lazarus, R. S., and Folkman, S. 1984. Stress, Appraisal, and Coping, New York: Springer Pub-
lishing Company.
Lee, A. S., Thomas, M., and Baskerville, R. L. 2015. “Going Back to Basics in Design Science:
From the Information Technology Artifact to the Information Systems Artifact,” Infor-
mation Systems Journal (25:1), pp. 5-21.
Maier, C., Laumer, S., Weinert, C., and Weitzel, T. 2015. “The Effects of Technostress and
Switching Stress on Discontinued Use of Social Networking Services: A Study of Facebook
Use,” Information Systems Journal (25:3), pp. 275-308.
Marakas, G., Johnson, R., and Clay, P. 2007. “The Evolving Nature of the Computer Self-
Efficacy Construct: An Empirical Investigation of Measurement Construction, Validity, Re-
liability and Stability Over Time,” Journal of the Association for Information Systems (8:1),
pp. 16-46.
Marakas, G. M., Yi, M. Y., and Johnson, R. D. 1998. “The Multilevel and Multifaceted Char-
acter of Computer Self-Efficacy: Toward Clarification of the Construct and an Integrative
Framework for Research,” Information Systems Research (9:2), pp. 126-163.
Niehaves, B., Köffer, S., and Ortbach, K. 2012. “IT Consumerization: A Theory and Practice
Review,” in Proceedings of the 18th Americas Conference on Information Systems, Seattle,
Washington, USA, pp. 1-9.
Niehaves, B., Köffer, S., and Ortbach, K. 2013a. “The Effect of Private IT Use on Work Per-
formance: Towards an IT Consumerization Theory,” in Proceedings of the 11th Interna-
tional Conference on Wirtschaftsinformatik, Leipzig, Germany, pp. 39-53.
Niehaves, B., Köffer, S., Ortbach, K., and Reimler, S. 2013b. “Boon and Bane of IT Consum-
erization: The Burnout-Engagement-Continuum,” in Proceedings of the 19th Americas
Conference on Information Systems, Chicago, Illinois, USA, pp. 1-9.
Oppenheimer, D. M., Meyvis, T., and Davidenko, N. 2009. “Instructional Manipulation
Checks: Detecting Satisficing to Increase Statistical Power,” Journal of Experimental Social
Psychology (45:4), pp. 867-872.
Technostress as a Negative Outcome of Individual Information Systems Use 123
Ortbach, K. 2015. “Unraveling the Effect of Personal Innovativeness on Bring-Your-Own-De-
vice (BYOD) Intention: The Role of Perceptions towards Enterprise-Provided and Pri-
vately-Owned Technologies,” in Proceedings of the 23rd European Conference on Infor-
mation Systems, Muenster, Germany, pp. 1-17.
Ortbach, K., Köffer, S., Müller, C. P. F., and Niehaves, B. 2013. “How IT Consumerization
Affects the Stress Level at Work: A Public Sector Case Study,” in Proceedings of the 17th
Pacific Asia Conference on Information Systems, Jeju Island, Korea, pp. 1-11.
Paolacci, G., Chandler, J., and Ipeirotis, P. G. 2010. “Running Experiments on Amazon Me-
chanical Turk,” Judgement and Decision Making (5:5), pp. 411-419.
Ragu-Nathan, T. S., Tarafdar, M., Ragu-Nathan, B. S., and Tu, Q. 2008. “The Consequences
of Technostress for End Users in Organizations: Conceptual Development and Empirical
Validation,” Information Systems Research (19:4), pp. 417-433.
Rai, A., and Tang, X. 2010. “Leveraging IT Capabilits and Competitive Process Capabilities
for the Management of Interorganizational Relationship Portfolios,” Information Systems
Research (21:3), pp. 516-542.
Salo, M., Pirkkalainen, H., Makkonen, M., and Hekkala, R. 2018. “Distress, Eustress, or No
Stress?: Explaining Smartphone Users’ Different Technostress Responses,” in Proceedings
of the 39th International Conference on Information Systems, San Francisco, California,
USA, pp. 1-17.
Shu, Q., Tu, Q., and Wang, K. 2011. “The Impact of Computer Self-Efficacy and Technology
Dependence on Computer-Related Technostress: A Social Cognitive Theory Perspective,”
International Journal of Human–Computer Interaction (27:10), pp. 923-939.
Steelman, Z. R., Hammer, B. I., and Limayem, M. M. 2014. “Data Collection in the Digital
Age: Innovative Alternatives to Student Samples,” Management Information Systems Quar-
terly (38:2), pp. 355-378.
Stich, J.-F., Tarafdar, M., Stacey, P., and Cooper, C. L. 2019. “Appraisal of Email Use as a
Source of Workplace Stress: A Person-Environment Fit Approach,” Journal of the Associ-
ation for Information Systems (20:2), pp. 132-160.
Strauss, A., and Corbin, J. M. 1990. Basics of Qualitative Research: Grounded Theory Proce-
dures and Techniques, Newbury Park, CA: Sage Publications.
Tarafdar, M., Cooper, C. L., and Stich, J.-F. 2019. “The Technostress Trifecta: Techno Eustress,
Techno Distress and Design: Theoretical Directions and an Agenda for Research,” Infor-
mation Systems Journal (29:1), pp. 6-42.
Technostress as a Negative Outcome of Individual Information Systems Use 124
Tarafdar, M., Pullins, E. B., and Ragu-Nathan, T. S. 2015. “Technostress: Negative Effect on
Performance and Possible Mitigations,” Information Systems Journal (25:2), pp. 103-132.
Tarafdar, M., Tu, Q., and Ragu-Nathan, T. S. 2010. “Impact of Technostress on End-User Sat-
isfaction and Performance,” Journal of Management Information Systems (27:3), pp. 303-
334.
Venkatesh, V., Brown, S. A., and Bala, H. 2013. “Bridging the Qualitative-Quantitative Di-
vide: Guidelines for Conducting Mixed Methods Research in Information Systems,” Man-
agement Information Systems Quarterly (37:1), pp. 21-54.
Venkatesh, V., Brown, S. A., and Sullivan, Y. W. 2016. “Guidelines for Conducting Mixed-
methods Research: An Extension and lllustration,” Journal of the Association for Infor-
mation Systems (17:7), pp. 435-494.
Venkatesh, V., Thong, J. Y. L., and Xu, X. 2012. “Consumer Acceptance and Use of Infor-
mation Technology: Extending the Unified Theory of Acceptance and Use of Technology,”
Management Information Systems Quarterly (36:1), pp. 157-178.
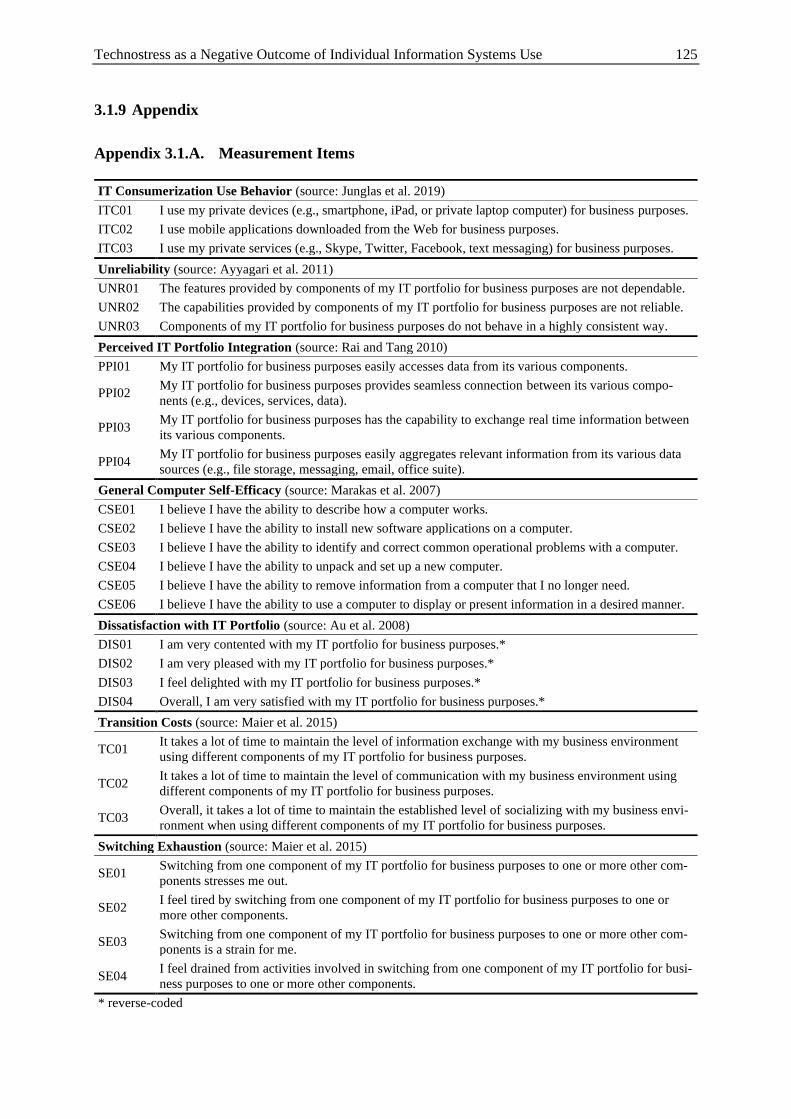
Technostress as a Negative Outcome of Individual Information Systems Use 125
3.1.9 Appendix
Appendix 3.1.A. Measurement Items
IT Consumerization Use Behavior (source: Junglas et al. 2019)
ITC01 I use my private devices (e.g., smartphone, iPad, or private laptop computer) for business purposes.
ITC02 I use mobile applications downloaded from the Web for business purposes.
ITC03 I use my private services (e.g., Skype, Twitter, Facebook, text messaging) for business purposes.
Unreliability (source: Ayyagari et al. 2011)
UNR01 The features provided by components of my IT portfolio for business purposes are not dependable.
UNR02 The capabilities provided by components of my IT portfolio for business purposes are not reliable.
UNR03 Components of my IT portfolio for business purposes do not behave in a highly consistent way.
Perceived IT Portfolio Integration (source: Rai and Tang 2010)
PPI01 My IT portfolio for business purposes easily accesses data from its various components.
PPI02 My IT portfolio for business purposes provides seamless connection between its various compo-
nents (e.g., devices, services, data).
PPI03 My IT portfolio for business purposes has the capability to exchange real time information between
its various components.
PPI04 My IT portfolio for business purposes easily aggregates relevant information from its various data
sources (e.g., file storage, messaging, email, office suite).
General Computer Self-Efficacy (source: Marakas et al. 2007)
CSE01 I believe I have the ability to describe how a computer works.
CSE02 I believe I have the ability to install new software applications on a computer.
CSE03 I believe I have the ability to identify and correct common operational problems with a computer.
CSE04 I believe I have the ability to unpack and set up a new computer.
CSE05 I believe I have the ability to remove information from a computer that I no longer need.
CSE06 I believe I have the ability to use a computer to display or present information in a desired manner.
Dissatisfaction with IT Portfolio (source: Au et al. 2008)
DIS01 I am very contented with my IT portfolio for business purposes.*
DIS02 I am very pleased with my IT portfolio for business purposes.*
DIS03 I feel delighted with my IT portfolio for business purposes.*
DIS04 Overall, I am very satisfied with my IT portfolio for business purposes.*
Transition Costs (source: Maier et al. 2015)
TC01 It takes a lot of time to maintain the level of information exchange with my business environment
using different components of my IT portfolio for business purposes.
TC02 It takes a lot of time to maintain the level of communication with my business environment using
different components of my IT portfolio for business purposes.
TC03 Overall, it takes a lot of time to maintain the established level of socializing with my business envi-
ronment when using different components of my IT portfolio for business purposes.
Switching Exhaustion (source: Maier et al. 2015)
SE01 Switching from one component of my IT portfolio for business purposes to one or more other com-
ponents stresses me out.
SE02 I feel tired by switching from one component of my IT portfolio for business purposes to one or
more other components.
SE03 Switching from one component of my IT portfolio for business purposes to one or more other com-
ponents is a strain for me.
SE04 I feel drained from activities involved in switching from one component of my IT portfolio for busi-
ness purposes to one or more other components.
* reverse-coded
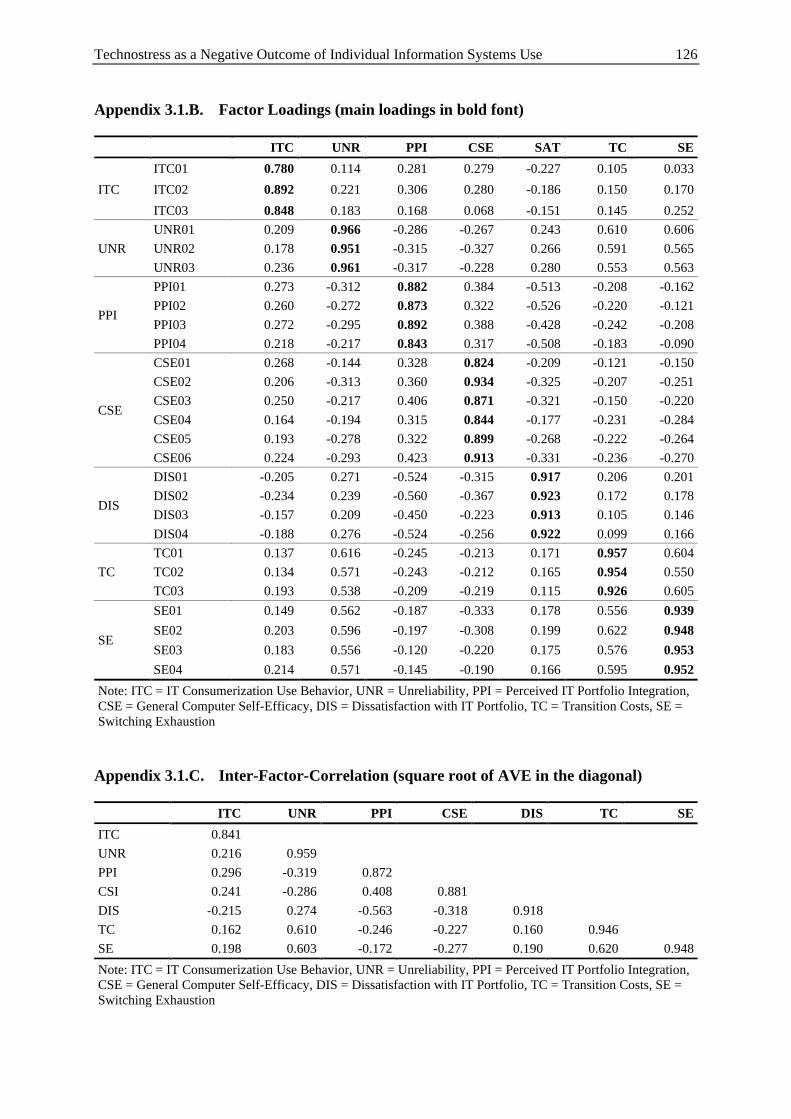
Technostress as a Negative Outcome of Individual Information Systems Use 126
Appendix 3.1.B. Factor Loadings (main loadings in bold font)
ITC UNR PPI CSE SAT TC SE
ITC
ITC01 0.780 0.114 0.281 0.279 -0.227 0.105 0.033
ITC02 0.892 0.221 0.306 0.280 -0.186 0.150 0.170
ITC03 0.848 0.183 0.168 0.068 -0.151 0.145 0.252
UNR
UNR01 0.209 0.966 -0.286 -0.267 0.243 0.610 0.606
UNR02 0.178 0.951 -0.315 -0.327 0.266 0.591 0.565
UNR03 0.236 0.961 -0.317 -0.228 0.280 0.553 0.563
PPI
PPI01 0.273 -0.312 0.882 0.384 -0.513 -0.208 -0.162
PPI02 0.260 -0.272 0.873 0.322 -0.526 -0.220 -0.121
PPI03 0.272 -0.295 0.892 0.388 -0.428 -0.242 -0.208
PPI04 0.218 -0.217 0.843 0.317 -0.508 -0.183 -0.090
CSE
CSE01 0.268 -0.144 0.328 0.824 -0.209 -0.121 -0.150
CSE02 0.206 -0.313 0.360 0.934 -0.325 -0.207 -0.251
CSE03 0.250 -0.217 0.406 0.871 -0.321 -0.150 -0.220
CSE04 0.164 -0.194 0.315 0.844 -0.177 -0.231 -0.284
CSE05 0.193 -0.278 0.322 0.899 -0.268 -0.222 -0.264
CSE06 0.224 -0.293 0.423 0.913 -0.331 -0.236 -0.270
DIS
DIS01 -0.205 0.271 -0.524 -0.315 0.917 0.206 0.201
DIS02 -0.234 0.239 -0.560 -0.367 0.923 0.172 0.178
DIS03 -0.157 0.209 -0.450 -0.223 0.913 0.105 0.146
DIS04 -0.188 0.276 -0.524 -0.256 0.922 0.099 0.166
TC
TC01 0.137 0.616 -0.245 -0.213 0.171 0.957 0.604
TC02 0.134 0.571 -0.243 -0.212 0.165 0.954 0.550
TC03 0.193 0.538 -0.209 -0.219 0.115 0.926 0.605
SE
SE01 0.149 0.562 -0.187 -0.333 0.178 0.556 0.939
SE02 0.203 0.596 -0.197 -0.308 0.199 0.622 0.948
SE03 0.183 0.556 -0.120 -0.220 0.175 0.576 0.953
SE04 0.214 0.571 -0.145 -0.190 0.166 0.595 0.952
Note: ITC = IT Consumerization Use Behavior, UNR = Unreliability, PPI = Perceived IT Portfolio Integration,
CSE = General Computer Self-Efficacy, DIS = Dissatisfaction with IT Portfolio, TC = Transition Costs, SE =
Switching Exhaustion
Appendix 3.1.C. Inter-Factor-Correlation (square root of AVE in the diagonal)
ITC UNR PPI CSE DIS TC SE
ITC 0.841
UNR 0.216 0.959
PPI 0.296 -0.319 0.872
CSI 0.241 -0.286 0.408 0.881
DIS -0.215 0.274 -0.563 -0.318 0.918
TC 0.162 0.610 -0.246 -0.227 0.160 0.946
SE 0.198 0.603 -0.172 -0.277 0.190 0.620 0.948
Note: ITC = IT Consumerization Use Behavior, UNR = Unreliability, PPI = Perceived IT Portfolio Integration,
CSE = General Computer Self-Efficacy, DIS = Dissatisfaction with IT Portfolio, TC = Transition Costs, SE =
Switching Exhaustion
Technostress as a Negative Outcome of Individual Information Systems Use 127
3.2 Considering Characteristic Profiles of Technologies at the Digital
Workplace: The Influence on Technostress
Abstract
Workplaces develop more and more to digital workplaces. However, this may lead to tech-
nostress. An understanding of the profiles of technologies used at the digital workplace, their
interplay, and how they influence technostress is valuable as it can assist developers of tech-
nologies and designers of workplaces to prevent technostress. Therefore, we analyze literature
and conduct expert interviews to identify ten characteristics of digital technologies that relate
to technostress. By analyzing data from 4,560 employees, we evaluate the characteristics. Fur-
thermore, we develop characteristic profiles of multiple technologies used at the respondent’s
digital workplace. Lastly, we investigate their influence on technostress creators using struc-
tural equation modeling. We find that the different portfolios of technology profiles influence
technostress creators in different manners. Our contributions are identifying additional charac-
teristics of digital technologies, showing the importance of investigating workplaces as a whole,
and highlighting design opportunities for health-oriented workplaces that alleviate technostress.
Keywords: Digital Technologies, Characteristics of Digital Technologies, Digital Workplace,
Technostress, Digital Stress, Mixed-Methods Research, Structural Equation Modeling
Authors: Dr. Julia Becker, Michelle Berger (M. Sc.), Prof. Dr. Henner Gimpel, Julia Lanzl
(M. Sc.), Dr. Christian Regal
Status: This article was presented at the 41st International Conference on Information Systems,
India 2020 and published in the conference proceedings.
Technostress as a Negative Outcome of Individual Information Systems Use 128
3.2.1 Introduction
Digitalization, driven by a wide variety of digital technologies, has led to multifaceted changes
for individuals, economies, and society (Fitzgerald et al. 2013; Gimpel et al. 2018a). Digital
technologies are ubiquitous in private but also in business lives. They have changed the work-
place from a narrowly defined and time-bound place to a partly virtual and temporally and
locally independent existence (Zuppo 2012). At the beginning of the year 2020, the COVID-19
pandemic led to the imposition of confinement or contact restrictions in many countries. Work
was transferred to home offices where possible. For many, this meant a new level of virtual
work. This may have a long-term impact on the equipment of many workplaces with digital
technologies and their use even after the end of the pandemic.
Digital technologies include devices like smartphones or tablets but also applications that can
facilitate business processes by providing tools for inter- and intra-organizational communica-
tion and collaboration (Zuppo 2012). Today’s workplace does not only consist of a single digital
technology but many, which enable effective ways of working, defined as a digital workplace
(Gartner 2020). The design of the digital workplace has become an important factor in increas-
ing the productivity of knowledge workers (Köffer 2015). However, the increased usage of
digital technologies in the changing world of work may cause stress, leading to potentially neg-
ative reactions in individuals. Research has noted this specific form of stress as technostress
(Ayyagari et al. 2011; Tarafdar et al. 2007; Tarafdar et al. 2011; Tarafdar et al. 2019), which
has first been introduced by clinical psychologist Craig Brod as “a modern disease [caused by
one’s] inability to cope with new computer technologies in a healthy manner” (Brod 1984,
p. 16).
In the last years, researchers focused on different aspects of technostress including technostress
creators (e.g., Tarafdar et al. 2007), strains (e.g., Gimpel et al. 2018b), technostress inhibitors
(e.g., Ragu-Nathan et al. 2008) and coping behaviors (e.g., Pirkkalainen et al. 2019). Ayyagari
et al. (2011) emphasized the question of which role the different characteristics of digital tech-
nologies play in terms of technostress. The characteristics of digital technologies refer to the
functional and non-functional features perceived by the user, which can be pursued directly or
indirectly. Many other researchers followed the call of Ayyagari et al. (2011) that their list of
proposed characteristics might not be exhaustive and that the introduction of new technologies
in the future might also result in new characteristics. Therefore, Maier et al. (2015) analyzed
characteristics of enterprise resource planning (ERP) systems, Salo et al. (2019) focused on
characteristics of social network services, and Hung et al. (2015) regarded mobile phone
Technostress as a Negative Outcome of Individual Information Systems Use 129
characteristics influencing technostress. In summary, there exist additional characteristics re-
sulting from further research focusing on specific technologies or contexts that extend the list
of Ayyagari et al. (2011). However, to eliminate the black box phenomenon between technol-
ogies and technostress, further research is needed. Currently, there is no research that uses the
extended list of characteristics to analyze their influence on technostress and no review of
whether there are also other characteristics beyond that.
Furthermore, Ayyagari et al. (2011) analyzed the influence of technology characteristics on
technostress by incorporating all digital technologies that are used at the workplace of their
respondents without referring to a specific technology. Therefore, it is not ensured that respond-
ents only think about one digital technology they use at work when answering the questionnaire.
Instead, it is conceivable that the respondents mix their perception of using many different dig-
ital technologies, maybe even with those they use at home. This is also one of the significant
drawbacks that Ayyagari et al. (2011) mentioned by themselves in their limitations section.
However, analyzing the relation between the characteristics of one specific technology and
technostress might seem to be by far more precise and concrete, as it does not mix-up and allow
for bias when participants have different technologies in mind. On the other side, it does not
properly reflect reality. Typically, people use a combination, and hence, the assessment of tech-
nostress incorporates the experiences with multiple digital technologies and not only with a
specific technology. However, there are no considerations to assess the characteristics of spe-
cific digital technologies building digital technology profiles in order to summarize these across
all technologies used at the user’s workplace to explain the connection with technostress. Re-
search on the design of digital workplaces examined people-focused and process-focused de-
sign approaches, in which information exchange and sharing documents or project support was
regarded, without the impact on technostress (Williams and Schubert 2018). Therefore, an un-
derstanding of characteristics of digital technologies, their interplay at the workplace, and how
they influence technostress will be valuable as it can assist developers of digital technologies
and designers of workplaces in a way that can prevent technostress.
Therefore, we aim to add to technostress literature by addressing the following three research
questions (RQ):
RQ1) Which characteristics of digital technologies with relation to technostress exist?
RQ2) How does the characteristic profile of specific digital technologies look like?
RQ3) What is the influence of characteristic profiles of digital technologies used at the
workplace on technostress?
Technostress as a Negative Outcome of Individual Information Systems Use 130
In order to answer our research questions, we apply mixed methods. First, we conceptualize the
relevant characteristics of digital technologies based on extant literature and qualitative re-
search. Next, to be able to evaluate the characteristics quantitatively, we collect existing items
scales, develop new multi-item scales where necessary, and perform an initial reliability and
validity test of our scales via card-sorting and a quantitative pre-test. Then, we further validate
the scales in a large-scale survey with both exploratory (EFA) and confirmatory factor analyses
(CFA). Based on survey data, we develop characteristic profiles of multiple specific technolo-
gies used at the respondent’s workplace and determine their influence on technostress using
structural equation modeling (SEM).
Our paper is structured as follows: Section 3.2.2 introduces the theoretical background, includ-
ing the characteristics of digital technologies that have already been found to influence tech-
nostress. Section 3.2.3 presents the methodology, while Section 3.2.4 describes the develop-
ment of the digital technology profiles based on interviews with experts and focus groups as
well as a survey with 4,560 users of digital technologies in different organizations. Section 3.2.5
analyzes the relationship between the developed digital technology profiles of specific technol-
ogies with technostress. Finally, section 3.2.6 discusses these results and concludes the paper.
3.2.2 Theoretical Background and Related Work
Digital workplaces are characterized by the set of digital technologies provided to execute one's
work effectively, irrespective of the location, and whether the task is performed alone or with
others (Williams and Schubert 2018). Bharadwaj et al. (2013, p. 471) define digital technolo-
gies as “combinations of information, computing, communication, and connectivity technolo-
gies” and refer to the importance of the interplay of digital technologies. Digital technologies
include social, mobile, analytics, and cloud technologies, as well as the internet of things, and
are known by the SMACIT acronym (Sebastian et al. 2017). Vial (2019) also includes plat-
forms, the internet, software, and blockchain to the term of digital technologies, whereas only
platforms are mentioned frequently in research articles (Tan et al. 2015; Tiwana et al. 2010).
Elements of a digital workplace include digital technologies accessible by every stakeholder
and interaction is possible without any physical limitations (Dahlan et al. 2018). The objective
of digital workplaces is to improve collaboration and communication in the organization and
has gained relevance in the past years (Yalina 2020). The design of a digital workplace is crucial
for the worker’s productivity, especially for knowledge workers (Köffer 2015; Yalina 2020).
People-focused and process-focused design principles exist, dealing with information exchange
and project support issues (Williams and Schubert 2018). Dery et al. (2017) illustrated how one
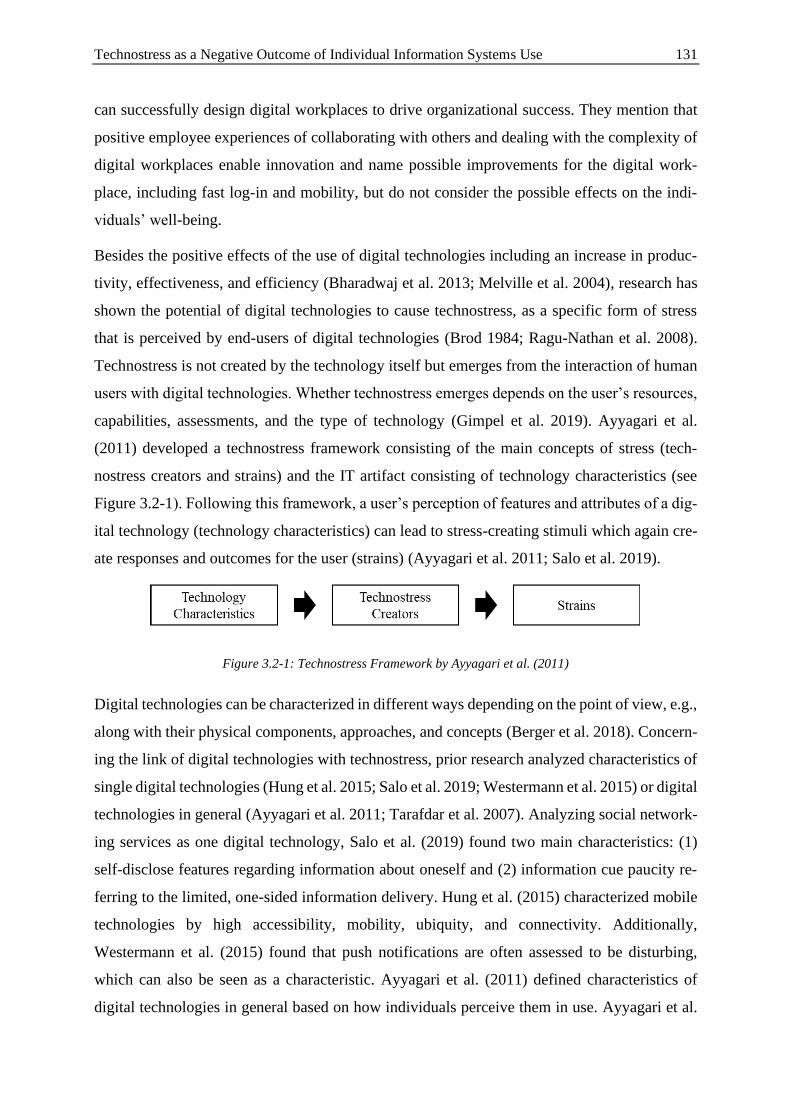
Technostress as a Negative Outcome of Individual Information Systems Use 131
can successfully design digital workplaces to drive organizational success. They mention that
positive employee experiences of collaborating with others and dealing with the complexity of
digital workplaces enable innovation and name possible improvements for the digital work-
place, including fast log-in and mobility, but do not consider the possible effects on the indi-
viduals’ well-being.
Besides the positive effects of the use of digital technologies including an increase in produc-
tivity, effectiveness, and efficiency (Bharadwaj et al. 2013; Melville et al. 2004), research has
shown the potential of digital technologies to cause technostress, as a specific form of stress
that is perceived by end-users of digital technologies (Brod 1984; Ragu-Nathan et al. 2008).
Technostress is not created by the technology itself but emerges from the interaction of human
users with digital technologies. Whether technostress emerges depends on the user’s resources,
capabilities, assessments, and the type of technology (Gimpel et al. 2019). Ayyagari et al.
(2011) developed a technostress framework consisting of the main concepts of stress (tech-
nostress creators and strains) and the IT artifact consisting of technology characteristics (see
Figure 3.2-1). Following this framework, a user’s perception of features and attributes of a dig-
ital technology (technology characteristics) can lead to stress-creating stimuli which again cre-
ate responses and outcomes for the user (strains) (Ayyagari et al. 2011; Salo et al. 2019).
Figure 3.2-1: Technostress Framework by Ayyagari et al. (2011)
Digital technologies can be characterized in different ways depending on the point of view, e.g.,
along with their physical components, approaches, and concepts (Berger et al. 2018). Concern-
ing the link of digital technologies with technostress, prior research analyzed characteristics of
single digital technologies (Hung et al. 2015; Salo et al. 2019; Westermann et al. 2015) or digital
technologies in general (Ayyagari et al. 2011; Tarafdar et al. 2007). Analyzing social network-
ing services as one digital technology, Salo et al. (2019) found two main characteristics: (1)
self-disclose features regarding information about oneself and (2) information cue paucity re-
ferring to the limited, one-sided information delivery. Hung et al. (2015) characterized mobile
technologies by high accessibility, mobility, ubiquity, and connectivity. Additionally,
Westermann et al. (2015) found that push notifications are often assessed to be disturbing,
which can also be seen as a characteristic. Ayyagari et al. (2011) defined characteristics of
digital technologies in general based on how individuals perceive them in use. Ayyagari et al.
Technostress as a Negative Outcome of Individual Information Systems Use 132
(2011) found six characteristics categorized in usability, dynamic, and intrusive features. Usa-
bility features are usefulness, complexity, and reliability. The single dynamic feature is the pace
of change. Intrusive features are presenteeism and anonymity. Adding to these six characteris-
tics, Tarafdar et al. (2019) mention mobility.
Regarding technostress creators, Tarafdar et al. (2007) and Ragu-Nathan et al. (2008) developed
and empirically validated scales for five factors, which create technostress among individuals.
The first dimension is techno-overload, describing situations where greater workload and
higher speed are caused by digital technologies. Secondly, techno-invasion describes the effect
of being constantly reachable and connected, leading to a blurring boundary between work and
private life. The third creator is called techno-complexity, which describes the feeling of not
having the needed skills and experiences to deal with the complexity of digital technologies and
being forced to spend time and effort in learning it. Techno-insecurity describes the fear of
losing one’s jobs due to automation or missing skills to deal with digital technologies. Lastly,
techno-uncertainty refers to the feeling of having to constantly develop one’s abilities and
knowledge due to continuing technology changes and upgrades.
Prior research has also pointed out the outcomes of technostress. The most recorded strain is
the negative effect on end-user satisfaction, followed by job satisfaction, performance, produc-
tivity, and organizational commitment (Sarabadani et al. 2018). Tarafdar et al. (2007) stated
that higher technostress results in lower productivity. Ragu-Nathan et al. (2008) showed that
technostress creators decrease job satisfaction as well as organizational and continuance com-
mitment. Both are emphasized by Tu et al. (2005), who found that next to lower productivity,
also higher employee turnover can result out of technostress. Concerning individuals’ health,
Mahapatra and Pati (2018) found that, in an Indian context, techno-invasion and techno-inse-
curity can lead to burnout which, in turn, is associated with several negative outcomes on the
organizational and individual level including lower productivity, job satisfaction, and higher
absenteeism as well as depression and anxiety (Maslach et al. 2001). For German employees,
Gimpel et al. (2018b) found that higher levels of technostress go along with a higher number
of people reporting to suffer from headaches, fatigue, sleeping problems, and exhaustion, for
example.
3.2.3 Research Process
As we strive to answer three interconnected questions, our research process is divided into three
parts, each of them applying a combination of various methods. We conduct a mixed-methods
Technostress as a Negative Outcome of Individual Information Systems Use 133
approach, as described by Venkatesh et al. (2013). It includes and integrates qualitative as well
as quantitative investigations, which, according to Venkatesh et al.’s (2013) scheme, serve de-
velopmental purposes.
First of all, we aim to identify the characteristics of digital technologies that relate to tech-
nostress. For identifying and conceptualizing the characteristics of digital technologies, we fol-
low steps one to six of the process of MacKenzie et al. (2011). We conduct a literature research
and interviews with experts and focus groups. Based on this, we develop multi-item survey
scales for the characteristics of specific digital technologies. The scales and individual items
are refined based on results from card-sorting regarding their content and face validity. Next,
we perform a pre-test and an exploratory factor analysis (EFA) and, again, refine the scales and
individual items.
Second, the resulting scales are then used in a large-scale quantitative survey. For the validation,
the data is split into two random subsets. On the first subset, an additional EFA is carried out
to examine the revised items. Finally, a confirmatory factor analysis (CFA) is performed on the
second subset to validate the scales. Furthermore, we used the data to calculate a normed char-
acteristics profile for specific technologies by aggregating the answers across many respond-
ents.
Third, as we argue that technostress does not solely depend on the usage of a single technology
but on the combination of all technologies used at the workplace, we, hence, use in the further
course the digital technology profiles of the used technologies at the respondents’ workplace.
Therefore, we use covariance-based structural equation modeling (SEM) to estimate the effect
on technostress.
3.2.4 The Development of Digital Technology Profiles
3.2.4.1 Theoretical Conceptualization
In order to build the foundation for our research, in a first step, we conducted a literature search.
The focus was to identify technologies and their characteristics in relation to technostress (cre-
ators). To cover the full picture, the search additionally comprised literature of linked outcomes
like stress and strain (including health and well-being). The list covered a broad picture of lit-
erature in different areas. Databases, namely EBSCO Business Source Premier, EBSCO Aca-
demic Search Premier, EBSCO Psych, Web of Science, and PubMed, were searched in the
languages English and German. Because the seminal paper by Tarafdar et al. (2007) was pub-
lished in 2007, only publications from this year onwards were included. The list of search
Technostress as a Negative Outcome of Individual Information Systems Use 134
strings is available in Appendix 3.2.A. Types of publications that were considered are (aca-
demic) journals, reviews, proceedings, books, book chapters, and dissertations. Overall, 273 ar-
ticles relevant for our research were identified.
To enrich the insights from the literature research, we interviewed practitioners and experts.
The semi-structured interview guideline included questions about technostress creators, tech-
nologies for which usage may cause stress, and technology characteristics, which the subjects
believed to cause stress and stressful usage behaviors. The complete interview guideline can be
found in Appendix 3.2.B. In total, 15 people participated in face-to-face interviews, including
employee and employer representatives, experts from occupational health management, ethics,
ergonomics, informatics, and human resource management. Each interview lasted between 30
and 90 minutes. The number of interviews was determined by content saturation, meaning in-
terviews were conducted until no new aspects were identified and named by our experts. Inter-
views were audio-recorded, transcribed, and continuously analyzed through MAXQDA with a
formalized coding strategy. Categories were built deductively because the interviews were
structured in sections with questions concerning technologies, their characteristics, and how
these exactly relate to technostress. These particular aspects guided the analysis to gain a better
understanding of the relationship.
Following on from this, six focus groups were conducted (between 5 and 8 participants each)
consisting of employees and managers from four different organizations (n = 33). The groups
covered different occupational groups and hierarchies. Participants were contacted by a respon-
sible from the respective company and were asked to take part voluntarily. The groups almost
got identical task descriptions to the experts. First, they named the technologies they use at the
workplace and their characteristics. They rated which of these caused the most stress. Besides,
they were asked for (short-term and long-term) consequences and successful strategies to cope
with the stress. The guideline for the focus group workshop is available in Appendix 3.2.C. The
aim was to get insights from the practical perspective and collect examples for aspects that were
named by our experts. All group discussions were recorded by an observer and the results doc-
umented in a picture protocol. Again, the results were written down, coded, and aggregated.
For the technologies, for example, categories were identified when they named one specific
software product (e.g., Edge as an example for an Internet browser).
The result of these steps is a conceptual understanding of nine characteristics of digital technol-
ogies relating to technostress. See Table 3.2-1 for their definition. Please note that in a later
quantitative pre-test, one characteristic (information provision) was split into two (push and
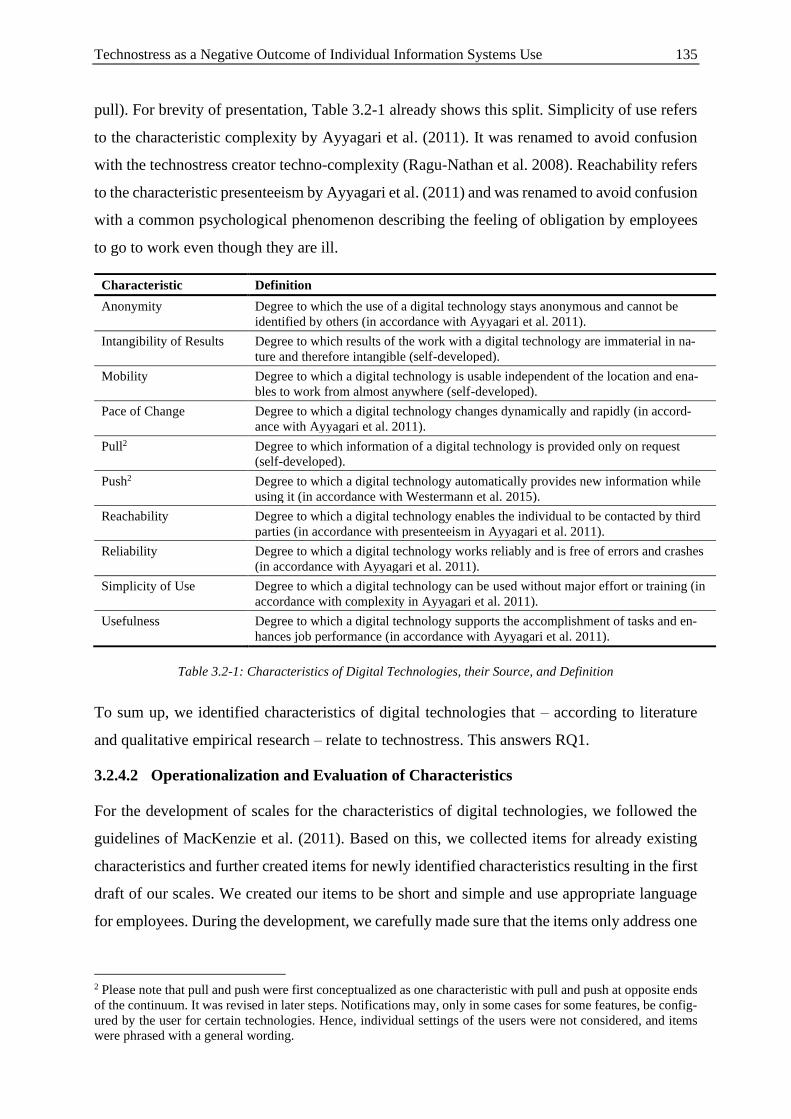
Technostress as a Negative Outcome of Individual Information Systems Use 135
pull). For brevity of presentation, Table 3.2-1 already shows this split. Simplicity of use refers
to the characteristic complexity by Ayyagari et al. (2011). It was renamed to avoid confusion
with the technostress creator techno-complexity (Ragu-Nathan et al. 2008). Reachability refers
to the characteristic presenteeism by Ayyagari et al. (2011) and was renamed to avoid confusion
with a common psychological phenomenon describing the feeling of obligation by employees
to go to work even though they are ill.
Characteristic Definition
Anonymity Degree to which the use of a digital technology stays anonymous and cannot be
identified by others (in accordance with Ayyagari et al. 2011).
Intangibility of Results Degree to which results of the work with a digital technology are immaterial in na-
ture and therefore intangible (self-developed).
Mobility Degree to which a digital technology is usable independent of the location and ena-
bles to work from almost anywhere (self-developed).
Pace of Change Degree to which a digital technology changes dynamically and rapidly (in accord-
ance with Ayyagari et al. 2011).
Pull2 Degree to which information of a digital technology is provided only on request
(self-developed).
Push2 Degree to which a digital technology automatically provides new information while
using it (in accordance with Westermann et al. 2015).
Reachability Degree to which a digital technology enables the individual to be contacted by third
parties (in accordance with presenteeism in Ayyagari et al. 2011).
Reliability Degree to which a digital technology works reliably and is free of errors and crashes
(in accordance with Ayyagari et al. 2011).
Simplicity of Use Degree to which a digital technology can be used without major effort or training (in
accordance with complexity in Ayyagari et al. 2011).
Usefulness Degree to which a digital technology supports the accomplishment of tasks and en-
hances job performance (in accordance with Ayyagari et al. 2011).
Table 3.2-1: Characteristics of Digital Technologies, their Source, and Definition
To sum up, we identified characteristics of digital technologies that – according to literature
and qualitative empirical research – relate to technostress. This answers RQ1.
3.2.4.2 Operationalization and Evaluation of Characteristics
For the development of scales for the characteristics of digital technologies, we followed the
guidelines of MacKenzie et al. (2011). Based on this, we collected items for already existing
characteristics and further created items for newly identified characteristics resulting in the first
draft of our scales. We created our items to be short and simple and use appropriate language
for employees. During the development, we carefully made sure that the items only address one
2 Please note that pull and push were first conceptualized as one characteristic with pull and push at opposite ends
of the continuum. It was revised in later steps. Notifications may, only in some cases for some features, be config-
ured by the user for certain technologies. Hence, individual settings of the users were not considered, and items
were phrased with a general wording.
Technostress as a Negative Outcome of Individual Information Systems Use 136
single aspect (i.e., no connection of different statements in one item) in order to prevent a con-
fusion of the respondent. Thereby, we also considered recommendations proposed by Podsakoff
et al. (2003) to avoid common method bias by “improving scale items” (Podsakoff et al. 2003,
p. 888). We used the anchor points of the existing rating scales to retain the interpretability and
comparability of the results with the existing studies.
To evaluate content validity, we conducted a card-sorting via an online matching task with
fellow researchers (n = 39) in which they were asked to map items to characteristics (definition
of the constructs) (Moore and Benbasat 1991). 85 % correct matches were defined as the min-
imum boundary for the retainment of an item. Out of the 26 items, 22 were mapped correctly
to the related construct by more than 85 % of the persons, so we did not change them. The
remaining four items were matched correctly by less than 85 % of the participants. Thus, we
changed the wording of these items to fit the corresponding construct better, provide more clar-
ity, and reduce ambiguity. This step of item generation finished with the revised scales.
To evaluate the structure of our scales and validate our reworked items, we conducted a pre-
test. 445 respondents who were acquired via an online panel took part in the study. The data
was collected anonymously as far as possible (some socio-demographic questions were in-
cluded to evaluate the quality of the intended sample). Participants were instructed to respond
honestly and gave informed consent to participation. This was done to further minimize com-
mon-method bias by “protecting respondent anonymity and reducing evaluation apprehension“
(Podsakoff et al. 2003, p. 888). This principle was applied to all data collection processes. To
get a better understanding of the participant’s digital workplace, each respondent of our survey
stated his or her usage of 40 technologies (Nüske et al. 2019), evaluated by 0 = “no usage”,
1 = “monthly usage”, 2 = “weekly usage”, 3 = “daily usage”, and 4 = “several times a day”.
The list of technologies included common hardware used at the workplace like a printer, laptop
or stationary phone, software like text, table, and presentation programs, simulation programs,
statistical and analysis tools, networks like cloud systems, intranet, WiFi, and technologies like
virtual augmented reality and mixed reality. Participants evaluated their perception regarding
the characteristics of one randomly selected technology that they used at least weekly. We de-
cided to give each participant only one technology to reduce dropouts due to the length of the
survey.
We performed an EFA (parallel analysis revealed nine factors that were extracted using princi-
pal axis factoring with an oblimin rotation) to carefully assess the quality of our questionnaire
and did a preliminary analysis of all scales. The result of this EFA properly reflected our
Technostress as a Negative Outcome of Individual Information Systems Use 137
assumption of the factor structure of the scales with nine underlying technology characteristics.
However, we faced some problems. First of all, we observed a few severe cross-loadings be-
tween the constructs simplicity of use and reliability. Also, we originally derived a bipolar con-
struct “information provision” that contained aspects about how digital technologies provide
users with information distinguishing whether the information has to be requested explicitly by
the user (pull) or whether they are provided automatically when available (push). Regarding
the issues with the properties of the items of this characteristic, we decided to redefine it and
created two separate scales for push and pull as they seem to be more than two ends of one
construct. The two scales refer to the original settings of the technologies. Items were phrased
with a general wording, that did not consider the individual settings of the user. In some cases,
of course, it is possible to adjust the individual settings (e.g., turn off notifications on the lock
screen of the smartphone) but this does not apply to all devices and features. In addition, organ-
izational policies possibly interact with personal preferences (e.g., a user may be able to set his
stationary telephone on mute, but he does not use this option because the supervisor expects
him/her to be reachable on the phone for customers). Finally, we revised the items accordingly.
To go on in our evaluation and validation process, we conducted a large-scale study distributing
a questionnaire that, among other things, contained our scales on characteristics of digital tech-
nologies. These were assessed with the same procedure as in the pre-test: each participant rated
the characteristics of one randomly drawn technology from the list of 40, which (s)he uses. To
evaluate the respondent's technostress level, the items belonging to the five technostress crea-
tors introduced by Tarafdar et al. (2007) and Ragu-Nathan et al. (2008), namely techno-over-
load, techno-invasion, techno-complexity, techno-insecurity, and techno-uncertainty were in-
cluded in the survey. This served the last step of our research to test for the influence of tech-
nology profiles on technostress. We acquired respondents for the surveys via an external re-
search panel focusing on German employees. Respondents were paid for participation in the
study. We included control variables to review the representability of our sample. These com-
prised gender, employment status, occupational title and sector, number of hours worked per
week, and education. The sample for the evaluation consisted of 4,560 respondents. The distri-
bution of participants was representative of the German working population with respect to the
control variables age, gender, and occupational sector.
We used a five-point Likert-type rating scale from 0 = “I do not agree at all” to 4 = “I totally
agree” to measure the technostress creators as well as the characteristics of digital technologies.
All questions were presented in German. If necessary, the items were translated. Therefore,
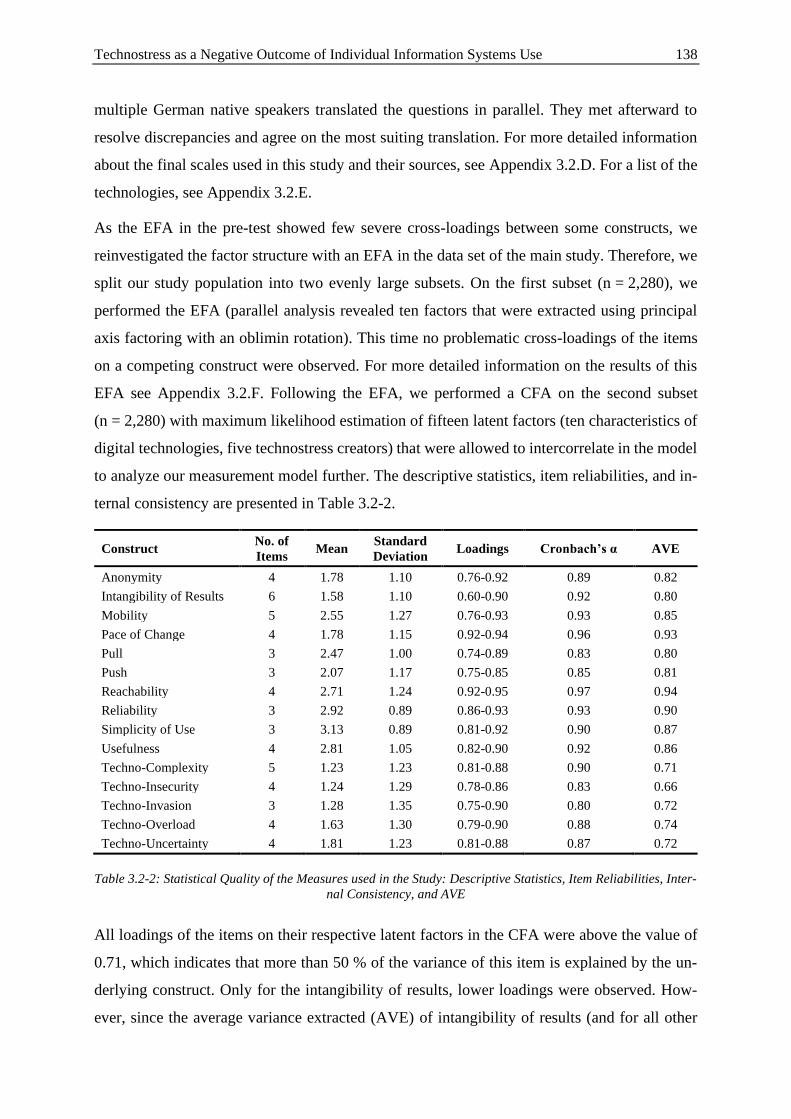
Technostress as a Negative Outcome of Individual Information Systems Use 138
multiple German native speakers translated the questions in parallel. They met afterward to
resolve discrepancies and agree on the most suiting translation. For more detailed information
about the final scales used in this study and their sources, see Appendix 3.2.D. For a list of the
technologies, see Appendix 3.2.E.
As the EFA in the pre-test showed few severe cross-loadings between some constructs, we
reinvestigated the factor structure with an EFA in the data set of the main study. Therefore, we
split our study population into two evenly large subsets. On the first subset (n = 2,280), we
performed the EFA (parallel analysis revealed ten factors that were extracted using principal
axis factoring with an oblimin rotation). This time no problematic cross-loadings of the items
on a competing construct were observed. For more detailed information on the results of this
EFA see Appendix 3.2.F. Following the EFA, we performed a CFA on the second subset
(n = 2,280) with maximum likelihood estimation of fifteen latent factors (ten characteristics of
digital technologies, five technostress creators) that were allowed to intercorrelate in the model
to analyze our measurement model further. The descriptive statistics, item reliabilities, and in-
ternal consistency are presented in Table 3.2-2.
Construct No. of
Items Mean
Standard
Deviation Loadings Cronbach’s α AVE
Anonymity 4 1.78 1.10 0.76-0.92 0.89 0.82
Intangibility of Results 6 1.58 1.10 0.60-0.90 0.92 0.80
Mobility 5 2.55 1.27 0.76-0.93 0.93 0.85
Pace of Change 4 1.78 1.15 0.92-0.94 0.96 0.93
Pull 3 2.47 1.00 0.74-0.89 0.83 0.80
Push 3 2.07 1.17 0.75-0.85 0.85 0.81
Reachability 4 2.71 1.24 0.92-0.95 0.97 0.94
Reliability 3 2.92 0.89 0.86-0.93 0.93 0.90
Simplicity of Use 3 3.13 0.89 0.81-0.92 0.90 0.87
Usefulness 4 2.81 1.05 0.82-0.90 0.92 0.86
Techno-Complexity 5 1.23 1.23 0.81-0.88 0.90 0.71
Techno-Insecurity 4 1.24 1.29 0.78-0.86 0.83 0.66
Techno-Invasion 3 1.28 1.35 0.75-0.90 0.80 0.72
Techno-Overload 4 1.63 1.30 0.79-0.90 0.88 0.74
Techno-Uncertainty 4 1.81 1.23 0.81-0.88 0.87 0.72
Table 3.2-2: Statistical Quality of the Measures used in the Study: Descriptive Statistics, Item Reliabilities, Inter-
nal Consistency, and AVE
All loadings of the items on their respective latent factors in the CFA were above the value of
0.71, which indicates that more than 50 % of the variance of this item is explained by the un-
derlying construct. Only for the intangibility of results, lower loadings were observed. How-
ever, since the average variance extracted (AVE) of intangibility of results (and for all other
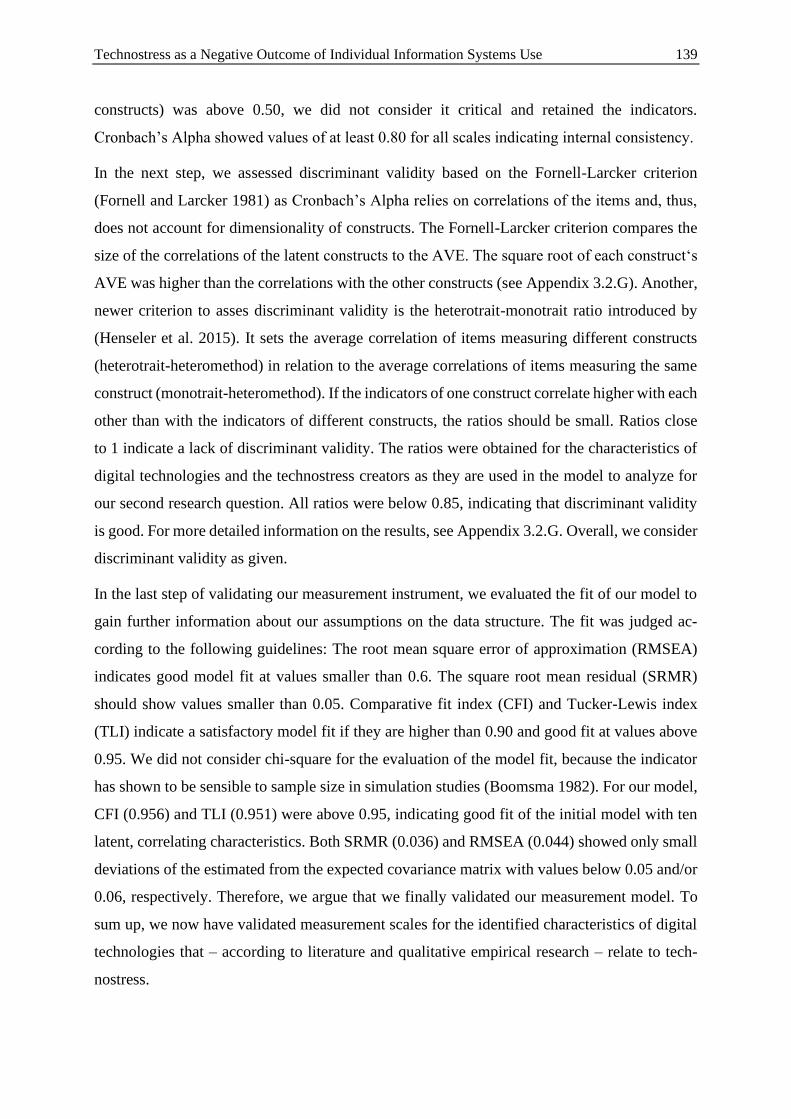
Technostress as a Negative Outcome of Individual Information Systems Use 139
constructs) was above 0.50, we did not consider it critical and retained the indicators.
Cronbach’s Alpha showed values of at least 0.80 for all scales indicating internal consistency.
In the next step, we assessed discriminant validity based on the Fornell-Larcker criterion
(Fornell and Larcker 1981) as Cronbach’s Alpha relies on correlations of the items and, thus,
does not account for dimensionality of constructs. The Fornell-Larcker criterion compares the
size of the correlations of the latent constructs to the AVE. The square root of each construct‘s
AVE was higher than the correlations with the other constructs (see Appendix 3.2.G). Another,
newer criterion to asses discriminant validity is the heterotrait-monotrait ratio introduced by
(Henseler et al. 2015). It sets the average correlation of items measuring different constructs
(heterotrait-heteromethod) in relation to the average correlations of items measuring the same
construct (monotrait-heteromethod). If the indicators of one construct correlate higher with each
other than with the indicators of different constructs, the ratios should be small. Ratios close
to 1 indicate a lack of discriminant validity. The ratios were obtained for the characteristics of
digital technologies and the technostress creators as they are used in the model to analyze for
our second research question. All ratios were below 0.85, indicating that discriminant validity
is good. For more detailed information on the results, see Appendix 3.2.G. Overall, we consider
discriminant validity as given.
In the last step of validating our measurement instrument, we evaluated the fit of our model to
gain further information about our assumptions on the data structure. The fit was judged ac-
cording to the following guidelines: The root mean square error of approximation (RMSEA)
indicates good model fit at values smaller than 0.6. The square root mean residual (SRMR)
should show values smaller than 0.05. Comparative fit index (CFI) and Tucker-Lewis index
(TLI) indicate a satisfactory model fit if they are higher than 0.90 and good fit at values above
0.95. We did not consider chi-square for the evaluation of the model fit, because the indicator
has shown to be sensible to sample size in simulation studies (Boomsma 1982). For our model,
CFI (0.956) and TLI (0.951) were above 0.95, indicating good fit of the initial model with ten
latent, correlating characteristics. Both SRMR (0.036) and RMSEA (0.044) showed only small
deviations of the estimated from the expected covariance matrix with values below 0.05 and/or
0.06, respectively. Therefore, we argue that we finally validated our measurement model. To
sum up, we now have validated measurement scales for the identified characteristics of digital
technologies that – according to literature and qualitative empirical research – relate to tech-
nostress.
Technostress as a Negative Outcome of Individual Information Systems Use 140
To confirm this ten-factor structure, a nested model comparison was conducted. The simpler
model comprised nine latent factors (interim result from the first EFA in pre-test, reapplied to
data from the main study) where all items of the two factors simplicity of use and reliability
loaded on the same, common construct. A chi-square difference test revealed significant better
fit (χ2Model1
= 5277.18, χ2Model2 = 3327.98, dfModel1 = 651, dfModel2 = 657, Δχ2 = -1949.20) of the
model with ten latent factors. The fit indices are displayed in Table 3.2-3.
Model CFI TLI RMSEA SRMR
Nine Factors – Model 1 0.924 0.914 0.059 0.041
Ten Factors – Model 2 0.956 0.951 0.044 0.036
Table 3.2-3: Nested-Model Comparison of the Measurement Model for the Technology Characteristics
3.2.4.3 Profiles of Digital Technologies based on their Characteristics
To get a better understanding of the differences between technologies with respect to their char-
acteristics, we created a profile for each of the 40 digital technologies from our list. Each profile
line consists of the means of all ten characteristics that were evaluated for this one specific
technology. We argue that the characteristic of a digital technology that is used more frequently
has a higher impact on the overall perceived characteristics of digital technologies. Therefore,
we only regarded the responses of persons that used this specific technology at least once a day.
We then calculated a mean score for the ten characteristics. See Table 3.2-4 for examples.
From the overall list of 40 technologies, some had to be excluded for the profiles. Due to the
randomized choice which technology the respondent was asked to evaluate, group sizes were
in some cases below 30. These were considered too small to provide unbiased information. For
example, 86 used augmented, virtual and mixed reality daily, but only ten respondents were
asked to evaluate its characteristics due to the randomized sampling. All profiles with means
and standard deviations are provided in Table 3.2-4. The table shows how different technolo-
gies are perceived by users. It is important to note that these perceptions are from users, that is,
they are conditional on the respondent working in a job where the employer assumes a task-
technology fit and, thus, provides the technology. Cash systems have a higher perceived use-
fulness than statistics software to pick just one example. Likely, only few people use both types
of systems. The perceptions originate from different people in different jobs. Five profiles are
visually displayed in Figure 3.2-2 to highlight similarities and differences. For example,
smartphones enable mobile working represented by high values of mobility. The same applies
to emails because usually, these can be checked on the run with the smartphone. However, in
contrast to smartphones, emails have a rather low pace of change. A new smartphone is released
Technostress as a Negative Outcome of Individual Information Systems Use 141
almost every other week by different companies, whereas the functionality of the email program
remains the same as ten years ago (Figure 3.2-2).
To sum up, we now have profiles of the 26 most important (i.e., common and frequently used)
workplace technologies along with the characteristics that – according to literature and qualita-
tive empirical research – relate to technostress. This answers RQ2.
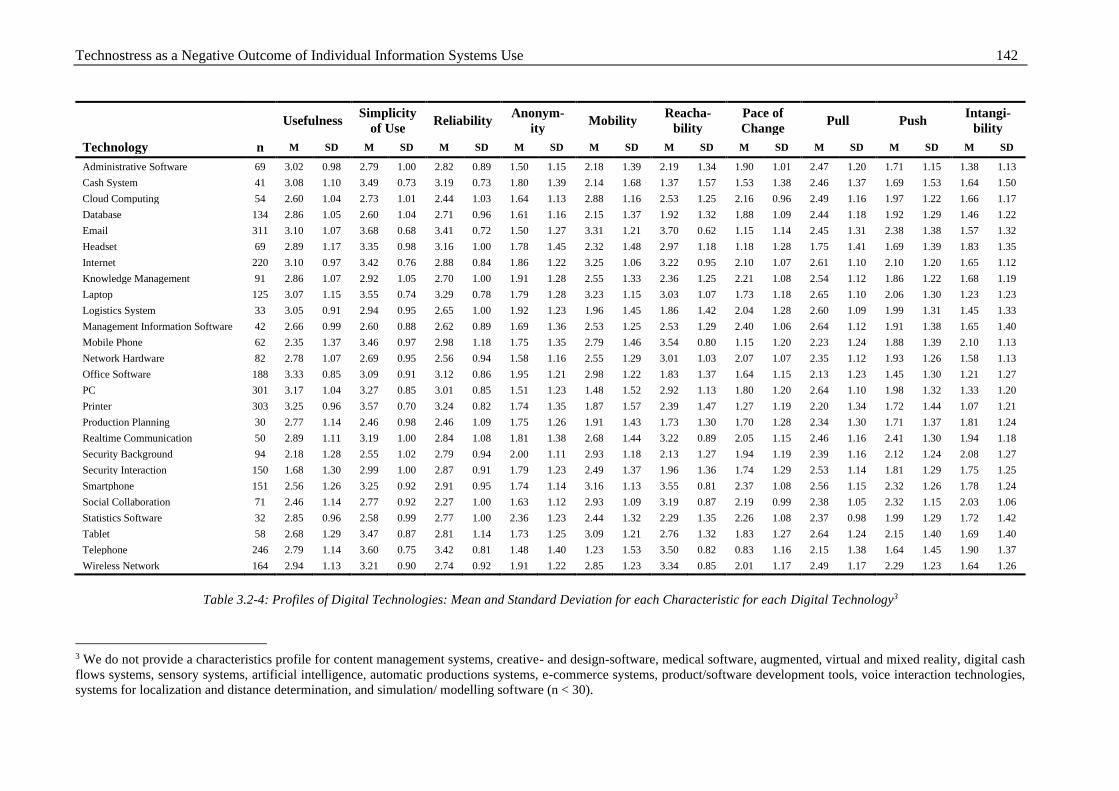
Technostress as a Negative Outcome of Individual Information Systems Use 142
Usefulness Simplicity
of Use Reliability
Anonym-
ity Mobility
Reacha-
bility
Pace of
Change Pull Push
Intangi-
bility
Technology n M SD M SD M SD M SD M SD M SD M SD M SD M SD M SD
Administrative Software 69 3.02 0.98 2.79 1.00 2.82 0.89 1.50 1.15 2.18 1.39 2.19 1.34 1.90 1.01 2.47 1.20 1.71 1.15 1.38 1.13
Cash System 41 3.08 1.10 3.49 0.73 3.19 0.73 1.80 1.39 2.14 1.68 1.37 1.57 1.53 1.38 2.46 1.37 1.69 1.53 1.64 1.50
Cloud Computing 54 2.60 1.04 2.73 1.01 2.44 1.03 1.64 1.13 2.88 1.16 2.53 1.25 2.16 0.96 2.49 1.16 1.97 1.22 1.66 1.17
Database 134 2.86 1.05 2.60 1.04 2.71 0.96 1.61 1.16 2.15 1.37 1.92 1.32 1.88 1.09 2.44 1.18 1.92 1.29 1.46 1.22
Email 311 3.10 1.07 3.68 0.68 3.41 0.72 1.50 1.27 3.31 1.21 3.70 0.62 1.15 1.14 2.45 1.31 2.38 1.38 1.57 1.32
Headset 69 2.89 1.17 3.35 0.98 3.16 1.00 1.78 1.45 2.32 1.48 2.97 1.18 1.18 1.28 1.75 1.41 1.69 1.39 1.83 1.35
Internet 220 3.10 0.97 3.42 0.76 2.88 0.84 1.86 1.22 3.25 1.06 3.22 0.95 2.10 1.07 2.61 1.10 2.10 1.20 1.65 1.12
Knowledge Management 91 2.86 1.07 2.92 1.05 2.70 1.00 1.91 1.28 2.55 1.33 2.36 1.25 2.21 1.08 2.54 1.12 1.86 1.22 1.68 1.19
Laptop 125 3.07 1.15 3.55 0.74 3.29 0.78 1.79 1.28 3.23 1.15 3.03 1.07 1.73 1.18 2.65 1.10 2.06 1.30 1.23 1.23
Logistics System 33 3.05 0.91 2.94 0.95 2.65 1.00 1.92 1.23 1.96 1.45 1.86 1.42 2.04 1.28 2.60 1.09 1.99 1.31 1.45 1.33
Management Information Software 42 2.66 0.99 2.60 0.88 2.62 0.89 1.69 1.36 2.53 1.25 2.53 1.29 2.40 1.06 2.64 1.12 1.91 1.38 1.65 1.40
Mobile Phone 62 2.35 1.37 3.46 0.97 2.98 1.18 1.75 1.35 2.79 1.46 3.54 0.80 1.15 1.20 2.23 1.24 1.88 1.39 2.10 1.13
Network Hardware 82 2.78 1.07 2.69 0.95 2.56 0.94 1.58 1.16 2.55 1.29 3.01 1.03 2.07 1.07 2.35 1.12 1.93 1.26 1.58 1.13
Office Software 188 3.33 0.85 3.09 0.91 3.12 0.86 1.95 1.21 2.98 1.22 1.83 1.37 1.64 1.15 2.13 1.23 1.45 1.30 1.21 1.27
PC 301 3.17 1.04 3.27 0.85 3.01 0.85 1.51 1.23 1.48 1.52 2.92 1.13 1.80 1.20 2.64 1.10 1.98 1.32 1.33 1.20
Printer 303 3.25 0.96 3.57 0.70 3.24 0.82 1.74 1.35 1.87 1.57 2.39 1.47 1.27 1.19 2.20 1.34 1.72 1.44 1.07 1.21
Production Planning 30 2.77 1.14 2.46 0.98 2.46 1.09 1.75 1.26 1.91 1.43 1.73 1.30 1.70 1.28 2.34 1.30 1.71 1.37 1.81 1.24
Realtime Communication 50 2.89 1.11 3.19 1.00 2.84 1.08 1.81 1.38 2.68 1.44 3.22 0.89 2.05 1.15 2.46 1.16 2.41 1.30 1.94 1.18
Security Background 94 2.18 1.28 2.55 1.02 2.79 0.94 2.00 1.11 2.93 1.18 2.13 1.27 1.94 1.19 2.39 1.16 2.12 1.24 2.08 1.27
Security Interaction 150 1.68 1.30 2.99 1.00 2.87 0.91 1.79 1.23 2.49 1.37 1.96 1.36 1.74 1.29 2.53 1.14 1.81 1.29 1.75 1.25
Smartphone 151 2.56 1.26 3.25 0.92 2.91 0.95 1.74 1.14 3.16 1.13 3.55 0.81 2.37 1.08 2.56 1.15 2.32 1.26 1.78 1.24
Social Collaboration 71 2.46 1.14 2.77 0.92 2.27 1.00 1.63 1.12 2.93 1.09 3.19 0.87 2.19 0.99 2.38 1.05 2.32 1.15 2.03 1.06
Statistics Software 32 2.85 0.96 2.58 0.99 2.77 1.00 2.36 1.23 2.44 1.32 2.29 1.35 2.26 1.08 2.37 0.98 1.99 1.29 1.72 1.42
Tablet 58 2.68 1.29 3.47 0.87 2.81 1.14 1.73 1.25 3.09 1.21 2.76 1.32 1.83 1.27 2.64 1.24 2.15 1.40 1.69 1.40
Telephone 246 2.79 1.14 3.60 0.75 3.42 0.81 1.48 1.40 1.23 1.53 3.50 0.82 0.83 1.16 2.15 1.38 1.64 1.45 1.90 1.37
Wireless Network 164 2.94 1.13 3.21 0.90 2.74 0.92 1.91 1.22 2.85 1.23 3.34 0.85 2.01 1.17 2.49 1.17 2.29 1.23 1.64 1.26
Table 3.2-4: Profiles of Digital Technologies: Mean and Standard Deviation for each Characteristic for each Digital Technology3
3 We do not provide a characteristics profile for content management systems, creative- and design-software, medical software, augmented, virtual and mixed reality, digital cash
flows systems, sensory systems, artificial intelligence, automatic productions systems, e-commerce systems, product/software development tools, voice interaction technologies,
systems for localization and distance determination, and simulation/ modelling software (n < 30).
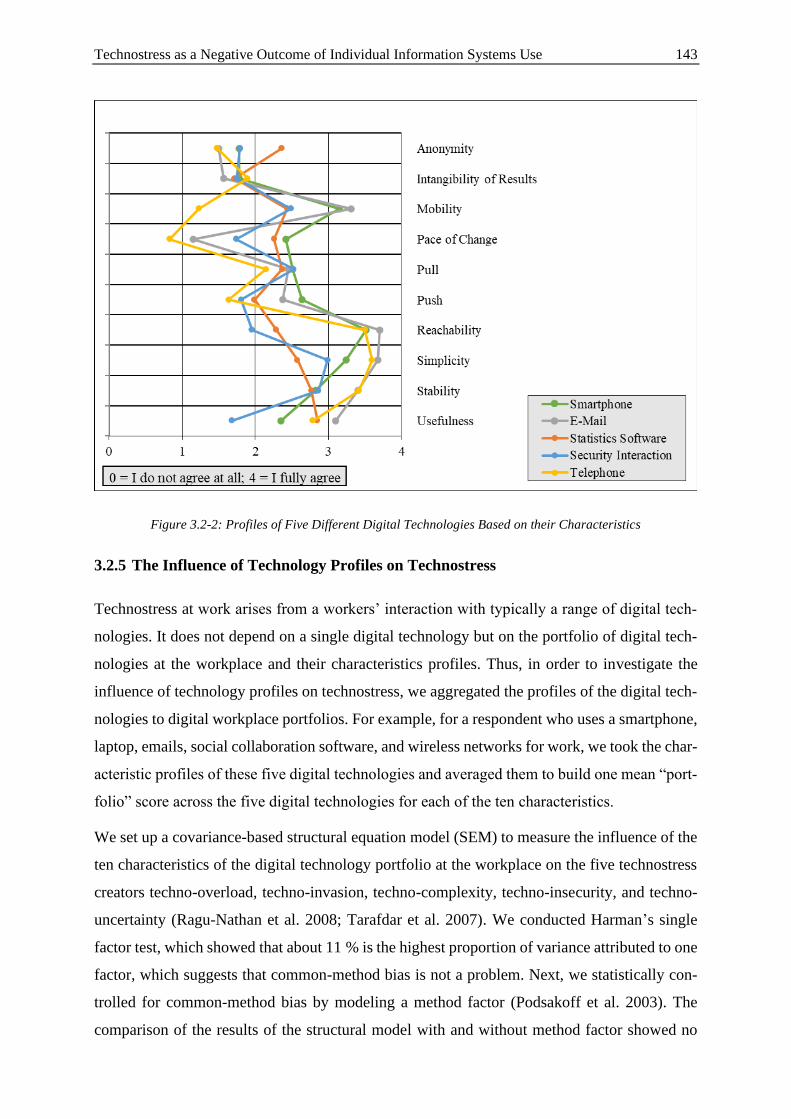
Technostress as a Negative Outcome of Individual Information Systems Use 143
Figure 3.2-2: Profiles of Five Different Digital Technologies Based on their Characteristics
3.2.5 The Influence of Technology Profiles on Technostress
Technostress at work arises from a workers’ interaction with typically a range of digital tech-
nologies. It does not depend on a single digital technology but on the portfolio of digital tech-
nologies at the workplace and their characteristics profiles. Thus, in order to investigate the
influence of technology profiles on technostress, we aggregated the profiles of the digital tech-
nologies to digital workplace portfolios. For example, for a respondent who uses a smartphone,
laptop, emails, social collaboration software, and wireless networks for work, we took the char-
acteristic profiles of these five digital technologies and averaged them to build one mean “port-
folio” score across the five digital technologies for each of the ten characteristics.
We set up a covariance-based structural equation model (SEM) to measure the influence of the
ten characteristics of the digital technology portfolio at the workplace on the five technostress
creators techno-overload, techno-invasion, techno-complexity, techno-insecurity, and techno-
uncertainty (Ragu-Nathan et al. 2008; Tarafdar et al. 2007). We conducted Harman’s single
factor test, which showed that about 11 % is the highest proportion of variance attributed to one
factor, which suggests that common-method bias is not a problem. Next, we statistically con-
trolled for common-method bias by modeling a method factor (Podsakoff et al. 2003). The
comparison of the results of the structural model with and without method factor showed no
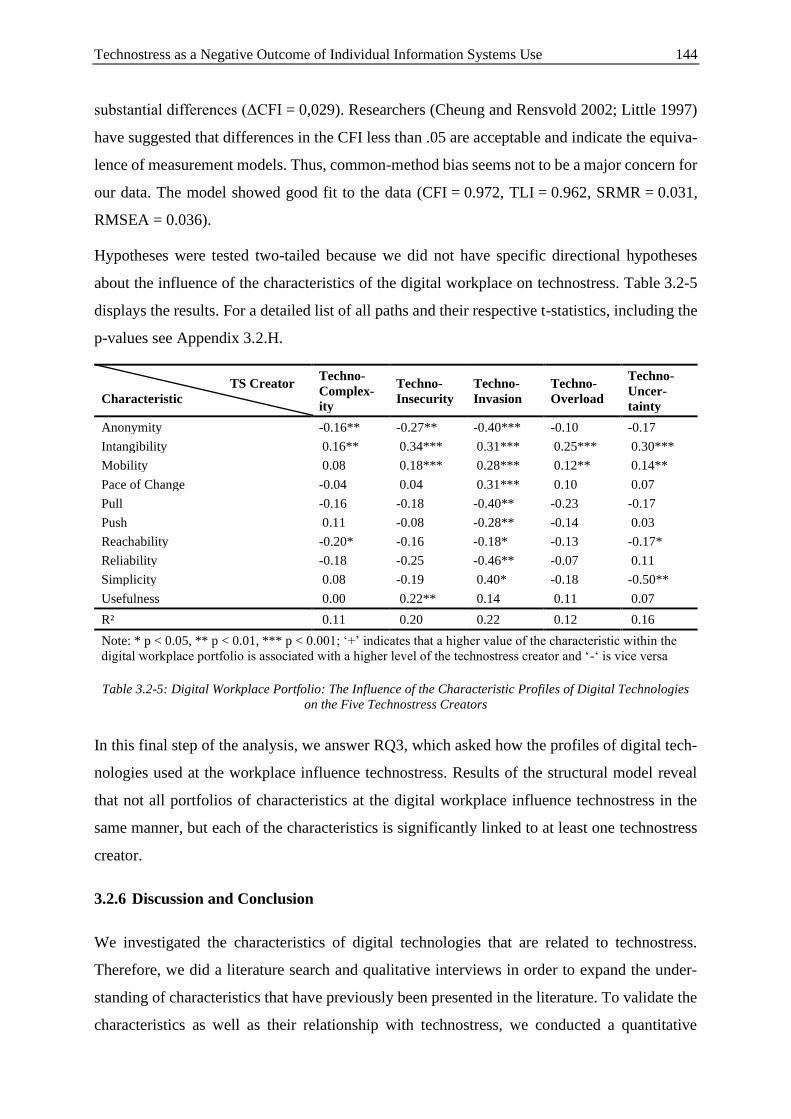
Technostress as a Negative Outcome of Individual Information Systems Use 144
substantial differences (ΔCFI = 0,029). Researchers (Cheung and Rensvold 2002; Little 1997)
have suggested that differences in the CFI less than .05 are acceptable and indicate the equiva-
lence of measurement models. Thus, common-method bias seems not to be a major concern for
our data. The model showed good fit to the data (CFI = 0.972, TLI = 0.962, SRMR = 0.031,
RMSEA = 0.036).
Hypotheses were tested two-tailed because we did not have specific directional hypotheses
about the influence of the characteristics of the digital workplace on technostress. Table 3.2-5
displays the results. For a detailed list of all paths and their respective t-statistics, including the
p-values see Appendix 3.2.H.
TS Creator
Characteristic
Techno-
Complex-
ity
Techno-
Insecurity
Techno-
Invasion
Techno-
Overload
Techno-
Uncer-
tainty
Anonymity -0.16** -0.27** -0.40*** -0.10 -0.17
Intangibility 0.16** 0.34*** 0.31*** 0.25*** 0.30***
Mobility 0.08 0.18*** 0.28*** 0.12** 0.14**
Pace of Change -0.04 0.04 0.31*** 0.10 0.07
Pull -0.16 -0.18 -0.40** -0.23 -0.17
Push 0.11 -0.08 -0.28** -0.14 0.03
Reachability -0.20* -0.16 -0.18* -0.13 -0.17*
Reliability -0.18 -0.25 -0.46** -0.07 0.11
Simplicity 0.08 -0.19 0.40* -0.18 -0.50**
Usefulness 0.00 0.22** 0.14 0.11 0.07
R² 0.11 0.20 0.22 0.12 0.16
Note: * p < 0.05, ** p < 0.01, *** p < 0.001; ‘+’ indicates that a higher value of the characteristic within the
digital workplace portfolio is associated with a higher level of the technostress creator and ‘-‘ is vice versa
Table 3.2-5: Digital Workplace Portfolio: The Influence of the Characteristic Profiles of Digital Technologies
on the Five Technostress Creators
In this final step of the analysis, we answer RQ3, which asked how the profiles of digital tech-
nologies used at the workplace influence technostress. Results of the structural model reveal
that not all portfolios of characteristics at the digital workplace influence technostress in the
same manner, but each of the characteristics is significantly linked to at least one technostress
creator.
3.2.6 Discussion and Conclusion
We investigated the characteristics of digital technologies that are related to technostress.
Therefore, we did a literature search and qualitative interviews in order to expand the under-
standing of characteristics that have previously been presented in the literature. To validate the
characteristics as well as their relationship with technostress, we conducted a quantitative
Technostress as a Negative Outcome of Individual Information Systems Use 145
survey study. We used structural equation modelling to reveal the characteristics’ relationship
with technostress creators. The results answer our three research questions by showing the ex-
istence of ten characteristics of digital technologies related to technostress, profiling 26 com-
mon workplace technologies along the ten characteristics, and relating the digital workplace
portfolio with technostress creators.
In terms of revealing characteristics of digital technologies with relation to technostress crea-
tors, we found evidence for ten different characteristics. Each technology characteristic relates
to at least one technostress creator and each technostress creator to at least two characteristics.
In this dense web of relationships, we found that anonymity is negatively related to complexity,
insecurity, and invasion. For insecurity, for example, this means that if the users may use their
technologies anonymously without leaving traces of their usage behavior, employees fear to
lose their jobs less as they less feel their work activities to be monitored. Intangibility of results
is positively associated with all five technostress creators. Again, for insecurity, this relation-
ship is understandable as employees experience more fear of losing their jobs if they do not see
the results of their work and thereby feel no progress in accomplishing their tasks. Regarding
these two results concerning insecurity in combination this could be interpreted in the following
way: With high intangibility of results, employees might experience a lack of productivity and
they fear losing their job because this seemingly poor performance could be controlled or
traced, for example by the supervisor, if a system does not allow anonymous usage. For mobil-
ity, we found positive relations with insecurity, invasion, overload, and uncertainty. With regard
to invasion, this may be because mobile workplaces allow individuals for more flexibility in
doing their tasks. Therefore, they may experience a stronger feeling of blurring boundaries be-
tween job and private life, resulting in higher levels of perceived invasion. Pace of change is
only related to invasion and the relationship is positive, meaning that a high pace of change
increases the feeling of one's life being invaded with digital technologies. This may be because
employees have to use their non-work times (e.g., weekends) in order to deal with the newly
changed digital technologies and learn how to use them and, thus, feel their private lives as
being invaded by digital technologies. In contrast to pace of change, pull as well as push is
negatively linked with invasion. For pull, this relationship may be because individuals actively
have to access information via their digital workplace portfolio and, thus, are more in control
of when they want to do so. For push, however, in the first sense, one would expect a positive
link to invasion. But we argue that, if individuals know that their digital technologies will notify
the individuals about important work issues, they do not have to constantly check their
Technostress as a Negative Outcome of Individual Information Systems Use 146
smartphone or other digital technologies for important updates and, thus, can mentally discon-
nect from their job when being with their family. Reachability is negatively associated with
complexity, invasion, and uncertainty. One possible interpretation of the decreasing uncertainty
could be that people who are well reachable (i.e., due to their position) will inevitably interact
and deal with the technology permanently, which means that they have little uncertainty in
using it. For reliability, we only found a negative relation to invasion. Simplicity is linked with
invasion and uncertainty. For invasion, the relation is positive, whereas, for uncertainty, it is
negative. Interestingly, simplicity does not affect complexity. Lastly and unexpectedly, useful-
ness is positively related to insecurity. At this point, further research is needed to better under-
stand and interpret the relationship.
Our paper contributes to theory in several ways. Our first contribution is the identification and
definition of further characteristics of digital technologies that affect technostress at an individ-
ual’s workplace, including measurement scales for the newly added characteristics. Placing
these newly identified characteristics side by side with the ones from extant literature (esp. from
Ayyagari et al. 2011), our paper presents the most holistic set of technology characteristics
related to technostress. Further, to the best of our knowledge, we are the first to combine the
characteristics of Ayyagari et al. (2011) with the technostress creators of Ragu-Nathan et al.
(2008) and thereby can show their relationships. With this broader understanding of character-
istics, future research can investigate the influence of digitalization on technostress in more
detail.
Second, we show that it is important to investigate the workplace as a whole based on the port-
folio of technologies at the workplace. Prior research either investigates individual technologies
(e.g., Hung et al. 2015; Maier et al. 2015; Salo et al. 2019) or the entire digital workplace with-
out considering the individual technologies at work (e.g., Ragu-Nathan et al. 2008; Tarafdar et
al. 2007). We take an intermediate way considering all major individual digital technologies at
the workplace. We build technology profiles on the individuals’ perception of characteristics
and not by asking technology experts. Stress is a construct that builds on the perception of a
situation and the individual’s own ability to cope with a certain situation. Therefore, from the
individual’s point of view, the perceived characteristics of digital technologies at the workplace
are key because stress is neither solely anchored in the environment and its demands nor solely
in the person characteristics (Lazarus and Folkman 1984). Asking users rather than design ex-
perts seems appropriate according to adaptive structuration theory (DeSanctis and Poole 1994).
Outcomes of the use of advanced information technology do not only depend on the structure
Technostress as a Negative Outcome of Individual Information Systems Use 147
of the technology but also the social interaction of the user with the technology (which can be
different than intended by the designer also depending on the organizational practices and
norms). These profiles were put together to an individual portfolio consisting the mean charac-
teristics of the different technologies each employee uses at his/her own workplace. This pro-
vides a more holistic picture than looking at only a single technology; further, it allows to trace
the effects on technostress back to characteristics and from there to individual technologies
rather than considering technologies at the workplace as monolithic.
Third and last, we give evidence on the relationship of the characteristics with different tech-
nostress creators instead of technostress in general. This more detailed understanding can help
future research to develop specific preventive measures and coping strategies for concrete tech-
nostress creators at concrete workplaces. In sum, the identification and measurement of char-
acteristics of digital technologies along with knowledge on their effect on technostress enable
future research to cluster technologies and evaluate different technologies and workplaces
based on their impact on technostress. Future research could consider whether the technology
profiles prove to be consistent among demographic and cultural differences. Also, the size of
the technology profile combined with the intensity of usage or additional moderating charac-
teristics influencing technostress can be analyzed.
The results of this study also provide implications for practice. Since prior research has shown
the negative effects of technostress, including lower productivity and lower job satisfaction,
organizations should aim to prevent and lower the level of technostress of their employees.
Based on our developed items for characteristics of digital technologies, digital workplaces can
be evaluated on their possible susceptibility to technostress, by for example identifying tech-
nologies that outshine the positive characteristics of other digital technologies in terms of tech-
nostress. This is important as we were able to show that the combination of technologies and
their aggregated mean characteristics are associated with technostress creators. The combina-
tion of technologies matters as one technology with its characteristics can distort the overall
sensation and lead to technostress.
Workplace designers should focus on usability features, including usefulness, simplicity of use,
and reliability, but also on technologies that enable mobility and pull configurations. When
individual technostress creators are of specific concern for a given workplace or company, the
guidance becomes more nuanced on which characteristics to look out for and which technolo-
gies have a favorable profile regarding these characteristics. Besides, individuals can affect
their levels of technostress by adjusting their workplace technologies. Therefore, employers
Technostress as a Negative Outcome of Individual Information Systems Use 148
also should give their employees the flexibility of configuring their digital technologies in a
way that is most beneficial for each individual.
However, there are limitations to our research. Each respondent to the survey assessed only the
characteristics of one digital technology and not the characteristics of the digital technologies
at her or his entire workplace. However, since our sample is of a high number, we were able to
assign the perception of the characteristics between subjects.
Despite these limitations, our results add to a broader understanding of characteristics of digital
technologies at an individual’s workplace, not only by extending the number of characteristics
that were already known but also by revealing the structure among them as well as their effect
on technostress creators.
Technostress as a Negative Outcome of Individual Information Systems Use 149
3.2.7 References
Ayyagari, R., Grover, V., and Purvis, R. 2011. “Technostress: Technological Antecedents and
Implications,” Management Information Systems Quarterly (35:4), pp. 831-858.
Berger, S., Denner, M.-S., and Röglinger, M. 2018. “The Nature of Digital Technologies: De-
velopment of a Multi-Layer Taxonomy,” in Proceedings of the 26th European Conference
on Information Systems, Portsmouth, UK, pp. 1-18.
Bharadwaj, A., El Sawy, O. A., Pavlou, P. A., and Venkatraman, N. 2013. “Digital Business
Strategy: Toward a Next Generation of Insights,” Management Information Systems Quar-
terly (37:2), pp. 471-482.
Boomsma, A. 1982. “The Robustness of LISREL against Small Sample Sizes in Factor Analy-
sis Models,” pp. 149-173.
Brod, C. 1984. Technostress: The Human Cost of the Computer Revolution, Reading, Mass.:
Addison-Wesley.
Cheung, G. W., and Rensvold, R. B. 2002. “Evaluating Goodness-of-Fit Indexes for Testing
Measurement Invariance,” Structural Equation Modeling: A Multidisciplinary Journal
(9:2), pp. 233-255.
Dahlan, M. K. M., Abdullah, N., and Suhaimi, A. I. H. 2018. “A Study on Supporting Factors
of Digital Workplace Diffusion in Public Sector,” in User Science and Engineering, N. Ab-
dullah, W. A. Wan Adnan and M. Foth (eds.), Singapore: Springer Singapore, pp. 327-335.
Dery, K., Sebastian, I. M., and van der Meulen, N. 2017. “The Digital Workplace is Key to
Digital Innovation,” Management Information Systems Quarterly Executive (16:2), pp. 135-
152.
DeSanctis, G., and Poole, M. S. 1994. “Capturing the Complexity in Advanced Technology
Use: Adaptive Structuration Theory,” Organization Science (5:2), pp. 121-147.
Fitzgerald, M., Kruschwitz, N., Bonnet, D., and Welch, M. 2013. “Embracing Digital Technol-
ogy: A New Strategic Imperative,” MIT Sloan Management Review (55:2), pp. 1-12.
Fornell, C., and Larcker, D. F. 1981. “Evaluating Structural Equation Models with Unobserva-
ble Variables and Measurement Error,” Journal of Marketing Research (18:1), pp. 39-50.
Gartner 2020. Gartner IT Glossary > Digital Workplace. http://www.gartner.com/it-glos-
sary/digital-workplace. Accessed 29 March 2020.
Gimpel, H., Hosseini, S., Huber, R., Probst, L., Röglinger, M., and Faisst, U. 2018a. “Structur-
ing Digital Transformation: A Framework of Action Fields and its Application at ZEISS,”
Journal of Information Technology Theory and Application (19:1), pp. 31-54.
Technostress as a Negative Outcome of Individual Information Systems Use 150
Gimpel, H., Lanzl, J., Manner-Romberg, T., and Nüske, N. 2018b. “Digitaler Stress in Deutsch-
land: Eine Befragung von Erwerbstätigen zu Belastung und Beanspruchung durch Arbeit
mit digitalen Technologien,” Hans Böckler Stiftung (ed.).
Gimpel, H., Lanzl, J., Regal, C., Urbach, N., Wischniewski, S., Tegtmeier, P., Kreilos, M.,
Kühlmann, T. M., Becker, J., Eimecke, J., and Derra, N. D. 2019. “Gesund digital arbeiten?!
Eine Studie zu digitalem Stress in Deutschland,” Fraunhofer FIT (ed.), Augsburg.
Henseler, J., Ringle, C. M., and Sarstedt, M. 2015. “A New Criterion for Assessing Discrimi-
nant Validity in Variance-Based Structural Equation Modeling,” Journal of the Academy of
Marketing Science (43:1), pp. 115-135.
Hung, W.-H., Chen, K., and Lin, C.-P. 2015. “Does the Proactive Personality Mitigate the Ad-
verse Effect of Technostress on Productivity in the Mobile Environment?” Telematics and
Informatics (32:1), pp. 143-157.
Köffer, S. 2015. “Designing the Digital Workplace of the Future: What Scholars Recommend
to Practitioners,” in Proceedings of the 36th International Conference on Information Sys-
tems, Fort Worth, Texas, USA, pp. 1-21.
Lazarus, R. S., and Folkman, S. 1984. Stress, Appraisal, and Coping, New York: Springer Pub-
lishing Company.
Little, T. D. 1997. “Mean and Covariance Structures (MACS) Analyses of Cross-Cultural Data:
Practical and Theoretical Issues,” Multivariate Behavioral Research (32:1), pp. 53-76.
MacKenzie, S. B., Podsakoff, P. M., and Podsakoff, N. P. 2011. “Construct Measurement and
Validation Procedures in MIS and Behavioral Research: Integrating New and Existing
Techniques,” Management Information Systems Quarterly (35:2), pp. 293-334.
Mahapatra, M., and Pati, S. P. 2018. “Technostress Creators and Burnout: A Job Demands-
Resources Perspective,” in Proceedings of the 2018 ACM SIGMIS Conference on Comput-
ers and People Research, Buffalo-Niagara Falls, New York, USA, pp. 70-77.
Maier, C., Laumer, S., and Weinert, C. 2015. “Enterprise Resource Planning systems Induced
Stress: A Comparative Empirical Analysis with Young and Elderly SAP Users,” in Pro-
ceedings of the 12th International Conference on Wirtschaftsinformatik, Osnabrueck, Ger-
many, pp. 1-16.
Maslach, C., Schaufeli, W. B., and Leiter, M. P. 2001. “Job Burnout,” Annual Review of Psy-
chology (52), pp. 397-422.
Melville, N., Kraemer, K., and Gurbaxani, V. 2004. “Review: Information Technology and
Organizational Performance: An Integrative Model of IT Business Value,” Management
Information Systems Quarterly (28:2), pp. 283-322.
Technostress as a Negative Outcome of Individual Information Systems Use 151
Moore, G. C., and Benbasat, I. 1991. “Development of an Instrument to Measure the Percep-
tions of Adopting an Information Technology Innovation,” Information Systems Research
(2:3), pp. 192-222.
Nüske, N., Bayer, S., Gimpel, H., and Lanzl, J. 2019. “Digitization of the German Workplace:
Typical Technologies and Who Uses Them,” research in process.
Pirkkalainen, H., Salo, M., Tarafdar, M., and Makkonen, M. 2019. “Deliberate or Instinctive?:
Proactive and Reactive Coping for Technostress,” Journal of Management Information Sys-
tems (36:4), pp. 1179-1212.
Podsakoff, P. M., MacKenzie, S. B., and Podsakoff, N. P. 2003. “Common Method Biases in
Behavioral Research: A Critical Review of the Literature and Recommended Remedies,”
Journal of Applied Psychology (88:5), pp. 879-903.
Ragu-Nathan, T. S., Tarafdar, M., Ragu-Nathan, B. S., and Tu, Q. 2008. “The Consequences
of Technostress for End Users in Organizations: Conceptual Development and Empirical
Validation,” Information Systems Research (19:4), pp. 417-433.
Salo, M., Pirkkalainen, H., and Koskelainen, T. 2019. “Technostress and Social Networking
Services: Explaining Users’ Concentration, Sleep, Identity, and Social Relation Problems,”
Information Systems Journal (29:2), pp. 408-435.
Sarabadani, J., Carter, M., and Compeau, D. 2018. “10 Years of Research on Technostress
Creators and Inhibitors: Synthesis and Critique,” in Proceedings of the 24th Americas Con-
ference on Information Systems, New Orleans, Louisiana, USA, pp. 1-10.
Sebastian, I. M., Ross, J. W., Beath, C., Mocker, M., Moloney, K. G., and Fonstad, N. O. 2017.
“How Big Old Companies Navigate Digital Transformation,” Management Information
Systems Quarterly Executive (16:3), pp. 197-213.
Tan, B., Pan, S. L., Lu, X., and Huang, L. 2015. “The Role of IS Capabilities in the Develop-
ment of Multi-sided Platforms: The Digital Ecosystem Strategy of Alibaba.com,” Journal
of the Association for Information Systems (16:4), pp. 248-280.
Tarafdar, M., Cooper, C. L., and Stich, J.-F. 2019. “The Technostress Trifecta: Techno Eustress,
Techno Distress and Design: Theoretical Directions and an Agenda for Research,” Infor-
mation Systems Journal (29:1), pp. 6-42.
Tarafdar, M., Tu, Q., Ragu-Nathan, B. S., and Ragu-Nathan, T. S. 2007. “The Impact of Tech-
nostress on Role Stress and Productivity,” Journal of Management Information Systems
(24:1), pp. 301-328.
Technostress as a Negative Outcome of Individual Information Systems Use 152
Tarafdar, M., Tu, Q., Ragu-Nathan, T. S., and Ragu-Nathan, B. S. 2011. “Crossing to the Dark
Side: Examining Creators, Outcomes, and Inhibitors of Technostress,” Communications of
the ACM (54:9), pp. 113-120.
Tiwana, A., Konsynski, B. R., and Bush, A. A. 2010. “Research Commentary - Platform Evo-
lution: Coevolution of Platform Architecture, Governance, and Environmental Dynamics,”
Information Systems Research (21:4), pp. 675-687.
Tu, Q., Wang, K., and Shu, Q. 2005. “Computer-Mediated Technostress in China,” Communi-
cations of the ACM (48:4), pp. 77-81.
Venkatesh, V., Brown, S. A., and Bala, H. 2013. “Bridging the Qualitative-Quantitative Di-
vide: Guidelines for Conducting Mixed Methods Research in Information Systems,” Man-
agement Information Systems Quarterly (37:1), pp. 21-54.
Vial, G. 2019. “Understanding Digital Transformation: A Review and a Research Agenda,”
Journal of Strategic Information Systems (28:2), pp. 118-144.
Westermann, T., Möller, S., and Wechsung, I. 2015. “Assessing the Relationship between
Technical Affinity, Stress and Notifications on Smartphones,” in Proceedings of the 17th
International Conference on Human-Computer Interaction with Mobile Devices and Ser-
vices Adjunct, Copenhagen, Denmark, pp. 652-659.
Williams, S. P., and Schubert, P. 2018. “Designs for the Digital Workplace,” Procedia Com-
puter Science (138), pp. 478-485.
Yalina, N. 2020. “Digital Workplace Implementation to Promote Gender Equality,” Advances
in Social Science, Education and Humanities Research (390), pp. 1-5.
Zuppo, C. M. 2012. “Defining ICT in a Boundaryless World: The Development of a Working
Hierarchy,” International Journal of Managing Information Technology (4:3), pp. 13-22.
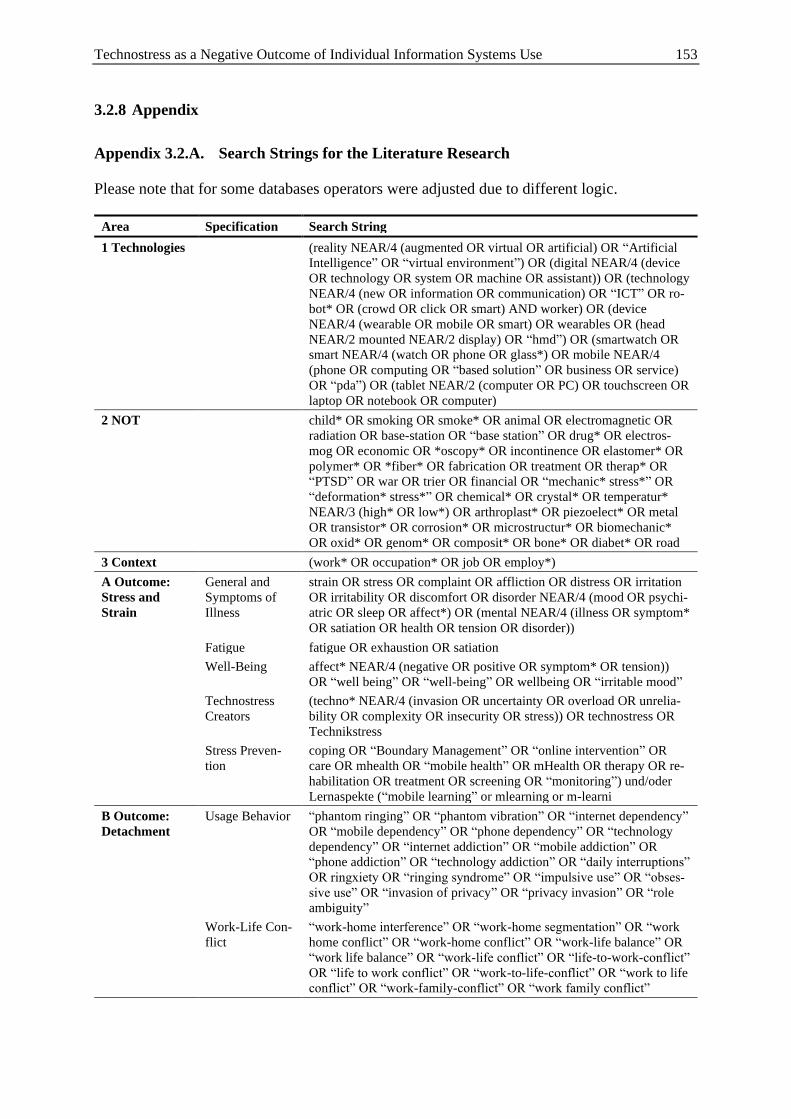
Technostress as a Negative Outcome of Individual Information Systems Use 153
3.2.8 Appendix
Appendix 3.2.A. Search Strings for the Literature Research
Please note that for some databases operators were adjusted due to different logic.
Area Specification Search String
1 Technologies (reality NEAR/4 (augmented OR virtual OR artificial) OR “Artificial
Intelligence” OR “virtual environment”) OR (digital NEAR/4 (device
OR technology OR system OR machine OR assistant)) OR (technology
NEAR/4 (new OR information OR communication) OR “ICT” OR ro-
bot* OR (crowd OR click OR smart) AND worker) OR (device
NEAR/4 (wearable OR mobile OR smart) OR wearables OR (head
NEAR/2 mounted NEAR/2 display) OR “hmd”) OR (smartwatch OR
smart NEAR/4 (watch OR phone OR glass*) OR mobile NEAR/4
(phone OR computing OR “based solution” OR business OR service)
OR “pda”) OR (tablet NEAR/2 (computer OR PC) OR touchscreen OR
laptop OR notebook OR computer)
2 NOT child* OR smoking OR smoke* OR animal OR electromagnetic OR
radiation OR base-station OR “base station” OR drug* OR electros-
mog OR economic OR *oscopy* OR incontinence OR elastomer* OR
polymer* OR *fiber* OR fabrication OR treatment OR therap* OR
“PTSD” OR war OR trier OR financial OR “mechanic* stress*” OR
“deformation* stress*” OR chemical* OR crystal* OR temperatur*
NEAR/3 (high* OR low*) OR arthroplast* OR piezoelect* OR metal
OR transistor* OR corrosion* OR microstructur* OR biomechanic*
OR oxid* OR genom* OR composit* OR bone* OR diabet* OR road
3 Context (work* OR occupation* OR job OR employ*)
A Outcome:
Stress and
Strain
General and
Symptoms of
Illness
strain OR stress OR complaint OR affliction OR distress OR irritation
OR irritability OR discomfort OR disorder NEAR/4 (mood OR psychi-
atric OR sleep OR affect*) OR (mental NEAR/4 (illness OR symptom*
OR satiation OR health OR tension OR disorder))
Fatigue fatigue OR exhaustion OR satiation
Well-Being affect* NEAR/4 (negative OR positive OR symptom* OR tension))
OR “well being” OR “well-being” OR wellbeing OR “irritable mood”
Technostress
Creators
(techno* NEAR/4 (invasion OR uncertainty OR overload OR unrelia-
bility OR complexity OR insecurity OR stress)) OR technostress OR
Technikstress
Stress Preven-
tion
coping OR “Boundary Management” OR “online intervention” OR
care OR mhealth OR “mobile health” OR mHealth OR therapy OR re-
habilitation OR treatment OR screening OR “monitoring”) und/oder
Lernaspekte (“mobile learning” or mlearning or m-learni
B Outcome:
Detachment
Usage Behavior “phantom ringing” OR “phantom vibration” OR “internet dependency”
OR “mobile dependency” OR “phone dependency” OR “technology
dependency” OR “internet addiction” OR “mobile addiction” OR
“phone addiction” OR “technology addiction” OR “daily interruptions”
OR ringxiety OR “ringing syndrome” OR “impulsive use” OR “obses-
sive use” OR “invasion of privacy” OR “privacy invasion” OR “role
ambiguity”
Work-Life Con-
flict
“work-home interference” OR “work-home segmentation” OR “work
home conflict” OR “work-home conflict” OR “work-life balance” OR
“work life balance” OR “work-life conflict” OR “life-to-work-conflict”
OR “life to work conflict” OR “work-to-life-conflict” OR “work to life
conflict” OR “work-family-conflict” OR “work family conflict”
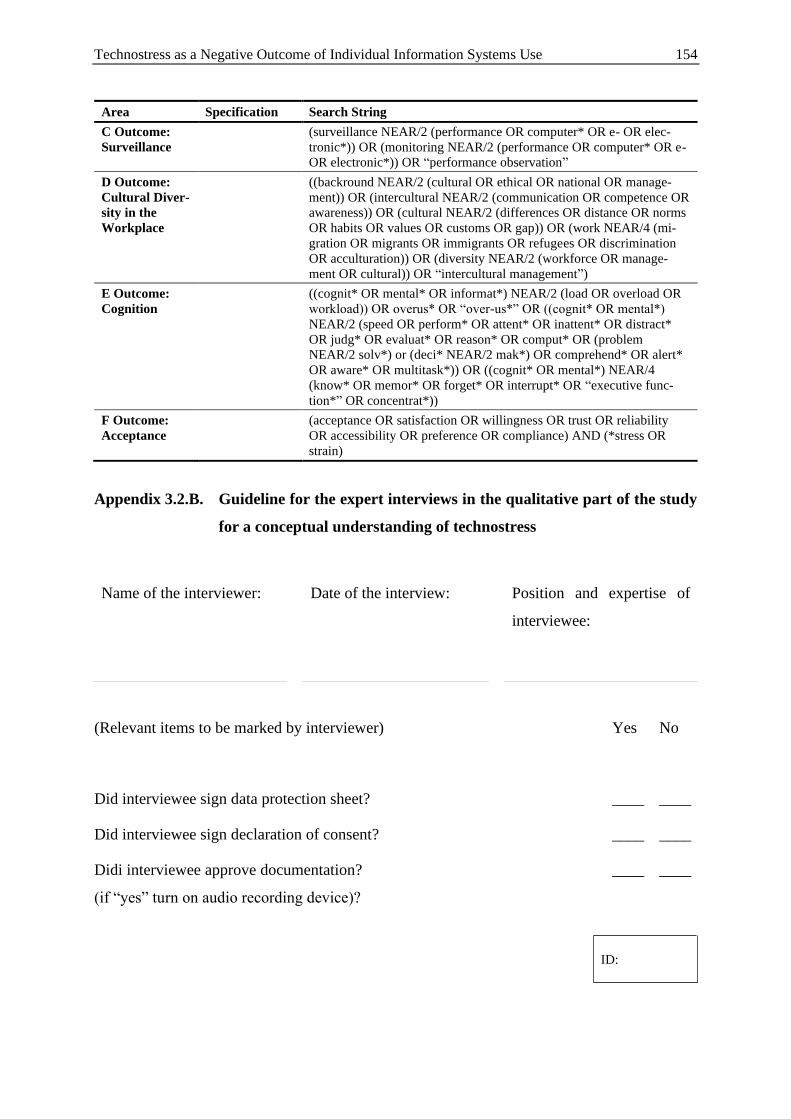
Technostress as a Negative Outcome of Individual Information Systems Use 154
Area Specification Search String
C Outcome:
Surveillance
(surveillance NEAR/2 (performance OR computer* OR e- OR elec-
tronic*)) OR (monitoring NEAR/2 (performance OR computer* OR e-
OR electronic*)) OR “performance observation”
D Outcome:
Cultural Diver-
sity in the
Workplace
((backround NEAR/2 (cultural OR ethical OR national OR manage-
ment)) OR (intercultural NEAR/2 (communication OR competence OR
awareness)) OR (cultural NEAR/2 (differences OR distance OR norms
OR habits OR values OR customs OR gap)) OR (work NEAR/4 (mi-
gration OR migrants OR immigrants OR refugees OR discrimination
OR acculturation)) OR (diversity NEAR/2 (workforce OR manage-
ment OR cultural)) OR “intercultural management”)
E Outcome:
Cognition
((cognit* OR mental* OR informat*) NEAR/2 (load OR overload OR
workload)) OR overus* OR “over-us*” OR ((cognit* OR mental*)
NEAR/2 (speed OR perform* OR attent* OR inattent* OR distract*
OR judg* OR evaluat* OR reason* OR comput* OR (problem
NEAR/2 solv*) or (deci* NEAR/2 mak*) OR comprehend* OR alert*
OR aware* OR multitask*)) OR ((cognit* OR mental*) NEAR/4
(know* OR memor* OR forget* OR interrupt* OR “executive func-
tion*” OR concentrat*))
F Outcome:
Acceptance
(acceptance OR satisfaction OR willingness OR trust OR reliability
OR accessibility OR preference OR compliance) AND (*stress OR
strain)
Appendix 3.2.B. Guideline for the expert interviews in the qualitative part of the study
for a conceptual understanding of technostress
(Relevant items to be marked by interviewer) Yes No
Did interviewee sign data protection sheet? ____ ____
Did interviewee sign declaration of consent? ____ ____
Didi interviewee approve documentation? ____ ____
(if “yes” turn on audio recording device)?
Name of the interviewer:
Date of the interview: Position and expertise of
interviewee:
ID:
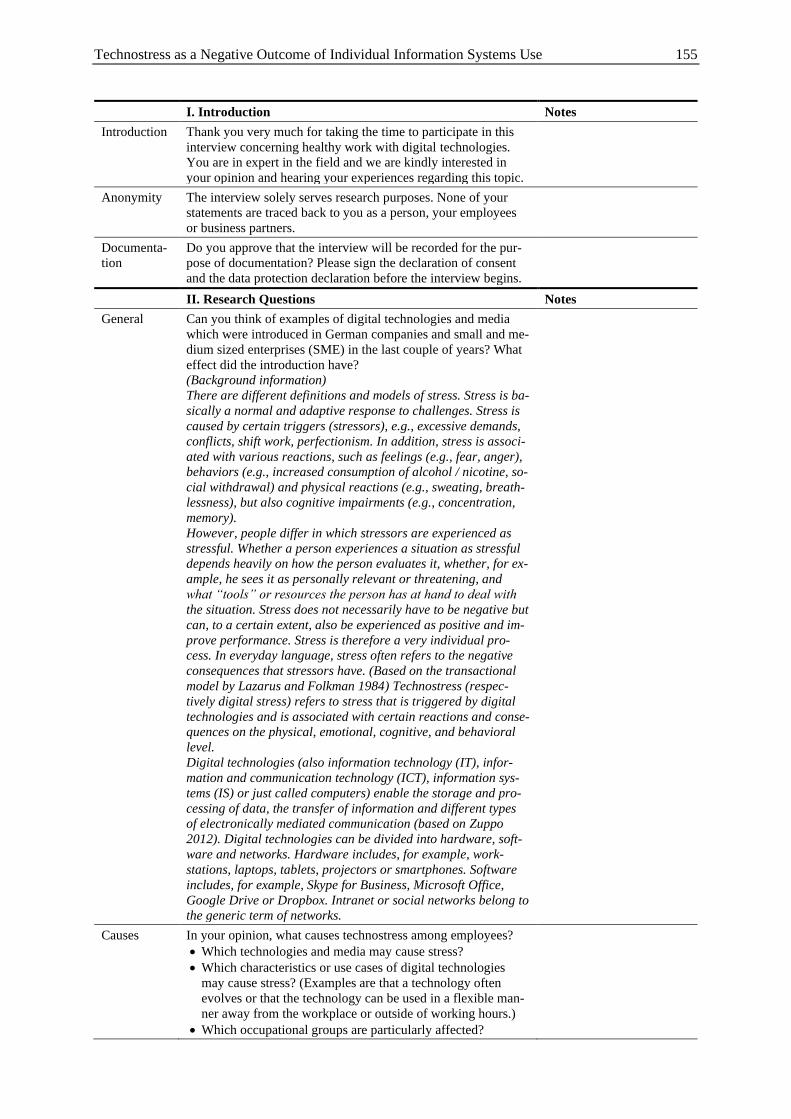
Technostress as a Negative Outcome of Individual Information Systems Use 155
I. Introduction Notes
Introduction Thank you very much for taking the time to participate in this
interview concerning healthy work with digital technologies.
You are in expert in the field and we are kindly interested in
your opinion and hearing your experiences regarding this topic.
Anonymity The interview solely serves research purposes. None of your
statements are traced back to you as a person, your employees
or business partners.
Documenta-
tion
Do you approve that the interview will be recorded for the pur-
pose of documentation? Please sign the declaration of consent
and the data protection declaration before the interview begins.
II. Research Questions Notes
General Can you think of examples of digital technologies and media
which were introduced in German companies and small and me-
dium sized enterprises (SME) in the last couple of years? What
effect did the introduction have?
(Background information)
There are different definitions and models of stress. Stress is ba-
sically a normal and adaptive response to challenges. Stress is
caused by certain triggers (stressors), e.g., excessive demands,
conflicts, shift work, perfectionism. In addition, stress is associ-
ated with various reactions, such as feelings (e.g., fear, anger),
behaviors (e.g., increased consumption of alcohol / nicotine, so-
cial withdrawal) and physical reactions (e.g., sweating, breath-
lessness), but also cognitive impairments (e.g., concentration,
memory).
However, people differ in which stressors are experienced as
stressful. Whether a person experiences a situation as stressful
depends heavily on how the person evaluates it, whether, for ex-
ample, he sees it as personally relevant or threatening, and
what “tools” or resources the person has at hand to deal with
the situation. Stress does not necessarily have to be negative but
can, to a certain extent, also be experienced as positive and im-
prove performance. Stress is therefore a very individual pro-
cess. In everyday language, stress often refers to the negative
consequences that stressors have. (Based on the transactional
model by Lazarus and Folkman 1984) Technostress (respec-
tively digital stress) refers to stress that is triggered by digital
technologies and is associated with certain reactions and conse-
quences on the physical, emotional, cognitive, and behavioral
level.
Digital technologies (also information technology (IT), infor-
mation and communication technology (ICT), information sys-
tems (IS) or just called computers) enable the storage and pro-
cessing of data, the transfer of information and different types
of electronically mediated communication (based on Zuppo
2012). Digital technologies can be divided into hardware, soft-
ware and networks. Hardware includes, for example, work-
stations, laptops, tablets, projectors or smartphones. Software
includes, for example, Skype for Business, Microsoft Office,
Google Drive or Dropbox. Intranet or social networks belong to
the generic term of networks.
Causes In your opinion, what causes technostress among employees?
• Which technologies and media may cause stress?
• Which characteristics or use cases of digital technologies
may cause stress? (Examples are that a technology often
evolves or that the technology can be used in a flexible man-
ner away from the workplace or outside of working hours.)
• Which occupational groups are particularly affected?
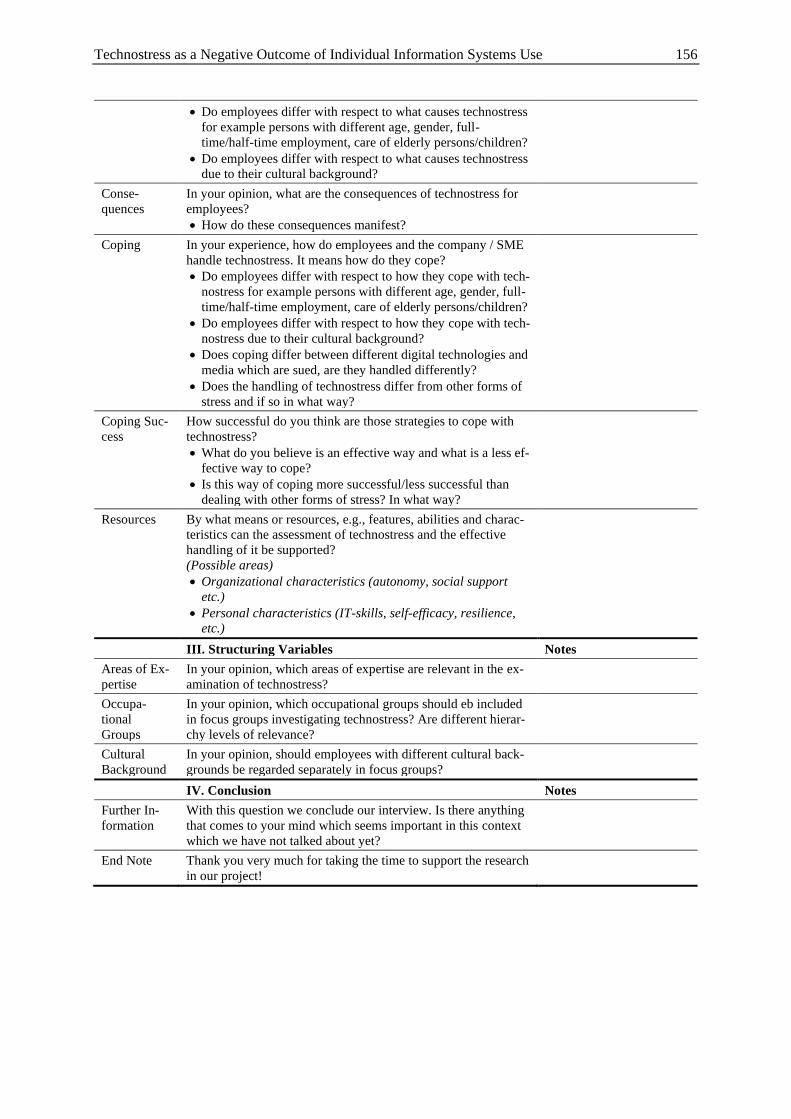
Technostress as a Negative Outcome of Individual Information Systems Use 156
• Do employees differ with respect to what causes technostress
for example persons with different age, gender, full-
time/half-time employment, care of elderly persons/children?
• Do employees differ with respect to what causes technostress
due to their cultural background?
Conse-
quences
In your opinion, what are the consequences of technostress for
employees?
• How do these consequences manifest?
Coping In your experience, how do employees and the company / SME
handle technostress. It means how do they cope?
• Do employees differ with respect to how they cope with tech-
nostress for example persons with different age, gender, full-
time/half-time employment, care of elderly persons/children?
• Do employees differ with respect to how they cope with tech-
nostress due to their cultural background?
• Does coping differ between different digital technologies and
media which are sued, are they handled differently?
• Does the handling of technostress differ from other forms of
stress and if so in what way?
Coping Suc-
cess
How successful do you think are those strategies to cope with
technostress?
• What do you believe is an effective way and what is a less ef-
fective way to cope?
• Is this way of coping more successful/less successful than
dealing with other forms of stress? In what way?
Resources By what means or resources, e.g., features, abilities and charac-
teristics can the assessment of technostress and the effective
handling of it be supported?
(Possible areas)
• Organizational characteristics (autonomy, social support
etc.)
• Personal characteristics (IT-skills, self-efficacy, resilience,
etc.)
III. Structuring Variables Notes
Areas of Ex-
pertise
In your opinion, which areas of expertise are relevant in the ex-
amination of technostress?
Occupa-
tional
Groups
In your opinion, which occupational groups should eb included
in focus groups investigating technostress? Are different hierar-
chy levels of relevance?
Cultural
Background
In your opinion, should employees with different cultural back-
grounds be regarded separately in focus groups?
IV. Conclusion Notes
Further In-
formation
With this question we conclude our interview. Is there anything
that comes to your mind which seems important in this context
which we have not talked about yet?
End Note Thank you very much for taking the time to support the research
in our project!
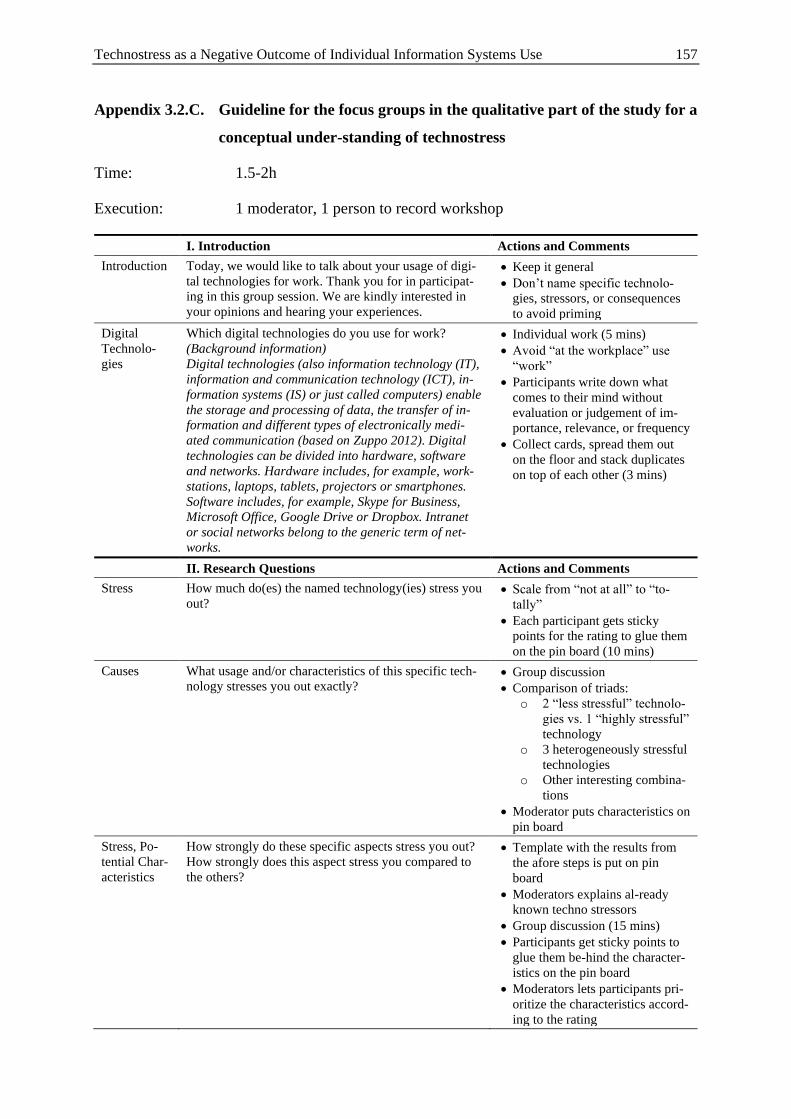
Technostress as a Negative Outcome of Individual Information Systems Use 157
Appendix 3.2.C. Guideline for the focus groups in the qualitative part of the study for a
conceptual under-standing of technostress
Time: 1.5-2h
Execution: 1 moderator, 1 person to record workshop
I. Introduction Actions and Comments
Introduction Today, we would like to talk about your usage of digi-
tal technologies for work. Thank you for in participat-
ing in this group session. We are kindly interested in
your opinions and hearing your experiences.
• Keep it general
• Don’t name specific technolo-
gies, stressors, or consequences
to avoid priming
Digital
Technolo-
gies
Which digital technologies do you use for work?
(Background information)
Digital technologies (also information technology (IT),
information and communication technology (ICT), in-
formation systems (IS) or just called computers) enable
the storage and processing of data, the transfer of in-
formation and different types of electronically medi-
ated communication (based on Zuppo 2012). Digital
technologies can be divided into hardware, software
and networks. Hardware includes, for example, work-
stations, laptops, tablets, projectors or smartphones.
Software includes, for example, Skype for Business,
Microsoft Office, Google Drive or Dropbox. Intranet
or social networks belong to the generic term of net-
works.
• Individual work (5 mins)
• Avoid “at the workplace” use
“work”
• Participants write down what
comes to their mind without
evaluation or judgement of im-
portance, relevance, or frequency
• Collect cards, spread them out
on the floor and stack duplicates
on top of each other (3 mins)
II. Research Questions Actions and Comments
Stress How much do(es) the named technology(ies) stress you
out? • Scale from “not at all” to “to-
tally”
• Each participant gets sticky
points for the rating to glue them
on the pin board (10 mins)
Causes What usage and/or characteristics of this specific tech-
nology stresses you out exactly? • Group discussion
• Comparison of triads:
o 2 “less stressful” technolo-
gies vs. 1 “highly stressful”
technology
o 3 heterogeneously stressful
technologies
o Other interesting combina-
tions
• Moderator puts characteristics on
pin board
Stress, Po-
tential Char-
acteristics
How strongly do these specific aspects stress you out?
How strongly does this aspect stress you compared to
the others?
• Template with the results from
the afore steps is put on pin
board
• Moderators explains al-ready
known techno stressors
• Group discussion (15 mins)
• Participants get sticky points to
glue them be-hind the character-
istics on the pin board
• Moderators lets participants pri-
oritize the characteristics accord-
ing to the rating
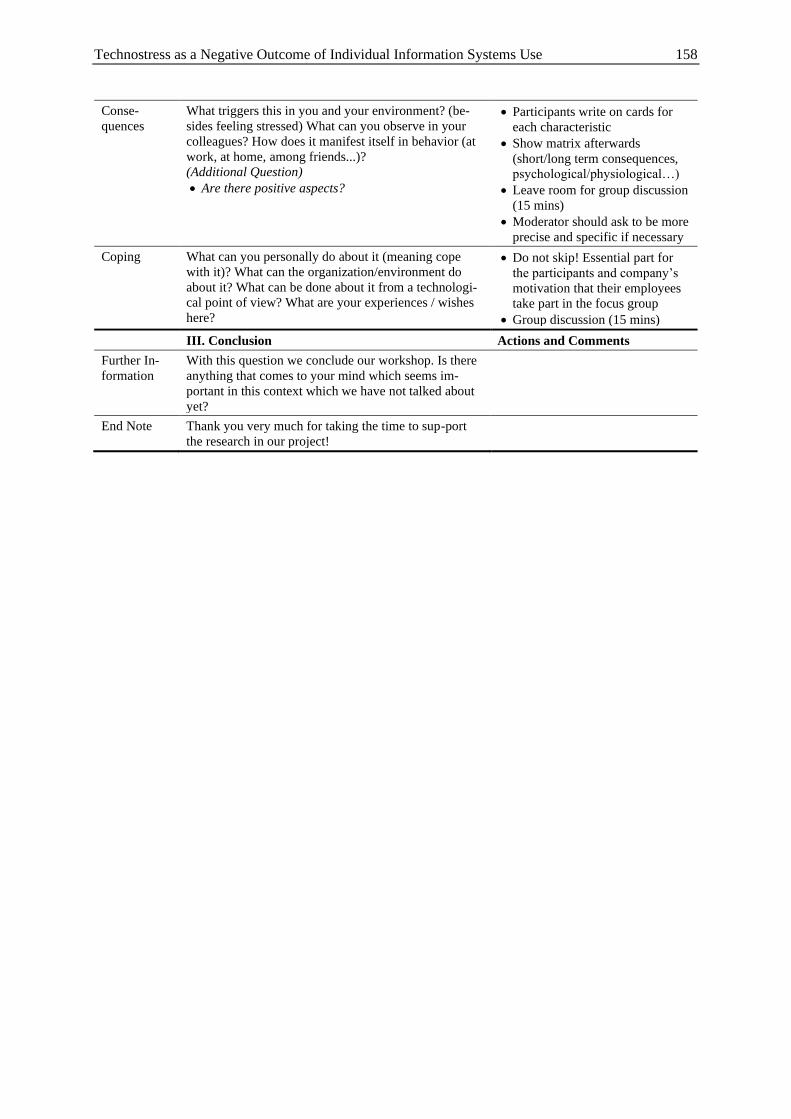
Technostress as a Negative Outcome of Individual Information Systems Use 158
Conse-
quences
What triggers this in you and your environment? (be-
sides feeling stressed) What can you observe in your
colleagues? How does it manifest itself in behavior (at
work, at home, among friends...)?
(Additional Question)
• Are there positive aspects?
• Participants write on cards for
each characteristic
• Show matrix afterwards
(short/long term consequences,
psychological/physiological…)
• Leave room for group discussion
(15 mins)
• Moderator should ask to be more
precise and specific if necessary
Coping What can you personally do about it (meaning cope
with it)? What can the organization/environment do
about it? What can be done about it from a technologi-
cal point of view? What are your experiences / wishes
here?
• Do not skip! Essential part for
the participants and company’s
motivation that their employees
take part in the focus group
• Group discussion (15 mins)
III. Conclusion Actions and Comments
Further In-
formation
With this question we conclude our workshop. Is there
anything that comes to your mind which seems im-
portant in this context which we have not talked about
yet?
End Note Thank you very much for taking the time to sup-port
the research in our project!
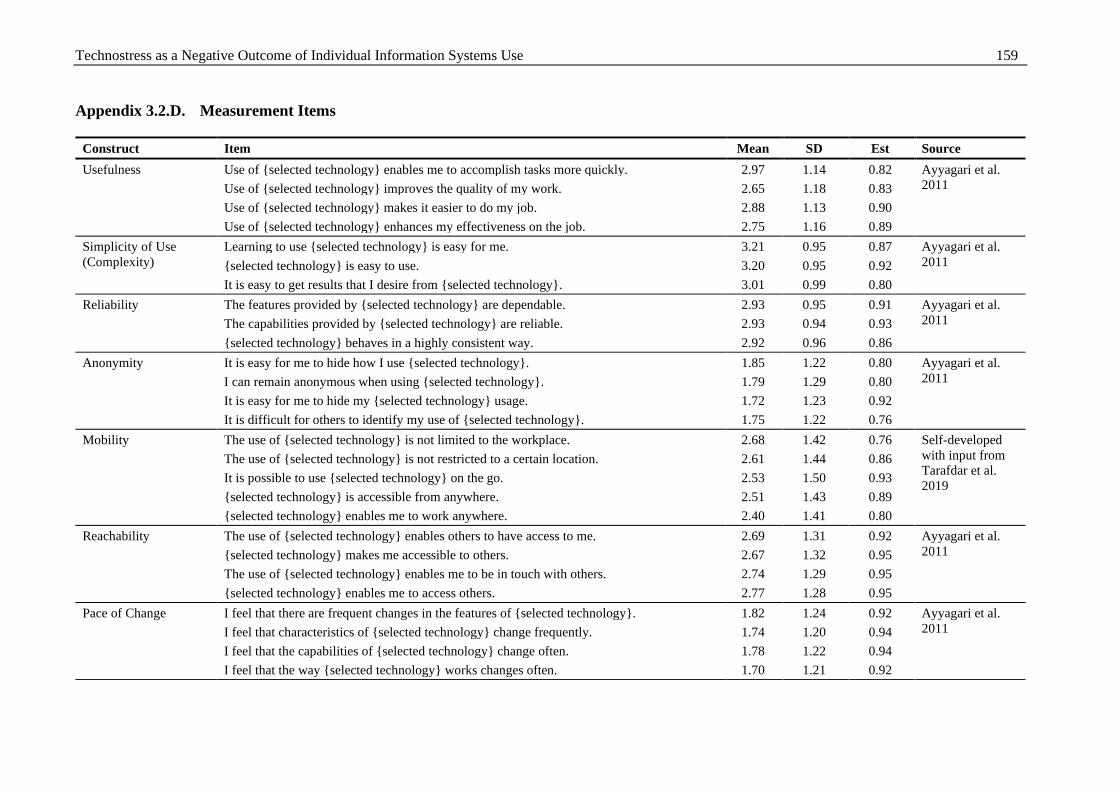
Technostress as a Negative Outcome of Individual Information Systems Use 159
Appendix 3.2.D. Measurement Items
Construct Item Mean SD Est Source
Usefulness Use of {selected technology} enables me to accomplish tasks more quickly. 2.97 1.14 0.82 Ayyagari et al.
2011 Use of {selected technology} improves the quality of my work. 2.65 1.18 0.83
Use of {selected technology} makes it easier to do my job. 2.88 1.13 0.90
Use of {selected technology} enhances my effectiveness on the job. 2.75 1.16 0.89
Simplicity of Use
(Complexity)
Learning to use {selected technology} is easy for me. 3.21 0.95 0.87 Ayyagari et al.
2011 {selected technology} is easy to use. 3.20 0.95 0.92
It is easy to get results that I desire from {selected technology}. 3.01 0.99 0.80
Reliability The features provided by {selected technology} are dependable. 2.93 0.95 0.91 Ayyagari et al.
2011 The capabilities provided by {selected technology} are reliable. 2.93 0.94 0.93
{selected technology} behaves in a highly consistent way. 2.92 0.96 0.86
Anonymity It is easy for me to hide how I use {selected technology}. 1.85 1.22 0.80 Ayyagari et al.
2011 I can remain anonymous when using {selected technology}. 1.79 1.29 0.80
It is easy for me to hide my {selected technology} usage. 1.72 1.23 0.92
It is difficult for others to identify my use of {selected technology}. 1.75 1.22 0.76
Mobility The use of {selected technology} is not limited to the workplace. 2.68 1.42 0.76 Self-developed
with input from
Tarafdar et al.
2019
The use of {selected technology} is not restricted to a certain location. 2.61 1.44 0.86
It is possible to use {selected technology} on the go. 2.53 1.50 0.93
{selected technology} is accessible from anywhere. 2.51 1.43 0.89
{selected technology} enables me to work anywhere. 2.40 1.41 0.80
Reachability The use of {selected technology} enables others to have access to me. 2.69 1.31 0.92 Ayyagari et al.
2011 {selected technology} makes me accessible to others. 2.67 1.32 0.95
The use of {selected technology} enables me to be in touch with others. 2.74 1.29 0.95
{selected technology} enables me to access others. 2.77 1.28 0.95
Pace of Change I feel that there are frequent changes in the features of {selected technology}. 1.82 1.24 0.92 Ayyagari et al.
2011 I feel that characteristics of {selected technology} change frequently. 1.74 1.20 0.94
I feel that the capabilities of {selected technology} change often. 1.78 1.22 0.94
I feel that the way {selected technology} works changes often. 1.70 1.21 0.92
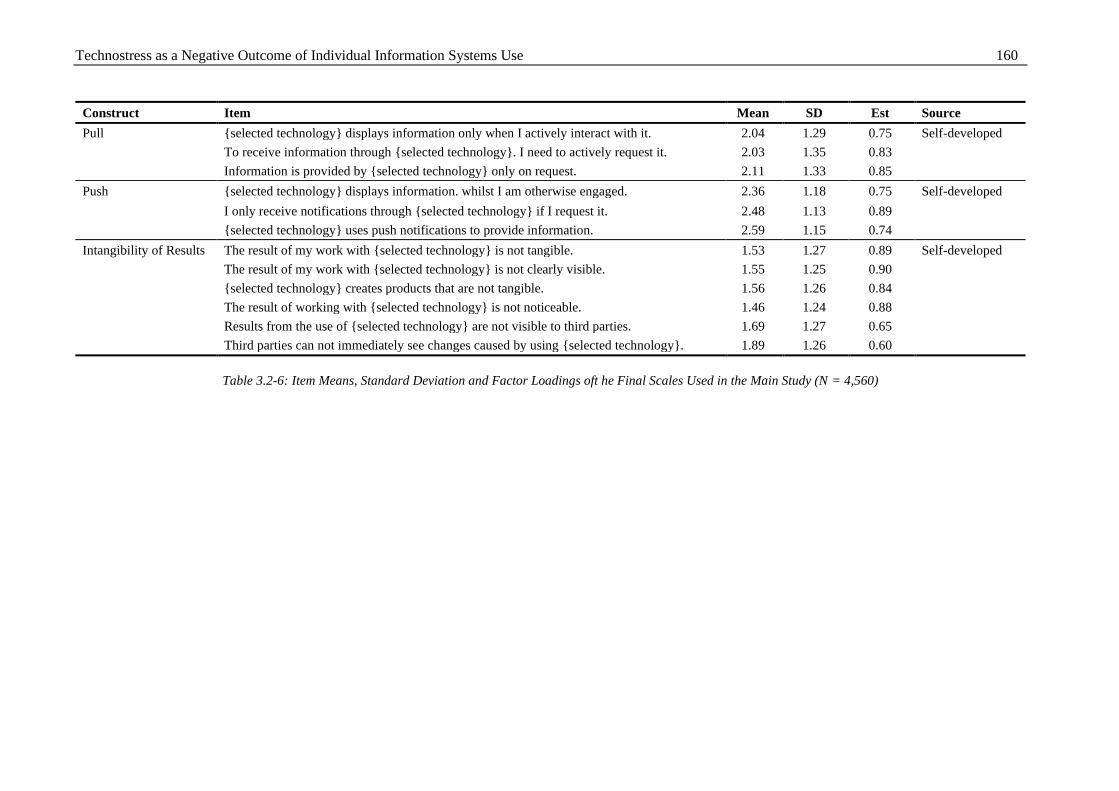
Technostress as a Negative Outcome of Individual Information Systems Use 160
Construct Item Mean SD Est Source
Pull {selected technology} displays information only when I actively interact with it. 2.04 1.29 0.75 Self-developed
To receive information through {selected technology}. I need to actively request it. 2.03 1.35 0.83
Information is provided by {selected technology} only on request. 2.11 1.33 0.85
Push {selected technology} displays information. whilst I am otherwise engaged. 2.36 1.18 0.75 Self-developed
I only receive notifications through {selected technology} if I request it. 2.48 1.13 0.89
{selected technology} uses push notifications to provide information. 2.59 1.15 0.74
Intangibility of Results The result of my work with {selected technology} is not tangible. 1.53 1.27 0.89 Self-developed
The result of my work with {selected technology} is not clearly visible. 1.55 1.25 0.90
{selected technology} creates products that are not tangible. 1.56 1.26 0.84
The result of working with {selected technology} is not noticeable. 1.46 1.24 0.88
Results from the use of {selected technology} are not visible to third parties. 1.69 1.27 0.65
Third parties can not immediately see changes caused by using {selected technology}. 1.89 1.26 0.60
Table 3.2-6: Item Means, Standard Deviation and Factor Loadings oft he Final Scales Used in the Main Study (N = 4,560)
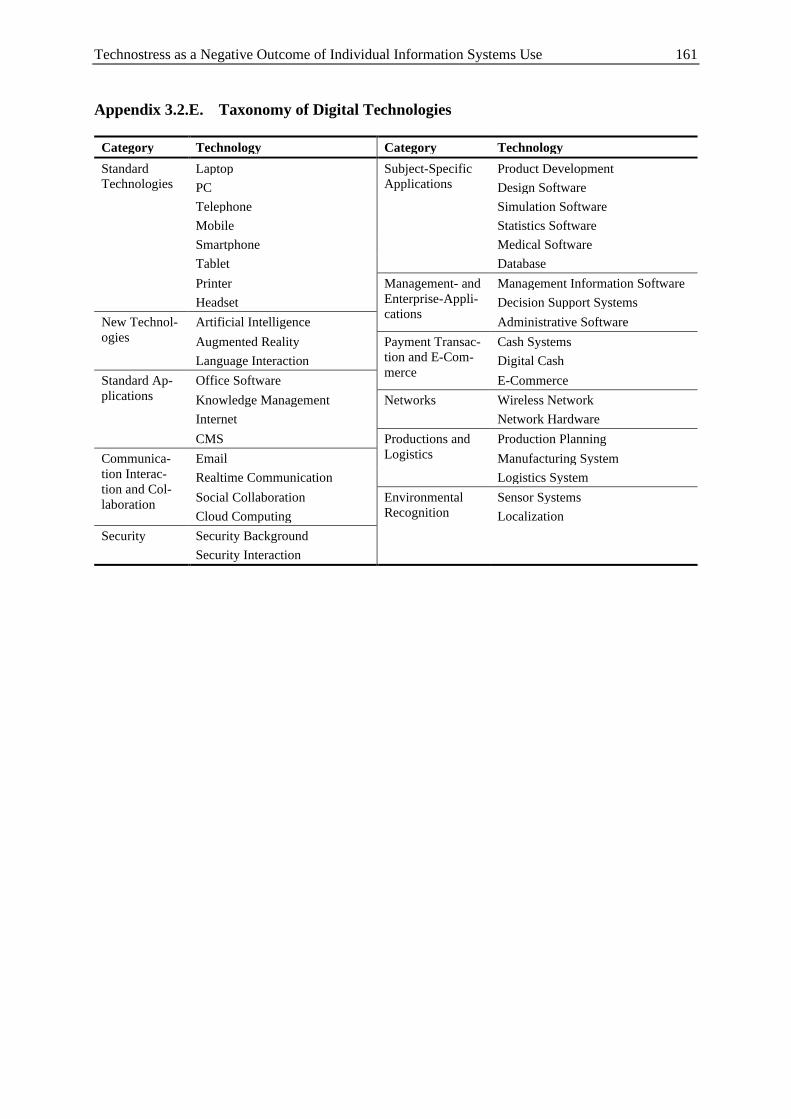
Technostress as a Negative Outcome of Individual Information Systems Use 161
Appendix 3.2.E. Taxonomy of Digital Technologies
Category Technology Category Technology
Standard
Technologies
Laptop Subject-Specific
Applications
Product Development
PC Design Software
Telephone Simulation Software
Mobile Statistics Software
Smartphone Medical Software
Tablet Database
Printer Management- and
Enterprise-Appli-
cations
Management Information Software
Headset Decision Support Systems
New Technol-
ogies
Artificial Intelligence Administrative Software
Augmented Reality Payment Transac-
tion and E-Com-
merce
Cash Systems
Language Interaction Digital Cash
Standard Ap-
plications
Office Software E-Commerce
Knowledge Management Networks Wireless Network
Internet Network Hardware
CMS Productions and
Logistics
Production Planning
Communica-
tion Interac-
tion and Col-
laboration
Email Manufacturing System
Realtime Communication Logistics System
Social Collaboration Environmental
Recognition
Sensor Systems
Cloud Computing Localization
Security Security Background
Security Interaction
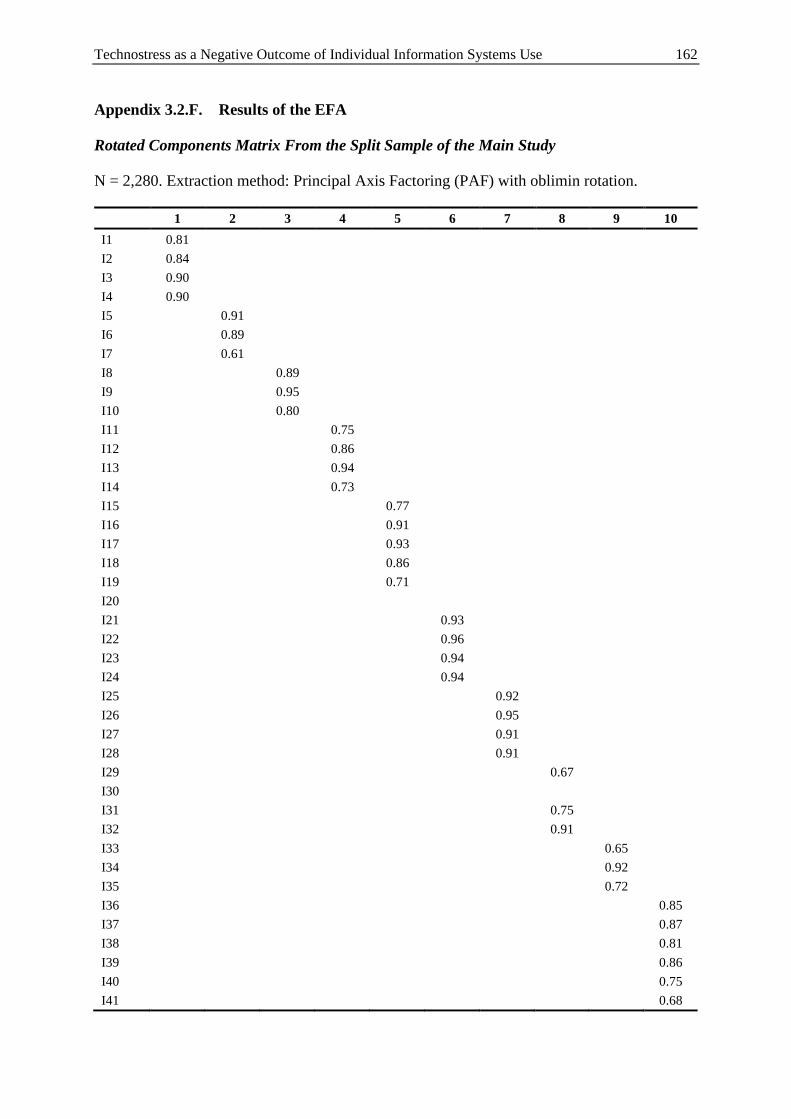
Technostress as a Negative Outcome of Individual Information Systems Use 162
Appendix 3.2.F. Results of the EFA
Rotated Components Matrix From the Split Sample of the Main Study
N = 2,280. Extraction method: Principal Axis Factoring (PAF) with oblimin rotation.
1 2 3 4 5 6 7 8 9 10
I1 0.81
I2 0.84
I3 0.90
I4 0.90
I5 0.91
I6 0.89
I7 0.61
I8 0.89
I9 0.95
I10 0.80
I11 0.75
I12 0.86
I13 0.94
I14 0.73
I15 0.77
I16 0.91
I17 0.93
I18 0.86
I19 0.71
I20
I21 0.93
I22 0.96
I23 0.94
I24 0.94
I25 0.92
I26 0.95
I27 0.91
I28 0.91
I29 0.67
I30
I31 0.75
I32 0.91
I33 0.65
I34 0.92
I35 0.72
I36 0.85
I37 0.87
I38 0.81
I39 0.86
I40 0.75
I41 0.68
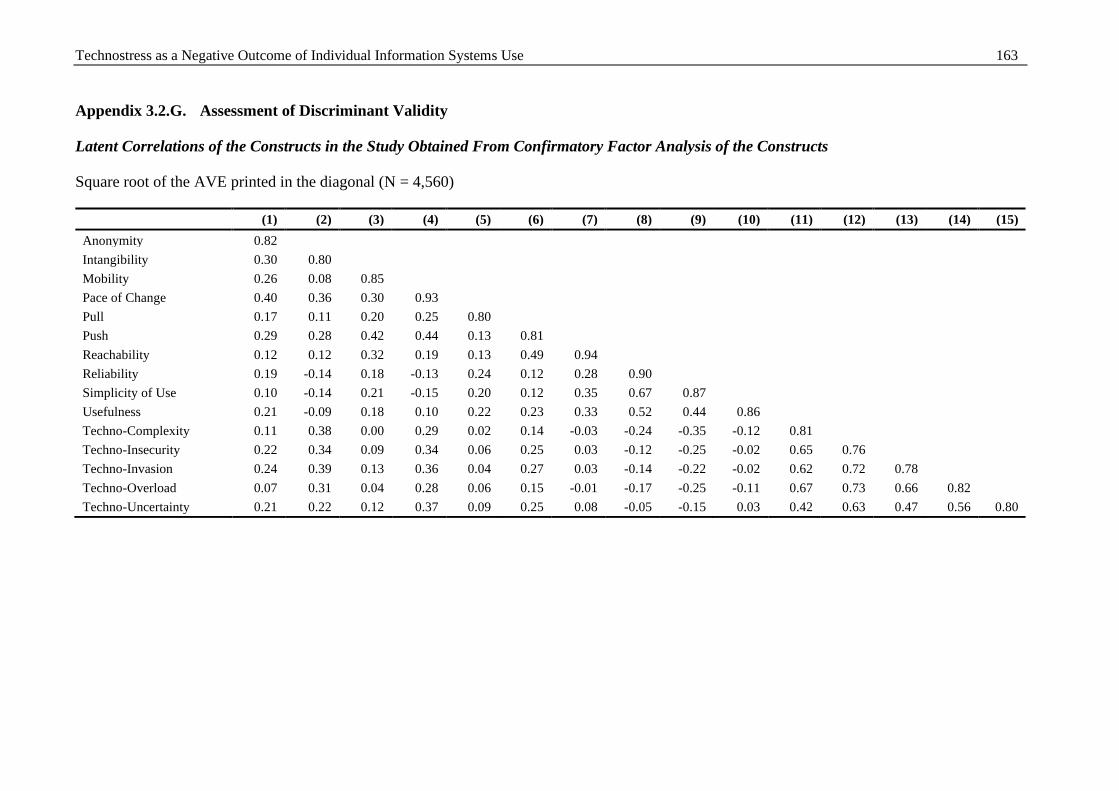
Technostress as a Negative Outcome of Individual Information Systems Use 163
Appendix 3.2.G. Assessment of Discriminant Validity
Latent Correlations of the Constructs in the Study Obtained From Confirmatory Factor Analysis of the Constructs
Square root of the AVE printed in the diagonal (N = 4,560)
(1) (2) (3) (4) (5) (6) (7) (8) (9) (10) (11) (12) (13) (14) (15)
Anonymity 0.82
Intangibility 0.30 0.80
Mobility 0.26 0.08 0.85
Pace of Change 0.40 0.36 0.30 0.93
Pull 0.17 0.11 0.20 0.25 0.80
Push 0.29 0.28 0.42 0.44 0.13 0.81
Reachability 0.12 0.12 0.32 0.19 0.13 0.49 0.94
Reliability 0.19 -0.14 0.18 -0.13 0.24 0.12 0.28 0.90
Simplicity of Use 0.10 -0.14 0.21 -0.15 0.20 0.12 0.35 0.67 0.87
Usefulness 0.21 -0.09 0.18 0.10 0.22 0.23 0.33 0.52 0.44 0.86
Techno-Complexity 0.11 0.38 0.00 0.29 0.02 0.14 -0.03 -0.24 -0.35 -0.12 0.81
Techno-Insecurity 0.22 0.34 0.09 0.34 0.06 0.25 0.03 -0.12 -0.25 -0.02 0.65 0.76
Techno-Invasion 0.24 0.39 0.13 0.36 0.04 0.27 0.03 -0.14 -0.22 -0.02 0.62 0.72 0.78
Techno-Overload 0.07 0.31 0.04 0.28 0.06 0.15 -0.01 -0.17 -0.25 -0.11 0.67 0.73 0.66 0.82
Techno-Uncertainty 0.21 0.22 0.12 0.37 0.09 0.25 0.08 -0.05 -0.15 0.03 0.42 0.63 0.47 0.56 0.80
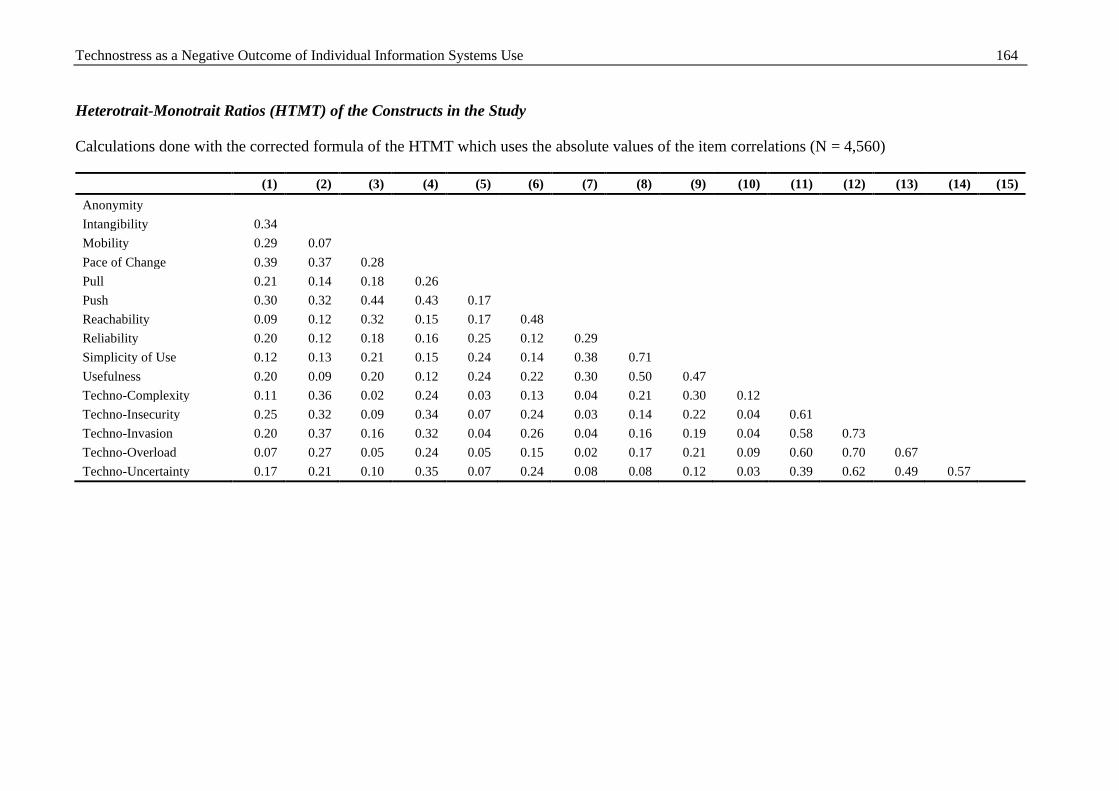
Technostress as a Negative Outcome of Individual Information Systems Use 164
Heterotrait-Monotrait Ratios (HTMT) of the Constructs in the Study
Calculations done with the corrected formula of the HTMT which uses the absolute values of the item correlations (N = 4,560)
(1) (2) (3) (4) (5) (6) (7) (8) (9) (10) (11) (12) (13) (14) (15)
Anonymity
Intangibility 0.34
Mobility 0.29 0.07
Pace of Change 0.39 0.37 0.28
Pull 0.21 0.14 0.18 0.26
Push 0.30 0.32 0.44 0.43 0.17
Reachability 0.09 0.12 0.32 0.15 0.17 0.48
Reliability 0.20 0.12 0.18 0.16 0.25 0.12 0.29
Simplicity of Use 0.12 0.13 0.21 0.15 0.24 0.14 0.38 0.71
Usefulness 0.20 0.09 0.20 0.12 0.24 0.22 0.30 0.50 0.47
Techno-Complexity 0.11 0.36 0.02 0.24 0.03 0.13 0.04 0.21 0.30 0.12
Techno-Insecurity 0.25 0.32 0.09 0.34 0.07 0.24 0.03 0.14 0.22 0.04 0.61
Techno-Invasion 0.20 0.37 0.16 0.32 0.04 0.26 0.04 0.16 0.19 0.04 0.58 0.73
Techno-Overload 0.07 0.27 0.05 0.24 0.05 0.15 0.02 0.17 0.21 0.09 0.60 0.70 0.67
Techno-Uncertainty 0.17 0.21 0.10 0.35 0.07 0.24 0.08 0.08 0.12 0.03 0.39 0.62 0.49 0.57
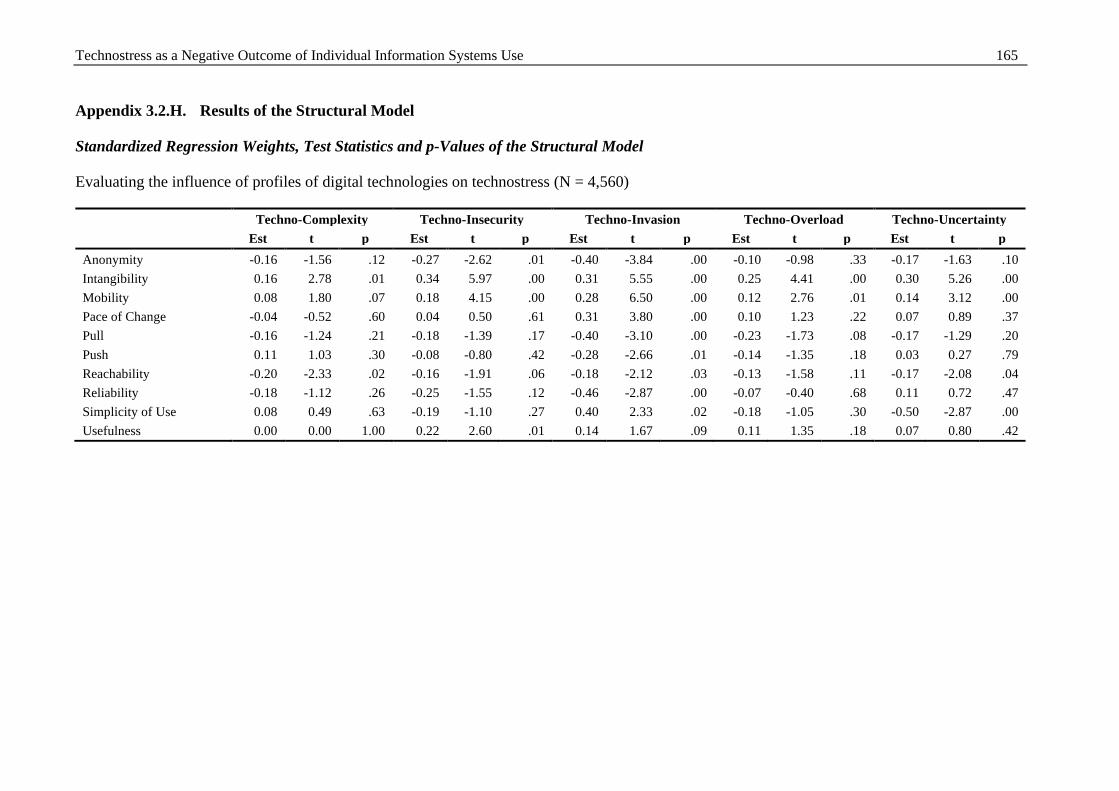
Technostress as a Negative Outcome of Individual Information Systems Use 165
Appendix 3.2.H. Results of the Structural Model
Standardized Regression Weights, Test Statistics and p-Values of the Structural Model
Evaluating the influence of profiles of digital technologies on technostress (N = 4,560)
Techno-Complexity Techno-Insecurity Techno-Invasion Techno-Overload Techno-Uncertainty
Est t p Est t p Est t p Est t p Est t p
Anonymity -0.16 -1.56 .12 -0.27 -2.62 .01 -0.40 -3.84 .00 -0.10 -0.98 .33 -0.17 -1.63 .10
Intangibility 0.16 2.78 .01 0.34 5.97 .00 0.31 5.55 .00 0.25 4.41 .00 0.30 5.26 .00
Mobility 0.08 1.80 .07 0.18 4.15 .00 0.28 6.50 .00 0.12 2.76 .01 0.14 3.12 .00
Pace of Change -0.04 -0.52 .60 0.04 0.50 .61 0.31 3.80 .00 0.10 1.23 .22 0.07 0.89 .37
Pull -0.16 -1.24 .21 -0.18 -1.39 .17 -0.40 -3.10 .00 -0.23 -1.73 .08 -0.17 -1.29 .20
Push 0.11 1.03 .30 -0.08 -0.80 .42 -0.28 -2.66 .01 -0.14 -1.35 .18 0.03 0.27 .79
Reachability -0.20 -2.33 .02 -0.16 -1.91 .06 -0.18 -2.12 .03 -0.13 -1.58 .11 -0.17 -2.08 .04
Reliability -0.18 -1.12 .26 -0.25 -1.55 .12 -0.46 -2.87 .00 -0.07 -0.40 .68 0.11 0.72 .47
Simplicity of Use 0.08 0.49 .63 -0.19 -1.10 .27 0.40 2.33 .02 -0.18 -1.05 .30 -0.50 -2.87 .00
Usefulness 0.00 0.00 1.00 0.22 2.60 .01 0.14 1.67 .09 0.11 1.35 .18 0.07 0.80 .42
Technostress as a Negative Outcome of Individual Information Systems Use 166
3.3 Extending the Concept of Technostress: The Hierarchical Structure of
Digital Stress
Abstract
Increasing use of digital technologies at workplaces has led to technostress. Research concep-
tualizing technostress dates to over a decade ago. Given that digital technologies are now pre-
sent in unprecedented variety, pervasiveness, and usage intensity, the question arises whether
the current technostress concept is still up to date. To answer this question we designed a se-
quential qualitative-quantitative mixed-methods study that includes interviews, focus group
discussions, and multiple surveys, using over 5,000 participants drawn from members of the
German workforce. Key results are as follows: Based on theoretical reasoning and empirical
data, we present a holistic framework of twelve demands from work relating to digital technol-
ogy use and present a valid and reliable survey-based measurement model to assess the de-
mands. The twelve demands integrate nine demands described as technostress creators and re-
lated concepts in previous literature, as well as three newly identified demands. Our data sug-
gest a hierarchical structure with four second-order factors underlying the demands. Further,
we embed the hierarchical model in a nomological net that reveals work- and health-related
effects. Finally, given the magnitude of change regarding the considered stress creators and the
context of digital transformation, we suggest the concept of “digital stress” as an updated ex-
tension of technostress.
Keywords: Technostress, Digital Stress, Digital Work, Demands, Multilevel Structure, Mixed-
Methods
Authors: Prof. Dr. Henner Gimpel, Julia Lanzl (M. Sc.), Dr. Christian Regal, Prof. Dr. Nils
Urbach, Dr. Julia Becker, Prof. Dr. Torsten Kühlmann, Mathias Certa (M. A.), Dr. Patricia
Tegtmeier
Status: Working paper under review for publication.
Technostress as a Negative Outcome of Individual Information Systems Use 167
3.3.1 Introduction
Recent sociotechnical developments caused by ongoing digitalization (e.g., artificial intelli-
gence, robotic process automation, anthropomorphic systems) have dramatically changed the
work environment and culture. The COVID-19 pandemic has further intensified this change by
necessitating an increasing amount of virtual collaborations and employees working remotely.
Digital and smart workplace technologies are facilitating business processes and providing ef-
ficient communication and collaboration tools, “increasing the productivity of the workforce in
the information age” (Attaran et al. 2019, p. 1).
However, the use of digital technologies also has significant downsides: for example, infor-
mation flows across many different channels, frequent interruptions, and blurred boundaries
between work and private life (Tarafdar et al. 2010). Such demands may cause a specific form
of stress, identified already in the 1980s when Brod (1982, 1984) coined the term technostress
to describe the human cost of the computer revolution. However, the intensity of use and diver-
sity of digital technologies and virtual collaboration available in the business context has
changed dramatically since the 1980s. The contemporary perspective of technostress was
shaped more than two decades later by seminal papers such as Tarafdar et al. (2007), Ragu-
Nathan et al. (2008), and Ayyagari et al. (2011). The core framework centers on a misfit be-
tween demands arising from digital technology use and a person’s resources to cope with these
demands. Many consider the five technostress creators introduced by Tarafdar et al. (2007) and
Ragu-Nathan et al. (2008) to be the standard concept of technostress (e.g., Benlian 2020; Califf
et al. 2020). Although these papers also identify the bright sides of IT use, including productive
challenges, high performance, learning, personal growth, and positive emotions (Benlian 2020;
Califf et al. 2020; Tarafdar et al. 2019a), we focus on the dark side of technostress in this paper.
IT use behavior necessitates the investigation of technostress. Tarafdar et al. (2007, p. 304)
suggested that “given the proliferation of ICTs in the workplace in recent years, there are a
number of ways in which their use can create stress for people using them.” Likewise, Ayyagari
et al. (2011, p. 831) stated that “with the proliferation and ubiquity of information and commu-
nication technologies, it is becoming imperative for individuals to constantly engage with these
technologies in order to get work accomplished.” About a decade after the publication of these
seminal works, Fischer et al. (2019, p. 1822) argued that they “see no reason why this develop-
ment would have stopped.”
Ragu-Nathan et al.’s (2008) paper was first submitted to Information Systems Research in July
2005; however, the data were acquired earlier. At that point in time, IT-enabled work was
Technostress as a Negative Outcome of Individual Information Systems Use 168
shaped by a wide diffusion of PCs and the Internet. However, Facebook was only a year old
and social computing was in its infancy, with the term Web 2.0 becoming popular by the end
of 2005. Google’s CEO first used the term “cloud computing” in August 2006 (Regalado 2011)
and mobile computing began to emerge in 2007 with the release of the first iPhone. Work and
IT use for work have arguably changed substantially since these times. Technologies related to
social, mobile, analytics, cloud, and the internet of things – summarized in the popular SMACIT
acronym (Sebastian et al. 2017) – are now widely available at workplaces. Further, some work-
places feature the use of artificial intelligence, augmented and virtual reality, 3D printing and
other advanced digital technologies. These digital technologies do not merely represent the
world, they shape our world and lead to fundamental changes at work (Baskerville et al. 2020).
Tarafdar et al. (2019a, p. 7) recently argued that technostress is a “continually evolving phe-
nomenon as new types of IS […] and their use persistently emerge and reveal novel aspects of
it.” Similarly, La Torre et al. (2019) stated that the definition of technostress has changed over
time. Tarafdar et al. (2019a) acknowledged this dynamism by updating their core conceptual-
ization of technostress by assigning new dimensions to known technostress creators.
This dynamism of technostress concepts can be seen, for example, in a literature study on tech-
nostress conducted by Nisafani et al. (2020), who found indications for additional technostress
creators, which, however, refer less to the technology itself than how it is handled and users’
expectations (e.g., role ambiguity, flexibility). However, Fischer et al. (2019) remarked that it
is disputable whether new aspects can simply be added to a small set of known technostress
creators (e.g., techno-invasion, techno-insecurity) or whether additional dimensions are needed.
This debate raises the question of whether the present concept of “technostress” is still up to
date and accounts for the prevailing circumstances, given the unprecedented variety, pervasive-
ness, and usage intensity of digital technologies in all domains of life.
Contemporary research in the field of technostress deals with topics such as stress appraisal
(e.g., Benlian 2020; Califf et al. 2020), stress coping (Pirkkalainen et al. 2019; Tarafdar et al.
2019b), stress outcomes (e.g., Chen et al. 2019; La Torre et al. 2020), and the design of stress-
sensitive systems (e.g., Adam et al. 2017; Jimenez and Bregenzer 2018). These research foci
are valuable and essential since it is the appraisal of technostress creators and the application
of coping measures that determine the extent to which employees experience technostress and
its negative consequences. At the same time, however, it is also crucial to examine how working
life has changed and how this change affects technostress creators, their perception by employ-
ees, and appropriate prevention and coping measures. Only an up-to-date understanding of
Technostress as a Negative Outcome of Individual Information Systems Use 169
digital work demands that create stress will allow researchers to study the appraisal, coping,
outcomes, and system design concerning these demands.
Therefore, a conceptualization of stress caused by digital technology use that fits the new soci-
otechnical context of digital work is important for understanding the resulting psychological
strain and its organizational and personal consequences (e.g., low productivity, dissatisfaction
at work, health issues) and to allow researchers and practitioners to design and analyze
measures to counter this dark side of digital transformation. We do not suggest that an entirely
new theory of technostress is needed. However, context matters for theories (Hong et al. 2014),
and the digital transformation (Vial 2019) has changed the technological, organizational, and
social context of work for many individuals. We believe the time has come to update tech-
nostress theory. Toward this end, we adopt a cumulative knowledge perspective, and pose the
following research questions:
RQ1: What demands from contemporary work practices relating to digital technologies
cause stress for employees?
RQ2: How do these different demands relate to each other?
To answer these research questions, we applied a sequential qualitative-quantitative mixed-
methods research design, following the guidelines proposed by Venkatesh et al. (2013) and
Venkatesh et al. (2016). Our research is divided into a qualitative phase that relies on expert
interviews and focus group discussions and grounds our research in a general conceptual frame-
work, followed by a quantitative phase analyzing survey data from a total of 5,005 employees.
Key contributions are as follows: First, we present a holistic framework of twelve contemporary
digital work demands, summarizing demands spread across different studies and adding new
demands. Second, based on theoretical and empirical evidence, we model the hierarchical struc-
ture of these demands. Third, given the magnitude of change related to the considered stress
creators and the context of digitalization, we propose the concept of “digital stress” as an update
to and extension of technostress. Fourth, we present and validate a survey-based measurement
model for the complete set of demands.
In the following section, we describe the conceptual foundation and current state of knowledge.
Our mixed-methods research process and related design decisions are explained in Section
3.3.3. Section 3.3.4 presents the qualitative phase of our research and focuses on the conceptual
development of stress induced by digital technologies. Section 3.3.5 introduces the quantitative
Technostress as a Negative Outcome of Individual Information Systems Use 170
phase and presents the survey results. Section 3.3.6 discusses the results and the meta-infer-
ences, and Section 3.3.7 concludes the paper.
3.3.2 Conceptual Foundation
Brod (1984, p. 16) describes technostress as “a modern disease of adaptation caused by an ina-
bility to cope with the new computer technologies in a healthy manner,” illuminating the phe-
nomenon from an early perspective. The scholarly concept presented in Tarafdar et al. (2007,
p. 304) specifically focuses on the workplace, stating that “in the organizational context, tech-
nostress is caused by individuals’ attempts and struggles to deal with constantly evolving [in-
formation and communication technologies] and the changing physical, social, and cognitive
requirements related to their use.” These definitions stem from different decades and contexts
but, importantly, they are both based on the transactional theory of stress. According to this
theory, stress is more than a threatening, potentially harmful event and entails more than the
individual’s response to a stressor. Stress is anchored neither solely in the environment nor in
the person; it is created in a transactional process (Lazarus and Folkman 1984). Demands are
transmitted from the environment to a person through appraisal, which signifies the validation
of situational facets “with respect to the significance for well-being” (Lazarus and Folkman
1984, p. 31) along with one’s resources and ability to handle this situation.
Following Lazarus and Folkman (1984), technostress arises when negative consequences re-
sulting from digital technology use are anticipated and an imbalance occurs between these de-
mands, and the user’s personal or organizational resources to meet the demands (Tarafdar et al.
2007). Digital technologies exist in various forms and refer to a “combinations of information,
computing, communication, and connectivity technologies” (Bharadwaj et al. 2013, p. 471). By
using these new technologies in a working context, work becomes more digital. We define
digital work as the “effort to create digital goods or that makes substantial use of digital tools”
(Durward et al. 2016, p. 283). While further definitions propose a broad perspective in which
current work practices always entail digital aspects (Orlikowski and Scott 2017), we view dig-
ital work as essentially knowledge work in the framework of this study (Nash et al. 2018).
In their recent literature analysis of existing work on technostress, Tarafdar et al. (2019a) struc-
tured existing research on technostress along with a framework that builds on the transactional
process. This framework includes technology environmental conditions, technostress creators,
consequences, and moderators of the technostress creators and outcomes relationship. Our fo-
cus here is on technostress creators, which are specific demanding conditions that occur during
Technostress as a Negative Outcome of Individual Information Systems Use 171
digital technology use and must be met using personal resources. Techno-invasion, techno-
overload, techno-complexity, techno-uncertainty, and techno-insecurity are well-known tech-
nostress creators (Ragu-Nathan et al. 2008; Tarafdar et al. 2007). Techno-invasion refers to
situations that require being constantly available and connected, which may cause the boundary
between work and private life to blur. Techno-overload is associated with situations in which
digital technologies induce a greater workload and higher speed of work. Techno-complexity
describes situations where digital technologies make users feel that they lack the skills and
experiences necessary to deal with the complexities of digital technologies and are forced to
spend time and effort learning about them. Techno-uncertainty refers to situations in which
digital technologies are frequently changed and upgraded, requiring users to continually de-
velop their abilities and knowledge. Techno-insecurity describes situations where users per-
ceive the threat of losing their job due to automation or the lack of skills needed to deal with
digital technologies.
The five well-established technostress creators introduced by Tarafdar et al. (2007) and Ragu-
Nathan et al. (2008) have attracted much attention in the research on technostress and are still
considered to be state-of-the-art conceptualizations of technostress. Califf et al. (2020, p. 812)
state that “in IS research, technostress is composed of five dimensions” and Benlian (2020,
p. 1264) refers to them as “classical technostress creators.” Many other recent studies also refer
to these technostress creators (e.g., Güğerçin 2020; Korzynski et al. 2021; Molino et al. 2020;
Pflügner et al. 2020; Pflügner et al. 2021). However, other aspects discussed in the literature
are also capable of creating technostress and can cause negative consequences for individuals
using technologies at the workplace.
Fischer and Riedl (2015) and Adam et al. (2017), for example, discuss techno-unreliability.
This technology-related stressor comprises system malfunctions as well as IT hassles. Galluch
et al. (2015) focus on interruptions enabled by digital technology, such as emails and instant
messages. Ayyagari et al. (2011) consider role ambiguity and the invasion of privacy to be part
of the technostress concept. Role ambiguity describes the unpredictable consequences emerging
from the conflict between the need to perform a role and the lack of information to adequately
do so. This might occur, for example, when an employee is unsure whether to prioritize dealing
with technical problems or work activities. Invasion of privacy involves the perceived impair-
ment of one’s privacy. Invasion of privacy is not to be confused with techno-invasion. While
techno-invasion focuses on the blurring of boundaries between work and private life, invasion
of privacy refers to the perception that the private and occupational use of digital technologies
Technostress as a Negative Outcome of Individual Information Systems Use 172
during work time can easily be traced, potentially allowing the employer or coworkers to invade
one’s privacy.
3.3.3 Research Process
We followed a mixed-methods design. Mixed-methods research designs “contain elements of
both quantitative and qualitative approaches” (Tashakkori and Teddlie 1998, p. 5). Within the
IS discipline, mixed-methods designs are beneficial since context changes frequently and re-
searchers may have difficulty drawing significant insights from existing theories and perspec-
tives (Venkatesh et al. 2013). Mixed-methods designs offer three specific benefits: the ability
to “address confirmatory and explanatory research questions,” to “provide stronger inferences
than a single method or worldview,” and to “produce a greater assortment of divergent and/or
complementary views” (Venkatesh et al. 2016, p. 437). Given the general multiplicity of studies
on technostress and the changed context, a mixed-methods design is well suited to our work.
Our study’s mixed-methods design began with the articulation of two research questions. We
followed a developmental purpose, first conducting a qualitative study and then using the re-
sults from this study to develop the research model tested in the second quantitative phase of
research (Tashakkori and Teddlie 1998; Venkatesh et al. 2013; Venkatesh et al. 2016). We
adopted multiple paradigms as an epistemological stance. During the qualitative phase
(Phase 1), we take an interpretive perspective. During the quantitative phase (Phase 2), we
adopted a positivist approach. This methodology can be classified as “mixed-methods mul-
tistrand” approach (Venkatesh et al. 2016, p. 443), with both strands of research being equally
important. We used a sequential sampling strategy with parallel samples and performed data
analysis sequentially to help build the research model for the quantitative study based on the
results of the qualitative study (Venkatesh et al. 2016).
Overall, the mixed-methods design is divided into two phases (see Figure 3.3-1). In the quali-
tative phase, we accomplished the following: We grounded our research in a general conceptual
framework and compiled known demands of digital work discussed in this literature to provide
a holistic view of stress and technostress (Phase 1a). Subsequently, we revealed new digital
work demands through interviews with experts from various fields and through focus group
discussions. By identifying the currently most important/significant stressful aspects of the in-
teraction with digital technologies, we were able to understand the conditions that may give rise
to technostress (Phase 1b). We concluded this phase with qualitative inferences by analyzing
the interview data and iteratively reviewing the literature base. We thus defined the demands
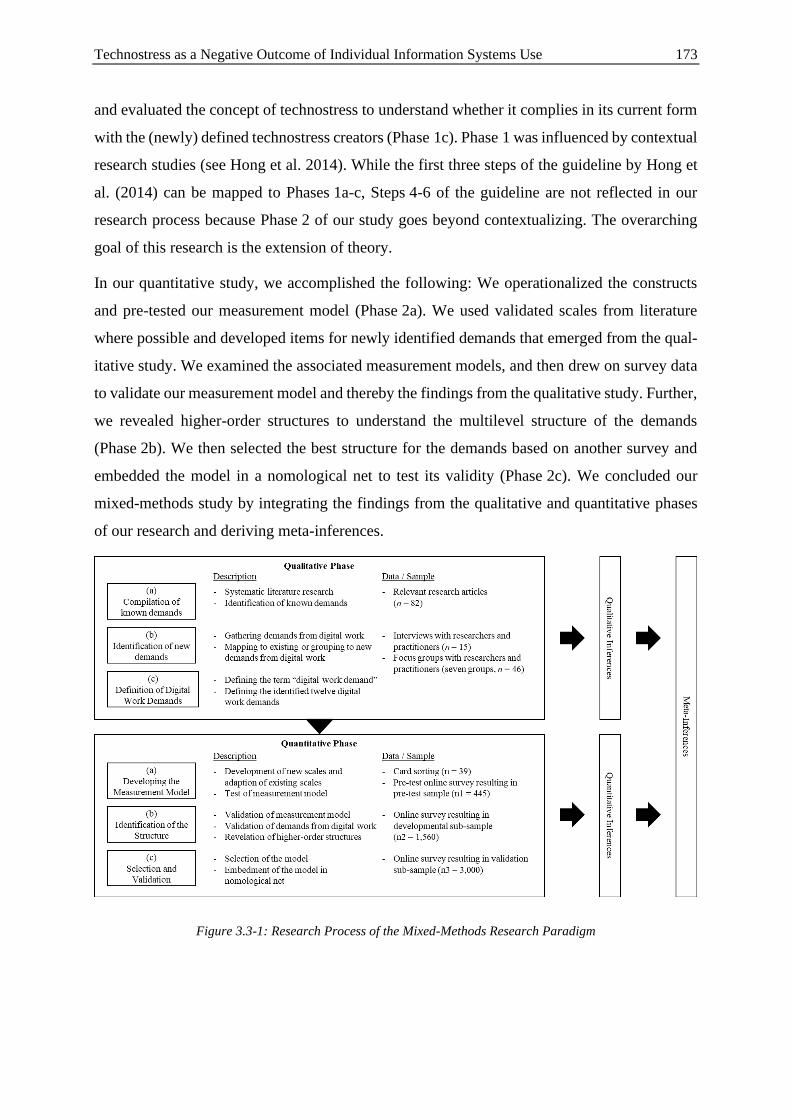
Technostress as a Negative Outcome of Individual Information Systems Use 173
and evaluated the concept of technostress to understand whether it complies in its current form
with the (newly) defined technostress creators (Phase 1c). Phase 1 was influenced by contextual
research studies (see Hong et al. 2014). While the first three steps of the guideline by Hong et
al. (2014) can be mapped to Phases 1a-c, Steps 4-6 of the guideline are not reflected in our
research process because Phase 2 of our study goes beyond contextualizing. The overarching
goal of this research is the extension of theory.
In our quantitative study, we accomplished the following: We operationalized the constructs
and pre-tested our measurement model (Phase 2a). We used validated scales from literature
where possible and developed items for newly identified demands that emerged from the qual-
itative study. We examined the associated measurement models, and then drew on survey data
to validate our measurement model and thereby the findings from the qualitative study. Further,
we revealed higher-order structures to understand the multilevel structure of the demands
(Phase 2b). We then selected the best structure for the demands based on another survey and
embedded the model in a nomological net to test its validity (Phase 2c). We concluded our
mixed-methods study by integrating the findings from the qualitative and quantitative phases
of our research and deriving meta-inferences.
Figure 3.3-1: Research Process of the Mixed-Methods Research Paradigm
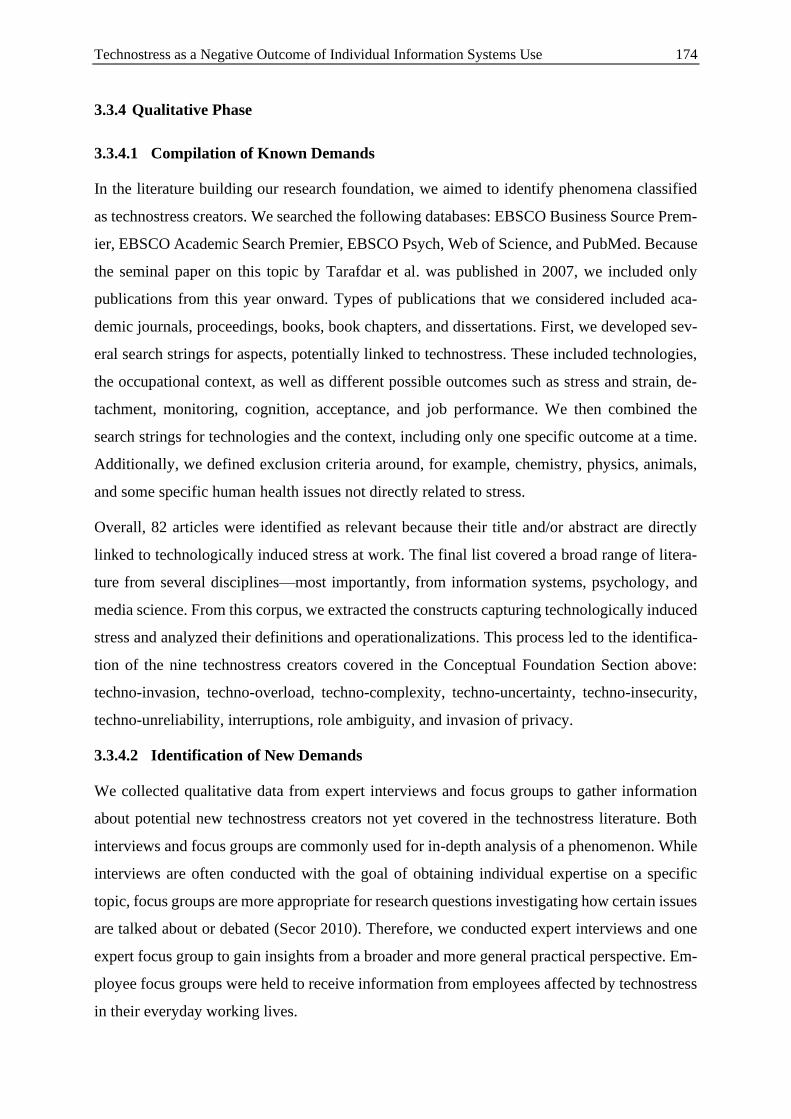
Technostress as a Negative Outcome of Individual Information Systems Use 174
3.3.4 Qualitative Phase
3.3.4.1 Compilation of Known Demands
In the literature building our research foundation, we aimed to identify phenomena classified
as technostress creators. We searched the following databases: EBSCO Business Source Prem-
ier, EBSCO Academic Search Premier, EBSCO Psych, Web of Science, and PubMed. Because
the seminal paper on this topic by Tarafdar et al. was published in 2007, we included only
publications from this year onward. Types of publications that we considered included aca-
demic journals, proceedings, books, book chapters, and dissertations. First, we developed sev-
eral search strings for aspects, potentially linked to technostress. These included technologies,
the occupational context, as well as different possible outcomes such as stress and strain, de-
tachment, monitoring, cognition, acceptance, and job performance. We then combined the
search strings for technologies and the context, including only one specific outcome at a time.
Additionally, we defined exclusion criteria around, for example, chemistry, physics, animals,
and some specific human health issues not directly related to stress.
Overall, 82 articles were identified as relevant because their title and/or abstract are directly
linked to technologically induced stress at work. The final list covered a broad range of litera-
ture from several disciplines—most importantly, from information systems, psychology, and
media science. From this corpus, we extracted the constructs capturing technologically induced
stress and analyzed their definitions and operationalizations. This process led to the identifica-
tion of the nine technostress creators covered in the Conceptual Foundation Section above:
techno-invasion, techno-overload, techno-complexity, techno-uncertainty, techno-insecurity,
techno-unreliability, interruptions, role ambiguity, and invasion of privacy.
3.3.4.2 Identification of New Demands
We collected qualitative data from expert interviews and focus groups to gather information
about potential new technostress creators not yet covered in the technostress literature. Both
interviews and focus groups are commonly used for in-depth analysis of a phenomenon. While
interviews are often conducted with the goal of obtaining individual expertise on a specific
topic, focus groups are more appropriate for research questions investigating how certain issues
are talked about or debated (Secor 2010). Therefore, we conducted expert interviews and one
expert focus group to gain insights from a broader and more general practical perspective. Em-
ployee focus groups were held to receive information from employees affected by technostress
in their everyday working lives.
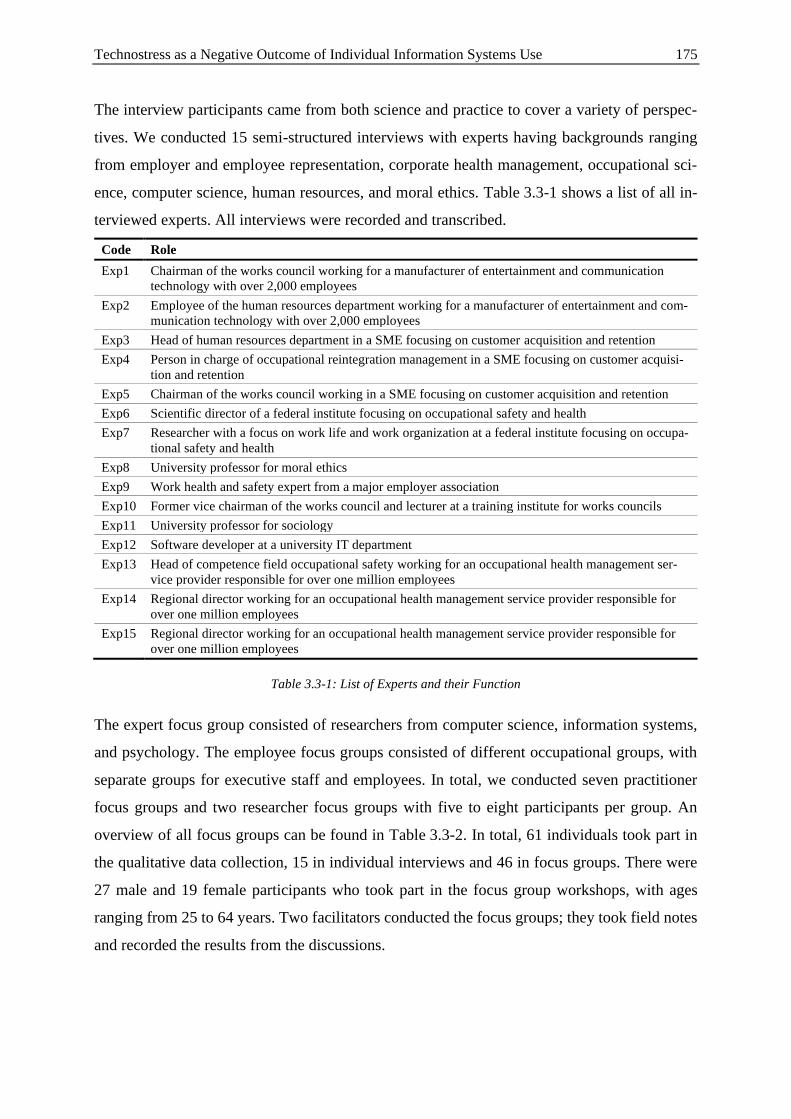
Technostress as a Negative Outcome of Individual Information Systems Use 175
The interview participants came from both science and practice to cover a variety of perspec-
tives. We conducted 15 semi-structured interviews with experts having backgrounds ranging
from employer and employee representation, corporate health management, occupational sci-
ence, computer science, human resources, and moral ethics. Table 3.3-1 shows a list of all in-
terviewed experts. All interviews were recorded and transcribed.
Code Role
Exp1 Chairman of the works council working for a manufacturer of entertainment and communication
technology with over 2,000 employees
Exp2 Employee of the human resources department working for a manufacturer of entertainment and com-
munication technology with over 2,000 employees
Exp3 Head of human resources department in a SME focusing on customer acquisition and retention
Exp4 Person in charge of occupational reintegration management in a SME focusing on customer acquisi-
tion and retention
Exp5 Chairman of the works council working in a SME focusing on customer acquisition and retention
Exp6 Scientific director of a federal institute focusing on occupational safety and health
Exp7 Researcher with a focus on work life and work organization at a federal institute focusing on occupa-
tional safety and health
Exp8 University professor for moral ethics
Exp9 Work health and safety expert from a major employer association
Exp10 Former vice chairman of the works council and lecturer at a training institute for works councils
Exp11 University professor for sociology
Exp12 Software developer at a university IT department
Exp13 Head of competence field occupational safety working for an occupational health management ser-
vice provider responsible for over one million employees
Exp14 Regional director working for an occupational health management service provider responsible for
over one million employees
Exp15 Regional director working for an occupational health management service provider responsible for
over one million employees
Table 3.3-1: List of Experts and their Function
The expert focus group consisted of researchers from computer science, information systems,
and psychology. The employee focus groups consisted of different occupational groups, with
separate groups for executive staff and employees. In total, we conducted seven practitioner
focus groups and two researcher focus groups with five to eight participants per group. An
overview of all focus groups can be found in Table 3.3-2. In total, 61 individuals took part in
the qualitative data collection, 15 in individual interviews and 46 in focus groups. There were
27 male and 19 female participants who took part in the focus group workshops, with ages
ranging from 25 to 64 years. Two facilitators conducted the focus groups; they took field notes
and recorded the results from the discussions.
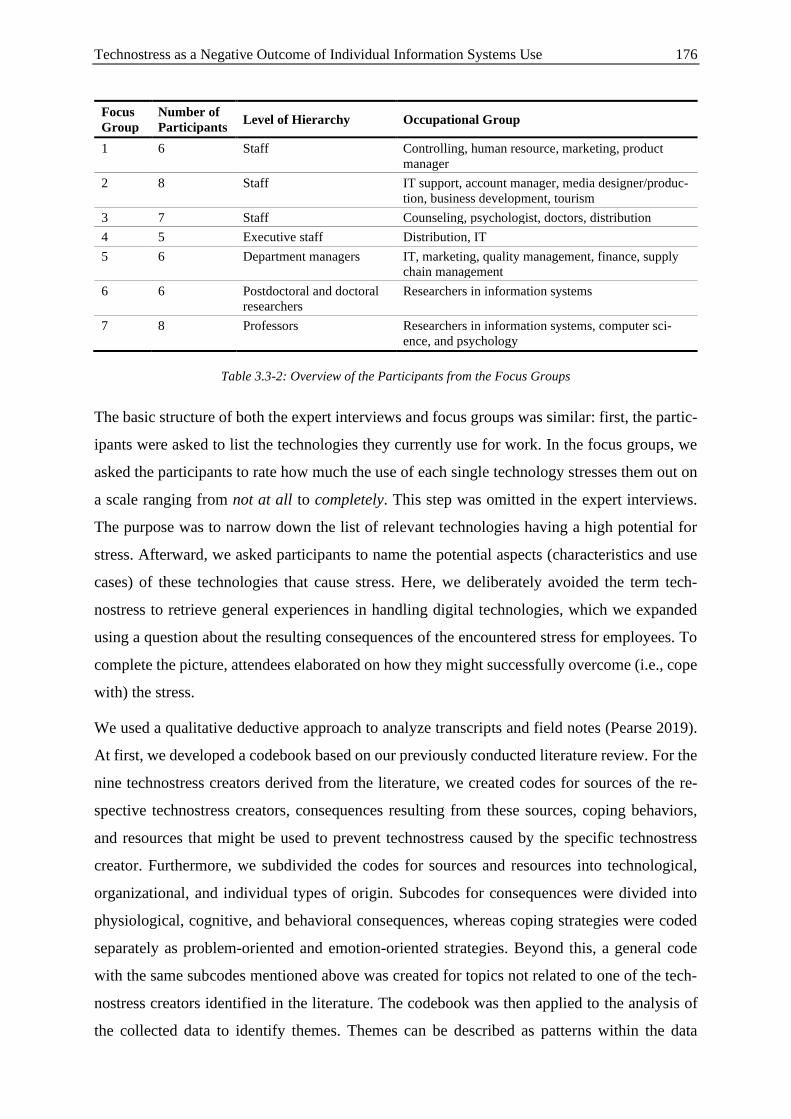
Technostress as a Negative Outcome of Individual Information Systems Use 176
Focus
Group
Number of
Participants Level of Hierarchy Occupational Group
1 6 Staff Controlling, human resource, marketing, product
manager
2 8 Staff IT support, account manager, media designer/produc-
tion, business development, tourism
3 7 Staff Counseling, psychologist, doctors, distribution
4 5 Executive staff Distribution, IT
5 6 Department managers IT, marketing, quality management, finance, supply
chain management
6 6 Postdoctoral and doctoral
researchers
Researchers in information systems
7 8 Professors Researchers in information systems, computer sci-
ence, and psychology
Table 3.3-2: Overview of the Participants from the Focus Groups
The basic structure of both the expert interviews and focus groups was similar: first, the partic-
ipants were asked to list the technologies they currently use for work. In the focus groups, we
asked the participants to rate how much the use of each single technology stresses them out on
a scale ranging from not at all to completely. This step was omitted in the expert interviews.
The purpose was to narrow down the list of relevant technologies having a high potential for
stress. Afterward, we asked participants to name the potential aspects (characteristics and use
cases) of these technologies that cause stress. Here, we deliberately avoided the term tech-
nostress to retrieve general experiences in handling digital technologies, which we expanded
using a question about the resulting consequences of the encountered stress for employees. To
complete the picture, attendees elaborated on how they might successfully overcome (i.e., cope
with) the stress.
We used a qualitative deductive approach to analyze transcripts and field notes (Pearse 2019).
At first, we developed a codebook based on our previously conducted literature review. For the
nine technostress creators derived from the literature, we created codes for sources of the re-
spective technostress creators, consequences resulting from these sources, coping behaviors,
and resources that might be used to prevent technostress caused by the specific technostress
creator. Furthermore, we subdivided the codes for sources and resources into technological,
organizational, and individual types of origin. Subcodes for consequences were divided into
physiological, cognitive, and behavioral consequences, whereas coping strategies were coded
separately as problem-oriented and emotion-oriented strategies. Beyond this, a general code
with the same subcodes mentioned above was created for topics not related to one of the tech-
nostress creators identified in the literature. The codebook was then applied to the analysis of
the collected data to identify themes. Themes can be described as patterns within the data
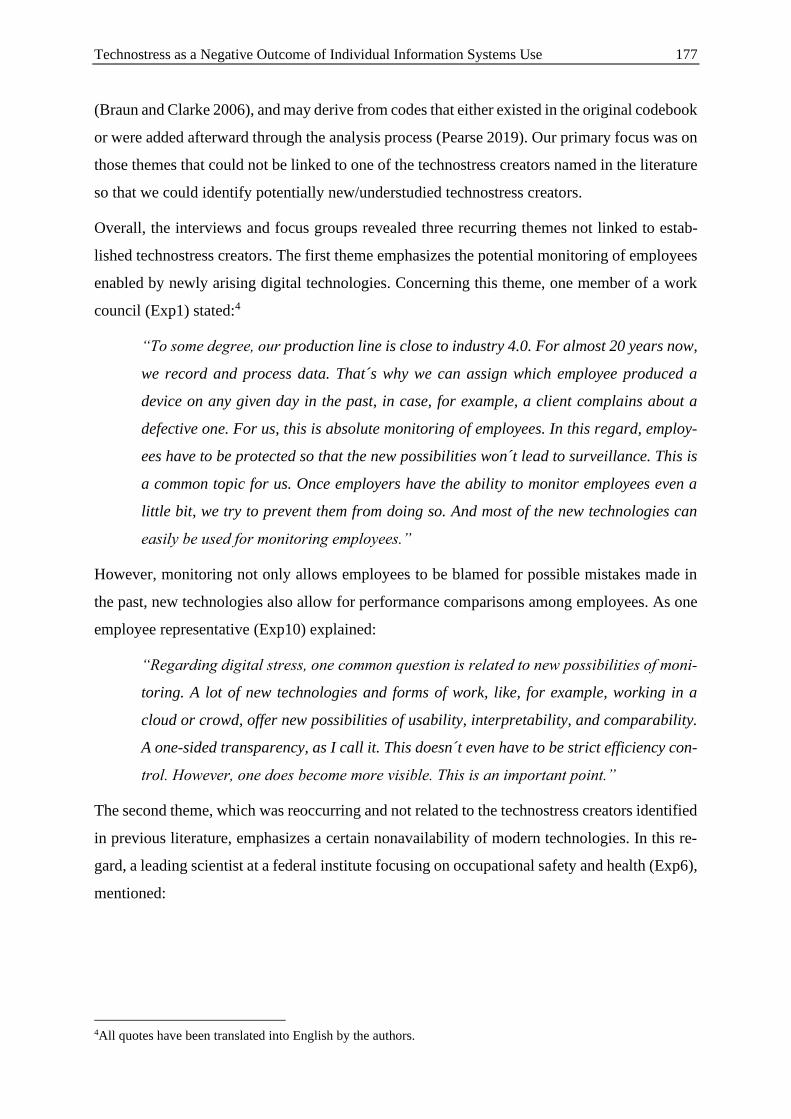
Technostress as a Negative Outcome of Individual Information Systems Use 177
(Braun and Clarke 2006), and may derive from codes that either existed in the original codebook
or were added afterward through the analysis process (Pearse 2019). Our primary focus was on
those themes that could not be linked to one of the technostress creators named in the literature
so that we could identify potentially new/understudied technostress creators.
Overall, the interviews and focus groups revealed three recurring themes not linked to estab-
lished technostress creators. The first theme emphasizes the potential monitoring of employees
enabled by newly arising digital technologies. Concerning this theme, one member of a work
council (Exp1) stated:4
“To some degree, our production line is close to industry 4.0. For almost 20 years now,
we record and process data. That´s why we can assign which employee produced a
device on any given day in the past, in case, for example, a client complains about a
defective one. For us, this is absolute monitoring of employees. In this regard, employ-
ees have to be protected so that the new possibilities won´t lead to surveillance. This is
a common topic for us. Once employers have the ability to monitor employees even a
little bit, we try to prevent them from doing so. And most of the new technologies can
easily be used for monitoring employees.”
However, monitoring not only allows employees to be blamed for possible mistakes made in
the past, new technologies also allow for performance comparisons among employees. As one
employee representative (Exp10) explained:
“Regarding digital stress, one common question is related to new possibilities of moni-
toring. A lot of new technologies and forms of work, like, for example, working in a
cloud or crowd, offer new possibilities of usability, interpretability, and comparability.
A one-sided transparency, as I call it. This doesn´t even have to be strict efficiency con-
trol. However, one does become more visible. This is an important point.”
The second theme, which was reoccurring and not related to the technostress creators identified
in previous literature, emphasizes a certain nonavailability of modern technologies. In this re-
gard, a leading scientist at a federal institute focusing on occupational safety and health (Exp6),
mentioned:
4All quotes have been translated into English by the authors.
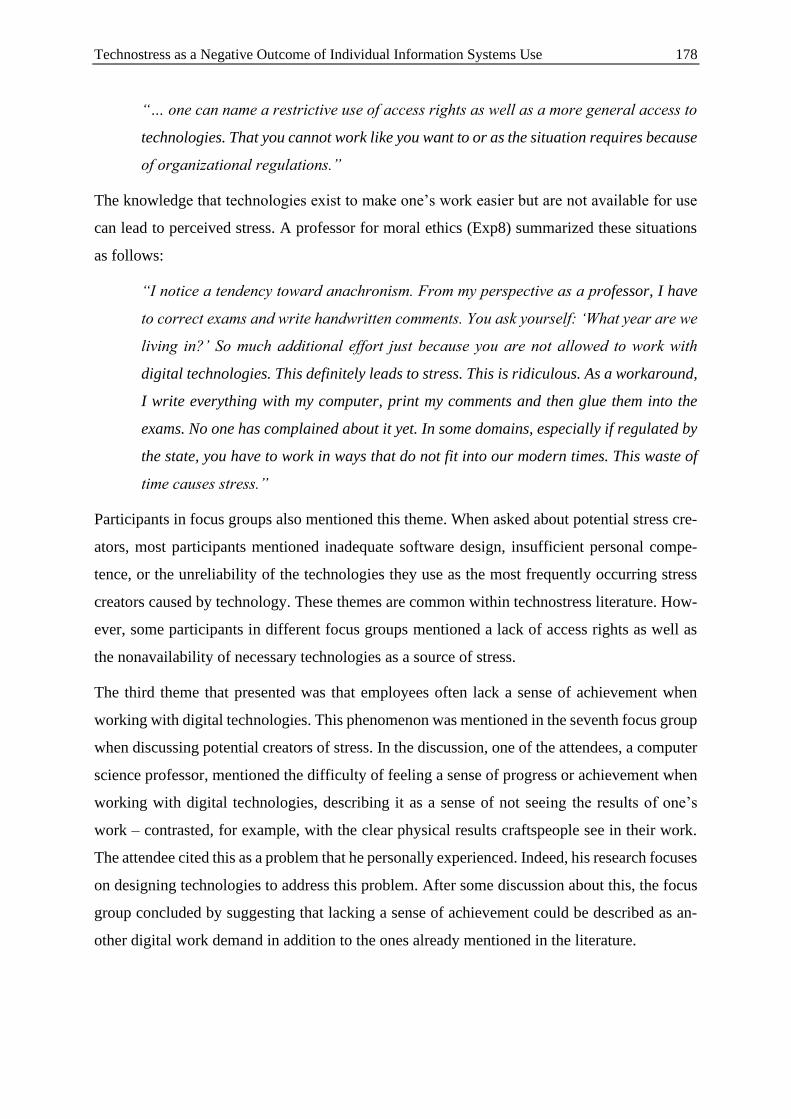
Technostress as a Negative Outcome of Individual Information Systems Use 178
“… one can name a restrictive use of access rights as well as a more general access to
technologies. That you cannot work like you want to or as the situation requires because
of organizational regulations.”
The knowledge that technologies exist to make one’s work easier but are not available for use
can lead to perceived stress. A professor for moral ethics (Exp8) summarized these situations
as follows:
“I notice a tendency toward anachronism. From my perspective as a professor, I have
to correct exams and write handwritten comments. You ask yourself: ‘What year are we
living in?’ So much additional effort just because you are not allowed to work with
digital technologies. This definitely leads to stress. This is ridiculous. As a workaround,
I write everything with my computer, print my comments and then glue them into the
exams. No one has complained about it yet. In some domains, especially if regulated by
the state, you have to work in ways that do not fit into our modern times. This waste of
time causes stress.”
Participants in focus groups also mentioned this theme. When asked about potential stress cre-
ators, most participants mentioned inadequate software design, insufficient personal compe-
tence, or the unreliability of the technologies they use as the most frequently occurring stress
creators caused by technology. These themes are common within technostress literature. How-
ever, some participants in different focus groups mentioned a lack of access rights as well as
the nonavailability of necessary technologies as a source of stress.
The third theme that presented was that employees often lack a sense of achievement when
working with digital technologies. This phenomenon was mentioned in the seventh focus group
when discussing potential creators of stress. In the discussion, one of the attendees, a computer
science professor, mentioned the difficulty of feeling a sense of progress or achievement when
working with digital technologies, describing it as a sense of not seeing the results of one’s
work – contrasted, for example, with the clear physical results craftspeople see in their work.
The attendee cited this as a problem that he personally experienced. Indeed, his research focuses
on designing technologies to address this problem. After some discussion about this, the focus
group concluded by suggesting that lacking a sense of achievement could be described as an-
other digital work demand in addition to the ones already mentioned in the literature.
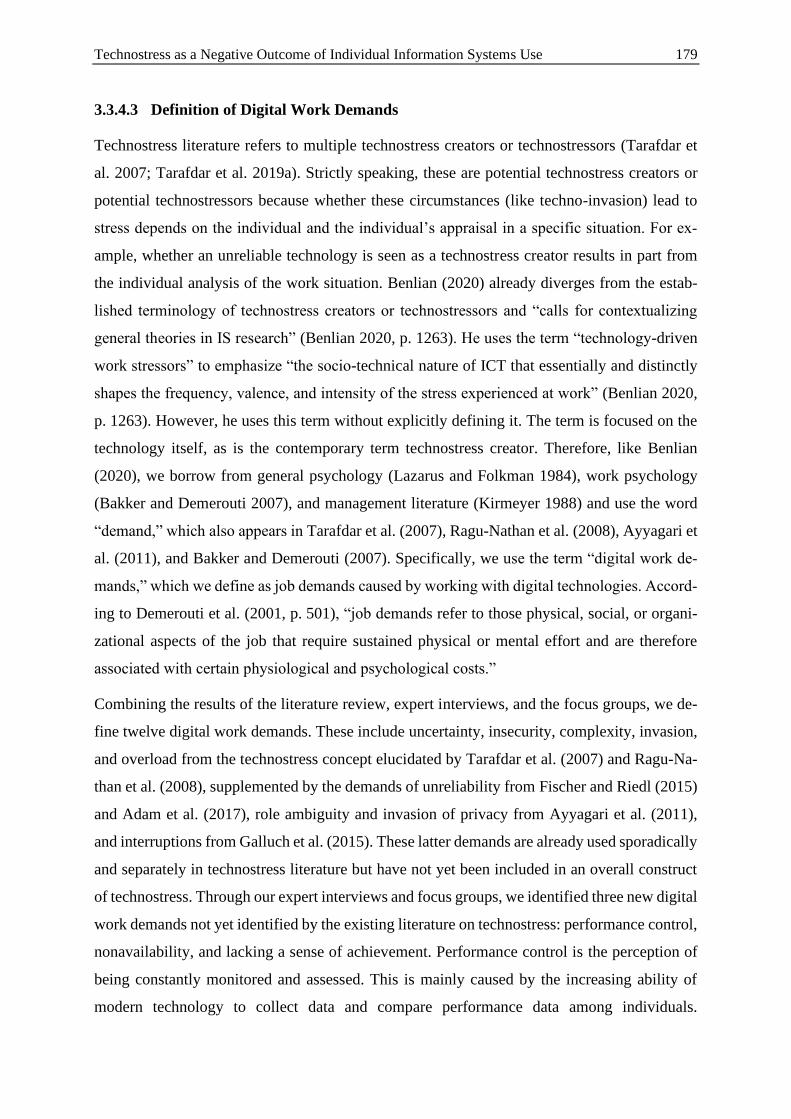
Technostress as a Negative Outcome of Individual Information Systems Use 179
3.3.4.3 Definition of Digital Work Demands
Technostress literature refers to multiple technostress creators or technostressors (Tarafdar et
al. 2007; Tarafdar et al. 2019a). Strictly speaking, these are potential technostress creators or
potential technostressors because whether these circumstances (like techno-invasion) lead to
stress depends on the individual and the individual’s appraisal in a specific situation. For ex-
ample, whether an unreliable technology is seen as a technostress creator results in part from
the individual analysis of the work situation. Benlian (2020) already diverges from the estab-
lished terminology of technostress creators or technostressors and “calls for contextualizing
general theories in IS research” (Benlian 2020, p. 1263). He uses the term “technology-driven
work stressors” to emphasize “the socio-technical nature of ICT that essentially and distinctly
shapes the frequency, valence, and intensity of the stress experienced at work” (Benlian 2020,
p. 1263). However, he uses this term without explicitly defining it. The term is focused on the
technology itself, as is the contemporary term technostress creator. Therefore, like Benlian
(2020), we borrow from general psychology (Lazarus and Folkman 1984), work psychology
(Bakker and Demerouti 2007), and management literature (Kirmeyer 1988) and use the word
“demand,” which also appears in Tarafdar et al. (2007), Ragu-Nathan et al. (2008), Ayyagari et
al. (2011), and Bakker and Demerouti (2007). Specifically, we use the term “digital work de-
mands,” which we define as job demands caused by working with digital technologies. Accord-
ing to Demerouti et al. (2001, p. 501), “job demands refer to those physical, social, or organi-
zational aspects of the job that require sustained physical or mental effort and are therefore
associated with certain physiological and psychological costs.”
Combining the results of the literature review, expert interviews, and the focus groups, we de-
fine twelve digital work demands. These include uncertainty, insecurity, complexity, invasion,
and overload from the technostress concept elucidated by Tarafdar et al. (2007) and Ragu-Na-
than et al. (2008), supplemented by the demands of unreliability from Fischer and Riedl (2015)
and Adam et al. (2017), role ambiguity and invasion of privacy from Ayyagari et al. (2011),
and interruptions from Galluch et al. (2015). These latter demands are already used sporadically
and separately in technostress literature but have not yet been included in an overall construct
of technostress. Through our expert interviews and focus groups, we identified three new digital
work demands not yet identified by the existing literature on technostress: performance control,
nonavailability, and lacking a sense of achievement. Performance control is the perception of
being constantly monitored and assessed. This is mainly caused by the increasing ability of
modern technology to collect data and compare performance data among individuals.
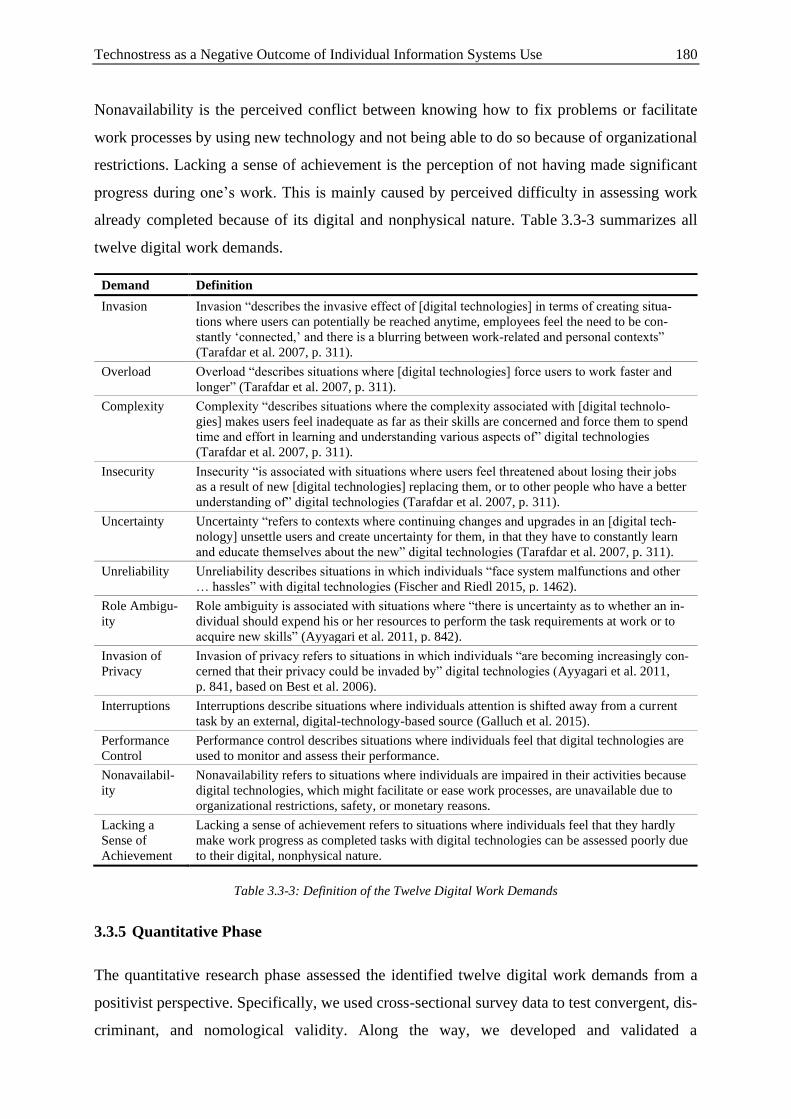
Technostress as a Negative Outcome of Individual Information Systems Use 180
Nonavailability is the perceived conflict between knowing how to fix problems or facilitate
work processes by using new technology and not being able to do so because of organizational
restrictions. Lacking a sense of achievement is the perception of not having made significant
progress during one’s work. This is mainly caused by perceived difficulty in assessing work
already completed because of its digital and nonphysical nature. Table 3.3-3 summarizes all
twelve digital work demands.
Demand Definition
Invasion Invasion “describes the invasive effect of [digital technologies] in terms of creating situa-
tions where users can potentially be reached anytime, employees feel the need to be con-
stantly ‘connected,’ and there is a blurring between work-related and personal contexts”
(Tarafdar et al. 2007, p. 311).
Overload Overload “describes situations where [digital technologies] force users to work faster and
longer” (Tarafdar et al. 2007, p. 311).
Complexity Complexity “describes situations where the complexity associated with [digital technolo-
gies] makes users feel inadequate as far as their skills are concerned and force them to spend
time and effort in learning and understanding various aspects of” digital technologies
(Tarafdar et al. 2007, p. 311).
Insecurity Insecurity “is associated with situations where users feel threatened about losing their jobs
as a result of new [digital technologies] replacing them, or to other people who have a better
understanding of” digital technologies (Tarafdar et al. 2007, p. 311).
Uncertainty Uncertainty “refers to contexts where continuing changes and upgrades in an [digital tech-
nology] unsettle users and create uncertainty for them, in that they have to constantly learn
and educate themselves about the new” digital technologies (Tarafdar et al. 2007, p. 311).
Unreliability Unreliability describes situations in which individuals “face system malfunctions and other
… hassles” with digital technologies (Fischer and Riedl 2015, p. 1462).
Role Ambigu-
ity
Role ambiguity is associated with situations where “there is uncertainty as to whether an in-
dividual should expend his or her resources to perform the task requirements at work or to
acquire new skills” (Ayyagari et al. 2011, p. 842).
Invasion of
Privacy
Invasion of privacy refers to situations in which individuals “are becoming increasingly con-
cerned that their privacy could be invaded by” digital technologies (Ayyagari et al. 2011,
p. 841, based on Best et al. 2006).
Interruptions Interruptions describe situations where individuals attention is shifted away from a current
task by an external, digital-technology-based source (Galluch et al. 2015).
Performance
Control
Performance control describes situations where individuals feel that digital technologies are
used to monitor and assess their performance.
Nonavailabil-
ity
Nonavailability refers to situations where individuals are impaired in their activities because
digital technologies, which might facilitate or ease work processes, are unavailable due to
organizational restrictions, safety, or monetary reasons.
Lacking a
Sense of
Achievement
Lacking a sense of achievement refers to situations where individuals feel that they hardly
make work progress as completed tasks with digital technologies can be assessed poorly due
to their digital, nonphysical nature.
Table 3.3-3: Definition of the Twelve Digital Work Demands
3.3.5 Quantitative Phase
The quantitative research phase assessed the identified twelve digital work demands from a
positivist perspective. Specifically, we used cross-sectional survey data to test convergent, dis-
criminant, and nomological validity. Along the way, we developed and validated a
Technostress as a Negative Outcome of Individual Information Systems Use 181
measurement instrument for digital work demands, demonstrated their prevalence, and identi-
fied a higher-order structure among these demands. The nomological net is a fundamental tool
for understanding constructs and building theory. Cronbach and Meehl (1955, p. 294) state that
“scientifically speaking, to make clear what something is means to set forth the laws in which
it occurs. We shall refer to the interlocking system of laws that constitute a theory as a nomo-
logical network.” This is done by embedding the construct of interest – in our case, the identi-
fied twelve digital work demands – in a nomological net with theoretically related entities and
empirically testing these relationships.
3.3.5.1 Developing the Measurement Model
The measurement instrument used to assess the latent digital work demands is essential for
quantitative investigation. For most of the digital work demands, validated survey scales exist.
However, measurement instruments had to be developed from scratch for the newly revealed
demands (i.e., nonavailability, performance control, and lacking a sense of achievement).
Therefore, we followed the guidelines for developing and evaluating measurement instruments
by Hinkin (1998) and MacKenzie et al. (2011). We give an overview of the steps suggested by
MacKenzie et al. (2011) here and provide the details, including additional numbers for each
step in Appendix 3.3.A.
Step 1: Develop a conceptual definition of the construct. This step was covered in Phase 1c of
our mixed-methods study (see Table 3.3-3).
Step 2: Generate items to represent the construct. We used the validated measurement instru-
ments from Ragu-Nathan et al. (2008) for overload, invasion, complexity, insecurity, and un-
certainty, from Ayyagari et al. (2011) for role ambiguity, invasion of privacy, and unreliability,
and Galluch et al. (2015) for interruptions. For the newly identified demands – nonavailability,
performance control, and lacking a sense of achievement – we developed six items for each
demand, based on the definitions of these constructs (Table 3.3-3) and considering standard
guidelines (Hinkin 1998; MacKenzie et al. 2011; Podsakoff et al. 2003).
Step 3: Assess the content validity of the items. We performed a card-sorting exercise with 39
participants and revised the wording of the newly developed items where necessary.
Step 4: Formally specify the measurement model. We specified the measurement model as first-
order reflective for each of the established scales as suggested by Ragu-Nathan et al. (2008)
and for the newly developed scales. We allowed for correlation among the twelve demands. In
a later step, we investigated whether there are higher-order structures among the demands.
Technostress as a Negative Outcome of Individual Information Systems Use 182
Steps 5 & 6: Collect data to conduct pre-test & scale purification and refinement. We ran a pre-
test with n1 = 445 participants in an online survey (pre-test sample). For this sample and the
two following samples (developmental, validation), participants were German workers re-
cruited via an external panel provider. We performed an exploratory factor analysis (EFA) on
data from the pre-test sample. For nonavailability and lacking a sense of achievement, the EFA
revealed a lack of convergent validity triggering a rewording of some items.
Steps 7 & 8: Gather data from new sample and reexamine scale properties. Using the revised
scales, we collected a new data set from a large-scale study with 4,560 respondents participating
in an online survey. The sample was recruited via the same external research panel as the pre-
test. Respondents were paid 3.70 USD / 3.10 EUR for their participation. We randomly split
our study population into a subset for developmental purposes (developmental sample;
n2 = 1,560) and a subset for validation purposes (validation sample; n3 = 3,000). Steps 7 and 8
were performed on the developmental sample to reassess scale properties, while all consecutive
steps were performed on the validation sample. A confirmatory factor analysis (CFA) showed
a good fit. Likewise, standard thresholds for discriminant and convergent validity were met.
Further, Cronbach’s alpha showed satisfactory values for the twelve demands from digital
work. Details on the numbers are presented in Appendix 3.3.A.
MacKenzie et al. (2011) mention that Step 8 should also examine the extent to which a multi-
dimensional structure is present, as we already pointed out in our fourth step. We thus move
discussion of Steps 8 and 9 to the following subsections, where we describe how we used the
developmental sample (n2 = 1,560) to investigate the structure of the twelve demands. Next, we
employed the new data from the validation sample (n3 = 3,000) to reassess scale validity, select
among the potential structures of the demands, and embed the final structure in a nomological
net. We omitted Step 10 (norm development), as it is not relevant for our research questions.
Overall, these steps suggested by MacKenzie et al. (2011) led us to a validated measurement
instrument for all twelve digital work demands. Details on these steps are provided in Appendix
3.3.A. The final scales are given in Appendix 3.3.B.
3.3.5.2 Identification of the Structure
The definitions and the high number of digital work demands suggest that they may not all be
completely unrelated. For example, acute demands such as interruptions and unreliability might
be grouped, as might more chronic demands such as insecurity and uncertainty. Similarly, in-
vasion of privacy and performance control both involve collecting or accessing personal data
by third parties – the first focuses on the private life and the second focuses on the working life.
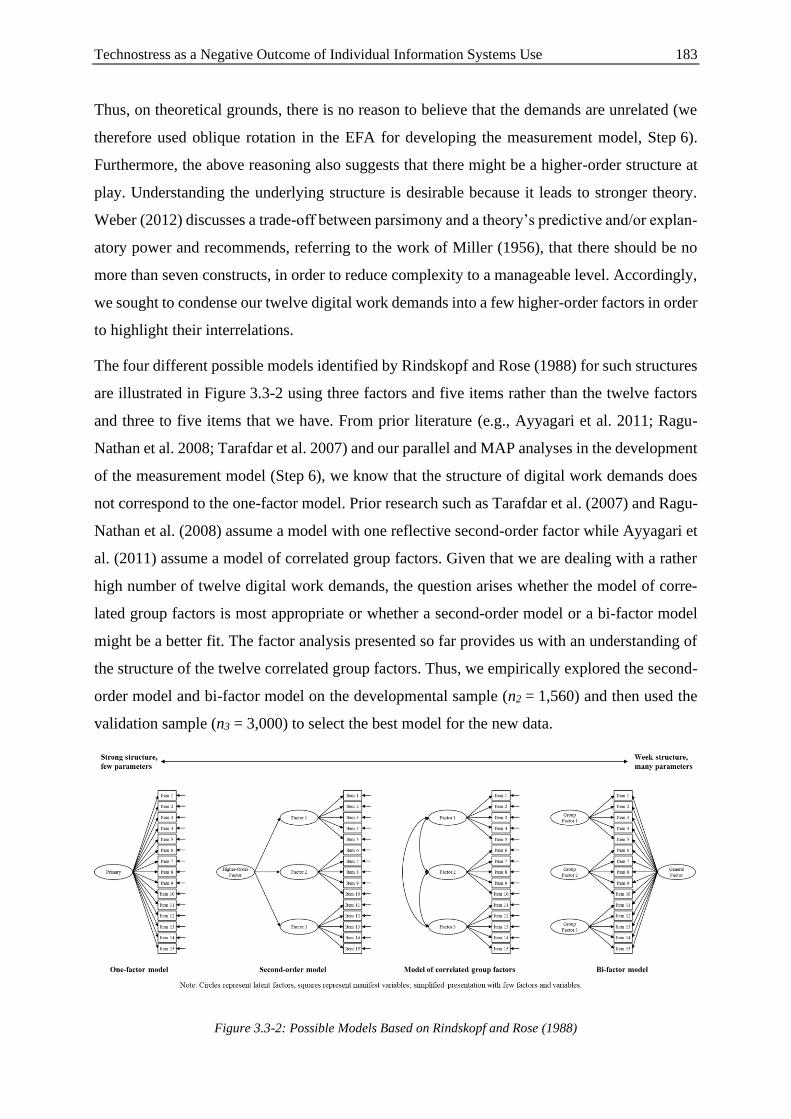
Technostress as a Negative Outcome of Individual Information Systems Use 183
Thus, on theoretical grounds, there is no reason to believe that the demands are unrelated (we
therefore used oblique rotation in the EFA for developing the measurement model, Step 6).
Furthermore, the above reasoning also suggests that there might be a higher-order structure at
play. Understanding the underlying structure is desirable because it leads to stronger theory.
Weber (2012) discusses a trade-off between parsimony and a theory’s predictive and/or explan-
atory power and recommends, referring to the work of Miller (1956), that there should be no
more than seven constructs, in order to reduce complexity to a manageable level. Accordingly,
we sought to condense our twelve digital work demands into a few higher-order factors in order
to highlight their interrelations.
The four different possible models identified by Rindskopf and Rose (1988) for such structures
are illustrated in Figure 3.3-2 using three factors and five items rather than the twelve factors
and three to five items that we have. From prior literature (e.g., Ayyagari et al. 2011; Ragu-
Nathan et al. 2008; Tarafdar et al. 2007) and our parallel and MAP analyses in the development
of the measurement model (Step 6), we know that the structure of digital work demands does
not correspond to the one-factor model. Prior research such as Tarafdar et al. (2007) and Ragu-
Nathan et al. (2008) assume a model with one reflective second-order factor while Ayyagari et
al. (2011) assume a model of correlated group factors. Given that we are dealing with a rather
high number of twelve digital work demands, the question arises whether the model of corre-
lated group factors is most appropriate or whether a second-order model or a bi-factor model
might be a better fit. The factor analysis presented so far provides us with an understanding of
the structure of the twelve correlated group factors. Thus, we empirically explored the second-
order model and bi-factor model on the developmental sample (n2 = 1,560) and then used the
validation sample (n3 = 3,000) to select the best model for the new data.
Figure 3.3-2: Possible Models Based on Rindskopf and Rose (1988)
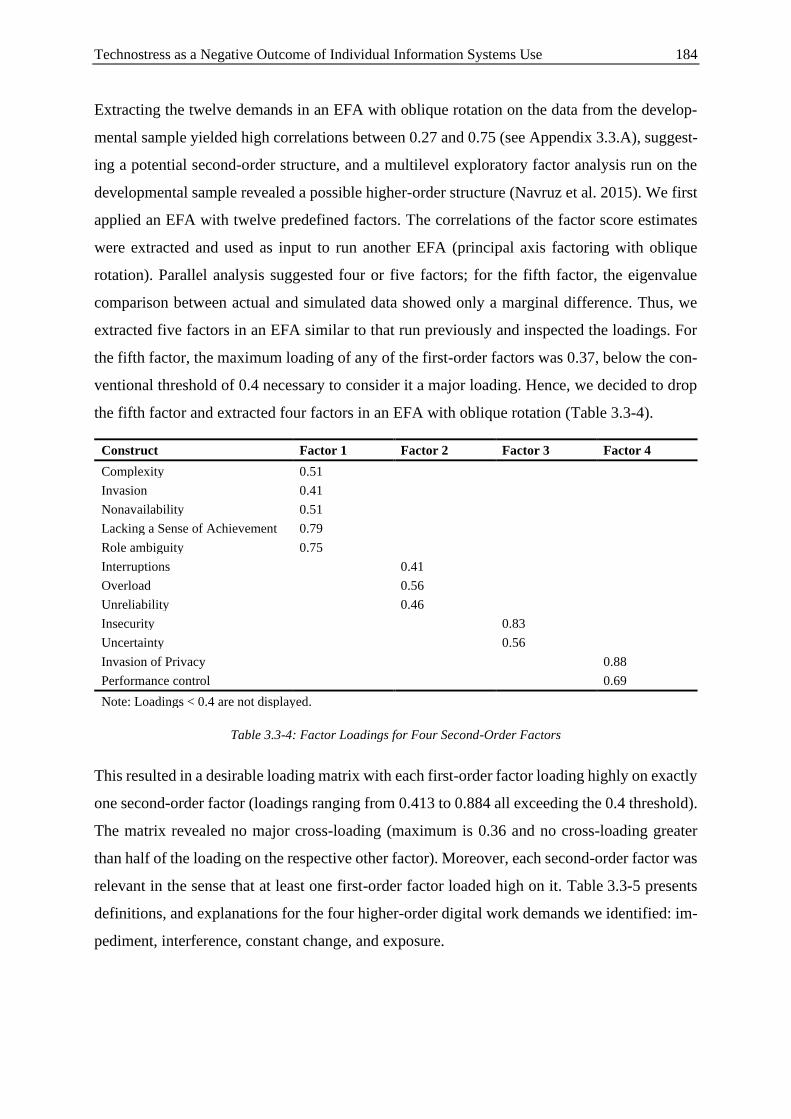
Technostress as a Negative Outcome of Individual Information Systems Use 184
Extracting the twelve demands in an EFA with oblique rotation on the data from the develop-
mental sample yielded high correlations between 0.27 and 0.75 (see Appendix 3.3.A), suggest-
ing a potential second-order structure, and a multilevel exploratory factor analysis run on the
developmental sample revealed a possible higher-order structure (Navruz et al. 2015). We first
applied an EFA with twelve predefined factors. The correlations of the factor score estimates
were extracted and used as input to run another EFA (principal axis factoring with oblique
rotation). Parallel analysis suggested four or five factors; for the fifth factor, the eigenvalue
comparison between actual and simulated data showed only a marginal difference. Thus, we
extracted five factors in an EFA similar to that run previously and inspected the loadings. For
the fifth factor, the maximum loading of any of the first-order factors was 0.37, below the con-
ventional threshold of 0.4 necessary to consider it a major loading. Hence, we decided to drop
the fifth factor and extracted four factors in an EFA with oblique rotation (Table 3.3-4).
Construct Factor 1 Factor 2 Factor 3 Factor 4
Complexity 0.51
Invasion 0.41
Nonavailability 0.51
Lacking a Sense of Achievement 0.79
Role ambiguity 0.75
Interruptions 0.41
Overload 0.56
Unreliability 0.46
Insecurity 0.83
Uncertainty 0.56
Invasion of Privacy 0.88
Performance control 0.69
Note: Loadings < 0.4 are not displayed.
Table 3.3-4: Factor Loadings for Four Second-Order Factors
This resulted in a desirable loading matrix with each first-order factor loading highly on exactly
one second-order factor (loadings ranging from 0.413 to 0.884 all exceeding the 0.4 threshold).
The matrix revealed no major cross-loading (maximum is 0.36 and no cross-loading greater
than half of the loading on the respective other factor). Moreover, each second-order factor was
relevant in the sense that at least one first-order factor loaded high on it. Table 3.3-5 presents
definitions, and explanations for the four higher-order digital work demands we identified: im-
pediment, interference, constant change, and exposure.

Technostress as a Negative Outcome of Individual Information Systems Use 185
Higher-Order
Digital Work
Demand
Definition Explanation
Impediment Impediment describes the
digital work demands
from complexity, inva-
sion, nonavailability, lack
of sense of achievement,
and role ambiguity.
During a workday, different activities must be carried out to
achieve the objectives associated with the work role. However,
the (steady) presence or absence of digital technologies may
contribute to the perception that making progress in achieving
the objectives is more complicated in digital work than nondig-
ital work.
Interference Interference describes the
digital work demands
arising from interrup-
tions, overload, and unre-
liability.
Digital technologies aim to support the handling of tasks in eve-
ryday work by facilitating communication and collaboration
with others and accomplishing activities. However, digital tech-
nologies can also foster the perception that task execution is
prolonged due to incidents occurring during the direct interac-
tion with the technologies or interferences caused by third par-
ties using technologies.
Constant
Change
Constant change de-
scribes the digital work
demands arising from in-
security and uncertainty.
New digital technologies and technology-related work routines
lead to higher demands of building up the necessary skills and
abilities to carry out work-related tasks or cause job require-
ments not to be fulfilled due to incorrect or inefficient use of
digital technologies.
Exposure Exposure describes the
digital work demands
from invasion of privacy
and performance control.
The use of digital technologies leaves digital trace data with
varying visibility. The increasing use of connected digital tech-
nologies enables easier access and simplified processing of
these data and may foster the perception that information about
persons from different contexts and sources is provided to third
parties.
Table 3.3-5: Explanation, Definition, and Interpretation of Higher-Order Factors
Although the bi-factor model might best describe the interrelation of digital work demands, the
bi-factor model has the weakest structure of the models considered here, consisting of one gen-
eral factor (shown on the far right side of Figure 3.3-2) and multiple group factors. In a bi-factor
model, each item loads onto a general factor that represents the individual differences in the
target dimension in which the researcher is most interested (in our case technostress). The bi-
factor model also specifies two or more group factors that are orthogonal to the general factor
(Dunn and McCray 2020), which are common factors measured by multiple items that explain
variance not reflected in the general factor. We ran an EFA using the bi-factor approach sug-
gested by Jennrich and Bentler (2011) to extract a general factor and twelve group factors. All
items loaded highly on the general factor. For each of the group factors, at least half of the items
related to the respective first-order demand loaded on the group factor.
3.3.5.3 Selection and Validation
We used the second subsample (validation sample, n3 = 3,000) and covariance-based structural
equation modeling to determine which structure of digital work demands fit best and then em-
bedded it in a nomological net. Table 3.3-6 characterizes the sample with respect to de-
mographics and work-related factors. Appendix 3.3.C lists the psychometric properties of our
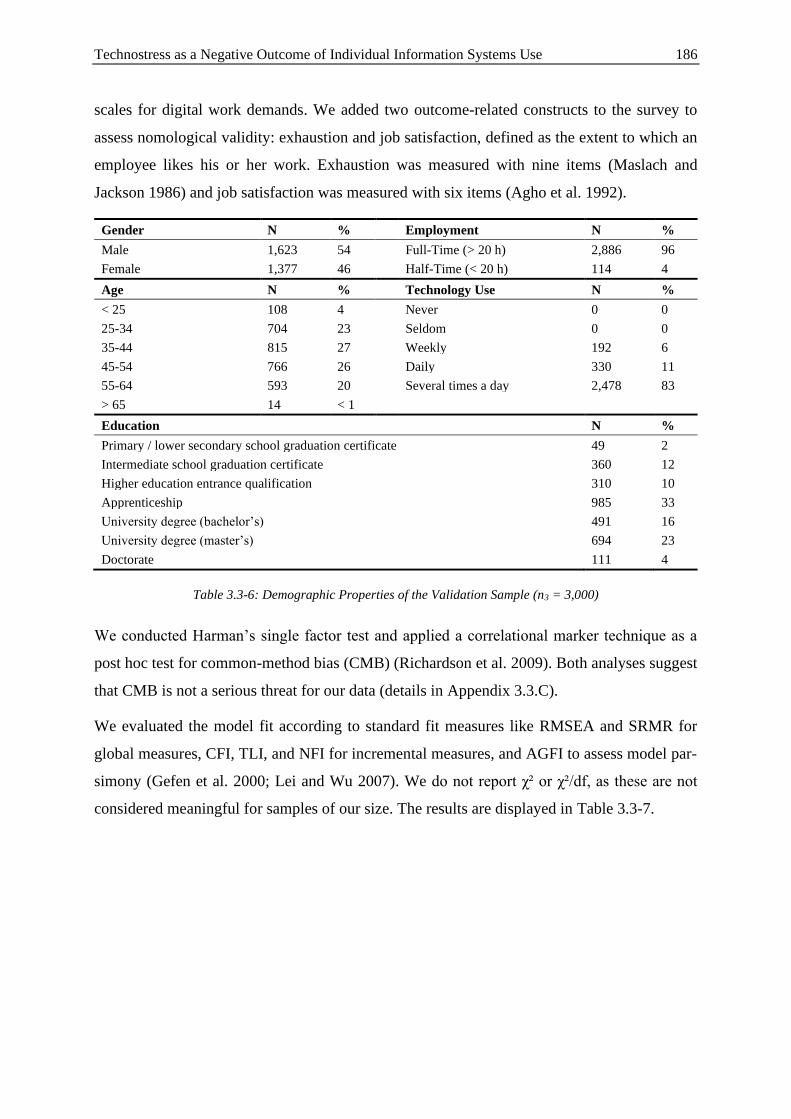
Technostress as a Negative Outcome of Individual Information Systems Use 186
scales for digital work demands. We added two outcome-related constructs to the survey to
assess nomological validity: exhaustion and job satisfaction, defined as the extent to which an
employee likes his or her work. Exhaustion was measured with nine items (Maslach and
Jackson 1986) and job satisfaction was measured with six items (Agho et al. 1992).
Gender N % Employment N %
Male 1,623 54 Full-Time (> 20 h) 2,886 96
Female 1,377 46 Half-Time (< 20 h) 114 4
Age N % Technology Use N %
< 25 108 4 Never 0 0
25-34 704 23 Seldom 0 0
35-44 815 27 Weekly 192 6
45-54 766 26 Daily 330 11
55-64 593 20 Several times a day 2,478 83
> 65 14 < 1
Education N %
Primary / lower secondary school graduation certificate 49 2
Intermediate school graduation certificate 360 12
Higher education entrance qualification 310 10
Apprenticeship 985 33
University degree (bachelor’s) 491 16
University degree (master’s) 694 23
Doctorate 111 4
Table 3.3-6: Demographic Properties of the Validation Sample (n3 = 3,000)
We conducted Harman’s single factor test and applied a correlational marker technique as a
post hoc test for common-method bias (CMB) (Richardson et al. 2009). Both analyses suggest
that CMB is not a serious threat for our data (details in Appendix 3.3.C).
We evaluated the model fit according to standard fit measures like RMSEA and SRMR for
global measures, CFI, TLI, and NFI for incremental measures, and AGFI to assess model par-
simony (Gefen et al. 2000; Lei and Wu 2007). We do not report χ² or χ²/df, as these are not
considered meaningful for samples of our size. The results are displayed in Table 3.3-7.
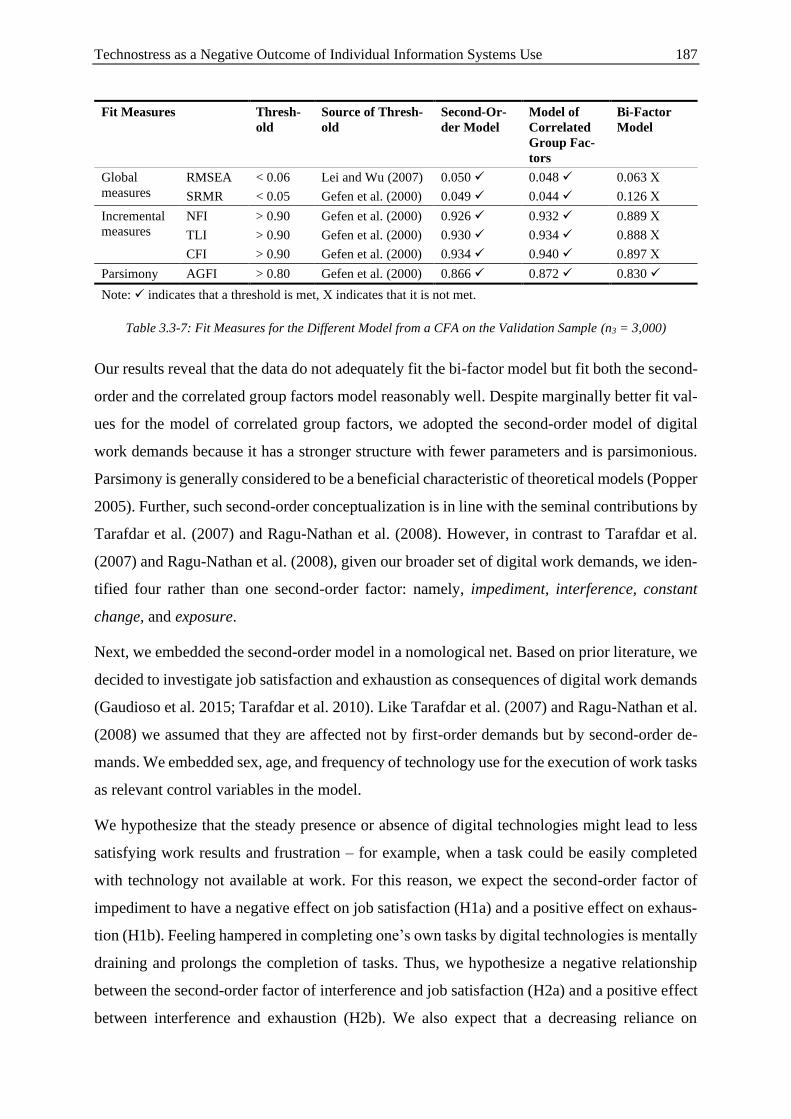
Technostress as a Negative Outcome of Individual Information Systems Use 187
Fit Measures Thresh-
old
Source of Thresh-
old
Second-Or-
der Model
Model of
Correlated
Group Fac-
tors
Bi-Factor
Model
Global
measures
RMSEA < 0.06 Lei and Wu (2007) 0.050 ✓ 0.048 ✓ 0.063 Χ
SRMR < 0.05 Gefen et al. (2000) 0.049 ✓ 0.044 ✓ 0.126 Χ
Incremental
measures
NFI > 0.90 Gefen et al. (2000) 0.926 ✓ 0.932 ✓ 0.889 Χ
TLI > 0.90 Gefen et al. (2000) 0.930 ✓ 0.934 ✓ 0.888 Χ
CFI > 0.90 Gefen et al. (2000) 0.934 ✓ 0.940 ✓ 0.897 Χ
Parsimony AGFI > 0.80 Gefen et al. (2000) 0.866 ✓ 0.872 ✓ 0.830 ✓
Note: ✓ indicates that a threshold is met, Χ indicates that it is not met.
Table 3.3-7: Fit Measures for the Different Model from a CFA on the Validation Sample (n3 = 3,000)
Our results reveal that the data do not adequately fit the bi-factor model but fit both the second-
order and the correlated group factors model reasonably well. Despite marginally better fit val-
ues for the model of correlated group factors, we adopted the second-order model of digital
work demands because it has a stronger structure with fewer parameters and is parsimonious.
Parsimony is generally considered to be a beneficial characteristic of theoretical models (Popper
2005). Further, such second-order conceptualization is in line with the seminal contributions by
Tarafdar et al. (2007) and Ragu-Nathan et al. (2008). However, in contrast to Tarafdar et al.
(2007) and Ragu-Nathan et al. (2008), given our broader set of digital work demands, we iden-
tified four rather than one second-order factor: namely, impediment, interference, constant
change, and exposure.
Next, we embedded the second-order model in a nomological net. Based on prior literature, we
decided to investigate job satisfaction and exhaustion as consequences of digital work demands
(Gaudioso et al. 2015; Tarafdar et al. 2010). Like Tarafdar et al. (2007) and Ragu-Nathan et al.
(2008) we assumed that they are affected not by first-order demands but by second-order de-
mands. We embedded sex, age, and frequency of technology use for the execution of work tasks
as relevant control variables in the model.
We hypothesize that the steady presence or absence of digital technologies might lead to less
satisfying work results and frustration – for example, when a task could be easily completed
with technology not available at work. For this reason, we expect the second-order factor of
impediment to have a negative effect on job satisfaction (H1a) and a positive effect on exhaus-
tion (H1b). Feeling hampered in completing one’s own tasks by digital technologies is mentally
draining and prolongs the completion of tasks. Thus, we hypothesize a negative relationship
between the second-order factor of interference and job satisfaction (H2a) and a positive effect
between interference and exhaustion (H2b). We also expect that a decreasing reliance on
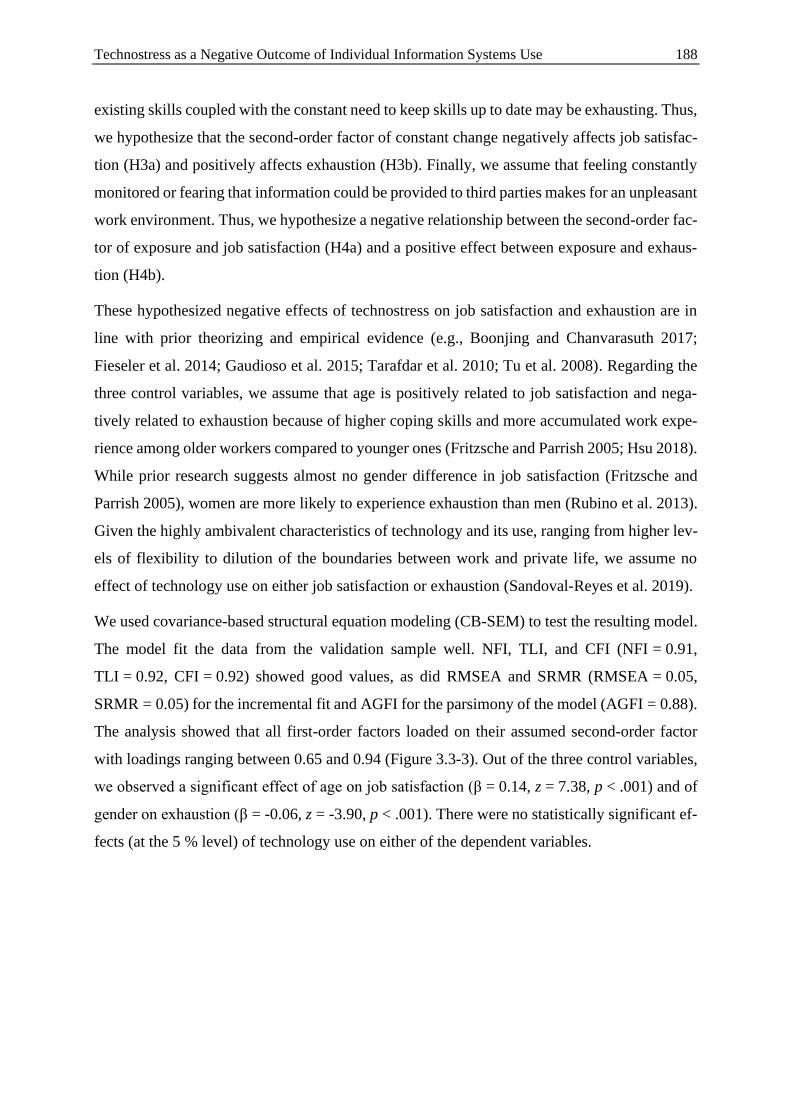
Technostress as a Negative Outcome of Individual Information Systems Use 188
existing skills coupled with the constant need to keep skills up to date may be exhausting. Thus,
we hypothesize that the second-order factor of constant change negatively affects job satisfac-
tion (H3a) and positively affects exhaustion (H3b). Finally, we assume that feeling constantly
monitored or fearing that information could be provided to third parties makes for an unpleasant
work environment. Thus, we hypothesize a negative relationship between the second-order fac-
tor of exposure and job satisfaction (H4a) and a positive effect between exposure and exhaus-
tion (H4b).
These hypothesized negative effects of technostress on job satisfaction and exhaustion are in
line with prior theorizing and empirical evidence (e.g., Boonjing and Chanvarasuth 2017;
Fieseler et al. 2014; Gaudioso et al. 2015; Tarafdar et al. 2010; Tu et al. 2008). Regarding the
three control variables, we assume that age is positively related to job satisfaction and nega-
tively related to exhaustion because of higher coping skills and more accumulated work expe-
rience among older workers compared to younger ones (Fritzsche and Parrish 2005; Hsu 2018).
While prior research suggests almost no gender difference in job satisfaction (Fritzsche and
Parrish 2005), women are more likely to experience exhaustion than men (Rubino et al. 2013).
Given the highly ambivalent characteristics of technology and its use, ranging from higher lev-
els of flexibility to dilution of the boundaries between work and private life, we assume no
effect of technology use on either job satisfaction or exhaustion (Sandoval-Reyes et al. 2019).
We used covariance-based structural equation modeling (CB-SEM) to test the resulting model.
The model fit the data from the validation sample well. NFI, TLI, and CFI (NFI = 0.91,
TLI = 0.92, CFI = 0.92) showed good values, as did RMSEA and SRMR (RMSEA = 0.05,
SRMR = 0.05) for the incremental fit and AGFI for the parsimony of the model (AGFI = 0.88).
The analysis showed that all first-order factors loaded on their assumed second-order factor
with loadings ranging between 0.65 and 0.94 (Figure 3.3-3). Out of the three control variables,
we observed a significant effect of age on job satisfaction (β = 0.14, z = 7.38, p < .001) and of
gender on exhaustion (β = -0.06, z = -3.90, p < .001). There were no statistically significant ef-
fects (at the 5 % level) of technology use on either of the dependent variables.
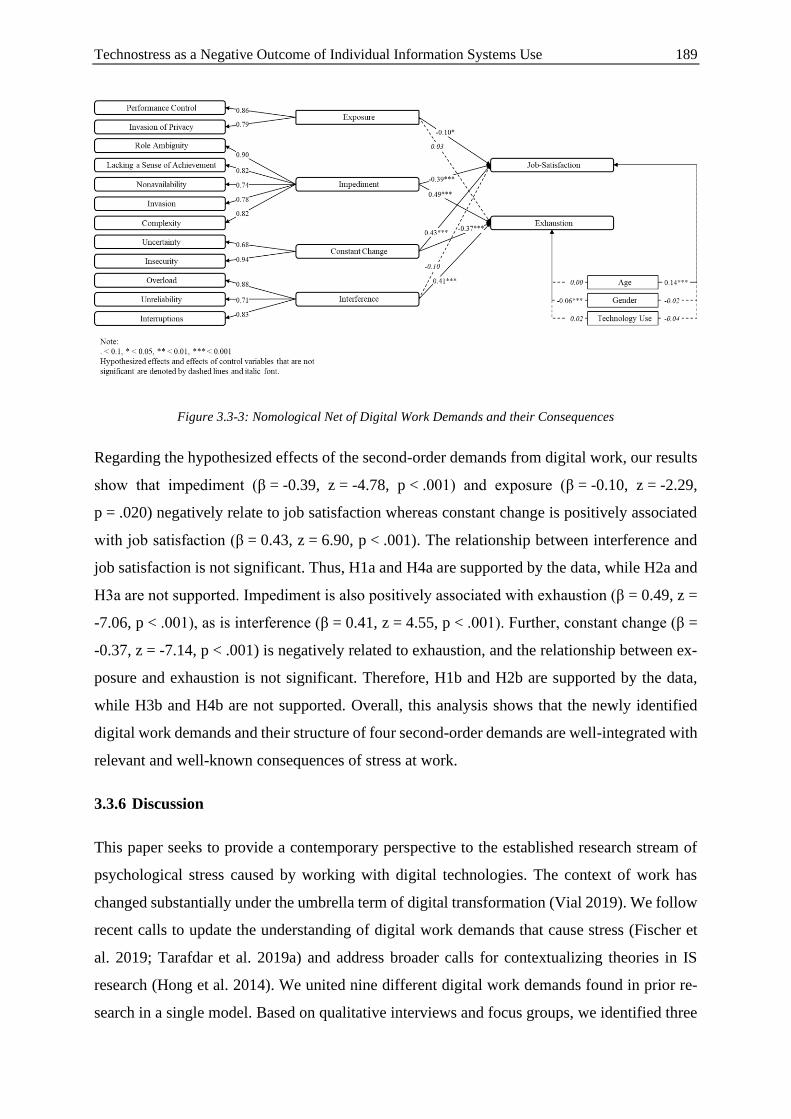
Technostress as a Negative Outcome of Individual Information Systems Use 189
Figure 3.3-3: Nomological Net of Digital Work Demands and their Consequences
Regarding the hypothesized effects of the second-order demands from digital work, our results
show that impediment (β = -0.39, z = -4.78, p < .001) and exposure (β = -0.10, z = -2.29,
p = .020) negatively relate to job satisfaction whereas constant change is positively associated
with job satisfaction (β = 0.43, z = 6.90, p < .001). The relationship between interference and
job satisfaction is not significant. Thus, H1a and H4a are supported by the data, while H2a and
H3a are not supported. Impediment is also positively associated with exhaustion (β = 0.49, z =
-7.06, p < .001), as is interference (β = 0.41, z = 4.55, p < .001). Further, constant change (β =
-0.37, z = -7.14, p < .001) is negatively related to exhaustion, and the relationship between ex-
posure and exhaustion is not significant. Therefore, H1b and H2b are supported by the data,
while H3b and H4b are not supported. Overall, this analysis shows that the newly identified
digital work demands and their structure of four second-order demands are well-integrated with
relevant and well-known consequences of stress at work.
3.3.6 Discussion
This paper seeks to provide a contemporary perspective to the established research stream of
psychological stress caused by working with digital technologies. The context of work has
changed substantially under the umbrella term of digital transformation (Vial 2019). We follow
recent calls to update the understanding of digital work demands that cause stress (Fischer et
al. 2019; Tarafdar et al. 2019a) and address broader calls for contextualizing theories in IS
research (Hong et al. 2014). We united nine different digital work demands found in prior re-
search in a single model. Based on qualitative interviews and focus groups, we identified three
Technostress as a Negative Outcome of Individual Information Systems Use 190
novel digital work demands and added them to the model: nonavailability, performance control,
and lacking a sense of achievement. In a series of quantitative survey-based studies, we dis-
cerned four higher-order digital work demands (exposure, impediment, constant change, inter-
ference).
Although stress is individual and situational, with demands differing over time and between
individuals, the ranking of average digital work demands based on intensity reported by the
3,000 employees from the validation sample is informative (Table 3.3-17). In terms of aggre-
gate values, employees perceive the strongest demands from the two first-order constructs re-
lated to exposure: performance control and invasion of privacy. This indicates that employees
are deeply concerned about how their data are handled within the company. The high intensity
of perceived performance control shows the relevance of the addition of this new factor to the
repertoire of digital work demands. While the second and third strongest demands, invasion of
privacy (Ayyagari et al. 2011) and unreliability (Adam et al. 2017; Fischer and Riedl 2015),
have been previously discussed as technostress creators, they had not yet been integrated in an
overarching framework along with the five classical technostress creators identified by Tarafdar
et al. (2007) and Ragu-Nathan et al. (2008). The strong perception of these demands highlights
the need for an integrated consideration of all the different digital work demands. Overall, our
ranking shows that the newly identified and integrated digital work demands do not lag behind
the classical ones. Thus, extending the set of demands to a contemporary work context reduces
parsimony but adds important facets needed to understand the psychological demands currently
caused by digital work.
Considering specifically the nomological validity of the higher-order factors, four of eight hy-
potheses were in line with our expectations: higher impediment correlates with less job satis-
faction and more emotional exhaustion. Thus, the steady presence or absence of digital tech-
nologies plays a significant role in assessing important aspects of occupational and health out-
comes. Further, interference is positively associated with exhaustion; therefore, being hampered
by digital technologies in completing tasks can be assumed to be mentally draining. Finally,
exposure is negatively associated with job satisfaction, and the awareness of potentially being
monitored during work contributes to an unpleasant work environment.
Beyond these expected findings, some of our results seem counterintuitive. Contrary to our
expectations, the second-order factor of constant change correlates with higher job satisfaction
and less employee exhaustion. A motivational effect may serve as a possible explanatory mech-
anism. In the transactional stress model (Lazarus and Folkman 1984), the third kind of stress
Technostress as a Negative Outcome of Individual Information Systems Use 191
appraisal is “challenge.” It has much in common with threat appraisal, as it also activates coping
resources, but it also has a motivational aspect. This form of appraisal focuses “on the potential
for gain or growth inherent in an encounter and …[is] characterized by pleasurable emotions
such as eagerness, excitement, and exhilaration” (Lazarus and Folkman 1984, p. 33). This as-
pect of technostress was also acknowledged by Tarafdar et al. (2019a), who invoked the ques-
tion of “how and why individuals appraise IS as challenging or thrilling, experience consequent
‘good’ stress, and are faced with positive outcomes” (Tarafdar et al. 2019a, p. 14). Benlian
(2020) also found technology-driven challenges along with technology-driven hindrance de-
mands. The factor constant change comprises uncertainty and insecurity. If employees feel that
they lack the competence to handle digital technologies, it could motivate them to learn. If one
invests time and effort to learn and is successful in that endeavor, it could lead to satisfaction
and, consequentially, reduce exhaustion.
Inferences from the qualitative strand of our mixed-methods approach led us to a broad set of
digital work demands that could be combined into a unified model. Inferences from the quan-
titative study show that all twelve digital work demands exist, are distinct, and interpretable.
Following the developmental purpose of our mixed-methods approach, the meta-inference is
that there are twelve demands from digital work. This answers our first research question. Based
on this result, a further inference from the quantitative strand is the second-order structure,
which answers our second research question.
3.3.6.1 Advancing the Concept of Technostress to Digital Stress
Arguably, the last fifteen years brought about a substantive change in the nature, pervasiveness,
and use of technologies at work. Contemporary digital work is different from former IT-based
work (Colbert et al. 2016). This created a new work context. Given the substantial transfor-
mation of work and the novel perspective of digital work demands, one may reconsider the
concept of technostress itself. As mentioned above, the term “technostress” was introduced in
1982 when the internet was still in its infancy. Since then, the definition has been revised and
expanded over time (see Table 3.3-8). All of these definitions focus on the user’s inability to
deal with technology adequately, and some of them even seem to “throw the burden of tech-
nostress onto the users” (Sellberg and Susi 2014, p. 200). However, some dimensions of tech-
nostress do not concern the user’s (in)capability to use technology adequately. For example,
technology-induced stress can occur because of system malfunctions or a lack of appropriate
technologies available to accomplish a task. The latter demand is caused not by using digital
technologies but by not using them. Likewise, job insecurity is not linked to technology use by
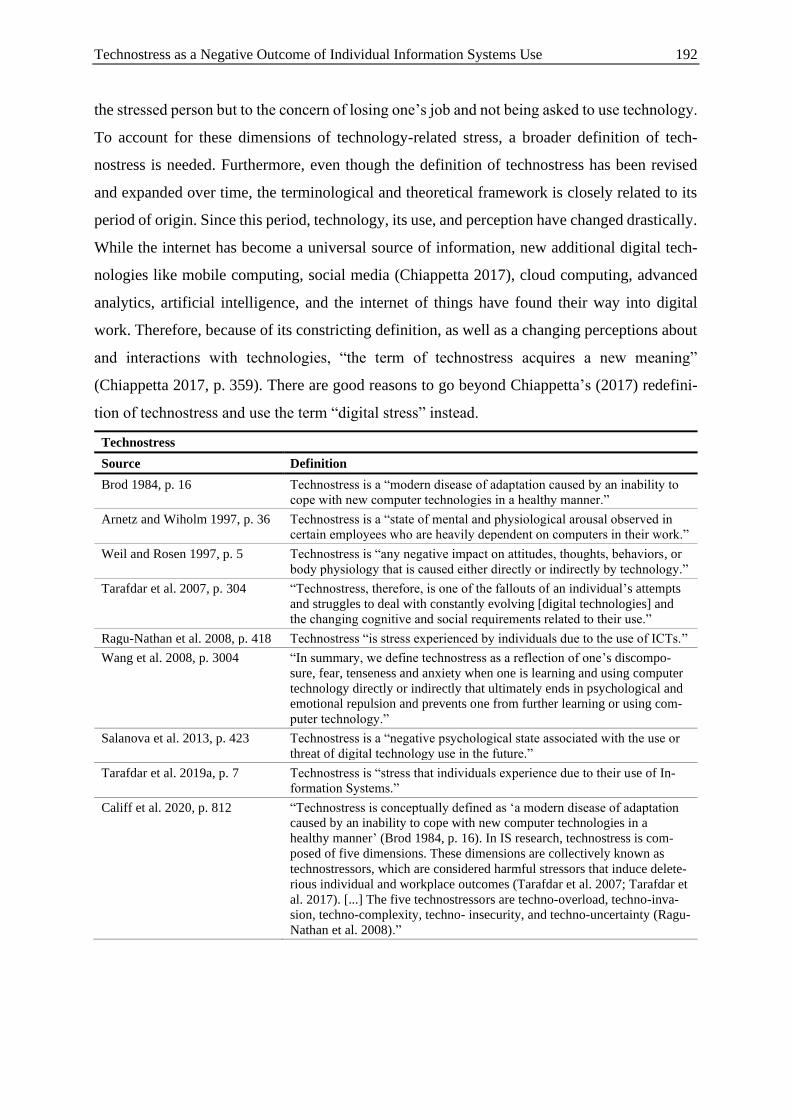
Technostress as a Negative Outcome of Individual Information Systems Use 192
the stressed person but to the concern of losing one’s job and not being asked to use technology.
To account for these dimensions of technology-related stress, a broader definition of tech-
nostress is needed. Furthermore, even though the definition of technostress has been revised
and expanded over time, the terminological and theoretical framework is closely related to its
period of origin. Since this period, technology, its use, and perception have changed drastically.
While the internet has become a universal source of information, new additional digital tech-
nologies like mobile computing, social media (Chiappetta 2017), cloud computing, advanced
analytics, artificial intelligence, and the internet of things have found their way into digital
work. Therefore, because of its constricting definition, as well as a changing perceptions about
and interactions with technologies, “the term of technostress acquires a new meaning”
(Chiappetta 2017, p. 359). There are good reasons to go beyond Chiappetta’s (2017) redefini-
tion of technostress and use the term “digital stress” instead.
Technostress
Source Definition
Brod 1984, p. 16 Technostress is a “modern disease of adaptation caused by an inability to
cope with new computer technologies in a healthy manner.”
Arnetz and Wiholm 1997, p. 36 Technostress is a “state of mental and physiological arousal observed in
certain employees who are heavily dependent on computers in their work.”
Weil and Rosen 1997, p. 5 Technostress is “any negative impact on attitudes, thoughts, behaviors, or
body physiology that is caused either directly or indirectly by technology.”
Tarafdar et al. 2007, p. 304 “Technostress, therefore, is one of the fallouts of an individual’s attempts
and struggles to deal with constantly evolving [digital technologies] and
the changing cognitive and social requirements related to their use.”
Ragu-Nathan et al. 2008, p. 418 Technostress “is stress experienced by individuals due to the use of ICTs.”
Wang et al. 2008, p. 3004 “In summary, we define technostress as a reflection of one’s discompo-
sure, fear, tenseness and anxiety when one is learning and using computer
technology directly or indirectly that ultimately ends in psychological and
emotional repulsion and prevents one from further learning or using com-
puter technology.”
Salanova et al. 2013, p. 423 Technostress is a “negative psychological state associated with the use or
threat of digital technology use in the future.”
Tarafdar et al. 2019a, p. 7 Technostress is “stress that individuals experience due to their use of In-
formation Systems.”
Califf et al. 2020, p. 812 “Technostress is conceptually defined as ‘a modern disease of adaptation
caused by an inability to cope with new computer technologies in a
healthy manner’ (Brod 1984, p. 16). In IS research, technostress is com-
posed of five dimensions. These dimensions are collectively known as
technostressors, which are considered harmful stressors that induce delete-
rious individual and workplace outcomes (Tarafdar et al. 2007; Tarafdar et
al. 2017). [...] The five technostressors are techno-overload, techno-inva-
sion, techno-complexity, techno- insecurity, and techno-uncertainty (Ragu-
Nathan et al. 2008).”
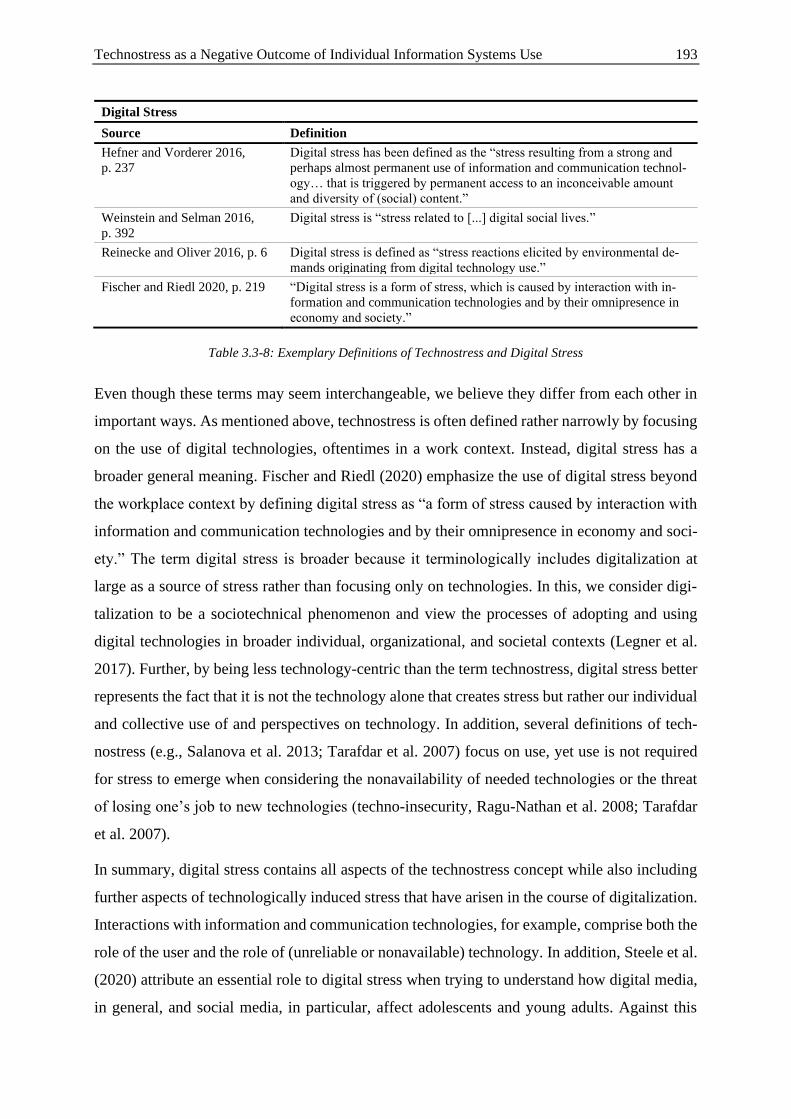
Technostress as a Negative Outcome of Individual Information Systems Use 193
Digital Stress
Source Definition
Hefner and Vorderer 2016,
p. 237
Digital stress has been defined as the “stress resulting from a strong and
perhaps almost permanent use of information and communication technol-
ogy… that is triggered by permanent access to an inconceivable amount
and diversity of (social) content.”
Weinstein and Selman 2016,
p. 392
Digital stress is “stress related to [...] digital social lives.”
Reinecke and Oliver 2016, p. 6 Digital stress is defined as “stress reactions elicited by environmental de-
mands originating from digital technology use.”
Fischer and Riedl 2020, p. 219 “Digital stress is a form of stress, which is caused by interaction with in-
formation and communication technologies and by their omnipresence in
economy and society.”
Table 3.3-8: Exemplary Definitions of Technostress and Digital Stress
Even though these terms may seem interchangeable, we believe they differ from each other in
important ways. As mentioned above, technostress is often defined rather narrowly by focusing
on the use of digital technologies, oftentimes in a work context. Instead, digital stress has a
broader general meaning. Fischer and Riedl (2020) emphasize the use of digital stress beyond
the workplace context by defining digital stress as “a form of stress caused by interaction with
information and communication technologies and by their omnipresence in economy and soci-
ety.” The term digital stress is broader because it terminologically includes digitalization at
large as a source of stress rather than focusing only on technologies. In this, we consider digi-
talization to be a sociotechnical phenomenon and view the processes of adopting and using
digital technologies in broader individual, organizational, and societal contexts (Legner et al.
2017). Further, by being less technology-centric than the term technostress, digital stress better
represents the fact that it is not the technology alone that creates stress but rather our individual
and collective use of and perspectives on technology. In addition, several definitions of tech-
nostress (e.g., Salanova et al. 2013; Tarafdar et al. 2007) focus on use, yet use is not required
for stress to emerge when considering the nonavailability of needed technologies or the threat
of losing one’s job to new technologies (techno-insecurity, Ragu-Nathan et al. 2008; Tarafdar
et al. 2007).
In summary, digital stress contains all aspects of the technostress concept while also including
further aspects of technologically induced stress that have arisen in the course of digitalization.
Interactions with information and communication technologies, for example, comprise both the
role of the user and the role of (unreliable or nonavailable) technology. In addition, Steele et al.
(2020) attribute an essential role to digital stress when trying to understand how digital media,
in general, and social media, in particular, affect adolescents and young adults. Against this
Technostress as a Negative Outcome of Individual Information Systems Use 194
background, Weinstein and Selman (2016) identify several digital demands, such as the pres-
sure to comply or public shaming and humiliation, by investigating the private use of digital
media by adolescents.
Furthermore, by adopting the broader digital stress concept, we see an opportunity to termino-
logically unite the multidisciplinary research field of technology-induced stress. Currently, “the
use of numerous terminologies for similar or identical constructs complicates the literature”
(Steele et al. 2020, p. 18). Focusing on a single term that includes the research aspects of both
private and work life spanning user ages ranging from the very young to the elderly would
prevent obscuring results among studies and therefore make it easier to bring together the re-
sults of different disciplines and to understand the phenomenon of digital stress in its entirety
(Steele et al. 2020). The nomenclature of digital stress could unify different terminologies used
in the literature and integrate new phenomena and contemporary work practices relating to dig-
ital technologies that cause stress.
Considering prior definitions of technostress and digital stress along with general definitions of
stress (Lazarus and Folkman 1984; Selye 1973), we define digital stress as the physiological,
emotional, and/or cognitive reaction of an individual to an imbalance between the demands
directly or indirectly imposed on the individual through interactions with digital technologies
and the available resources and coping measures available to meet these demands. These de-
mands result either directly from the use of digital technologies by the individual, indirectly
through the digital technologies themselves, or from the use of digital technologies by third
parties. For digital technologies, we adapt the definition from Bharadwaj et al. (2013, p. 471),
who define them as “combinations of information, computing, communication, and connectiv-
ity technologies.” While the given definition comprises digital stress within both private and
work contexts, our empirical analysis focuses solely on digital stress encountered in the work
context.
3.3.6.2 Implications for Theory and Research
Our research evaluates the current concept of technostress and its creating factors in the context
of contemporary digital work practices. The capabilities, availability, and use of digital tech-
nologies at work have considerably expanded and changed over the last ten to fifteen years.
The interdependence of communication and information channels and the availability of new
technologies have given rise to novel use cases and interaction forms through and with technol-
ogies. Our research aligns with Tarafdar et al. (2019a, p. 7) who suggested that stress induced
by digital technologies is a continually evolving phenomenon with ongoing digitalization.
Technostress as a Negative Outcome of Individual Information Systems Use 195
Further, we answer Fischer et al.’s (2019) question of whether the measurement instrument of
technostress is still up to date. Against this background, our research makes the following four
contributions.
First, we present a holistic set of the most important digital work demands. Nine of these twelve
demands have been previously considered in technostress literature, e.g., Tarafdar et al. (2007),
Ragu-Nathan et al. (2008), Ayyagari et al. (2011), and Galluch et al. (2015). Further, we added
three additional digital work demands that tax or potentially exceed workers’ resources, creat-
ing stress: nonavailability, performance control, and lacking a sense of achievement. We com-
bined all twelve of these demands in a single unified model. A large body of research in IS and
related disciplines is currently focused on stress appraisal (e.g., Benlian 2020; Califf et al.
2020), stress coping (e.g., Pirkkalainen et al. 2019; Tarafdar et al. 2019b), stress outcomes
(e.g., Chen et al. 2019; La Torre et al. 2020), and the design of stress-sensitive systems
(e.g., Adam et al. 2017; Jimenez and Bregenzer 2018). When stress from digital work is of
concern, such endeavors should consider using our unified and updated conceptualization.
Second, empirical evidence and theoretical reasoning bring to light a higher-order structure with
four second-order demands from digital work. Prior research has already considered higher-
order models (e.g., Tarafdar et al. 2007; Ragu-Nathan et al. 2008; and research building on
these articles), suggesting a single unitary second-order factor. In contrast, given the context of
contemporary work practices, our substantially broader conceptualization of digital work de-
mands and our large empirical samples identify the structure as multifaceted. Hence, we intro-
duce the new second-order demands of impediment, interference, constant change, and expo-
sure. By adding much needed further dimensions and expanding the concept of technostress
from five to twelve dimensions, this hierarchical structure adds depth to the understanding of
the increasing complexity of digital stress and identifies links between its dimensions. We en-
courage fellow researchers to not only solely investigate the twelve dimensions of technostress,
but also consider these higher-order demands to understanding technostress on a larger scale
and develop preventive and reactive measures against it.
Third, we suggest evolving the concept of technostress to digital stress. We expect that this
suggestion is controversial. One of the manifold potential objections could be that terming an-
ything as “digital” is a fad that will fade. It might be considered meaningless transient wording.
Second and more concerning, some might fear a discontinuity in the well-established (IS) re-
search stream on technostress. We partially share these concerns. Yet, because of its broader
definition, a theory of digital stress as an extension of technostress can consider more aspects
Technostress as a Negative Outcome of Individual Information Systems Use 196
of modern private and professional use of technology by individuals over the complete human
lifespan. Thus, this theory of digital stress may contribute to terminologically uniting the mul-
tidisciplinary research field of technology-induced stress. Future research should engage with
the concept of digital stress, to challenge and evolve the definition provided here and develop
the nomological net surrounding it in various contexts.
Fourth, we created and validated survey-based measurement scales for newly identified con-
structs. Further, we validated the compatibility and delineation of these scales with established
digital work demands. These scales could be used in future research to measure digital work
demands.
3.3.6.3 Implications for Practice
Our findings contribute to managerial practice in two ways. First, we raise awareness of the
broader categories of stress that arise from the individual and collective use of digital technol-
ogies and go beyond the established concept of technostress. Especially given that companies,
politics, and the public, are trying to keep up with the increasing digitalization and all its ex-
pected benefits, it is important to emphasize potential negative effects associated with digitali-
zation because these effects can only be inhibited or prevented if they are known.
Second, we go beyond raising awareness and offer a psychological risk assessment tool for the
workplace context. With the help of our measurement instrument for digital stress exposure,
companies can determine which of the twelve digital work demands are most relevant for their
employees. Based on company-specific assessment, specific measurements for prevention or
counteraction could be developed and implemented either for the entire company or for specific
employee groups experiencing high levels of digital stress.
3.3.6.4 Evaluation and Limitations
According to the classification of Gregor (2006), our conceptualization of demands and digital
stress constitutes a type IV theory for explaining and predicting. We propose that digital stress
is a physiological, emotional, and/or cognitive reaction of an individual to an imbalance be-
tween the demands directly or indirectly imposed on the individual through interaction with
digital technologies and the available resources and coping measures. Digital stress in the work
domain arises primarily from twelve demands of digital work combined in a hierarchical struc-
ture of four second-order demands: impediment, interference, constant change, and exposure.
Each of these constructs is associated with job satisfaction and exhaustion. According to Weber
(2012), we suggest evaluating our theoretical contribution, as shown in Table 3.3-9.
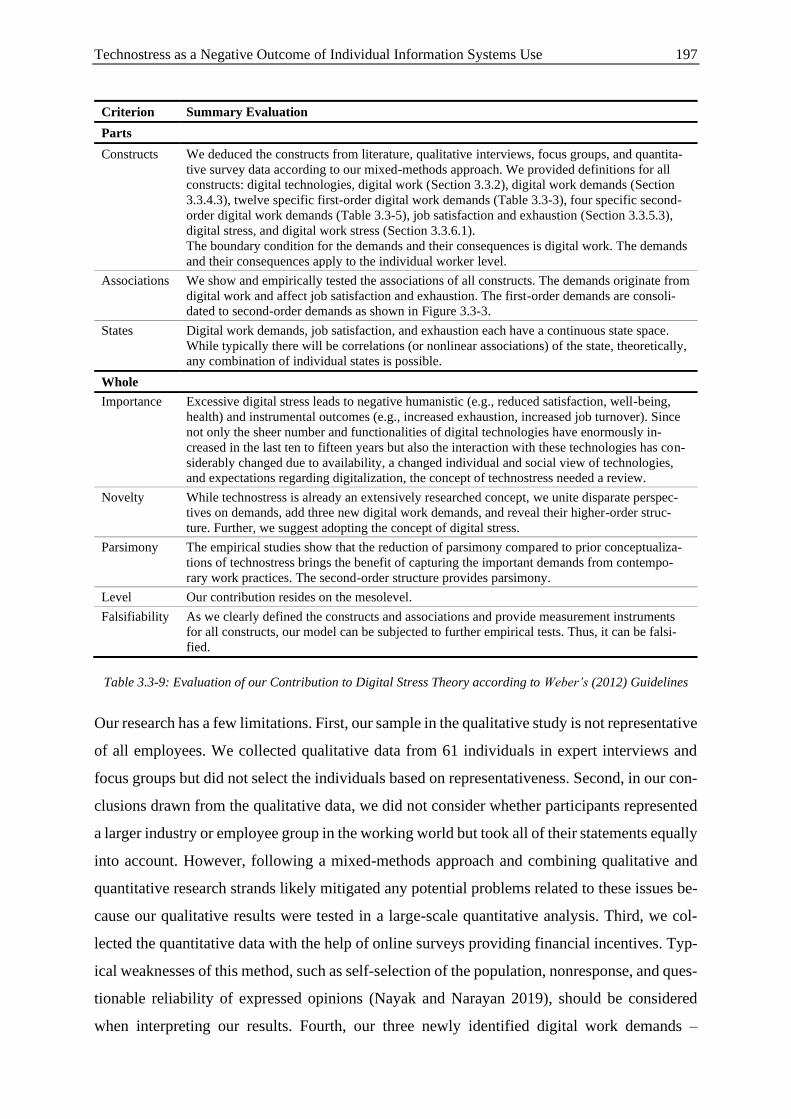
Technostress as a Negative Outcome of Individual Information Systems Use 197
Criterion Summary Evaluation
Parts
Constructs We deduced the constructs from literature, qualitative interviews, focus groups, and quantita-
tive survey data according to our mixed-methods approach. We provided definitions for all
constructs: digital technologies, digital work (Section 3.3.2), digital work demands (Section
3.3.4.3), twelve specific first-order digital work demands (Table 3.3-3), four specific second-
order digital work demands (Table 3.3-5), job satisfaction and exhaustion (Section 3.3.5.3),
digital stress, and digital work stress (Section 3.3.6.1).
The boundary condition for the demands and their consequences is digital work. The demands
and their consequences apply to the individual worker level.
Associations We show and empirically tested the associations of all constructs. The demands originate from
digital work and affect job satisfaction and exhaustion. The first-order demands are consoli-
dated to second-order demands as shown in Figure 3.3-3.
States Digital work demands, job satisfaction, and exhaustion each have a continuous state space.
While typically there will be correlations (or nonlinear associations) of the state, theoretically,
any combination of individual states is possible.
Whole
Importance Excessive digital stress leads to negative humanistic (e.g., reduced satisfaction, well-being,
health) and instrumental outcomes (e.g., increased exhaustion, increased job turnover). Since
not only the sheer number and functionalities of digital technologies have enormously in-
creased in the last ten to fifteen years but also the interaction with these technologies has con-
siderably changed due to availability, a changed individual and social view of technologies,
and expectations regarding digitalization, the concept of technostress needed a review.
Novelty While technostress is already an extensively researched concept, we unite disparate perspec-
tives on demands, add three new digital work demands, and reveal their higher-order struc-
ture. Further, we suggest adopting the concept of digital stress.
Parsimony The empirical studies show that the reduction of parsimony compared to prior conceptualiza-
tions of technostress brings the benefit of capturing the important demands from contempo-
rary work practices. The second-order structure provides parsimony.
Level Our contribution resides on the mesolevel.
Falsifiability As we clearly defined the constructs and associations and provide measurement instruments
for all constructs, our model can be subjected to further empirical tests. Thus, it can be falsi-
fied.
Table 3.3-9: Evaluation of our Contribution to Digital Stress Theory according to Weber’s (2012) Guidelines
Our research has a few limitations. First, our sample in the qualitative study is not representative
of all employees. We collected qualitative data from 61 individuals in expert interviews and
focus groups but did not select the individuals based on representativeness. Second, in our con-
clusions drawn from the qualitative data, we did not consider whether participants represented
a larger industry or employee group in the working world but took all of their statements equally
into account. However, following a mixed-methods approach and combining qualitative and
quantitative research strands likely mitigated any potential problems related to these issues be-
cause our qualitative results were tested in a large-scale quantitative analysis. Third, we col-
lected the quantitative data with the help of online surveys providing financial incentives. Typ-
ical weaknesses of this method, such as self-selection of the population, nonresponse, and ques-
tionable reliability of expressed opinions (Nayak and Narayan 2019), should be considered
when interpreting our results. Fourth, our three newly identified digital work demands –
Technostress as a Negative Outcome of Individual Information Systems Use 198
nonavailability, lacking a sense of achievement, and performance control – were tested using
multiple large data sets based on employees in Germany. Future work should seek to validate
our results in other economic and cultural backgrounds. Finally, we embedded the digital work
demands in a nomological net with job satisfaction and exhaustion. Some hypotheses were not
supported and, in two cases, a significant effect of demands on outcomes was observed in the
direction opposite from that hypothesized. Future research should delve deeper into these sur-
prising relationships and consider the second-order demands with regard to further conse-
quences (e.g., appraisal, coping behavior) and moderators of the demand-outcome relationship
(e.g., resources such as individual characteristics).
3.3.7 Conclusion
Digitalization is one of the most significant sociotechnical challenges of modern humankind; it
has tremendously transformed work practices and altered the demands placed on employees.
Our research contributes to understanding these new demands in the age of digital work and
thus lays the foundation for further research regarding antecedents, appraisal, coping, outcomes
of digital stress, and the design of social, technical, and sociotechnical systems seeking to limit
excessive stress and its negative consequences.
Technostress as a Negative Outcome of Individual Information Systems Use 199
3.3.8 References
Adam, M. T. P., Gimpel, H., Mädche, A., and Riedl, R. 2017. “Design Blueprint for Stress-
Sensitive Adaptive Enterprise Systems,” Business & Information Systems Engineering
(59:4), pp. 277-291.
Agho, A. O., Price, J. L., and Mueller, C. W. 1992. “Discriminant Validity of Measures of Job
Satisfaction, Positive Affectivity and Negative Affectivity,” Journal of Occupational and
Organizational Psychology (65:3), pp. 185-195.
Arnetz, B. B., and Wiholm, C. 1997. “Technological Stress: Psychophysiological Symptoms in
Modern Offices,” Journal of Psychosomatic Research (43:1), pp. 35-42.
Attaran, M., Attaran, S., and Kirkland, D. 2019. “The Need for Digital Workplace: Increasing
Workforce Productivity in the Information Age,” International Journal of Enterprise Infor-
mation Systems (15:1), pp. 1-23.
Ayyagari, R., Grover, V., and Purvis, R. 2011. “Technostress: Technological Antecedents and
Implications,” Management Information Systems Quarterly (35:4), pp. 831-858.
Bakker, A. B., and Demerouti, E. 2007. “The Job Demands‐Resources Model: State of the Art,”
Journal of Managerial Psychology (22:3), pp. 309-328.
Baskerville, R. L., Myers, M. D., and Yoo, Y. 2020. “Digital First: The Ontological Reversal
and New Challenges for Information Systems Research,” Management Information Systems
Quarterly (44:2), pp. 509-523.
Beaton, D., Bombardier, C., Guillemin, F., and Ferraz, M. B. 2002. “Recommendations for the
Cross-Cultural Adaptation of Health Status Measures,” American Academy of Orthopaedic
Surgeons (12), pp. 1-9.
Beauducel, A. 2001. “Problems with Parallel Analysis in Data Sets with Oblique Simple Struc-
ture,” Methods of Psychological Research Online (6:2), pp. 141-157.
Benlian, A. 2020. “A Daily Field Investigation of Technology-Driven Spillovers from Work to
Home,” Management Information Systems Quarterly (44:3), pp. 1259-1300.
Best, S. J., Krueger, B. S., and Ladewig, J. 2006. “Privacy in the Information Age,” Interna-
tional Journal of Public Opinion Quarterly (70:3), pp. 375-401.
Bharadwaj, A., El Sawy, O. A., Pavlou, P. A., and Venkatraman, N. 2013. “Digital Business
Strategy: Toward a Next Generation of Insights,” Management Information Systems Quar-
terly (37:2), pp. 471-482.
Boonjing, V., and Chanvarasuth, P. 2017. “Risk of Overusing Mobile Phones: Technostress
Effect,” Procedia Computer Science (111), pp. 196-202.
Technostress as a Negative Outcome of Individual Information Systems Use 200
Braun, V., and Clarke, V. 2006. “Using Thematic Analysis in Psychology,” Qualitative Re-
search in Psychology (3:2), pp. 77-101.
Brod, C. 1982. “Managing Technostress: Optimizing the Use of Computer Technology,” Per-
sonnel Journal (61:10), pp. 753-757.
Brod, C. 1984. Technostress: The Human Cost of the Computer Revolution, Reading, Mass.:
Addison-Wesley.
Califf, C. B., Sarker, S., and Sarker, S. 2020. “The Bright and Dark Sides of Technostress: A
Mixed-Methods Study Involving Healthcare IT,” Management Information Systems Quar-
terly (44:2), pp. 809-856.
Chen, J. V., Tran, A., and Nguyen, T. 2019. “Understanding the Discontinuance Behavior of
Mobile Shoppers as a Consequence of Technostress: An Application of the Stress-Coping
Theory,” Computers in Human Behavior (95), pp. 83-93.
Chiappetta, M. 2017. “The Technostress: Definition, Symptoms and Risk Prevention,” Senses
and Sciences (4:1), pp. 358-361.
Colbert, A., Yee, N., and George, G. 2016. “The Digital Workforce and the Workplace of the
Future,” Academy of Management Journal (59:3), pp. 731-739.
Cronbach, L. J., and Meehl, P. E. 1955. “Construct Validity in Psychological Tests,” Psycho-
logical Bulletin (52:4), pp. 281-302.
Demerouti, E., Bakker, A. B., Nachreiner, F., and Schaufeli, W. B. 2001. “The Job Demands-
Resources Model of Burnout,” The Journal of Applied Psychology (86:3), pp. 499-512.
Dunn, K. J., and McCray, G. 2020. “The Place of the Bifactor Model in Confirmatory Factor
Analysis Investigations into Construct Dimensionality in Language Testing,” Frontiers in
Psychology (11), Article 1357.
Durward, D., Blohm, I., and Leimeister, J. M. 2016. “Crowd Work,” Business & Information
Systems Engineering (58:4), pp. 281-286.
Edwards, J. R. 2001. “Multidimensional Constructs in Organizational Behavior Research: An
Integrative Analytical Framework,” Organizational Research Methods (4:2), pp. 144-192.
Fieseler, C., Grubenmann, S., Meckel, M., and Müller, S. 2014. “The Leadership Dimension of
Coping with Technostress,” in Proceedings of the 47th Hawaii International Conference on
System Science, Hilton Waikoloa, Big Island, Hawaii, USA, pp. 530-539.
Fischer, T., Pehböck, A., and Riedl, R. 2019. “Is the Technostress Creators Inventory Still an
Up-To-Date Measurement Instrument?: Results of a Large-Scale Interview Study,” in Pro-
ceedings of the 14th International Conference on Wirtschaftsinformatik, Siegen, Germany,
pp. 1820-1831.
Technostress as a Negative Outcome of Individual Information Systems Use 201
Fischer, T., and Riedl, R. 2015. “Theorizing Technostress in Organizations: A Cybernetic Ap-
proach,” in Proceedings of the 12th International Conference on Wirtschaftsinformatik, Os-
nabrueck, Germany, pp. 1453-1467.
Fischer, T., and Riedl, R. 2020. “Messung von digitalem Stress im organisationalen Umfeld:
Erfahrungen aus einer Fallstudie,” HMD Praxis der Wirtschaftsinformatik (57), pp. 218-
229.
Fornell, C., and Larcker, D. F. 1981. “Evaluating Structural Equation Models with Unobserva-
ble Variables and Measurement Error,” Journal of Marketing Research (18:1), pp. 39-50.
Fritzsche, B. A., and Parrish, T. J. 2005. “Theories and Research on Job Satisfaction,” in Career
Development and Counseling: Putting Theory and Research to Work, S. D. Brown and R.
W. Lent (eds.), Hoboken, New Jersey: Wiley.
Galluch, P. S., Grover, V., and Thatcher, J. B. 2015. “Interrupting the Workplace: Examining
Stressors in an Information Technology Context,” Journal of the Association for Infor-
mation Systems (16:1), pp. 1-47.
Gaudioso, F., Turel, O., and Galimberti, C. 2015. “Explaining Work Exhaustion From a Coping
Theory Perspective: Roles of Techno-Stressors and Technology-Specific Coping Strate-
gies,” Studies in Health Technology and Informatics (219), pp. 14-20.
Gefen, D., Straub, D. W., and Boudreau, M.-C. 2000. “Structural Equation Modeling and Re-
gression: Guidelines for Research Practice,” Communications of the Association for Infor-
mation Systems (4:1), Article 7.
Gregor, S. 2006. “The Nature of Theory in Information Systems,” Management Information
Systems Quarterly (30:3), pp. 611-642.
Güğerçin, U. 2020. “Does Techno-Stress Justify Cyberslacking?: An Empirical Study Based
on the Neutralisation Theory,” Behaviour & Information Technology (39:7), pp. 824-836.
Hefner, D., and Vorderer, P. 2016. “Digital Stress: Permanent Connectedness and Multitask-
ing,” in The Routledge Handbook of Media Use and Well-Being: International Perspectives
on Theory and Research on Positive Media, L. Reinecke and M. B. Oliver (eds.), New York:
Routledge, pp. 237-249.
Hinkin, T. R. 1998. “A Brief Tutorial on the Development of Measures for Use in Survey Ques-
tionnaires,” Organizational Research Methods (1:1), pp. 104-121.
Hong, W., Chan, F. K. Y., Thong, J. Y. L., Chasalow, L. C., and Dhillon, G. 2014. “A Frame-
work and Guidelines for Context-Specific Theorizing in Information Systems Research,”
Information Systems Research (25:1), pp. 111-136.
Technostress as a Negative Outcome of Individual Information Systems Use 202
Horn, J. L. 1965. “A Rationale and Test for the Number of Factors in Factor Analysis,” Psy-
chometrika (30:2), pp. 179-185.
Hsu, H.-C. 2018. “Age Differences in Work Stress, Exhaustion, Well-Being, and Related Fac-
tors From an Ecological Perspective,” International Journal of Environmental Research
and Public Health (16:1), Article 50.
Jarvis, C. B., MacKenzie, S. B., and Podsakoff, P. M. 2003. “A Critical Review of Construct
Indicators and Measurement Model Misspecification in Marketing and Consumer Re-
search,” Journal of Consumer Research (30:2), pp. 199-218.
Jennrich, R. I., and Bentler, P. M. 2011. “Exploratory Bi-Factor Analysis,” Psychometrika
(76:4), pp. 537-549.
Jimenez, P., and Bregenzer, A. 2018. “Integration of eHealth Tools in the Process of Workplace
Health Promotion: Proposal for Design and Implementation,” Journal of Medical Internet
Research (20:2), e65.
Kirmeyer, S. L. 1988. “Coping with Competing Demands: Interruption and the Type A Pat-
tern,” The Journal of Applied Psychology (73:4), pp. 621-629.
Korzynski, P., Rook, C., Florent Treacy, E., and Kets de Vries, M. 2021. “The Impact of Self-
Esteem, Conscientiousness and Pseudo-Personality on Technostress,” Internet Research
(31:1), pp. 59-79.
La Torre, G., Esposito, A., Sciarra, I., and Chiappetta, M. 2019. “Definition, Symptoms and
Risk of Techno-Stress: A Systematic Review,” International Archives of Occupational and
Environmental Health (92:1), pp. 13-35.
La Torre, G., Leonardis, V. de, and Chiappetta, M. 2020. “Technostress: How Does it Affect
the Productivity and Life of an Individual?: Results of an Observational Study,” Public
Health (189), pp. 60-65.
Law, K. S., and Wong, C.-S. 1999. “Multidimensional Constructs in Structural Equation Anal-
ysis: An Illustration Using the Job Perception and Job Satisfaction Constructs,” Journal of
Management (25:2), pp. 143-160.
Law, K. S., Wong, C.-S., and Mobley, W. H. 1998. “Toward a Taxonomy of Multidimensional
Constructs,” The Academy of Management Review (23:4), pp. 741-755.
Lazarus, R. S., and Folkman, S. 1984. Stress, Appraisal, and Coping, New York: Springer Pub-
lishing Company.
Legner, C., Eymann, T., Hess, T., Matt, C., Böhmann, T., Drews, P., Mädche, A., Urbach, N.,
and Ahlemann, F. 2017. “Digitalization: Opportunity and Challenge for the Business and
Technostress as a Negative Outcome of Individual Information Systems Use 203
Information Systems Engineering Community,” Business & Information Systems Engineer-
ing (59:4), pp. 301-308.
Lei, P.-W., and Wu, Q. 2007. “Introduction to Structural Equation Modeling: Issues and Prac-
tical Considerations,” Educational Measurement: Issues and Practice (26:3), pp. 33-43.
MacKenzie, S. B., Podsakoff, P. M., and Podsakoff, N. P. 2011. “Construct Measurement and
Validation Procedures in MIS and Behavioral Research: Integrating New and Existing
Techniques,” Management Information Systems Quarterly (35:2), pp. 293-334.
Maslach, C., and Jackson, S. E. 1986. The Maslach Burnout Inventory Manual, Palo Alto: Con-
sulting Psychologists Press.
Miller, G. A. 1956. “The Magical Number Seven, Plus or Minus Two: Some Limits on Our
Capacity for Processing Information,” Psychological Review (63:2), p. 81.
Molino, M., Ingusci, E., Signore, F., Manuti, A., Giancaspro, M. L., Russo, V., Zito, M., and
Cortese, C. G. 2020. “Wellbeing Costs of Technology Use during Covid-19 Remote Work-
ing: An Investigation Using the Italian Translation of the Technostress Creators Scale,”
Sustainability (12:15), p. 5911.
Moore, G. C., and Benbasat, I. 1991. “Development of an Instrument to Measure the Percep-
tions of Adopting an Information Technology Innovation,” Information Systems Research
(2:3), pp. 192-222.
Nash, C., Jarrahi, M. H., Sutherland, W., and Phillips, G. 2018. “Digital Nomads Beyond the
Buzzword: Defining Digital Nomadic Work and Use of Digital Technologies,” in Trans-
forming Digital Worlds: 13th International Conference, G. Chowdhury, J. McLeod, V. Gil-
let and P. Willett (eds.), Sheffield: Springer International Publishing, pp. 207-217.
Navruz, B., Capraro, R. M., Bicer, A., and Capraro, M. M. 2015. “A Review of Higher-Order
Factor Analysis Interpretation Strategies,” Journal of Measurement and Evaluation in Ed-
ucation and Psychology (6:1), pp. 72-94.
Nayak, M. S. D. P., and Narayan, K. A. 2019. “Strengths and Weakness of Online Surveys,”
IOSR Journal of Humanities and Social Science (24:5), pp. 31-38.
Nisafani, A. S., Kiely, G., and Mahony, C. 2020. “Workers’ Technostress: A Review of its
Causes, Strains, Inhibitors, and Impacts,” Journal of Decision Systems, pp. 1-16.
Orlikowski, W. J., and Scott, S. V. 2017. “Digital Work: A Research Agenda,” in A Research
Agenda for Management and Organization Studies, B. Czarniawska (ed.), Cheltenham, UK,
Northampton, MA, USA: Edward Elgar Publishing, pp. 88-95.
Technostress as a Negative Outcome of Individual Information Systems Use 204
Pearse, N. 2019. “An Illustration of Deductive Analysis in Qualitative Research,” in Proceed-
ings of the 18th European Conference on Research Methodology for Business and Manage-
ment Studies, Johannesburg, South Africa, pp. 264-270.
Pflügner, K., Maier, C., Mattke, J., and Weitzel, T. 2020. “Personality Profiles that Put Users
at Risk of Perceiving Technostress: A Qualitative Comparative Analysis with the Big Five
Personality Traits,” Business & Information Systems Engineering, pp. 1-14.
Pflügner, K., Maier, C., and Weitzel, T. 2021. “The Direct and Indirect Influence of Mindful-
ness on Techno-Stressors and Job Burnout: A Quantitative Study of White-Collar Workers,”
Computers in Human Behavior (115), p. 106566.
Pirkkalainen, H., Salo, M., Tarafdar, M., and Makkonen, M. 2019. “Deliberate or Instinctive?:
Proactive and Reactive Coping for Technostress,” Journal of Management Information Sys-
tems (36:4), pp. 1179-1212.
Podsakoff, P. M., MacKenzie, S. B., and Podsakoff, N. P. 2003. “Common Method Biases in
Behavioral Research: A Critical Review of the Literature and Recommended Remedies,”
Journal of Applied Psychology (88:5), pp. 879-903.
Popper, K. 2005. The Logic of Scientific Discovery, Routledge.
Ragu-Nathan, T. S., Tarafdar, M., Ragu-Nathan, B. S., and Tu, Q. 2008. “The Consequences
of Technostress for End Users in Organizations: Conceptual Development and Empirical
Validation,” Information Systems Research (19:4), pp. 417-433.
Regalado, A. 2011. Who Coined ‘Cloud Computing’? https://www.technolo-
gyreview.com/2011/10/31/257406/who-coined-cloud-computing/. Accessed 16 February
2021.
Reinecke, L., and Oliver, M. B. (eds.) 2016. The Routledge Handbook of Media Use and Well-
Being: International Perspectives on Theory and Research on Positive Media, New York:
Routledge.
Richardson, H. A., Simmering, M. J., and Sturman, M. C. 2009. “A Tale of Three Perspectives:
Examining Post Hoc Statistical Techniques for Detection and Correction of Common
Method Variance,” Organizational Research Methods (12:4), pp. 762-800.
Rindskopf, D., and Rose, T. 1988. “Some Theory and Applications of Confirmatory Second-
Order Factor Analysis,” Multivariate Behavioral Research (23:1), pp. 51-67.
Rubino, C., Volpone, S. D., and Avery, D. R. 2013. “Burnout on Mars and Venus: Exploring
Gender Differences in Emotional Exhaustion,” Gender in Management: An International
Journal (28:2), pp. 74-93.
Technostress as a Negative Outcome of Individual Information Systems Use 205
Salanova, M., Llorens, S., and Cifre, E. 2013. “The Dark Side of Technologies: Technostress
Among Users of Information and Communication Technologies,” International Journal of
Psychology (48:3), pp. 422-436.
Sandoval-Reyes, J., Acosta-Prado, J. C., and Sanchís-Pedregosa, C. 2019. “Relationship
Amongst Technology Use, Work Overload, and Psychological Detachment from Work,”
International Journal of Environmental Research and Public Health (16:23), Article 4602.
Sebastian, I. M., Ross, J. W., Beath, C., Mocker, M., Moloney, K. G., and Fonstad, N. O. 2017.
“How Big Old Companies Navigate Digital Transformation,” Management Information
Systems Quarterly Executive (16:3), pp. 197-213.
Secor, A. 2010. “Social Surveys, Interviews, and Focus Groups,” in Research Methods in Ge-
ography, B. Gomez and J. P. Jones, III (eds.), John Wiley & Sons, pp. 194-205.
Sellberg, C., and Susi, T. 2014. “Technostress in the Office: A Distributed Cognition Perspec-
tive on Human-Technology Interaction,” Cognition, Technology & Work (16:2), pp. 187-
201.
Selye, H. 1973. “The Evolution of the Stress Concept: The Originator of the Concept Traces its
Development from the Discovery in 1936 of the Alarm Reaction to Modern Therapeutic
Applications of Syntoxic and Catatoxic Hormones,” American Scientist (61:6), pp. 692-699.
Steele, R. G., Hall, J. A., and Christofferson, J. L. 2020. “Conceptualizing Digital Stress in
Adolescents and Young Adults: Toward the Development of an Empirically Based Model,”
Clinical Child and Family Psychology Review (23:1), pp. 15-26.
Tarafdar, M., Cooper, C. L., and Stich, J.-F. 2019a. “The Technostress Trifecta: Techno Eu-
stress, Techno Distress and Design: Theoretical Directions and an Agenda for Research,”
Information Systems Journal (29:1), pp. 6-42.
Tarafdar, M., Maier, C., Laumer, S., and Weitzel, T. 2019b. “Explaining the Link between
Technostress and Technology Addiction for Social Networking Sites: A Study of Distrac-
tion as a Coping Behavior,” Information Systems Journal (62:4), p. 51.
Tarafdar, M., Tu, Q., Ragu-Nathan, B. S., and Ragu-Nathan, T. S. 2007. “The Impact of Tech-
nostress on Role Stress and Productivity,” Journal of Management Information Systems
(24:1), pp. 301-328.
Tarafdar, M., Tu, Q., and Ragu-Nathan, T. S. 2010. “Impact of Technostress on End-User Sat-
isfaction and Performance,” Journal of Management Information Systems (27:3), pp. 303-
334.
Tashakkori, A., and Teddlie, C. 1998. Mixed Methodology: Combining Qualitative and Quan-
titative Approaches, Thousand Oaks, CA: SAGE.
Technostress as a Negative Outcome of Individual Information Systems Use 206
Thatcher, J. B., Wright, R. T., Sun, H., Zagenczyk, T. J., and Klein, R. 2018. “Mindfulness in
Information Technology Use: Definitions, Distinctions, and a New Measure,” Management
Information Systems Quarterly (42:3), pp. 831-847.
Tu, Q., Tarafdar, M., Ragu-Nathan, T. S., and Ragu-Nathan, B. S. 2008. “Improving End-User
Satisfaction through Techno-Stress Prevention: Some Empirical Evidences,” in Proceed-
ings of the 14th Americas Conference on Information Systems, Toronto, Canada, pp. 1-8.
Urbach, N., and Ahlemann, F. 2010. “Structural Equation Modeling in Information Systems
Research Using Partial Least Squares,” Journal of Information Technology Theory and Ap-
plication (11:2), pp. 5-40.
Velicer, W. F. 1976. “Determining the Number of Components from the Matrix of Partial Cor-
relations,” Psychometrika (41:3), pp. 321-327.
Venkatesh, V., Brown, S. A., and Bala, H. 2013. “Bridging the Qualitative-Quantitative Di-
vide: Guidelines for Conducting Mixed Methods Research in Information Systems,” Man-
agement Information Systems Quarterly (37:1), pp. 21-54.
Venkatesh, V., Brown, S. A., and Sullivan, Y. W. 2016. “Guidelines for Conducting Mixed-
methods Research: An Extension and lllustration,” Journal of the Association for Infor-
mation Systems (17:7), pp. 435-494.
Vial, G. 2019. “Understanding Digital Transformation: A Review and a Research Agenda,”
Journal of Strategic Information Systems (28:2), pp. 118-144.
Wang, K., Shu, Q., and Tu, Q. 2008. “Technostress Under Different Organizational Environ-
ments: An Empirical Investigation,” Computers in Human Behavior (24:6), pp. 3002-3013.
Weber, R. 2012. “Evaluating and Developing Theories in the Information Systems Discipline,”
Journal of the Association for Information Systems (13:1), pp. 1-30.
Weil, M. M., and Rosen, L. D. 1997. TechnoStress: Coping with Technology @Work @Home
@Play, New York: John Wiley & Sons Inc.
Weinstein, E. C., and Selman, R. L. 2016. “Digital Stress: Adolescents’ Personal Accounts,”
New Media & Society (18:3), pp. 391-409.
Technostress as a Negative Outcome of Individual Information Systems Use 207
3.3.9 Appendix
Appendix 3.3.A. Development and Validation of Measures
For the development and validation of measures, we followed two different processes depend-
ing on the prerequisites. If possible, the use of existing measures is recommended (Urbach and
Ahlemann 2010). In the case of new constructs without existing measures, we followed the
guidelines formulated by Hinkin (1998) and MacKenzie et al. (2011). Therefore, the following
passages are structured according to the steps recommended by MacKenzie et al. (2011).
Step 1: Develop a conceptual definition of the construct
The first step is to define the constructs conceptually and to discuss “how the construct differs
from other related constructs” (MacKenzie et al. 2011, p. 298). This step has been covered in
Phase 1 of our mixed-methods study. The qualitative investigations concluded with a definition
of twelve digital work demands, as presented in Table 3.3-3 within the research article.
Step 2: Generate items to represent the construct
For existing scales, we collected the items from Ragu-Nathan et al. (2008) (i.e., invasion, over-
load, complexity, insecurity, and uncertainty), Ayyagari et al. (2011) (i.e., unreliability, role
ambiguity, and invasion of privacy), and Galluch et al. (2015) (i.e., interruptions). The items
were slightly adapted. For example, instead of the wording “technology” or “ICT”, we consist-
ently used the term “digital technology and media”. The items were collected in English and
then translated into German since the survey’s final sample consisted of German employees.
Therefore, two bilingual speakers translated the questions in parallel. They met afterward to
discuss discrepancies with a third bilingual speaker and agree on the most suitable translation.
A fourth bilingual speaker back-translated the items into English again and checked the seman-
tic equivalence.
For the newly identified demands, nonavailability, performance control, and lacking a sense of
achievement, we developed items based on the definitions of these constructs (cf. Table 3.3-3)
considering standard guidelines (Hinkin 1998; MacKenzie et al. 2011; Podsakoff et al. 2003).
We created the items to be short, simple, and precise and used appropriate language for em-
ployees (Hinkin 1998; MacKenzie et al. 2011). During the development, we carefully made
sure that the items only address a single aspect (i.e., no connection of different statements in
one item) to prevent the respondent’s confusion (Hinkin 1998). High quality of items and care-
ful construction of the statements used are necessary procedural remedies to avoid common
method bias (CMB) (Podsakoff et al. 2003). Since it is likely in a scale development process
Technostress as a Negative Outcome of Individual Information Systems Use 208
that approximately half of the items may be dropped due to reliability and validity issues (Hin-
kin 1998), we generated six items for each creator of digital stress so that at least three items
would remain after the validation process. Because the questionnaire was rather long, reverse-
coded items were included to reduce response patterns in the first draft of the survey. The items
of the three new scales were generated in German. We translated the final versions of the items
into English for further reusability according to the same procedure as we translated the existing
English item scales into German.
We used a five-point Likert-type rating scale from 0 = “I do not agree at all” to 4 = “I totally
agree” to measure all twelve demands.
Step 3: Assess the content validity of the items
To evaluate the newly developed item scales’ content and face validity, we conducted a card-
sorting experiment via an online matching task with fellow researchers (Moore and Benbasat
1991; Thatcher et al. 2018). Thirty-nine participants completed the task. Items that were cor-
rectly matched by less than 85 % of participants were subject to refinement. Thus, we changed
the wording of these items to fit the corresponding digital work demands better and finished
this step of item generation with the revised scales.
Step 4: Formally specify the measurement model
We specified the measurement model as first-order reflective for each of the established scales
as suggested by Ragu-Nathan et al. (2008, p. 428), who “… have conceptualized technostress
creators … as reflective or superordinate (Edwards 2001; Law and Wong 1999) constructs. This
implies that (1) each of the first-order constructs represents a facet or manifestation and can be
viewed as one of its dimensions and the direction of causality is from the second-order construct
to its facets, the first-order constructs, (2) the first-order constructs are interchangeable, (3)
covariation among the first-order constructs is not unexpected, and (4) the nomological net-
works associated with them are expected to be similar (Jarvis et al. 2003)”. For the newly de-
veloped scales, we followed the suggestion from Ragu-Nathan et al. (2008, p. 428) and are
“consistent with previous literature on stress that models stress as a reflective construct (Law
et al. 1998)”. Furthermore, we allowed for correlation among the twelve demands. In a later
step, we investigated whether there are higher-order structures among the twelve demands.
Step 5: Collect data to conduct pre-test
Next, we collected data for evaluating our measures’ factor structure and validity (Hinkin 1998;
MacKenzie et al. 2011). First, we acquired respondents for a pre-test via an external research
Technostress as a Negative Outcome of Individual Information Systems Use 209
panel focusing on the German workforce. Respondents were paid 3.70 USD / 3.10 EUR for
participation in the study. Four hundred forty-five respondents took part in the study providing
data (pre-test sample; n1 = 445) in sufficiently good quality (e.g., consistency checks between
individual items, meaningful answers to free-text questions).
Step 6: Scale purification and refinement
On the pre-test data set, we performed an exploratory factor analysis (EFA) to assess the quality
of our questionnaire carefully and did a preliminary analysis of all scales (Hinkin 1998). Parallel
analysis (Horn 1965) suggested extracting nine factors but also showed a strong first factor,
which suggests that a minimum average partial (MAP) test (Beauducel 2001) is more adequate
to determine the number of factors to extract (Velicer 1976). The MAP test suggested 13 fac-
tors.
We used principle axis factoring and oblique rotation to identify the factors. As can be seen in
Table 3.3-11, the items for overload as well as for interruptions loaded on one joint factor.
Further, the items for nonavailability and for lacking a sense of achievement loaded on two
separate factors each. These “sub-factors” were compounded of items that were formulated in
the same direction. Thus, we decided to reformulate all reversely coded items. Furthermore, we
removed the first item of invasion of privacy due to its cross-loading on performance control.
As both, the overload and interruptions scales were validated in prior research (even if not used
jointly), we for now refrained from adaptations.
Step 7: Gather data from new sample and reexamine scale properties
Using the revised scales, we collect a new data set from a large scale-study with 4,560 respond-
ents participating in an online survey through the same external research panel as in the pre-
test. We randomly split our study population into a subset for developmental purposes (devel-
opmental sample; n2 = 1,560) and a subset for validation purposes (validation sample;
n3 = 3,000). Step seven and eight is performed on the developmental sample to re-assess scale
properties, while all consecutive steps are performed on the validation sample. Table 3.3-10
presents the demographic properties of the participants in the developmental sample.
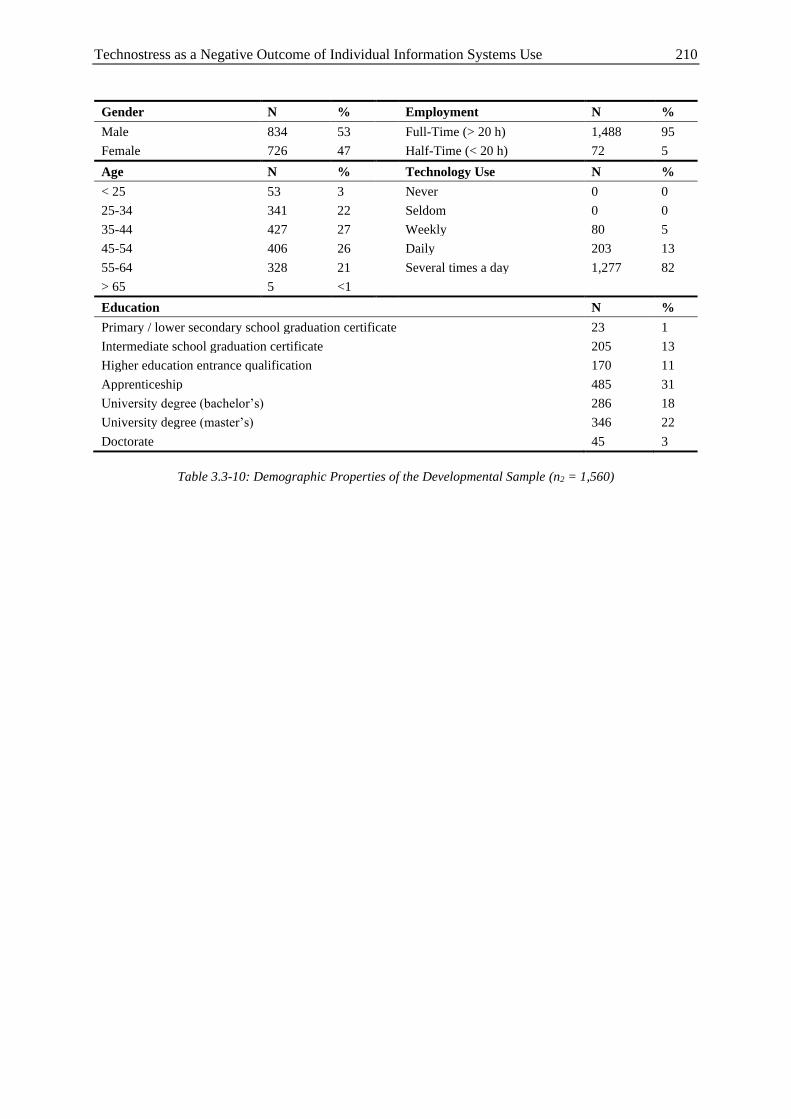
Technostress as a Negative Outcome of Individual Information Systems Use 210
Gender N % Employment N %
Male 834 53 Full-Time (> 20 h) 1,488 95
Female 726 47 Half-Time (< 20 h) 72 5
Age N % Technology Use N %
< 25 53 3 Never 0 0
25-34 341 22 Seldom 0 0
35-44 427 27 Weekly 80 5
45-54 406 26 Daily 203 13
55-64 328 21 Several times a day 1,277 82
> 65 5 <1
Education N %
Primary / lower secondary school graduation certificate 23 1
Intermediate school graduation certificate 205 13
Higher education entrance qualification 170 11
Apprenticeship 485 31
University degree (bachelor’s) 286 18
University degree (master’s) 346 22
Doctorate 45 3
Table 3.3-10: Demographic Properties of the Developmental Sample (n2 = 1,560)
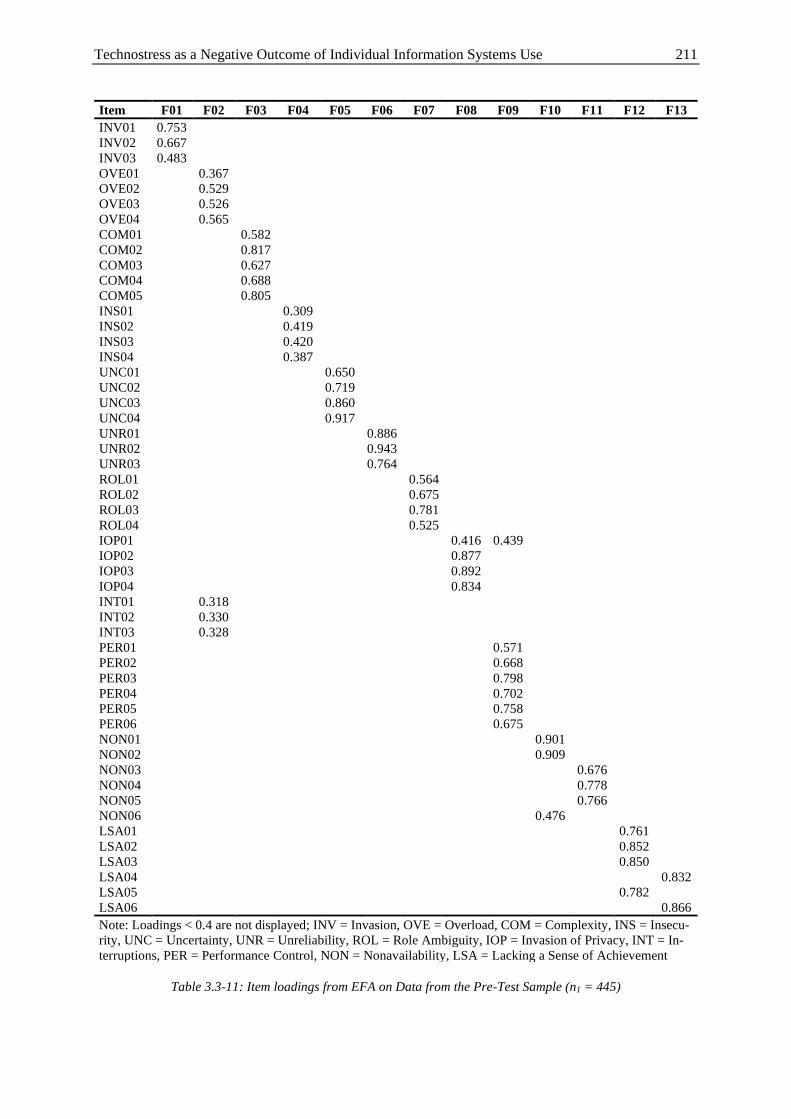
Technostress as a Negative Outcome of Individual Information Systems Use 211
Item F01 F02 F03 F04 F05 F06 F07 F08 F09 F10 F11 F12 F13
INV01 0.753
INV02 0.667
INV03 0.483
OVE01 0.367
OVE02 0.529
OVE03 0.526
OVE04 0.565
COM01 0.582
COM02 0.817
COM03 0.627
COM04 0.688
COM05 0.805
INS01 0.309
INS02 0.419
INS03 0.420
INS04 0.387
UNC01 0.650
UNC02 0.719
UNC03 0.860
UNC04 0.917
UNR01 0.886
UNR02 0.943
UNR03 0.764
ROL01 0.564
ROL02 0.675
ROL03 0.781
ROL04 0.525
IOP01 0.416 0.439
IOP02 0.877
IOP03 0.892
IOP04 0.834
INT01 0.318
INT02 0.330
INT03 0.328
PER01 0.571
PER02 0.668
PER03 0.798
PER04 0.702
PER05 0.758
PER06 0.675
NON01 0.901
NON02 0.909
NON03 0.676
NON04 0.778
NON05 0.766
NON06 0.476
LSA01 0.761
LSA02 0.852
LSA03 0.850
LSA04 0.832
LSA05 0.782
LSA06 0.866
Note: Loadings < 0.4 are not displayed; INV = Invasion, OVE = Overload, COM = Complexity, INS = Insecu-
rity, UNC = Uncertainty, UNR = Unreliability, ROL = Role Ambiguity, IOP = Invasion of Privacy, INT = In-
terruptions, PER = Performance Control, NON = Nonavailability, LSA = Lacking a Sense of Achievement
Table 3.3-11: Item loadings from EFA on Data from the Pre-Test Sample (n1 = 445)
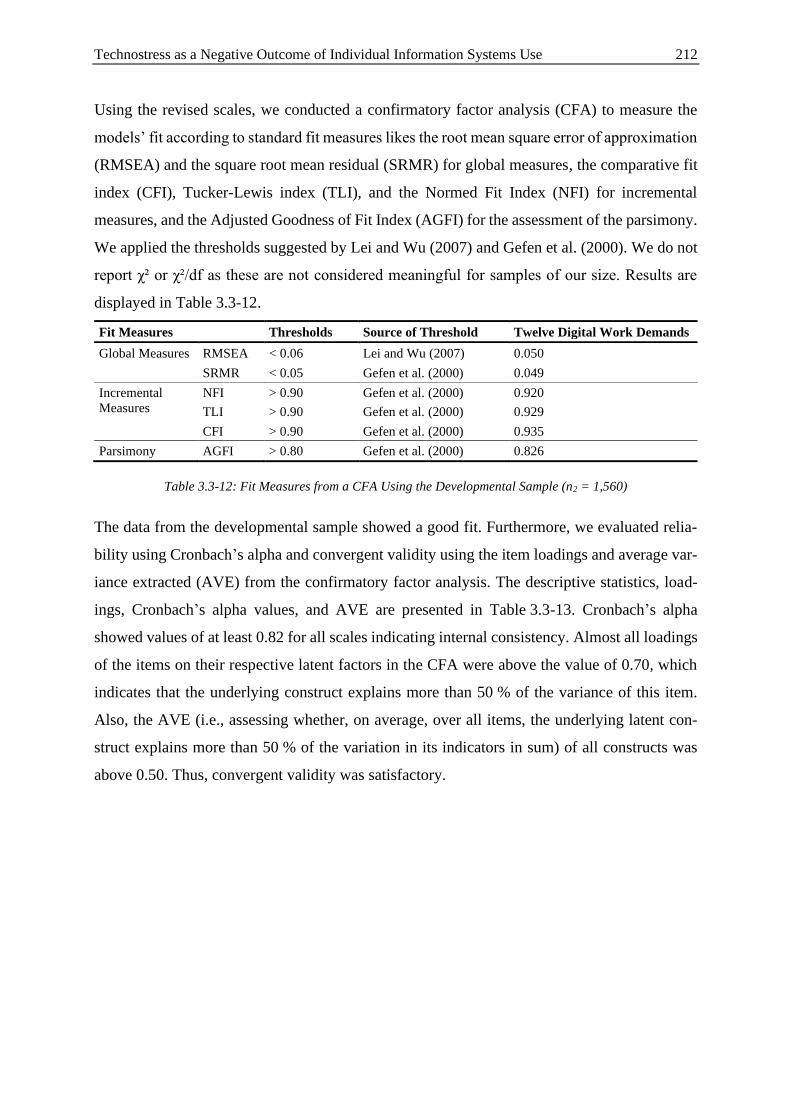
Technostress as a Negative Outcome of Individual Information Systems Use 212
Using the revised scales, we conducted a confirmatory factor analysis (CFA) to measure the
models’ fit according to standard fit measures likes the root mean square error of approximation
(RMSEA) and the square root mean residual (SRMR) for global measures, the comparative fit
index (CFI), Tucker-Lewis index (TLI), and the Normed Fit Index (NFI) for incremental
measures, and the Adjusted Goodness of Fit Index (AGFI) for the assessment of the parsimony.
We applied the thresholds suggested by Lei and Wu (2007) and Gefen et al. (2000). We do not
report χ² or χ²/df as these are not considered meaningful for samples of our size. Results are
displayed in Table 3.3-12.
Fit Measures Thresholds Source of Threshold Twelve Digital Work Demands
Global Measures RMSEA < 0.06 Lei and Wu (2007) 0.050
SRMR < 0.05 Gefen et al. (2000) 0.049
Incremental
Measures
NFI > 0.90 Gefen et al. (2000) 0.920
TLI > 0.90 Gefen et al. (2000) 0.929
CFI > 0.90 Gefen et al. (2000) 0.935
Parsimony AGFI > 0.80 Gefen et al. (2000) 0.826
Table 3.3-12: Fit Measures from a CFA Using the Developmental Sample (n2 = 1,560)
The data from the developmental sample showed a good fit. Furthermore, we evaluated relia-
bility using Cronbach’s alpha and convergent validity using the item loadings and average var-
iance extracted (AVE) from the confirmatory factor analysis. The descriptive statistics, load-
ings, Cronbach’s alpha values, and AVE are presented in Table 3.3-13. Cronbach’s alpha
showed values of at least 0.82 for all scales indicating internal consistency. Almost all loadings
of the items on their respective latent factors in the CFA were above the value of 0.70, which
indicates that the underlying construct explains more than 50 % of the variance of this item.
Also, the AVE (i.e., assessing whether, on average, over all items, the underlying latent con-
struct explains more than 50 % of the variation in its indicators in sum) of all constructs was
above 0.50. Thus, convergent validity was satisfactory.
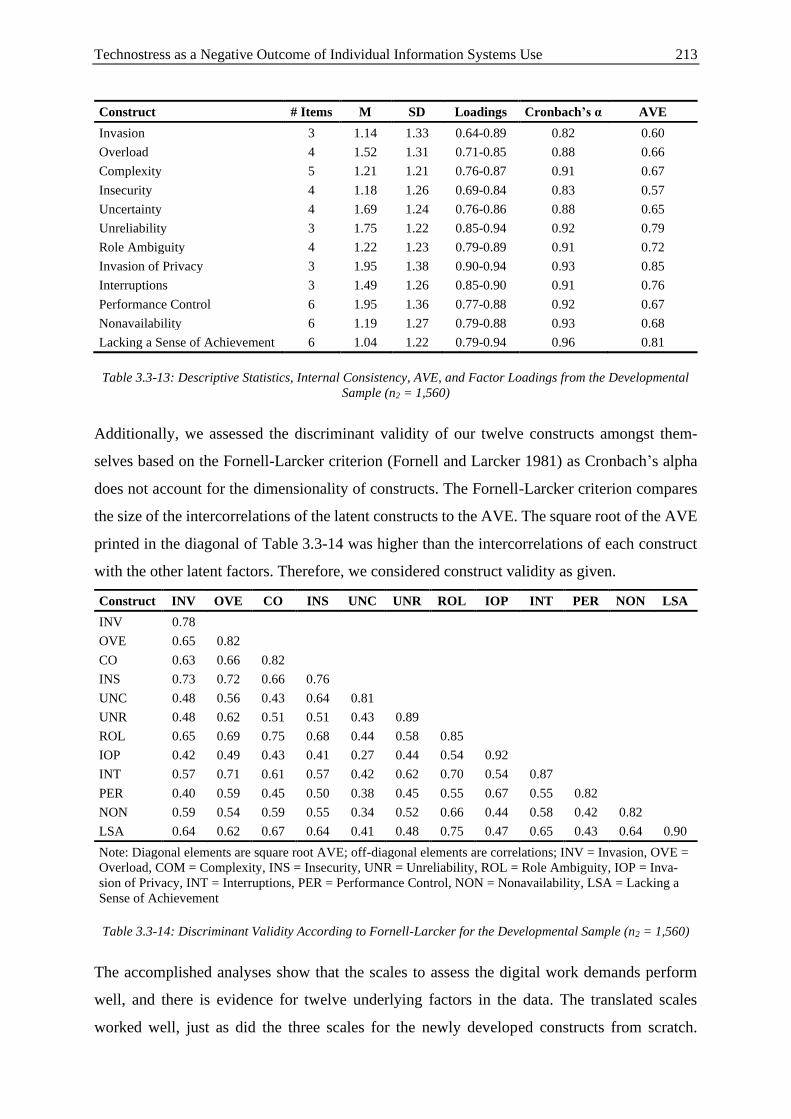
Technostress as a Negative Outcome of Individual Information Systems Use 213
Construct # Items M SD Loadings Cronbach’s α AVE
Invasion 3 1.14 1.33 0.64-0.89 0.82 0.60
Overload 4 1.52 1.31 0.71-0.85 0.88 0.66
Complexity 5 1.21 1.21 0.76-0.87 0.91 0.67
Insecurity 4 1.18 1.26 0.69-0.84 0.83 0.57
Uncertainty 4 1.69 1.24 0.76-0.86 0.88 0.65
Unreliability 3 1.75 1.22 0.85-0.94 0.92 0.79
Role Ambiguity 4 1.22 1.23 0.79-0.89 0.91 0.72
Invasion of Privacy 3 1.95 1.38 0.90-0.94 0.93 0.85
Interruptions 3 1.49 1.26 0.85-0.90 0.91 0.76
Performance Control 6 1.95 1.36 0.77-0.88 0.92 0.67
Nonavailability 6 1.19 1.27 0.79-0.88 0.93 0.68
Lacking a Sense of Achievement 6 1.04 1.22 0.79-0.94 0.96 0.81
Table 3.3-13: Descriptive Statistics, Internal Consistency, AVE, and Factor Loadings from the Developmental
Sample (n2 = 1,560)
Additionally, we assessed the discriminant validity of our twelve constructs amongst them-
selves based on the Fornell-Larcker criterion (Fornell and Larcker 1981) as Cronbach’s alpha
does not account for the dimensionality of constructs. The Fornell-Larcker criterion compares
the size of the intercorrelations of the latent constructs to the AVE. The square root of the AVE
printed in the diagonal of Table 3.3-14 was higher than the intercorrelations of each construct
with the other latent factors. Therefore, we considered construct validity as given.
Construct INV OVE CO INS UNC UNR ROL IOP INT PER NON LSA
INV 0.78
OVE 0.65 0.82
CO 0.63 0.66 0.82
INS 0.73 0.72 0.66 0.76
UNC 0.48 0.56 0.43 0.64 0.81
UNR 0.48 0.62 0.51 0.51 0.43 0.89
ROL 0.65 0.69 0.75 0.68 0.44 0.58 0.85
IOP 0.42 0.49 0.43 0.41 0.27 0.44 0.54 0.92
INT 0.57 0.71 0.61 0.57 0.42 0.62 0.70 0.54 0.87
PER 0.40 0.59 0.45 0.50 0.38 0.45 0.55 0.67 0.55 0.82
NON 0.59 0.54 0.59 0.55 0.34 0.52 0.66 0.44 0.58 0.42 0.82
LSA 0.64 0.62 0.67 0.64 0.41 0.48 0.75 0.47 0.65 0.43 0.64 0.90
Note: Diagonal elements are square root AVE; off-diagonal elements are correlations; INV = Invasion, OVE =
Overload, COM = Complexity, INS = Insecurity, UNR = Unreliability, ROL = Role Ambiguity, IOP = Inva-
sion of Privacy, INT = Interruptions, PER = Performance Control, NON = Nonavailability, LSA = Lacking a
Sense of Achievement
Table 3.3-14: Discriminant Validity According to Fornell-Larcker for the Developmental Sample (n2 = 1,560)
The accomplished analyses show that the scales to assess the digital work demands perform
well, and there is evidence for twelve underlying factors in the data. The translated scales
worked well, just as did the three scales for the newly developed constructs from scratch.
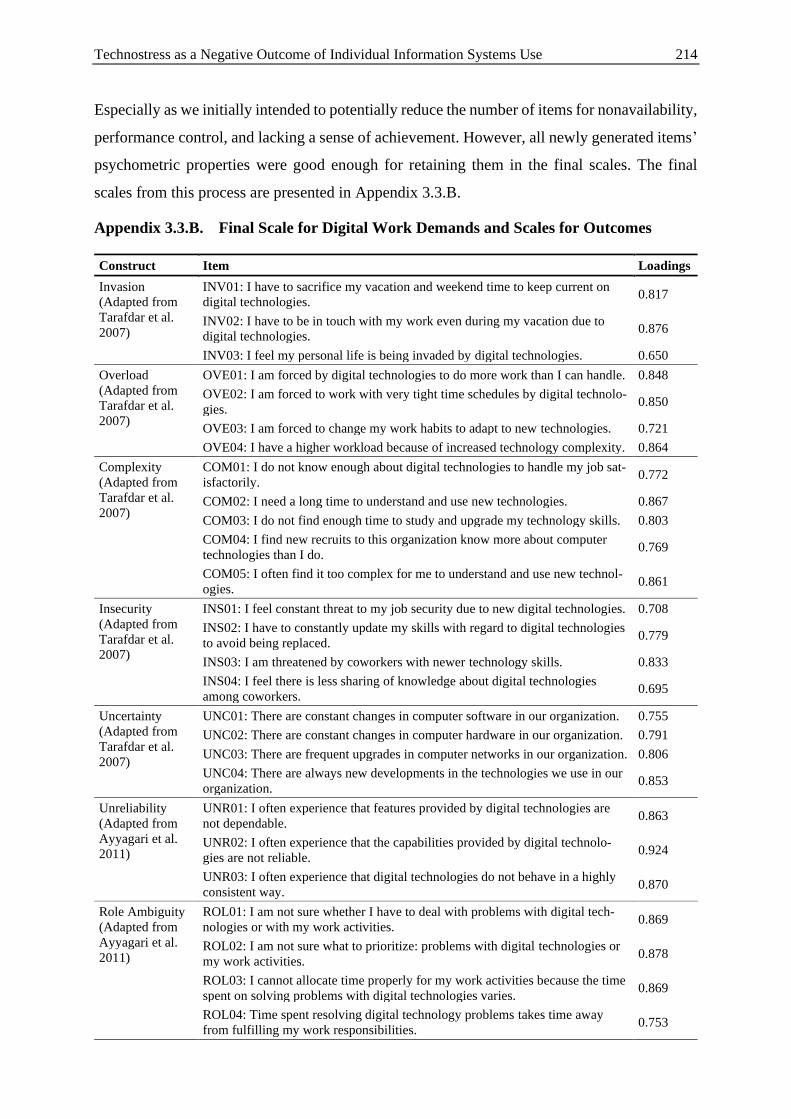
Technostress as a Negative Outcome of Individual Information Systems Use 214
Especially as we initially intended to potentially reduce the number of items for nonavailability,
performance control, and lacking a sense of achievement. However, all newly generated items’
psychometric properties were good enough for retaining them in the final scales. The final
scales from this process are presented in Appendix 3.3.B.
Appendix 3.3.B. Final Scale for Digital Work Demands and Scales for Outcomes
Construct Item Loadings
Invasion
(Adapted from
Tarafdar et al.
2007)
INV01: I have to sacrifice my vacation and weekend time to keep current on
digital technologies. 0.817
INV02: I have to be in touch with my work even during my vacation due to
digital technologies. 0.876
INV03: I feel my personal life is being invaded by digital technologies. 0.650
Overload
(Adapted from
Tarafdar et al.
2007)
OVE01: I am forced by digital technologies to do more work than I can handle. 0.848
OVE02: I am forced to work with very tight time schedules by digital technolo-
gies. 0.850
OVE03: I am forced to change my work habits to adapt to new technologies. 0.721
OVE04: I have a higher workload because of increased technology complexity. 0.864
Complexity
(Adapted from
Tarafdar et al.
2007)
COM01: I do not know enough about digital technologies to handle my job sat-
isfactorily. 0.772
COM02: I need a long time to understand and use new technologies. 0.867
COM03: I do not find enough time to study and upgrade my technology skills. 0.803
COM04: I find new recruits to this organization know more about computer
technologies than I do. 0.769
COM05: I often find it too complex for me to understand and use new technol-
ogies. 0.861
Insecurity
(Adapted from
Tarafdar et al.
2007)
INS01: I feel constant threat to my job security due to new digital technologies. 0.708
INS02: I have to constantly update my skills with regard to digital technologies
to avoid being replaced. 0.779
INS03: I am threatened by coworkers with newer technology skills. 0.833
INS04: I feel there is less sharing of knowledge about digital technologies
among coworkers. 0.695
Uncertainty
(Adapted from
Tarafdar et al.
2007)
UNC01: There are constant changes in computer software in our organization. 0.755
UNC02: There are constant changes in computer hardware in our organization. 0.791
UNC03: There are frequent upgrades in computer networks in our organization. 0.806
UNC04: There are always new developments in the technologies we use in our
organization. 0.853
Unreliability
(Adapted from
Ayyagari et al.
2011)
UNR01: I often experience that features provided by digital technologies are
not dependable. 0.863
UNR02: I often experience that the capabilities provided by digital technolo-
gies are not reliable. 0.924
UNR03: I often experience that digital technologies do not behave in a highly
consistent way. 0.870
Role Ambiguity
(Adapted from
Ayyagari et al.
2011)
ROL01: I am not sure whether I have to deal with problems with digital tech-
nologies or with my work activities. 0.869
ROL02: I am not sure what to prioritize: problems with digital technologies or
my work activities. 0.878
ROL03: I cannot allocate time properly for my work activities because the time
spent on solving problems with digital technologies varies. 0.869
ROL04: Time spent resolving digital technology problems takes time away
from fulfilling my work responsibilities. 0.753
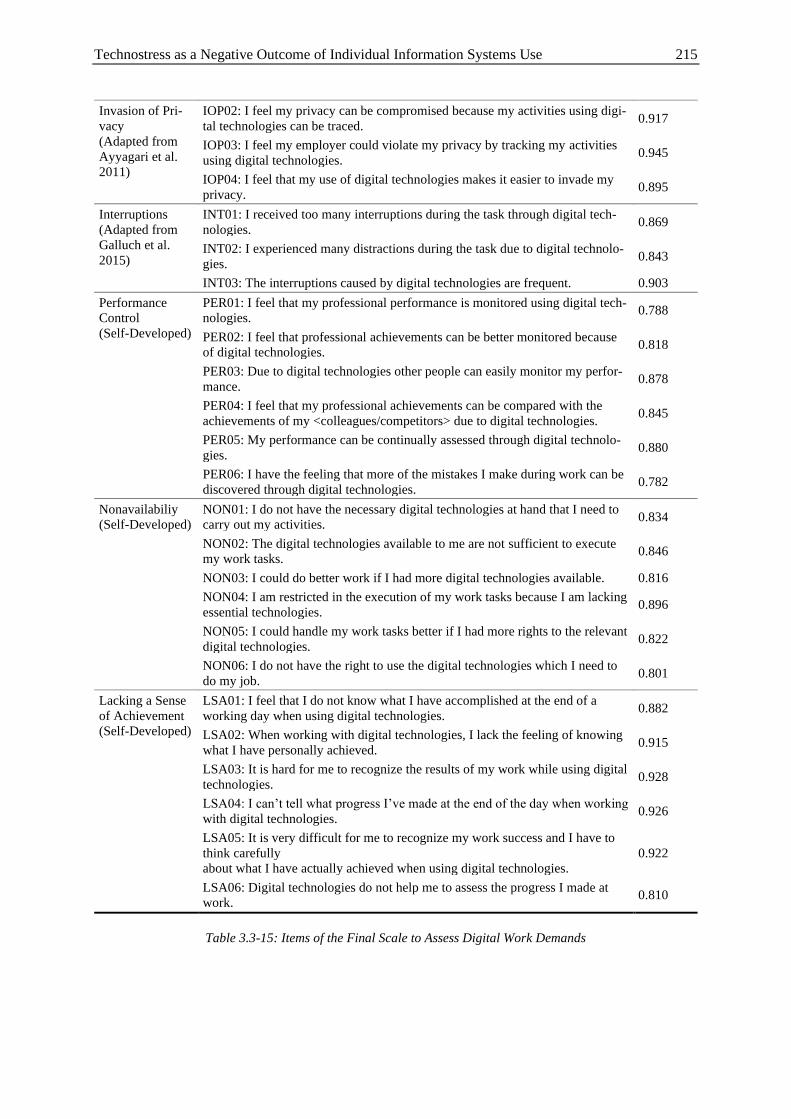
Technostress as a Negative Outcome of Individual Information Systems Use 215
Invasion of Pri-
vacy
(Adapted from
Ayyagari et al.
2011)
IOP02: I feel my privacy can be compromised because my activities using digi-
tal technologies can be traced. 0.917
IOP03: I feel my employer could violate my privacy by tracking my activities
using digital technologies. 0.945
IOP04: I feel that my use of digital technologies makes it easier to invade my
privacy. 0.895
Interruptions
(Adapted from
Galluch et al.
2015)
INT01: I received too many interruptions during the task through digital tech-
nologies. 0.869
INT02: I experienced many distractions during the task due to digital technolo-
gies. 0.843
INT03: The interruptions caused by digital technologies are frequent. 0.903
Performance
Control
(Self-Developed)
PER01: I feel that my professional performance is monitored using digital tech-
nologies. 0.788
PER02: I feel that professional achievements can be better monitored because
of digital technologies. 0.818
PER03: Due to digital technologies other people can easily monitor my perfor-
mance. 0.878
PER04: I feel that my professional achievements can be compared with the
achievements of my <colleagues/competitors> due to digital technologies. 0.845
PER05: My performance can be continually assessed through digital technolo-
gies. 0.880
PER06: I have the feeling that more of the mistakes I make during work can be
discovered through digital technologies. 0.782
Nonavailabiliy
(Self-Developed)
NON01: I do not have the necessary digital technologies at hand that I need to
carry out my activities. 0.834
NON02: The digital technologies available to me are not sufficient to execute
my work tasks. 0.846
NON03: I could do better work if I had more digital technologies available. 0.816
NON04: I am restricted in the execution of my work tasks because I am lacking
essential technologies. 0.896
NON05: I could handle my work tasks better if I had more rights to the relevant
digital technologies. 0.822
NON06: I do not have the right to use the digital technologies which I need to
do my job. 0.801
Lacking a Sense
of Achievement
(Self-Developed)
LSA01: I feel that I do not know what I have accomplished at the end of a
working day when using digital technologies. 0.882
LSA02: When working with digital technologies, I lack the feeling of knowing
what I have personally achieved. 0.915
LSA03: It is hard for me to recognize the results of my work while using digital
technologies. 0.928
LSA04: I can’t tell what progress I’ve made at the end of the day when working
with digital technologies. 0.926
LSA05: It is very difficult for me to recognize my work success and I have to
think carefully
about what I have actually achieved when using digital technologies.
0.922
LSA06: Digital technologies do not help me to assess the progress I made at
work. 0.810
Table 3.3-15: Items of the Final Scale to Assess Digital Work Demands
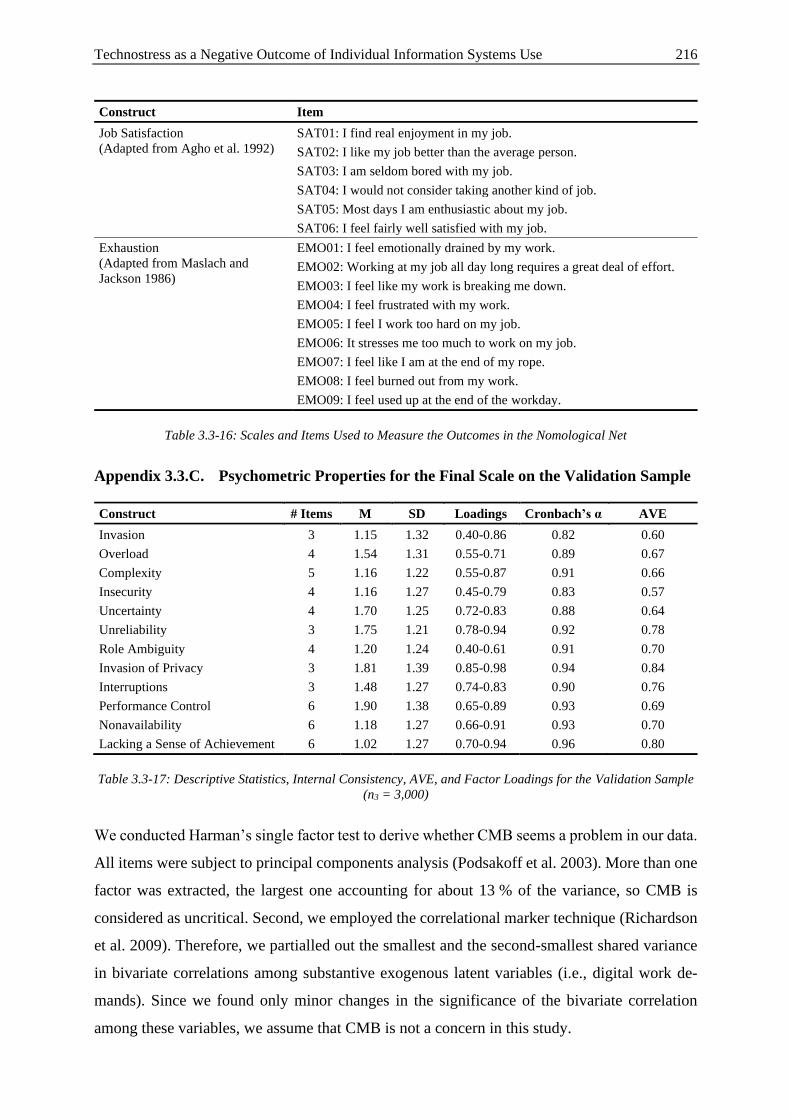
Technostress as a Negative Outcome of Individual Information Systems Use 216
Construct Item
Job Satisfaction
(Adapted from Agho et al. 1992)
SAT01: I find real enjoyment in my job.
SAT02: I like my job better than the average person.
SAT03: I am seldom bored with my job.
SAT04: I would not consider taking another kind of job.
SAT05: Most days I am enthusiastic about my job.
SAT06: I feel fairly well satisfied with my job.
Exhaustion
(Adapted from Maslach and
Jackson 1986)
EMO01: I feel emotionally drained by my work.
EMO02: Working at my job all day long requires a great deal of effort.
EMO03: I feel like my work is breaking me down.
EMO04: I feel frustrated with my work.
EMO05: I feel I work too hard on my job.
EMO06: It stresses me too much to work on my job.
EMO07: I feel like I am at the end of my rope.
EMO08: I feel burned out from my work.
EMO09: I feel used up at the end of the workday.
Table 3.3-16: Scales and Items Used to Measure the Outcomes in the Nomological Net
Appendix 3.3.C. Psychometric Properties for the Final Scale on the Validation Sample
Construct # Items M SD Loadings Cronbach’s α AVE
Invasion 3 1.15 1.32 0.40-0.86 0.82 0.60
Overload 4 1.54 1.31 0.55-0.71 0.89 0.67
Complexity 5 1.16 1.22 0.55-0.87 0.91 0.66
Insecurity 4 1.16 1.27 0.45-0.79 0.83 0.57
Uncertainty 4 1.70 1.25 0.72-0.83 0.88 0.64
Unreliability 3 1.75 1.21 0.78-0.94 0.92 0.78
Role Ambiguity 4 1.20 1.24 0.40-0.61 0.91 0.70
Invasion of Privacy 3 1.81 1.39 0.85-0.98 0.94 0.84
Interruptions 3 1.48 1.27 0.74-0.83 0.90 0.76
Performance Control 6 1.90 1.38 0.65-0.89 0.93 0.69
Nonavailability 6 1.18 1.27 0.66-0.91 0.93 0.70
Lacking a Sense of Achievement 6 1.02 1.27 0.70-0.94 0.96 0.80
Table 3.3-17: Descriptive Statistics, Internal Consistency, AVE, and Factor Loadings for the Validation Sample
(n3 = 3,000)
We conducted Harman’s single factor test to derive whether CMB seems a problem in our data.
All items were subject to principal components analysis (Podsakoff et al. 2003). More than one
factor was extracted, the largest one accounting for about 13 % of the variance, so CMB is
considered as uncritical. Second, we employed the correlational marker technique (Richardson
et al. 2009). Therefore, we partialled out the smallest and the second-smallest shared variance
in bivariate correlations among substantive exogenous latent variables (i.e., digital work de-
mands). Since we found only minor changes in the significance of the bivariate correlation
among these variables, we assume that CMB is not a concern in this study.
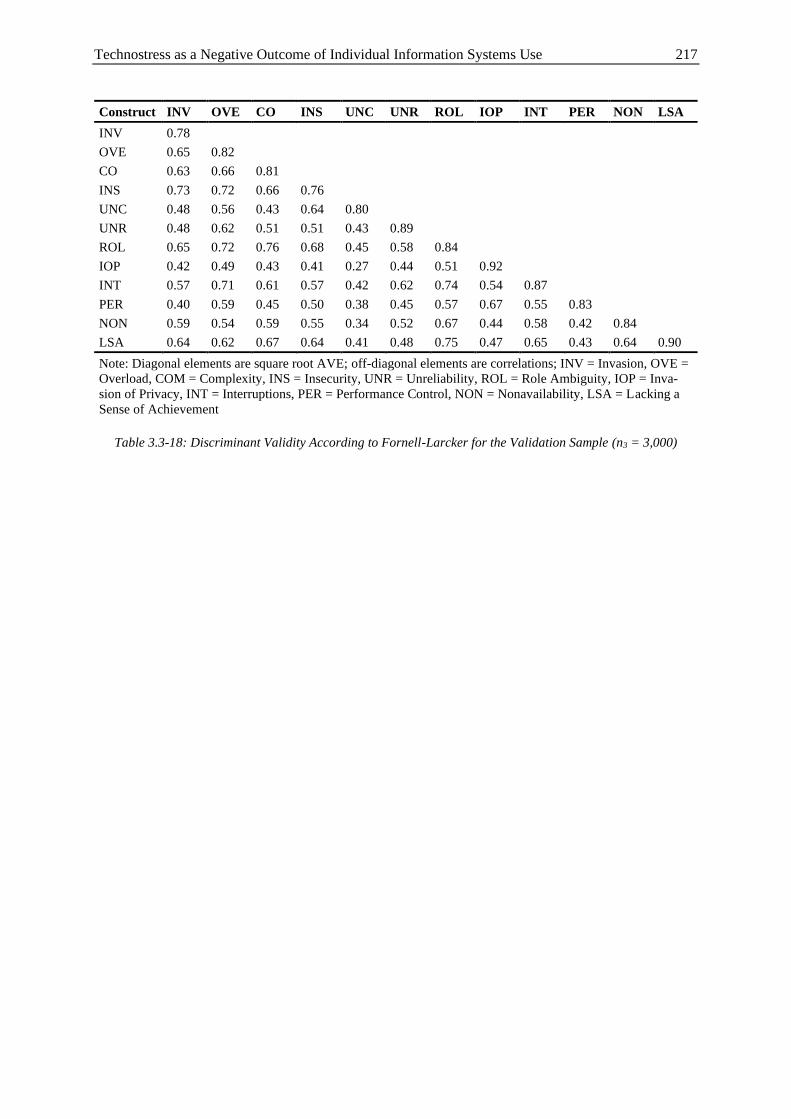
Technostress as a Negative Outcome of Individual Information Systems Use 217
Construct INV OVE CO INS UNC UNR ROL IOP INT PER NON LSA
INV 0.78
OVE 0.65 0.82
CO 0.63 0.66 0.81
INS 0.73 0.72 0.66 0.76
UNC 0.48 0.56 0.43 0.64 0.80
UNR 0.48 0.62 0.51 0.51 0.43 0.89
ROL 0.65 0.72 0.76 0.68 0.45 0.58 0.84
IOP 0.42 0.49 0.43 0.41 0.27 0.44 0.51 0.92
INT 0.57 0.71 0.61 0.57 0.42 0.62 0.74 0.54 0.87
PER 0.40 0.59 0.45 0.50 0.38 0.45 0.57 0.67 0.55 0.83
NON 0.59 0.54 0.59 0.55 0.34 0.52 0.67 0.44 0.58 0.42 0.84
LSA 0.64 0.62 0.67 0.64 0.41 0.48 0.75 0.47 0.65 0.43 0.64 0.90
Note: Diagonal elements are square root AVE; off-diagonal elements are correlations; INV = Invasion, OVE =
Overload, COM = Complexity, INS = Insecurity, UNR = Unreliability, ROL = Role Ambiguity, IOP = Inva-
sion of Privacy, INT = Interruptions, PER = Performance Control, NON = Nonavailability, LSA = Lacking a
Sense of Achievement
Table 3.3-18: Discriminant Validity According to Fornell-Larcker for the Validation Sample (n3 = 3,000)
Organizational and Social Mechanisms as Technostress Inhibitors 218
4 Organizational and Social Mechanisms as Technostress
Inhibitors
4.1 Technostress and Digitalization: Evidence from German Employees
Abstract
Technostress at work is well established. Nevertheless, the influence of the degree of workplace
digitalization on technostress has not yet been investigated extensively. Based on theoretical
models on technostress and a large-scale survey (n = 2,640), this study analyzes the relationship
between the degree of workplace digitalization and technostress, including the moderating ef-
fect of the three inhibitors literacy facilitation, involvement facilitation, and technical support
provision. The results reveal that a higher degree of workplace digitalization is positively asso-
ciated with technostress and the three inhibitors. However, the effect on technostress varies
when considering single technostress creators instead of technostress in general. For the inhib-
itors, the effects are also multifaceted. While literacy facilitation and technical support provi-
sion negatively affect technostress, literacy facilitation also decreases the effect of the degree
of workplace digitalization on technostress. Involvement facilitation is positively associated
with technostress. The results are important for organizations willing to take advantage of the
benefits of digital technologies at the workplace and at the same time prevent them from causing
adverse effects such as technostress for their employees.
Keywords: Technostress, Technostress Creators, Technostress Inhibitors, Digitalization, Sur-
vey Research
Authors: Julia Lanzl (M. Sc.), Prof. Dr. Henner Gimpel, Niclas Nüske (M. Sc. with honors),
Prof. Monideepa Tarafdar, Ph. D.
Status: Working paper under review for publication.
Organizational and Social Mechanisms as Technostress Inhibitors 219
4.1.1 Introduction
Digitalization has changed the business world. Organizations keep on digitalizing their busi-
nesses or even their business models in order to achieve competitive advantages like increases
in operational efficiency, performance, productivity, and sales as well as savings in cost and
time, and innovations in value creation (Fitzgerald et al. 2013; Neumeier et al. 2017; Vial 2019).
Additionally, the COVID-19 pandemic and the associated social distancing measures have fur-
ther accelerated workplace digitalization since many employees were forced to work from home
using digital technologies. This continuing digitalization of the business world also has a major
impact on the employees facing the proliferation of digital technologies at their workplace and
the consequent changes of, for example, communication, working routines, and organizational
structures (Colbert et al. 2016). Today, employees gain high flexibility in collaborating world-
wide and at any time due to mobile internet, ubiquitous digital devices, and access to a vast
amount of information on their tasks. However, they also are confronted with challenges like
work overload due to high amounts of incoming emails and a blurring of work and non-work
life (Barley et al. 2011; Colbert et al. 2016; Stanko and Beckman 2014; van Knippenberg et al.
2015).
The imbalance between the demands due to digital technologies and an individual’s resources
to meet these demands leads to stress. In information systems (IS) literature, this increased
stress for employees due to digital technologies is known as technostress (Tarafdar et al. 2019).
Technostress was described by Brod (1984, p. 16) as an individual’s “inability to cope with new
computer technologies in a healthy manner.” Research on technostress has identified different
technostress creators (Adam et al. 2017; Ayyagari et al. 2011; Ragu-Nathan et al. 2008;
Tarafdar et al. 2007): techno-invasion, techno-overload, techno-complexity, techno-uncer-
tainty, techno-insecurity, and techno-unreliability. Further, many studies have investigated the
impact of technostress on different outcomes in the business context (Tarafdar et al. 2019).
Examples are job‐related adverse outcomes such as reduced job satisfaction and organizational
commitment (Gimpel et al. 2018; Ragu-Nathan et al. 2008; Tarafdar et al. 2007), IS-use related
adverse outcomes such as lower end-user satisfaction (Tarafdar et al. 2010; Tarafdar et al. 2015)
and non-adherence to IS use requirements (D’Arcy et al. 2014) as well as well‐being related
adverse outcomes such as exhaustion and burnout (Day et al. 2012; Galluch et al. 2015; Maier
et al. 2015b).
Prior literature has studied organizational measures to inhibit technostress, especially literacy
facilitation, involvement facilitation, and technical support provision (Ragu-Nathan et al.
Organizational and Social Mechanisms as Technostress Inhibitors 220
2008). Concerning the antecedents of technostress, Ayyagari et al. (2011) and Becker et al.
(2020) find that technology usage and technology characteristics influence technostress. In sev-
eral studies, selected digital technologies, including smartphones (Lee et al. 2014) and enter-
prise resource planning (ERP) systems (Maier et al. 2015a), have been investigated for their
effects on technostress. However, to date, we lack understanding of the interplay of the degree
of workplace digitalization and technostress.
The degree of workplace digitalization is the extent to which a workplace is equipped with
digital technologies. For employees, the degree of workplace digitalization is primarily deter-
mined by their employers, who decide on IT strategies and procurement, deployment, and use
of digital technologies. High levels of digitalization shall foster the positive effects of digitali-
zation and support the efficiency and effectiveness of work (Colbert et al. 2016). However,
increasing degrees of digitalization might lead to rising levels of technostress, which is associ-
ated with adverse effects on employees’ productivity, satisfaction, well-being, and health. Nev-
ertheless, since not digitalizing work is hardly an option for companies due to the constant
competition with other organizations, we need to understand the exact relationship between the
degree of workplace digitalization, possible inhibiting measures, and different technostress fac-
tors. Thus, we formulate the following two research questions:
RQ1: How is the degree of workplace digitalization linked to technostress?
RQ2: How do the technostress inhibitors literacy facilitation, involvement facilitation,
and technical support provision moderate the relationship of the degree of workplace
digitalization and technostress?
To answer these research questions, we build research models to assess the effect of the degree
of workplace digitalization on technostress and the effects of three different inhibitors (literacy
facilitation, involvement facilitation, and technical support provision) on this relationship. We
chose these three inhibitors as they are the most established in prior technostress literature
(e.g., Ragu-Nathan et al. 2008; Tarafdar et al. 2011). We test the models empirically with sur-
vey data of 2,640 German employees. We find that a higher degree of workplace digitalization
increases technostress and is associated with higher inhibitors, but it shows different effects on
individual technostress creators. The effects also differ between the three inhibitors. Literacy
facilitation and technical support provision negatively affect technostress. Further, literacy fa-
cilitation moderates the effect of the degree of workplace digitalization on technostress. Sur-
prisingly, involvement facilitation increases technostress. Our results give evidence for the fact
Organizational and Social Mechanisms as Technostress Inhibitors 221
that high degrees of workplace digitalization cause high levels of technostress. Further, we can
draw recommendations regarding possible measures to inhibit this effect.
The remainder of this paper is structured as follows: Section 4.1.2 sets up the theoretical foun-
dation on the digitalization of workplaces and technostress. Section 4.1.3 introduces our re-
search models and hypotheses. Section 4.1.4 describes the design and operationalization of the
survey as well as its results. Section 4.1.5 discusses the findings. Section 4.1.6 illustrates the
theoretical contributions and practical implications for individuals, organizations, and IT de-
signers and provides an outlook for future research.
4.1.2 Theoretical Background
4.1.2.1 Digitalization of Workplaces
Employees today face major changes and ever more digital technologies at their workplaces
through organizations’ ongoing digitalization (Colbert et al. 2016). Digital technologies are all
“combinations of information, computing, communication, and connectivity technologies”
(Bharadwaj et al. 2013 according to Vial 2019, p. 118). There is no particular research stream
on workplace digitalization in IS literature (Köffer 2015), and different definitions exist in prac-
tice. According to Williams and Schubert (2018, p. 480), “the digital workplace is an integrated
platform that provides all the tools and services to enable employees to effectively undertake
their work, both alone and with others, regardless of location and is strategically coordinated
and managed through digital workplace designs that are agile and capable of being adapted to
meet future organizational requirements and technologies.”
The degree of digitalization of workplaces differs between jobs, organizations, and different
sectors (Fitzgerald et al. 2013; Reimann et al. 2020). For example, many jobs are highly digital
in the information and communication sector, with employees using laptops, smartphones, and
various communication and collaboration applications. In other sectors, such as healthcare,
many activities are still person-centered and non-digital, with employees using only a few dif-
ferent digital technologies.
Digitalization of workplaces brings chances for individuals (e.g., automation, enhanced deci-
sion making, access to information, increased performance, collaboration, flexibility) (Barley
et al. 2011; Colbert et al. 2016; Neumeier et al. 2017; van Knippenberg et al. 2015). At the same
time, working at a digital workplace requires employees to bring or build a specific set of skills
like analytical skills, leadership skills, self-awareness, and digital fluency (Colbert et al. 2016;
Hess et al. 2016; Vial 2019). Further, Colbert et al. (2016) name challenging effects on
Organizational and Social Mechanisms as Technostress Inhibitors 222
individuals like excessive amounts of emails that have to be answered, the blurring of bounda-
ries between work and private life, and decreased productivity due to constant interruptions via
digital technologies.
4.1.2.2 Technostress
In IS literature, a whole research stream addresses the consequence of workplace digitalization
for individuals, namely technostress (i.e., stress caused by the use of digital technologies)
(e.g., Adam et al. 2017; Lee et al. 2014; Maier et al. 2015a; Ragu-Nathan et al. 2008; Riedl
2013; Tarafdar et al. 2011; Tarafdar et al. 2019). Tarafdar et al. (2015, p. 103) define tech-
nostress as “stress that users experience as a result of their use of IS in the organizational con-
text.” Recent literature on technostress can be categorized by three questions: Which tech-
nostress creators exist? Which consequences are caused by technostress? Which factors inhibit
technostress?
Concerning technostress creators, research has identified six relevant factors: techno-invasion,
techno-overload, techno-complexity, techno-uncertainty, techno-insecurity (Ragu-Nathan et al.
2008; Tarafdar et al. 2007), and techno-unreliability (Adam et al. 2017; Ayyagari et al. 2011).
They are defined in Appendix 4.1.A. The technostress creators refer to the use of digital tech-
nologies. Tarafdar et al. (2019) see the “technology environment conditions” as an antecedent
of technostress but also show that the stream of “future of work” is understudied in technostress
literature. Concerning the relationship between the degree of workplace digitalization and tech-
nostress, several studies have been conducted to investigate the effect of digital technologies
on technostress (e.g., Ayyagari et al. 2011; Lee et al. 2014; Maier et al. 2015a). However, there
is even less evidence when considering the overall degree of workplace digitalization instead
of single technologies, groups of technologies, or specific characteristics and features of tech-
nologies, and we do not find prior research investigating the relationship of the whole portfolio
of digital technologies with technostress.
Concerning the consequences of technostress, many different studies have already been con-
ducted. On the side of the organizational outcomes, reduced end-user satisfaction has been
found, followed by reduced job satisfaction, performance, productivity, and organizational
commitment (Ragu-Nathan et al. 2008; Srivastava et al. 2015; Tarafdar et al. 2007; Tu et al.
2005). Further, technostress harms individuals’ well-being and is associated with increased ex-
haustion and burnout (Day et al. 2012; Galluch et al. 2015).
The adverse effects of technostress can be counteracted by establishing appropriate technostress
inhibitors. Concerning these factors, research primarily concentrates on three inhibitors:
Organizational and Social Mechanisms as Technostress Inhibitors 223
literacy facilitation, involvement facilitation, and technical support provision (Ragu-Nathan et
al. 2008). Literacy facilitation refers to measures taken by the employer to promote the sharing
of knowledge on the use of digital technologies within the organization. Involvement facilita-
tion refers to the employer’s involvement of employees in the process of introducing new digital
technologies. Technical support by the employer (e.g., a helpdesk) assists employees in solving
problems related using digital technologies. See Appendix 4.1.A for definitions of these three
inhibitors. Ragu-Nathan et al. (2008) identify literacy facilitation, involvement facilitation, and
technical support provision as fact that positively affect job satisfaction, organization, and con-
tinuance commitment. Hence, these inhibitors counteract some effects of technostress.
All studies contribute to acquiring knowledge about technostress, its antecedents, inhibitors,
and possible outcomes. However, no research endeavor has yet put a holistic view on workplace
digitalization and its effect on technostress. Nevertheless, we believe that such a view is re-
quired for being able to mitigate technostress. Thus, we aim to close this gap and investigate
the effect of the degree of workplace digitalization (i.e., the number of digital technologies at a
workplace) on technostress. We also aim to understand the inhibiting effects of organizational
mechanisms like literacy facilitation, involvement facilitation, and technical support provision.
4.1.3 Hypotheses Linking the Degree of Workplace Digitalization, Technostress Creators,
and Technostress Inhibitors
To answer our research questions, we build three models to investigate the relationship of the
focused constructs. Our models’ central paradigm is that the degree of workplace digitalization
influences the level of technostress and that certain inhibiting factors can counteract this effect.
There is little evidence on the effect of technology usage on technostress. Ayyagari et al. (2011)
include “technology usage” as a control variable for technostress. Further, some studies analyze
different single technologies and their effect on technostress. Lee et al. (2014) show that com-
pulsive smartphone usage increases technostress. Maier et al. (2015a) find that different char-
acteristics of ERP systems like usefulness and reliability can affect technostress. However, there
is only little evidence on the effect of the degree to which digital technologies are used. Stich
et al. (2019) investigate the extent to which an individual uses email on technostress. Further,
Galluch et al. (2015) find that a higher quantitative demand (i.e., the number of interruptions
caused by digital technologies) increases the perceived stress.
According to Lazarus and Folkman (1984), stress occurs when environmental demands exceed
an individual’s resources to deal with the demands. At the digital workplace, the environmental
Organizational and Social Mechanisms as Technostress Inhibitors 224
demands are the technology environment conditions (Tarafdar et al. 2019). Thus, the different
digital technologies an individual works with.
The ongoing digitalization of workplaces and the corresponding increase in the number of dig-
ital technologies at the workplace leads to a required increase in the individuals’ skills and
resources to deal with technologies. In many cases, this may happen due to increased media
competence of individuals in general, rising experience with the digital technologies on the job,
selection by the employer when recruiting employees for the respective workplace, or self-
selection by the individual when applying for suitable jobs. However, as digitalization pro-
gresses rapidly, the change in resources does not always meet the changed technology environ-
ment conditions. Thus, we believe that a higher degree of workplace digitalization is associated
with higher levels of technostress creators and hypothesize:
H1: A higher degree of workplace digitalization is associated with higher technostress.
To detail the understanding of the relationship of the degree of workplace digitalization with
the second-order construct technostress, we also aim to analyze the effect on the underlying
first-order constructs of technostress: techno-invasion, techno-overload, techno-complexity,
techno-insecurity, techno-uncertainty, and techno-unreliability. As we hypothesize that the
combined construct is positively affected by a higher degree of workplace digitalization, we
consider the same effect for the detailed technostress creators. Thus, we propose the hypotheses
H2a to H2f as follows.
H2a: A higher degree of workplace digitalization is associated with higher
techno-invasion.
H2b: A higher degree of workplace digitalization is associated with higher
techno-overload.
H2c: A higher degree of workplace digitalization is associated with higher
techno-complexity.
H2d: A higher degree of workplace digitalization is associated with higher
techno-insecurity.
H2e: A higher degree of workplace digitalization is associated with higher
techno-uncertainty.
H2f: A higher degree of workplace digitalization is associated with higher
techno-unreliability.
Organizational and Social Mechanisms as Technostress Inhibitors 225
Technostress inhibitors are possible measures to counteract the emergence of technostress cre-
ators. Ragu-Nathan et al. (2008) analyzed the effect of all three inhibitors as a second-order
construct on the consequences of technostress. They found that the inhibitors are associated
with increased job satisfaction, organizational commitment, and continuance commitment. In
the same direction, Fuglseth and Sørebø (2014) found increased satisfaction with ICT use as-
sociated with the inhibitors. Additionally, Day et al. (2012) found that technical support provi-
sion moderated the effect between technostress creators and its consequences. Higher technical
support provision decreased the effect of ICT hassles on strain. Further studies analyzed the
direct effect on the arising of technostress rather than on its consequences. Tarafdar et al. (2010)
found a decreasing effect of involvement facilitation on technostress creators. In line with that,
Tarafdar et al. (2015) found technostress inhibitors to be associated with lower levels of tech-
nostress creators.
However, none of these research contributions has investigated to what extent the degree of
workplace digitalization is associated with technostress inhibitors. As Vial (2019) states, digital
transformation of workplaces requires structural changes such as new employee skills for the
digital work – which refers to literacy facilitation. Further, according to Vial’s (2019) extensive
literature review on digital transformation, involvement facilitation can be one mechanism to
overcome employees’ resistance to digital transformation. For technical support provision, we
believe that in organizations with higher digitalization, key processes depend on digital tech-
nologies, making it essential to have adequate technical support to sustain the ability to work at
any time. In line with these notions, we suggest that organizations take such measures when the
degree of workplace digitalization is high. Thus, we hypothesize:
H3a: A higher degree of workplace digitalization is associated with higher literacy
facilitation.
H3b: A higher degree of workplace digitalization is associated with higher involvement
facilitation.
H3c: A higher degree of workplace digitalization is associated with higher technical
support provision.
Literacy facilitation is an organizational measure to help employees enhance their personal re-
sources and skills to deal with digital technologies. That is why it helps individuals to better
deal with the increased demands of a higher number of digital technologies at the workplace.
Thus, we hypothesize that literacy facilitation helps to decrease the increasing effect of digital-
ization on technostress creators.
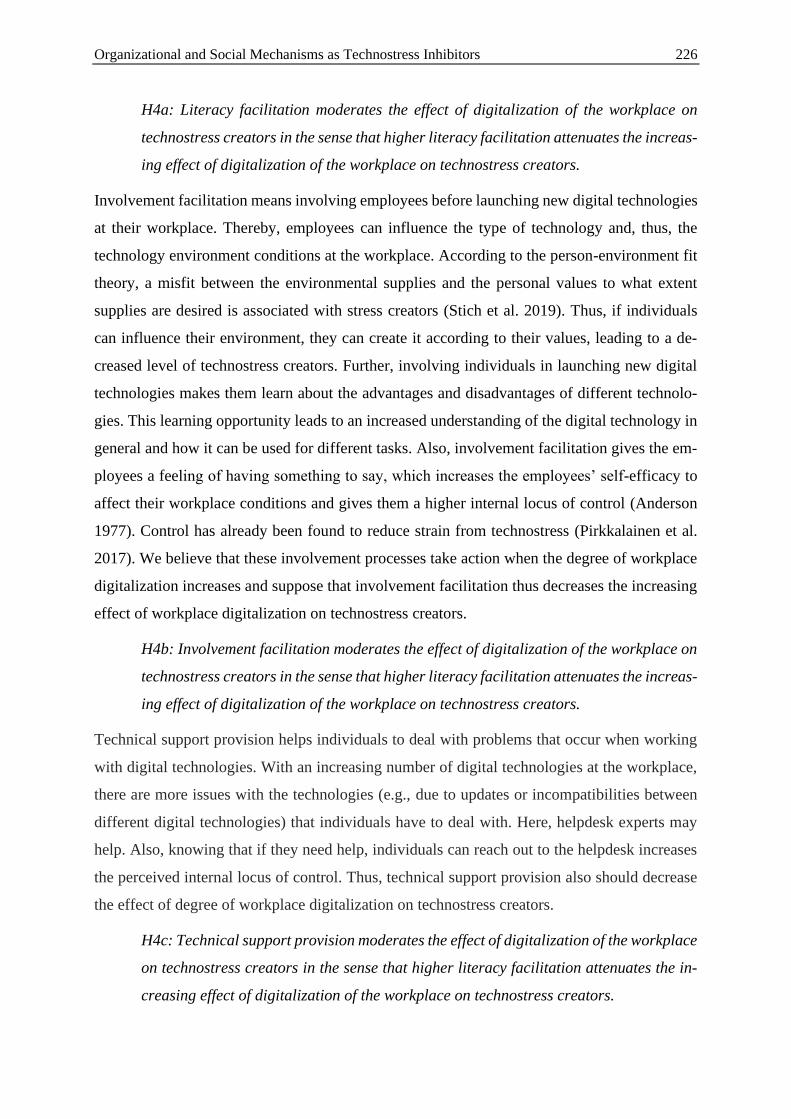
Organizational and Social Mechanisms as Technostress Inhibitors 226
H4a: Literacy facilitation moderates the effect of digitalization of the workplace on
technostress creators in the sense that higher literacy facilitation attenuates the increas-
ing effect of digitalization of the workplace on technostress creators.
Involvement facilitation means involving employees before launching new digital technologies
at their workplace. Thereby, employees can influence the type of technology and, thus, the
technology environment conditions at the workplace. According to the person-environment fit
theory, a misfit between the environmental supplies and the personal values to what extent
supplies are desired is associated with stress creators (Stich et al. 2019). Thus, if individuals
can influence their environment, they can create it according to their values, leading to a de-
creased level of technostress creators. Further, involving individuals in launching new digital
technologies makes them learn about the advantages and disadvantages of different technolo-
gies. This learning opportunity leads to an increased understanding of the digital technology in
general and how it can be used for different tasks. Also, involvement facilitation gives the em-
ployees a feeling of having something to say, which increases the employees’ self-efficacy to
affect their workplace conditions and gives them a higher internal locus of control (Anderson
1977). Control has already been found to reduce strain from technostress (Pirkkalainen et al.
2017). We believe that these involvement processes take action when the degree of workplace
digitalization increases and suppose that involvement facilitation thus decreases the increasing
effect of workplace digitalization on technostress creators.
H4b: Involvement facilitation moderates the effect of digitalization of the workplace on
technostress creators in the sense that higher literacy facilitation attenuates the increas-
ing effect of digitalization of the workplace on technostress creators.
Technical support provision helps individuals to deal with problems that occur when working
with digital technologies. With an increasing number of digital technologies at the workplace,
there are more issues with the technologies (e.g., due to updates or incompatibilities between
different digital technologies) that individuals have to deal with. Here, helpdesk experts may
help. Also, knowing that if they need help, individuals can reach out to the helpdesk increases
the perceived internal locus of control. Thus, technical support provision also should decrease
the effect of degree of workplace digitalization on technostress creators.
H4c: Technical support provision moderates the effect of digitalization of the workplace
on technostress creators in the sense that higher literacy facilitation attenuates the in-
creasing effect of digitalization of the workplace on technostress creators.
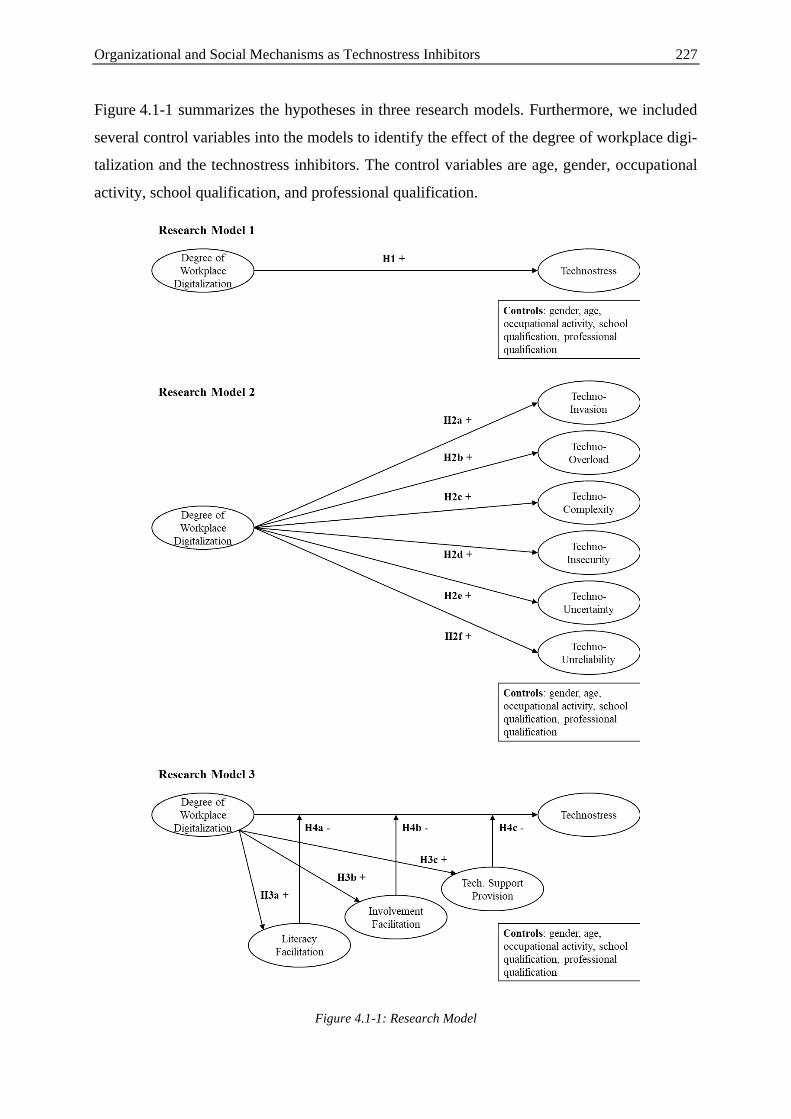
Organizational and Social Mechanisms as Technostress Inhibitors 227
Figure 4.1-1 summarizes the hypotheses in three research models. Furthermore, we included
several control variables into the models to identify the effect of the degree of workplace digi-
talization and the technostress inhibitors. The control variables are age, gender, occupational
activity, school qualification, and professional qualification.
Figure 4.1-1: Research Model
Organizational and Social Mechanisms as Technostress Inhibitors 228
4.1.4 Research Methodology, Analysis, and Results
We designed an online survey to measure all constructs from the research model and control
variables to empirically test the hypotheses.
4.1.4.1 Questionnaire Development
The first part of the survey was to measure respondents’ workplace equipment with digital
technologies, that is, the degree of workplace digitalization. For this purpose, participants were
shown a list of 40 technologies, like smartphones, laptops, or text, spreadsheet, and presentation
software. The list of technologies was generated based on the ACM Computing Classification
System, the job information of the German Federal Employment Agency, and several job ad-
vertisements. The development process is described in detail in (disguised for review). The
complete list of technologies is provided in Appendix 4.1.B. The survey participants were asked
to select all technologies they use actively or passively in their daily work.
Following this section, the survey dealt with the six dimensions of technostress (invasion, over-
load, complexity, insecurity, uncertainty, and unreliability) and its inhibiting factors (literacy
facilitation, involvement facilitation, and technical support provision). Therefore, we used the
item scales from Ayyagari et al. (2011) for techno-unreliability and Ragu-Nathan et al. (2008)
for all other constructs. Following Tarafdar et al. (2007) and Ragu-Nathan et al. (2008), we
model technostress as a reflective second-order construct comprised of the individual dimen-
sions of technostress.
Furthermore, we asked the participants for their gender (female, male, or other), year of birth,
German federal state, industry, type of occupational activity according to the German Federal
Employment Agency as well as the school qualification and professional qualification accord-
ing to the German Federal Statistical Office.
As ex-ante precautions against common method bias (CMB), we assured the respondents of
anonymity of their answers and stated that there were no right or wrong answers to the questions
(Podsakoff et al. 2003). We translated all items into German for the questionnaire and measured
them on a five-point Likert scale (“fully disagree,” “rather disagree,” “undecided,” “rather
agree,” “fully agree”). Appendix 4.1.C provides an overview of all items.
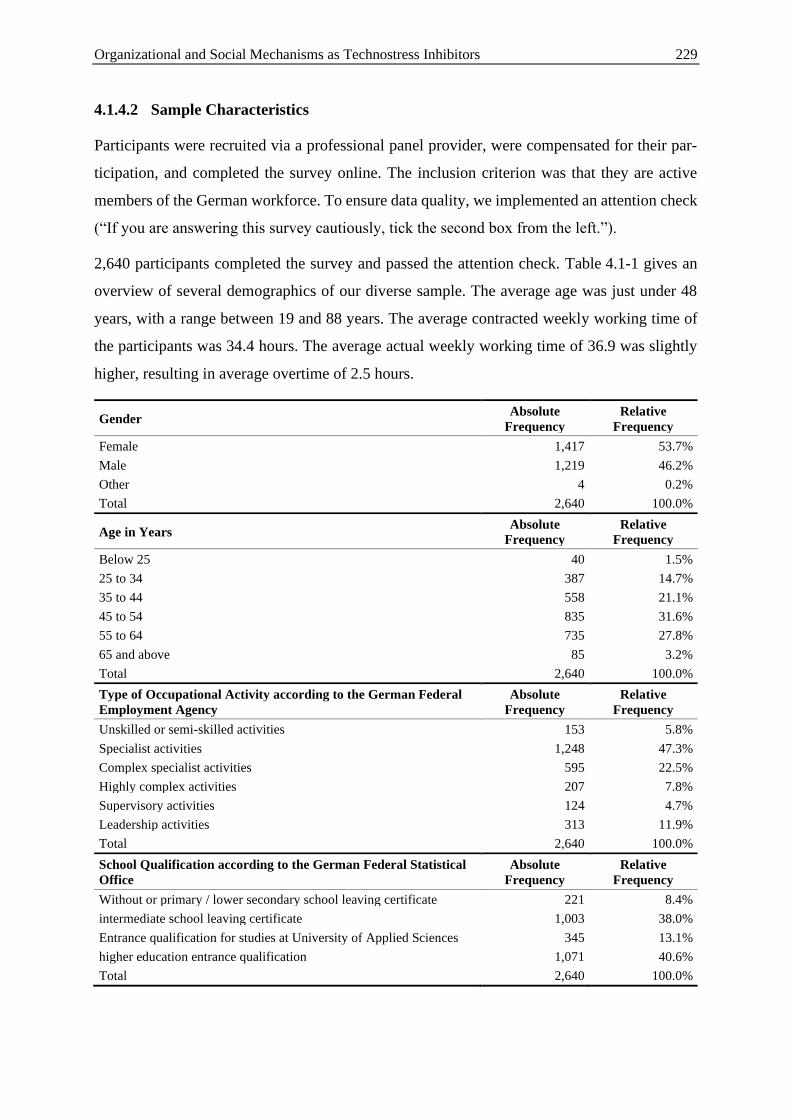
Organizational and Social Mechanisms as Technostress Inhibitors 229
4.1.4.2 Sample Characteristics
Participants were recruited via a professional panel provider, were compensated for their par-
ticipation, and completed the survey online. The inclusion criterion was that they are active
members of the German workforce. To ensure data quality, we implemented an attention check
(“If you are answering this survey cautiously, tick the second box from the left.”).
2,640 participants completed the survey and passed the attention check. Table 4.1-1 gives an
overview of several demographics of our diverse sample. The average age was just under 48
years, with a range between 19 and 88 years. The average contracted weekly working time of
the participants was 34.4 hours. The average actual weekly working time of 36.9 was slightly
higher, resulting in average overtime of 2.5 hours.
Gender Absolute
Frequency
Relative
Frequency
Female 1,417 53.7%
Male 1,219 46.2%
Other 4 0.2%
Total 2,640 100.0%
Age in Years Absolute
Frequency
Relative
Frequency
Below 25 40 1.5%
25 to 34 387 14.7%
35 to 44 558 21.1%
45 to 54 835 31.6%
55 to 64 735 27.8%
65 and above 85 3.2%
Total 2,640 100.0%
Type of Occupational Activity according to the German Federal
Employment Agency
Absolute
Frequency
Relative
Frequency
Unskilled or semi-skilled activities 153 5.8%
Specialist activities 1,248 47.3%
Complex specialist activities 595 22.5%
Highly complex activities 207 7.8%
Supervisory activities 124 4.7%
Leadership activities 313 11.9%
Total 2,640 100.0%
School Qualification according to the German Federal Statistical
Office
Absolute
Frequency
Relative
Frequency
Without or primary / lower secondary school leaving certificate 221 8.4%
intermediate school leaving certificate 1,003 38.0%
Entrance qualification for studies at University of Applied Sciences 345 13.1%
higher education entrance qualification 1,071 40.6%
Total 2,640 100.0%
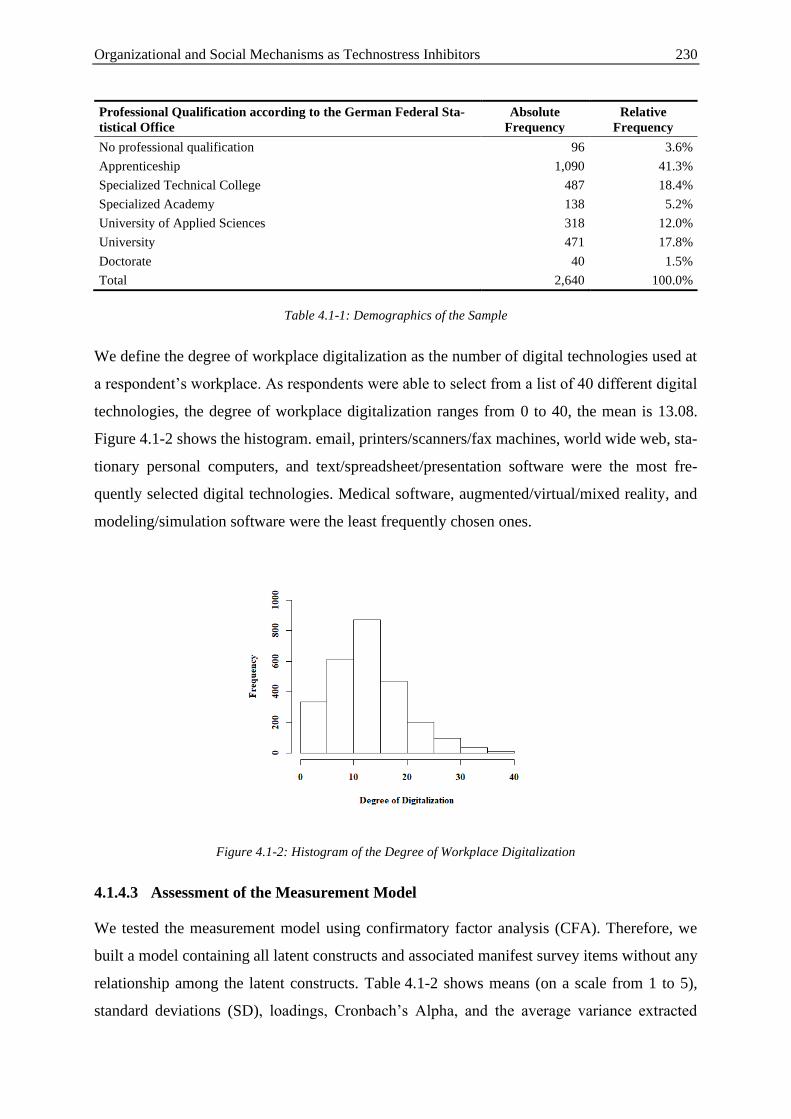
Organizational and Social Mechanisms as Technostress Inhibitors 230
Professional Qualification according to the German Federal Sta-
tistical Office
Absolute
Frequency
Relative
Frequency
No professional qualification 96 3.6%
Apprenticeship 1,090 41.3%
Specialized Technical College 487 18.4%
Specialized Academy 138 5.2%
University of Applied Sciences 318 12.0%
University 471 17.8%
Doctorate 40 1.5%
Total 2,640 100.0%
Table 4.1-1: Demographics of the Sample
We define the degree of workplace digitalization as the number of digital technologies used at
a respondent’s workplace. As respondents were able to select from a list of 40 different digital
technologies, the degree of workplace digitalization ranges from 0 to 40, the mean is 13.08.
Figure 4.1-2 shows the histogram. email, printers/scanners/fax machines, world wide web, sta-
tionary personal computers, and text/spreadsheet/presentation software were the most fre-
quently selected digital technologies. Medical software, augmented/virtual/mixed reality, and
modeling/simulation software were the least frequently chosen ones.
Figure 4.1-2: Histogram of the Degree of Workplace Digitalization
4.1.4.3 Assessment of the Measurement Model
We tested the measurement model using confirmatory factor analysis (CFA). Therefore, we
built a model containing all latent constructs and associated manifest survey items without any
relationship among the latent constructs. Table 4.1-2 shows means (on a scale from 1 to 5),
standard deviations (SD), loadings, Cronbach’s Alpha, and the average variance extracted
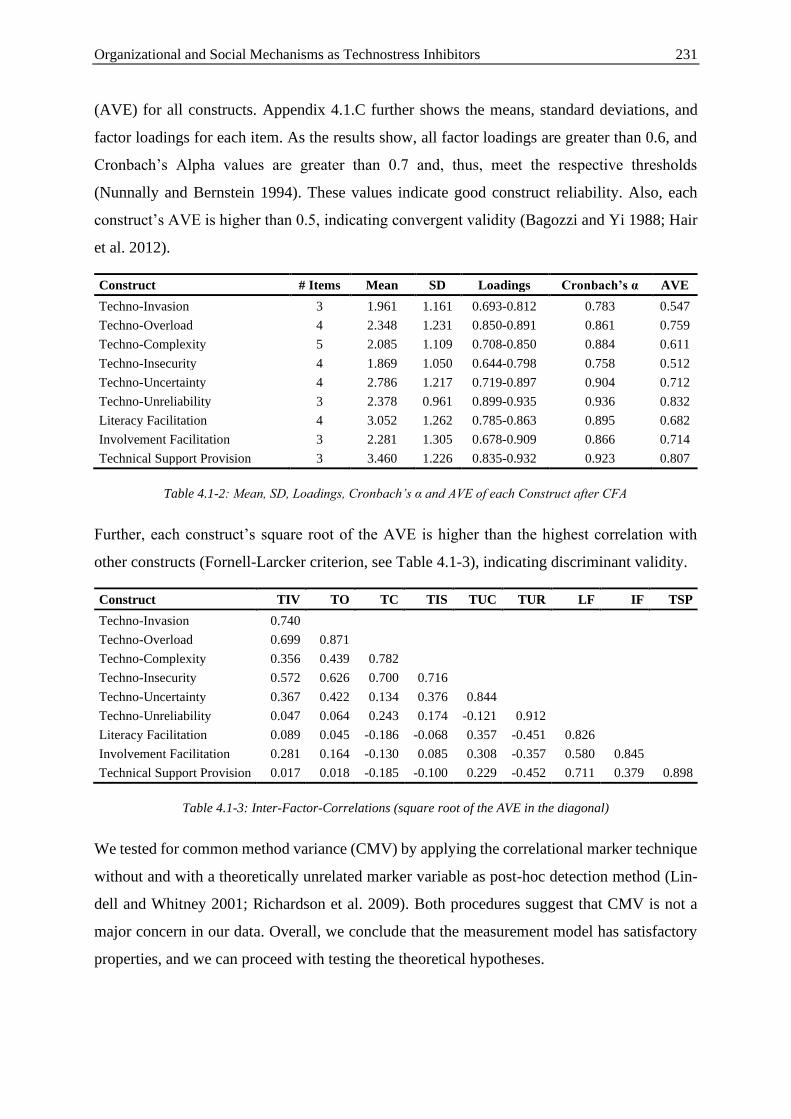
Organizational and Social Mechanisms as Technostress Inhibitors 231
(AVE) for all constructs. Appendix 4.1.C further shows the means, standard deviations, and
factor loadings for each item. As the results show, all factor loadings are greater than 0.6, and
Cronbach’s Alpha values are greater than 0.7 and, thus, meet the respective thresholds
(Nunnally and Bernstein 1994). These values indicate good construct reliability. Also, each
construct’s AVE is higher than 0.5, indicating convergent validity (Bagozzi and Yi 1988; Hair
et al. 2012).
Construct # Items Mean SD Loadings Cronbach’s α AVE
Techno-Invasion 3 1.961 1.161 0.693-0.812 0.783 0.547
Techno-Overload 4 2.348 1.231 0.850-0.891 0.861 0.759
Techno-Complexity 5 2.085 1.109 0.708-0.850 0.884 0.611
Techno-Insecurity 4 1.869 1.050 0.644-0.798 0.758 0.512
Techno-Uncertainty 4 2.786 1.217 0.719-0.897 0.904 0.712
Techno-Unreliability 3 2.378 0.961 0.899-0.935 0.936 0.832
Literacy Facilitation 4 3.052 1.262 0.785-0.863 0.895 0.682
Involvement Facilitation 3 2.281 1.305 0.678-0.909 0.866 0.714
Technical Support Provision 3 3.460 1.226 0.835-0.932 0.923 0.807
Table 4.1-2: Mean, SD, Loadings, Cronbach’s α and AVE of each Construct after CFA
Further, each construct’s square root of the AVE is higher than the highest correlation with
other constructs (Fornell-Larcker criterion, see Table 4.1-3), indicating discriminant validity.
Construct TIV TO TC TIS TUC TUR LF IF TSP
Techno-Invasion 0.740
Techno-Overload 0.699 0.871
Techno-Complexity 0.356 0.439 0.782
Techno-Insecurity 0.572 0.626 0.700 0.716
Techno-Uncertainty 0.367 0.422 0.134 0.376 0.844
Techno-Unreliability 0.047 0.064 0.243 0.174 -0.121 0.912
Literacy Facilitation 0.089 0.045 -0.186 -0.068 0.357 -0.451 0.826
Involvement Facilitation 0.281 0.164 -0.130 0.085 0.308 -0.357 0.580 0.845
Technical Support Provision 0.017 0.018 -0.185 -0.100 0.229 -0.452 0.711 0.379 0.898
Table 4.1-3: Inter-Factor-Correlations (square root of the AVE in the diagonal)
We tested for common method variance (CMV) by applying the correlational marker technique
without and with a theoretically unrelated marker variable as post-hoc detection method (Lin-
dell and Whitney 2001; Richardson et al. 2009). Both procedures suggest that CMV is not a
major concern in our data. Overall, we conclude that the measurement model has satisfactory
properties, and we can proceed with testing the theoretical hypotheses.
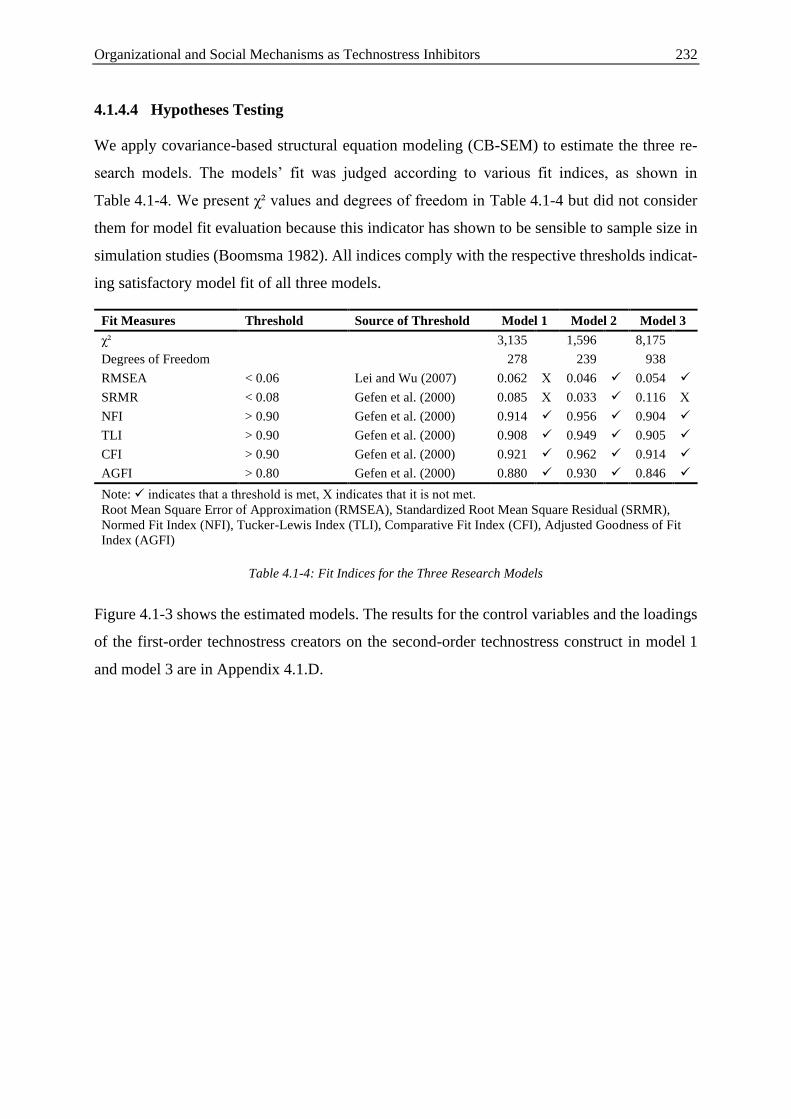
Organizational and Social Mechanisms as Technostress Inhibitors 232
4.1.4.4 Hypotheses Testing
We apply covariance-based structural equation modeling (CB-SEM) to estimate the three re-
search models. The models’ fit was judged according to various fit indices, as shown in
Table 4.1-4. We present χ² values and degrees of freedom in Table 4.1-4 but did not consider
them for model fit evaluation because this indicator has shown to be sensible to sample size in
simulation studies (Boomsma 1982). All indices comply with the respective thresholds indicat-
ing satisfactory model fit of all three models.
Fit Measures Threshold Source of Threshold Model 1 Model 2 Model 3
χ² 3,135 1,596 8,175
Degrees of Freedom 278 239 938
RMSEA < 0.06 Lei and Wu (2007) 0.062 Χ 0.046 ✓ 0.054 ✓
SRMR < 0.08 Gefen et al. (2000) 0.085 Χ 0.033 ✓ 0.116 Χ
NFI > 0.90 Gefen et al. (2000) 0.914 ✓ 0.956 ✓ 0.904 ✓
TLI > 0.90 Gefen et al. (2000) 0.908 ✓ 0.949 ✓ 0.905 ✓
CFI > 0.90 Gefen et al. (2000) 0.921 ✓ 0.962 ✓ 0.914 ✓
AGFI > 0.80 Gefen et al. (2000) 0.880 ✓ 0.930 ✓ 0.846 ✓
Note: ✓ indicates that a threshold is met, Χ indicates that it is not met.
Root Mean Square Error of Approximation (RMSEA), Standardized Root Mean Square Residual (SRMR),
Normed Fit Index (NFI), Tucker-Lewis Index (TLI), Comparative Fit Index (CFI), Adjusted Goodness of Fit
Index (AGFI)
Table 4.1-4: Fit Indices for the Three Research Models
Figure 4.1-3 shows the estimated models. The results for the control variables and the loadings
of the first-order technostress creators on the second-order technostress construct in model 1
and model 3 are in Appendix 4.1.D.
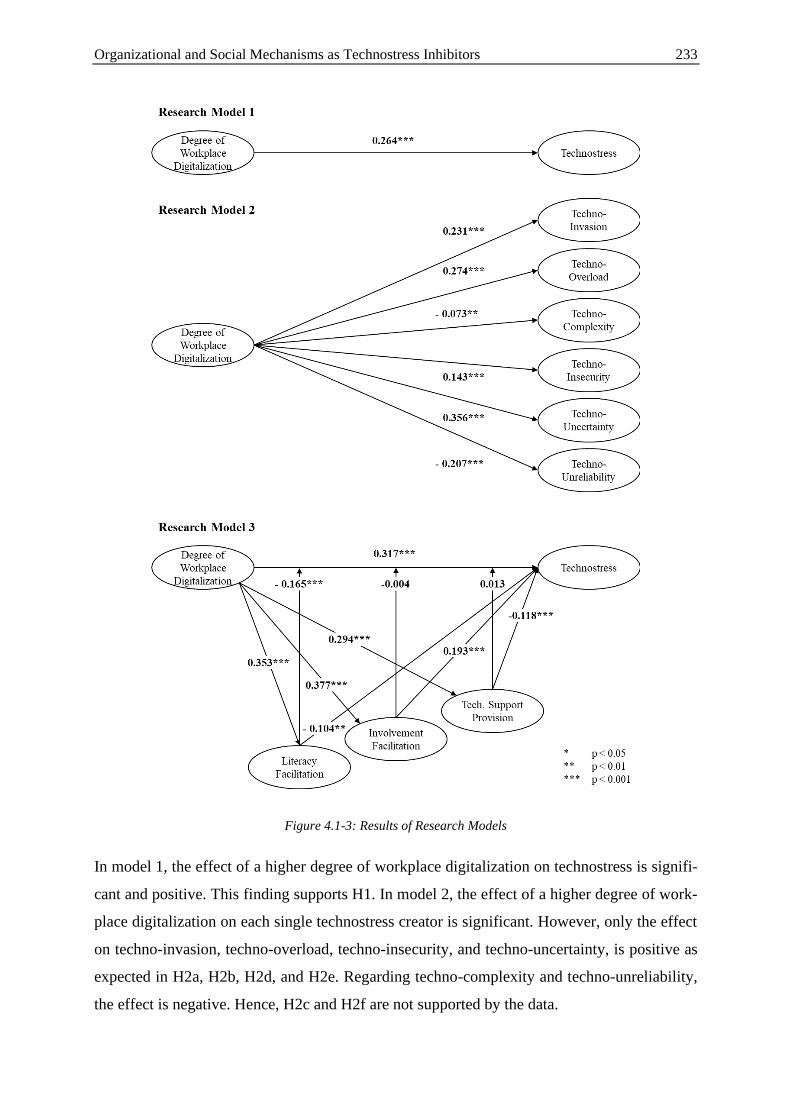
Organizational and Social Mechanisms as Technostress Inhibitors 233
Figure 4.1-3: Results of Research Models
In model 1, the effect of a higher degree of workplace digitalization on technostress is signifi-
cant and positive. This finding supports H1. In model 2, the effect of a higher degree of work-
place digitalization on each single technostress creator is significant. However, only the effect
on techno-invasion, techno-overload, techno-insecurity, and techno-uncertainty, is positive as
expected in H2a, H2b, H2d, and H2e. Regarding techno-complexity and techno-unreliability,
the effect is negative. Hence, H2c and H2f are not supported by the data.
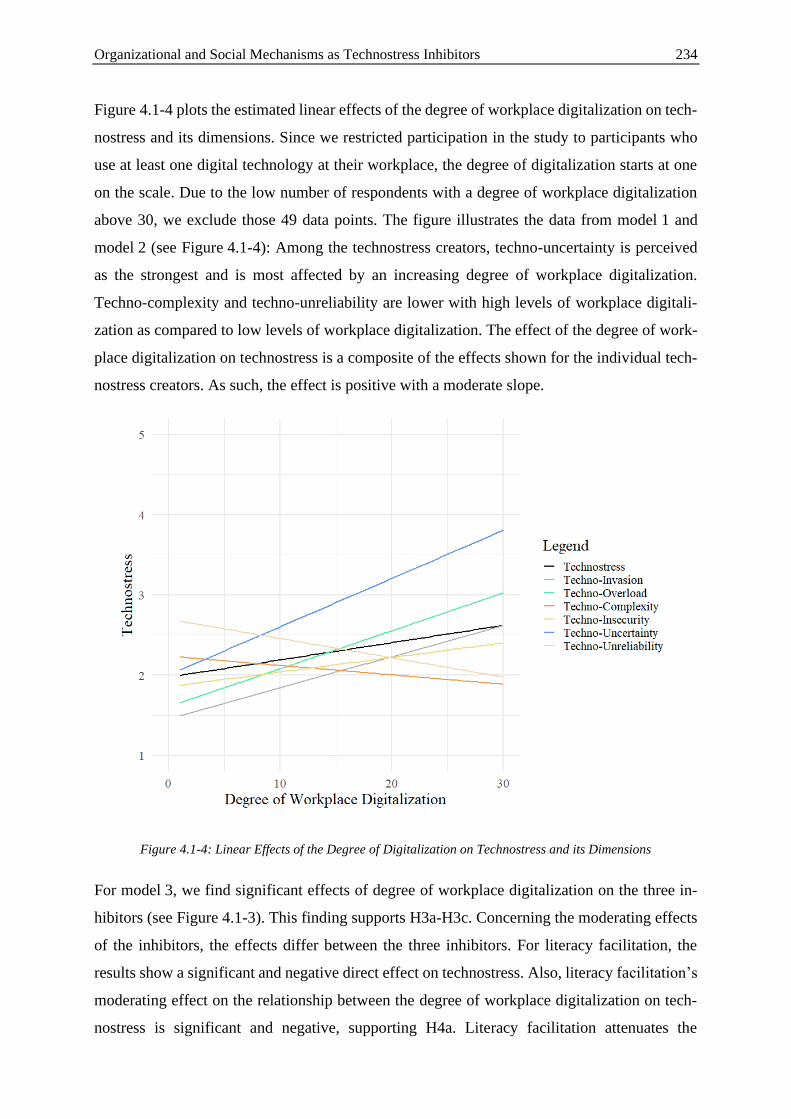
Organizational and Social Mechanisms as Technostress Inhibitors 234
Figure 4.1-4 plots the estimated linear effects of the degree of workplace digitalization on tech-
nostress and its dimensions. Since we restricted participation in the study to participants who
use at least one digital technology at their workplace, the degree of digitalization starts at one
on the scale. Due to the low number of respondents with a degree of workplace digitalization
above 30, we exclude those 49 data points. The figure illustrates the data from model 1 and
model 2 (see Figure 4.1-4): Among the technostress creators, techno-uncertainty is perceived
as the strongest and is most affected by an increasing degree of workplace digitalization.
Techno-complexity and techno-unreliability are lower with high levels of workplace digitali-
zation as compared to low levels of workplace digitalization. The effect of the degree of work-
place digitalization on technostress is a composite of the effects shown for the individual tech-
nostress creators. As such, the effect is positive with a moderate slope.
Figure 4.1-4: Linear Effects of the Degree of Digitalization on Technostress and its Dimensions
For model 3, we find significant effects of degree of workplace digitalization on the three in-
hibitors (see Figure 4.1-3). This finding supports H3a-H3c. Concerning the moderating effects
of the inhibitors, the effects differ between the three inhibitors. For literacy facilitation, the
results show a significant and negative direct effect on technostress. Also, literacy facilitation’s
moderating effect on the relationship between the degree of workplace digitalization on tech-
nostress is significant and negative, supporting H4a. Literacy facilitation attenuates the
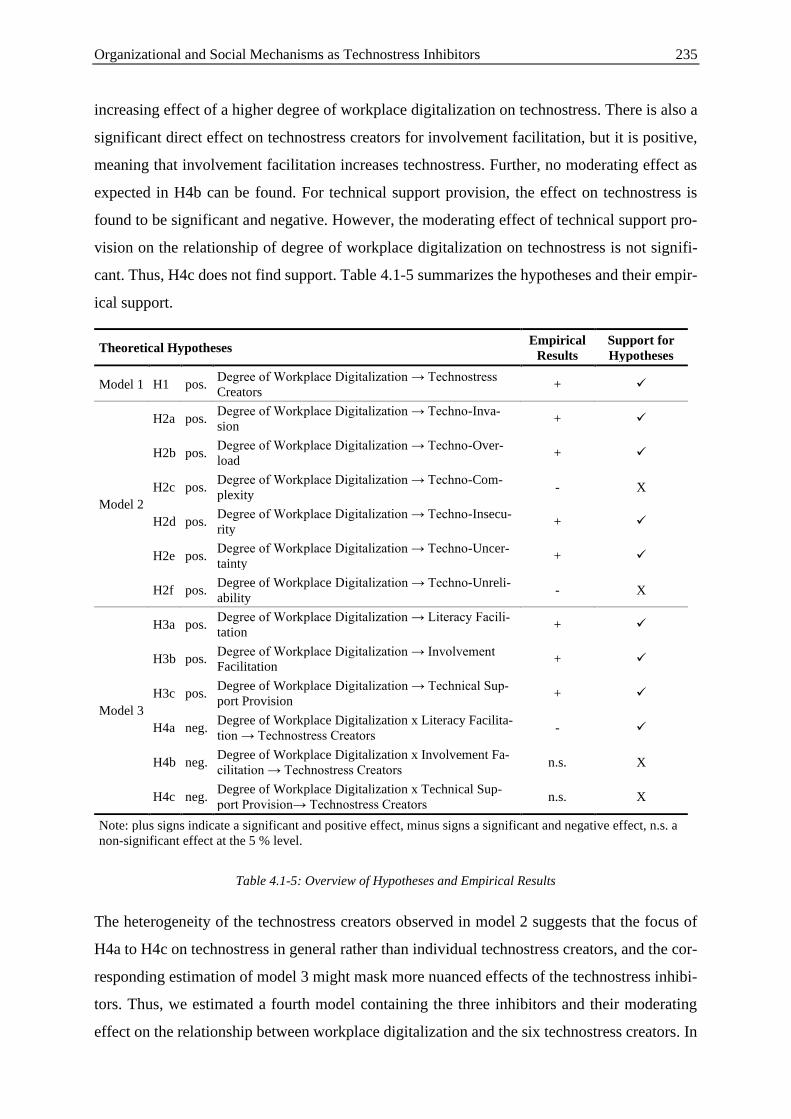
Organizational and Social Mechanisms as Technostress Inhibitors 235
increasing effect of a higher degree of workplace digitalization on technostress. There is also a
significant direct effect on technostress creators for involvement facilitation, but it is positive,
meaning that involvement facilitation increases technostress. Further, no moderating effect as
expected in H4b can be found. For technical support provision, the effect on technostress is
found to be significant and negative. However, the moderating effect of technical support pro-
vision on the relationship of degree of workplace digitalization on technostress is not signifi-
cant. Thus, H4c does not find support. Table 4.1-5 summarizes the hypotheses and their empir-
ical support.
Theoretical Hypotheses Empirical
Results
Support for
Hypotheses
Model 1 H1 pos. Degree of Workplace Digitalization → Technostress
Creators + ✓
Model 2
H2a pos. Degree of Workplace Digitalization → Techno-Inva-
sion + ✓
H2b pos. Degree of Workplace Digitalization → Techno-Over-
load + ✓
H2c pos. Degree of Workplace Digitalization → Techno-Com-
plexity - X
H2d pos. Degree of Workplace Digitalization → Techno-Insecu-
rity + ✓
H2e pos. Degree of Workplace Digitalization → Techno-Uncer-
tainty + ✓
H2f pos. Degree of Workplace Digitalization → Techno-Unreli-
ability - X
Model 3
H3a pos. Degree of Workplace Digitalization → Literacy Facili-
tation + ✓
H3b pos. Degree of Workplace Digitalization → Involvement
Facilitation + ✓
H3c pos. Degree of Workplace Digitalization → Technical Sup-
port Provision + ✓
H4a neg. Degree of Workplace Digitalization x Literacy Facilita-
tion → Technostress Creators - ✓
H4b neg. Degree of Workplace Digitalization x Involvement Fa-
cilitation → Technostress Creators n.s. X
H4c neg. Degree of Workplace Digitalization x Technical Sup-
port Provision→ Technostress Creators n.s. X
Note: plus signs indicate a significant and positive effect, minus signs a significant and negative effect, n.s. a
non-significant effect at the 5 % level.
Table 4.1-5: Overview of Hypotheses and Empirical Results
The heterogeneity of the technostress creators observed in model 2 suggests that the focus of
H4a to H4c on technostress in general rather than individual technostress creators, and the cor-
responding estimation of model 3 might mask more nuanced effects of the technostress inhibi-
tors. Thus, we estimated a fourth model containing the three inhibitors and their moderating
effect on the relationship between workplace digitalization and the six technostress creators. In
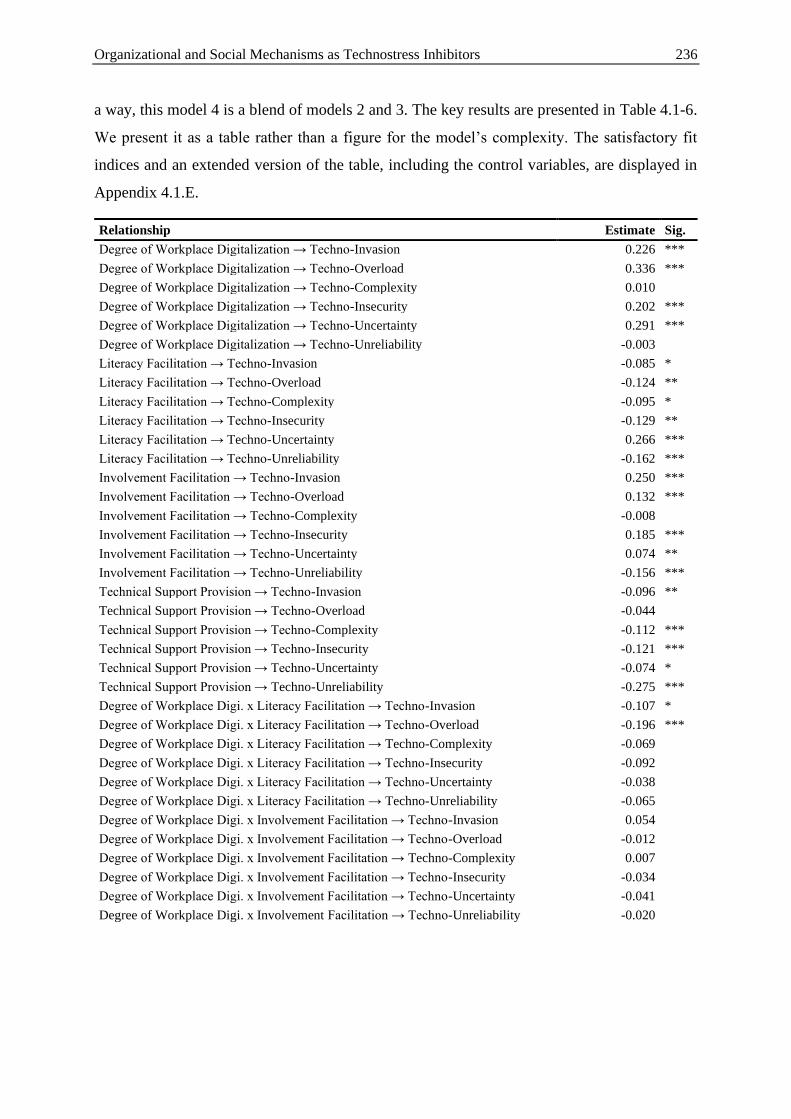
Organizational and Social Mechanisms as Technostress Inhibitors 236
a way, this model 4 is a blend of models 2 and 3. The key results are presented in Table 4.1-6.
We present it as a table rather than a figure for the model’s complexity. The satisfactory fit
indices and an extended version of the table, including the control variables, are displayed in
Appendix 4.1.E.
Relationship Estimate Sig.
Degree of Workplace Digitalization → Techno-Invasion 0.226 ***
Degree of Workplace Digitalization → Techno-Overload 0.336 ***
Degree of Workplace Digitalization → Techno-Complexity 0.010
Degree of Workplace Digitalization → Techno-Insecurity 0.202 ***
Degree of Workplace Digitalization → Techno-Uncertainty 0.291 ***
Degree of Workplace Digitalization → Techno-Unreliability -0.003
Literacy Facilitation → Techno-Invasion -0.085 *
Literacy Facilitation → Techno-Overload -0.124 **
Literacy Facilitation → Techno-Complexity -0.095 *
Literacy Facilitation → Techno-Insecurity -0.129 **
Literacy Facilitation → Techno-Uncertainty 0.266 ***
Literacy Facilitation → Techno-Unreliability -0.162 ***
Involvement Facilitation → Techno-Invasion 0.250 ***
Involvement Facilitation → Techno-Overload 0.132 ***
Involvement Facilitation → Techno-Complexity -0.008
Involvement Facilitation → Techno-Insecurity 0.185 ***
Involvement Facilitation → Techno-Uncertainty 0.074 **
Involvement Facilitation → Techno-Unreliability -0.156 ***
Technical Support Provision → Techno-Invasion -0.096 **
Technical Support Provision → Techno-Overload -0.044
Technical Support Provision → Techno-Complexity -0.112 ***
Technical Support Provision → Techno-Insecurity -0.121 ***
Technical Support Provision → Techno-Uncertainty -0.074 *
Technical Support Provision → Techno-Unreliability -0.275 ***
Degree of Workplace Digi. x Literacy Facilitation → Techno-Invasion -0.107 *
Degree of Workplace Digi. x Literacy Facilitation → Techno-Overload -0.196 ***
Degree of Workplace Digi. x Literacy Facilitation → Techno-Complexity -0.069
Degree of Workplace Digi. x Literacy Facilitation → Techno-Insecurity -0.092
Degree of Workplace Digi. x Literacy Facilitation → Techno-Uncertainty -0.038
Degree of Workplace Digi. x Literacy Facilitation → Techno-Unreliability -0.065
Degree of Workplace Digi. x Involvement Facilitation → Techno-Invasion 0.054
Degree of Workplace Digi. x Involvement Facilitation → Techno-Overload -0.012
Degree of Workplace Digi. x Involvement Facilitation → Techno-Complexity 0.007
Degree of Workplace Digi. x Involvement Facilitation → Techno-Insecurity -0.034
Degree of Workplace Digi. x Involvement Facilitation → Techno-Uncertainty -0.041
Degree of Workplace Digi. x Involvement Facilitation → Techno-Unreliability -0.020
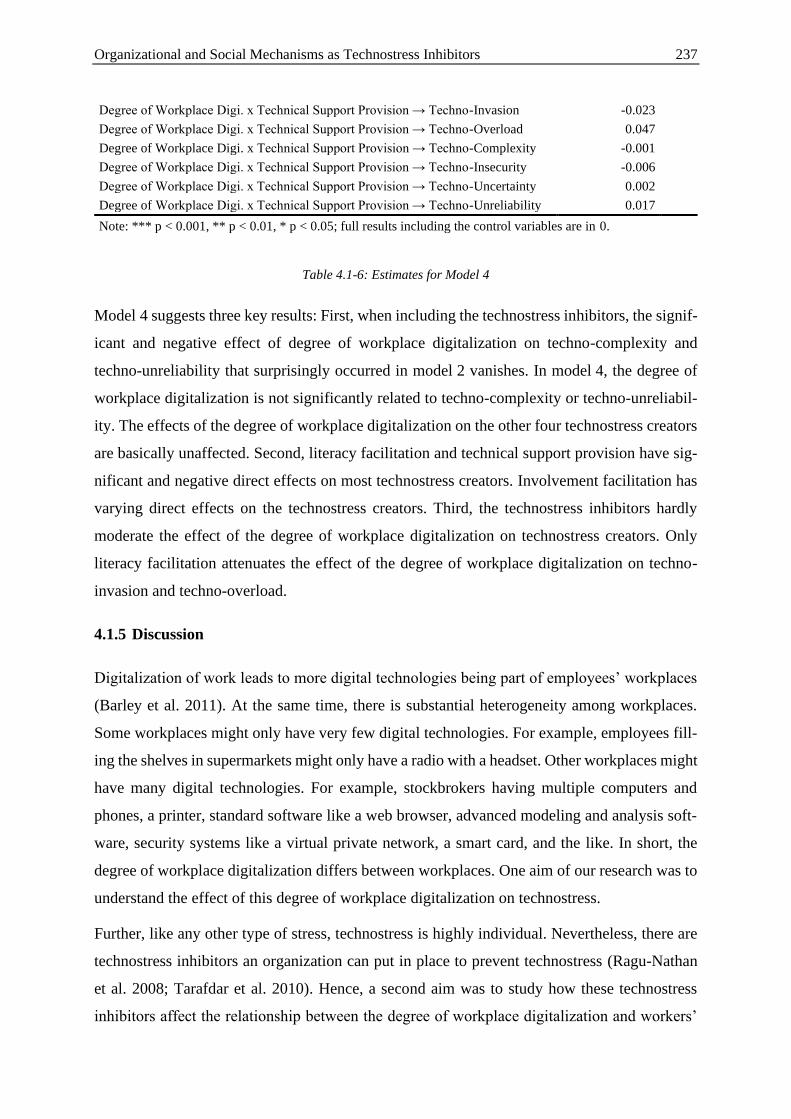
Organizational and Social Mechanisms as Technostress Inhibitors 237
Degree of Workplace Digi. x Technical Support Provision → Techno-Invasion -0.023
Degree of Workplace Digi. x Technical Support Provision → Techno-Overload 0.047
Degree of Workplace Digi. x Technical Support Provision → Techno-Complexity -0.001
Degree of Workplace Digi. x Technical Support Provision → Techno-Insecurity -0.006
Degree of Workplace Digi. x Technical Support Provision → Techno-Uncertainty 0.002
Degree of Workplace Digi. x Technical Support Provision → Techno-Unreliability 0.017
Note: *** p < 0.001, ** p < 0.01, * p < 0.05; full results including the control variables are in 0.
Table 4.1-6: Estimates for Model 4
Model 4 suggests three key results: First, when including the technostress inhibitors, the signif-
icant and negative effect of degree of workplace digitalization on techno-complexity and
techno-unreliability that surprisingly occurred in model 2 vanishes. In model 4, the degree of
workplace digitalization is not significantly related to techno-complexity or techno-unreliabil-
ity. The effects of the degree of workplace digitalization on the other four technostress creators
are basically unaffected. Second, literacy facilitation and technical support provision have sig-
nificant and negative direct effects on most technostress creators. Involvement facilitation has
varying direct effects on the technostress creators. Third, the technostress inhibitors hardly
moderate the effect of the degree of workplace digitalization on technostress creators. Only
literacy facilitation attenuates the effect of the degree of workplace digitalization on techno-
invasion and techno-overload.
4.1.5 Discussion
Digitalization of work leads to more digital technologies being part of employees’ workplaces
(Barley et al. 2011). At the same time, there is substantial heterogeneity among workplaces.
Some workplaces might only have very few digital technologies. For example, employees fill-
ing the shelves in supermarkets might only have a radio with a headset. Other workplaces might
have many digital technologies. For example, stockbrokers having multiple computers and
phones, a printer, standard software like a web browser, advanced modeling and analysis soft-
ware, security systems like a virtual private network, a smart card, and the like. In short, the
degree of workplace digitalization differs between workplaces. One aim of our research was to
understand the effect of this degree of workplace digitalization on technostress.
Further, like any other type of stress, technostress is highly individual. Nevertheless, there are
technostress inhibitors an organization can put in place to prevent technostress (Ragu-Nathan
et al. 2008; Tarafdar et al. 2010). Hence, a second aim was to study how these technostress
inhibitors affect the relationship between the degree of workplace digitalization and workers’
Organizational and Social Mechanisms as Technostress Inhibitors 238
technostress. Thus, we derived theoretical hypotheses and conducted a large-scale online sur-
vey.
Our results suggest that a higher degree of workplace digitalization increases technostress, but
the relationship differs among the six technostress creators. While most technostress creators
are more pronounced with a high rather than low degree of workplace digitalization, the oppo-
site is the case for techno-complexity and techno-unreliability.
The complexity associated with digital technologies can force users to learn how to handle them
(Ragu-Nathan et al. 2008). One might think (as in fact, we did in our hypothesis H2c) that an
increasing degree of workplace digitalization leads to more complexity and more effort for
learning. However, the data suggest otherwise. Hypotheses to explore in future research are that
the selection of digitally savvy employees (either self-selection or selection by the supervisor
or employer) is responsible for the surprising effect or that learning how to deal with a specific
technology has positive side-effects for dealing with other technologies. In other words, com-
petencies in handling digital technologies might not be fully technology-specific and, thus, ex-
posure to a highly digital workplace may eventually lead to reduced perceived complexity.
The perception of techno-unreliability might be lower for a high degree of workplace digitali-
zation, as some technologies might be substitutes. Take the example of an employee equipped
with a landline phone, a smartphone, and a computer mainly used to browse the internet, access
documents in cloud storage, and email. When one of the three devices is temporarily not oper-
ational, the other two in combination afford to perform basically the same work (likely with
less convenience and lower productivity than the complete set of three devices). Testing
whether such substitutability explains the surprising result regarding H2f is a matter for future
research.
Despite these two counterintuitive effects, the overall picture is that a higher degree of work-
place digitalization goes along with higher levels of technostress.
The degree of workplace digitalization is also positively associated with the three investigated
technostress inhibitors. However, the effect of technostress inhibitors on technostress is not
always as expected previously. Literacy facilitation behaves as expected as it decreases tech-
nostress and the positive relationship between the degree of workplace digitalization and tech-
nostress. This effect is in line with prior research suggesting that individual resources that are
enhanced by literacy facilitation are of great importance in terms of technostress (Tarafdar et
al. 2019). Involvement facilitation has no moderating effect and increases instead of decreases
technostress. This results contrasts with Tarafdar et al. (2010) finding a negative effect. Thus,
Organizational and Social Mechanisms as Technostress Inhibitors 239
further examination of this relationship is required. When looking at model 4, involvement fa-
cilitation has a significantly negative effect on techno-unreliability and a significantly positive
effect on techno-invasion, techno-overload, techno-insecurity, and techno-uncertainty. This
finding calls for further research to understand these relationships better. Technical support
provision does not moderate the relationship between the degree of workplace digitalization
and technostress but has a significantly negative direct effect on technostress and most individ-
ual technostress creators.
The results also highlight the double-edged effect of workplace digitalization on technostress.
While the direct effect on technostress creators is positive – referring to an adverse outcome for
individuals – the indirect effect over literacy facilitation and technical support provision is as-
sociated with a beneficial effect for the individuals since inhibitors are higher when workplace
digitalization is high, and thus their inhibiting effect is stronger.
4.1.5.1 Theoretical Contribution
We contribute to theory in three ways. First, we focus on the degree of overall workplace digi-
talization rather than analyzing specific digital technologies and their effect on technostress.
This focus complements prior work of, for example, Maier et al. (2015a) or Stich et al. (2019).
It establishes the degree of workplace digitalization as an important characteristic of the work-
ing and technological environment.
Second, we find evidence for the link of the degree of workplace digitalization with tech-
nostress. Thereby, we find a significant effect on technostress overall and find significant ef-
fects on each of the six individual technostress creators. Prior research mostly builds a second-
order factor of technostress based on the technostress creators. We contribute a more detailed
understanding. We further show the importance of the individual consideration of technostress
creators as we find that only four of the six technostress creators (techno-invasion, techno-
overload, techno-insecurity, and techno-uncertainty) are positively affected by a higher degree
of workplace digitalization as expected. Techno-complexity and techno-unreliability, however,
have a negative relationship with the degree of workplace digitalization. This surprising result
should inspire future research to consider different technostress creators individually rather than
as one combined construct.
Third, we find evidence for the three-way relationship between the degree of workplace digi-
talization, technostress inhibitors, and technostress. Thereby, we find an effect of the degree of
workplace digitalization on technostress inhibitors, of technostress inhibitors on the emergence
of technostress creators, and the moderating effect of literacy facilitation on the relationship
Organizational and Social Mechanisms as Technostress Inhibitors 240
between the degree of workplace digitalization and technostress. Since the effects differ be-
tween the three technostress inhibitors and the affected technostress creators, we further
strengthen the need to consider them separately.
4.1.5.2 Practical Implications
Our results also bring practical implications for organizations. With our large-scale study
among German employees, we provide input on the existence and strength of the effect of the
degree of workplace digitalization and technostress inhibitors on different technostress creators.
Especially literacy facilitation can be an effective measure for organizations to mitigate the
adverse effects of increasing workplace digitalization. This finding gives inspiration for miti-
gating the adverse effects of digitalization without slowing digitalization down. Our specific
results for the six technostress creators and the three technostress inhibitors can impact IT and
HR departments’ decisions to design digital workplaces and leverage inhibitors better.
4.1.6 Limitations and Conclusion
Our study has several limitations that leave room for future research. First, our study was con-
ducted in Germany and thus limited to the German workforce. Future research can analyze the
robustness of the findings across other nationalities. Second, we collected cross-sectional data.
Future work should also consider the effect of an increasingly digitalized workplace on tech-
nostress over time. Third, we measured the degree of workplace digitalization by providing
participants with a list of 40 technologies to choose from. Even though we believe that these
technologies cover the digital technologies present at today’s workplaces, we cannot control for
completeness of the list as it may change over time.
In conclusion, our research makes an important contribution to knowledge on inhibiting the
adverse effects of the ongoing digitalization of workplaces. While organizations will keep on
adopting digital technologies and establishing work routines based on digital technologies to
achieve the associated benefits, they also have to consider possible adverse outcomes for their
employees, such as technostress. Our work shows that inhibitors like literacy facilitation, in-
volvement facilitation, and technical support provision can be effective.
Organizational and Social Mechanisms as Technostress Inhibitors 241
4.1.7 References
Adam, M. T. P., Gimpel, H., Mädche, A., and Riedl, R. 2017. “Design Blueprint for Stress-
Sensitive Adaptive Enterprise Systems,” Business & Information Systems Engineering
(59:4), pp. 277-291.
Anderson, C. R. 1977. “Locus of Control, Coping Behaviors, and Performance in a Stress Set-
ting: A Longitudinal Study,” Journal of Applied Psychology (62:4), pp. 446-451.
Ayyagari, R., Grover, V., and Purvis, R. 2011. “Technostress: Technological Antecedents and
Implications,” Management Information Systems Quarterly (35:4), pp. 831-858.
Bagozzi, R., and Yi, Y. 1988. “On the Evaluation of Structure Equation Models,” Journal of
the Academy of Marketing Science (16:1), pp. 74-94.
Barley, S. R., Meyerson, D. E., and Grodal, S. 2011. “E-mail as a Source and Symbol of Stress,”
Organization Science (22:4), pp. 887-906.
Becker, J., Berger, M., Gimpel, H., Lanzl, J., and Regal, C. 2020. “Considering Characteristic
Profiles of Technologies at the Digital Workplace: The Influence on Technostress,” in Pro-
ceedings of the 41st International Conference on Information Systems, Hyderabad, India,
pp. 1-17.
Bharadwaj, A., El Sawy, O. A., Pavlou, P. A., and Venkatraman, N. 2013. “Digital Business
Strategy: Toward a Next Generation of Insights,” Management Information Systems Quar-
terly (37:2), pp. 471-482.
Boomsma, A. 1982. “The Robustness of LISREL against Small Sample Sizes in Factor Analy-
sis Models,” pp. 149-173.
Brod, C. 1984. Technostress: The Human Cost of the Computer Revolution, Reading, Mass.:
Addison-Wesley.
Colbert, A., Yee, N., and George, G. 2016. “The Digital Workforce and the Workplace of the
Future,” Academy of Management Journal (59:3), pp. 731-739.
D’Arcy, J., Herath, T., and Shoss, M. K. 2014. “Understanding Employee Responses to Stress-
ful Information Security Requirements: A Coping Perspective,” Journal of Management
Information Systems (31:2), pp. 285-318.
Day, A., Paquet, S., Scott, N., and Hambley, L. 2012. “Perceived Information and Communi-
cation Technology (ICT) Demands on Employee Outcomes: the Moderating Effect of Or-
ganizational ICT Support,” Journal of Occupational Health Psychology (17:4), pp. 473-
491.
Organizational and Social Mechanisms as Technostress Inhibitors 242
Fitzgerald, M., Kruschwitz, N., Bonnet, D., and Welch, M. 2013. “Embracing Digital Technol-
ogy: A New Strategic Imperative,” MIT Sloan Management Review (55:2), pp. 1-12.
Fuglseth, A. M., and Sørebø, Ø. 2014. “The Effects of Technostress within the Context of Em-
ployee Use of ICT,” Computers in Human Behavior (40), pp. 161-170.
Galluch, P. S., Grover, V., and Thatcher, J. B. 2015. “Interrupting the Workplace: Examining
Stressors in an Information Technology Context,” Journal of the Association for Infor-
mation Systems (16:1), pp. 1-47.
Gefen, D., Straub, D. W., and Boudreau, M.-C. 2000. “Structural Equation Modeling and Re-
gression: Guidelines for Research Practice,” Communications of the Association for Infor-
mation Systems (4:1), Article 7.
Gimpel, H., Lanzl, J., Manner-Romberg, T., and Nüske, N. 2018. “Digitaler Stress in Deutsch-
land: Eine Befragung von Erwerbstätigen zu Belastung und Beanspruchung durch Arbeit
mit digitalen Technologien,” Hans Böckler Stiftung (ed.).
Hair, J. F., Sarstedt, M., Ringle, C. M., and Mena, J. A. 2012. “An Assessment of the Use of
Partial Least Squares Structural Equation Modeling in Marketing Research,” Journal of the
Academy of Marketing Science (40:3), pp. 414-433.
Hess, T., Matt, C., Benlian, A., and Wiesböck, F. 2016. “Options for Formulating a Digital
Transformation Strategy,” Management Information Systems Quarterly Executive (15:2),
pp. 123-139.
Köffer, S. 2015. “Designing the Digital Workplace of the Future: What Scholars Recommend
to Practitioners,” in Proceedings of the 36th International Conference on Information Sys-
tems, Fort Worth, Texas, USA, pp. 1-21.
Lazarus, R. S., and Folkman, S. 1984. Stress, Appraisal, and Coping, New York: Springer Pub-
lishing Company.
Lee, Y.-K., Chang, C.-T., Lin, Y., and Cheng, Z.-H. 2014. “The Dark Side of Smartphone Us-
age: Psychological Traits, Compulsive Behavior and Technostress,” Computers in Human
Behavior (31), pp. 373-383.
Lei, P.-W., and Wu, Q. 2007. “Introduction to Structural Equation Modeling: Issues and Prac-
tical Considerations,” Educational Measurement: Issues and Practice (26:3), pp. 33-43.
Lindell, M. K., and Whitney, D. J. 2001. “Accounting for Common Method Variance in Cross-
Sectional Research Designs,” The Journal of Applied Psychology (86:1), pp. 114-121.
Maier, C., Laumer, S., and Weinert, C. 2015a. “Enterprise Resource Planning systems Induced
Stress: A Comparative Empirical Analysis with Young and Elderly SAP Users,” in
Organizational and Social Mechanisms as Technostress Inhibitors 243
Proceedings of the 12th International Conference on Wirtschaftsinformatik, Osnabrueck,
Germany, pp. 1-16.
Maier, C., Laumer, S., Weinert, C., and Weitzel, T. 2015b. “The Effects of Technostress and
Switching Stress on Discontinued Use of Social Networking Services: A Study of Facebook
Use,” Information Systems Journal (25:3), pp. 275-308.
Neumeier, A., Wolf, T., and Oesterle, S. 2017. “The Manifold Fruits of Digitalization: Deter-
mining the Literal Value Behing,” in Proceedings of the 13th International Conference on
Wirtschaftsinformatik, St. Gallen, Switzerland, pp. 484-498.
Nunnally, J. C., and Bernstein, I. H. 1994. Psychometric Theory, New York: McGraw-Hill.
Pirkkalainen, H., Salo, M., Makkonen, M., and Tarafdar, M. 2017. “Coping with Technostress:
When Emotional Responses Fail,” in Proceedings of the 38th International Conference on
Information Systems, Seoul, Korea, pp. 1-18.
Podsakoff, P. M., MacKenzie, S. B., and Podsakoff, N. P. 2003. “Common Method Biases in
Behavioral Research: A Critical Review of the Literature and Recommended Remedies,”
Journal of Applied Psychology (88:5), pp. 879-903.
Ragu-Nathan, T. S., Tarafdar, M., Ragu-Nathan, B. S., and Tu, Q. 2008. “The Consequences
of Technostress for End Users in Organizations: Conceptual Development and Empirical
Validation,” Information Systems Research (19:4), pp. 417-433.
Reimann, M., Abendroth, A.-K., and Diewald, M. 2020. “How Digitalized is Work in Large
German Workplaces, and how is Digitalized Work Perceived by Workers?: A New Em-
ployer-Employee Survey Instrument,” IAB-Forschungsbericht 8/2020, Institute for Em-
ployment Research (IAB) (ed.).
Richardson, H. A., Simmering, M. J., and Sturman, M. C. 2009. “A Tale of Three Perspectives:
Examining Post Hoc Statistical Techniques for Detection and Correction of Common
Method Variance,” Organizational Research Methods (12:4), pp. 762-800.
Riedl, R. 2013. “On the Biology of Technostress: Literature Review and Research Agenda,”
DATA BASE for Advances in Information Systems (44:1), pp. 18-55.
Srivastava, S. C., Chandra, S., and Shirish, A. 2015. “Technostress Creators and Job Outcomes:
Theorising the Moderating Influence of Personality Traits,” Information Systems Journal
(25:4), pp. 355-401.
Stanko, T. L., and Beckman, C. M. 2014. “Watching You Watching Me: Boundary Control and
Capturing Attention in the Context of Ubiquitous Technology Use,” The Academy of Man-
agement Journal (58:3), pp. 712-738.
Organizational and Social Mechanisms as Technostress Inhibitors 244
Stich, J.-F., Tarafdar, M., Stacey, P., and Cooper, C. L. 2019. “Appraisal of Email Use as a
Source of Workplace Stress: A Person-Environment Fit Approach,” Journal of the Associ-
ation for Information Systems (20:2), pp. 132-160.
Tarafdar, M., Cooper, C. L., and Stich, J.-F. 2019. “The Technostress Trifecta: Techno Eustress,
Techno Distress and Design: Theoretical Directions and an Agenda for Research,” Infor-
mation Systems Journal (29:1), pp. 6-42.
Tarafdar, M., Pullins, E. B., and Ragu-Nathan, T. S. 2015. “Technostress: Negative Effect on
Performance and Possible Mitigations,” Information Systems Journal (25:2), pp. 103-132.
Tarafdar, M., Tu, Q., Ragu-Nathan, B. S., and Ragu-Nathan, T. S. 2007. “The Impact of Tech-
nostress on Role Stress and Productivity,” Journal of Management Information Systems
(24:1), pp. 301-328.
Tarafdar, M., Tu, Q., and Ragu-Nathan, T. S. 2010. “Impact of Technostress on End-User Sat-
isfaction and Performance,” Journal of Management Information Systems (27:3), pp. 303-
334.
Tarafdar, M., Tu, Q., Ragu-Nathan, T. S., and Ragu-Nathan, B. S. 2011. “Crossing to the Dark
Side: Examining Creators, Outcomes, and Inhibitors of Technostress,” Communications of
the ACM (54:9), pp. 113-120.
Tu, Q., Wang, K., and Shu, Q. 2005. “Computer-Mediated Technostress in China,” Communi-
cations of the ACM (48:4), pp. 77-81.
van Knippenberg, D., Dahlander, L., Haas, M. R., and George, G. 2015. “From the Editors:
Information, Attention, and Decision Making,” Academy of Management Journal (58:3),
pp. 649-657.
Vial, G. 2019. “Understanding Digital Transformation: A Review and a Research Agenda,”
Journal of Strategic Information Systems (28:2), pp. 118-144.
Williams, S. P., and Schubert, P. 2018. “Designs for the Digital Workplace,” Procedia Com-
puter Science (138), pp. 478-485.
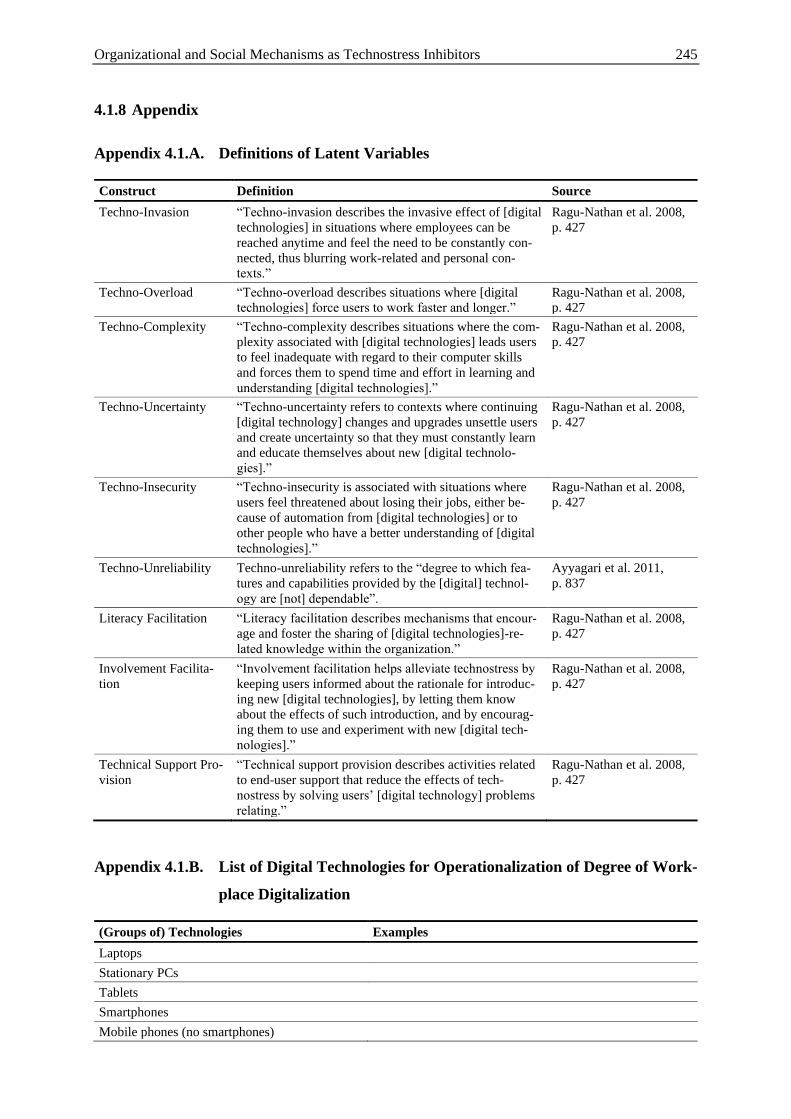
Organizational and Social Mechanisms as Technostress Inhibitors 245
4.1.8 Appendix
Appendix 4.1.A. Definitions of Latent Variables
Construct Definition Source
Techno-Invasion “Techno-invasion describes the invasive effect of [digital
technologies] in situations where employees can be
reached anytime and feel the need to be constantly con-
nected, thus blurring work-related and personal con-
texts.”
Ragu-Nathan et al. 2008,
p. 427
Techno-Overload “Techno-overload describes situations where [digital
technologies] force users to work faster and longer.”
Ragu-Nathan et al. 2008,
p. 427
Techno-Complexity “Techno-complexity describes situations where the com-
plexity associated with [digital technologies] leads users
to feel inadequate with regard to their computer skills
and forces them to spend time and effort in learning and
understanding [digital technologies].”
Ragu-Nathan et al. 2008,
p. 427
Techno-Uncertainty “Techno-uncertainty refers to contexts where continuing
[digital technology] changes and upgrades unsettle users
and create uncertainty so that they must constantly learn
and educate themselves about new [digital technolo-
gies].”
Ragu-Nathan et al. 2008,
p. 427
Techno-Insecurity “Techno-insecurity is associated with situations where
users feel threatened about losing their jobs, either be-
cause of automation from [digital technologies] or to
other people who have a better understanding of [digital
technologies].”
Ragu-Nathan et al. 2008,
p. 427
Techno-Unreliability Techno-unreliability refers to the “degree to which fea-
tures and capabilities provided by the [digital] technol-
ogy are [not] dependable”.
Ayyagari et al. 2011,
p. 837
Literacy Facilitation “Literacy facilitation describes mechanisms that encour-
age and foster the sharing of [digital technologies]-re-
lated knowledge within the organization.”
Ragu-Nathan et al. 2008,
p. 427
Involvement Facilita-
tion
“Involvement facilitation helps alleviate technostress by
keeping users informed about the rationale for introduc-
ing new [digital technologies], by letting them know
about the effects of such introduction, and by encourag-
ing them to use and experiment with new [digital tech-
nologies].”
Ragu-Nathan et al. 2008,
p. 427
Technical Support Pro-
vision
“Technical support provision describes activities related
to end-user support that reduce the effects of tech-
nostress by solving users’ [digital technology] problems
relating.”
Ragu-Nathan et al. 2008,
p. 427
Appendix 4.1.B. List of Digital Technologies for Operationalization of Degree of Work-
place Digitalization
(Groups of) Technologies Examples
Laptops
Stationary PCs
Tablets
Smartphones
Mobile phones (no smartphones)
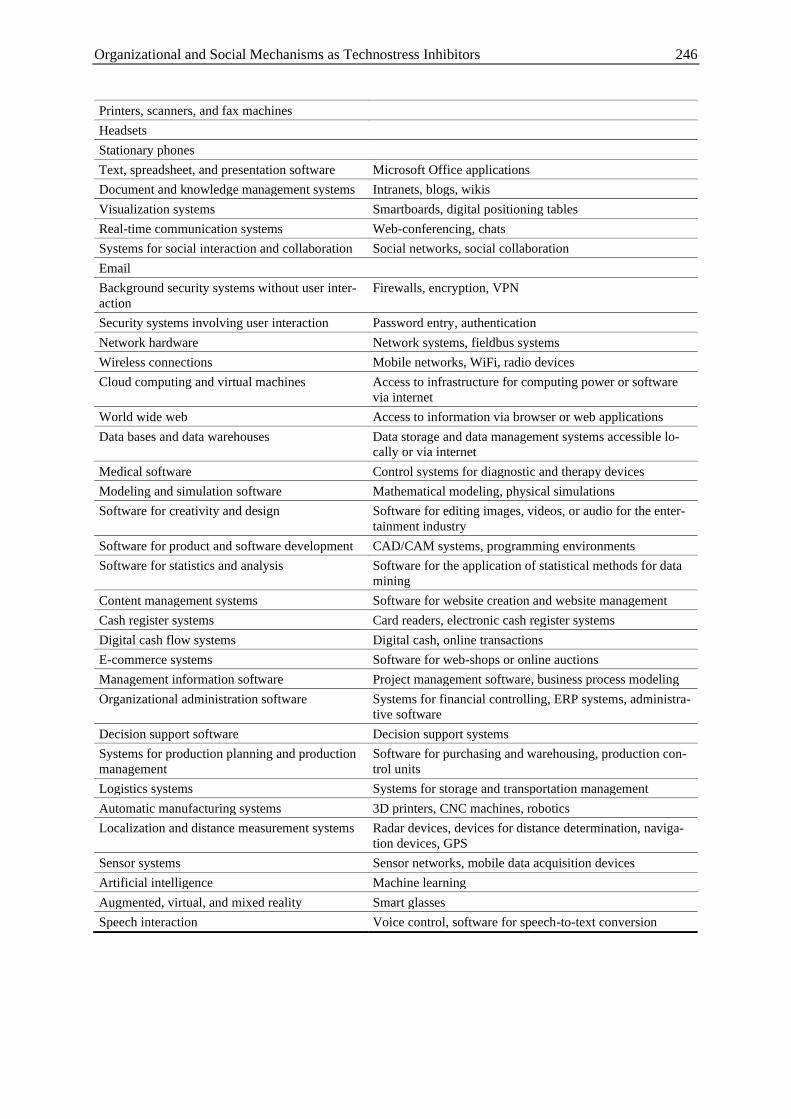
Organizational and Social Mechanisms as Technostress Inhibitors 246
Printers, scanners, and fax machines
Headsets
Stationary phones
Text, spreadsheet, and presentation software Microsoft Office applications
Document and knowledge management systems Intranets, blogs, wikis
Visualization systems Smartboards, digital positioning tables
Real-time communication systems Web-conferencing, chats
Systems for social interaction and collaboration Social networks, social collaboration
Background security systems without user inter-
action
Firewalls, encryption, VPN
Security systems involving user interaction Password entry, authentication
Network hardware Network systems, fieldbus systems
Wireless connections Mobile networks, WiFi, radio devices
Cloud computing and virtual machines Access to infrastructure for computing power or software
via internet
World wide web Access to information via browser or web applications
Data bases and data warehouses Data storage and data management systems accessible lo-
cally or via internet
Medical software Control systems for diagnostic and therapy devices
Modeling and simulation software Mathematical modeling, physical simulations
Software for creativity and design Software for editing images, videos, or audio for the enter-
tainment industry
Software for product and software development CAD/CAM systems, programming environments
Software for statistics and analysis Software for the application of statistical methods for data
mining
Content management systems Software for website creation and website management
Cash register systems Card readers, electronic cash register systems
Digital cash flow systems Digital cash, online transactions
E-commerce systems Software for web-shops or online auctions
Management information software Project management software, business process modeling
Organizational administration software Systems for financial controlling, ERP systems, administra-
tive software
Decision support software Decision support systems
Systems for production planning and production
management
Software for purchasing and warehousing, production con-
trol units
Logistics systems Systems for storage and transportation management
Automatic manufacturing systems 3D printers, CNC machines, robotics
Localization and distance measurement systems Radar devices, devices for distance determination, naviga-
tion devices, GPS
Sensor systems Sensor networks, mobile data acquisition devices
Artificial intelligence Machine learning
Augmented, virtual, and mixed reality Smart glasses
Speech interaction Voice control, software for speech-to-text conversion
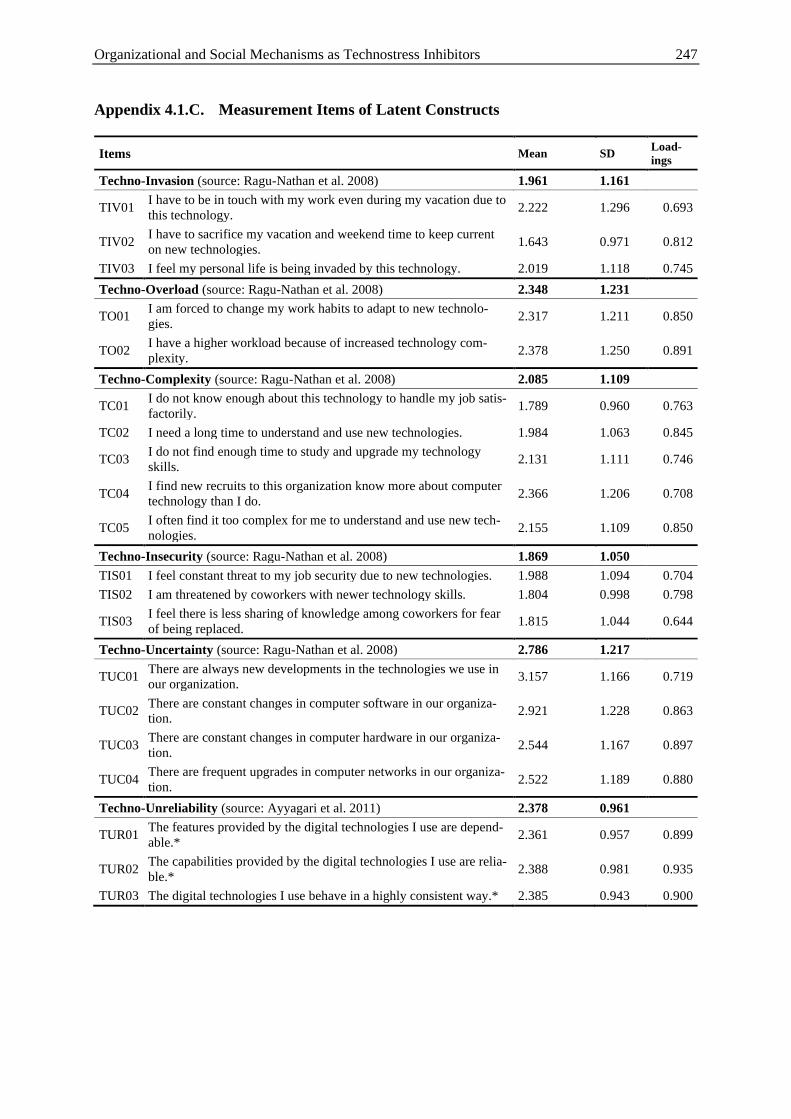
Organizational and Social Mechanisms as Technostress Inhibitors 247
Appendix 4.1.C. Measurement Items of Latent Constructs
Items Mean SD Load-
ings
Techno-Invasion (source: Ragu-Nathan et al. 2008) 1.961 1.161
TIV01 I have to be in touch with my work even during my vacation due to
this technology. 2.222 1.296 0.693
TIV02 I have to sacrifice my vacation and weekend time to keep current
on new technologies. 1.643 0.971 0.812
TIV03 I feel my personal life is being invaded by this technology. 2.019 1.118 0.745
Techno-Overload (source: Ragu-Nathan et al. 2008) 2.348 1.231
TO01 I am forced to change my work habits to adapt to new technolo-
gies. 2.317 1.211 0.850
TO02 I have a higher workload because of increased technology com-
plexity. 2.378 1.250 0.891
Techno-Complexity (source: Ragu-Nathan et al. 2008) 2.085 1.109
TC01 I do not know enough about this technology to handle my job satis-
factorily. 1.789 0.960 0.763
TC02 I need a long time to understand and use new technologies. 1.984 1.063 0.845
TC03 I do not find enough time to study and upgrade my technology
skills. 2.131 1.111 0.746
TC04 I find new recruits to this organization know more about computer
technology than I do. 2.366 1.206 0.708
TC05 I often find it too complex for me to understand and use new tech-
nologies. 2.155 1.109 0.850
Techno-Insecurity (source: Ragu-Nathan et al. 2008) 1.869 1.050
TIS01 I feel constant threat to my job security due to new technologies. 1.988 1.094 0.704
TIS02 I am threatened by coworkers with newer technology skills. 1.804 0.998 0.798
TIS03 I feel there is less sharing of knowledge among coworkers for fear
of being replaced. 1.815 1.044 0.644
Techno-Uncertainty (source: Ragu-Nathan et al. 2008) 2.786 1.217
TUC01 There are always new developments in the technologies we use in
our organization. 3.157 1.166 0.719
TUC02 There are constant changes in computer software in our organiza-
tion. 2.921 1.228 0.863
TUC03 There are constant changes in computer hardware in our organiza-
tion. 2.544 1.167 0.897
TUC04 There are frequent upgrades in computer networks in our organiza-
tion. 2.522 1.189 0.880
Techno-Unreliability (source: Ayyagari et al. 2011) 2.378 0.961
TUR01 The features provided by the digital technologies I use are depend-
able.* 2.361 0.957 0.899
TUR02 The capabilities provided by the digital technologies I use are relia-
ble.* 2.388 0.981 0.935
TUR03 The digital technologies I use behave in a highly consistent way.* 2.385 0.943 0.900
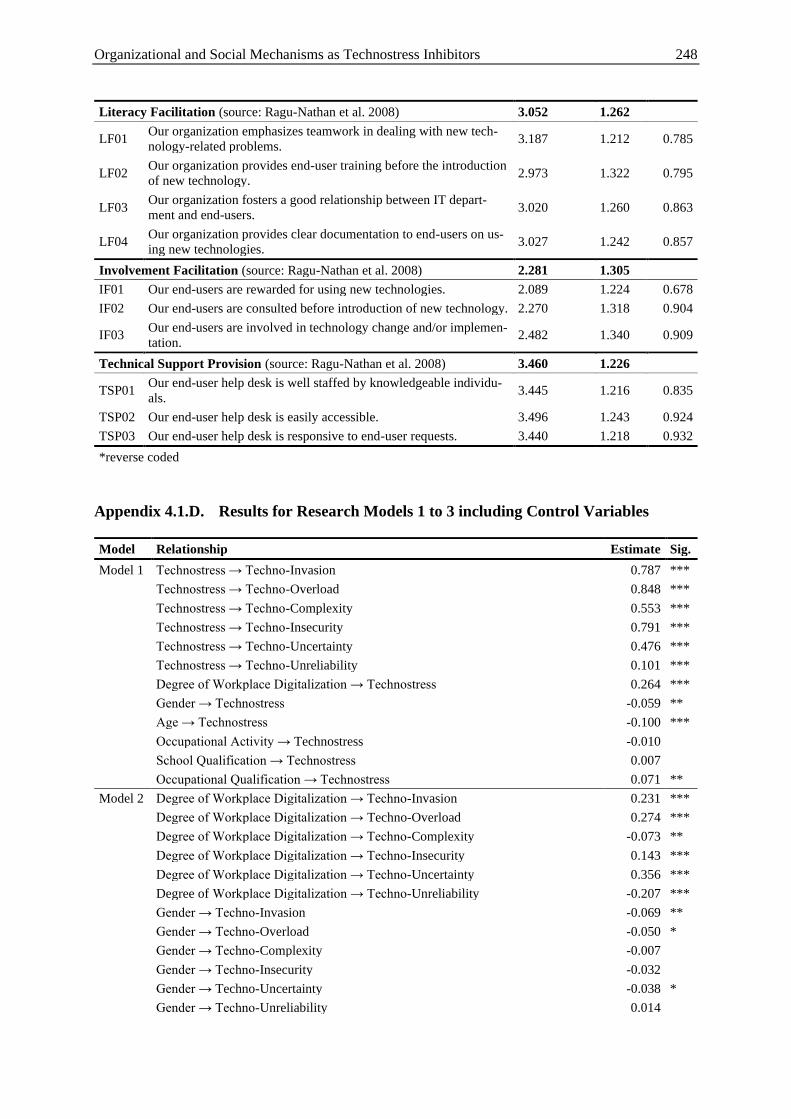
Organizational and Social Mechanisms as Technostress Inhibitors 248
Literacy Facilitation (source: Ragu-Nathan et al. 2008) 3.052 1.262
LF01 Our organization emphasizes teamwork in dealing with new tech-
nology-related problems. 3.187 1.212 0.785
LF02 Our organization provides end-user training before the introduction
of new technology. 2.973 1.322 0.795
LF03 Our organization fosters a good relationship between IT depart-
ment and end-users. 3.020 1.260 0.863
LF04 Our organization provides clear documentation to end-users on us-
ing new technologies. 3.027 1.242 0.857
Involvement Facilitation (source: Ragu-Nathan et al. 2008) 2.281 1.305
IF01 Our end-users are rewarded for using new technologies. 2.089 1.224 0.678
IF02 Our end-users are consulted before introduction of new technology. 2.270 1.318 0.904
IF03 Our end-users are involved in technology change and/or implemen-
tation. 2.482 1.340 0.909
Technical Support Provision (source: Ragu-Nathan et al. 2008) 3.460 1.226
TSP01 Our end-user help desk is well staffed by knowledgeable individu-
als. 3.445 1.216 0.835
TSP02 Our end-user help desk is easily accessible. 3.496 1.243 0.924
TSP03 Our end-user help desk is responsive to end-user requests. 3.440 1.218 0.932
*reverse coded
Appendix 4.1.D. Results for Research Models 1 to 3 including Control Variables
Model Relationship Estimate Sig.
Model 1 Technostress → Techno-Invasion 0.787 ***
Technostress → Techno-Overload 0.848 ***
Technostress → Techno-Complexity 0.553 ***
Technostress → Techno-Insecurity 0.791 ***
Technostress → Techno-Uncertainty 0.476 ***
Technostress → Techno-Unreliability 0.101 ***
Degree of Workplace Digitalization → Technostress 0.264 ***
Gender → Technostress -0.059 **
Age → Technostress -0.100 ***
Occupational Activity → Technostress -0.010
School Qualification → Technostress 0.007
Occupational Qualification → Technostress 0.071 **
Model 2 Degree of Workplace Digitalization → Techno-Invasion 0.231 ***
Degree of Workplace Digitalization → Techno-Overload 0.274 ***
Degree of Workplace Digitalization → Techno-Complexity -0.073 **
Degree of Workplace Digitalization → Techno-Insecurity 0.143 ***
Degree of Workplace Digitalization → Techno-Uncertainty 0.356 ***
Degree of Workplace Digitalization → Techno-Unreliability -0.207 ***
Gender → Techno-Invasion -0.069 **
Gender → Techno-Overload -0.050 *
Gender → Techno-Complexity -0.007
Gender → Techno-Insecurity -0.032
Gender → Techno-Uncertainty -0.038 *
Gender → Techno-Unreliability 0.014
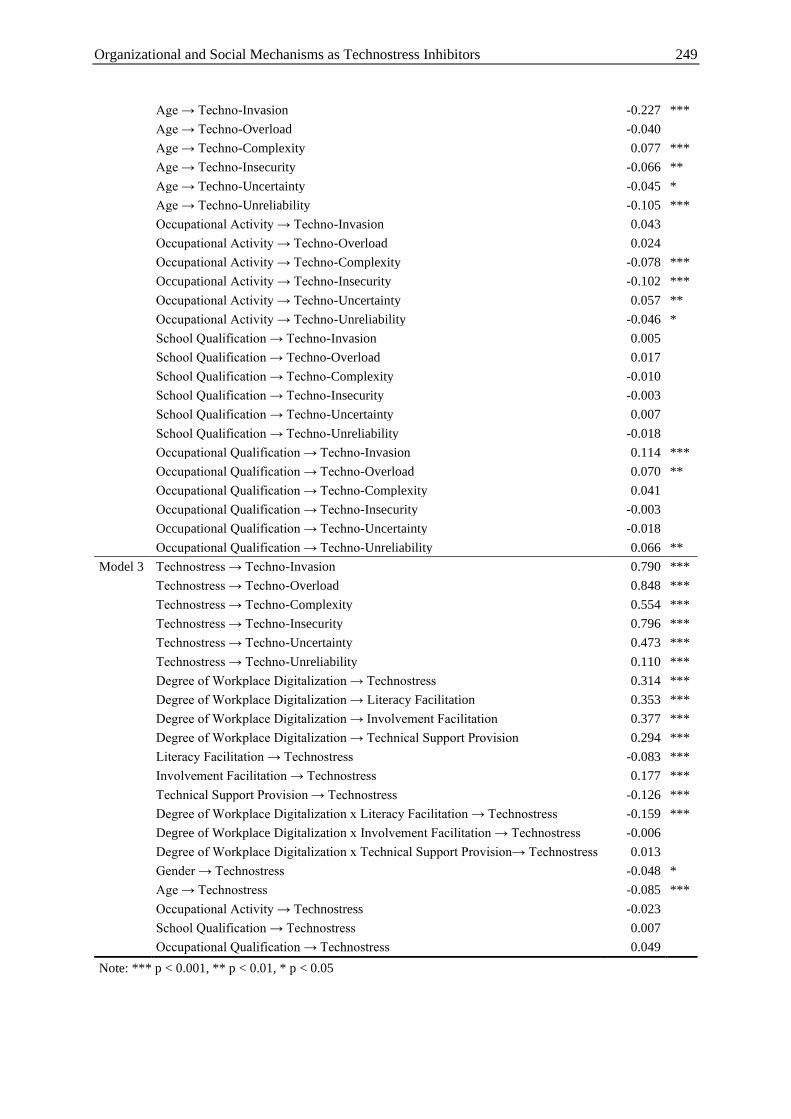
Organizational and Social Mechanisms as Technostress Inhibitors 249
Age → Techno-Invasion -0.227 ***
Age → Techno-Overload -0.040
Age → Techno-Complexity 0.077 ***
Age → Techno-Insecurity -0.066 **
Age → Techno-Uncertainty -0.045 *
Age → Techno-Unreliability -0.105 ***
Occupational Activity → Techno-Invasion 0.043
Occupational Activity → Techno-Overload 0.024
Occupational Activity → Techno-Complexity -0.078 ***
Occupational Activity → Techno-Insecurity -0.102 ***
Occupational Activity → Techno-Uncertainty 0.057 **
Occupational Activity → Techno-Unreliability -0.046 *
School Qualification → Techno-Invasion 0.005
School Qualification → Techno-Overload 0.017
School Qualification → Techno-Complexity -0.010
School Qualification → Techno-Insecurity -0.003
School Qualification → Techno-Uncertainty 0.007
School Qualification → Techno-Unreliability -0.018
Occupational Qualification → Techno-Invasion 0.114 ***
Occupational Qualification → Techno-Overload 0.070 **
Occupational Qualification → Techno-Complexity 0.041
Occupational Qualification → Techno-Insecurity -0.003
Occupational Qualification → Techno-Uncertainty -0.018
Occupational Qualification → Techno-Unreliability 0.066 **
Model 3 Technostress → Techno-Invasion 0.790 ***
Technostress → Techno-Overload 0.848 ***
Technostress → Techno-Complexity 0.554 ***
Technostress → Techno-Insecurity 0.796 ***
Technostress → Techno-Uncertainty 0.473 ***
Technostress → Techno-Unreliability 0.110 ***
Degree of Workplace Digitalization → Technostress 0.314 ***
Degree of Workplace Digitalization → Literacy Facilitation 0.353 ***
Degree of Workplace Digitalization → Involvement Facilitation 0.377 ***
Degree of Workplace Digitalization → Technical Support Provision 0.294 ***
Literacy Facilitation → Technostress -0.083 ***
Involvement Facilitation → Technostress 0.177 ***
Technical Support Provision → Technostress -0.126 ***
Degree of Workplace Digitalization x Literacy Facilitation → Technostress -0.159 ***
Degree of Workplace Digitalization x Involvement Facilitation → Technostress -0.006
Degree of Workplace Digitalization x Technical Support Provision→ Technostress 0.013
Gender → Technostress -0.048 *
Age → Technostress -0.085 ***
Occupational Activity → Technostress -0.023
School Qualification → Technostress 0.007
Occupational Qualification → Technostress 0.049
Note: *** p < 0.001, ** p < 0.01, * p < 0.05
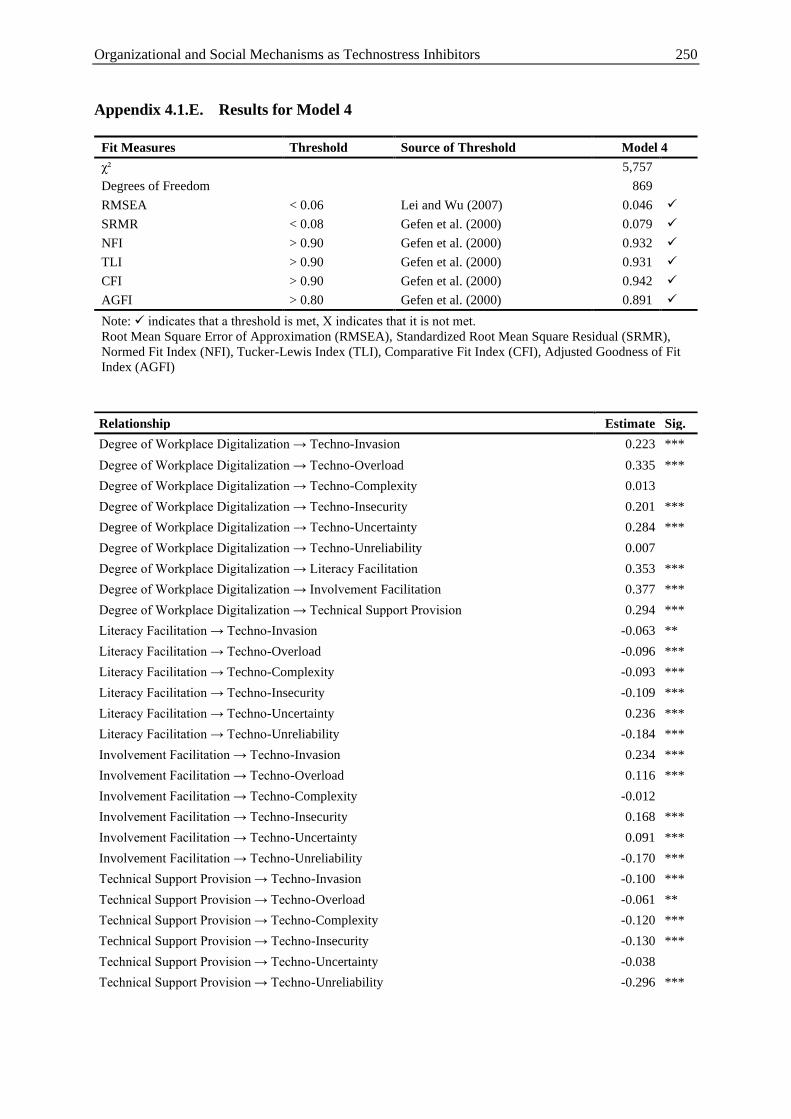
Organizational and Social Mechanisms as Technostress Inhibitors 250
Appendix 4.1.E. Results for Model 4
Fit Measures Threshold Source of Threshold Model 4
χ² 5,757
Degrees of Freedom 869
RMSEA < 0.06 Lei and Wu (2007) 0.046 ✓
SRMR < 0.08 Gefen et al. (2000) 0.079 ✓
NFI > 0.90 Gefen et al. (2000) 0.932 ✓
TLI > 0.90 Gefen et al. (2000) 0.931 ✓
CFI > 0.90 Gefen et al. (2000) 0.942 ✓
AGFI > 0.80 Gefen et al. (2000) 0.891 ✓
Note: ✓ indicates that a threshold is met, Χ indicates that it is not met.
Root Mean Square Error of Approximation (RMSEA), Standardized Root Mean Square Residual (SRMR),
Normed Fit Index (NFI), Tucker-Lewis Index (TLI), Comparative Fit Index (CFI), Adjusted Goodness of Fit
Index (AGFI)
Relationship Estimate Sig.
Degree of Workplace Digitalization → Techno-Invasion 0.223 ***
Degree of Workplace Digitalization → Techno-Overload 0.335 ***
Degree of Workplace Digitalization → Techno-Complexity 0.013
Degree of Workplace Digitalization → Techno-Insecurity 0.201 ***
Degree of Workplace Digitalization → Techno-Uncertainty 0.284 ***
Degree of Workplace Digitalization → Techno-Unreliability 0.007
Degree of Workplace Digitalization → Literacy Facilitation 0.353 ***
Degree of Workplace Digitalization → Involvement Facilitation 0.377 ***
Degree of Workplace Digitalization → Technical Support Provision 0.294 ***
Literacy Facilitation → Techno-Invasion -0.063 **
Literacy Facilitation → Techno-Overload -0.096 ***
Literacy Facilitation → Techno-Complexity -0.093 ***
Literacy Facilitation → Techno-Insecurity -0.109 ***
Literacy Facilitation → Techno-Uncertainty 0.236 ***
Literacy Facilitation → Techno-Unreliability -0.184 ***
Involvement Facilitation → Techno-Invasion 0.234 ***
Involvement Facilitation → Techno-Overload 0.116 ***
Involvement Facilitation → Techno-Complexity -0.012
Involvement Facilitation → Techno-Insecurity 0.168 ***
Involvement Facilitation → Techno-Uncertainty 0.091 ***
Involvement Facilitation → Techno-Unreliability -0.170 ***
Technical Support Provision → Techno-Invasion -0.100 ***
Technical Support Provision → Techno-Overload -0.061 **
Technical Support Provision → Techno-Complexity -0.120 ***
Technical Support Provision → Techno-Insecurity -0.130 ***
Technical Support Provision → Techno-Uncertainty -0.038
Technical Support Provision → Techno-Unreliability -0.296 ***
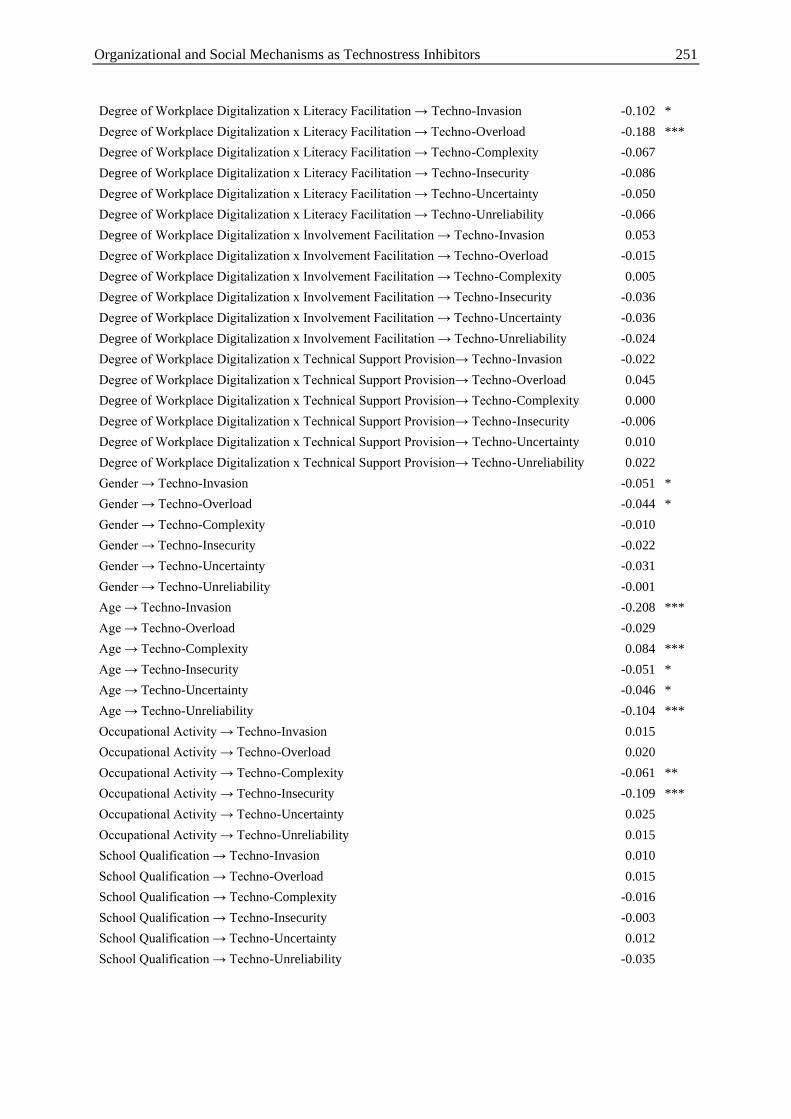
Organizational and Social Mechanisms as Technostress Inhibitors 251
Degree of Workplace Digitalization x Literacy Facilitation → Techno-Invasion -0.102 *
Degree of Workplace Digitalization x Literacy Facilitation → Techno-Overload -0.188 ***
Degree of Workplace Digitalization x Literacy Facilitation → Techno-Complexity -0.067
Degree of Workplace Digitalization x Literacy Facilitation → Techno-Insecurity -0.086
Degree of Workplace Digitalization x Literacy Facilitation → Techno-Uncertainty -0.050
Degree of Workplace Digitalization x Literacy Facilitation → Techno-Unreliability -0.066
Degree of Workplace Digitalization x Involvement Facilitation → Techno-Invasion 0.053
Degree of Workplace Digitalization x Involvement Facilitation → Techno-Overload -0.015
Degree of Workplace Digitalization x Involvement Facilitation → Techno-Complexity 0.005
Degree of Workplace Digitalization x Involvement Facilitation → Techno-Insecurity -0.036
Degree of Workplace Digitalization x Involvement Facilitation → Techno-Uncertainty -0.036
Degree of Workplace Digitalization x Involvement Facilitation → Techno-Unreliability -0.024
Degree of Workplace Digitalization x Technical Support Provision→ Techno-Invasion -0.022
Degree of Workplace Digitalization x Technical Support Provision→ Techno-Overload 0.045
Degree of Workplace Digitalization x Technical Support Provision→ Techno-Complexity 0.000
Degree of Workplace Digitalization x Technical Support Provision→ Techno-Insecurity -0.006
Degree of Workplace Digitalization x Technical Support Provision→ Techno-Uncertainty 0.010
Degree of Workplace Digitalization x Technical Support Provision→ Techno-Unreliability 0.022
Gender → Techno-Invasion -0.051 *
Gender → Techno-Overload -0.044 *
Gender → Techno-Complexity -0.010
Gender → Techno-Insecurity -0.022
Gender → Techno-Uncertainty -0.031
Gender → Techno-Unreliability -0.001
Age → Techno-Invasion -0.208 ***
Age → Techno-Overload -0.029
Age → Techno-Complexity 0.084 ***
Age → Techno-Insecurity -0.051 *
Age → Techno-Uncertainty -0.046 *
Age → Techno-Unreliability -0.104 ***
Occupational Activity → Techno-Invasion 0.015
Occupational Activity → Techno-Overload 0.020
Occupational Activity → Techno-Complexity -0.061 **
Occupational Activity → Techno-Insecurity -0.109 ***
Occupational Activity → Techno-Uncertainty 0.025
Occupational Activity → Techno-Unreliability 0.015
School Qualification → Techno-Invasion 0.010
School Qualification → Techno-Overload 0.015
School Qualification → Techno-Complexity -0.016
School Qualification → Techno-Insecurity -0.003
School Qualification → Techno-Uncertainty 0.012
School Qualification → Techno-Unreliability -0.035
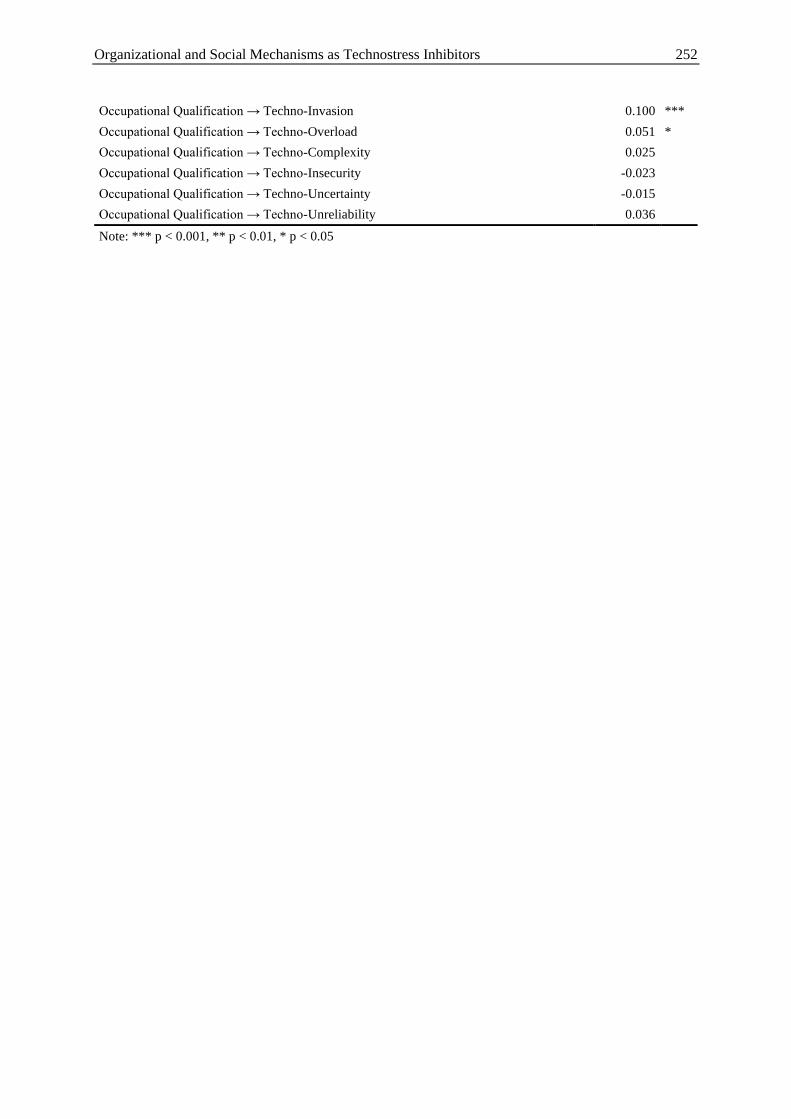
Organizational and Social Mechanisms as Technostress Inhibitors 252
Occupational Qualification → Techno-Invasion 0.100 ***
Occupational Qualification → Techno-Overload 0.051 *
Occupational Qualification → Techno-Complexity 0.025
Occupational Qualification → Techno-Insecurity -0.023
Occupational Qualification → Techno-Uncertainty -0.015
Occupational Qualification → Techno-Unreliability 0.036
Note: *** p < 0.001, ** p < 0.01, * p < 0.05
Organizational and Social Mechanisms as Technostress Inhibitors 253
4.2 Social Support as Technostress Inhibitor: Even More Important During
the COVID-19 Pandemic?
Abstract
Due to ongoing digitalization and the social distancing measures that came along with the
COVID-19 pandemic, the working conditions and environments have changed for many indi-
viduals. Because of increased telework, the use of digital technologies for communicating and
collaborating at work has been intensified which can cause technostress. With longitudinal data
from two surveys – one before and one during the COVID-19 pandemic – the paper analyzes
the relationship between four social support dimensions (supervisor support, co-worker sup-
port, sense of community at work, and family support) and technostress creators. The study
shows that social support can be an effective inhibitor of technostress creators. However, social
support dimensions have to be differentiated in that regard. Further, the results show that the
inhibiting effect of family support has become even more important during the COVID-19 pan-
demic. The results contribute to technostress research and research with regard to the new nor-
mal of working after the pandemic.
Keywords: Technostress, Technostress Inhibitors, Social Support, Longitudinal Data, Struc-
tural Equation Modeling
Author: Julia Lanzl (M. Sc.)
Status: Working paper.
Organizational and Social Mechanisms as Technostress Inhibitors 254
4.2.1 Introduction
The COVID-19 pandemic has changed the working conditions for many people. Due to the
social distancing measures in order to fight the pandemic, many employees were asked to en-
gage in telework and work from home. In July 2020, one third of employees in the European
Union worked entirely from home, almost 50 % at least partly (Ahrendt et al. 2020). This led
to a higher amount of digital work and less contact with co-workers. On the other hand, contact
with family members increased since many of them were working from home together.
One phenomenon that goes along with digital work is technostress, which refers to “stress that
users experience as a result of their use of IS in the organizational context” (Tarafdar et al.
2015, p. 103). Technostress is associated with lower job satisfaction, productivity, and a higher
risk of burnout (e.g., Day et al. 2012; Ragu-Nathan et al. 2008; Tu et al. 2008). To address such
negative outcomes, literature on technostress has investigated potential mitigation strategies.
While coping literature deals with behavioral, cognitive, and perceptional efforts of individuals
(Weinert et al. 2020), literature on technostress inhibitors focuses on organizational or environ-
mental mechanisms that reduce technostress creators or its negative consequences (Ragu-
Nathan et al. 2008). Such inhibitors are, for example, the fostering of learning to deal with
digital technologies, the provision of technical support, or the involvement of employees when
launching new digital technologies (Ragu-Nathan et al. 2008).
However, organizational measures have been less available in times of the COVID-19 pan-
demic. Many companies, for example, introduced communication and collaboration tools al-
most over night in order to be able to stay connected and, thus, were not able to involve em-
ployees in this change. But, according to results from Ahrendt et al. (2020), the provision of
help and social support from supervisors or co-workers did not change during telework.
In psychology research, social support has been considered as inhibitor of workplace stress
(e.g., Barrera 1986; Eisenberger et al. 2002; Sass et al. 2011). There are different sources of
social support (e.g., supervisors, co-workers, family members) (Barrera 1986). To the best of
our knowledge, technostress research has not yet considered such variables as technostress in-
hibitors. Thus, we aim to understand whether social support can inhibit technostress and its
importance during times of high telework and pose the following research questions:
RQ1: Are different dimensions of social support effective technostress inhibitors?
RQ2: Is social support as technostress inhibitor more important during the COVID-19
pandemic?
Organizational and Social Mechanisms as Technostress Inhibitors 255
To answer these questions, we draw on literature from psychology on the effect of social sup-
port on stress creators and outcomes and develop hypotheses on the association of different
social support dimensions (supervisor support, co-worker support, sense of community at work,
and family support) with technostress creators (techno-invasion, techno-overload, techno-com-
plexity, techno-insecurity, and techno-uncertainty) as well as the changes in times of telework.
We collect longitudinal empirical data on the constructs at two points of time (i.e., before and
during the COVID-19 pandemic) and analyze the data by structural equation modeling and
regression analysis with interaction effects.
The paper is structured as follows: Section 4.2.2 introduces the theoretical background on tech-
nostress literature, technostress inhibitors, and other stress mitigation constructs from psychol-
ogy literature. Section 4.2.3 develops the hypotheses. Section 4.2.4 describes the study design
and procedures and Section 4.2.5 displays the corresponding results. Section 4.2.6 discusses the
results as well as the theoretical contribution and practical implications of the findings. Finally,
Section 4.2.7 concludes the paper.
4.2.2 Theoretical Background
Studies on technostress can be traced back to the clinical psychologist Brod (1982), who coined
the term and described the phenomenon as an individual’s inability to deal with new technology
in a healthy way, which leads to a stressful experience. In psychology literature, Lazarus and
Folkman (1984, p. 19) define stress as a “particular relationship between the person and the
environment that is appraised by the person as taxing or exceeding his or her resources and
endangering his or her well-being.” For technostress, the demands result from the use of digital
technologies. Tarafdar et al. (2007) and Ragu-Nathan et al. (2008) have defined five tech-
nostress creators which, to date, are the most established and researched technostress creators
in IS literature: techno-invasion, techno-overload, techno-complexity, techno-insecurity, and
techno-uncertainty. Techno-invasion refers to the feeling of blurring boundaries between pri-
vate and business lives and the need to be constantly available. Techno-overload describes the
feeling of having to work faster and longer. Techno-complexity is the feeling of having inade-
quate skills to deal with digital technologies. Techno-insecurity refers to the fear of losing ones
job due to automation or a lack of skills for dealing with digital technologies. Lastly, techno-
uncertainty describes the experience of constant changes and updates of digital technologies
and the need for constant learning (Ragu-Nathan et al. 2008).
Organizational and Social Mechanisms as Technostress Inhibitors 256
Since technostress has been found to have negative effects on individuals and organizations
such as reduced job satisfaction, increased burnout, or lower organizational commitment
(e.g., Day et al. 2012; Ragu-Nathan et al. 2008; Tarafdar et al. 2007), much research focuses on
the mitigation of technostress. Thereby, literature can be divided in two streams: technostress
inhibitors and coping. Technostress inhibitors refer to “organizational mechanisms that have
the potential to reduce the effects of technostress” (Ragu-Nathan et al. 2008, p. 422). Coping,
in contrast, focuses on the individual perspective and “investigates how users themselves aim
to reduce technostress by deploying behavioral, cognitive, and perceptional efforts” (Weinert
et al. 2020, p. 1203). In our study, we focus on mechanisms from the individual’s environment
and, thus, draw on literature of technostress inhibitors.
Several studies can be found that investigate the effect of technostress inhibitors (e.g., Day et
al. 2012; Ragu-Nathan et al. 2008; Tarafdar et al. 2010). While some studies investigate the
effect on technostress creators, some focus on the direct effect on technostress outcomes, and
some analyze the moderating effect between technostress creators and outcomes (Sarabadani et
al. 2018). The most studied technostress inhibitors are three organizational mechanisms: liter-
acy facilitation (i.e., promoting the sharing of knowledge on digital technologies), involvement
facilitation (i.e., involving employees in the change process when introducing new digital tech-
nologies), and technical support provision (i.e., the provision of an adequate end-user support
for problems with digital technologies). Tarafdar et al. (2015), for example, find them to be
negatively associated with technostress creators. Direct negative effects on technostress crea-
tors have also been found by Tarafdar et al. (2010) (for involvement facilitation) and Tarafdar
et al. (2011) (for involvement facilitation, technical support provision, and innovation support).
For the direct effects on technostress outcomes, the three inhibitors and other inhibitors such as
innovation support, stress management trainings, and job control have been found to have a
positive effect on, for example, end-user satisfaction, job satisfaction, organizational commit-
ment, continuance commitment, and productivity (Ahmad et al. 2014; Fuglseth and Sørebø
2014; Ragu-Nathan et al. 2008; Tarafdar et al. 2010; Tarafdar et al. 2011; Tu et al. 2008) and a
negative effect on ICT stress, strain, or burnout (Day et al. 2012). Regarding the moderating
effect of technostress inhibitors on the relationship between technostress creators and outcomes,
Ahmad et al. (2014), for example, find technical support to moderate the relationship between
techno-overload and organizational commitment. Other studies such as Ragu-Nathan et al.
(2008), Tu et al. (2008), and Hung et al. (2011) do not find moderating effects of technostress
inhibitors.
Organizational and Social Mechanisms as Technostress Inhibitors 257
In psychology literature, different dimensions of social support and their relationship with dif-
ferent types of stress and strain have been researched (Barrera 1986). One important dimension
is perceived social support, that refers to the “perceived availability and adequacy of supportive
ties” (Barrera 1986, p. 416). Another dimension of social support is social embeddedness,
which “refers to the connections that individuals have to significant others in their social envi-
ronments” (Barrera 1986, p. 415). There are many studies that investigate perceived social sup-
port and social embeddedness and their relationship with stress in the organizational context.
Witt and Carlson (2006, p. 347), for example, investigated perceived organizational support
and define it as “the employee’s assessment of the extent to which the organization is ‘on my
side’.” Organizational support (i.e., social support from various sources in the organization) has
been found to be associated with increased satisfaction, job performance, and continuance com-
mitment (Eisenberger et al. 1990; Patrick and Laschinger 2006). More specific than organiza-
tional support in general, support for individuals at their workplaces can stem from different
groups of people of an individual’s environment: supervisors, colleagues, and family members
(e.g., Mansour and Tremblay 2016; Sass et al. 2011; Wolgast and Fischer 2017).
According to Barrera (1986), social support can relate to stress and stress outcomes in different
ways: by directly affecting the occurrence of stress events, perceived stress, or stress outcomes.
This is along the lines with prior literature on technostress inhibitors (Sarabadani et al. 2018).
Technostress literature has mostly neglected dimensions of social support and their possible
consideration as technostress-inhibitors. To close this gap, we aim to transfer knowledge on
social support and sense of community from psychology literature to the context of technostress
and analyze their effect on technostress creators. Thereby, we especially want to understand
whether the importance of social support and sense of community has changed in times of high
telework (i.e., during the COVID-19 pandemic).
4.2.3 Hypotheses Development
According to Lazarus and Folkman (1984), stress is the result of an interplay of environmental
demands and the individual’s resources. This is in line with related psychology theories like the
conservation of resources theory (Hobfoll 1989) or the job demands-resources model
(Demerouti et al. 2001). Thereby, social support is considered as one important resource for
inhibiting stress creators (Barrera 1986).
We aim to understand the relationship of different dimensions of social support with tech-
nostress creators. Therefore, we investigate four dimensions of social support: supervisor
Organizational and Social Mechanisms as Technostress Inhibitors 258
support, co-worker support, sense of community at work, and family support. The first three of
them refers to the “perceived social support” dimension and the last one refers to the “social
embeddedness” dimension of Barrera (1986).
Supervisor support is the “degree to which supervisors value their [employees’] contributions
and care about their well-being” (Eisenberger et al. 2002, p. 565). Sass et al. (2011) found su-
pervisor support to be negatively associated with workload stressors and job dissatisfaction.
Sosik and Godshalk’s (2000) results show lower job stress of employees when their leaders
engage in a mentoring function. Co-worker support refers to a “cooperative peer-level effort
amongst employees to provide work-related assistance” (Jia et al. 2008, p. 307). Sass et al.
(2011) as well as Wolgast and Fischer (2017) detected negative effects of co-worker support
on job dissatisfaction and strain. McCarty et al. (2007) discovered a negative effect of camara-
derie on work-related strain. Family support is defined as the “degree of […] support [from
family members] employees perceive as directed at their roles as worker” (King et al. 1995,
p. 236). Barnett et al. (2012) as well as Mansour and Tremblay (2016) found it to be negatively
associated with job strain and Asbari et al. (2021) found a positive effect on job satisfaction.
Lastly, sense of community refers to “the overall quality of social interaction at work” (Leiter
and Maslach 2003, p. 98). Cicognani et al. (2009) found a negative correlation between sense
of community and burnout. In the same regard, Gascón et al. (2021) detected negative effects
on burnout. They also found sense of community to negatively moderate the relationship be-
tween workload and cynicism and lack of job fulfillment (Gascón et al. 2021).
In line with these findings, we propose a negative relationship of social support (i.e., supervisor
support, co-worker support, sense of community at work, and family support) with technostress
creators. The reasons are as follows: Higher social support from supervisors, co-workers, and
family members gives employees the feeling that they can expect help when having problems
with digital technologies and, thus, feel less threatened in the first place. For supervisor support,
for example, it is easier for an employee to talk to their supervisors about their fear of losing
the job (i.e., techno-insecurity) if the supervisor is concerned with the employee’s needs. Also,
they can more easily take precautions in the task portfolio of the employee so that the feeling
of having to much to do (i.e., techno-overload) will not occur.
To sum it up, we pose the following hypothesis:
H1: Social support dimensions (a) supervisor support, b) co-worker support, c) sense
of community at work, and d) family support) are negatively related with technostress
creators.
Organizational and Social Mechanisms as Technostress Inhibitors 259
During the COVID-19 pandemic, many employees were forced to telework and work from
home. Thus, their working environment and the availability of organizational resources
changed rapidly. Whereas, before the pandemic, many employees worked in the organization’s
office and were surrounded by their co-workers and supervisors, they now worked from home
or in less frequented offices. Because of rapidly introduced new digital technologies for being
able to stay in contact with co-workers and supervisors, traditional technostress inhibitors such
as involvement facilitation were less available. Therefore, not only demands changed but em-
ployees had to adapt to the new environmental conditions and find effective and available
sources of support. Thus, we hypothesize:
H2: The negative relationship between social support and technostress creators is
stronger during the COVID-19 pandemic.
4.2.4 Study Design and Procedures
To test our hypotheses empirically, we conducted a longitudinal online survey and measured
all constructs from the research model in the questionnaire. For technostress creators, we used
the items from Ragu-Nathan et al. (2008). For supervisor support and family support, we built
on the scale by Graen and Uhl-Bien (1995). Items for co-worker support and sense of commu-
nity at work were collected from Burr et al. (2019). Where possible, we used validated German
translations of the items. For all other items, we translated the English versions to German.
Appendix 4.2.A provides an overview of all items.
We recruited participants via a German panel provider. Respondents were paid a small com-
pensation for their participation. The first survey was conducted in March 2019 (T1). In De-
cember 2020, during the second lockdown in Germany, we surveyed the same participants for
the second time (T2).
4.2.5 Results
637 participants completed the survey in both iterations. Of the respondents, 41.1 % were fe-
male and 58.9 % were male. On average, respondents were 47 years old at the first time of
participation.
Our analysis strategy was threefold: First, we conducted paired t-tests in order to compare the
variables at the two points in time (T1 and T2). Second, we assessed two structural equation
models at the two points of time through covariance-based structural equation modeling (CB-
SEM). Each of the models consisted of the five technostress creators as dependent variables
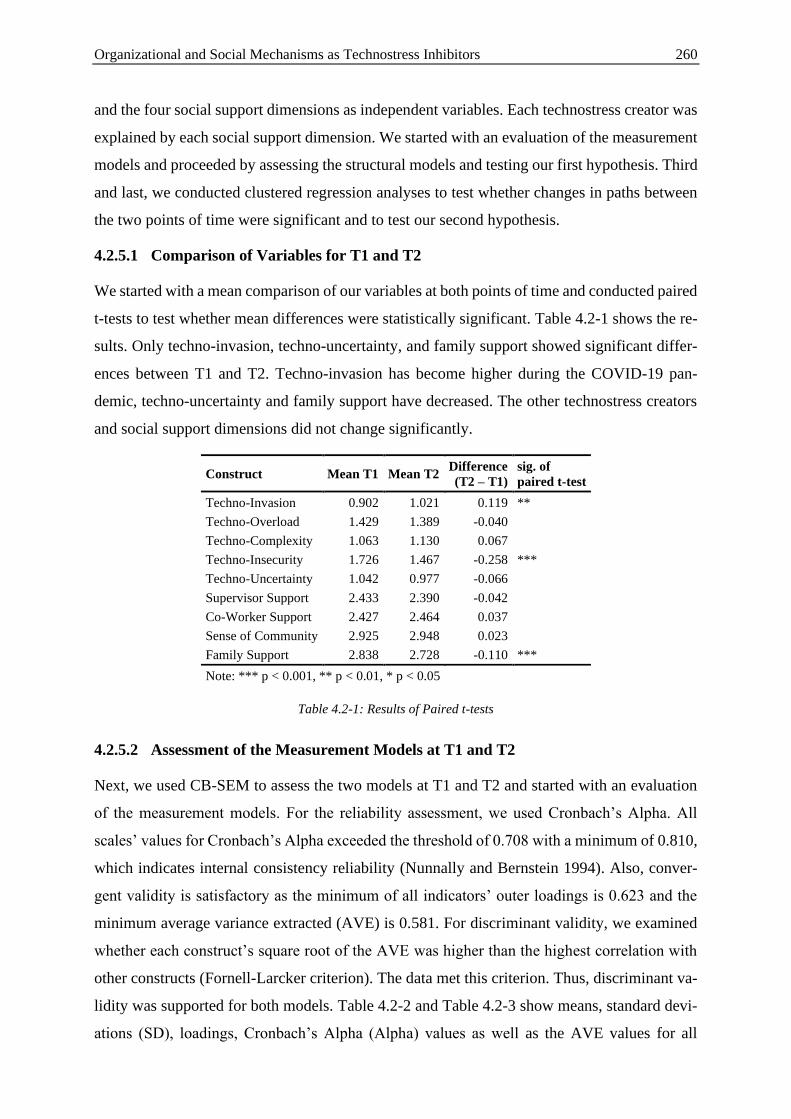
Organizational and Social Mechanisms as Technostress Inhibitors 260
and the four social support dimensions as independent variables. Each technostress creator was
explained by each social support dimension. We started with an evaluation of the measurement
models and proceeded by assessing the structural models and testing our first hypothesis. Third
and last, we conducted clustered regression analyses to test whether changes in paths between
the two points of time were significant and to test our second hypothesis.
4.2.5.1 Comparison of Variables for T1 and T2
We started with a mean comparison of our variables at both points of time and conducted paired
t-tests to test whether mean differences were statistically significant. Table 4.2-1 shows the re-
sults. Only techno-invasion, techno-uncertainty, and family support showed significant differ-
ences between T1 and T2. Techno-invasion has become higher during the COVID-19 pan-
demic, techno-uncertainty and family support have decreased. The other technostress creators
and social support dimensions did not change significantly.
Construct Mean T1 Mean T2 Difference
(T2 – T1)
sig. of
paired t-test
Techno-Invasion 0.902 1.021 0.119 **
Techno-Overload 1.429 1.389 -0.040
Techno-Complexity 1.063 1.130 0.067
Techno-Insecurity 1.726 1.467 -0.258 ***
Techno-Uncertainty 1.042 0.977 -0.066
Supervisor Support 2.433 2.390 -0.042
Co-Worker Support 2.427 2.464 0.037
Sense of Community 2.925 2.948 0.023
Family Support 2.838 2.728 -0.110 ***
Note: *** p < 0.001, ** p < 0.01, * p < 0.05
Table 4.2-1: Results of Paired t-tests
4.2.5.2 Assessment of the Measurement Models at T1 and T2
Next, we used CB-SEM to assess the two models at T1 and T2 and started with an evaluation
of the measurement models. For the reliability assessment, we used Cronbach’s Alpha. All
scales’ values for Cronbach’s Alpha exceeded the threshold of 0.708 with a minimum of 0.810,
which indicates internal consistency reliability (Nunnally and Bernstein 1994). Also, conver-
gent validity is satisfactory as the minimum of all indicators’ outer loadings is 0.623 and the
minimum average variance extracted (AVE) is 0.581. For discriminant validity, we examined
whether each construct’s square root of the AVE was higher than the highest correlation with
other constructs (Fornell-Larcker criterion). The data met this criterion. Thus, discriminant va-
lidity was supported for both models. Table 4.2-2 and Table 4.2-3 show means, standard devi-
ations (SD), loadings, Cronbach’s Alpha (Alpha) values as well as the AVE values for all
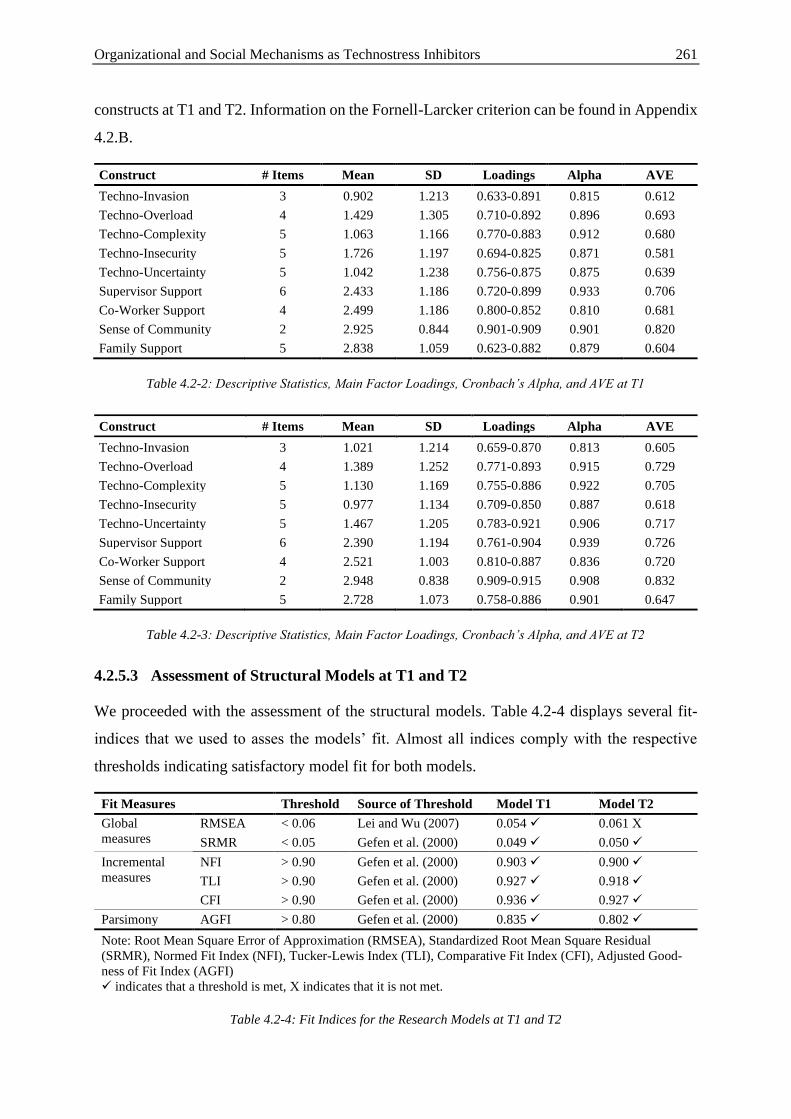
Organizational and Social Mechanisms as Technostress Inhibitors 261
constructs at T1 and T2. Information on the Fornell-Larcker criterion can be found in Appendix
4.2.B.
Construct # Items Mean SD Loadings Alpha AVE
Techno-Invasion 3 0.902 1.213 0.633-0.891 0.815 0.612
Techno-Overload 4 1.429 1.305 0.710-0.892 0.896 0.693
Techno-Complexity 5 1.063 1.166 0.770-0.883 0.912 0.680
Techno-Insecurity 5 1.726 1.197 0.694-0.825 0.871 0.581
Techno-Uncertainty 5 1.042 1.238 0.756-0.875 0.875 0.639
Supervisor Support 6 2.433 1.186 0.720-0.899 0.933 0.706
Co-Worker Support 4 2.499 1.186 0.800-0.852 0.810 0.681
Sense of Community 2 2.925 0.844 0.901-0.909 0.901 0.820
Family Support 5 2.838 1.059 0.623-0.882 0.879 0.604
Table 4.2-2: Descriptive Statistics, Main Factor Loadings, Cronbach’s Alpha, and AVE at T1
Construct # Items Mean SD Loadings Alpha AVE
Techno-Invasion 3 1.021 1.214 0.659-0.870 0.813 0.605
Techno-Overload 4 1.389 1.252 0.771-0.893 0.915 0.729
Techno-Complexity 5 1.130 1.169 0.755-0.886 0.922 0.705
Techno-Insecurity 5 0.977 1.134 0.709-0.850 0.887 0.618
Techno-Uncertainty 5 1.467 1.205 0.783-0.921 0.906 0.717
Supervisor Support 6 2.390 1.194 0.761-0.904 0.939 0.726
Co-Worker Support 4 2.521 1.003 0.810-0.887 0.836 0.720
Sense of Community 2 2.948 0.838 0.909-0.915 0.908 0.832
Family Support 5 2.728 1.073 0.758-0.886 0.901 0.647
Table 4.2-3: Descriptive Statistics, Main Factor Loadings, Cronbach’s Alpha, and AVE at T2
4.2.5.3 Assessment of Structural Models at T1 and T2
We proceeded with the assessment of the structural models. Table 4.2-4 displays several fit-
indices that we used to asses the models’ fit. Almost all indices comply with the respective
thresholds indicating satisfactory model fit for both models.
Fit Measures Threshold Source of Threshold Model T1 Model T2
Global
measures
RMSEA < 0.06 Lei and Wu (2007) 0.054 ✓ 0.061 Χ
SRMR < 0.05 Gefen et al. (2000) 0.049 ✓ 0.050 ✓
Incremental
measures
NFI > 0.90 Gefen et al. (2000) 0.903 ✓ 0.900 ✓
TLI > 0.90 Gefen et al. (2000) 0.927 ✓ 0.918 ✓
CFI > 0.90 Gefen et al. (2000) 0.936 ✓ 0.927 ✓
Parsimony AGFI > 0.80 Gefen et al. (2000) 0.835 ✓ 0.802 ✓
Note: Root Mean Square Error of Approximation (RMSEA), Standardized Root Mean Square Residual
(SRMR), Normed Fit Index (NFI), Tucker-Lewis Index (TLI), Comparative Fit Index (CFI), Adjusted Good-
ness of Fit Index (AGFI)
✓ indicates that a threshold is met, Χ indicates that it is not met.
Table 4.2-4: Fit Indices for the Research Models at T1 and T2
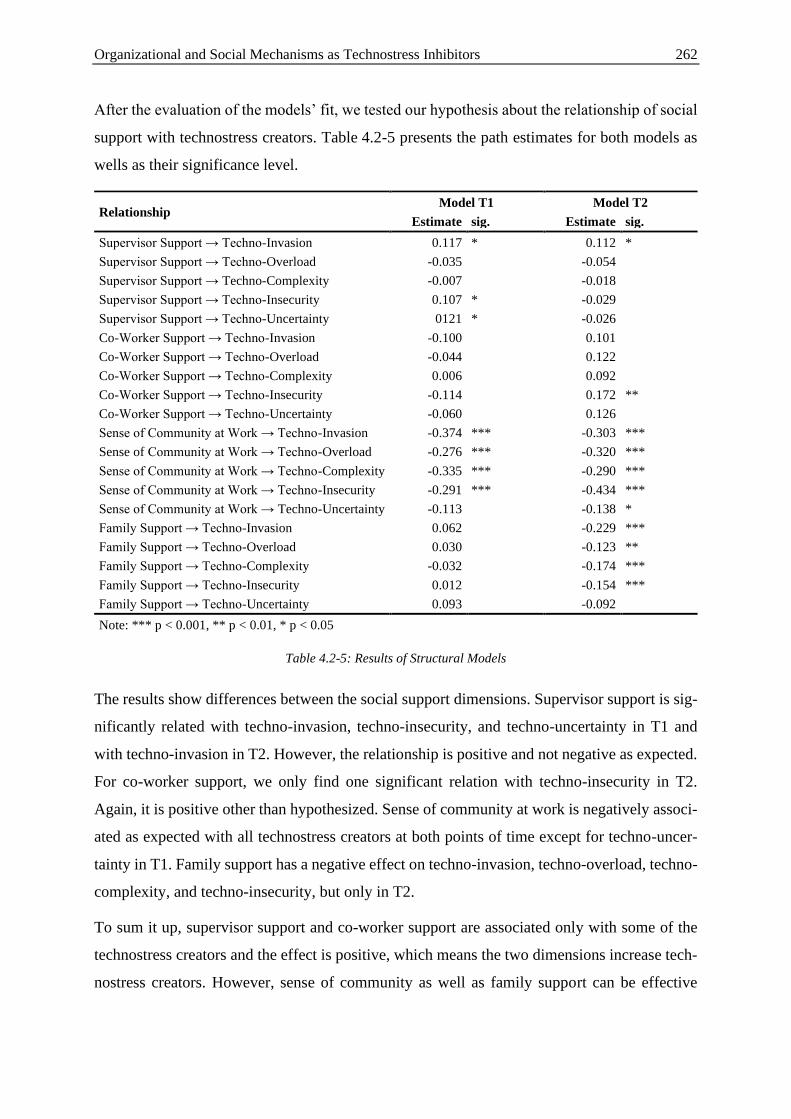
Organizational and Social Mechanisms as Technostress Inhibitors 262
After the evaluation of the models’ fit, we tested our hypothesis about the relationship of social
support with technostress creators. Table 4.2-5 presents the path estimates for both models as
wells as their significance level.
Relationship Model T1 Model T2
Estimate sig. Estimate sig.
Supervisor Support → Techno-Invasion 0.117 * 0.112 *
Supervisor Support → Techno-Overload -0.035 -0.054
Supervisor Support → Techno-Complexity -0.007 -0.018
Supervisor Support → Techno-Insecurity 0.107 * -0.029
Supervisor Support → Techno-Uncertainty 0121 * -0.026
Co-Worker Support → Techno-Invasion -0.100 0.101
Co-Worker Support → Techno-Overload -0.044 0.122
Co-Worker Support → Techno-Complexity 0.006 0.092
Co-Worker Support → Techno-Insecurity -0.114 0.172 **
Co-Worker Support → Techno-Uncertainty -0.060 0.126
Sense of Community at Work → Techno-Invasion -0.374 *** -0.303 ***
Sense of Community at Work → Techno-Overload -0.276 *** -0.320 ***
Sense of Community at Work → Techno-Complexity -0.335 *** -0.290 ***
Sense of Community at Work → Techno-Insecurity -0.291 *** -0.434 ***
Sense of Community at Work → Techno-Uncertainty -0.113 -0.138 *
Family Support → Techno-Invasion 0.062 -0.229 ***
Family Support → Techno-Overload 0.030 -0.123 **
Family Support → Techno-Complexity -0.032 -0.174 ***
Family Support → Techno-Insecurity 0.012 -0.154 ***
Family Support → Techno-Uncertainty 0.093 -0.092
Note: *** p < 0.001, ** p < 0.01, * p < 0.05
Table 4.2-5: Results of Structural Models
The results show differences between the social support dimensions. Supervisor support is sig-
nificantly related with techno-invasion, techno-insecurity, and techno-uncertainty in T1 and
with techno-invasion in T2. However, the relationship is positive and not negative as expected.
For co-worker support, we only find one significant relation with techno-insecurity in T2.
Again, it is positive other than hypothesized. Sense of community at work is negatively associ-
ated as expected with all technostress creators at both points of time except for techno-uncer-
tainty in T1. Family support has a negative effect on techno-invasion, techno-overload, techno-
complexity, and techno-insecurity, but only in T2.
To sum it up, supervisor support and co-worker support are associated only with some of the
technostress creators and the effect is positive, which means the two dimensions increase tech-
nostress creators. However, sense of community as well as family support can be effective
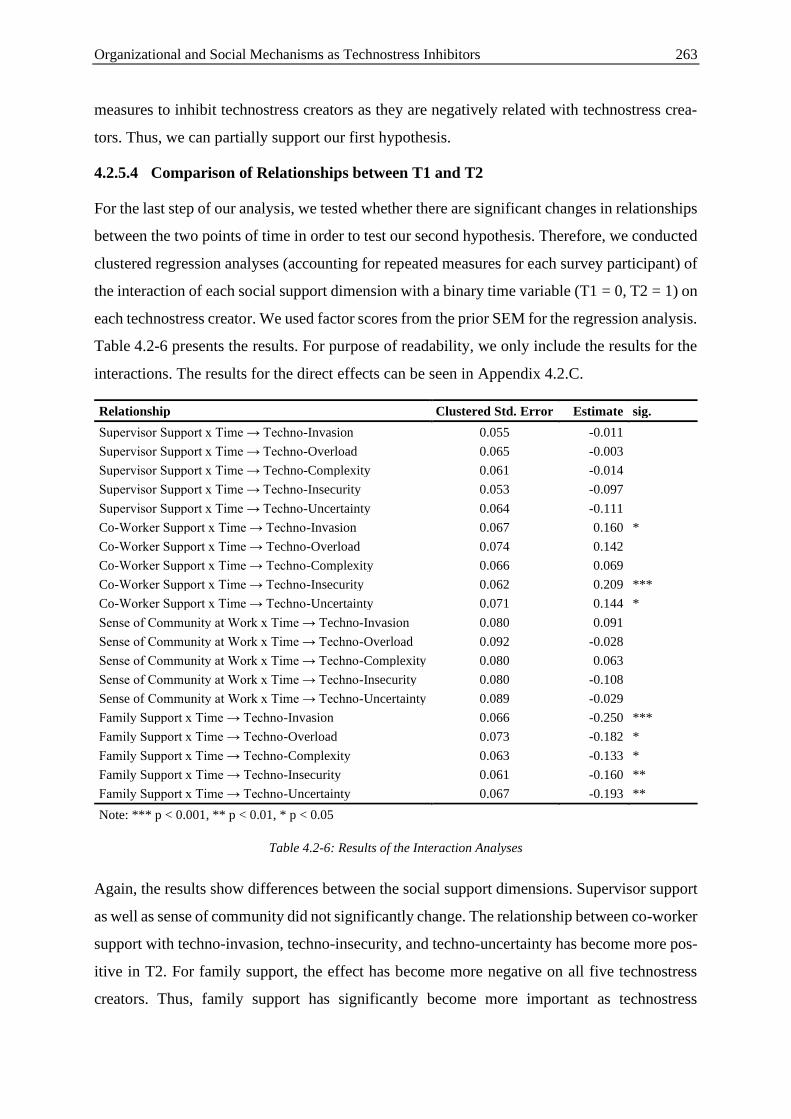
Organizational and Social Mechanisms as Technostress Inhibitors 263
measures to inhibit technostress creators as they are negatively related with technostress crea-
tors. Thus, we can partially support our first hypothesis.
4.2.5.4 Comparison of Relationships between T1 and T2
For the last step of our analysis, we tested whether there are significant changes in relationships
between the two points of time in order to test our second hypothesis. Therefore, we conducted
clustered regression analyses (accounting for repeated measures for each survey participant) of
the interaction of each social support dimension with a binary time variable (T1 = 0, T2 = 1) on
each technostress creator. We used factor scores from the prior SEM for the regression analysis.
Table 4.2-6 presents the results. For purpose of readability, we only include the results for the
interactions. The results for the direct effects can be seen in Appendix 4.2.C.
Relationship Clustered Std. Error Estimate sig.
Supervisor Support x Time → Techno-Invasion 0.055 -0.011
Supervisor Support x Time → Techno-Overload 0.065 -0.003
Supervisor Support x Time → Techno-Complexity 0.061 -0.014
Supervisor Support x Time → Techno-Insecurity 0.053 -0.097
Supervisor Support x Time → Techno-Uncertainty 0.064 -0.111
Co-Worker Support x Time → Techno-Invasion 0.067 0.160 *
Co-Worker Support x Time → Techno-Overload 0.074 0.142
Co-Worker Support x Time → Techno-Complexity 0.066 0.069
Co-Worker Support x Time → Techno-Insecurity 0.062 0.209 ***
Co-Worker Support x Time → Techno-Uncertainty 0.071 0.144 *
Sense of Community at Work x Time → Techno-Invasion 0.080 0.091
Sense of Community at Work x Time → Techno-Overload 0.092 -0.028
Sense of Community at Work x Time → Techno-Complexity 0.080 0.063
Sense of Community at Work x Time → Techno-Insecurity 0.080 -0.108
Sense of Community at Work x Time → Techno-Uncertainty 0.089 -0.029
Family Support x Time → Techno-Invasion 0.066 -0.250 ***
Family Support x Time → Techno-Overload 0.073 -0.182 *
Family Support x Time → Techno-Complexity 0.063 -0.133 *
Family Support x Time → Techno-Insecurity 0.061 -0.160 **
Family Support x Time → Techno-Uncertainty 0.067 -0.193 **
Note: *** p < 0.001, ** p < 0.01, * p < 0.05
Table 4.2-6: Results of the Interaction Analyses
Again, the results show differences between the social support dimensions. Supervisor support
as well as sense of community did not significantly change. The relationship between co-worker
support with techno-invasion, techno-insecurity, and techno-uncertainty has become more pos-
itive in T2. For family support, the effect has become more negative on all five technostress
creators. Thus, family support has significantly become more important as technostress
Organizational and Social Mechanisms as Technostress Inhibitors 264
inhibitor in T2 in comparison to T1. This is in line with H2. Thus, we also find partial support
for our second hypothesis.
4.2.6 Discussion
The presented research was motivated in two ways: First, technostress research has increasingly
investigated possible mitigation of technostress via individual coping or organizational mecha-
nisms. However, social support as technostress inhibitor has been mostly neglected so far even
though it is an inhibitor of stress in general and our results show that it is also an inhibitor of
technostress. Second, the COVID-19 pandemic has changed the working environment for many
employees and increased their amount of telework. In this changed environment, organizational
measures such as technical support cannot take the same effect as during times of high physical
presence in the organizational offices and, thus, individuals had to find other sources of support.
Our results shed light on the effect of social support to inhibit technostress. Thereby, it is im-
portant to notice that the amount of supervisor support, co-worker support as well as sense of
community at work did not significantly change before and during the pandemic. Thus, the
results are not influenced by the availability of each source of support but may be due to other
changed conditions during the pandemic.
We find that sense of community at work is an effective technostress inhibitor and is negatively
associated with technostress creators before and during the pandemic. Supervisor support, how-
ever, cannot be confirmed as technostress inhibitor as it even increases techno-invasion, techno-
insecurity, and techno-uncertainty. This means that a good relationship with the supervisor in-
creases the perception of these technostress creators. This is in contrast to prior findings on the
effect of supervisor support on work stress (e.g., Sass et al. 2011). For techno-invasion, the
reason might be that if an employee has a close relationship with his or her supervisor, they are
more willing to be reachable during non-work hours when this appears important to the super-
visor. For techno-insecurity and techno-uncertainty, the explanation for this positive relation-
ship is less intuitive and needs further investigation. The same is the case for the discovered
positive relationship between co-worker support and techno-insecurity during the pandemic.
Apart from that relationship, co-worker support could not be found as technostress inhibitor.
Family support did become slightly lower during the pandemic. Yet, in this time period, it was
important as a technostress inhibitor. While it did not have an effect before the pandemic, it
significantly decreased technostress creators during the pandemic. This is one important finding
indicating that employees found alternative sources of support during the pandemic and found
Organizational and Social Mechanisms as Technostress Inhibitors 265
this source in their own family members. Even though the availability of family support slightly
decreased, it helps to inhibit technostress creators.
4.2.6.1 Theoretical Contribution
Our results contribute to literature in several ways: First, we extend literature on technostress
inhibitors and transfer knowledge from psychology to technostress literature. We find that sense
of community at work helps to inhibit technostress creators and that family support has the
same effect in work settings with high amounts of telework. This adds to the previously highly
investigated technostress inhibitors (literacy facilitation, involvement facilitation, and technical
support provision) and may inspire research to further investigate the effects of social support
on technostress creators and the relationship between technostress creators and strain. For future
research, it is important to investigate whether different groups of employees (e.g., male vs.
female employees) lean on different dimensions of social support.
Second, we find evidence that not all social support dimensions are related to technostress cre-
ators in the same direction. According to our results, supervisor support does not function as
technostress inhibitor. Rather, it increases technostress. This is an important finding and shows
that social support dimensions have to be differentiated. Future research should analyze the
reasons for the differences between different social support dimensions.
Third, we find differing results between the technostress creators. Prior research often builds a
higher-order construct of technostress creators (e.g., Ragu-Nathan et al. 2008) instead of inves-
tigating the relationship of the first-order constructs with, for example, antecedents and out-
comes of technostress. We show the importance of differentiating the different technostress
creators.
4.2.6.2 Practical Implications
Our results suggest different practical implications for organizations. Organizations must be
aware of the fact that not only organizational mechanisms such as the provision of technical
support or training with digital technologies can inhibit technostress but also more soft mecha-
nisms such as the sense of community at work. However, building such a sense of community
among the employees takes time and it is hard to influence it by one single measure but by
numerous measures (such as trust-building or team-building measures).
Also, it is important for organizations as well as supervisors to notice that their behavior may
imply too high expectations in terms of, for example, reachability during non-work hours on
their employees when they have a good relationship. According to our results, such a behavior
Organizational and Social Mechanisms as Technostress Inhibitors 266
may increase technostress. Thus, supervisors have to challenge their behavior in that regard and
actively communicate their expectations.
4.2.6.3 Limitations
Our study has several limitations. We used data from two cross-sectional surveys which limits
the possibility to find causal effects between social support and technostress creators. Even
though the causal motivation for each relationship stems from theory and prior literature, future
research should follow up with generating further data sets to test robustness and generalizabil-
ity. Further, the COVID-19 pandemic has come along with a large variety of changes in the
private and business environment of employees. Thus, it may be that the surveyed constructs in
our study do not completely cover all these changes. Future research should further investigate
these changes that have not been regarded in our study. This is also important in order to draw
conclusions for the new normal of working after the COVID-19 pandemic.
4.2.7 Conclusion
Digitalization as well as the COVID-19 pandemic have dramatically changed workplaces and
working environments. The resulting technostress can be inhibited by different organizational
mechanisms as well as support from an individual’s environment. Our results give evidence
that social support can be an effective technostress inhibitor and that it becomes even more
important when the amount of telework is high. Even when the social distancing measures due
to the COVID-19 pandemic will be terminated, many studies show that the new normal of
working will include higher amounts of telework than before the COVID-19 pandemic. Thus,
our results remain relevant even after the pandemic and may inspire research and organizations
when preparing for the new normal of working.
Organizational and Social Mechanisms as Technostress Inhibitors 267
4.2.8 References
Ahmad, U. N. U., Amin, S. M., and Ismail, W. K. W. 2014. “Moderating Effect of Technostress
Inhibitors on the Relationship between Technostress Creators and Organisational Commit-
ment,” Jurnal Teknologi (67:1), pp. 51-62.
Ahrendt, D., Cabrita, J., Clerici, E., Hurley, J., Leončikas, T., Mascherini, M., Riso, S., and
Sandor, E. 2020. “Living, Working and COVID-19,” COVID-19 series, Eurofound (ed.),
Luxembourg.
Asbari, M., Purwanto, A., Sudargini, Y., and Fahmi, K. 2021. “The Effect of Work-Family
Conflict and Social Support on Job Satisfaction: A Case Study of Female Employees in
Indonesia,” International Journal of Social and Management Studies (1:1), pp. 32-42.
Barnett, R. C., Brennan, R. T., Gareis, K. C., Ertel, K. A., Berkman, L. F., and Almeida, D. M.
2012. “Conservation of Resources Theory in the Context of Multiple Roles: An Analysis of
Within- and Cross-Role Mediational Pathways,” Community, Work & Family (15:2),
pp. 131-148.
Barrera, M. 1986. “Distinctions Between Social Support Concepts, Measures, and Models,”
American Journal of Community Psychology (14:4), pp. 413-445.
Brod, C. 1982. “Managing Technostress: Optimizing the Use of Computer Technology,” Per-
sonnel Journal (61:10), pp. 753-757.
Burr, H., Berthelsen, H., Moncada, S., Nübling, M., Dupret, E., Demiral, Y., Oudyk, J., Kris-
tensen, T. S., Llorens, C., Navarro, A., Lincke, H.-J., Bocéréan, C., Sahan, C., Smith, P.,
and Pohrt, A. 2019. “The Third Version of the Copenhagen Psychosocial Questionnaire,”
Safety and Health at Work (10:4), pp. 482-503.
Cicognani, E., Pietrantoni, L., Palestini, L., and Prati, G. 2009. “Emergency Workers’ Quality
of Life: The Protective Role of Sense of Community, Efficacy Beliefs and Coping Strate-
gies,” Social Indicators Research (94:3), pp. 449-463.
Day, A., Paquet, S., Scott, N., and Hambley, L. 2012. “Perceived Information and Communi-
cation Technology (ICT) Demands on Employee Outcomes: the Moderating Effect of Or-
ganizational ICT Support,” Journal of Occupational Health Psychology (17:4), pp. 473-
491.
Demerouti, E., Bakker, A. B., Nachreiner, F., and Schaufeli, W. B. 2001. “The Job Demands-
Resources Model of Burnout,” The Journal of Applied Psychology (86:3), pp. 499-512.
Organizational and Social Mechanisms as Technostress Inhibitors 268
Eisenberger, R., Fasolo, P., and Davis-LaMastro, V. 1990. “Perceived Organizational Support
and Employee Diligence, Commitment, and Innovation,” Journal of Applied Psychology
(75:1), pp. 51-59.
Eisenberger, R., Stinglhamber, F., Vandenberghe, C., Sucharski, I. L., and Rhoades, L. 2002.
“Perceived Supervisor Support: Contributions to Perceived Organizational Support and Em-
ployee Retention,” The Journal of Applied Psychology (87:3), pp. 565-573.
Fuglseth, A. M., and Sørebø, Ø. 2014. “The Effects of Technostress within the Context of Em-
ployee Use of ICT,” Computers in Human Behavior (40), pp. 161-170.
Gascón, S., Fueyo-Díaz, R., Borao, L., Leiter, M. P., Fanlo-Zarazaga, Á., Oliván-Blázquez, B.,
and Aguilar-Latorre, A. 2021. “Value Conflict, Lack of Rewards, and Sense of Community
as Psychosocial Risk Factors of Burnout in Communication Professionals (Press, Radio,
and Television),” International Journal of Environmental Research and Public Health
(18:2).
Gefen, D., Straub, D. W., and Boudreau, M.-C. 2000. “Structural Equation Modeling and Re-
gression: Guidelines for Research Practice,” Communications of the Association for Infor-
mation Systems (4:1), Article 7.
Graen, G. B., and Uhl-Bien, M. 1995. “Relationship-Based Approach to Leadership: Develop-
ment of Leader-Member Exchange (LMX) Theory of Leadership over 25 Years: Applying
a Multi-Level Multi-Domain Perspective,” Leadership Quarterly (6:2), pp. 219-247.
Hobfoll, S. E. 1989. “Conservation of Resources: A New Attempt at Conceptualizing Stress,”
American Psychologist (44:3), pp. 513-524.
Hung, W.-H., Chang, L.-M., and Lin, C.-H. 2011. “Managing the Risk of Overusing Mobile
Phones in the Working Environment: A Study of Ubiquitous Technostress,” in Proceedings
of the 15th Pacific Asia Conference on Information Systems, Brisbane, Australia, pp. 1-12.
Jia, R., Reich, B. H., and Pearson, J. M. 2008. “IT Service Climate: An Extension to IT Service
Quality Research,” Journal of the Association for Information Systems (9:5), pp. 294-321.
King, L. A., Mattimore, L. K., King, D. W., and Adams, G. A. 1995. “Family Support Inventory
for Workers: A New Measure of Perceived Social Support from Family Members,” Journal
of Organizational Behavior (16:3), pp. 235-258.
Lazarus, R. S., and Folkman, S. 1984. Stress, Appraisal, and Coping, New York: Springer Pub-
lishing Company.
Lei, P.-W., and Wu, Q. 2007. “Introduction to Structural Equation Modeling: Issues and Prac-
tical Considerations,” Educational Measurement: Issues and Practice (26:3), pp. 33-43.
Organizational and Social Mechanisms as Technostress Inhibitors 269
Leiter, M. P., and Maslach, C. 2003. “Areas of Worklife: A Structured Approach to Organiza-
tional Predictors of Job Burnout,” in Emotional and Physiological Processes and Positive
Intervention Strategies, D. C. Ganster and P. L. Perrewe (eds.), Bingley: Elsevier JAI,
pp. 91-134.
Mansour, S., and Tremblay, D.-G. 2016. “Workload, Generic and Work–Family Specific Social
Supports and Job Stress,” International Journal of Contemporary Hospitality Management
(28:8), pp. 1778-1804.
McCarty, W. P., Zhao, J. “., and Garland, B. E. 2007. “Occupational Stress and Burnout Be-
tween Male and Female Police Officers: Are There Any Gender Differences?” Policing: An
International Journal of Police Strategies & Management (30:4), pp. 672-691.
Nunnally, J. C., and Bernstein, I. H. 1994. Psychometric Theory, New York: McGraw-Hill.
Patrick, A., and Laschinger, H. K. S. 2006. “The Effect of Structural Empowerment and Per-
ceived Organizational Support on Middle Level Nurse Managers’ Role Satisfaction,” Jour-
nal of Nursing Management (14:1), pp. 13-22.
Ragu-Nathan, T. S., Tarafdar, M., Ragu-Nathan, B. S., and Tu, Q. 2008. “The Consequences
of Technostress for End Users in Organizations: Conceptual Development and Empirical
Validation,” Information Systems Research (19:4), pp. 417-433.
Sarabadani, J., Carter, M., and Compeau, D. 2018. “10 Years of Research on Technostress
Creators and Inhibitors: Synthesis and Critique,” in Proceedings of the 24th Americas Con-
ference on Information Systems, New Orleans, Louisiana, USA, pp. 1-10.
Sass, D. A., Seal, A. K., and Martin, N. K. 2011. “Predicting Teacher Retention Using Stress
and Support Variables,” Journal of Educational Administration (49:2), pp. 200-215.
Sosik, J. J., and Godshalk, V. M. 2000. “Leadership Styles, Mentoring Functions Received, and
Job-Related Stress: A Conceptual Model and Preliminary Study,” Journal of Organiza-
tional Behavior (21:4), pp. 365-390.
Tarafdar, M., Pullins, E. B., and Ragu-Nathan, T. S. 2015. “Technostress: Negative Effect on
Performance and Possible Mitigations,” Information Systems Journal (25:2), pp. 103-132.
Tarafdar, M., Tu, Q., Ragu-Nathan, B. S., and Ragu-Nathan, T. S. 2007. “The Impact of Tech-
nostress on Role Stress and Productivity,” Journal of Management Information Systems
(24:1), pp. 301-328.
Tarafdar, M., Tu, Q., and Ragu-Nathan, T. S. 2010. “Impact of Technostress on End-User Sat-
isfaction and Performance,” Journal of Management Information Systems (27:3), pp. 303-
334.
Organizational and Social Mechanisms as Technostress Inhibitors 270
Tarafdar, M., Tu, Q., Ragu-Nathan, T. S., and Ragu-Nathan, B. S. 2011. “Crossing to the Dark
Side: Examining Creators, Outcomes, and Inhibitors of Technostress,” Communications of
the ACM (54:9), pp. 113-120.
Tu, Q., Tarafdar, M., Ragu-Nathan, T. S., and Ragu-Nathan, B. S. 2008. “Improving End-User
Satisfaction through Techno-Stress Prevention: Some Empirical Evidences,” in Proceed-
ings of the 14th Americas Conference on Information Systems, Toronto, Canada, pp. 1-8.
Weinert, C., Maier, C., Laumer, S., and Weitzel, T. 2020. “Technostress Mitigation: An Exper-
imental Study of Social Support During a Computer Freeze,” Journal of Business Econom-
ics (90:8), pp. 1199-1249.
Witt, L. A., and Carlson, D. S. 2006. “The Work-Family Interface and Job Performance: Mod-
erating Effects of Conscientiousness and Perceived Organizational Support,” Journal of Oc-
cupational Health Psychology (11:4), pp. 343-357.
Wolgast, A., and Fischer, N. 2017. “You Are Not Alone: Colleague Support and Goal-Oriented
Cooperation as Resources to Reduce Teachers’ Stress,” Social Psychology of Education
(20:1), pp. 97-114.
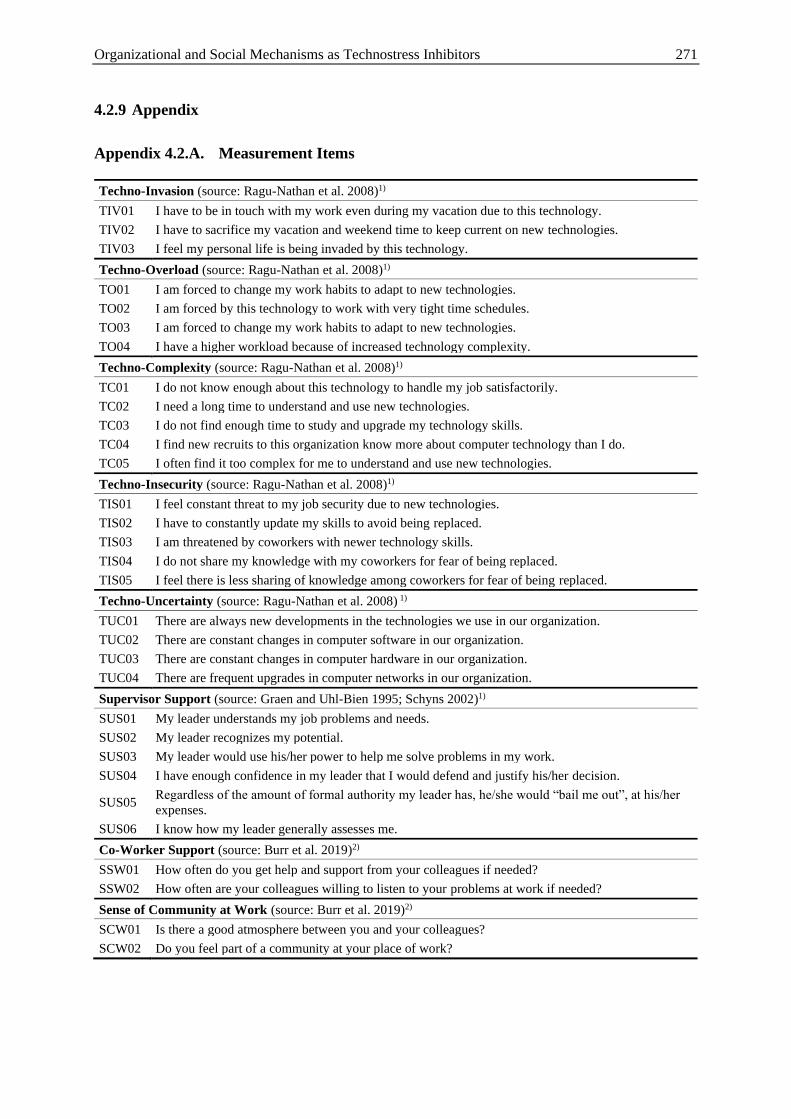
Organizational and Social Mechanisms as Technostress Inhibitors 271
4.2.9 Appendix
Appendix 4.2.A. Measurement Items
Techno-Invasion (source: Ragu-Nathan et al. 2008)1)
TIV01 I have to be in touch with my work even during my vacation due to this technology.
TIV02 I have to sacrifice my vacation and weekend time to keep current on new technologies.
TIV03 I feel my personal life is being invaded by this technology.
Techno-Overload (source: Ragu-Nathan et al. 2008)1)
TO01 I am forced to change my work habits to adapt to new technologies.
TO02 I am forced by this technology to work with very tight time schedules.
TO03 I am forced to change my work habits to adapt to new technologies.
TO04 I have a higher workload because of increased technology complexity.
Techno-Complexity (source: Ragu-Nathan et al. 2008)1)
TC01 I do not know enough about this technology to handle my job satisfactorily.
TC02 I need a long time to understand and use new technologies.
TC03 I do not find enough time to study and upgrade my technology skills.
TC04 I find new recruits to this organization know more about computer technology than I do.
TC05 I often find it too complex for me to understand and use new technologies.
Techno-Insecurity (source: Ragu-Nathan et al. 2008)1)
TIS01 I feel constant threat to my job security due to new technologies.
TIS02 I have to constantly update my skills to avoid being replaced.
TIS03 I am threatened by coworkers with newer technology skills.
TIS04 I do not share my knowledge with my coworkers for fear of being replaced.
TIS05 I feel there is less sharing of knowledge among coworkers for fear of being replaced.
Techno-Uncertainty (source: Ragu-Nathan et al. 2008) 1)
TUC01 There are always new developments in the technologies we use in our organization.
TUC02 There are constant changes in computer software in our organization.
TUC03 There are constant changes in computer hardware in our organization.
TUC04 There are frequent upgrades in computer networks in our organization.
Supervisor Support (source: Graen and Uhl-Bien 1995; Schyns 2002)1)
SUS01 My leader understands my job problems and needs.
SUS02 My leader recognizes my potential.
SUS03 My leader would use his/her power to help me solve problems in my work.
SUS04 I have enough confidence in my leader that I would defend and justify his/her decision.
SUS05 Regardless of the amount of formal authority my leader has, he/she would “bail me out”, at his/her
expenses.
SUS06 I know how my leader generally assesses me.
Co-Worker Support (source: Burr et al. 2019)2)
SSW01 How often do you get help and support from your colleagues if needed?
SSW02 How often are your colleagues willing to listen to your problems at work if needed?
Sense of Community at Work (source: Burr et al. 2019)2)
SCW01 Is there a good atmosphere between you and your colleagues?
SCW02 Do you feel part of a community at your place of work?
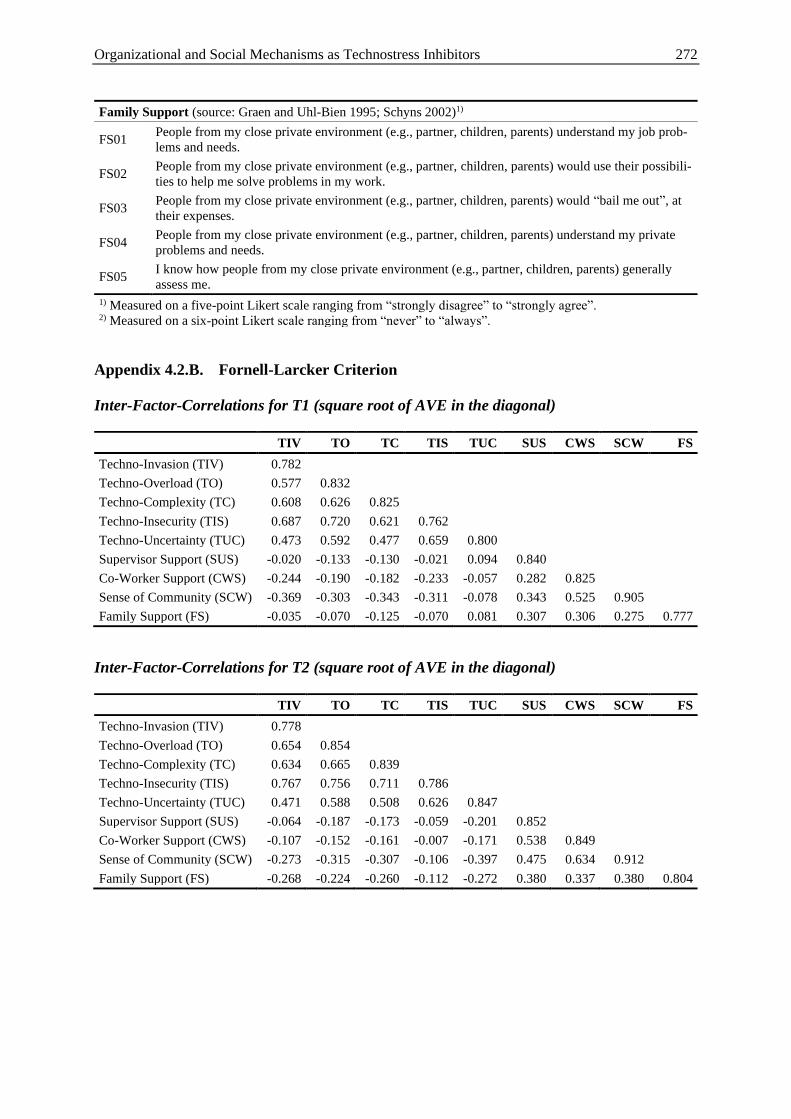
Organizational and Social Mechanisms as Technostress Inhibitors 272
Family Support (source: Graen and Uhl-Bien 1995; Schyns 2002)1)
FS01 People from my close private environment (e.g., partner, children, parents) understand my job prob-
lems and needs.
FS02 People from my close private environment (e.g., partner, children, parents) would use their possibili-
ties to help me solve problems in my work.
FS03 People from my close private environment (e.g., partner, children, parents) would “bail me out”, at
their expenses.
FS04 People from my close private environment (e.g., partner, children, parents) understand my private
problems and needs.
FS05 I know how people from my close private environment (e.g., partner, children, parents) generally
assess me.
1) Measured on a five-point Likert scale ranging from “strongly disagree” to “strongly agree”. 2) Measured on a six-point Likert scale ranging from “never” to “always”.
Appendix 4.2.B. Fornell-Larcker Criterion
Inter-Factor-Correlations for T1 (square root of AVE in the diagonal)
TIV TO TC TIS TUC SUS CWS SCW FS
Techno-Invasion (TIV) 0.782
Techno-Overload (TO) 0.577 0.832
Techno-Complexity (TC) 0.608 0.626 0.825
Techno-Insecurity (TIS) 0.687 0.720 0.621 0.762
Techno-Uncertainty (TUC) 0.473 0.592 0.477 0.659 0.800
Supervisor Support (SUS) -0.020 -0.133 -0.130 -0.021 0.094 0.840
Co-Worker Support (CWS) -0.244 -0.190 -0.182 -0.233 -0.057 0.282 0.825
Sense of Community (SCW) -0.369 -0.303 -0.343 -0.311 -0.078 0.343 0.525 0.905
Family Support (FS) -0.035 -0.070 -0.125 -0.070 0.081 0.307 0.306 0.275 0.777
Inter-Factor-Correlations for T2 (square root of AVE in the diagonal)
TIV TO TC TIS TUC SUS CWS SCW FS
Techno-Invasion (TIV) 0.778
Techno-Overload (TO) 0.654 0.854
Techno-Complexity (TC) 0.634 0.665 0.839
Techno-Insecurity (TIS) 0.767 0.756 0.711 0.786
Techno-Uncertainty (TUC) 0.471 0.588 0.508 0.626 0.847
Supervisor Support (SUS) -0.064 -0.187 -0.173 -0.059 -0.201 0.852
Co-Worker Support (CWS) -0.107 -0.152 -0.161 -0.007 -0.171 0.538 0.849
Sense of Community (SCW) -0.273 -0.315 -0.307 -0.106 -0.397 0.475 0.634 0.912
Family Support (FS) -0.268 -0.224 -0.260 -0.112 -0.272 0.380 0.337 0.380 0.804
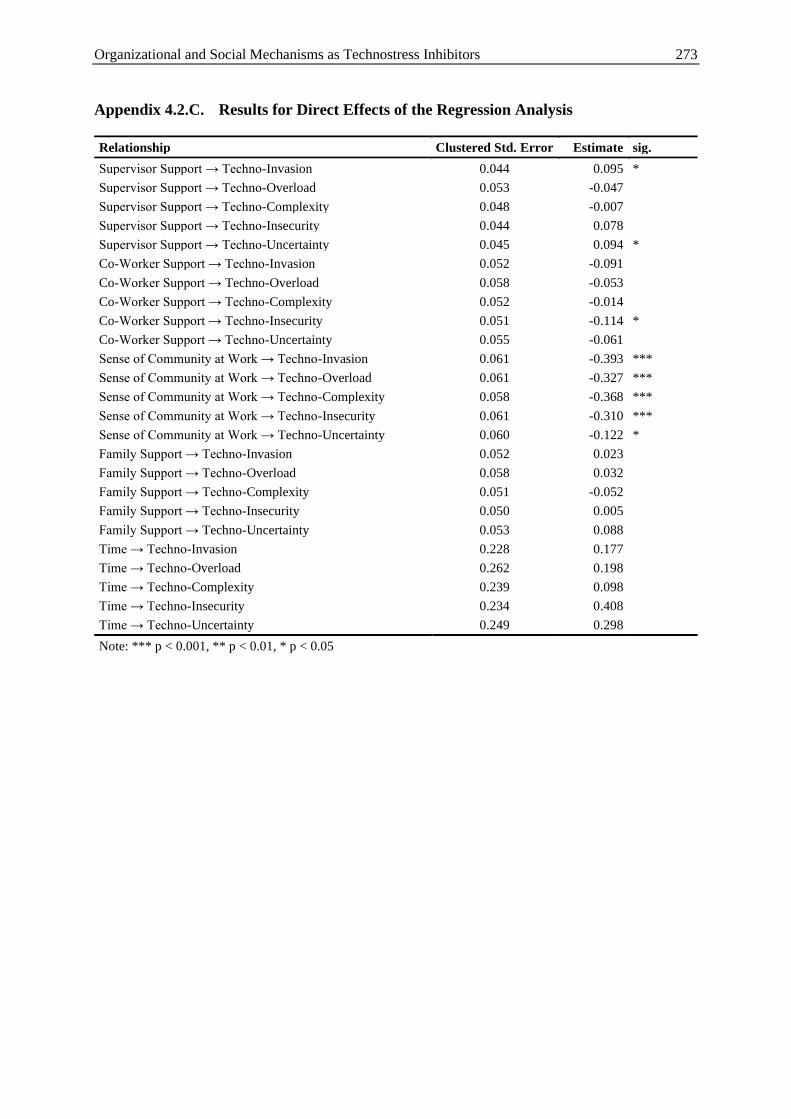
Organizational and Social Mechanisms as Technostress Inhibitors 273
Appendix 4.2.C. Results for Direct Effects of the Regression Analysis
Relationship Clustered Std. Error Estimate sig.
Supervisor Support → Techno-Invasion 0.044 0.095 *
Supervisor Support → Techno-Overload 0.053 -0.047
Supervisor Support → Techno-Complexity 0.048 -0.007
Supervisor Support → Techno-Insecurity 0.044 0.078
Supervisor Support → Techno-Uncertainty 0.045 0.094 *
Co-Worker Support → Techno-Invasion 0.052 -0.091
Co-Worker Support → Techno-Overload 0.058 -0.053
Co-Worker Support → Techno-Complexity 0.052 -0.014
Co-Worker Support → Techno-Insecurity 0.051 -0.114 *
Co-Worker Support → Techno-Uncertainty 0.055 -0.061
Sense of Community at Work → Techno-Invasion 0.061 -0.393 ***
Sense of Community at Work → Techno-Overload 0.061 -0.327 ***
Sense of Community at Work → Techno-Complexity 0.058 -0.368 ***
Sense of Community at Work → Techno-Insecurity 0.061 -0.310 ***
Sense of Community at Work → Techno-Uncertainty 0.060 -0.122 *
Family Support → Techno-Invasion 0.052 0.023
Family Support → Techno-Overload 0.058 0.032
Family Support → Techno-Complexity 0.051 -0.052
Family Support → Techno-Insecurity 0.050 0.005
Family Support → Techno-Uncertainty 0.053 0.088
Time → Techno-Invasion 0.228 0.177
Time → Techno-Overload 0.262 0.198
Time → Techno-Complexity 0.239 0.098
Time → Techno-Insecurity 0.234 0.408
Time → Techno-Uncertainty 0.249 0.298
Note: *** p < 0.001, ** p < 0.01, * p < 0.05
General Discussion and Conclusion 274
5 General Discussion and Conclusion
The purpose of this dissertation is to contribute to a deeper understanding of how the ongoing
digitalization is affecting individuals. Specifically, it sets out to examine individual information
systems, their use, and their impact on technostress as well as resources of individuals that are
important in that context. This chapter illustrates the key findings of this dissertation and their
contributions to literature in Section 5.1, then lists limitations and directions for future research
in Section 5.2, and concludes with Section 5.3.
5.1 Summary of Results and Meta-Inferences
This section summarizes the findings, theoretical contributions, and practical implications of
each individual research paper and provides meta-inferences for each part of the dissertation.
5.1.1 Results of Chapter 2: Individual Information Systems and their Use
Paper 1 introduces a four-layer conceptualization of IIS. The four layers are: devices, digital
identities, relationships, and information. Furthermore, Paper 1 defines IIS integration as the
overlap of the IIS sub-systems from the business and private domains on each of the four layers.
In other words, it defines IIS integration as the degree to which components of the IIS are used
for both business and private purposes. Paper 1 then proposes a method to measure this inte-
gration. A quantitative empirical study is conducted with 205 individuals to assess this concep-
tualization and evaluate IIS integration in a nomological network based on boundary theory
literature. The findings support the four-layer conceptualization as well as the theoretical model.
The results of the quantitative study shed light on IIS integration and how it differs depending
on demographic variables, such as age, gender, marital status, and working hours. These in-
sights include that IIS integration varies in the respective layers and in regard to marital status
and working hours, which indicates differences between individuals with alternate private and
business responsibilities.
Paper 1 makes several contributions to theory: First, the conceptualization of IIS as comprising
four layers takes a more comprehensive view of IIS than prior literature, which allows a more
nuanced perspective on IIS and its use. Second, the definition of IIS integration as being more
or less developed on each of the four layers extends the understanding of IIS integration since
prior literature has not yet taken into account that integration lies on a continuum between com-
plete segmentation and complete integration and that it may differ between the four layers.
General Discussion and Conclusion 275
Third, the measurement method of IIS integration makes it possible for future research to collect
data on IIS integration and analyze it in greater depth. Fourth, Paper 1 finds support for the
transfer of boundary theory concepts to IS literature. Regarding practical implications, the con-
ceptualization can help individuals, organizations, and IT designers to build IIS and thus take
advantage of individual as well as organizational benefits of IIS use and IIS integration.
Paper 2 analyzes a net-valence model on benefits and risks of IT service consumerization
(i.e., the use of private IT services for business purposes) and their effects on attitude towards
IT service consumerization and its use behavior. An empirical survey with 221 respondents and
quantitative as well as qualitative elements reveals the following results: On the benefit side,
functionalities of IT services and their fit with the individual’s tasks at work are a critical factor
of their attitude to IT service consumerization. On the risk side, Paper 2 finds that the threat of
sanctions for the use of private IT services in the business domain does not prevent individuals
from using private IT services for business purposes, nor does the occupational hazard that one
could lose control over business data due to IT services consumerization. These findings are
corroborated with qualitative data from the survey to offer further insights into how the func-
tionalities of IT services affect IT consumerization behavior. This includes, for example, the
finding that certain respondents indicated that they deliberately use their private IT services due
to IT security concerns as they perceive the business IT service and its security functionalities
to be less secure than their private alternative.
With these results, Paper 2 makes contributions to literature since it provides a detailed under-
standing of what drives IT consumerization on the service layer: First, the paper considers IT
service consumerization, rather than IT consumerization in general. It applies a net-valence
model and finds evidence that the benefits outweigh the risks in this context. Second, it shows
that the benefits are mainly predicted on the better functionalities of the private IT service, as
opposed to those of the business IT service. Third, it finds that individuals with a higher IT
mindfulness better recognize the functionalities of their IT services. Fourth, the paper offers
qualitative insights on reasons for the small impact of data security risks on the IT consumeri-
zation decision of individuals. The relevance that Paper 2 holds for IT departments is that it
reveals the need to provide their employees with suitable business IT services in order to man-
age IT service consumerization more effectively.
In summary, Chapter 2 sets out to provide a better understanding of IIS and its different com-
ponents at the intersection of the business and private domains of individuals. In this notion,
Paper 1 presents four layers on which components have to be taken into account and points out
General Discussion and Conclusion 276
to consider the integration of IIS when using business as well as private IT components. Paper 2
further explores IT services as part of the digital identity layer of IIS and investigates one di-
rection of IIS integration: the use of private IT services for business purposes. On a meta-infer-
ence level, both papers emphasize the increasing empowerment of individuals when it comes
to building their own IIS. Whereas the management of IS used to be done mainly by organiza-
tional IT departments, individuals can now do this by themselves. This makes it ever more
difficult for IT departments to enforce their policies for IS use. As this development of individ-
ual empowerment is expected to continue, interest should grow among practitioners as well as
academics. Increasingly, it will be a matter of IT departments having to leave the one-size-fits-
all approaches behind so as to consider the needs of individuals with regard to their IIS, rather
than persevere with impositions of organizational IS use policies on individuals. To support this
development, researchers in that area should further engage themselves with the deeper ra-
tionale underlying the individual use of IIS on the different layers and at the intersection of the
business and private domains. In that regard, Chapter 2 provides a more comprehensive under-
standing of IIS on which future research can build.
5.1.2 Results of Chapter 3: Technostress as a Negative Outcome of Individual Infor-
mation Systems Use
Paper 3 extends the research on IT consumerization and investigates a potential adverse out-
come: techno-unreliability. The paper uses a mixed-methods study design that draws on quali-
tative and quantitative data collected from 224 employees to analyze the relationship between
IT consumerization and techno-unreliability. In doing so, it accounts for the individual’s com-
puter self-efficacy as well as the extent of IT portfolio integration. The analysis reveals that IT
consumerization is positively associated with techno-unreliability, which in turn has adverse
effects on several outcomes regarding the IT portfolio. Furthermore, techno-unreliability is ex-
perienced stronger when IT portfolio integration and the individual’s computer self-efficacy are
low. In the qualitative part of the analysis, reasons are identified why business and private in-
tegrated IT portfolios cause techno-unreliability. These reasons include a lack of compatibility
between the business and private components of the IT portfolio.
With these findings, Paper 3 makes several contributions to literature: First, it is one of the first
research endeavors to link the study of IT consumerization with that of technostress, and while
the former has largely come to be discussed in terms of its positive outcomes for individuals,
Paper 3 highlights a significant negative outcome that has to be regarded. Second, the paper
General Discussion and Conclusion 277
sheds light on the extent of integration between business and private IT components of an indi-
vidual’s IIS and presents challenges associated with integrated IT portfolios.
Paper 4 examines the characteristics of digital technologies that are related to technostress. It
does so by employing a mixed-methods study including a structured literature analysis, a set of
qualitative interviews, and a quantitative survey among 4,560 users of digital technologies. This
data is condensed into ten characteristics of digital technologies, each of which is related to at
least one technostress creator, and a measurement instrument is developed for every one of
them. The ten characteristics and measurement methods are of further value in that they con-
tribute to the literature on technostress and support future research efforts to investigate tech-
nological antecedents of technostress. Further, Paper 4 highlights the importance of investigat-
ing the entire IT portfolio at a workplace, rather than focusing exclusively on the particular
digital technologies that individuals are using. For such comprehensive investigations, the paper
also provides future research with profiles on the perception of characteristics for 26 common
digital technologies in the workplace. Along with the insights on the relationships of each char-
acteristic with different technostress creators, practitioners can better combine different digital
technologies with their different characteristics in the workplace in order to mitigate tech-
nostress.
Paper 5 deals with the concept of technostress and its creators. Using a similar study design as
Paper 4, it compiles twelve different technostress creators – some of which have already been
discussed in prior literature, while others are newly conceptualized in the qualitative phase of
this study. Paper 5 thus makes five key contributions to IS theory: First, it adds three new tech-
nostress creators to the nine previously discussed. In doing so, it provides a more comprehen-
sive view of the phenomenon. Second, the paper presents and evaluates a measurement model
for the twelve technostress creators. This helps future research to collect data on the constructs.
Third, Paper 5 reveals the creators’ underlying hierarchical structure of four second-order fac-
tors: impediment, interference, constant change, and exposure. This may inspire future research
and provides parsimony to the twelve technostress creators when needed. Fourth, the empirical
analysis brings the four second-order factors into relation with work- and health-related effects.
This extends the current body of knowledge on the outcomes of technostress. Fifth and final,
Paper 5 suggests digital stress as an evolved concept of technostress. With this, the paper helps
to establish a unifying terminology for the multi-disciplinary research field on stress caused by
digital technologies. As far as practitioners are concerned, Paper 5 contributes to a deeper, more
holistic understanding of the potential sources of stress in the workplace. Also, with the
General Discussion and Conclusion 278
measurement instrument, it provides practitioners with a tool for psychological risk assessment
of workplaces.
In summary, Chapter 3 leads to an understanding of technostress as a negative consequence of
the increased use of digital technologies among individuals. In that regard, Paper 3 builds a
bridge from IT consumerization, as examined in Chapter 2, to technostress literature. Paper 4
goes deeper into the relationship between various components of IIS on the technological layers
and its associated characteristics with technostress whereas Paper 5 advances the technostress
concept as a whole. All three papers highlight the importance of investigating technostress
along with its multiple technostress creators and their relationships with digital technologies.
While Chapter 2 considers the ongoing digitalization of individuals, Chapter 3 emphasizes the
importance of also considering the negative outcome of this current development. With this,
Chapter 3 contributes to literature in two ways: by establishing a link between technostress and
the digitalization of individuals and their workplaces, and by advancing the understanding of
its antecedents.
5.1.3 Results of Chapter 4: Organizational and Social Mechanisms as Technostress Inhib-
itors
Paper 6 investigates the impact of workplace digitalization on technostress and whether organ-
izational measures such as literacy facilitation, involvement facilitation, and technical support
provision can influence this relationship and serve as technostress inhibitors. To establish this,
a quantitative survey was conducted among 2,640 German employees. The results indicate that
a higher degree of workplace digitalization is associated with higher levels of technostress in
general, but the effect varies between different technostress creators. The same applies to the
organizational measures which are only partially effective in inhibiting technostress. The con-
tributions to theory of Paper 6 are threefold: First, the results highlight the importance of inves-
tigating the degree of workplace digitalization and its impact on technostress. While prior liter-
ature focused, for the most part, on single digital technologies, Paper 6 is one of the first studies
to expand this narrow focus to a comprehensive investigation of the entire IT portfolio in the
digital workplace. Second, the paper finds that the digitalization of workplaces affects individ-
ual technostress creators in different ways. This is important for the further refinement of theory
since prior work on technostress inhibitors has largely investigated technostress as a higher-
order construct. Instead, Paper 6 shows that a differentiated examination is required to account
for different technostress creators. Third, Paper 6 finds evidence that technostress inhibitors
have a notable impact on the relationship between the degree of workplace digitalization and
General Discussion and Conclusion 279
technostress. Since this effect varies depending on the different technostress inhibitors and tech-
nostress creators, it further illustrates the need for a differentiated consideration. Concerning
practical implications, Paper 6 reveals the effect of ongoing workplace digitalization on tech-
nostress as one aspect that affects employees’ well-being. To address this health issue, the paper
specifies potential measures that can be taken at an organizational level to inhibit this negative
outcome of workplace digitalization.
Paper 7 examines how effective social support dimensions can be as technostress inhibitors. By
employing a quantitative longitudinal study among 637 German employees, the study finds
evidence that a sense of community at work lowers technostress and, therefore, acts as an ef-
fective technostress inhibitor. The same applies to family support which has been found to be
even more important as technostress inhibitor in times of extended telework. With these find-
ings, Paper 7 makes several contributions to IS literature: First, it advances the knowledge on
technostress inhibitors since IS literature to date has not yet considered social support dimen-
sions in terms of technostress inhibitors. Second, while a sense of community at work was found
to act as a technostress inhibitor on the five examined technostress creators, the other analyzed
social support dimensions have not been found to be related to all five technostress inhibitors.
Instead, the findings have indicated that supervisor support can be positively rather than nega-
tively related to some technostress creators, such as techno-insecurity. This should be taken as
further evidence that social support dimensions and the associated technostress creators have to
be differentiated in future research. As far as practitioners are concerned, Paper 7 indicates fur-
ther mitigation mechanisms to deal with potentially adverse effects of workplace digitalization
and thus support the familiar organizational measures that have already been discussed in prior
literature. However, practitioners also have to be aware of the potentially increasing effects of,
for example, supervisor support. Further worth noting is the fact that mechanisms like a sense
of community at work do not take effect over night. Instead, they have to be implemented and
nurtured over a long period of time.
In summary, Chapter 4 sets out to identify potential mechanisms that help mitigate technostress.
While the ongoing digitalization of workplaces has been found to cause technostress along with
its associated negative outcomes for individuals as well as organizations, Chapter 4 presents
resources to inhibit these adverse effects. Paper 6 and Paper 7 serve this purpose by investigat-
ing technostress inhibitors from two perspectives: organizational measures and social support
dimensions. In both papers, the former as well as the latter are found to have potential efficacy
in mitigating technostress. However, they have different relationship with different technostress
General Discussion and Conclusion 280
creators. Therefore, both papers emphasize the need for a differentiated theorizing around sin-
gle technostress creators, rather than discussing technostress in general. In short, both papers
advance the knowledge on technostress mitigation in the workplace and help direct future en-
deavors in both research and practice.
5.2 Future Research
One purpose of this dissertation is to inspire future research. Areas in which this may be most
beneficial are discussed in this section. Furthermore, each paper comes with some limitations,
which will also be discussed here.
5.2.1 Future Research on the Topics of Chapter 2: Individual Information Systems and
their Use
Paper 1 and Paper 2 advance the knowledge on IIS and their different components at the inter-
section of the business and private domains. However, both papers have several limitations that
leave room for future research. First, the conceptualization of IIS integration in Paper 1 does
not differentiate the direction of integration which would indicate whether private IIS compo-
nents are used in the business domain or whether business IIS components are used in the pri-
vate domain. Meanwhile, Paper 2 accounts for one of those directions as it investigates the use
of private IT services for business purposes. Thus, it makes one step towards overcoming this
limitation, yet future research could detail the understanding of IIS integration and its measure-
ment method with regard to both directions of IIS integration. Second, both papers use self-
reported data on the usage of different IIS components and IT services consumerization. Since
log-file data is becoming ever-more readily available, future studies could use such data to make
the measurement more objective. Third, the data collection on IIS usage in Paper 1 was re-
stricted to IIS components that serve the purpose of communication. The rationale here was
keeping the questionnaire short. Yet although communication is one of the main use cases of
IIS, future research could expand on this by investigating all potential components of IIS. For
Paper 2, responses were restricted to two IT services: instant messaging and file sharing, which
are two important IT services at most digital workplaces. However, other IT services, such as
emailing or social networks could also be beneficial avenues of research. Also, asking all re-
spondents to rate both IT services may have led to unobserved homogeneity in the answers.
Fourth, both quantitative studies were conducted as cross-sectional studies measuring all con-
structs at one point in time. This brings limitations concerning causality of the relationships and
generalizability of the results.
General Discussion and Conclusion 281
With a view to future research potential, it would be worth further exploring the rationales of
IT service consumerization. As the qualitative analysis of Paper 2 has revealed, the use of pri-
vate IT services can foster informal relationships with business contacts, and private IT services
may be seen as less risky in terms of data security than their business equivalents, and yet to
date, neither of these considerations have found their way into established adoption models for
IT consumerization. Deepening the understanding of such considerations promises to refine the
theory on IT consumerization. Furthermore, while Paper 2 contributes to the literature of IT
consumerization on the service layer, the other layers discussed in Paper 1 should also be con-
sidered in future research. The notable benefit would be a more comprehensive understanding
of IT consumerization and the rationales behind the use of different IIS components for differ-
ent purposes.
5.2.2 Future Research on the Topics of Chapter 3: Technostress as a Negative Outcome
of Individual Information Systems Use
Paper 3, Paper 4, and Paper 5 add to the understanding on technostress but come with some
limitations that may inspire future research. All three papers contain a quantitative survey with
a cross-sectional design. This limits generalizability and claims of causality for all three papers.
Furthermore, the data collection for Paper 4 and Paper 5 was restricted to German employees.
With this in mind, future researchers would be well-advices to cross-validate the results among
other countries.
Another area in which research of Paper 4 could be refined is the assessment of characteristics
of digital technologies. In the quantitative study of Paper 4, individuals were asked to assess
the ten characteristics of one digital technology of which they made frequent use. They were
not asked to assess the characteristics of all digital technologies in their workplace. Further, the
survey respondents were ordinary users of the digital technologies, rather than IT experts. As a
result, the assessment resulted in perceived characteristics instead of an objective assessment.
Future research could examine the objective characteristics of each technology and analyze
differences between the perceived and the objective assessment. If there are notable differences,
researchers should investigate the reasons for these differences.
Bringing the three papers together, Papers 3 and 4 assessed only a selection of potential tech-
nostress creators. Since Paper 5 advances the knowledge of these creators presenting twelve of
them, future research should study these additional technostress creators and their association
with IT consumerization on the one hand (Paper 3) and with the characteristics of digital
General Discussion and Conclusion 282
technologies on the other (Paper 4). This new set of technostress creators may also inspire fu-
ture research in other areas of technostress research, such as coping strategies for each of the
twelve technostress creators.
5.2.3 Future Research on the Topics of Chapter 4: Organizational and Social Mechanisms
as Technostress Inhibitors
While Paper 6 and Paper 7 make certain contributions to the understanding of how to mitigate
technostress as one adverse effect of workplace digitalization, both papers come with some
limitations that should be addressed by future research. First, both data sets were collected
among the German workforce, which limits generalizability across other countries and cultures.
Second, both for Paper 6 and for the first part of Paper 7, the data was collected via a cross-
sectional survey design. This goes along with limitations regarding causality of the revealed
relationships. Third, the 40 digital technologies analyzed in Paper 6 may not cover all potential
technologies in a digital workplace, and they may change in the future. In that regard, Paper 7
was conducted in the context of the COVID-19 pandemic, a time when certain major changes
occurred in the respective workplaces. Future research should, therefore, consider potential ad-
justments to digital work that may affect technostress and technostress mitigation.
On top of that, future researchers would do well to bring together organizational and social
support mechanisms and investigate potential interdependencies between them in the digital
workplace of the future. Also, other technostress creators than the ones investigated in Papers 6
and 7 may be of value in future research in order to be able to tailor the mitigation of tech-
nostress at individuals’ workplaces according to the technostress creators that the individuals
experience the most.
5.3 Conclusion
The purpose of this dissertation has been to contribute not only to the understanding of the
ongoing digitalization of individuals but also to that of technostress as one negative outcome of
this development. All seven research papers included in this dissertation serve this purpose by
providing new insights into IIS and their use, the emergence of technostress in digitalized work-
places, and organizational as well as social support mechanisms that help to mitigate tech-
nostress. In summary, this dissertation supports current efforts in both research and practice to
reduce technostress while leveraging the positive opportunities of workplace digitalization.
Top Related
Copyright © 2022 FDOKUMEN

