


Bahasa
Halaman
Hukum

lable at ScienceDirect
Materials Chemistry and Physics 143 (2014) 1540e1549
Contents lists avai
Materials Chemistry and Physics
journal homepage: www.elsevier .com/locate/matchemphys
Indiumetin nanoscaled oxides synthesized under hydrothermalsupercritical and postannealing pathway: Phase dynamics andcharacterization
L. Diamandescu a,*, D. Tarabasanu-Mihaila a, M. Feder a, M. Enculescu a, V.S. Teodorescu a,S. Constantinescu a, T. Popescu a, C. Bartha a, Zs. Pap b
aNational Institute of Materials Physics, Atomistilor 105 Bis, P.O. Box MG-7, Bucharest-Magurele 77125, Romaniab Institute of Material Science and Engineering, University of Szeged, Szeged H-6701, P.O. Box 440, Hungary
h i g h l i g h t s
� Phase dynamics study on SnCl4eInCl3 water solution under hydrothermal conditions.� InOOHeSnO2, In2O3eSnO2 nanopowders obtained by hydrothermal and postannealing route.� In the presence of Sn4þ ions, InOOH phase goes into rhombohedral In2O3 at 500 �C.� ITO like phases based on rhombohedral In2O3 have been obtained.� Solubility limits in the InOOHeSnO2 and In2O3eSnO2 nanoparticles systems evidenced.
a r t i c l e i n f o
Article history:Received 11 September 2012Received in revised form15 September 2013Accepted 30 November 2013
Keywords:OxidesNanostructuresChemical synthesisPowder diffraction
* Corresponding author. Tel.: þ40 21 3690170; fax:E-mail addresses: [email protected], ldiamandescu
0254-0584/$ e see front matter � 2013 Elsevier B.V.http://dx.doi.org/10.1016/j.matchemphys.2013.11.064
a b s t r a c t
With the aim of synthesizing the mixed nanoparticle system xIn2O3e(1�x)SnO2 over all molar con-centration range 0 � x � 1, Dx ¼ 0.1, we performed hydrothermal supercritical experiments on indiumetin hydrogel resulted from InCl3eSnCl4 water solution. Nanophases isostructural with InOOH and SnO2
were obtained by hydrothermal reaction at 400 �C, in the molar concentration range of 0.1 � x � 0.7; atx ¼ 0.8 and x ¼ 0.9 only one phase, isostructural with InOOH, was observed. Samples calcined at 500 �Cwith x in the range of 0.2 � x � 0.7 contain a nanoscaled phase isostructural with rhombohedral In2O3
and a second one isostructural with tetrahedral SnO2. At x ¼ 0.8 and x ¼ 0.9 only one phase isostructuralwith rhombohedral In2O3 appears: rhombohedral ITO phase. The determined band gap energies couldrecommend the rhombohedral ITO structure for visible light photocatalytic applications. The phasedynamics together with the concentration range for existence of the solid solutions in the InOOHeSnO2
and In2O3eSnO2 composite semiconducting nanoparticle systems have been evidenced and discussed.� 2013 Elsevier B.V. All rights reserved.
1. Introduction
In the last decade much attention has been paid to the synthesisand study of mixed nanoscaled semiconducting oxides due to theirapplications in sensing, optoelectronic devices or catalysis [1e4]. Ahuge number of oxides such as SnO2, TiO2, In2O3, WO3, Fe2O3, andmixed oxides were synthesized and studied. In particular, themixed system tin oxideeindium oxide is of great importancemainly due to the representative transparent conducting oxidecalled ITO (usually 10% SnO2e90% In2O3 by weight). ITO combinesthe property of optical transparency in the visible region with high
þ40 21 [email protected] (L. Diamandescu).
All rights reserved.
electrical conductivity being an essential component of modernoptoelectronic devices.
It is known that the electrical, catalytic and optical properties ofnanoparticles sensitively depend on their shapes and size that aremainly determined by the physico-chemical parameters of thesynthesis method. Among the chemical methods, the solvothermaltechnique has attracted a great interest because it permits to pre-pare particles with desirable characteristics by controlling the re-action parameters (temperature, time, pressure, solution pH, natureand concentration of precursors, type of solvent, presence of sur-factants etc.) [5]. In a solvothermal process, the physico-chemicalproperties (viscosity, density and polarity) of the solvent stronglyinfluence the solubility and transport behavior of solutes [6,7]. Bythe conventional hydrothermal process in subcritical water assolvent (temperatures and pressures lower than 374 �C and
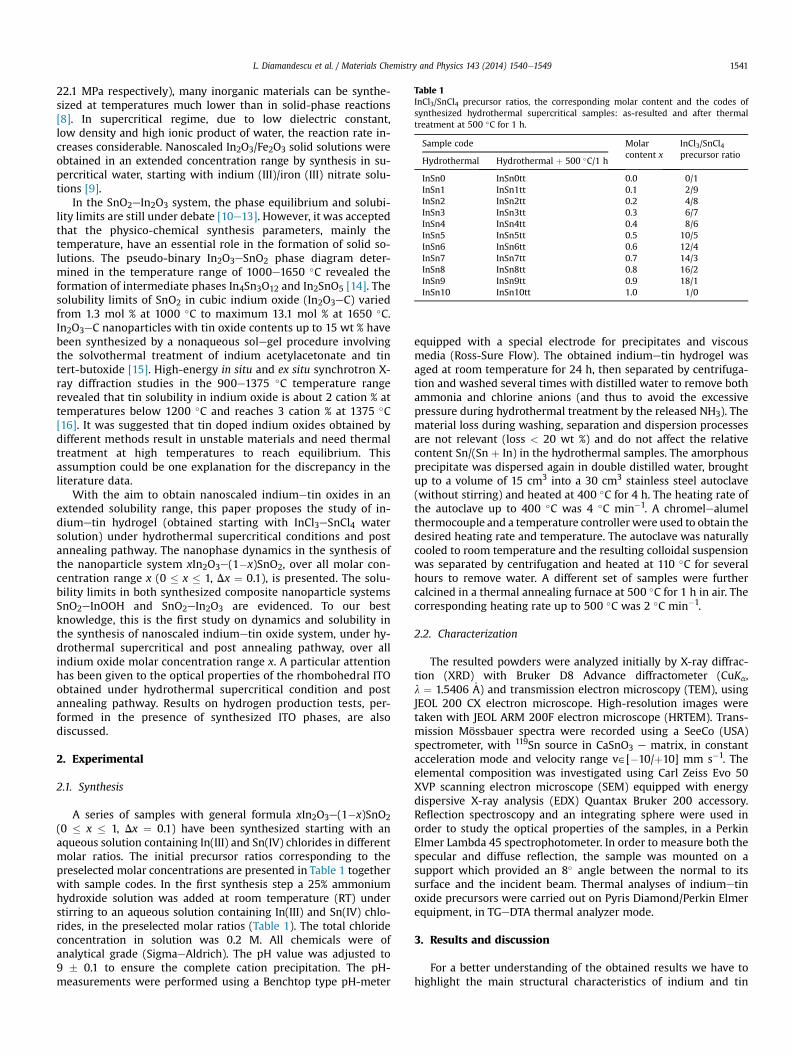
Table 1InCl3/SnCl4 precursor ratios, the corresponding molar content and the codes ofsynthesized hydrothermal supercritical samples: as-resulted and after thermaltreatment at 500 �C for 1 h.
Sample code Molarcontent x
InCl3/SnCl4precursor ratio
Hydrothermal Hydrothermal þ 500 �C/1 h
InSn0 InSn0tt 0.0 0/1InSn1 InSn1tt 0.1 2/9InSn2 InSn2tt 0.2 4/8InSn3 InSn3tt 0.3 6/7InSn4 InSn4tt 0.4 8/6InSn5 InSn5tt 0.5 10/5InSn6 InSn6tt 0.6 12/4InSn7 InSn7tt 0.7 14/3InSn8 InSn8tt 0.8 16/2InSn9 InSn9tt 0.9 18/1InSn10 InSn10tt 1.0 1/0
L. Diamandescu et al. / Materials Chemistry and Physics 143 (2014) 1540e1549 1541
22.1 MPa respectively), many inorganic materials can be synthe-sized at temperatures much lower than in solid-phase reactions[8]. In supercritical regime, due to low dielectric constant,low density and high ionic product of water, the reaction rate in-creases considerable. Nanoscaled In2O3/Fe2O3 solid solutions wereobtained in an extended concentration range by synthesis in su-percritical water, starting with indium (III)/iron (III) nitrate solu-tions [9].
In the SnO2eIn2O3 system, the phase equilibrium and solubi-lity limits are still under debate [10e13]. However, it was acceptedthat the physico-chemical synthesis parameters, mainly thetemperature, have an essential role in the formation of solid so-lutions. The pseudo-binary In2O3eSnO2 phase diagram deter-mined in the temperature range of 1000e1650 �C revealed theformation of intermediate phases In4Sn3O12 and In2SnO5 [14]. Thesolubility limits of SnO2 in cubic indium oxide (In2O3eC) variedfrom 1.3 mol % at 1000 �C to maximum 13.1 mol % at 1650 �C.In2O3eC nanoparticles with tin oxide contents up to 15 wt % havebeen synthesized by a nonaqueous solegel procedure involvingthe solvothermal treatment of indium acetylacetonate and tintert-butoxide [15]. High-energy in situ and ex situ synchrotron X-ray diffraction studies in the 900e1375 �C temperature rangerevealed that tin solubility in indium oxide is about 2 cation % attemperatures below 1200 �C and reaches 3 cation % at 1375 �C[16]. It was suggested that tin doped indium oxides obtained bydifferent methods result in unstable materials and need thermaltreatment at high temperatures to reach equilibrium. Thisassumption could be one explanation for the discrepancy in theliterature data.
With the aim to obtain nanoscaled indiumetin oxides in anextended solubility range, this paper proposes the study of in-diumetin hydrogel (obtained starting with InCl3eSnCl4 watersolution) under hydrothermal supercritical conditions and postannealing pathway. The nanophase dynamics in the synthesis ofthe nanoparticle system xIn2O3e(1�x)SnO2, over all molar con-centration range x (0 � x � 1, Dx ¼ 0.1), is presented. The solu-bility limits in both synthesized composite nanoparticle systemsSnO2eInOOH and SnO2eIn2O3 are evidenced. To our bestknowledge, this is the first study on dynamics and solubility inthe synthesis of nanoscaled indiumetin oxide system, under hy-drothermal supercritical and post annealing pathway, over allindium oxide molar concentration range x. A particular attentionhas been given to the optical properties of the rhombohedral ITOobtained under hydrothermal supercritical condition and postannealing pathway. Results on hydrogen production tests, per-formed in the presence of synthesized ITO phases, are alsodiscussed.
2. Experimental
2.1. Synthesis
A series of samples with general formula xIn2O3e(1�x)SnO2(0 � x � 1, Dx ¼ 0.1) have been synthesized starting with anaqueous solution containing In(III) and Sn(IV) chlorides in differentmolar ratios. The initial precursor ratios corresponding to thepreselected molar concentrations are presented in Table 1 togetherwith sample codes. In the first synthesis step a 25% ammoniumhydroxide solution was added at room temperature (RT) understirring to an aqueous solution containing In(III) and Sn(IV) chlo-rides, in the preselected molar ratios (Table 1). The total chlorideconcentration in solution was 0.2 M. All chemicals were ofanalytical grade (SigmaeAldrich). The pH value was adjusted to9 � 0.1 to ensure the complete cation precipitation. The pH-measurements were performed using a Benchtop type pH-meter
equipped with a special electrode for precipitates and viscousmedia (Ross-Sure Flow). The obtained indiumetin hydrogel wasaged at room temperature for 24 h, then separated by centrifuga-tion and washed several times with distilled water to remove bothammonia and chlorine anions (and thus to avoid the excessivepressure during hydrothermal treatment by the released NH3). Thematerial loss during washing, separation and dispersion processesare not relevant (loss < 20 wt %) and do not affect the relativecontent Sn/(Sn þ In) in the hydrothermal samples. The amorphousprecipitate was dispersed again in double distilled water, broughtup to a volume of 15 cm3 into a 30 cm3 stainless steel autoclave(without stirring) and heated at 400 �C for 4 h. The heating rate ofthe autoclave up to 400 �C was 4 �C min�1. A chromelealumelthermocouple and a temperature controller were used to obtain thedesired heating rate and temperature. The autoclave was naturallycooled to room temperature and the resulting colloidal suspensionwas separated by centrifugation and heated at 110 �C for severalhours to remove water. A different set of samples were furthercalcined in a thermal annealing furnace at 500 �C for 1 h in air. Thecorresponding heating rate up to 500 �C was 2 �C min�1.
2.2. Characterization
The resulted powders were analyzed initially by X-ray diffrac-tion (XRD) with Bruker D8 Advance diffractometer (CuKa,l ¼ 1.5406 �A) and transmission electron microscopy (TEM), usingJEOL 200 CX electron microscope. High-resolution images weretaken with JEOL ARM 200F electron microscope (HRTEM). Trans-mission Mössbauer spectra were recorded using a SeeCo (USA)spectrometer, with 119Sn source in CaSnO3 e matrix, in constantacceleration mode and velocity range v˛[�10/þ10] mm s�1. Theelemental composition was investigated using Carl Zeiss Evo 50XVP scanning electron microscope (SEM) equipped with energydispersive X-ray analysis (EDX) Quantax Bruker 200 accessory.Reflection spectroscopy and an integrating sphere were used inorder to study the optical properties of the samples, in a PerkinElmer Lambda 45 spectrophotometer. In order to measure both thespecular and diffuse reflection, the sample was mounted on asupport which provided an 8� angle between the normal to itssurface and the incident beam. Thermal analyses of indiumetinoxide precursors were carried out on Pyris Diamond/Perkin Elmerequipment, in TGeDTA thermal analyzer mode.
3. Results and discussion
For a better understanding of the obtained results we have tohighlight the main structural characteristics of indium and tin
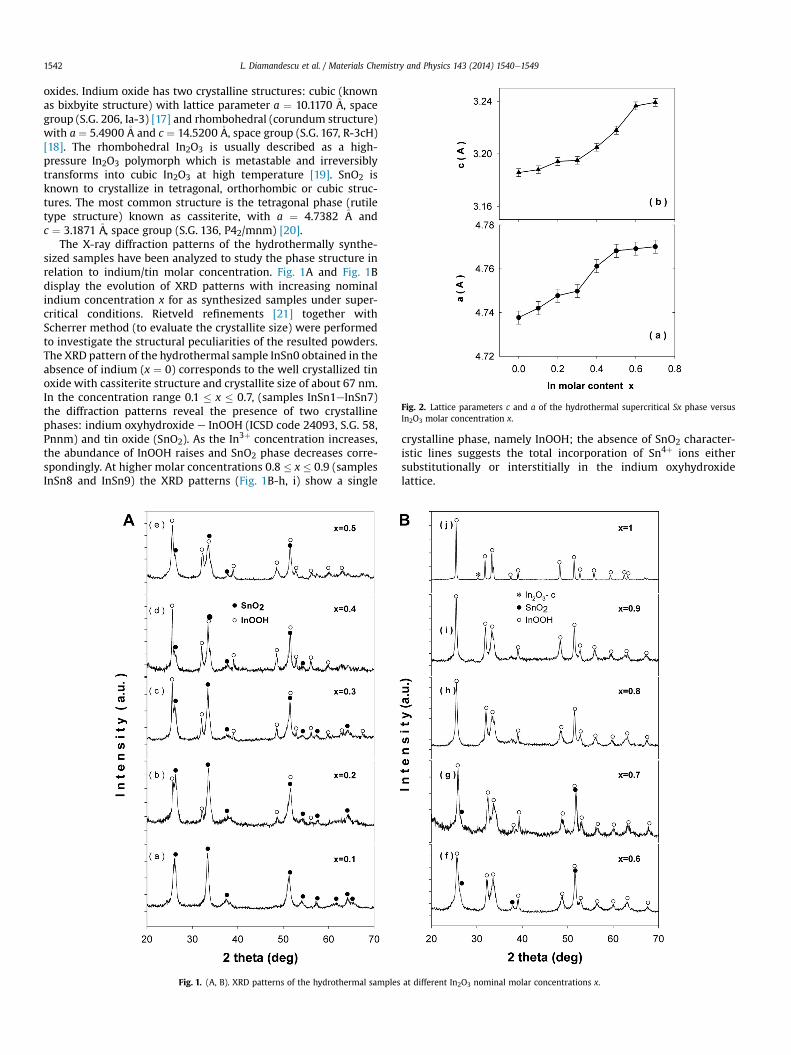
Fig. 2. Lattice parameters c and a of the hydrothermal supercritical Sx phase versusIn2O3 molar concentration x.
L. Diamandescu et al. / Materials Chemistry and Physics 143 (2014) 1540e15491542
oxides. Indium oxide has two crystalline structures: cubic (knownas bixbyite structure) with lattice parameter a ¼ 10.1170 �A, spacegroup (S.G. 206, Ia-3) [17] and rhombohedral (corundum structure)with a ¼ 5.4900�A and c ¼ 14.5200�A, space group (S.G. 167, R-3cH)[18]. The rhombohedral In2O3 is usually described as a high-pressure In2O3 polymorph which is metastable and irreversiblytransforms into cubic In2O3 at high temperature [19]. SnO2 isknown to crystallize in tetragonal, orthorhombic or cubic struc-tures. The most common structure is the tetragonal phase (rutiletype structure) known as cassiterite, with a ¼ 4.7382 �A andc ¼ 3.1871 �A, space group (S.G. 136, P42/mnm) [20].
The X-ray diffraction patterns of the hydrothermally synthe-sized samples have been analyzed to study the phase structure inrelation to indium/tin molar concentration. Fig. 1A and Fig. 1Bdisplay the evolution of XRD patterns with increasing nominalindium concentration x for as synthesized samples under super-critical conditions. Rietveld refinements [21] together withScherrer method (to evaluate the crystallite size) were performedto investigate the structural peculiarities of the resulted powders.The XRD pattern of the hydrothermal sample InSn0 obtained in theabsence of indium (x ¼ 0) corresponds to the well crystallized tinoxide with cassiterite structure and crystallite size of about 67 nm.In the concentration range 0.1 � x � 0.7, (samples InSn1eInSn7)the diffraction patterns reveal the presence of two crystallinephases: indium oxyhydroxide e InOOH (ICSD code 24093, S.G. 58,Pnnm) and tin oxide (SnO2). As the In3þ concentration increases,the abundance of InOOH raises and SnO2 phase decreases corre-spondingly. At higher molar concentrations 0.8 � x � 0.9 (samplesInSn8 and InSn9) the XRD patterns (Fig. 1B-h, i) show a single
Fig. 1. (A, B). XRD patterns of the hydrothermal samples
crystalline phase, namely InOOH; the absence of SnO2 character-istic lines suggests the total incorporation of Sn4þ ions eithersubstitutionally or interstitially in the indium oxyhydroxidelattice.
at different In2O3 nominal molar concentrations x.
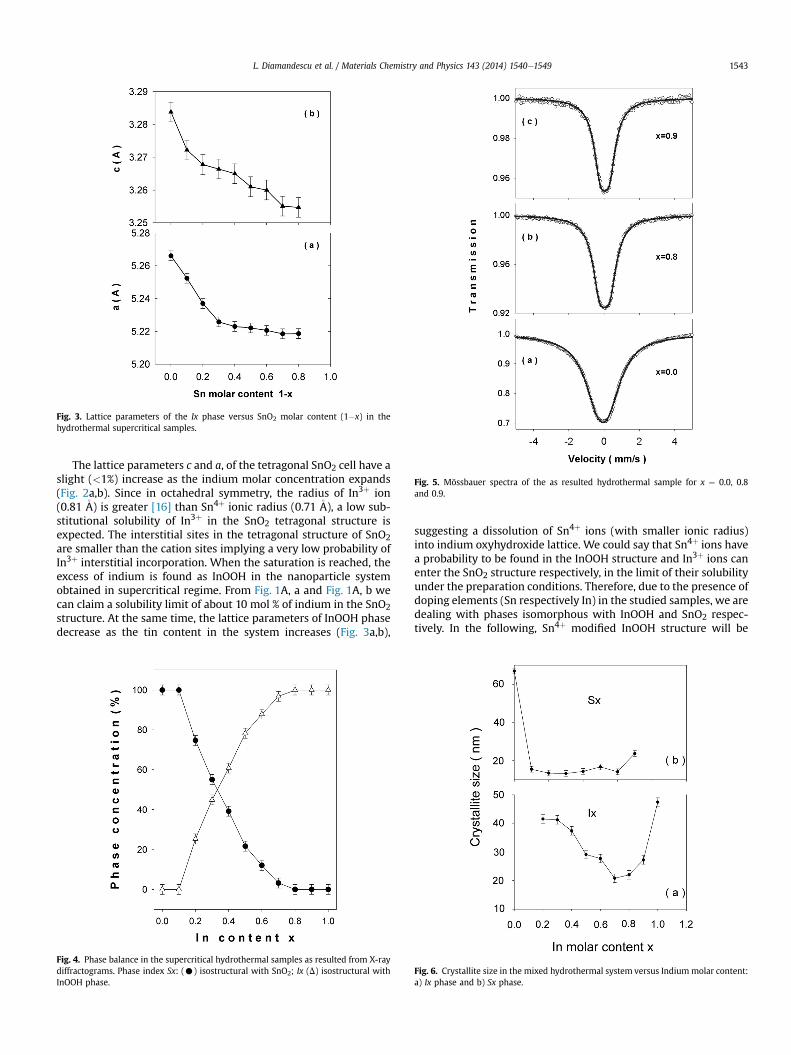
Fig. 3. Lattice parameters of the Ix phase versus SnO2 molar content (1�x) in thehydrothermal supercritical samples.
Fig. 5. Mössbauer spectra of the as resulted hydrothermal sample for x ¼ 0.0, 0.8and 0.9.
L. Diamandescu et al. / Materials Chemistry and Physics 143 (2014) 1540e1549 1543
The lattice parameters c and a, of the tetragonal SnO2 cell have aslight (<1%) increase as the indium molar concentration expands(Fig. 2a,b). Since in octahedral symmetry, the radius of In3þ ion(0.81 �A) is greater [16] than Sn4þ ionic radius (0.71 �A), a low sub-stitutional solubility of In3þ in the SnO2 tetragonal structure isexpected. The interstitial sites in the tetragonal structure of SnO2are smaller than the cation sites implying a very low probability ofIn3þ interstitial incorporation. When the saturation is reached, theexcess of indium is found as InOOH in the nanoparticle systemobtained in supercritical regime. From Fig. 1A, a and Fig. 1A, b wecan claim a solubility limit of about 10 mol % of indium in the SnO2structure. At the same time, the lattice parameters of InOOH phasedecrease as the tin content in the system increases (Fig. 3a,b),
Fig. 4. Phase balance in the supercritical hydrothermal samples as resulted from X-raydiffractograms. Phase index Sx: (C) isostructural with SnO2; Ix (D) isostructural withInOOH phase.
suggesting a dissolution of Sn4þ ions (with smaller ionic radius)into indium oxyhydroxide lattice. We could say that Sn4þ ions havea probability to be found in the InOOH structure and In3þ ions canenter the SnO2 structure respectively, in the limit of their solubilityunder the preparation conditions. Therefore, due to the presence ofdoping elements (Sn respectively In) in the studied samples, we aredealing with phases isomorphous with InOOH and SnO2 respec-tively. In the following, Sn4þ modified InOOH structure will be
Fig. 6. Crystallite size in the mixed hydrothermal system versus Indiummolar content:a) Ix phase and b) Sx phase.

Fig. 7. TG (red line) and DTA (black line) curves for the hydrothermal sample at x ¼ 0.9.(For interpretation of the references to colour in this figure legend, the reader isreferred to the web version of this article.)
L. Diamandescu et al. / Materials Chemistry and Physics 143 (2014) 1540e15491544
named ‘Ix’ phase and In3þ modified SnO2 structure will be denoted‘Sx’ phase. The phase balance in the series of samples obtained inthe hydrothermal supercritical regime starting with InCl3eSnCl4aqueous solution is represented in Fig. 4. No tin phases wereobserved at x> 0.8, suggesting a complete dissolution of Sn4þ in thelattice of Ix phase at high indium concentrations. To evidencethe presence of tin in these samples, Mössbauer measurementswere performed using 119Sn source at room temperature (RT).The Mössbauer spectra of the samples InSn0, InSn8 and InSn9 aredisplayed together with the computer fit (continuous line) inFig. 5aec. All spectra consist in a central quadrupole pattern. Thequadrupole splitting, characteristic for Sn4þ ions, varies fromw0.63 mm s�1 in the case of pure nanoscaled SnO2 (x ¼ 0.0) to
Fig. 8. (A, B). XRD patterns of the calcinated samples at 500
w0.50 mm s�1 for x ¼ 0.9, revealing changes in local symmetry at119Sn Mössbauer nucleus. The effects of Mössbauer lines are drop-ping from 30% at x ¼ 0.0 (pure SnO2 phase) tow5% for x ¼ 0.9, dueto the changes in site occupancy and relative abundance of Möss-bauer isotope in the hydrothermal samples. The Mössbauer spectrasupport the hypothesis of a complete dissolution of Sn4þ in theInOOH lattice.
At x ¼ 1 in the XRD pattern (Fig. 1B-j) besides the main InOOHphase, traces of cubic In2O3 were identified. The crystallite sizes inthe mixed hydrothermal system, calculated by the Scherrer equa-tion, are shown in Fig. 6a,b versus indium molar content x. In thepresence of indium ions the crystallite size of Sx phase drops from67 nm to nearly 13 nm with a slight tendency to increase through23 nm at x ¼ 0.7. In the case of Ix phase the crystallite size dropsfromw40 nm to 20 nm (at x ¼ 0.7) followed by an abrupt increaseup to w50 nm at x ¼ 1.0.
From the presented data we can conclude that the energy of thehydrothermal system is not enough to directly build up the indiumoxide structure, even under supercritical conditions. Therefore, anadditional thermal treatment was performed in order to obtain theoxide phase. Fig. 7 shows the curves of the dried hydrothermalsample InSn9, at a heating rate of 10 �C min�1 in air. The distinctendothermic peak at 409 �C corresponds to the formation of oxideby dehydroxylation of indium precursor. The weight drop associ-ated with the loss of hydroxyl groups occurs up to 450 �C. After thistemperature the sample weight remains constant and no otherthermal effects were observed. Consequently, a set of hydrothermalsamples were further annealed at 500 �C for 1 h.
In Fig. 8A and B the evolution of XRD patterns of the calcinedsamples with the nominal molar indium concentration x is pre-sented. The XRD pattern of the calcined sample (InSn1tt) shows a
�C for 1 h, at different nominal molar concentrations x.

Fig. 9. Lattice parameters of Sx phase versus molar content x, after calcinations at500 �C for 1 h.
L. Diamandescu et al. / Materials Chemistry and Physics 143 (2014) 1540e1549 1545
unique crystalline phase, Sx like phase, suggesting the total incor-poration of indium ions in the tin oxide lattice. In the concentrationrange 0.2 � x � 0.7, (samples InSn2tteInSn7tt) the XRD patternsreveal the presence of phases isostructural with tetrahedral SnO2(Sx like phases) and rhombohedral indium oxide In2O3 (denoted inthe following Inr). The abundance of the Sx phase decreasescontinuously as the indium concentration increases. The variationof the lattice parameters (c and a) of the Sx phase versus indiummolar content x in the series of calcined samples is presented inFig. 9a,b. The increase in the lattice parameters is an argument forthe presence of In3þ ions in the Sx structure.
Fig. 10. Lattice parameters of Inr rhombohedral phase in the system after calcinationsat 500 �C for 1 h, versus Sn molar content 1�x.
In Fig. 10a,b the dependence of the lattice parameters of the Inrphase are displayed versus tin molar concentration (1�x). The aparameter drops as the tin content increases, in agreement withthe difference in the ionic radius of In3þ and Sn4þ, while the cparameter remains practically constant. The diffractograms of thesamples InSn8tt and InSn9tt correspond to the tin substitutedrhombohedral indium oxide, Inr, no other tin phase beingobserved.
The Mössbauer spectra of the calcined samples InSn8tt andInSn9tt represented in Fig. 11b,c confirm the presence of Sn inthe analyzed specimens. The best fit with experimental pointswas obtained also in the hypothesis of a single quadrupoledoublet. The quadrupole splitting varies from w0.56 mm s�1
(InSn0tt) to w0.46 mm s�1, for InSn9tt, values characteristic forSn4þ ions. The calculated Mössbauer effects for the calcinedsamples behave similar to those found for the as resulted hy-drothermal samples (Fig. 5aec). These findings support a com-plete incorporation of Sn4þ ions in the rhombohedral In2O3structure.
In the absence of tin (x ¼ 1) the crystallization mechanism isdifferent and leads mainly to cubic indium oxide. No other IneSnphases like In2SnO5 or In4Sn3O12 were identified in XRD patterns;these two phases are high temperature phases as described in Ref.[14]. The phase content in the series of calcined samples is pre-sented in Fig. 12. The crystallite size of Inr phase (Fig. 13a) increasesfromw10 nm at x¼ 0.2 up to 30 nm at x¼ 0.9. The crystallite size ofcubic indium oxide formed at x¼ 1.0 is close to 75 nm. In the case ofSx phase of the calcinated samples one can observe (Fig. 13b) anabrupt dropping of the crystallite size fromw74 nm at x ¼ 0 to lessthan 10 nm x ¼ 0.2, showing the crucial effect of the presence of Inions in the sample.
Fig. 11. Mössbauer spectra of the calcined samples at 500 �C for 1 h, for x ¼ 0.0, 0.8 and0.9.
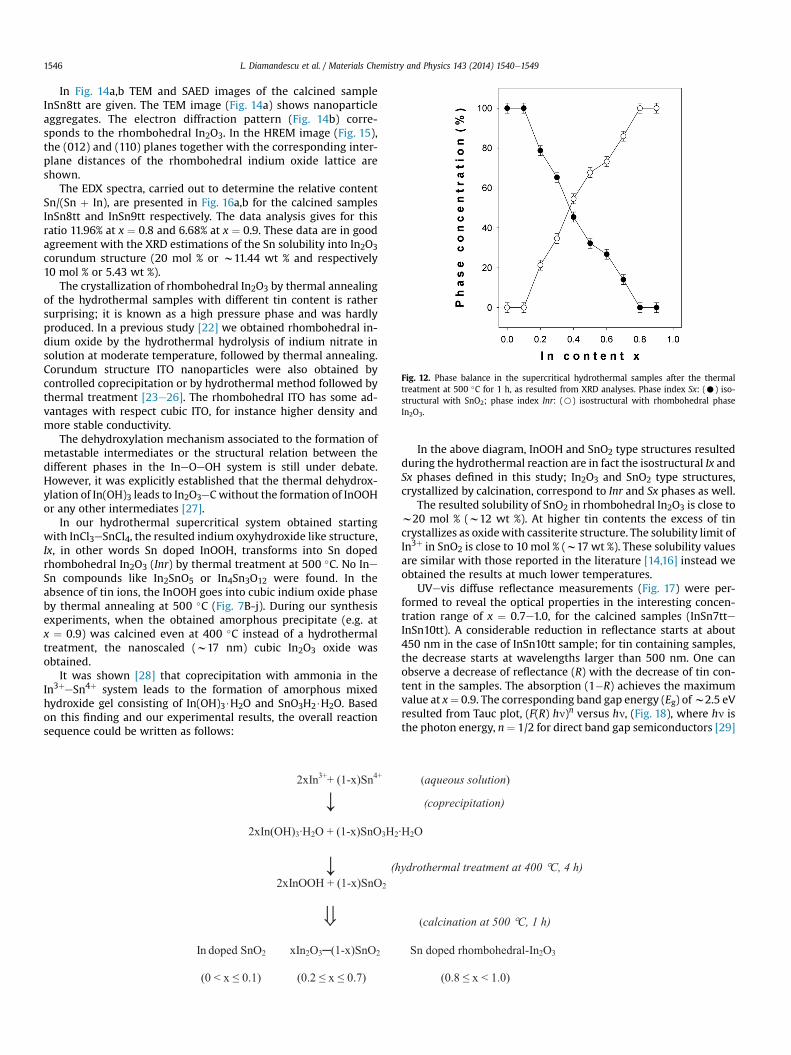
Fig. 12. Phase balance in the supercritical hydrothermal samples after the thermaltreatment at 500 �C for 1 h, as resulted from XRD analyses. Phase index Sx: (C) iso-structural with SnO2; phase index Inr: (B) isostructural with rhombohedral phaseIn2O3.
L. Diamandescu et al. / Materials Chemistry and Physics 143 (2014) 1540e15491546
In Fig. 14a,b TEM and SAED images of the calcined sampleInSn8tt are given. The TEM image (Fig. 14a) shows nanoparticleaggregates. The electron diffraction pattern (Fig. 14b) corre-sponds to the rhombohedral In2O3. In the HREM image (Fig. 15),the (012) and (110) planes together with the corresponding inter-plane distances of the rhombohedral indium oxide lattice areshown.
The EDX spectra, carried out to determine the relative contentSn/(Sn þ In), are presented in Fig. 16a,b for the calcined samplesInSn8tt and InSn9tt respectively. The data analysis gives for thisratio 11.96% at x ¼ 0.8 and 6.68% at x ¼ 0.9. These data are in goodagreement with the XRD estimations of the Sn solubility into In2O3corundum structure (20 mol % or w11.44 wt % and respectively10 mol % or 5.43 wt %).
The crystallization of rhombohedral In2O3 by thermal annealingof the hydrothermal samples with different tin content is rathersurprising; it is known as a high pressure phase and was hardlyproduced. In a previous study [22] we obtained rhombohedral in-dium oxide by the hydrothermal hydrolysis of indium nitrate insolution at moderate temperature, followed by thermal annealing.Corundum structure ITO nanoparticles were also obtained bycontrolled coprecipitation or by hydrothermal method followed bythermal treatment [23e26]. The rhombohedral ITO has some ad-vantages with respect cubic ITO, for instance higher density andmore stable conductivity.
The dehydroxylation mechanism associated to the formation ofmetastable intermediates or the structural relation between thedifferent phases in the IneOeOH system is still under debate.However, it was explicitly established that the thermal dehydrox-ylation of In(OH)3 leads to In2O3eCwithout the formation of InOOHor any other intermediates [27].
In our hydrothermal supercritical system obtained startingwith InCl3eSnCl4, the resulted indium oxyhydroxide like structure,Ix, in other words Sn doped InOOH, transforms into Sn dopedrhombohedral In2O3 (Inr) by thermal treatment at 500 �C. No IneSn compounds like In2SnO5 or In4Sn3O12 were found. In theabsence of tin ions, the InOOH goes into cubic indium oxide phaseby thermal annealing at 500 �C (Fig. 7B-j). During our synthesisexperiments, when the obtained amorphous precipitate (e.g. atx ¼ 0.9) was calcined even at 400 �C instead of a hydrothermaltreatment, the nanoscaled (w17 nm) cubic In2O3 oxide wasobtained.
It was shown [28] that coprecipitation with ammonia in theIn3þeSn4þ system leads to the formation of amorphous mixedhydroxide gel consisting of In(OH)3$H2O and SnO3H2$H2O. Basedon this finding and our experimental results, the overall reactionsequence could be written as follows:
In the above diagram, InOOH and SnO2 type structures resultedduring the hydrothermal reaction are in fact the isostructural Ix andSx phases defined in this study; In2O3 and SnO2 type structures,crystallized by calcination, correspond to Inr and Sx phases as well.
The resulted solubility of SnO2 in rhombohedral In2O3 is close tow20 mol % (w12 wt %). At higher tin contents the excess of tincrystallizes as oxidewith cassiterite structure. The solubility limit ofIn3þ in SnO2 is close to 10 mol % (w17 wt %). These solubility valuesare similar with those reported in the literature [14,16] instead weobtained the results at much lower temperatures.
UVevis diffuse reflectance measurements (Fig. 17) were per-formed to reveal the optical properties in the interesting concen-tration range of x ¼ 0.7e1.0, for the calcined samples (InSn7tteInSn10tt). A considerable reduction in reflectance starts at about450 nm in the case of InSn10tt sample; for tin containing samples,the decrease starts at wavelengths larger than 500 nm. One canobserve a decrease of reflectance (R) with the decrease of tin con-tent in the samples. The absorption (1�R) achieves the maximumvalue at x¼ 0.9. The corresponding band gap energy (Eg) ofw2.5 eVresulted from Tauc plot, (F(R) hn)n versus hn, (Fig. 18), where hn isthe photon energy, n¼ 1/2 for direct band gap semiconductors [29]

Fig. 13. Crystallite size of hydrothermally synthesized samples after calcination at500 �C for 1 h, versus Indium molar content: a) Inr phase and b) Sx phase.
Fig. 15. HRETM image of the calcined xIn2O3e(1ex)SnO2 sample with nominal con-centration x ¼ 0.8.
L. Diamandescu et al. / Materials Chemistry and Physics 143 (2014) 1540e1549 1547
and F(R) is KubelkaeMunk function, as described in a previouswork [30]. The band gap energies were deduced from the inter-section of the Tauc’s region extrapolation with the photon energyaxis in Fig. 18. The lower band gap energy (w2.5 eV) was found forthe sample InSn9tt. This Eg value together with the absorption inthe region of 500 nm or higher could recommend the rhombohe-dral ITO, synthesized under hydrothermal supercritical and post-annealing pathway, as photocatalyst in visible light region.
In the recent literature, ITO based materials are mentioned tohave the “ability” to produce hydrogen (in some cases multi layerthis films coupled with other oxides, such as doped titania [31,32])by photocatalytic/photoelectrocatalytic means, under visible light.To uncover the truth, behind this issue, a two step verificationmeasurementwas performed according to our previous publication[33] for the samples InSn8tt, InSn9tt and InSn10tt. Shortly, the firststep was to verify the activity of these materials towards the holescavenger (oxalic acid) utilizing UV or visible light (under N2 at-mosphere). No oxalic acid degradationwas observed in any cases ofthe preliminary tests suggesting these materials are not suitable forpure photocatalytic hydrogen production. The second step was theverification of the produced hydrogen quantity. The obtainedhydrogen quantity was scarce and below the detection limit of the
Fig. 14. TEM image (a), and electron diffraction pattern (b) of the calcin
gas chromatograph. Both verification procedures showed clearlythat no hydrogen can be produced (and no hole scavenger degra-dation was observed either) by this method. This behavior can bedue to several reasons, such as extremely low quantum efficiency(i.e. Fe2O3), high hydrogen evolution overpotential (bias) etc. Thatmeans some other strategies have to be applied to activate thesematerials for photocatalytic hydrogen production, such as noblemetal deposition [33], coupling with other oxides or apply a certainbias to overcome the hydrogen production overpotential on thesenanocomposites.
4. Conclusions
Indiumetin nanoscaled oxides, xIn2O3e(1�x)SnO2 (0 � x � 1),were synthesized under hydrothermal supercritical conditions andpostannealing pathway, starting with InCl3eSnCl4 water solution.In the concentration range 0.1 � x � 0.7, by hydrothermal reactionat 400 �C, mixtures of phases isostructural with InOOH and SnO2,were obtained. At higher indium contents (x¼ 0.8 and x¼ 0.9) onlyone phase, isostructural with InOOH, is observed. In the absence oftin (x ¼ 1) the InOOH hydrothermal precursor transforms, bythermal treatment at 500 �C for 1 h, into cubic indium oxide. In thepresence of tin, the calcined samples with the nominal indiumconcentrations 0.2 � x � 0.7 contain two nanoscaled phases: firstone isostructural with rhombohedral In2O3 and the second oneisostructural with tetrahedral SnO2; the abundance of the tin oxidelike phase decreases continuously with increasing indium con-centration. At high indium concentrations (x¼ 0.8 and x¼ 0.9) onlyone phase isostructural with rhombohedral In2O3 appears; this isan ITO like phase based on rhombohedral indium oxide. No other
ed xIn2O3e(1ex)SnO2 sample with nominal concentration x ¼ 0.8.
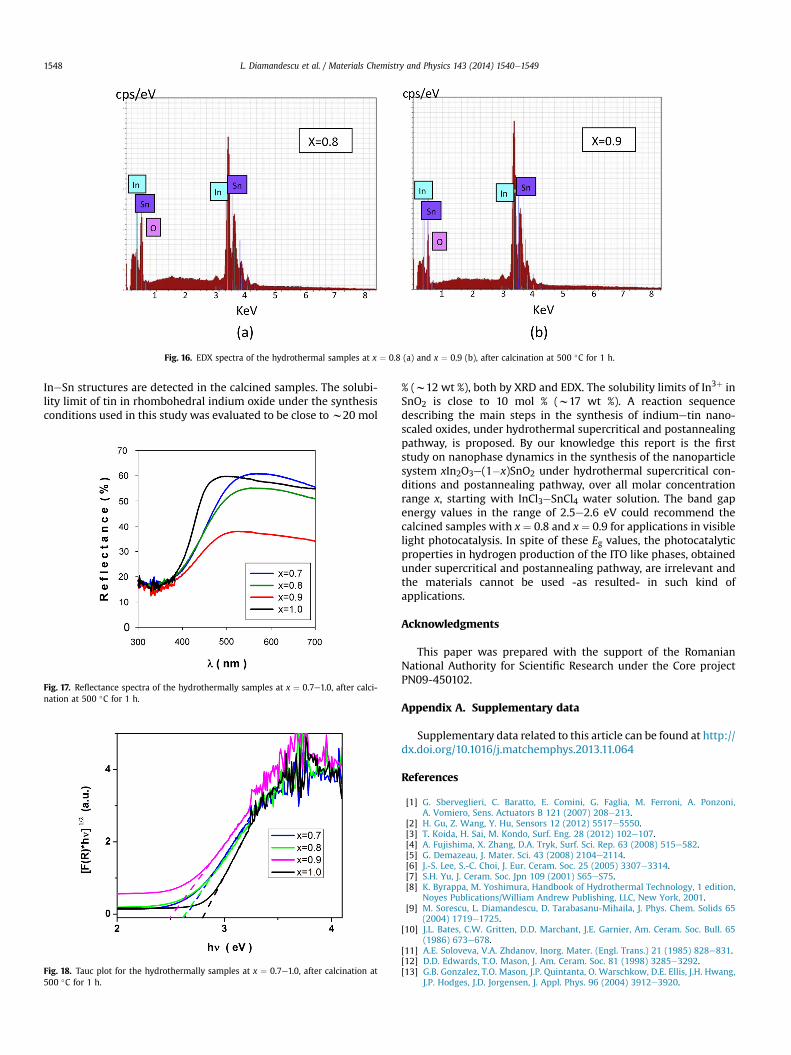
Fig. 16. EDX spectra of the hydrothermal samples at x ¼ 0.8 (a) and x ¼ 0.9 (b), after calcination at 500 �C for 1 h.
L. Diamandescu et al. / Materials Chemistry and Physics 143 (2014) 1540e15491548
IneSn structures are detected in the calcined samples. The solubi-lity limit of tin in rhombohedral indium oxide under the synthesisconditions used in this study was evaluated to be close tow20 mol
Fig. 17. Reflectance spectra of the hydrothermally samples at x ¼ 0.7e1.0, after calci-nation at 500 �C for 1 h.
Fig. 18. Tauc plot for the hydrothermally samples at x ¼ 0.7e1.0, after calcination at500 �C for 1 h.
% (w12 wt %), both by XRD and EDX. The solubility limits of In3þ inSnO2 is close to 10 mol % (w17 wt %). A reaction sequencedescribing the main steps in the synthesis of indiumetin nano-scaled oxides, under hydrothermal supercritical and postannealingpathway, is proposed. By our knowledge this report is the firststudy on nanophase dynamics in the synthesis of the nanoparticlesystem xIn2O3e(1�x)SnO2 under hydrothermal supercritical con-ditions and postannealing pathway, over all molar concentrationrange x, starting with InCl3eSnCl4 water solution. The band gapenergy values in the range of 2.5e2.6 eV could recommend thecalcined samples with x ¼ 0.8 and x ¼ 0.9 for applications in visiblelight photocatalysis. In spite of these Eg values, the photocatalyticproperties in hydrogen production of the ITO like phases, obtainedunder supercritical and postannealing pathway, are irrelevant andthe materials cannot be used -as resulted- in such kind ofapplications.
Acknowledgments
This paper was prepared with the support of the RomanianNational Authority for Scientific Research under the Core projectPN09-450102.
Appendix A. Supplementary data
Supplementary data related to this article can be found at http://dx.doi.org/10.1016/j.matchemphys.2013.11.064
References
[1] G. Sberveglieri, C. Baratto, E. Comini, G. Faglia, M. Ferroni, A. Ponzoni,A. Vomiero, Sens. Actuators B 121 (2007) 208e213.
[2] H. Gu, Z. Wang, Y. Hu, Sensors 12 (2012) 5517e5550.[3] T. Koida, H. Sai, M. Kondo, Surf. Eng. 28 (2012) 102e107.[4] A. Fujishima, X. Zhang, D.A. Tryk, Surf. Sci. Rep. 63 (2008) 515e582.[5] G. Demazeau, J. Mater. Sci. 43 (2008) 2104e2114.[6] J.-S. Lee, S.-C. Choi, J. Eur. Ceram. Soc. 25 (2005) 3307e3314.[7] S.H. Yu, J. Ceram. Soc. Jpn 109 (2001) S65eS75.[8] K. Byrappa, M. Yoshimura, Handbook of Hydrothermal Technology, 1 edition,
Noyes Publications/William Andrew Publishing, LLC, New York, 2001.[9] M. Sorescu, L. Diamandescu, D. Tarabasanu-Mihaila, J. Phys. Chem. Solids 65
(2004) 1719e1725.[10] J.L. Bates, C.W. Gritten, D.D. Marchant, J.E. Garnier, Am. Ceram. Soc. Bull. 65
(1986) 673e678.[11] A.E. Soloveva, V.A. Zhdanov, Inorg. Mater. (Engl. Trans.) 21 (1985) 828e831.[12] D.D. Edwards, T.O. Mason, J. Am. Ceram. Soc. 81 (1998) 3285e3292.[13] G.B. Gonzalez, T.O. Mason, J.P. Quintanta, O. Warschkow, D.E. Ellis, J.H. Hwang,
J.P. Hodges, J.D. Jorgensen, J. Appl. Phys. 96 (2004) 3912e3920.

L. Diamandescu et al. / Materials Chemistry and Physics 143 (2014) 1540e1549 1549
[14] W.J. Heward, D.J. Swenson, J. Mater. Sci. 42 (2007) 7135e7140.[15] J. Ba, D. Fattakhova-Rohlfing, A. Feldhoff, T. Brezesinki, I. Djerdj, M. Wark,
M. Niederberger, Chem. Mater 18 (2006) 2848e2854.[16] G.B. Gonzales, T.O. Mason, J.S. Okasinski, T. Buslaps, V. Honkimäki, J. Am.
Ceram. Soc. 95 (2012) 809e815.[17] N. Naduad, N. Lequeux, M. Nanot, J. Jove, T. Roisnel, J. Solid State Chem. 135
(1998) 140e148.[18] C.T. Prewitt, R.D. Shannon, D.B. Rogers, A.W. Sleight, Inorg. Chem. 8 (1969)
1985e1993.[19] A. Gurlo, S. Lauterbach, G. Miehe, H.J. Kleebe, R. Riedel, J. Phys. Chem. C 112
(2008) 9209e9213.[20] Norman N. Greenwood, A. Earnshaw, Chemistry of the Elements, Pergamon
Press, Oxford, 1984.[21] H.M. Rietveld, Acta Crystallogr. 22 (1967) 151e152.[22] M. Sorescu, L. Diamandescu, D. Tarabasanu-Mihaila, V.S. Teodorescu, J. Mater.
Sci. 39 (2004) 675e677.[23] Y.Y. Gu, L.P. Qin, X.Y. Liu, J. Cent. South Univ. Technol. 13 (2006) 389e392.
[24] B.C. Kim, J.Y. Kim, D.-D. Lee, J.O. Lim, J.-S. Huh, Sens. Actuators B Chem. 89(2003) 180e186.
[25] A. Solieman, S. Alamri, M. Aegerter, J. Nanopart. Res. 12 (2010) 2381e2385.[26] A. Solieman, M.K. Zayed, S.N. Alamri, N. Al-Dahoudi, M.A. Aegerter, Mater.
Chem. Phys. 134 (2012) 127e132.[27] L. Schlicker, R. Riedel, A. Gurlo, Nanotechnology 20 (2009) 495702.[28] N.C. Pramanik, P.K. Biswas, Bull. Mater. Sci. 25 (2002) 505e507.[29] J. Tauc, R. Grigorovici, A. Vancu, Phys. Status Solidi 15 (1966) 627e637.[30] L. Diamandescu, F. Vasiliu, D. Tarabasanu-Mihaila, M. Feder, A.M. Vlaicu,
C.M. Teodorescu, D. Macovei, I. Enculescu, V. Parvulescu, E. Vasile, Mater.Chem. Phys 112 (2008) 146e153.
[31] R. Dholam, N. Patel, A. Santini, A. Miotello, Int. J. Hydrogen Energy 35 (2010)9581e9590.
[32] R. Dholam, N. Patel, A. Miotello, Int. J. Hydrogen Energy 36 (2011) 6519e6528.[33] É. Karácsonyi, L. Baia, A. Dombi, V. Danciu, K. Mogyorósi, L.C. Pop, G. Kovács,
V. Cosoveanu, A. Vulpoi, S. Simon, Zs. Pap, Catal. Today 208 (2013) 19e27.
Top Related
Copyright © 2022 FDOKUMEN

