


Bahasa
Halaman
Hukum


ORIGINAL PAPER
Increased abundance of the non-indigenous zooplanktivore,Bythotrephes longimanus, is strongly correlated with greaterspring prey availability in Canadian Shield lakes
Joelle D. Young • Angela L. Strecker •
Norman D. Yan
Received: 5 July 2010 / Accepted: 17 January 2011 / Published online: 21 August 2011
� Springer Science+Business Media B.V. 2011
Abstract The non-indigenous zooplanktivore, By-
thotrephes longimanus, is a large Palaearctic cladoc-
eran that is spreading rapidly in the Great Lakes
watershed in North America. As a voracious predator,
Bythotrephes can reduce herbivorous cladoceran
abundance and diversity; however, the variables that
affect its abundance are not well understood. To
determine what bottom-up factors are associated with
the abundance and seasonal dynamics of established
Bythotrephes populations, two Bythotrephes datasets
from lakes in south-central Ontario, Canada, were
analysed using multiple regression and multivariate
analyses: a multi-lake dataset of nine lakes sampled
in 2003 and a multi-year dataset of one of these lakes,
Harp Lake, sampled from 1994–1998 and
2001–2004. Bottom-up variables tested were Secchi
disk depth, epilimnetic temperature, cladoceran
(prey) density, total phosphorus, dissolved organic
carbon and Chlorophyll a, as well as maximum depth
for the multi-lake dataset. In both analyses and
datasets, springtime abundance of herbivorous cla-
docerans was consistently found to be a significant
factor associated with Bythotrephes (June–September)
abundance; Bythotrephes annual abundance was
significantly and positively associated with mean
May and June prey abundance, along with mean
Secchi disk depth for the multi-lake dataset, and
groups of lakes or years with similar Bythotrephes
seasonal abundance patterns were predicted by June
prey abundance. Additionally, prey availability was
the dominant contributor towards changes in weekly
Bythotrephes birth rates calculated for two of the
study lakes. Our study suggests that prey availability
influences Bythotrephes abundance, which provides
evidence that Bythotrephes establishment success is
affected by the abundance of its prey.
Keywords Bythotrephes longimanus � Seasonal
abundance � Visual predation � Cladoceran
zooplankton � Harp Lake
J. D. Young � N. D. Yan
Biology Department, York University, Toronto,
ON M3J 1P3, Canada
Present Address:J. D. Young (&)
Water Monitoring Section,
Ontario Ministry of the Environment, Toronto,
ON M9P 3V6, Canada
e-mail: [email protected]
A. L. Strecker
Department of Biology, Queen’s University, Kingston,
ON K7L 3N6, Canada
Present Address:A. L. Strecker
School of Aquatic and Fishery Sciences,
University of Washington, Seattle,
WA 98105, USA
N. D. Yan
Dorset Environmental Science Centre,
Ontario Ministry of the Environment,
Dorset, ON P0A 1E0, Canada
123
Biol Invasions (2011) 13:2605–2619
DOI 10.1007/s10530-011-0077-9

Introduction
Bythotrephes longimanus is a Palaearctic cladoceran
that was first detected in the Great Lakes in the early
1980s (Johannsson et al. 1991) and has since
invaded [140 North American lakes (Branstrator
et al. 2006; Weisz and Yan 2010; Muirhead and
MacIsaac 2011). The invader is a voracious and
active predator that consumes a large number of
zooplankton each day, with a preference for herbiv-
orous cladocerans (Vanderploeg et al. 1993;
Burkhardt and Lehman 1994; Wahlstrom and West-
man 1999; Grigorovich et al. 1998). Consequently,
zooplankton species richness and abundance, partic-
ularly of cladocerans, have declined in invaded lakes
in which Bythotrephes is abundant (Yan et al. 2002;
Boudreau and Yan 2003; Barbiero and Tuchman
2004; Strecker et al. 2006). However, Bythotrephes
abundance exhibits considerable variability among
and within lakes, and, as we do not currently
understand the key factors controlling its abundance,
we cannot predict the degree of impact Bythotrephes
will have in individual lakes.
The population dynamics of a cladoceran species
are directly driven by bottom-up and/or top-down
regulation (e.g., Hall 1964; Lampert et al. 1989;
Luecke et al. 1990). Given that Bythotrephes is a
voracious predator, prey availability would likely be
an important bottom-up regulator of its abundance.
Dumitru et al. (2001) and Strecker and Arnott (2008)
observed that Bythotrephes consumption rates on
occasion exceeded prey production rates, i.e., prey
could limit Bythotrephes production. Because
Bythotrephes is mostly situated in the metalimnion
during the day (Young and Yan 2008) and is
primarily a visual feeder, the depth of light penetra-
tion would affect its feeding rates (Muirhead and
Sprules 2003; Pangle and Peacor 2009), and conse-
quently its abundance. This may explain why
Bythotrephes is most commonly present, and often
most abundant, in clear, oligotrophic lakes, which
are also deep (MacIsaac et al. 2000; Therriault et al.
2002; Branstrator et al. 2006; Manca et al. 2007;
Weisz and Yan 2010). Warmer water temperatures
might increase Bythotrephes abundance, as Bytho-
trephes per capita birth rates are temperature depen-
dent (Yurista 1992), and population maxima can
coincide with peak summer temperatures (Rivier
1998; Brown 2006).
The primary top-down regulator of Bythotrephes is
predation from both warm- and cold-water planktiv-
orous fish (Coulas et al. 1998; Jarnagin et al. 2004).
Macroinvertebrate predators are likely unimportant
predators of Bythotrephes (Foster and Sprules 2010),
although it can be consumed by Mysis relicta (Nordin
et al. 2008). In contrast, it has been suggested that
Bythotrephes was eliminated by planktivorous fishes
in some European lakes when fish densities were
sufficiently large (Langeland 1978; Stenson 1978;
Nilsson 1979). In North American lakes, planktivory
by cold-water fish species, such as Coregonus artedi
(cisco or lake herring) or Osmerus mordax (rainbow
smelt), and the warm-water Perca flavescens (yellow
perch) were implicated in up to 50% of Bythotrephes
mortality in Harp Lake, Ontario, and Lake Michig-
amme, Michigan (Hall and Yan 1997; Jarnagin et al.
2004). Additionally, a refuge initially hypothesized to
afford Bythotrephes protection from cisco (Yan and
Pawson 1998; Yan et al. 2001) now seems unlikely to
exist in most Canadian Shield lakes (Young et al.
2009).
A variety of Bythotrephes abundance patterns
among and within lakes have been observed. After
establishment, Bythotrephes can be virtually absent in
some lakes or years while in others it is very
abundant (Cairns et al. 2007). Seasonal Bythotrephes
patterns can also vary enormously from lake to lake
or year to year within the same lake, ranging from
sustained stable densities, to single or multiple
population peaks (e.g., Yan and Pawson 1998). It is
currently not clear what regulates these Bythotrephes
abundance patterns, which is unfortunate given that
impacts on prey appear to vary with Bythotrephes
abundance (Boudreau and Yan 2003). Our objective
was to identify the bottom-up variables that are
associated with mean Bythotrephes annual abundance
and seasonal abundance patterns in established
Bythotrephes populations. We focussed on bottom-
up variables that could affect Bythotrephes abun-
dance because of the difficulty in acquiring accurate
temporal data on fish abundances in multiple lakes.
Methods
Nine lakes in south-central Ontario, Canada, with
established Bythotrephes populations were sampled
(Table 1). The lakes were oligo- to meso-trophic with
2606 J. D. Young et al.
123

Ta
ble
1M
ean
ann
ual
Byt
ho
trep
hes
abu
nd
ance
(±1
stan
dar
dd
evia
tio
n),
and
bo
tto
m-u
pv
aria
ble
sfo
r(a
)th
em
ult
i-la
ke
dat
aset
,an
d(b
)th
em
ult
i-y
ear
(Har
pL
ake)
dat
aset
An
nu
al
Byt
ho
(no
.m
-3)
pH
TP
(lg
L-
1)
DO
C
(mg
L-
1)
Ch
la
(lg
L-
1)
Sec
chi
dep
th
(m)
Sp
rin
g
tem
p
(8C
)
Su
mm
er
tem
p
(8C
)
Sp
rin
g
pre
y
(no
.m
-3)
Su
mm
er
pre
y
(no
.m
-3)
Max
dep
th
(m)
Su
rfac
e
area
(ha)
Yea
r
Byt
ho
det
ecte
d
(a)
Ber
nar
d6
.1±
5.1
7.1
39
.56
3.4
1.9
53
.75
13
.12
0.8
71
29
.65
.62
47
.92
05
7.7
19
98
Fai
ry1
.4±
1.3
6.9
56
.98
5.9
0.8
32
.43
15
.42
2.1
17
37
7.2
71
26
.46
9.5
71
1.5
19
90
Har
p3
.9±
3.9
6.9
87
.22
6.7
2.3
13
.52
17
.62
2.4
45
15
.52
74
6.8
37
.57
1.7
19
93
Lak
eo
fB
ays
2.7
±2
.36
.97
3.3
85
.12
.08
4.2
21
3.9
22
.02
07
6.4
78
4.6
70
.16
90
4.1
19
95
Mar
y1
.7±
1.0
6.9
67
.21
6.6
2.4
82
.38
15
.12
2.0
11
48
7.1
68
54
.75
6.4
10
65
.41
99
0
Mu
sko
ka
1.7
±1
.07
.02
5.5
05
.53
.96
2.8
21
5.1
22
.13
31
0.0
58
21
.96
6.5
12
20
6.0
19
89
Pen
insu
la9
.0±
5.4
7.1
49
.00
6.1
2.0
83
.29
16
.02
2.3
43
62
6.4
18
70
7.8
34
.18
64
.81
99
1
Sk
elet
on
0.3
±0
.46
.94
3.8
22
.60
.49
7.3
81
2.9
21
.33
2.7
14
35
.96
4.7
21
55
.51
99
8
Ver
no
n4
.1±
3.5
6.7
57
.90
7.1
2.0
22
.50
17
.12
1.4
12
86
3.5
39
72
.73
7.2
15
05
.11
99
1
(b)
19
94
2.2
±3
.76
.29
6.8
03
.79
2.1
04
.20
15
.72
1.3
12
97
.69
09
.5
19
95
1.8
±1
.66
.36
6.1
94
.08
2.4
14
.10
20
.02
0.6
25
38
.43
45
1.0
19
96
0.3
±0
.26
.28
5.4
44
.13
3.4
03
.55
11
.62
1.2
82
.61
49
6.0
19
97
0.8
±0
.66
.32
5.6
33
.67
1.8
84
.46
12
.92
0.0
28
2.9
17
35
.9
19
98
3.4
±4
.36
.45
5.9
83
.52
2.6
24
.93
19
.52
1.3
27
90
.12
96
1.5
20
01
2.6
±2
.46
.33
5.3
64
.03
2.6
84
.65
16
.82
1.4
80
2.6
10
23
.3
20
02
2.5
±3
.26
.43
6.0
43
.75
1.1
74
.36
16
.52
2.3
57
9.9
21
85
.2
20
03
3.4
±3
.46
.42
6.3
53
.92
1.8
04
.49
15
.32
1.7
22
07
.45
20
05
.23
20
04
3.0
±3
.76
.44
5.9
04
.06
1.8
94
.38
18
.52
0.7
19
29
.92
23
01
.63
An
nu
alB
yth
o=
mea
nJu
ne
toS
epte
mb
erB
yth
otr
eph
esab
un
dan
ce,
TP
=to
tal
ph
osp
ho
rus,
DO
C=
dis
solv
edo
rgan
icca
rbo
n,
Ch
la=
Ch
loro
ph
yll
a,
Sec
chi
dep
th=
mea
nic
e-
free
(all
dat
essa
mp
led
)S
ecch
id
isk
dep
th,
Sp
rin
gte
mp
=M
ean
May
and
Jun
eep
ilim
net
icte
mp
erat
ure
,S
um
mer
tem
p=
Mea
nJu
lyto
Sep
tem
ber
epil
imn
etic
tem
per
atu
re,
Sp
rin
gp
rey
=M
ean
May
and
Jun
eh
erb
ivo
rou
scl
ado
cera
nab
un
dan
ce,
Su
mm
erp
rey
=M
ean
July
toS
epte
mb
erh
erb
ivo
rou
scl
ado
cera
nab
un
dan
ce,
Max
dep
th=
max
imu
m
dep
th,
Yea
rB
yth
od
etec
ted
=th
ey
ear
that
Byt
ho
trep
hes
was
firs
td
etec
ted
inea
chla
ke.
pH
,T
P,
DO
Can
dC
hla
are
fro
mJu
ly1
4fo
rth
em
ult
i-y
ear
dat
aset
and
are
ice-
free
mea
ns
for
the
mu
lti-
yea
rd
atas
et
Increased abundance of the non-indigenous zooplanktivore 2607
123
circumneutral pH and planktivorous fish communities
consisting of yellow perch, cisco and/or rainbow
smelt (Strecker et al. 2006).
To test for factors that affect Bythotrephes annual
and seasonal abundance, two datasets were compiled
containing information on Bythotrephes abundance
and potential bottom-up factors (zooplankton abun-
dance, temperature profiles, Secchi disk depth and
water chemistry). A multi-lake dataset consisted of
data from the nine lakes sampled in 2003 as part of a
study on the effect of Bythotrephes on zooplankton
communities (Strecker et al. 2006; Strecker and
Arnott 2008). A multi-year dataset consisted of nine
years of data (1994 to 1998 and 2001 to 2004) from
Harp Lake. Harp Lake has been monitored through
the ice-free season by the Ontario Ministry of the
Environment (OMOE) since 1977. Bythotrephes was
first observed in Harp Lake in routine zooplankton
samples in 1993 (Yan and Pawson 1997), and an
intense and independent Bythotrephes monitoring
program was initialized on the lake by the OMOE in
1994 (Yan and Pawson 1998) that has continued
through most ice-free seasons ever since. In addition,
we collected weekly samples of Bythotrephes and
temperature profiles in Harp Lake in 2003 and in
Peninsula Lake in 2004 so that per capita birth rates
could be calculated. Harp Lake was chosen due to its
long term Bythotrephes sampling record, and Penin-
sula Lake was chosen because the Bythotrephes
seasonal abundance in 2003 differed substantially
from the pattern typical of Harp Lake.
Sample collection
The nine lakes comprising the multi-lake dataset were
sampled every two weeks over a five day period. From
June to August, Bythotrephes were collected at 5
stations, a deep lake station as well as 4 other
stations \1 km apart, while in September, Bythotre-
phes were collected only at the deep station. At each
station, Bythotrephes were collected from 5 m off the
lake bottom to the lake surface with a 400-lm mesh,
0.5-m diameter mouth, 2.5-m net (Strecker et al.
2006). From May to September at the deep station,
samples of zooplankton were collected and vertical
temperature profiles (at 1-m increments) and Secchi
disk depth were measured. Zooplankton were col-
lected separately from the epilimnion, metalimnion
and hypolimnion with a conical closing net that had
110-lm mesh and 0.5-m diameter mouth (Strecker and
Arnott 2008). The epilimnion was defined as the
surface layer where temperature decreased by less than
1�C m-1 and the metalimnion was the layer where
temperature changed more than 0.2�C m-1. Once in
the middle of the summer (during the week of July 14),
water samples for the purpose of chemical analyses
were collected at the deep station from the epilimnion
with a 2.5-cm diameter integrated tube sampler. In 7 of
the lakes, the ‘deep station’ was the deepest position in
the lake; however, this was inaccessible for Muskoka
Lake and Lake of Bays thus they were sampled at a
secondary deep spot that was not much shallower.
For the multi-year dataset, Bythotrephes were
collected in Harp Lake every 1–4 weeks at 10 stations
following a protocol designed by Yan and Pawson
(1998). Bythotrephes were collected at each station
from 2–3 m above the lake bottom to the lake surface
using a 2.5-m net with a 0.75-m diameter mouth and
285-lm mesh. Every two weeks at the deepest spot in
the lake, Secchi disk depth and temperature profiles (at
1-m increments) were measured, and zooplankton and
water chemistry samples were collected. Zooplankton
were sampled with a 80-lm mesh, 12.5-cm diameter
net in hauls from 5 depths to surface, with the haul
lengths selected so that the combined composite
represented all strata in proportion to their volume
(Yan and Pawson 1997). Bathymetrically weighted
composite water samples were collected through a
weighted tygon tube via a peristaltic pump as described
in Girard and Reid (1990) and Ingram et al. (2006).
For the calculation of accurate per capita birth rate
of a species, many gravid animals must be assessed
frequently (De Mott 1980); therefore, two of the
study lakes were sampled weekly from May to
October. Harp Lake was sampled in 2003 at 10
stations and Peninsula Lake was sampled in 2004 at
15 stations, with the number of stations determined
after examination of pilot studies of spatial variance
(Young 2008). On each sample date, temperature
profiles and Bythotrephes were collected using
methods outlined above for Harp Lake.
Sample processing
Bythotrephes and zooplankton samples were
enumerated with a semi-automated, zooplankton
2608 J. D. Young et al.
123

enumeration and measuring system called ZEBRA
(Allen et al. 1994). Multi-year Bythotrephes samples
were examined entirely and multi-lake samples were
subsampled with a Folsom plankton splitter when
Bythotrephes appeared abundant in a sample ([32
Bythotrephes present). Sex and instar of Bythotrephes
were identified and clutch size of broods containing
embryos with red- or black-eyed pigmentation was
recorded. For each sampling date, Bythotrephes
abundance was calculated as a mean of all stations,
with station abundance being the number of female
Bythotrephes divided by the total volume of water
filtered by the net. In the multi-year samples, volumes
were corrected with a filtration efficiency of 95%
(Young 2008). Bythotrephes instar and embryo
density used in the birth rate analyses were calculated
similarly to female abundances.
Zooplankton samples were enumerated following
a protocol described in Girard and Reid (1990),
where subsamples of a known volume were generated
with a Folsom plankton splitter and a minimum of
350 individuals were identified and enumerated. As
herbivorous cladocerans are the favoured prey of
Bythotrephes, a sum of their densities (i.e., of genera
Daphnia, Bosmina, Eubosmina, Holopedium, Chyd-
orus and Diaphanosoma) was used as the variable
representing Bythotrephes prey. Bythotrephes primar-
ily occupies the epi- and metalimnion, and thus will
only overlap with prey in these layers (Young and
Yan 2008). Therefore, prey abundance was treated
differently for the two datasets due to differences in
zooplankton collection. For the multi-lake dataset in
which individual thermal layers were sampled for
zooplankton separately, only epi- and metalimnion
prey were included. In the multi-year dataset in which
zooplankton were volume-weighted to include all
thermal layers, Daphnia mendotae was excluded
from prey abundance as it is known to migrate into
the hypolimnion during the day to avoid overlap with
Bythotrephes (Lakes Michigan and Erie, Pangle et al.
2007; Harp Lake, Young and Yan 2008). To meet
assumptions of normality in the following analyses,
all prey abundances were transformed using
log(x ?1).
Water samples were analysed for total phosphorus
(TP), Chlorophyll a (Chla), dissolved organic carbon
(DOC) and pH at the OMOE’s Dorset Environmental
Research Centre following standard OMOE (2003)
methods.
Data analyses
Mean Bythotrephes annual abundance
Multiple regression analyses were performed to
determine which bottom-up variables most parsimo-
niously explained variation in mean Bythotrephes
annual abundance among lakes (multi-lake dataset)
and among years (multi-year dataset). For each
dataset, the best subsets procedure in SigmaStat
(version 3.1) was used to calculate all possible models
(not including interactions). The most parsimonious
model was chosen as the one with the smallest
Akaike’s Information Criterion corrected for small
sample sizes (AICc; Johnson and Omland 2004).
A Kolmogorov–Smirnov normality test and a constant
variance test were used to assess assumptions for the
regression models and all passed with P [ 0.05.
Mean Bythotrephes annual abundance was calcu-
lated by averaging Bythotrephes abundance on all
sample dates from June to September for each lake or
year. The predictor variables for the multi-lake
regression were log-transformed mean spring (all
sample dates in May and June) and summer (all dates
in July to September) prey abundance, mean spring
and summer temperature, mean ice-free (all dates
sampled) Secchi disk depth, mid-summer TP, and
maximum depth. The predictor variables for the
multi-year regression were mean spring and summer
prey abundance, mean spring and summer tempera-
ture, and mean ice-free Secchi disk depth, TP and
Chla. pH was not included as it did not vary greatly
between lakes or dates (Table 1), and was [6 in all
lakes, a level of acidity that should not affect
Bythotrephes abundance (Natalie Kim, York Univer-
sity, unpublished toxicity data). No collinearity
among variables was detected as variance inflation
factors were always \10 (Quinn and Keough 2002).
When the dependent variable in a multiple
regression is species abundance data, there is a risk
that the data are autocorrelated, as abundance on one
date would depend on previous dates. However, it is
unlikely that mean Bythotrephes annual abundance
would be autocorrelated, as Bythotrephes overwinter
as resting eggs. Resting egg production in one year
may affect the following year’s initial Bythotrephes
abundance, but other processes such as reproduction
should quickly take over, making it unlikely that
mean annual abundance would be affected.
Increased abundance of the non-indigenous zooplanktivore 2609
123

Seasonal Bythotrephes abundance
Multivariate analyses were used to determine which
bottom-up variables could predict differences in
seasonal Bythotrephes abundance patterns for each
dataset. Because Bythotrephes abundances collected
every few weeks would be autocorrelated, it would
not be appropriate to use redundancy analyses with
seasonal Bythotrephes abundance as the dependent
variable. Instead, canonical variates analyses (CVA)
were used where the dependent variables were groups
of lakes (multi-lake dataset) or years (multi-year
dataset) with similar seasonal Bythotrephes abun-
dance patterns. Predictor variables for the multi-lake
CVA were maximum depth, biweekly values for
Secchi disk depth, epilimnetic temperature and log-
transformed prey abundance, and mid-summer (July
14) DOC and TP. Predictor variables for the multi-
year CVA were monthly means for Secchi disk depth,
epilimnetic temperature, log-transformed prey abun-
dance, DOC and TP. Monthly means were used for
the multi-year predictor variables because they were
sampled on different dates from year to year and not
at the same time as Bythotrephes. Predictor variables
were first checked for normality using the Kolmogo-
rov–Smirnov test. Variables that were not normally
distributed (i.e., P [ 0.05; only variables from the
multi-lake dataset: Secchi disk depth in mid July and
early September and prey abundance in early June
and early August) were not included in the multivar-
iate analyses as they violated this assumption. The
rest of the variables were tested with a Monte Carlo
permutation test (with 999 permutations) by manual
selection to determine if a significant amount of
variation was explained (P \ 0.05) (ter Braak and
Smilauer 2002).
To identify the groups of lakes or years with
similar seasonal abundance patterns for the CVAs,
we first grouped those with very low abundance (B1
Bythotrephes m-3), which were Skeleton Lake for the
multi-lake dataset, and 1996 and 1997 for the multi-
year dataset. For the rest of the lakes or years, groups
were generated with a principal components analysis
(PCA) and hierarchical cluster analyses, where the
response variables were relative seasonal Bythotre-
phes abundances. For the multi-lake dataset, all
biweekly seasonal abundances from June to Septem-
ber for each lake were used as they were collected
within 5 days of each other. For the multi-year
dataset, Bythotrephes were not always collected on a
similar date each year; therefore, abundances were
averaged between dates when needed so that values
existed for similar dates twice a month from end of
June to mid September. Because data were only
collected monthly in 2001, this year was excluded
from the seasonal multi-year analysis. The cluster
analyses used were single, median, centroid, average
and weighted average linkages with Euclidean dis-
tances where lakes or years were grouped when
C50% similarity. Cluster analyses were performed in
MiniTab 15, normality tests were done in SigmaPlot
3.1 and multivariate analyses were performed in
Canoco 4.5.
Contributions to per capita birth rates
To identify whether temperature, prey availability or
predation were contributing to per capita birth rate
changes over time (i.e., how much birth rates were
increasing or decreasing from one date to the next),
partial differentials were applied to the three vari-
ables in the following equation for per capita birth
rate, b ¼ R lnð1þ PePaÞ (Polishchuck 1995). This
equation is the same as the Edmondson-Paloheimo
model and thus relies on the same assumptions.
R (d-1) is the inverse of the temperature-dependent
embryo development rate, Pe is the proportion of
embryos to adult (i.e., second and third instar)
Bythotrephes, Pa is the proportion of adult vs. all
Bythotrephes, and thus PePa is the ratio of embryos to
all Bythotrephes. b was only calculated for dates
when the number of females carrying embryos was
greater than 6, where sample sizes varied from 7 to 33
in Harp Lake and 6 to 292 in Peninsula Lake. To
approximate the rate of change in the per capita birth
rate, db/dt (d-2), for each sample date, separate
polynomials were fit to birth rates on three consec-
utive sample dates (i.e., a sample date and the sample
dates before and after), differentiated and solved for
the sample date (Polishchuck 1995).
The interpretation of this method was based on
how much the partial derivative of each variable
(d-2) contributed to db/dt. A greater contribution
from R (i.e., ConR) suggests that temperature was
affecting the changes in per capita birth rates, as
embryo development rate in Bythotrephes is primar-
ily temperature dependent (Yurista 1992). When
ConPe provides the major contribution, prey
2610 J. D. Young et al.
123

availability was assumed to be the most important
factor, as resources affect the proportion of mature
females reproducing in cladocerans (Hall 1964;
Goulden and Hornig 1980). A contribution from Pa
with or without Pe (i.e., ConPa and/or ConPe)
suggests that per capita birth rates were changing
due to a combination of factors known to affect
cladocerans: predation by fish that select larger over
smaller females (Pa) and/or females with clutches,
especially larger ones, over those without clutches
(Pe) (Gliwicz and Pijanowska 1989; Polishchuck
1995).
Results
Mean annual Bythotrephes abundance
In the multi-lake dataset, mean Bythotrephes annual
abundance ± 1 standard deviation ranged from
0.3 ± 0.4 (in Skeleton Lake) to 9.0 ± 5.4 (in Pen-
insula Lake) Bythotrephes m-3 (Table 1a). Based on
AICc values, the most parsimonious model for
predicting among lake differences in mean annual
abundance included abundance of spring prey, mean
Secchi disk depth and maximum depth as factors
(adjusted R2 = 0.80; F3,5 = 11.40; P = 0.01).
Spring prey and Secchi depth were both significantly
and positively correlated with mean annual Bytho-
trephes abundance, while maximum depth was not a
significant predictor (Table 2a).
In the multi-year dataset, mean annual Bythotre-
phes abundance ± 1 standard deviation varied from
0.3 ± 0.2 (in 1996) to 3.4 ± 4.3 (in 1998) and
3.4 ± 3.4 (in 2003) Bythotrephes m-3 (Table 1b).
The most parsimonious model for predicting among
year differences only included the abundance of
spring prey (adjusted R2 = 0.67; F1,7 = 17.25;
P = 0.004) as a significant and positive factor
(Table 2b).
Seasonal Bythotrephes abundance
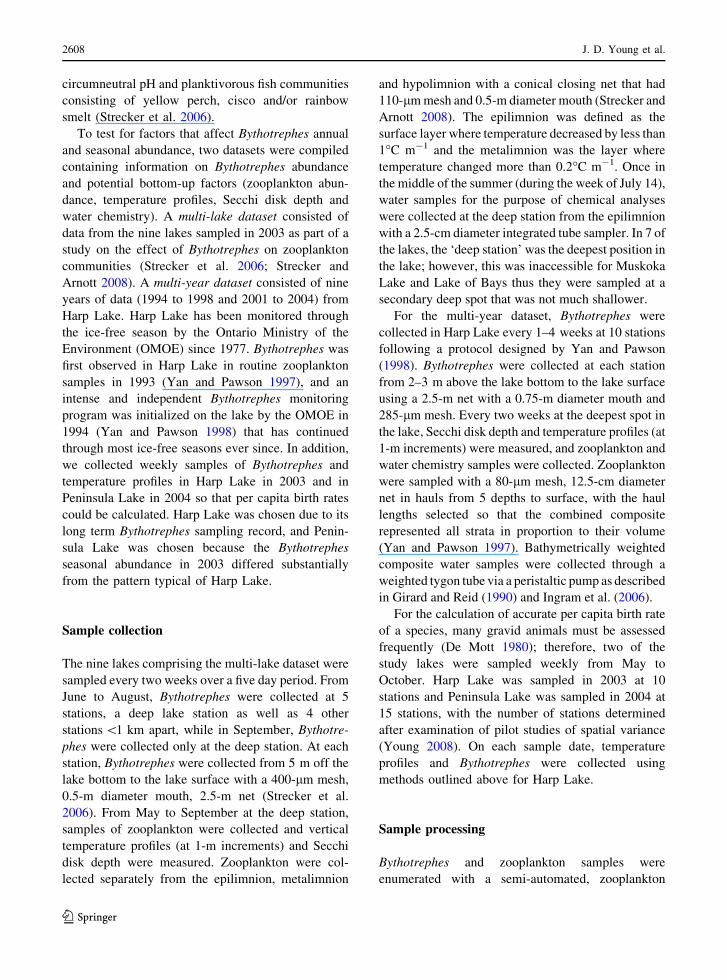
In the multi-lake dataset, Bythotrephes seasonal
abundance patterns varied substantially (Fig. 1) and
did not cluster consistently into similar groups using
the different cluster analyses. The four groups
suggested by the PCA best summarized the results
of the cluster analyses and thus were used in the CVA:
(1) Peninsula Lake, (2) Fairy and Mary lakes and Lake
of Bays, (3) Bernard and Vernon lakes, and (4)
Muskoka and Harp lakes (Fig. 2a). Prey abundance in
mid June was the only variable that was marginally
significant at predicting these groups on Axis 1 of the
multi-lake CVA (P = 0.06; Fig. 2b). Skeleton Lake
had a strong negative association with June prey along
Axis 1, and both prey and Bythotrephes abundance
were very low in this lake (Fig. 1a). Peninsula Lake
had a strong positive association with June prey, and
had very high prey and Bythotrephes abundances in
early June (Fig. 1i). Bernard and Vernon lakes also
had a positive association with June prey abundance;
prey abundances were relatively high in June in both
lakes and Bythotrephes abundance was relatively high
from the end of June to the middle of August (Fig. 1g,
h). The remaining two groups only had a weak
association with June prey abundance. Harp and
Muskoka lakes had low but somewhat contrasting
prey and Bythotrephes abundances in comparison to
the other lakes, with Bythotrephes peaking later in the
season (Fig. 1e, f). Although Fairy Lake, Lake of
Bays and Mary Lake had similar relative seasonal
Bythotrephes abundance patterns, their prey abun-
dance patterns were different; June prey abundance
was very high in Fairy and Mary lakes but very low in
Lake of Bays (Fig. 1b, c, d).
Table 2 Results of multiple regression analyses of mean annual Bythotrephes abundance with bottom-up variables for (a) nine lakes
in the multi-lake dataset and (b) nine years for the multi-year (Harp Lake) dataset
Dataset DFres,reg Adjusted R2 F ratio P value Variable Coefficient t value P value
(a) 3,5 0.80 11.40 0.01 Spring prey 3.97 3.32 0.02
Secchi depth 1.76 2.86 0.04
Max depth -0.08 -2.20 0.08
(b) 1,7 0.67 17.25 0.004 Spring prey 1.81 4.15 0.004
Significant results (P \ 0.05) are in bold. Variables are defined in the footnote of Table 1
Increased abundance of the non-indigenous zooplanktivore 2611
123
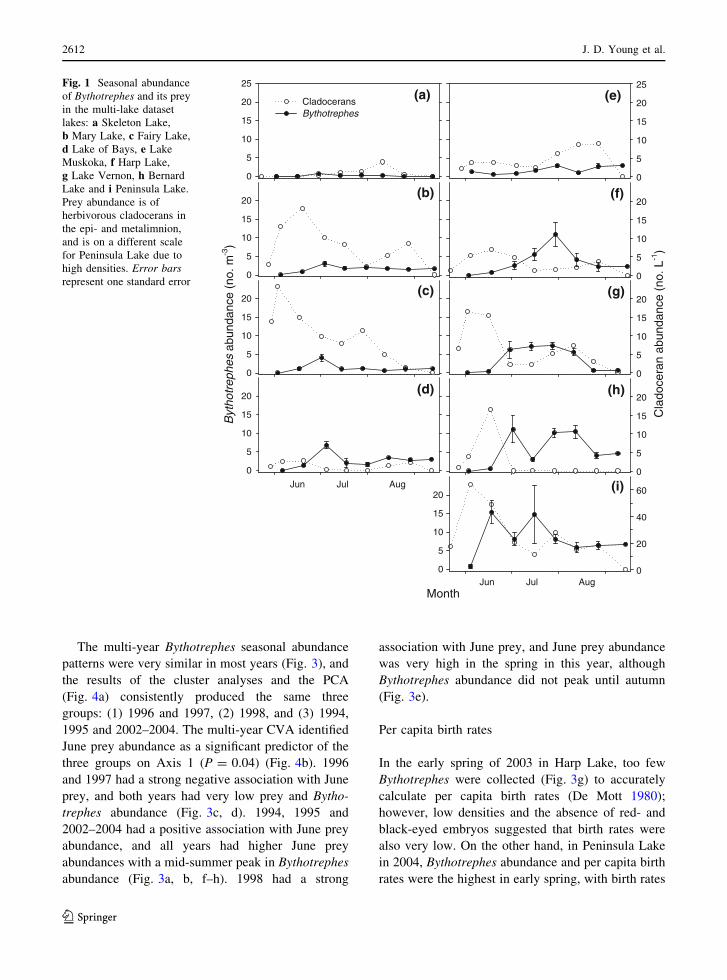
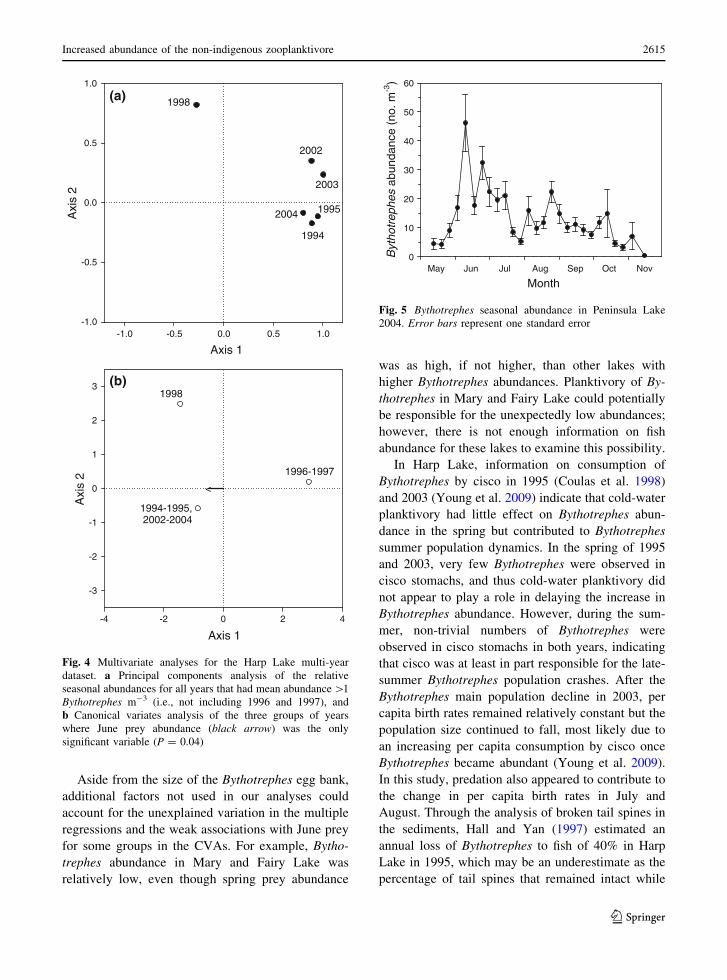
The multi-year Bythotrephes seasonal abundance
patterns were very similar in most years (Fig. 3), and
the results of the cluster analyses and the PCA
(Fig. 4a) consistently produced the same three
groups: (1) 1996 and 1997, (2) 1998, and (3) 1994,
1995 and 2002–2004. The multi-year CVA identified
June prey abundance as a significant predictor of the
three groups on Axis 1 (P = 0.04) (Fig. 4b). 1996
and 1997 had a strong negative association with June
prey, and both years had very low prey and Bytho-
trephes abundance (Fig. 3c, d). 1994, 1995 and
2002–2004 had a positive association with June prey
abundance, and all years had higher June prey
abundances with a mid-summer peak in Bythotrephes
abundance (Fig. 3a, b, f–h). 1998 had a strong
association with June prey, and June prey abundance
was very high in the spring in this year, although
Bythotrephes abundance did not peak until autumn
(Fig. 3e).
Per capita birth rates
In the early spring of 2003 in Harp Lake, too few
Bythotrephes were collected (Fig. 3g) to accurately
calculate per capita birth rates (De Mott 1980);
however, low densities and the absence of red- and
black-eyed embryos suggested that birth rates were
also very low. On the other hand, in Peninsula Lake
in 2004, Bythotrephes abundance and per capita birth
rates were the highest in early spring, with birth rates
0
5
10
15
20
0
5
10
15
20
0
5
10
15
20
25
CladoceransBythotrephes
0
5
10
15
20
0
5
10
15
20
0
5
10
15
20
25
Byt
hotr
ephe
s ab
unda
nce
(no.
m-3
)
0
5
10
15
20
Cla
doce
ran
abun
danc
e (n
o. L
-1)
0
5
10
15
20
(b)
(a)
(c)
(d)
(f)
(e)
(g)
(h)
0
20
40
60
0
5
10
15
20(i)
MonthAugJulJun
AugJulJun
Fig. 1 Seasonal abundance
of Bythotrephes and its prey
in the multi-lake dataset
lakes: a Skeleton Lake,
b Mary Lake, c Fairy Lake,
d Lake of Bays, e Lake
Muskoka, f Harp Lake,
g Lake Vernon, h Bernard
Lake and i Peninsula Lake.
Prey abundance is of
herbivorous cladocerans in
the epi- and metalimnion,
and is on a different scale
for Peninsula Lake due to
high densities. Error barsrepresent one standard error
2612 J. D. Young et al.
123

at 0.1 day-1 as early as 20 May, increasing to a
maximum of 0.2 day-1 on 10 June (Figs. 5, 6b).
Bythotrephes per capita birth rates were the highest in
Harp Lake on 10 July (Fig. 6a), preceding the
population peak (Fig. 3g).
Pe was almost always the main contributor to the
positive and negative changes in per capita birth rates
in both Harp and Peninsula Lake (Fig. 6), suggesting
that prey availability was the primary factor affecting
Bythotrephes per capita birth rates. There was often
an additional, smaller contribution from Pa, making it
difficult to differentiate whether prey availability or
predation were driving the contribution from Pe, but
suggesting that predation was sometimes responsible
such as in mid July in Harp Lake when per capita
birth rates decreased considerably. R, and thus
temperature, also contributed to per capita birth rate
changes, most prominently in the spring in Peninsula
Lake.
Discussion
In all analyses and datasets, the abundance of prey in
the spring was consistently found to be a significant
factor associated with Bythotrephes annual and
seasonal abundance. In the multiple regressions,
spring prey abundance had a significant and positive
association with mean annual Bythotrephes abun-
dance, as well as Secchi disk depth for the multi-lake
dataset. In the CVAs, prey abundance in June was the
only significant variable that was associated with
groups of lakes or years with similar seasonal
Bythotrephes abundance patterns, although some
groups did not appear to be significantly predicted
by spring prey suggesting other unmeasured factors
were involved. Lastly, prey availability appeared to
be the most common and dominant contributor to
changes in per capita birth rates in Harp and
Peninsula lakes, while temperature and predation
were also important on some dates.
The multiple regressions on the multi-lake and
multi-year datasets both suggested that greater prey
abundance in the spring contributed to greater mean
annual Bythotrephes abundance. The CVAs showed a
very similar trend, where groups of lakes or years that
appeared to be significantly different were those with
both high Bythotrephes abundance and June prey
abundance compared with groups with both very low
Bythotrephes and June prey abundance. Lakes in the
multi-lake dataset that had the greatest Bythotrephes
abundance reached maximum abundance by mid
(e.g., Peninsula Lake) or late (e.g., Bernard and
Vernon Lake) June. In the lakes in this study,
Axis 1-10 -5 0 5 10
Axi
s 2
-3
-2
-1
0
1
2
3
Axis 1-2 -1 0 1 2
Axi
s 2
-2
-1
0
1
2
Bernard
Vernon
Harp
Muskoka
Peninsula
Fairy
Lake of Bays
Mary
BernardVernon
Skeleton
Peninsula
FairyLake of Bays
Mary
HarpMuskoka
(a)
(b)
<
Fig. 2 Multivariate analyses for the multi-lake dataset lakes.
a Principal components analysis of the relative seasonal
abundances for the eight lakes that had mean abundance [1
Bythotrephes m-3 (i.e., not including Skeleton Lake), and
b Canonical variates analysis of the five groups of lakes where
mid-June prey abundance (black arrow) was the only variable
that was marginally significant (P = 0.06). The magnitude of
the mid-June prey abundance arrow has been increased by a
factor of 3 so that it could be more visible
Increased abundance of the non-indigenous zooplanktivore 2613
123

Bythotrephes overwinters as resting eggs that begin
hatching in May (Young 2008). A greater availability
of prey in the early months of Bythotrephes emer-
gence would allow for higher per capita birth rates,
leading to increased population growth. Additionally,
Bythotrephes clutch sizes in the spring are much
larger than the summer, making very high birth rates
possible (Straile and Halbich 2000; Young 2008). In
Peninsula Lake in 2004, which had a very similar
early spring Bythotrephes abundance peak to 2003,
per capita birth rates were highest in June, and prey
availability was the greatest contributor on 3 June.
Bythotrephes in European Lake Constance (Straile
and Halbich 2000) and Lago Maggiore (Manca et al.
2007) have a similar population dynamic to Peninsula
Lake. The early spring Bythotrephes abundance
peaks in these lakes were also attributed to earlier
onsets of exponential growth (Manca et al. 2007) and
high springtime per capita birth rates (Straile and
Halbich 2000).
In most years in Harp Lake, Bythotrephes abun-
dance had a later peak than the other lakes, which
occurred mid-summer and resembled the Rybinsk
reservoir in Russia (Rivier 1998). Prey abundance in
Harp Lake routinely did not start increasing until
June, suggesting a consistent insufficiency of prey to
support a spring bloom of Bythotrephes thus poten-
tially explaining the delayed Bythotrephes peak.
Interestingly, prey abundance in 1998 began increas-
ing in May and reached a maximum in early June, yet
Bythotrephes abundance did not peak until autumn,
indicating a factor other than prey availability
affected Bythotrephes abundance in this year. We
suggest that the discrepancy is attributable to a
dramatically reduced pool of resting eggs in the
spring of 1998. The Bythotrephes egg bank for a
current year consists mainly of the eggs deposited the
preceding year, as Bythotrephes resting eggs are only
viable for approximately three-quarters of a year
(Andrew and Herzig 1984). Due to the low Bytho-
trephes abundances in 1996 and 1997, resting egg
production and sediment deposition were likely very
low preceding 1998, thus explaining the unique
Bythotrephes seasonal pattern in 1998.
0
5
10
15
0
5
10
15
0
5
10
15
0
2
4
6
8
Byt
hotr
ephe
s ab
unda
nce
(no.
m-3
) 0
5
10
15
20
CladoceransBythotrephes
Month
0
2
4
6
0
2
4
6
Cla
doce
ran
abun
danc
e (n
o. L
-1)
0
2
4
6(b)
(a)
(g)
(h)
(c)
(d)
(e)
(f)
Jun Jul Aug Oct Jun Jul Aug Sep Oct May MaySep
Fig. 3 Seasonal abundance
of Bythotrephes and its prey
in Harp Lake for a 1994,
b 1995, c 1996, d 1997,
e 1998, f 2002, g 2003 and
h 2004. Bythotrephessampling in 1999–2001 was
infrequent and thus these
years were not included in
seasonal analyses. Prey
abundance is of herbivorous
cladocerans (excluding
Daphnia mendotae) and
was volume-weighted to
represent the whole water
column. Error barsrepresent one standard error
2614 J. D. Young et al.
123
Aside from the size of the Bythotrephes egg bank,
additional factors not used in our analyses could
account for the unexplained variation in the multiple
regressions and the weak associations with June prey
for some groups in the CVAs. For example, Bytho-
trephes abundance in Mary and Fairy Lake was
relatively low, even though spring prey abundance
was as high, if not higher, than other lakes with
higher Bythotrephes abundances. Planktivory of By-
thotrephes in Mary and Fairy Lake could potentially
be responsible for the unexpectedly low abundances;
however, there is not enough information on fish
abundance for these lakes to examine this possibility.
In Harp Lake, information on consumption of
Bythotrephes by cisco in 1995 (Coulas et al. 1998)
and 2003 (Young et al. 2009) indicate that cold-water
planktivory had little effect on Bythotrephes abun-
dance in the spring but contributed to Bythotrephes
summer population dynamics. In the spring of 1995
and 2003, very few Bythotrephes were observed in
cisco stomachs, and thus cold-water planktivory did
not appear to play a role in delaying the increase in
Bythotrephes abundance. However, during the sum-
mer, non-trivial numbers of Bythotrephes were
observed in cisco stomachs in both years, indicating
that cisco was at least in part responsible for the late-
summer Bythotrephes population crashes. After the
Bythotrephes main population decline in 2003, per
capita birth rates remained relatively constant but the
population size continued to fall, most likely due to
an increasing per capita consumption by cisco once
Bythotrephes became abundant (Young et al. 2009).
In this study, predation also appeared to contribute to
the change in per capita birth rates in July and
August. Through the analysis of broken tail spines in
the sediments, Hall and Yan (1997) estimated an
annual loss of Bythotrephes to fish of 40% in Harp
Lake in 1995, which may be an underestimate as the
percentage of tail spines that remained intact while
-1.0 -0.5 0.0 0.5 1.0
Axi
s 2
-1.0
-0.5
0.0
0.5
1.0
2002
1998
Axis 1
-4 -2 0 2 4
Axi
s 2
-3
-2
-1
0
1
2
3
1996-1997
1998
1994-1995,2002-2004
(a)
(b)
<
2003
1995
1994
2004
Axis 1
Fig. 4 Multivariate analyses for the Harp Lake multi-year
dataset. a Principal components analysis of the relative
seasonal abundances for all years that had mean abundance [1
Bythotrephes m-3 (i.e., not including 1996 and 1997), and
b Canonical variates analysis of the three groups of years
where June prey abundance (black arrow) was the only
significant variable (P = 0.04)
MonthMay Jun Jul Aug Sep Oct Nov
Byt
hotr
ephe
s ab
unda
nce
(no.
m-3
)
0
10
20
30
40
50
60
Fig. 5 Bythotrephes seasonal abundance in Peninsula Lake
2004. Error bars represent one standard error
Increased abundance of the non-indigenous zooplanktivore 2615
123

passing through fish was not considered, and could
range from 4 to 13% (Jarnagin et al. 2004). Recent
modelled estimates of death rates of Bythotrephes in
Harp Lake were as high as 0.19 day-1 (Wittman et al.
2011).
Along with cold-water planktivory, prey availabil-
ity also appeared to affect Bythotrephes summer
abundance in Harp Lake. Around the population
crash in both 1995 and 2003, Bythotrephes consump-
tion exceeded prey production (Dumitru et al. 2001;
Strecker and Arnott 2008), indicating that prey were
limiting. Daphnia abundance often follows a similar
trend with population size declining soon after the
clear-water phase, due primarily to the lack of edible
phytoplankton, but also due to predation (Lampert
et al. 1989; Luecke et al. 1990). Additionally, prey
availability continued to contribute to changes in
birth rates through the summer. Given the apparent
effect of prey availability on Bythotrephes abundance
during the summer, we might have expected summer
prey abundance to be associated with Bythotrephes
abundance in our analyses but it was not. This
discrepancy could be explained by the fact that a
relationship between Bythotrephes and prey abun-
dance might be weakened in the summertime due to
Bythotrephes consumption on its prey.
The importance of Bythotrephes as a visual
predator was indicated from the results of the multi-
lake multiple regression, as the combination of
increased prey in the spring and light availability
affected its mean annual abundance. Similar to many
fish planktivores, Bythotrephes uses light for efficient
finding and capturing of prey (Muirhead and Sprules
2003). The light levels at which it achieves its
maximum feeding rate are C100 lmol m-2 s-1
(Pangle and Peacor 2009), usually the top 3–5 m of
our study lakes (JDY, unpublished data) similar to
Secchi disk depth. During the day, most Bythotrephes
are deeper than this (Young and Yan 2008); there-
fore, greater light penetration would be expected to
have a direct positive effect on its feeding rate. This
might also at least partially explain why Bythotrephes
Per
cap
ita b
irth
rate
(d
-1)
-0.2
-0.1
0.0
0.1
0.2
Con
trib
utio
ns (
d-2)
-0.01
0.00
0.01
-0.4
-0.2
0.0
0.2
0.4
-0.02
-0.01
0.00
0.01
0.02
bdb/dtConPe
ConRConPa
May
(a)
(b)
Jun Jul Aug Sep
Fig. 6 Bythotrephes birth rate analysis for a Harp Lake 2003
and b Peninsula Lake 2004. On the lefthand y-axis is the per
capita birth rate, b. On the righthand y-axis is the rate of change
in the per capita birth rate, db/dt, along with ConPe
representing the contribution of food availability, ConR repre-
senting temperature and ConPa with or without ConPe
representing predation. Theoretically, the sum of the contribu-
tions (SumCon) should add up to db/dt; therefore, dates with
0.5 [ SumCon:db/dt [ 2 were not presented (Polishchuck
1995). db/dt was approximated for each sample date by fitting
separate polynomials to birth rates on three consecutive sample
dates (i.e., a sample date and the sample date before and after),
differentiating it and solving for the sample date (Polishchuck
1995). Please note that the scale of the y-axes differ between
a and b
2616 J. D. Young et al.
123

is more often found in clear lakes (Weisz and Yan
2010).
Our study has suggested the importance of spring
prey on Bythotrephes abundance, as well as reinforced
previous studies (e.g., Pangle and Peacor 2009) on the
role that light plays in Bythotrephes predation. It is
also evident that other factors not measured in this
study may also have an effect on Bythotrephes
abundance, such as resting egg abundances and
planktivorous fish predation. Understanding the fac-
tors that are associated with the abundance of an
invasive species provides insight into the invasion
process and helps to identify and target systems that
are susceptible to successful establishment of an
invasive species. Recent work has identified that an
Allee effect exists for Bythotrephes (e.g., Wittman
et al. 2011). If prey availability affects Bythotrephes
abundance in established populations as suggested in
our study, it might also be an important factor at the
low abundances that occur when a species is first
introduced, which is when an Allee effect would be
operating. Therefore, our study suggests the hypoth-
esis that Bythotrephes establishment success is
affected by the availability of its prey foodbase.
Acknowledgments We thank Emily Parrott for counting
Bythotrephes in the 2003 lake dataset and Brady Yu for
counting a portion of the Harp Lake 2003 and Peninsula Lake
2004 datasets. From the OMOE’s Dorset Environmental
Science Centre, we thank Andrew Paterson, Robert Girard
and Ron Ingram for access to field equipment and Harp Lake
Bythotrephes, temperature, chemical and zooplankton data, and
Keith Somers for statistical consulting. B. Yu, E. Parrott,
Jonathon Hovius, Greg Puncher and Alison Croft provided
assistance in the field. We are very grateful for the detailed and
helpful comments provided by two reviewers and the editor.
Funding for this project was provided by an Ontario Graduate
Scholarship in Science and Technology to JDY, and Natural
Sciences and Engineering Research Council of Canada grants
to ALS and NDY. We also thank Shelley Arnott for guidance
and funding.
References
Allen G, Yan ND, Geiling WT (1994) ZEBRA2—Zooplankton
enumeration and biomass routines for APIOS: a semi-
automated sample processing system for zooplankton
ecologists. Ontario Ministry of Environment and Energy
Report, 44 pp ? appendices
Andrew TE, Herzig A (1984) The respiration rate of the resting
eggs of Leptodora kindtii (Focke 1844) and Bythotrepheslongimanus 1860 (Crustacea, Cladocera) at environmen-
tally encountered temperatures. Oecologia 64:241–244
Barbiero RP, Tuchman ML (2004) Changes in the crustacean
communities of Lakes Michigan, Huron and Erie fol-
lowing the invasion of the predatory cladoceran Bytho-trephes longimanus. Can J Fish Aquat Sci 61:2111–2125
Boudreau SA, Yan ND (2003) The differing crustacean zoo-
plankton communities of Canadian Shield lakes with and
without the non-indigenous zooplanktivore Bythotrepheslongimanus. Can J Fish Aquat Sci 60:1307–1313
Branstrator DK, Brown ME, Shannon LJ, Thabes M, Heim-
gartner K (2006) Range expansion of Bythotrephes lon-gimanus in North America: evaluating habitat
characteristics in the spread of an exotic zooplankter. Biol
Inv 8:1367–1379
Brown MA (2006) The ecology of the exotic zooplankter,
Bythotrephes longimanus, in a reservoir system: evaluat-
ing the role of multiple environmental factors in life-cycle
completion. Dissertation, University of Minnesota
Burkhardt S, Lehman JT (1994) Prey consumption and pred-
atory effects of an invertebrate predator (Bythotrephes:
Cladocera, Cercopagidae) based on phosphorus budgets.
Limnol Oceanogr 39:1007–1019
Cairns A, Yan ND, Weisz E, Petruniak J, Hoare J (2007) The
large, inland lake, Bythotrephes survey—limnology,
database design, and presence of Bythotrephes and other
pelagic macroinvertebrates in 311 south-central Ontario
lakes. Operationalizing CAISN project 1.V, Technical
Report #2
Coulas RA, MacIsaac HJ, Dunlop W (1998) Selective preda-
tion on an introduced zooplankter (Bythotrephes ceder-stroemi) by lake herring (Coregonus artedii) in Harp
Lake, Ontario. Freshw Biol 40:343–355
De Mott WR (1980) An analysis of the precision of birth and
death rate estimates for egg-bearing zooplankters. In:
Kerfoot WC (ed) Evolution and ecology of zooplankton
communities. Hanover, New Hampshire, USA,
pp 337–345
Dumitru C, Sprules WG, Yan ND (2001) Impact of Bythotre-phes longimanus on zooplankton assemblages of Harp
Lake, Canada: an assessment based on predator con-
sumption and prey production. Freshw Biol 46:241–251
Foster SE, Sprules WG (2010) Effects of Bythotrephes on the
trophic position of native macroinvertebrates. Can J Fish
Aquat Sci 67:58–69
Girard R, Reid RA (1990) Dorset Research Centre study lakes:
sampling methodology (1986–1989) and lake morphom-
etry. OMOE, Dorset, Canada
Gliwicz ZM, Pijanowska J (1989) The role of predation in
zooplankton succession. In: Sommer U (ed) Plankton
ecology: succession in plankton communities. Springer,
Heidelberg, Germany, pp 253–295
Goulden CE, Hornig LL (1980) Population oscillations and
energy reserves in planktonic cladocera and their conse-
quences to competition. Proc Natl Acad Sci USA
77:1716–1720
Grigorovich IA, Pashkova OV, Gromova YF, van Overdijk
CDA (1998) Bythotrephes longimanus in the Common-
wealth of Independent States: variability, distribution and
ecology. Hydrobiologia 379:183–198
Hall DJ (1964) An experimental approach to the dynamics of a
natural population of Daphnia galeata mendotae. Ecology
45:94–112
Increased abundance of the non-indigenous zooplanktivore 2617
123

Hall RI, Yan ND (1997) Comparing annual population growth
estimates of the exotic invader Bythotrephes by using
sediment and plankton records. Limnol Oceanogr 42:
112–120
Ingram RG, Girard RE, Clark BJ, Paterson AM, Reid RA,
Findeis JG (2006) Dorset Environmental Science Centre:
lake sampling methods. Queen’s Printer for Ontario,
Toronto, ON, Canada. ISBN 1-4249-2049-3
Jarnagin ST, Kerfoot WC, Swan BK (2004) Zooplankton life
cycles: direct documentation of pelagic births and deaths
relative to diapausing egg production. Limnol Oceanogr
49:1317–1332
Johannsson OE, Mills EL, O’ Gorman R (1991) Changes in the
nearshore and offshore zooplankton communities in Lake
Ontario: 1981–88. Can J Fish Aquat Sci 48:1546–1557
Johnson JB, Omland KS (2004) Model selection in ecology and
evolution. Trends Ecol Evol 19:101–108
Lampert W, Fleckner W, Rai H, Taylor BE (1989) Phyto-
plankton control by grazing zooplankton: a study on the
spring clear-water phase. Limnol Oceanogr 31:478–490
Langeland A (1978) Effect of fish (Salvelinus alpinus, arctic
char) predation on the zooplankton in ten Norwegian
lakes. Verh Int Verein Limnol 20:2065–2069
Luecke C, Vanni MJ, Magnuson JJ, Kitchell JF, Jacobson PT
(1990) Seasonal regulation of Daphnia populations by
planktivorous fish—implications for the spring clear-
water phase. Limnol Oceanogr 35:1718–1733
MacIsaac HJ, Ketelaars HAM, Grigorovich IA, Ramcharan
CW, Yan ND (2000) Modeling Bythotrephes longimanusinvasions in the Great Lakes basin based on its European
distribution. Arch Hydrobiol 149:1–21
Manca MM, Portogallo M, Brown ME (2007) Shifts in phe-
nology of Bythotrephes longimanus and its modern suc-
cess in Lago Maggiore as a result of changes in climate
and trophy. J Plankton Res 29:515–525
Muirhead J, Sprules WG (2003) Reaction distance of Bytho-trephes longimanus, encounter rate and index of prey risk
for Harp Lake, Ontario. Freshw Biol 48:135–146
Muirhead JR, MacIsaac HJ (2011) Evaluation of stochastic gravity
model selection for use in estimating non-indigenous species
dispersal and establishment. doi:10.1007/s10530-011-0070-3
Nilsson NA (1979) Food and habitat of the fish community of
the offshore region of Lake Vanern, Sweden. Inst Fresh-
water Res Dottingholm Rep 58:126–139
Nordin LJ, Arts MT, Johannsson OE, Taylor WD (2008) An
evaluation of the diet of Mysis relicta using gut contents
and fatty acid profiles in lakes with and without the
invader Bythotrephes longimanus (Onychopoda, Cerco-
pagidae). Aquat Ecol 42:421–436
Ontario Ministry of the Environment (2003) Approved routine
methods reports. E3042, 3422, 3249, 3036, 3147, 3424,
3024, 3386, OMOE, Laboratory Services Branch. Quality
Management Unit, Etobicoke, ON
Pangle KL, Peacor SD (2009) Light-dependent predation by
the invertebrate planktivore Bythotrephes longimanus.
Can J Fish Aquat Sci 66:1748–1757
Pangle KL, Peacor SD, Johannsson OE (2007) Large nonlethal
effects of an invasive invertebrate predator on zooplank-
ton population growth rate. Ecology 88:402–412
Polishchuck LV (1995) Direct positive effect of invertebrate
predators on birth rate in Daphnia studied with a new
method of birth rate analysis. Limnol Oceanogr 40:
483–489
Quinn GP, Keough MJ (2002) Experimental design and data
analysis for biologists. Cambridge University Press,
Cambridge, UK
Rivier I (1998) The predatory Cladocera (Onychopoda: Po-
donidae, Polyphemidae. Backhuys Publishers, Leiden
Stenson JAE (1978) Relations between vertebrate and inver-
tebrate zooplankton predators in some arctic lakes. Astarte
11:21–26
Straile D, Halbich A (2000) Life history and multiple anti-
predator defenses of an invertebrate pelagic predator,
Bythotrephes longimanus. Ecology 81:150–163
Strecker AL, Arnott SE (2008) Invasive predator, Bythotre-phes, has varied effects on ecosystem function in fresh-
water lakes. Ecosystems 11:490–503
Strecker AL, Arnott SE, Yan ND, Girard R (2006) Variation in
the response of crustacean zooplankton species richness
and composition to the invasive predator Bythotrepheslongimanus. Can J Fish Aquat Sci 63:2126–2136
ter Braak CJF, Smilauer P (2002) CANOCO version 4.5. Bi-
ometris—Plant Research International, Wageningen
Therriault TW, Grigorovich IA, Cristescu ME, Ketelaars
HAM, Viljanen M, Heath DD, MacIsaac HJ (2002) Tax-
onomic resolution of the genus Bythotrephes Leydig using
molecular markers and re-evaluation of its global distri-
bution. Divers Distrib 8:67–84
Vanderploeg HA, Liebig JR, Omair M (1993) Bythotrephespredation on Great Lakes’ zooplankton measured by an insitu method: implications for zooplankton community
structure. Arch Hydrobiol 12:1–8
Wahlstrom E, Westman E (1999) Planktivory by the preda-
cious cladoceran Bythotrephes longimanus: effects on
zooplankton size structure and abundance. Can J Fish
Aquat Sci 56:1865–1872
Weisz EA, Yan ND (2010) Relative value of limnological,
geographic, and human use variables as predictors of the
presence of Bythotrephes longimanus in Canadian Shield
lakes. Can J Fish Aquat Sci 67:462–472
Wittmann MJ, Lewis MA, Young JD, Yan ND (2011) Tempera-
ture-dependent Allee effects in a stage-structured model for
Bythotrephes establishment. doi:10.1007/s10530-011-0074-z
Yan ND, Pawson TW (1997) Changes in the crustacean zoo-
plankton community of Harp Lake, Canada, following
invasion by Bythotrephes cederstroemi. Freshw Biol
37:409–425
Yan ND, Pawson TW (1998) Variation in size and abundance
of the exotic invader Bythotrephes cederstroemi in Harp
Lake, Canada. Hydrobiologia 361:157–168
Yan ND, Blukacz A, Sprules WG, Kindy PK, Hackett D,
Girard R, Clark BJ (2001) Changes in the zooplankton
and the phenology of the spiny water flea, Bythotrephes,
following its invasion of Harp Lake, Ontario, Canada. Can
J Fish Aquat Sci 58:2341–2350
Yan ND, Girard R, Boudreau S (2002) An introduced inver-
tebrate predator (Bythotrephes) reduces zooplankton spe-
cies richness. Ecol Lett 5:481–485
Young JD (2008) Ecological regulators of the life history,
morphology, behaviour and abundance of the invasive
zooplanktivore Bythotrephes longimanus in south-central
Ontario lakes. Dissertation, York University
2618 J. D. Young et al.
123

Young JD, Yan ND (2008) Modification of the diel vertical
migration of Bythotrephes longimanus by the cold-water
planktivore, Coregonus artedi. Freshw Biol 53:981–995
Young JD, Loew ER, Yan ND (2009) Examination of direct
daytime predation by Coregonus artedi on Bythotrephes
longimanus in Harp Lake, Ontario, Canada: No evidence
for the refuge hypothesis. Can J Fish Aquat Sci 66:449–459
Yurista PM (1992) Embryonic and postembryonic develop-
ment in Bythotrephes cederstroemi. Can J Fish Aquat Sci
49:1118–1125
Increased abundance of the non-indigenous zooplanktivore 2619
123
Top Related
Copyright © 2022 FDOKUMEN

