


Bahasa
Halaman
Hukum


In situ FTIR monitoring of Ag and Au electrodeposition on glassycarbon and silicon
K. Marquez a,*,1, R. Ortiz b,1, J.W. Schultze a,1, O.P. Marquez b,1, J. Marquez b,1,G. Staikov a,1
a Institut fur Physikalische Chemie und Elektrochemie, Heinrich-Heine-Universitat Dusseldorf, Universitatsstraße 1, Geb. 26.32,
40225 Dusseldorf, Germanyb Departamento de Quımica Facultad de Ciencias, Laboratorio de Electroquımica, Universidad de los Andes, Merida 5101, Venezuela
Received 14 October 2002; received in revised form 13 November 2002
Abstract
Formation of Ag, Au and Ag�/Au alloys on Si and Glassy Carbon (GC) electrodes from alkaline cyanide electrolytes was
investigated using a combination of electrochemical and spectroscopic techniques. Metal deposition and dissolution processes could
be studied in situ by monitoring the n (CN) bands of the metal complexes and the free cyanide ion in the region between 2000 and
2200 cm�1 using FTIR reflectance spectroscopy. Under the experimental conditions, two different silver complexes, namely
[Ag(CN)2]� and [Ag(CN)3]2� (whilst only one gold complex, namely [Au(CN)2]�), were identified. In the case of the Ag�/Au
alloys, both species co-deposit even in the activation region, where Ag reduction is expected to be the main reaction. Experimental
results indicate that in a mixed electrolyte containing equal amounts of Ag and Au, Ag deposition is thermodynamically favoured (/
E0eq; Ag�E0
eq; Au); while Au deposition is kinetically favoured. The Ag�/Au alloy deposition follows a progressive nucleation
mechanism even at relatively high negative potentials. The morphology and adhesion of all deposits, as well as the alloy
composition, were found to be strongly dependent on the deposition conditions. A better adhesion of the films with a higher Au
content was observed, due to the formation of a more stable Au�/Si bond.
# 2002 Elsevier Science Ltd. All rights reserved.
Keywords: Electrodeposition; FTIR; Silver; Gold; Silicon; Glassy carbon; Alloys
1. Introduction
Metallisation on silicon plays a key role in the
production of integrated devices. In the last years, metal
and alloy electrodeposition has attracted more attention
as a versatile technique for tailoring ohmic contacts and
Schottky barriers. Due to the stringent demands in
modern technologies, many conventional materials (i.e.
aluminium alloys) cannot keep pace as building blocks
for the ever narrower and more densely packed inter-
connecting lines. The application of copper for electro-
nic devices may also be limited due to the undesired
diffusion of this metal into the Si substrate and to its
poor binding to the surface of the semiconductor [1,2].
Therefore, other materials are being intensively re-
searched for this purpose, and in this context metals
such as Ag and Au, as well as their alloys, exhibit quite
interesting characteristics. These metals do not diffuse
into Si, thus avoiding the need for barrier seed layers;
and they have very high electrical conductivities, form-
ing covalent bonds with Si that improve their adhesion
to the semiconductor surface [3�/5]. Unfortunately, most
of the non-cyanide based electrolytes for Ag and Au
deposition are relatively unstable and the properties of
the metal films obtained in cyanide-free solutions are
generally poor. Because of this, non-cyanide Ag- and
Au-plating processes are still not well accepted [6].
However, due to environmental reasons, only relatively
low cyanide concentrations are normally used in in-
dustrial processes.
* Corresponding Author. Tel.: �/49-211-8114152; fax: �/49-211-
8112803.
E-mail address: [email protected] (K. Marquez).1 ISE Member (K. Marquez: Student member).
Electrochimica Acta 48 (2003) 711�/720
www.elsevier.com/locate/electacta
0013-4686/02/$ - see front matter # 2002 Elsevier Science Ltd. All rights reserved.
PII: S 0 0 1 3 - 4 6 8 6 ( 0 2 ) 0 0 7 4 0 - 5
In general, the structure and properties of the result-
ing metal and alloy films are strongly dependent on the
mechanism of nucleation and growth. Therefore, a
detailed understanding of the processes occurring duringelectrodeposition is crucial for obtaining high quality
deposits [7].
In the last few years many spectroelectrochemical
methods have shown their importance for studying the
electrode/electrolyte interfacial region. Undoubtedly, a
very successful technique has been potential modulated
external reflectance IR spectroscopy [8], in which both
spectral and transient information about the concentra-tions of absorbing species in the diffusion layer at the
electrode can be obtained. In the last years, reflectance
Fourier Transform IR spectroscopy has been success-
fully applied for studying various electrochemical sys-
tems [9�/12].
In this paper, a study of the electrodeposition of Ag,
Au and Ag�/Au alloys on H-terminated n-type silicon
(111) from cyanide solutions is presented and comparedwith results obtained on glassy carbon (GC). The
deposition process on both substrates was investigated
using a combination of electrochemical and spectro-
scopic methods. For obtaining continuous and smooth
deposits, a double pulse polarisation routine, previously
described [13], was used. Some physical and electronic
properties of the deposits, which have been studied using
combined surface analytical and electrochemical techni-ques are also briefly discussed.
2. Experimental
Electrochemical measurements were carried out in a
conventional three-electrodes cell at room temperature
in the systems:
a) n-Si(111)/x mM AgCN�/0.2 M KCN�/0.5 M KOH
(pH 14);
b) n-Si(111)/x mM AuCN�/0.2 M KCN�/0.5 M KOH
(pH 14);
c) n-Si(111)/x mM AgCN�/x mM AuCN�/0.2 M
KCN�/0.5 M KOH (pH 14);d) GC/x mM AgCN�/0.2 M KCN�/0.5 M KOH (pH
14);
e) GC/x mM AuCN�/0.2 M KCN�/0.5 M KOH (pH
14); and
f) GC/x mM AgCN�/x mM AuCN�/0.2 M KCN�/
0.5 M KOH (pH 14).
Electrolyte solutions were prepared from analytical
grade chemicals and Millipore† water and kept under
inert atmosphere. For the in situ spectroelectrochemicalstudies, a typical external reflectance cell with a flat
CaF2 window was used. A 2000 FTIR Spectrometer
(Perkin�/Elmer) with a software-controlled source car-
ousel and a liquid nitrogen cooled Mercury Cadmium
Telluride (MCT) detector was coupled to the electro-
chemical system for the FTIR measurements [14].
Wavelength reference was provided by a 632.99 nmhelium neon (He/Ne) laser. For data manipulation, a
difference protocol was adopted, with only those
absorptions that changed with time and/or potential
being retained in the spectra: the reference spectrum, Sr,
was collected at a reference potential, Er, within an
electro-inactive region. Then, depending on the case, the
potential was either successively stepped to other values
(Es), being further spectra (Ss) collected at each step, orit was changed in a single potential increment and the
spectra Ss were collected as a function of time. The
number of averaged scans was chosen to give an
adequate signal/noise ratio. All spectra are presented as:
DR=R�(Ss�Sr)=Sr versus n (cm�1) (1)
Experiments were performed either on phosphorous-
doped n-Si(111) wafers (Silchem, Germany) with a
resistivity of 7.5 V cm (ND:/1015 cm�3) or on GC
discs (HTW, Germany). Prior to each experiment the Si
wafers were sequentially cleaned ultrasonically for 10
min in trichloroethylene, acetone, ethanol and water. Anohmic contact was formed on the back side of the wafer
by applying InGa eutectic after treatment in 48% HF
and 40% NH4F for 2 min. After this treatment a stepped
hydrogen-terminated Si surface with atomically flat
terraces was obtained. The GC discs were first polished
with several grades of alumina (Buehler) down to 0.3
mm, then cleaned in Millipore† water in an ultrasonic
bath for 10 min and finally pre-treated electrochemicallyin the metal-free solutions. All electrode potentials given
here are referred to the standard hydrogen electrode
(SHE).
3. Results and discussion
Typical cyclic voltammograms in the systems: n-Si/
[Ag(CN)2]�, n-Si/[Au(CN)2]� and n-Si/[Au(CN)2]��/
[Ag(CN)2]� are shown in Fig. 1. In all cases cyclic
voltammograms show initial deposition peaks and limit-
ing current densities, indicating a mass transport con-
trolled deposition process at high negative potentials.Ag behaves as a more noble metal than Au in this
medium, and a difference of about 150 mV is observed
between both deposition peaks (Fig. 1a). In the case of
the mixed Ag�/Au electrolyte (Fig. 1b), electrodeposi-
tion starts earlier than deposition of Ag or Au from the
corresponding one component electrolytes, indicating a
strong interaction between adsorbed Ag and Au species.
However, the nucleation and growth kinetics from asolution containing equal amounts of AgCN and AuCN
is afterwards slightly inhibited, the deposition peak
being shifted in about DE�/110 mV to more negative
K. Marquez et al. / Electrochimica Acta 48 (2003) 711�/720712

potentials with respect to the system: n-Si/[Ag(CN)2]�.
Due to the formation of high Schottky barriers in all
cases [13], the deposits cannot be dissolved electroche-
mically under the experimental conditions. For compar-
ison, curves in the systems: GC/[Ag(CN)2]�, GC/
[Au(CN)2]� and GC/[Ag(CN)2]��/[Au/(CN)2]� are
presented in Fig. 2a and b. Metal and alloy deposits
can be easily dissolved from the GC electrode and
equivalent charge densities were estimated for the
deposition and dissolution processes in all cases. As it
can be seen in Fig. 2a, Ag deposition on GC takes place
at a less negative potential than on Si. In the case of Au
(Fig. 2a), a small dissolution peak is observed at E�/�/
0.43 V in the cyclic voltammogram in addition to the
main dissolution peak. As reported by MacArthur [15],
this smaller peak could be consistent with a charge
transfer reaction, producing an intermediate (AuCNads)
which becomes soluble by a rate-determining chemical
reaction in which the species [Au(CN)2]� is finally
formed. In Fig. 2b, a cyclic voltammogram obtained
during the alloy deposition, showing both dissolution
peaks for Ag and Au, can be seen. Fig. 2c shows cyclic
voltammograms taken at two different scanning rates
during Ag�/Au alloy deposition on GC. As can be seen,
at dE /dt�/10 mV/s both anodic peaks corresponding to
Ag and Au dissolution can be clearly distinguished,
while at dE /dt�/50 mV/s only the peak for Au dissolu-
tion is well defined. These results suggest that the
amount of Ag deposited at higher sweep rates is
relatively small compared to Au, indicating a higher
Au deposition rate. EDX and XPS measurements
performed on Ag�/Au alloy deposits formed at different
scanning rates on n-Si(111) confirm these observations
[16].
Upon coordination to a metal, the vibration band of
the CN� group, which is normally found at about 2080
cm�1, shifts to higher frequencies. Additionally, the C�/
N stretching bands in cyano complexes are governed by
the electronegativity, the oxidation state and the co-
ordination number of the metal. Because of this, it is
possible to distinguish very well between the different
Fig. 1. Cyclic voltammograms for: (a) Ag and Au deposition in the
systems: n-Si(111)/[Ag(CN)2]� (pH 14, cAgCN�/5 mM) and n-Si(111)/
[Au(CN)2]� (pH 14, cAuCN�/5 mM). Scan rate jdE /dt j�/10 mV/s.
The standard equilibrium potentials (/E0eq; Ag/and/E0
eq; Au) for the systems
Ag/[Ag(CN)2]� and Au/[Au(CN)2]� are shown. (b) Alloy deposition
in the system n-Si(111)/[Ag(CN)2]��/[Au(CN)2]� (pH 14, cAgCN�/
cAuCN�/5 mM). Scan rate jdE /dt j�/10 mV/s.
Fig. 2. Cyclic voltammograms for: (a) Ag and Au deposition in the
systems: GC/[Ag(CN)2]� (pH 14, cAgCN�/5 mM) and GC/
[Au(CN)2]� (pH 14, cAuCN�/5 mM). Scan rate jdE /dt j�/10 mV/s.
The standard equilibrium potentials (/E0eq; Ag/and/E0
eq; Au) for the systems
Ag/[Ag(CN)2]� and Au/[Au(CN)2]� are shown. (b) Alloy deposition
in the system GC/[Ag(CN)2]��/[Au(CN)2]� (pH 14, cAgCN�/
cAuCN�/5 mM). Scan rate jdE /dt j�/10 mV/s; (c) Alloy deposition in
the system GC/[Ag(CN)2]��/[Au(CN)2]� (pH 14, cAgCN�/cAuCN�/5
mM). Scan rates jdE /dt j�/10 and 50 mV/s.
K. Marquez et al. / Electrochimica Acta 48 (2003) 711�/720 713
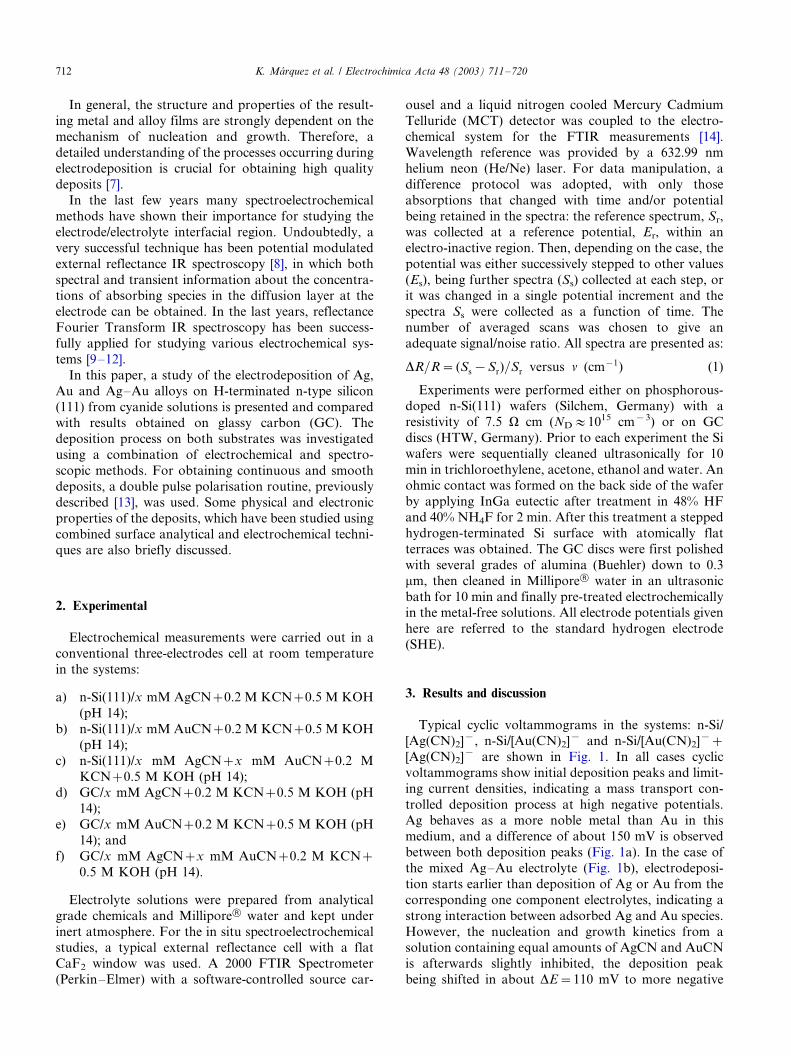
species involved during the Ag�/Au alloy deposition
process in cyanide. As it can be seen in Fig. 3 and Table
1, in the case of Ag, two different complexes were
observed under the experimental conditions: the com-
plexes [Ag(CN)2]� and [Ag(CN)3]2�. In the case of Au,
however, only one complex was present, namely the di-
cyano complex. This fact can be easily understood if the
formation constants for the di-cyano complexes of both
metals are considered (Table 1). Au is more electro-
negative than Ag, and for this reason the band
corresponding to [Au(CN)2]� appears at a higher
frequency compared to that corresponding to
[Ag(CN)2]�. In the spectrum obtained during the alloy
deposition, all three peaks can be distinguished. Addi-
tionally, a band due to free cyanide can be observed in
all cases at about 2080 cm�1. All bands shown in Fig. 3
are described in Table 1.
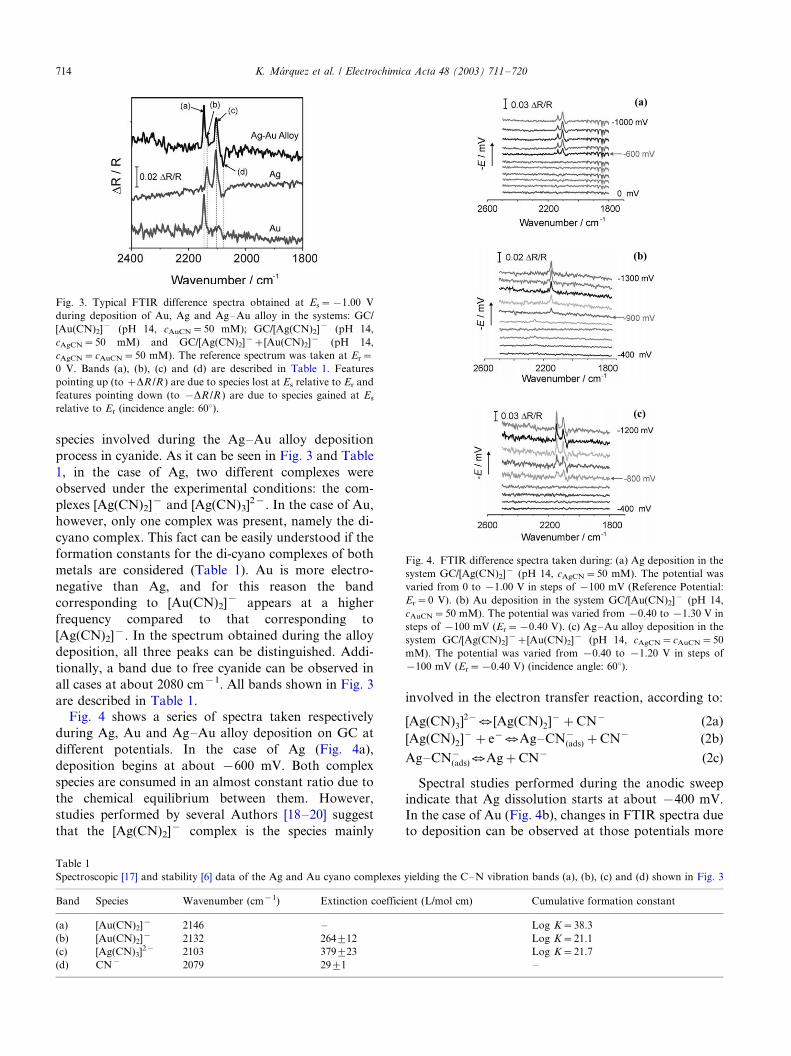
Fig. 4 shows a series of spectra taken respectively
during Ag, Au and Ag�/Au alloy deposition on GC at
different potentials. In the case of Ag (Fig. 4a),
deposition begins at about �/600 mV. Both complex
species are consumed in an almost constant ratio due to
the chemical equilibrium between them. However,
studies performed by several Authors [18�/20] suggest
that the [Ag(CN)2]� complex is the species mainly
involved in the electron transfer reaction, according to:
[Ag(CN)3]2�U [Ag(CN)2]��CN� (2a)
[Ag(CN)2]��e�UAg�CN�(ads)�CN� (2b)
Ag�CN�(ads)UAg�CN� (2c)
Spectral studies performed during the anodic sweep
indicate that Ag dissolution starts at about �/400 mV.
In the case of Au (Fig. 4b), changes in FTIR spectra due
to deposition can be observed at those potentials more
Fig. 3. Typical FTIR difference spectra obtained at Es�/�/1.00 V
during deposition of Au, Ag and Ag�/Au alloy in the systems: GC/
[Au(CN)2]� (pH 14, cAuCN�/50 mM); GC/[Ag(CN)2]� (pH 14,
cAgCN�/50 mM) and GC/[Ag(CN)2]��/[Au(CN)2]� (pH 14,
cAgCN�/cAuCN�/50 mM). The reference spectrum was taken at Er�/
0 V. Bands (a), (b), (c) and (d) are described in Table 1. Features
pointing up (to �/DR /R ) are due to species lost at Es relative to Er and
features pointing down (to �/DR /R ) are due to species gained at Es
relative to Er (incidence angle: 608).
Table 1
Spectroscopic [17] and stability [6] data of the Ag and Au cyano complexes yielding the C�/N vibration bands (a), (b), (c) and (d) shown in Fig. 3
Band Species Wavenumber (cm�1) Extinction coefficient (L/mol cm) Cumulative formation constant
(a) [Au(CN)2]� 2146 �/ Log K�/38.3
(b) [Au(CN)2]� 2132 2649/12 Log K�/21.1
(c) [Ag(CN)3]2� 2103 3799/23 Log K�/21.7
(d) CN� 2079 299/1 �/
Fig. 4. FTIR difference spectra taken during: (a) Ag deposition in the
system GC/[Ag(CN)2]� (pH 14, cAgCN�/50 mM). The potential was
varied from 0 to �/1.00 V in steps of �/100 mV (Reference Potential:
Er�/0 V). (b) Au deposition in the system GC/[Au(CN)2]� (pH 14,
cAuCN�/50 mM). The potential was varied from �/0.40 to �/1.30 V in
steps of �/100 mV (Er�/�/0.40 V). (c) Ag�/Au alloy deposition in the
system GC/[Ag(CN)2]��/[Au(CN)2]� (pH 14, cAgCN�/cAuCN�/50
mM). The potential was varied from �/0.40 to �/1.20 V in steps of
�/100 mV (Er�/�/0.40 V) (incidence angle: 608).
K. Marquez et al. / Electrochimica Acta 48 (2003) 711�/720714
negative than �/900 mV. Results obtained in the mixed
solution (Fig. 4c) indicate that both metals co-deposit at
E B/�/800 mV during the Ag�/Au alloy formation.
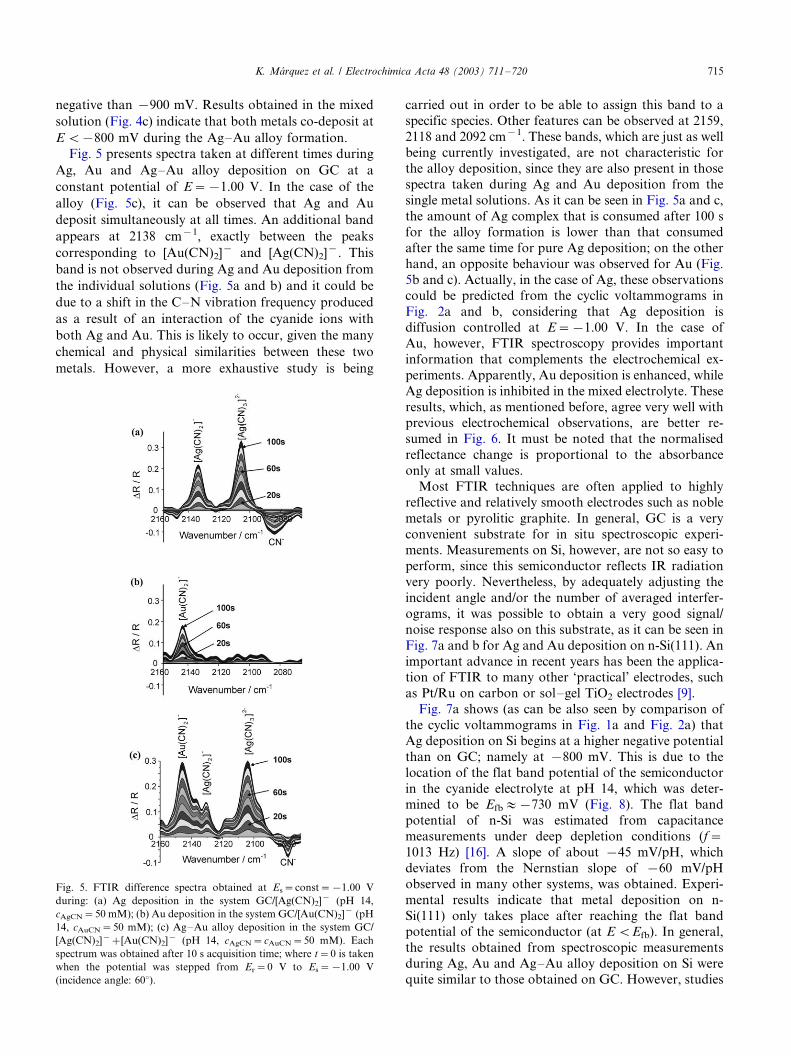
Fig. 5 presents spectra taken at different times during
Ag, Au and Ag�/Au alloy deposition on GC at a
constant potential of E�/�/1.00 V. In the case of the
alloy (Fig. 5c), it can be observed that Ag and Au
deposit simultaneously at all times. An additional band
appears at 2138 cm�1, exactly between the peaks
corresponding to [Au(CN)2]� and [Ag(CN)2]�. This
band is not observed during Ag and Au deposition from
the individual solutions (Fig. 5a and b) and it could be
due to a shift in the C�/N vibration frequency produced
as a result of an interaction of the cyanide ions with
both Ag and Au. This is likely to occur, given the many
chemical and physical similarities between these two
metals. However, a more exhaustive study is being
carried out in order to be able to assign this band to a
specific species. Other features can be observed at 2159,
2118 and 2092 cm�1. These bands, which are just as well
being currently investigated, are not characteristic forthe alloy deposition, since they are also present in those
spectra taken during Ag and Au deposition from the
single metal solutions. As it can be seen in Fig. 5a and c,
the amount of Ag complex that is consumed after 100 s
for the alloy formation is lower than that consumed
after the same time for pure Ag deposition; on the other
hand, an opposite behaviour was observed for Au (Fig.
5b and c). Actually, in the case of Ag, these observationscould be predicted from the cyclic voltammograms in
Fig. 2a and b, considering that Ag deposition is
diffusion controlled at E�/�/1.00 V. In the case of
Au, however, FTIR spectroscopy provides important
information that complements the electrochemical ex-
periments. Apparently, Au deposition is enhanced, while
Ag deposition is inhibited in the mixed electrolyte. These
results, which, as mentioned before, agree very well withprevious electrochemical observations, are better re-
sumed in Fig. 6. It must be noted that the normalised
reflectance change is proportional to the absorbance
only at small values.
Most FTIR techniques are often applied to highly
reflective and relatively smooth electrodes such as noble
metals or pyrolitic graphite. In general, GC is a very
convenient substrate for in situ spectroscopic experi-ments. Measurements on Si, however, are not so easy to
perform, since this semiconductor reflects IR radiation
very poorly. Nevertheless, by adequately adjusting the
incident angle and/or the number of averaged interfer-
ograms, it was possible to obtain a very good signal/
noise response also on this substrate, as it can be seen in
Fig. 7a and b for Ag and Au deposition on n-Si(111). An
important advance in recent years has been the applica-tion of FTIR to many other ‘practical’ electrodes, such
as Pt/Ru on carbon or sol�/gel TiO2 electrodes [9].
Fig. 7a shows (as can be also seen by comparison of
the cyclic voltammograms in Fig. 1a and Fig. 2a) that
Ag deposition on Si begins at a higher negative potential
than on GC; namely at �/800 mV. This is due to the
location of the flat band potential of the semiconductor
in the cyanide electrolyte at pH 14, which was deter-mined to be Efb:/�/730 mV (Fig. 8). The flat band
potential of n-Si was estimated from capacitance
measurements under deep depletion conditions (f�/
1013 Hz) [16]. A slope of about �/45 mV/pH, which
deviates from the Nernstian slope of �/60 mV/pH
observed in many other systems, was obtained. Experi-
mental results indicate that metal deposition on n-
Si(111) only takes place after reaching the flat bandpotential of the semiconductor (at E B/Efb). In general,
the results obtained from spectroscopic measurements
during Ag, Au and Ag�/Au alloy deposition on Si were
quite similar to those obtained on GC. However, studies
Fig. 5. FTIR difference spectra obtained at Es�/const�/�/1.00 V
during: (a) Ag deposition in the system GC/[Ag(CN)2]� (pH 14,
cAgCN�/50 mM); (b) Au deposition in the system GC/[Au(CN)2]� (pH
14, cAuCN�/50 mM); (c) Ag�/Au alloy deposition in the system GC/
[Ag(CN)2]��/[Au(CN)2]� (pH 14, cAgCN�/cAuCN�/50 mM). Each
spectrum was obtained after 10 s acquisition time; where t�/0 is taken
when the potential was stepped from Er�/0 V to Es�/�/1.00 V
(incidence angle: 608).
K. Marquez et al. / Electrochimica Acta 48 (2003) 711�/720 715

performed on Si had one clear disadvantage: the
deposits could not be dissolved electrochemically and
thus, the electrode had to be dismounted and replaced
after each measurement, making experiments on Si quite
time-consuming and more vulnerable to experimental
errors.
Due to the relatively small interaction energy between
the metal adatoms and the substrate, the Ag�/Au alloy
deposition on n-Si(111) and GC electrodes follows a 3D
island growth mechanism (Volmer-Weber mechanism)
[24], as can be seen in Fig. 9a, where an AFM image of
Ag�/Au alloy islands deposited on n-Si(111) by applying
a 20 s long pulse to E�/�/1.00 V is shown. The width/
height ratios of the Ag�/Au alloy clusters determined
from the AFM measurements show that the growing
nuclei can be considered hemispherical as assumed in
most theoretical models. The observed size distribution
of the clusters is characteristic for a progressive nuclea-
tion mechanism. This was also confirmed by chron-
oamperometric measurements. A typical current
transient for Ag�/Au alloy deposition in the system n-
Si(111)/[Ag(CN)2]�, [Au(CN)2]� at E�/�/1.10 V is
Fig. 6. Variation of the intensities of the n (CN) bands for: (a)
[Ag(CN)2]�; (b) [Ag(CN)3]2�; and (c) [Au(CN)2]� during alloy and
metal deposition at E�/const�/�/1.00 V from the mixed and
individual solutions on GC. As can be seen, Ag deposition is in
somewhat inhibited (while Au deposition is enhanced) in the mixed
electrolyte.
Fig. 7. FTIR difference spectra taken during: (a) Ag deposition in the
system n-Si(111)/[Ag(CN)2]� (pH 14, cAgCN�/50 mM). The potential
was varied from �/0.20 to �/1.20 V in steps of �/200 mV (Reference
Potential: Er�/�/0.20 V); (b) Au deposition in the system n-Si(111)/
[Au(CN)2]� (pH 14, cAuCN�/50 mM). The potential was varied from
�/0.30 to �/1.30 V in steps of �/200 mV (Er�/�/0.30 V) (incidence
angle: 408).
Fig. 8. Flat band potentials Efb of n-Si in several electrolytes at
different pH values [16,21�/23]
K. Marquez et al. / Electrochimica Acta 48 (2003) 711�/720716
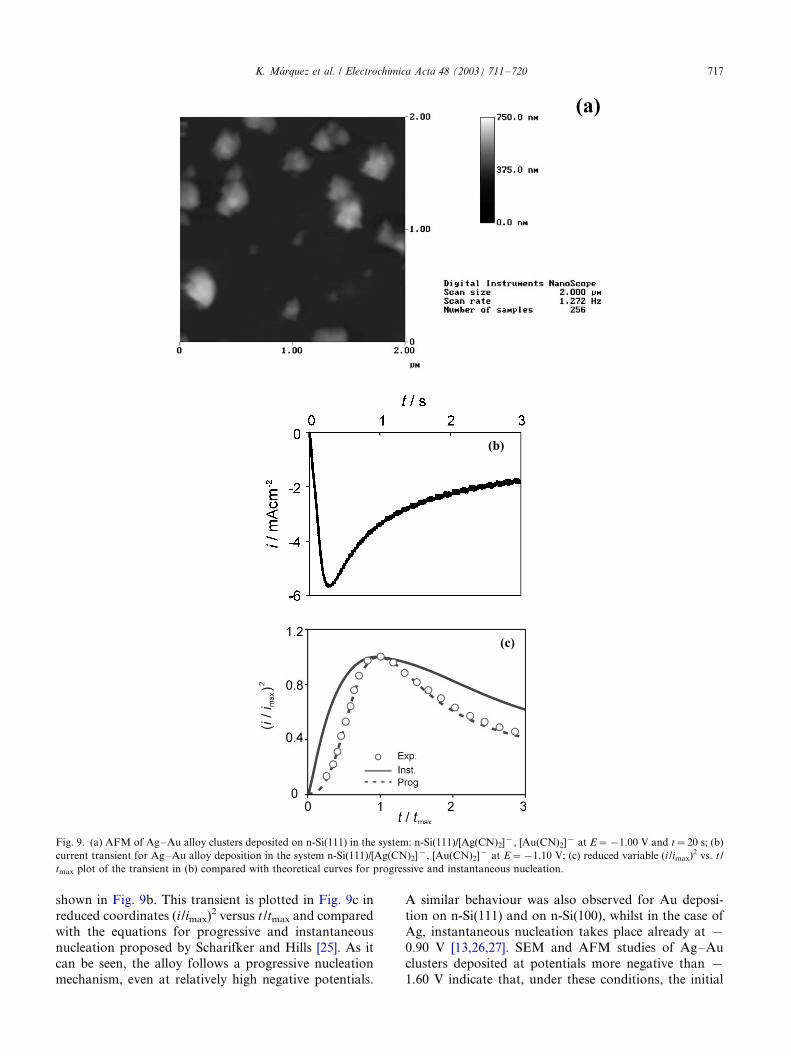
shown in Fig. 9b. This transient is plotted in Fig. 9c in
reduced coordinates (i /imax)2 versus t /tmax and compared
with the equations for progressive and instantaneous
nucleation proposed by Scharifker and Hills [25]. As it
can be seen, the alloy follows a progressive nucleation
mechanism, even at relatively high negative potentials.
A similar behaviour was also observed for Au deposi-
tion on n-Si(111) and on n-Si(100), whilst in the case of
Ag, instantaneous nucleation takes place already at �/
0.90 V [13,26,27]. SEM and AFM studies of Ag�/Au
clusters deposited at potentials more negative than �/
1.60 V indicate that, under these conditions, the initial
Fig. 9. (a) AFM of Ag�/Au alloy clusters deposited on n-Si(111) in the system: n-Si(111)/[Ag(CN)2]�, [Au(CN)2]� at E�/�/1.00 V and t�/20 s; (b)
current transient for Ag�/Au alloy deposition in the system n-Si(111)/[Ag(CN)2]�, [Au(CN)2]� at E�/�/1.10 V; (c) reduced variable (i /imax)2 vs. t /
tmax plot of the transient in (b) compared with theoretical curves for progressive and instantaneous nucleation.
K. Marquez et al. / Electrochimica Acta 48 (2003) 711�/720 717

deposition in this system occurs by instantaneous
nucleation. However, a quantitative analysis of current
transients measured at such high negative potentials was
not possible due to the overlapping hydrogen evolution
current.
As mentioned before, the alloy deposition follows a
3D island growth mechanism. Thus, in order to obtain a
continuous metal film, the density of nuclei must be
sufficiently high for the islands to coalesce during
further growth. This is particularly important for
metallisation of microstructures. For depositing contin-
uous and adherent metal films, a double pulse polarisa-
tion routine was used [13]. Initially, a density of clusters
higher than 1010 cm�1 is produced under conditions of
instantaneous nucleation. In a further step, the clusters
grow under mixed or charge-transfer control. An
example of the metallisation of a recessed n-Si/SiO2
microstructure (prepared on the basis of Si planar
technology [28]) using a double pulse polarisation
routine is shown in Fig. 10.
The electronic properties of the solid state n-Si/metal
and n-Si/alloy junctions were investigated in the dark by
current�/voltage and capacity�/voltage measurements
[13]. All n-Si/alloy and n-Si/metal junctions showed an
ideal Schottky-diode behaviour. No significant influence
of the Ag�/Au alloy composition on the characteristics
of deposited n-Si(111)/Ag�/Au contacts was observed. A
barrier height of about (0.759/0.05) eV was estimated
for the n-Si(111)/Ag�/Au contact in all cases. The
morphology and adhesion of all deposits, as well as
the alloy composition, were found to be strongly
dependent on the deposition potential (Fig. 11). A better
adhesion of the films with a higher Au content was
observed, due to the formation of a more stable Au�/Si
bond with a binding enthalpy of about 305 kJ/mol
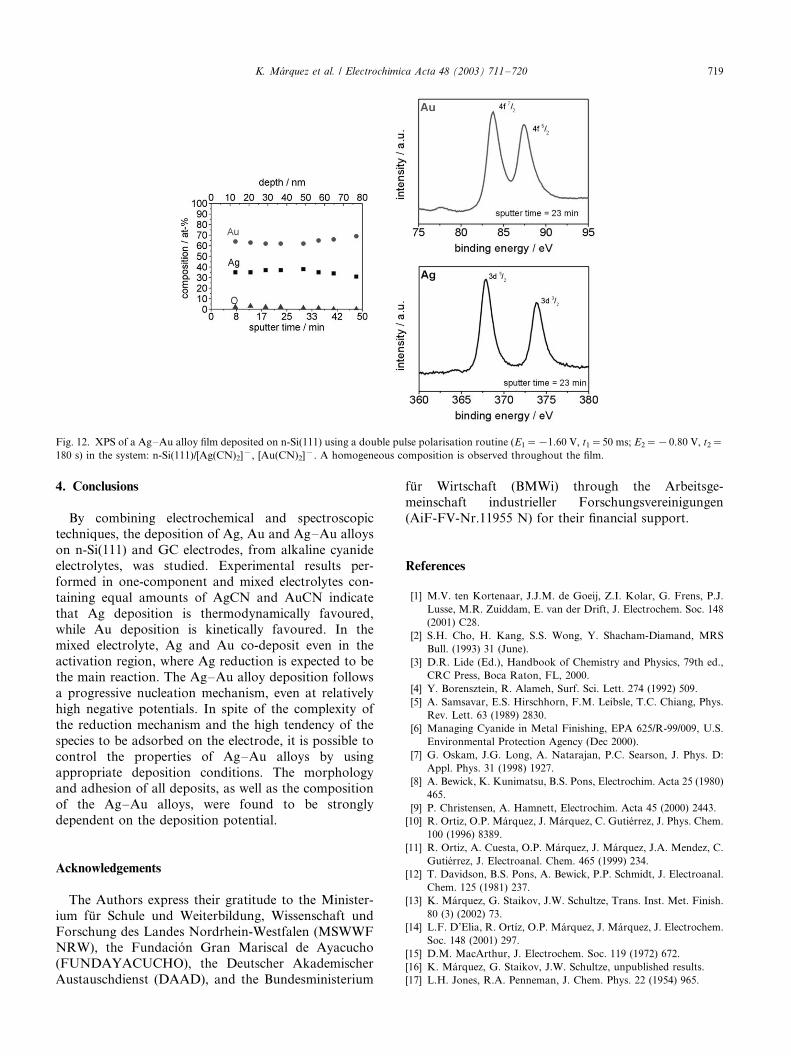
(binding enthalpy for Ag�/Si�/178 kJ/mol) [3]. XPS
surface analytical studies of deposited alloy films with a
thickness between 80 and 300 nm showed that, for given
deposition conditions, the alloy composition is homo-
geneous throughout the film and remains the same at all
sputtering depths (Fig. 12).
Fig. 10. Metallisation of a recessed n-Si/SiO2 microstructure using the
so-called ‘capillary based electrochemical microcell’ [29] and a double
pulse polarisation routine. A continuous, adherent film was obtained.
Fig. 11. (a) AFM of a Ag�/Au alloy film deposited on n-Si(111) at E�/
�/0.80 V. Scan size: 5 mm. (b) AFM of a Ag�/Au alloy film deposited
on n-Si(111) at E�/�/1.10 V. This deposit, which contains about 1.5
times more Au than the deposit shown in (a), exhibited a very good
adhesion to the Si surface. Scan size: 5 mm. (c) Dependence of the
composition of Ag�/Au alloy clusters on the deposition potential E
(obtained from EDX measurements). System: n-Si(111)/[Ag(CN)2]�,
[Au(CN)2]�. Deposition time: t�/20 s. As can be seen, the composi-
tion, adhesion and morphology of the Ag�/Au alloy deposits depend
strongly on the deposition potential.
K. Marquez et al. / Electrochimica Acta 48 (2003) 711�/720718
4. Conclusions
By combining electrochemical and spectroscopictechniques, the deposition of Ag, Au and Ag�/Au alloys
on n-Si(111) and GC electrodes, from alkaline cyanide
electrolytes, was studied. Experimental results per-
formed in one-component and mixed electrolytes con-
taining equal amounts of AgCN and AuCN indicate
that Ag deposition is thermodynamically favoured,
while Au deposition is kinetically favoured. In the
mixed electrolyte, Ag and Au co-deposit even in theactivation region, where Ag reduction is expected to be
the main reaction. The Ag�/Au alloy deposition follows
a progressive nucleation mechanism, even at relatively
high negative potentials. In spite of the complexity of
the reduction mechanism and the high tendency of the
species to be adsorbed on the electrode, it is possible to
control the properties of Ag�/Au alloys by using
appropriate deposition conditions. The morphologyand adhesion of all deposits, as well as the composition
of the Ag�/Au alloys, were found to be strongly
dependent on the deposition potential.
Acknowledgements
The Authors express their gratitude to the Minister-
ium fur Schule und Weiterbildung, Wissenschaft und
Forschung des Landes Nordrhein-Westfalen (MSWWFNRW), the Fundacion Gran Mariscal de Ayacucho
(FUNDAYACUCHO), the Deutscher Akademischer
Austauschdienst (DAAD), and the Bundesministerium
fur Wirtschaft (BMWi) through the Arbeitsge-
meinschaft industrieller Forschungsvereinigungen
(AiF-FV-Nr.11955 N) for their financial support.
References
[1] M.V. ten Kortenaar, J.J.M. de Goeij, Z.I. Kolar, G. Frens, P.J.
Lusse, M.R. Zuiddam, E. van der Drift, J. Electrochem. Soc. 148
(2001) C28.
[2] S.H. Cho, H. Kang, S.S. Wong, Y. Shacham-Diamand, MRS
Bull. (1993) 31 (June).
[3] D.R. Lide (Ed.), Handbook of Chemistry and Physics, 79th ed.,
CRC Press, Boca Raton, FL, 2000.
[4] Y. Borensztein, R. Alameh, Surf. Sci. Lett. 274 (1992) 509.
[5] A. Samsavar, E.S. Hirschhorn, F.M. Leibsle, T.C. Chiang, Phys.
Rev. Lett. 63 (1989) 2830.
[6] Managing Cyanide in Metal Finishing, EPA 625/R-99/009, U.S.
Environmental Protection Agency (Dec 2000).
[7] G. Oskam, J.G. Long, A. Natarajan, P.C. Searson, J. Phys. D:
Appl. Phys. 31 (1998) 1927.
[8] A. Bewick, K. Kunimatsu, B.S. Pons, Electrochim. Acta 25 (1980)
465.
[9] P. Christensen, A. Hamnett, Electrochim. Acta 45 (2000) 2443.
[10] R. Ortiz, O.P. Marquez, J. Marquez, C. Gutierrez, J. Phys. Chem.
100 (1996) 8389.
[11] R. Ortiz, A. Cuesta, O.P. Marquez, J. Marquez, J.A. Mendez, C.
Gutierrez, J. Electroanal. Chem. 465 (1999) 234.
[12] T. Davidson, B.S. Pons, A. Bewick, P.P. Schmidt, J. Electroanal.
Chem. 125 (1981) 237.
[13] K. Marquez, G. Staikov, J.W. Schultze, Trans. Inst. Met. Finish.
80 (3) (2002) 73.
[14] L.F. D’Elia, R. Ortız, O.P. Marquez, J. Marquez, J. Electrochem.
Soc. 148 (2001) 297.
[15] D.M. MacArthur, J. Electrochem. Soc. 119 (1972) 672.
[16] K. Marquez, G. Staikov, J.W. Schultze, unpublished results.
[17] L.H. Jones, R.A. Penneman, J. Chem. Phys. 22 (1954) 965.
Fig. 12. XPS of a Ag�/Au alloy film deposited on n-Si(111) using a double pulse polarisation routine (E1�/�/1.60 V, t1�/50 ms; E2�/�/ 0.80 V, t2�/
180 s) in the system: n-Si(111)/[Ag(CN)2]�, [Au(CN)2]�. A homogeneous composition is observed throughout the film.
K. Marquez et al. / Electrochimica Acta 48 (2003) 711�/720 719

[18] W. Vielstich, H. Gerischer, Z. Phys. Chem. NF4 (1955) 10.
[19] H. Gerischer, Chem. Ing. Tech. 36 (1964) 666.
[20] H. Baltruschat, W. Vielstich, J. Electroanal. Chem. 154 (1983)
141.
[21] P. Allongue, V. Kieling, H. Gerischer, Electrochim. Acta 40
(1995) 1353.
[22] E. Tomita, N. Matsuda, K. Itaya, J. Vac. Sci. Technol. A8 (1990)
534.
[23] R. Krumm, B. Guel, C. Schmitz, G. Staikov, Electrochim. Acta
45 (2000) 73.
[24] E. Budevski, G. Staikov, W.J. Lorenz, Electrochemical Phase
Formation And Growth, VCH, Weinheim, 1996.
[25] B.R. Scharifker, G.J. Hills, Electrochim. Acta 28 (1983) 879.
[26] G. Oskam, P. Searson, Surf. Sci. 446 (2000) 103.
[27] G. Oskam, P. Searson, J. Electrochem. Soc. 147 (2000)
2199.
[28] G. Buß, M.J. Schoning, H. Luth, J.W. Schultze, Electrochim.
Acta 44 (1999) 3899.
[29] M.M. Lohrengel, A. Moehring, M. Pilaski, Electrochim. Acta 47
(2001) 137.
K. Marquez et al. / Electrochimica Acta 48 (2003) 711�/720720
Top Related
Copyright © 2022 FDOKUMEN

