


Bahasa
Halaman
Hukum


Improving the wettability of 2024 aluminium alloy bymeans of cold plasma treatment
W. Polini*, L. SorrentinoDipartimento di Ingegneria Industriale, Universita degli Studi di Cassino, via G. di Biasio 43, 03043 Cassino, Italy
Received 10 October 2002; received in revised form 6 March 2003; accepted 6 March 2003
Abstract
Aluminium alloys are heavily used to manufacture structural parts in the aeronautic industry because of its lightness and its
corrosion resistance. These alloys are successfully used in other industrial fields too, such as railway, automotive and naval
industries. The need to contrast the severe use conditions and the heavy stresses developing in aeronautic field implies to protect
the surfaces of the structures in aluminium alloy by any deterioration. To preserve by deterioration, it is necessary to make
aluminium more suitable to be coated by protective paint. In the aeronautic industry, a complex and critical process is used in
order to enhance both wettability and adhesive properties of aluminium alloy surfaces. Cold plasma treatment represents an
efficient, clean and economic alternative to activate aluminium surfaces.
The present work deals with air cold plasma treatment of 2024 aluminium alloy surfaces. The influence of dc electrical
discharge cold plasma parameters on wettability of 2024 aluminium alloy surfaces has been studied. A set of process variables
(voltage, time and air flow rate) has been identified and used to conduct some experimental tests on the basis of design of
experiment (DOE) techniques. The experimental results show that the proposed plasma process may considerably increase
aluminium alloy wettability. These results represent the first step in trying to optimise the aluminium adhesion by means of this
non-conventional manufacturing process.
# 2003 Elsevier Science B.V. All rights reserved.
Keywords: Cold plasma; Glow-discharge plasma; Aluminium alloy; Wettability
1. Introduction
Metals undergo corrosive phenomena when one or
more of their constituting elements combine with
environmental elements, in particular with oxygen.
An idea of the importance and the spread of the
corrosive phenomena is obtained by estimating the
damage due to corrosion. A recent assessment shows
that the corrosion damages amount to 3.5% of the
gross home product of industrial countries. This
assessment takes into account both the direct and
the indirect damages of corrosion, such as stops in
production or pollution.
The aluminium and the aluminium alloy are
involved in corrosive phenomena when they are used
in critical applications, such as aeronautic ones. In
aeronautic applications, the corrosion of aluminium
involves safety problems. The solution commonly
adopted to solve the corrosive problems is the paint-
ing of the aluminium alloy surface and, therefore, of
2024 aluminium alloy too, which is the subject of
Applied Surface Science 214 (2003) 232–242
* Corresponding author. Tel.: þ39-0776-299679;
fax: þ39-0776-299886.
E-mail address: [email protected] (W. Polini).
URL: http://www.unicas.it.
0169-4332/03/$ – see front matter # 2003 Elsevier Science B.V. All rights reserved.
doi:10.1016/S0169-4332(03)00359-3

this study. The applied paint film protects the alumi-
nium alloy from corrosion. Therefore, the adhesion of
the paint film to the aluminium alloy and the stability
of the film over time are critical variables for corrosion
protection. In fact, after a temporary exposure to
atmospheric conditions the paint film often shows, a
widespread or localised adhesion loss or air bubbles
that form between the paint film and the aluminium
alloy. These entities represent the centres that cause a
quick spread of corrosion below the paint film. The
paint film has to resist humidity penetration, to contain
an anti-corrosive pigment, to have a good adhesion
both to metal and to the further films of paint in order
to protect effectively the aluminium alloy from
corrosion. No protective film with the requirements
described above exists at the moment. Therefore, it is
necessary to apply a primer and, then, a protective film.
Primer assures that the protective film adheres well to
the aluminium below and, eventually, inhibits the
corrosive process. The protective film should prevent
humidity penetration and corrosion. In the aeronautic
industry, a complex and critical process is used in order
to enhance both wettability and adhesive properties of
aluminium alloy surfaces. It consists of three steps:
solvent cleaning to remove grease and dust from
surfaces; an anodising process to protect surfaces from
corrosion; and a primer application to promote adhe-
sion of the paint to the aluminium alloy surfaces.
The treatment of the aluminium to enhance adhe-
sion is the subject of a very large amount of research,
as discussed in detail in [1] where 41 mechanical,
chemical, electrochemical or other treatments are
identified. Cold plasma surface treatment is known
as a powerful process used to modify surface char-
acteristics of aluminium. The effects of oxygen
plasma treatments on the wettability and surface
composition of cold-rolled aluminium foil were inves-
tigated in [2] from a chemical point of view. Low
temperature plasma treatment was shown to be an
efficient approach in order to prepare the surface of
7075-T6 aluminium for Parylene C coatings [3]. Cold
plasma treatment has been applied to adhesive bond-
ing in [4,5]: cold plasma treatment with oxygen on Al
6061 alloy improves shear strength and, therefore, the
quality of the joint. An important characteristic of cold
plasma deposition is the possibility of obtaining coat-
ings with different compositions along the thickness
by changing the process conditions to minimise the
interface between metal and coating, as reported in
[6,7]. Cold plasma represents an efficient, clean and
economic alternative to the conventional techniques in
order to activate the aluminium surfaces.
The present work deals with air cold plasma treat-
ment of aluminium alloy surfaces. In particular, the
possibility that the cold plasma treatment can replace
one or more steps of the traditional process has been
evaluated with a view of eliminating either the priming
or the anodising steps or both. In this way, it will be
possible to decrease the time and, consequently, the
cost of machining and to reduce the weight of the
aeroplane structure since some materials, that are
traditionally used to activate the surface, will not be
applied any more. The first step towards this aim is to
increase surface wettability in order to improve adhe-
sion, as shown for polypropylene in [8,9]. The study of
wettability is the subject of the present work.
The present work aims to study the relationship
between the cold plasma variables and aluminium
alloy wettability. Owing to the complexity of
plasma–workpiece interaction, currently no validated
theory exists to predict the changes in these properties
with process variables which require experimental
investigations. A set of process variables has been
identified and used to conduct some experimental tests
on the basis of design of experiment (DOE) techni-
ques. In Sections 2 and 3, the plasma equipment and
the experimental plan are presented. In Sections 4 and
5, the methodologies, instruments and results related
to wettability are reported.
2. Cold plasma apparatus
A plasma is an ionised gas containing both charged
and neutral particles, such as electrons, ions, atoms,
molecules and radicals. There are two kinds of plasma:
cold and hot. The difference is the temperature of the
heavy species: it is similar to the electrons (104–
105 K) in a hot plasma, while it is lower than 773 K
in a cold plasma (or non-equilibrium plasma). More-
over, the working pressure of a cold plasma is gen-
erally lower than that of a hot plasma: this allows
the production of reactive chemical species at low
temperatures.
A plasma is generally obtained by an electrical
discharge passing through a gas. It is generated by
W. Polini, L. Sorrentino / Applied Surface Science 214 (2003) 232–242 233

either direct current (dc with 50–60 Hz), or radio
frequency (rf with 1.5–50 MHz), or microwave
(MW with 150–104 MHz) power applied to a gas.
In our case, the plasma is produced using an ac
electrical discharge with a 50 Hz frequency. The
transformer clamps are connected with two electrodes,
which are inside a reactor. The gas is confined in it
and it is submitted to pressures around 1000 Pa. The
electric field generated is able to accelerate the
particles and to transfer kinetic energy to them. Their
consequent motion causes a chain reaction, which
increases the concentration of charged particles (ioni-
sation of neutral species). In this way, a cold plasma is
generated. The electric apparatus supplies a voltage at
the electrodes, varying from 0 to 30 kV, with 30 mA as
current maximum. The gas distributor operates in the
pressure range of 300–9000 Pa and the flow rate
interval is 10–500 dm3/h. The details of this equip-
ment are reported in [10].
3. Experimental plan
A large number of process variables affects the cold
plasma results: flow rates of the different gases, total
pressure in the reactor chamber, substrate temperature
and bias, reactor geometry and material, electrode
material and distance between electrodes, tensioned
electric power applied to the plasma [11]. Because of
the complexity of the surface treatment and of the fairly
recent development of cold plasma technology, the
selection of process variables is still largely empirical.
A set of experimental tests has been designed by
means of a factorial experimental plan. The designed
plan is given in Table 1. The available reactor has
imposed some process variables: reactor geometry and
material, electrode material and distance between
electrodes. Among the many other variables that
influence the treatment results, only three have been
selected and considered as factors in the experimental
phase. The selection has been made considering their
influence on the surface treatment like results from
preliminary tests. The levels of the single process
variables have been chosen in order to cover ade-
quately all the possible experimental conditions, which
are consistent with aluminium alloy thermal stability.
The voltage levels (10, 20 and 30 kV) have been
uniformly spread along the reactor capability range,
its maximum value is related to the highest plasma gas
temperature. The flow rate has been chosen as 15, 35
and 60 dm3/h, and the corresponding pressure inside
the reactor has been 1000, 1500 and 2000 Pa. The use
of a flow rate over 60 dm3/h would involve a very high
pressure and temperature inside the reactor which
would not be consistent with aluminium alloy thermal
stability. The time levels (30, 75 and 120 s) have been
selected in order to study aluminium alloy reactivity to
quite long treatments. The gas used in the experiments
has been air, which is the cheapest gas used in cold
plasma treatment. The small dimensions of our reactor
prototype imposed the dimensions of our rectangular
test piece (120 mm � 30 mm area). The surfaces to be
treated have been cleaned by MEC1 and, then, placed
at a distance of 40 mm from the glow discharge to
avoid possible surface overheating. A steel support has
been used for the test piece positioning. As shown in
Table 1, each test has been replicated five times,
yielding a total of 135 measured surfaces. The experi-
ments have been performed in a random sequence, to
reduce the effect of any possible systematic error [12].
Further experiments have been carried out to eval-
uate the increase of wettability due to the most
economic treatment conditions, i.e. those conditions
characterised by a minimum value of voltage supply
(5 kV). This low voltage clearly reduces the achiev-
able wettability. Therefore, the aim is to solve the
trade-off: to find the best value of wettability achiev-
able at minimum cost. We have looked for the best
value of wettability by changing the treatment time for
a fixed value of air flow rate at 60 dm3/h, since the cost
of cold plasma treatment depends on time and on
electric power used to pump the air inside the reactor.
This electric power does not depend on the adopted
flow rate. The number and the value of levels of time
are the same as those of the first experimental plan.
Each test has been replicated three times.
Table 1
Experimental plan
Process variables Number of levels Values
Tension (kV) 3 10, 20, 30
Air flow rate (dm3/h) 3 15, 35, 60
Treatment time (s) 3 30, 75, 120
Replications 5
Measured surfaces 135
234 W. Polini, L. Sorrentino / Applied Surface Science 214 (2003) 232–242
4. Measurement of wettability
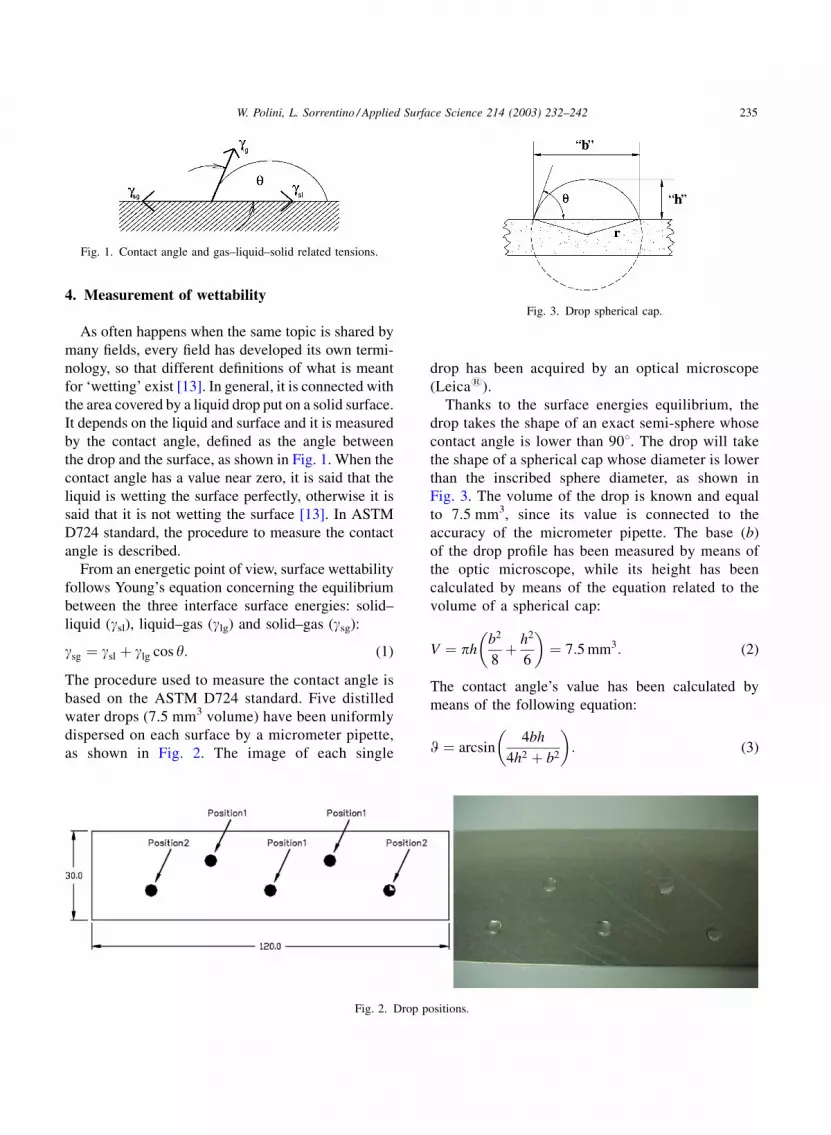
As often happens when the same topic is shared by
many fields, every field has developed its own termi-
nology, so that different definitions of what is meant
for ‘wetting’ exist [13]. In general, it is connected with
the area covered by a liquid drop put on a solid surface.
It depends on the liquid and surface and it is measured
by the contact angle, defined as the angle between
the drop and the surface, as shown in Fig. 1. When the
contact angle has a value near zero, it is said that the
liquid is wetting the surface perfectly, otherwise it is
said that it is not wetting the surface [13]. In ASTM
D724 standard, the procedure to measure the contact
angle is described.
From an energetic point of view, surface wettability
follows Young’s equation concerning the equilibrium
between the three interface surface energies: solid–
liquid (gsl), liquid–gas (glg) and solid–gas (gsg):
gsg ¼ gsl þ glg cos y: (1)
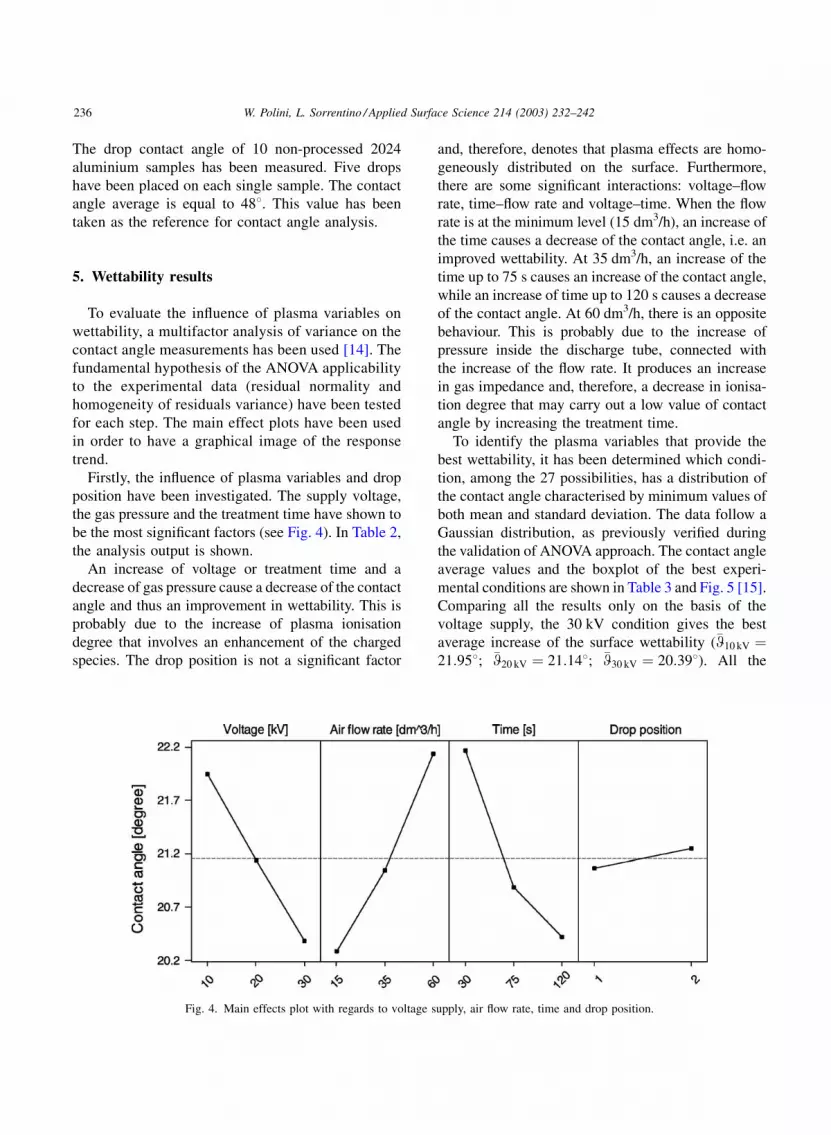
The procedure used to measure the contact angle is
based on the ASTM D724 standard. Five distilled
water drops (7.5 mm3 volume) have been uniformly
dispersed on each surface by a micrometer pipette,
as shown in Fig. 2. The image of each single
drop has been acquired by an optical microscope
(Leica1).
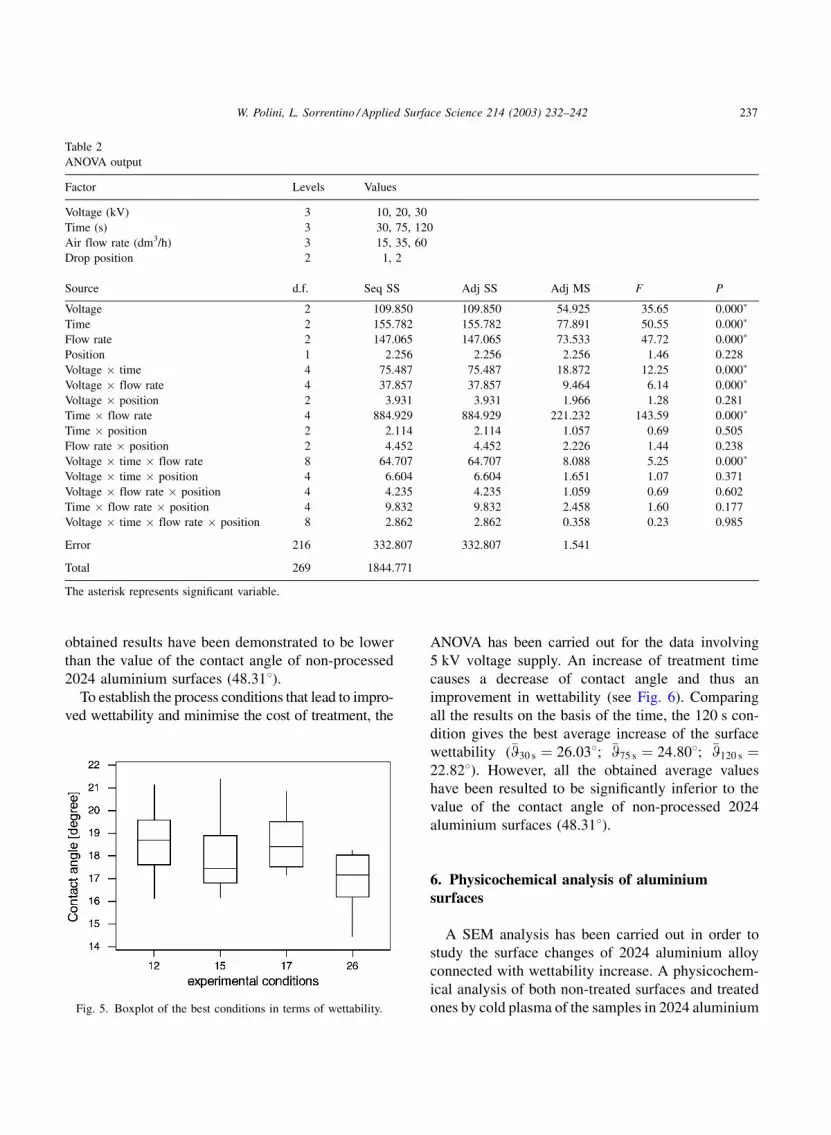
Thanks to the surface energies equilibrium, the
drop takes the shape of an exact semi-sphere whose
contact angle is lower than 908. The drop will take
the shape of a spherical cap whose diameter is lower
than the inscribed sphere diameter, as shown in
Fig. 3. The volume of the drop is known and equal
to 7.5 mm3, since its value is connected to the
accuracy of the micrometer pipette. The base (b)
of the drop profile has been measured by means of
the optic microscope, while its height has been
calculated by means of the equation related to the
volume of a spherical cap:
V ¼ phb2
8þ h2
6
� �¼ 7:5 mm3: (2)
The contact angle’s value has been calculated by
means of the following equation:
W ¼ arcsin4bh
4h2 þ b2
� �: (3)
Fig. 1. Contact angle and gas–liquid–solid related tensions.
Fig. 2. Drop positions.
Fig. 3. Drop spherical cap.
W. Polini, L. Sorrentino / Applied Surface Science 214 (2003) 232–242 235
The drop contact angle of 10 non-processed 2024
aluminium samples has been measured. Five drops
have been placed on each single sample. The contact
angle average is equal to 488. This value has been
taken as the reference for contact angle analysis.
5. Wettability results
To evaluate the influence of plasma variables on
wettability, a multifactor analysis of variance on the
contact angle measurements has been used [14]. The
fundamental hypothesis of the ANOVA applicability
to the experimental data (residual normality and
homogeneity of residuals variance) have been tested
for each step. The main effect plots have been used
in order to have a graphical image of the response
trend.
Firstly, the influence of plasma variables and drop
position have been investigated. The supply voltage,
the gas pressure and the treatment time have shown to
be the most significant factors (see Fig. 4). In Table 2,
the analysis output is shown.
An increase of voltage or treatment time and a
decrease of gas pressure cause a decrease of the contact
angle and thus an improvement in wettability. This is
probably due to the increase of plasma ionisation
degree that involves an enhancement of the charged
species. The drop position is not a significant factor
and, therefore, denotes that plasma effects are homo-
geneously distributed on the surface. Furthermore,
there are some significant interactions: voltage–flow
rate, time–flow rate and voltage–time. When the flow
rate is at the minimum level (15 dm3/h), an increase of
the time causes a decrease of the contact angle, i.e. an
improved wettability. At 35 dm3/h, an increase of the
time up to 75 s causes an increase of the contact angle,
while an increase of time up to 120 s causes a decrease
of the contact angle. At 60 dm3/h, there is an opposite
behaviour. This is probably due to the increase of
pressure inside the discharge tube, connected with
the increase of the flow rate. It produces an increase
in gas impedance and, therefore, a decrease in ionisa-
tion degree that may carry out a low value of contact
angle by increasing the treatment time.
To identify the plasma variables that provide the
best wettability, it has been determined which condi-
tion, among the 27 possibilities, has a distribution of
the contact angle characterised by minimum values of
both mean and standard deviation. The data follow a
Gaussian distribution, as previously verified during
the validation of ANOVA approach. The contact angle
average values and the boxplot of the best experi-
mental conditions are shown in Table 3 and Fig. 5 [15].
Comparing all the results only on the basis of the
voltage supply, the 30 kV condition gives the best
average increase of the surface wettability (�W10 kV ¼21:958; �W20 kV ¼ 21:148; �W30 kV ¼ 20:398). All the
Fig. 4. Main effects plot with regards to voltage supply, air flow rate, time and drop position.
236 W. Polini, L. Sorrentino / Applied Surface Science 214 (2003) 232–242
obtained results have been demonstrated to be lower
than the value of the contact angle of non-processed
2024 aluminium surfaces (48.318).To establish the process conditions that lead to impro-
ved wettability and minimise the cost of treatment, the
ANOVA has been carried out for the data involving
5 kV voltage supply. An increase of treatment time
causes a decrease of contact angle and thus an
improvement in wettability (see Fig. 6). Comparing
all the results on the basis of the time, the 120 s con-
dition gives the best average increase of the surface
wettability (�W30 s ¼ 26:038; �W75 s ¼ 24:808; �W120 s ¼22:828). However, all the obtained average values
have been resulted to be significantly inferior to the
value of the contact angle of non-processed 2024
aluminium surfaces (48.318).
6. Physicochemical analysis of aluminiumsurfaces
A SEM analysis has been carried out in order to
study the surface changes of 2024 aluminium alloy
connected with wettability increase. A physicochem-
ical analysis of both non-treated surfaces and treated
ones by cold plasma of the samples in 2024 aluminium
Table 2
ANOVA output
Factor Levels Values
Voltage (kV) 3 10, 20, 30
Time (s) 3 30, 75, 120
Air flow rate (dm3/h) 3 15, 35, 60
Drop position 2 1, 2
Source d.f. Seq SS Adj SS Adj MS F P
Voltage 2 109.850 109.850 54.925 35.65 0.000�
Time 2 155.782 155.782 77.891 50.55 0.000�
Flow rate 2 147.065 147.065 73.533 47.72 0.000�
Position 1 2.256 2.256 2.256 1.46 0.228
Voltage � time 4 75.487 75.487 18.872 12.25 0.000�
Voltage � flow rate 4 37.857 37.857 9.464 6.14 0.000�
Voltage � position 2 3.931 3.931 1.966 1.28 0.281
Time � flow rate 4 884.929 884.929 221.232 143.59 0.000�
Time � position 2 2.114 2.114 1.057 0.69 0.505
Flow rate � position 2 4.452 4.452 2.226 1.44 0.238
Voltage � time � flow rate 8 64.707 64.707 8.088 5.25 0.000�
Voltage � time � position 4 6.604 6.604 1.651 1.07 0.371
Voltage � flow rate � position 4 4.235 4.235 1.059 0.69 0.602
Time � flow rate � position 4 9.832 9.832 2.458 1.60 0.177
Voltage � time � flow rate � position 8 2.862 2.862 0.358 0.23 0.985
Error 216 332.807 332.807 1.541
Total 269 1844.771
The asterisk represents significant variable.
Fig. 5. Boxplot of the best conditions in terms of wettability.
W. Polini, L. Sorrentino / Applied Surface Science 214 (2003) 232–242 237

alloy has been developed. In particular, the surfaces
treated by cold plasma according to wettability
optimal condition (30 kV, 120 s, 35 dm3/h) has been
further investigated and compared with non-treated
one.
The chemical X-ray analysis has underlined the
elements that are present on the surface of the samples,
as weight (wt.%) and atomic (at.%) percentages, as
shown in Table 4. Both the elements constituting 2024
aluminium alloy (aluminium, copper and so on) and
the organic contaminants deriving from the manufac-
turing process of the aluminium alloy (carbon and
Table 3
Contact angle averages (�W) for the 27 experimental conditions
Experiment
ID
Parameter
values
�W (8) sW (8)
1 10 kV, 30 s, 15 dm3/h 23.58 1.34
2 10 kV, 30 s, 35 dm3/h 21.20 1.38
3 10 kV, 30 s, 60 dm3/h 19.49 1.11
4 10 kV, 75 s, 15 dm3/h 21.40 1.10
5 10 kV, 75 s, 35 dm3/h 22.70 1.13
6 10 kV, 75 s, 60 dm3/h 19.44 1.06
7 10 kV, 120 s, 15 dm3/h 24.87 1.29
8 10 kV, 120 s, 35 dm3/h 20.87 1.23
9 10 kV, 120 s, 60 dm3/h 24.97 1.77
10 20 kV, 30 s, 15 dm3/h 22.75 1.23
11 20 kV, 30 s, 35 dm3/h 20.22 1.10
12 20 kV, 30 s, 60 dm3/h 18.65 1.40
13 20 kV, 75 s, 15 dm3/h 19.78 0.98
14 20 kV, 75 s, 35 dm3/h 24.22 1.21
15 20 kV, 75 s, 60 dm3/h 17.94 1.62
16 20 kV, 120 s, 15 dm3/h 24.76 1.29
17 20 kV, 120 s, 35 dm3/h 18.57 1.22
18 20 kV, 120 s, 60 dm3/h 23.35 1.11
19 30 kV, 30 s, 15 dm3/h 19.51 1.16
20 30 kV, 30 s, 35 dm3/h 18.73 0.97
21 30 kV, 30 s, 60 dm3/h 18.45 1.17
22 30 kV, 75 s, 15 dm3/h 20.21 1.09
23 30 kV, 75 s, 35 dm3/h 24.51 1.27
24 30 kV, 75 s, 60 dm3/h 19.21 1.03
25 30 kV, 120 s, 15 dm3/h 22.62 1.14
26 30 kV, 120 s, 35 dm3/h 16.97 1.18
27 30 kV, 120 s, 60 dm3/h 23.26 1.42
Fig. 6. Main effects plot with regards to time (5 kV).
Table 4
Results of X-ray chemical analysis
Element Non-treated Treated with cold plasma
wt.% at.% wt.% at.%
CK 47.63 63.92 22.52 38.83
OK 13.15 13.26 6.21 8.05
MgK 2.36 1.57 3.60 3.07
AlK 34.72 20.75 63.58 48.84
AgL 0.52 0.08 1.10 0.21
MnK 0.21 0.06 0.44 0.17
CuL 1.41 0.36 2.55 0.83
Total 100.00 100.00 100.00 100.00
EDAX ZAF quantification (standardless)—element normalised.
V ¼ 25:00 kV.
238 W. Polini, L. Sorrentino / Applied Surface Science 214 (2003) 232–242
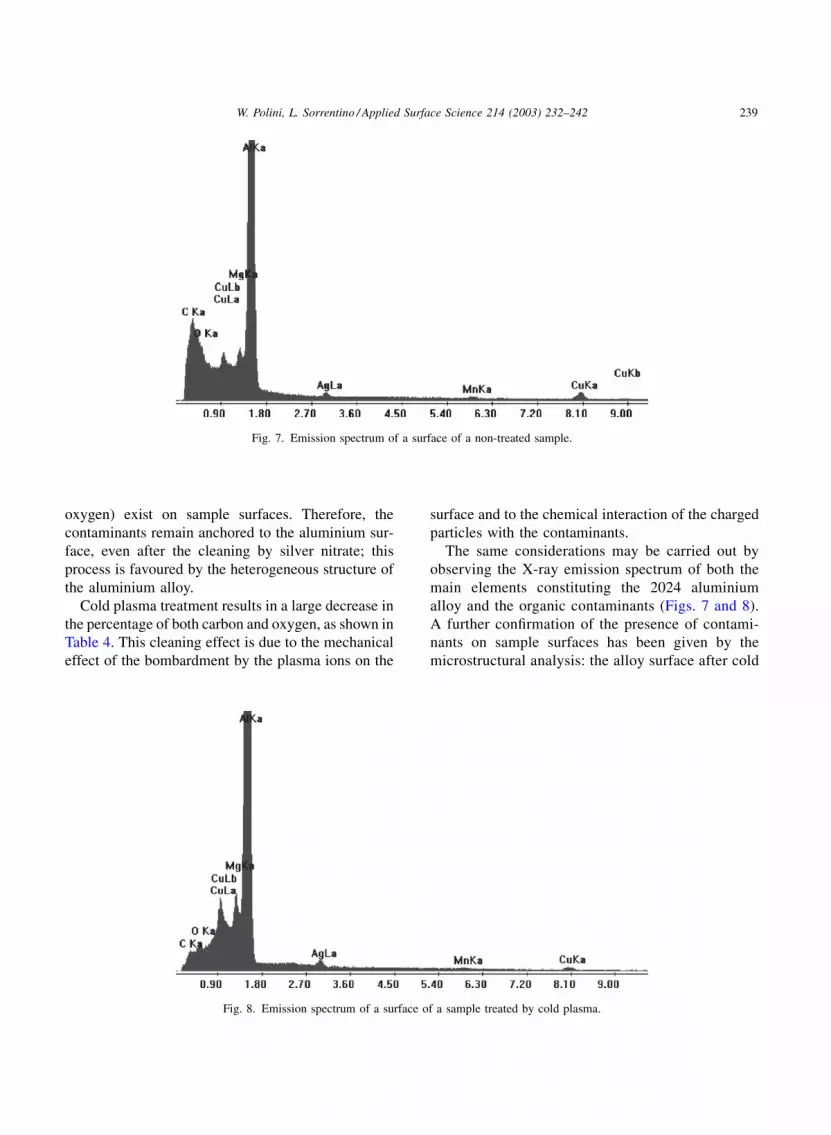
oxygen) exist on sample surfaces. Therefore, the
contaminants remain anchored to the aluminium sur-
face, even after the cleaning by silver nitrate; this
process is favoured by the heterogeneous structure of
the aluminium alloy.
Cold plasma treatment results in a large decrease in
the percentage of both carbon and oxygen, as shown in
Table 4. This cleaning effect is due to the mechanical
effect of the bombardment by the plasma ions on the
surface and to the chemical interaction of the charged
particles with the contaminants.
The same considerations may be carried out by
observing the X-ray emission spectrum of both the
main elements constituting the 2024 aluminium
alloy and the organic contaminants (Figs. 7 and 8).
A further confirmation of the presence of contami-
nants on sample surfaces has been given by the
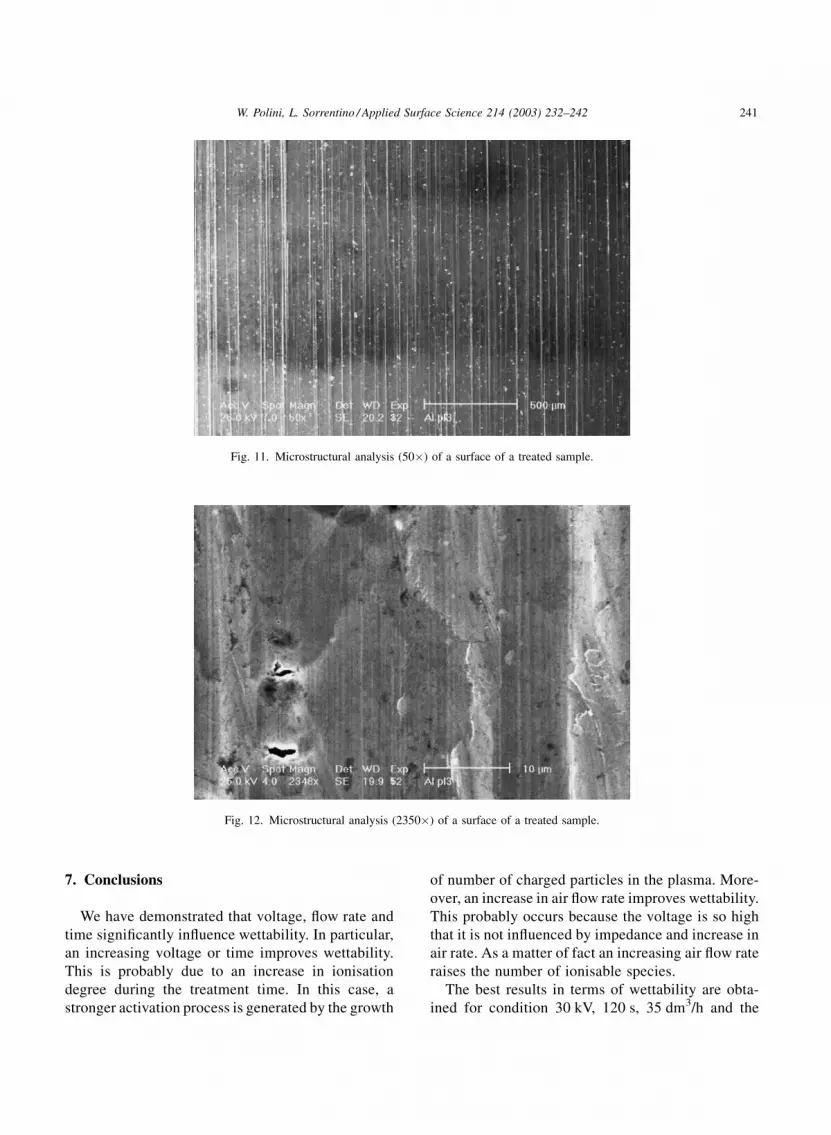
microstructural analysis: the alloy surface after cold
Fig. 7. Emission spectrum of a surface of a non-treated sample.
Fig. 8. Emission spectrum of a surface of a sample treated by cold plasma.
W. Polini, L. Sorrentino / Applied Surface Science 214 (2003) 232–242 239

plasma treatment (Figs. 9 and 10) seems more
polished than that due to the industrial process
(Figs. 11 and 12).
The ageing time of cold plasma treatment applied to
aluminium alloy surface is a fundamental step to plan
the insertion of a cold plasma process inside an
industrial manufacturing plant. We have found out a
decay of about 4% in surface wettability after 1 h from
the cold plasma treatment by leaving the samples in
air, while it reaches 14% after 5 h. Moreover, the
decay is of about 65% after 1 day from treatment,
while it assumes an asymptotic trend from the 2nd day
up to the 7th day where the surface returns to an
untreated condition.
Fig. 9. Microstructural analysis (50�) of a surface of a non-treated sample.
Fig. 10. Microstructural analysis (2350�) of a surface of a non-treated sample.
240 W. Polini, L. Sorrentino / Applied Surface Science 214 (2003) 232–242
7. Conclusions
We have demonstrated that voltage, flow rate and
time significantly influence wettability. In particular,
an increasing voltage or time improves wettability.
This is probably due to an increase in ionisation
degree during the treatment time. In this case, a
stronger activation process is generated by the growth
of number of charged particles in the plasma. More-
over, an increase in air flow rate improves wettability.
This probably occurs because the voltage is so high
that it is not influenced by impedance and increase in
air rate. As a matter of fact an increasing air flow rate
raises the number of ionisable species.
The best results in terms of wettability are obta-
ined for condition 30 kV, 120 s, 35 dm3/h and the
Fig. 11. Microstructural analysis (50�) of a surface of a treated sample.
Fig. 12. Microstructural analysis (2350�) of a surface of a treated sample.
W. Polini, L. Sorrentino / Applied Surface Science 214 (2003) 232–242 241

corresponding contact angle is equal to about 178. The
most economic treatment condition is 5 kV, 120 s,
60 dm3/h that carries out a contact angle equal to
about 218. The contact angle of non-treated 2024
aluminium alloy is about 488. Therefore, the contact
angle reduction connected with plasma surface treat-
ment is higher than 50%. The characterisation of
adhesion properties of aluminium alloy 2024 is cur-
rent matter of further study.
Acknowledgements
This work was carried out with the funding of the
Italian M.U.R.S.T. (Ministry of University and Scien-
tific and Technological Research) and CNR (National
Research Council of Italy). The authors are grateful to
Agusta Frosinone and especially to Dr. Natalizia and
Mr. Colosimo for supporting this work. A special
thanks to engineer Annarita Viperino for participating
in the experimental work.
References
[1] G.W. Critchlow, D.M. Brewis, Review of surface pretreat-
ments for aluminium alloys, Int. J. Adhes. Adhes. 16 (1996)
255–275.
[2] B.R. Strohmeier, Improving the wettability of aluminium foil
with oxygen plasma treatments, in: K.L. Mittal (Ed.), Contact
Angle, Wettability and Adhesion, Utrecht, 1993, pp. 453–468.
[3] Q. Yu, J. Deffeyes, H. Yasuda, Engineering the surface and
interface of Parylene C coatings by low-temperature plasmas,
Prog. Org. Coat. 41 (2001) 247–253.
[4] I. De Iorio, C. Leone, L. Nele, V. Tagliaferri, Plasma
treatments of polymeric materials and Al alloy for adhesive
bonding, J. Mater. Process. Technol. 68 (1997) 179–183.
[5] I. De Iorio, C. Leone, L. Nele, V. Tagliaferri, Plasma
treatments for adhesive bonding, in: Proceedings of the Third
AITEM Conference, Fisciano, 17–19 September 1997,
pp. 351–359.
[6] F. Fracassi, R. D’Agostino, F. Palumbo, F. Bellucci, T.
Monetta, Deposition of gold-containing siloxane thin films,
Thin Solid Films 272 (1996) 60–63.
[7] F. Fracassi, R. D’Agostino, F. Palumbo, F. Bellucci, T.
Monetta, Plasma-assisted deposition of tungsten-containing
siloxane thin films, Thin Solid Films 264 (1995) 40–45.
[8] L. Carrino, G. Moroni, W. Polini, Cold plasma treatment of
polypropylene surface: a study on wettability and adhesion, J.
Mater. Process. Technol. 121 (2002) 373–382.
[9] L. Carrino, W. Polini, L. Sorrentino, Adhesion of polypropy-
lene surfaces treated by cold plasma, in: Proceedings of the
2002 International Body Engineering Conference, IBEC
2002, Paper # 2002-01-2103, Paris, France, 9–11 July 2002.
[10] L. Carrino, G. Moroni, W. Polini, Cold Plasma Technology
for Surface Treatment, Macplas International, Promoplast srl,
1999, pp. 69–72.
[11] A. Grill, Cold Plasma in Materials Fabrication from
Fundamental to Applications, IEEE Press, New York, 1993.
[12] M. Fox, Charts of the power of F-test, Ann. Math. Stat. 27
(1956) 484–497.
[13] F. Garbassi, M. Morra, E. Occhiello, Polymer Surfaces from
Physics to Technology, Wiley, New York, 1998.
[14] J. Neter, W. Wasserman, Applied Linear Statistical Models,
Irwin, Homewood, IL, 1974.
[15] D.C. Montgomery, Introduction to Statistical Quality Control,
Wiley, New York, 1991.
242 W. Polini, L. Sorrentino / Applied Surface Science 214 (2003) 232–242
Top Related
Copyright © 2022 FDOKUMEN

