


Bahasa
Halaman
Hukum


www.iese.edu
IESE Cities in Motion Index
Center for Globalization and Strategy
2015

IESE Business School - IESE Cities in Motion Index2
INDICE
FOREWORD _______________________________________________ 03
ABOUT US _________________________________________________ 05
WORKING TEAM ___________________________________________ 05
SPONSORS ________________________________________________ 05
INTRODUCTION: THE NEED FOR A GLOBAL VISION __________ 06
OUR MODEL: CITIES IN MOTION ____________________________ 07
INDICATORS ______________________________________________ 08
INDICATOR LIMITATIONS __________________________________ 18
GEOGRAPHIC COVERAGE __________________________________ 18
CITIES IN MOTION. RANKING _______________________________ 20
CITIES IN MOTION. RANKING BY DIMENSION ________________ 22
REGIONAL RANKING _______________________________________ 27
A FEW NOTABLE CASES ____________________________________ 28
DEVELOPMENTS IN THE CITIES IN MOTION INDEX __________ 31
CITIES IN MOTION VS. REPUTATION INDEX __________________ 33
CITIES IN MOTION: A DYNAMIC ANALYSIS ___________________ 34
CONCLUSIONS _____________________________________________ 36
GRAPHIC ANNEX. PROFILES OF 148 CITIES __________________ 38

IESE Business School - IESE Cities in Motion Index3
FOREWORD
It is a pleasure for us to present the second edition of our Cities in Motion Index (CIMI), which seeks to evaluate cities as they relate to what we consider 10 key dimensions: Governance, Urban Planning, Public Management, Technology, Environment, International Outreach, So-cial Cohesion, Mobility and Transport, Human Capital and Economy.
As with the first edition, we faced the challenge of creating an index of cities that is superior to existing ones. Therefore, this index is objective, comprehensive, with broad coverage and guided by criteria that have conceptual relevance and statistical rigor. The first edition had a major media impact and was very well received in various forums linked to the management of cities, which has encouraged us to continue working to improve the index. During our presen-tations, we received many recommendations and suggestions, which we tried to incorporate in this new edition. Some of the major changes in the index this year are: • Increased geographical coverage: we have increased by 10% the number of cities inclu-
ded in the ranking, with a total of 148 –55 of them are capitals– representing 57 countries. Among the highlights are Singapore, Hong Kong, San Francisco and Delhi.
• Greater number of indicators: we have increased by 35% the number of indicators that measure 10 relevant dimensions of a city, for a total of 66 indicators. In addition to sources used last year (Euromonitor, World Bank, UNESCO, Transparency International, Yale Uni-versity, ICCA, Global Entrepreneurship Monitor), we have introduced new information sour-ces such as World Health Organization, Financial Times, QS Top Universities, 2thinknow, Sightsmap , GaWC and Numbeo.
• Increased variability at the city level: as a result of the introduction of new sources of information, we were able to replace some indicators in the first edition which had been introduced at the country level with new variables at the city level, allowing an improved assessment of different cities.
• Introduction of subjective indicators: in addition to objective indicators used in the pre-vious edition, one of the recommendations we received was that citizens’ perceptions be incorporated. As a result, we have introduced data from Numbeo, a social network that co-llects information on the views that people have about cities on issues such as cost of living, access to housing, transportation, health and the environment.
• Improved analysis: We have added new analyses on the dynamics of the index, examining their evolution in 2012, 2013 and 2014.
• Improvements in the methodology: we have refined our methodology according to the latest statistical practices in creating synthetic indices.
We hope that this report will be useful to mayors, city managers, urban solutions companies and all those interest groups that aim to improve the quality of life of city inhabitants.
We see this endeavor as a dynamic project. We will continue working to ensure that future editions of the index contain better indicators, greater coverage and growing predictive value. We look forward to your suggestions for improvement and invite you to get in touch with the platform through our website: www.iese.edu/cim.

IESE Business School - IESE Cities in Motion Index4
This work is the result of a collective effort that includes our team, our sponsors and many people who have participated in our workshops, meetings and training programs and who have selflessly provided us with great ideas and support. In particular, this year we want to thank IBM, which has given us the “IBM Faculty Award” for our work on cities.
We are convinced that we can live in better cities, but this will only be possible if all stakehol-ders —the public sector, private businesses, civic organizations and academic institutions— participate and collaborate in order to achieve this common goal. This report is our small contribution.
Prof. Joan Enric Ricart
Carl Schroeder Chair in Strategic Management
Prof. Pascual Berrone
Schneider Electric Sustainabilityand Business Strategy Chair

IESE Business School - IESE Cities in Motion Index5
ABOUT US
IESE Cities in Motion Strategies is a research platform launched jointly by the Center for Globalization and Strategy and the Department of Strategy of the IESE Bu-siness School.
The initiative unites a worldwide network of experts on cities and specialized private companies with local ad-ministrations from around the world with the objective of developing valuable ideas and innovative tools that can lead to more sustainable, smarter cities and promote changes at the local level.
The platform’s mission is to promote the model of Cities in Motion, which includes an innovative approach to the governance of cities and a new urban model for the 21st century based on four main factors: a sustainable ecosystem, innovative activities, equality among citizens and a well-connected territory.
WORKING TEAM
ACADEMIC TEAM
Prof. Pascual Berrone Schneider Electric of Sustainability and Strategy Chair
Prof. Joan Enric Ricart Carl Schroeder Chair of Strategic Management
Carlos CarrascoResearch assistant
TECHNICAL TEAM
David Augusto Giuliodori Econfocus Consulting
María Andrea GiuliodoriIndependent researcher
CONSULTING TEAM
Juan Manuel BarrionuevoPresident of the advisory board of the IESE Cities in Motion platform
WITH THE SUPPORT OF
SPONSORS
2thinknow: City Benchmarking Data, the world’s leading provider of standard city data.
Users of City Benchmarking Data clients include the world’s top management consulting and accounting fir-ms, many city, state and federal governments, leading universities and major global corporations such as Sam-sung and Ogilvy.
2thinknow has provided raw unfiltered actual data to the IESE professors, researchers and analysts. See http://www.citybenchmarkingdata.com or email [email protected]
AND WITH THE COLLABORATION OF

IESE Business School - IESE Cities in Motion Index6
INTRODUCTION: THE NEED FOR A GLOBAL VISION
Now more than ever, cities require strategic planning. Only in this way can they begin to seek out paths for inno-vation and prioritize what is truly important for their future. The strategic planning process must be participatory and flexible, with one central objective: to design a sustainable action plan which contributes uniqueness and notoriety to the metropolis. Just as no two companies can use the same recipe for success, each city must search for its own model based on a set of common considerations.
Experience shows that cities must avoid having a short-term viewpoint and expand their field of vision. They must frequently turn to innovation to improve the efficiency and sustainability of their services, promote communication and get both their people and companies involved in projects.
The time has come to exercise smart governance which bears in mind all factors and social role-players, with a global outlook. It is because of this that, in recent decades, national and international entities have carried out studies with a focus on defining, creating and applying indicators to achieve various objectives, above all that of helping to perform a diagnosis of the status of cities. In each study, the way in which indicators are defined and the process for crea-ting them are the result of each study’s characteristics, the technical and econometric techniques which are best adapted to the theoretical model and available data, and the analysts’ preferences.
At present, there are a large number of “urban” indica-tors, though many of them have not been standardized, or they are not consistent or comparable between cities.
In the past, numerous attempts have been made to develop indicators for cities, of a national, regional and international
scale. However, few have been sustainable in the medium term, because they were studies that intended to meet the specific information needs of certain entities whose exis-tence depended on how long their financing endured. In other cases, the system of indicators depended upon the political desires of the moment, so its creation came to a halt when political priorities or authorities changed.
However, there are also indicators specifically created by international entities that seek to achieve the consistency and strength necessary to compare cities, though in most cases these indices tend to be biased or focused on one subject matter in particular (Technology, Economy, the Environment, etc.).
The Cities in Motion Index (CIMI) was designed with the goal of building an indicator that “surmounts” these difficulties, in the sense that its thoroughness, properties and comparability, and the quality and objectivity of the information included, make it capable of measuring the sustainability of the largest world cities into the future, as well as their inhabitants’ quality of life.
The CIMI seeks to allow people and governments to unders-tand a city’s performance through 10 fundamental “dimen-sions”: Governance, Urban Planning, Public Management, Technology, The Environment, International Outreach, So-cial Cohesion, Mobility and Transportation, Human Capital, and The Economy. All of the indicators are combined with one strategic objective, which leads to a different type of local economic development (creating a global city, promo-ting an entrepreneurial spirit, innovation, etc.).
Each city is unique and exceptional. They each have their own needs and opportunities. Therefore, they must all design their own plan, which establishes priorities while remaining flexible enough to adapt to changes.
Smart cities create many different business opportuni-ties and possibilities for cooperation between the public and private sectors. All can contribute, and therefore a networked ecosystem must be developed that involves every interest group (the people, organizations, institu-tions, government, universities, companies, experts, cen-ters of research, etc.).

IESE Business School - IESE Cities in Motion Index7
Working in a network provides advantages: it allows for better identification of the city’s needs and those of its residents; setting common goals; establishing constant communication between different role-players; increasing learning opportunities; increasing transparency and im-plementing more flexible public policies. As already indi-cated in a report by the OECD (Organization for Economic Cooperation and Development) in 2001, a network focus ensures that local policies revolve around the people.
Private initiative also has much to gain from this system of collaboration in a network; it can cooperate with the Administration in the long term; access new business opportunities; obtain greater knowledge about the needs of the local ecosystem, increase its international visibility and attract talent.
Thanks to their technical knowledge and experience in management projects, private companies are ideal for leading and developing smart city projects, in collabo-ration with universities and other institutions. Moreover, they can contribute efficiency and significant savings to public-private entities.
Last of all, we must not forget that the human factor is fundamental to the development of cities. Without a parti-cipatory, active society, any strategy, no matter how intelli-gent and global it may be, will be destined to fail.
Beyond technological and economic development, people hold the key to making cities shift from being “smart” to “wise.” That is the goal to which all cities must aspire: for the people who inhabit the city and those who govern it to put all of their talent to work in order to achieve progress.
To help cities to identify effective solutions, we have crea-ted an index that captures 10 dimensions into a single indicator and includes 148 cities worldwide. The Cities in Motion Index, due to its comprehensive and integrated view of the city, allows the identification of the strengths and weaknesses of each city.
OUR MODEL: CITIES IN MOTION
Experience shows that cities must flee a short-term vi-sion and expand their field of view, relying more often on innovation to improve the efficiency and sustainability of their services; fostering communication and involving citizens and businesses in projects. The time has come to exercise intelligent governance that takes into account all factors, with a global vision. Through our platform, we propose a conceptual model based on the study of a large number of success stories, as well as a series of in-depth interviews with city leaders, business leaders, academics and experts related to urban development.
Our model proposes a series of steps that encompass everything from performing a diagnosis of the current situation to creating a strategy and later implementing it.The first step towards being able to perform a proper diagnosis of the situation consists of analyzing the sta-tus of the key dimensions, which we describe in the fo-llowing paragraphs.
The first step toward making a good diagnosis is to analyze the situation of the key dimensions, which we set forth below.
HUMAN CAPITALThe main objective of every city should be to improve its human capital. Therefore, it should be able to attract and retain talent; create plans to improve education, and promote creativity and research.
SOCIAL COHESIONConcerns for the social environment of the city requires an analysis of factors such as immigration, community de-velopment, care of the elderly, the efficiency of the health system, and security and civic inclusion.
ECONOMYThis dimension includes all those aspects that promote a territory’s economic development: local economic pro-motion plans, transition plans, strategic industrial plans, the creation of clusters, innovation and entrepreneurial initiatives.
PUBLIC MANAGEMENTThis consists of actions intended to improve the efficien-cy of the Administration, such as designing new models of organization and management. Within this area, great opportunities are created for private initiative, which may contribute to increasing efficiency.

IESE Business School - IESE Cities in Motion Index8
GOVERNANCEPeople are central for solving all the challenges faced by cities. Because of this, such factors must be taken into account as people’s level of participation, the authorities’ ability to get business leaders and local role-players invol-ved, and the application of e-Governance plans.
MOBILITY AND TRANSPORTATIONIn this area, there are two great challenges in terms of the future: facilitating movement through cities, often of very large dimensions, and facilitating access to public services.
THE ENVIRONMENTIn this dimension, the following factors are essential to ci-ties: improving environmental sustainability through plans to fight pollution, supporting green buildings and alterna-tive energies, efficient management of water, and policies that help counteract the effects of climate change.
URBAN PLANNINGTo improve the “livability” of any territory, one must bear in mind the local master plans and the design of green areas and spaces for public use, as well as making a com-mitment to intelligent growth. New urban planning me-thods must focus on creating compact, well-connected cities that have public services that are accessible.
INTERNATIONAL OUTREACHThose cities that wish to progress must achieve a pri-vileged place in the world. Maintaining global outreach means improving the city’s “brand name” and its in-ternational recognition through strategic tourism plans, attracting foreign investment and having representation abroad.
TECHNOLOGY Although cities cannot prosper through technology alone, ICTs (information and communication technologies) are a part of the backbone of any society that wishes to call itself “smart.”
INDICATORS
HUMAN CAPITAL In this dimension, representative indicators were taken that were related to the proportion of the population with secondary and higher level (PHS) studies; the number of top-level business schools (MBAR); the flow of inter-national students in each city or country (IFS); the num-ber of universities (WUR); the number of museums per
100,000 inhabitants (NM); the number of art galleries per 100,000 inhabitants (NAG); and spending on leisure and recreation (CER).
While human capital presents factors that make it more extensive than can be measured by these indicators, there is international consensus that education and ac-cess to culture are essential components in the measu-rement of human capital. In fact, one of the pillars of human development is human capital, and considering that the Human Development Index published annually by the United Nations Development Programme (UNDP) includes education and culture as dimensions, it is valid to take these indicators as explanatory of differences in human capital in a city.
For the CIMI, the proportion of the population with se-condary and higher level (PHS) studies; the number of business schools (MBAR); the flow of international stu-dents in each city or country (IFS) and the number of universities (WUR), are considered positive.
As a measure of access to culture, the number of mu-seums, the number of art galleries and spending on lei-sure and recreation, all directly related to the indicator, are considered. These indicators show the commitment that a city has to culture and human capital. Creative and dynamic cities worldwide tend to have museums and art galleries open to the public and offer visits to art collections and events dedicated to the preservation of art. The existence of a city’s cultural and recreational offerings implies greater spending by the population on these activities
SOCIAL COHESIONSocial Cohesion is a sociological dimension of cities, defined as the degree of consensus of the members of a social group or the perception of belonging to a com-mon project or situation. It is a measure of the intensity of social interaction within the group. Social Cohesion in the urban context refers to the degree of coexistence between groups of people with incomes, cultures, ages and different professions who live in a city. The presence of various groups in the same space and mixing and inte-raction between groups is central to a sustainable urban system. In this context, social cohesion is a state in which there is a shared vision between citizens and the Gover-nment on a model of society based on social justice, the primacy of the rule of law and solidarity. This allows us to understand the relevance of policies to promote social cohesion based on democratic values.
Following the approach of measuring social cohesion adopted by the various indicators available, the following have been selected: the ratio of deaths per 100,000 po-

IESE Business School - IESE Cities in Motion Index9
pulation (DR); crime index (CI); Health index (HCI); the unemployment rate (EBU); the Gini index (GIN); and the price of property as a percentage of income (PPIR).
This selection of indicators attempts to include all of the sociological sub-dimensions that Social Cohesion contains. Health and the expectations of future society are represented, in this case, by the ratio of deaths per 100,000 inhabitants, with the crime rate, both having a negative bearing and the healthcare index, with a positive bearing to this dimension.
Employment is a fundamental factor in societies, to the extent that its lack can break consensus or the implicit social contract, according to historical evidence, so the unemployment rate (UER) is incorporated with a negative sign in the creation of the indicator for this dimension. The GIN is an index calculated from the Gini coefficient and measures social inequality.
It assumes a value equal to 0 for situations where there is a perfectly equitable income distribution (everyone has the same income) and assumes a value of 100 when in-come distribution is quite inequitable (one person has all the income and others none). This indicator is incorpo-rated into the Social Cohesion dimension with a negative sign, since a higher index value has a negative impact on cohesion.
Meanwhile, the price of the property as a percentage of income is linked negatively, since a greater percentage of income is needed to buy a property diminishes the incen-tives to belong to society in a particular city.
ECONOMY Indicators used to show the economic dimension of a ci-ty’s performance are: gross domestic product (GDP) in millions of dollars at constant 2013 prices; productivity, measured in dollars according to the labor force (LPR); the time required to start a business measured in days (TSB); ease in regulatory terms to start a business (EDB); the number of parent (headquarters) of listed companies (NHQ); and the rate of early-stage entrepreneurial activity (TEA), defined as the percentage of a population between 18 and 64 years old who are incipient entrepreneurs or business owner/administrators of new businesses (no more than 42 months).
Bearing in mind that the CIMI attempts to measure, through multiple dimensions, the future sustainability of the largest cities in the world and the standard of living of their inhabitants, real GDP is one measurement of the city’s economic power and the income of its inhabitants, which, in turn, is an important measurement of the quali-ty of life in cities. In numerous studies, GDP is considered
to be the only measurement or most important measu-rement of a city’s or country’s performance. However, in this report, it is not considered to be exclusive nor the most relevant factor; instead it is just one further indica-tor among 10 dimensions of the CIMI. For example, if a city with a high or relatively high GDP does not have a good performance level in other indicators, it may not be placed among the top ranks. A highly productive city, for instance, that has problems with transportation, inequali-ty, weak public finance or a production process that uses polluting technology, will probably not appear among the top positions in the ranking.
LPR is a measurement of the strength, efficiency and technological level of the production system, which, as regards local and international competitiveness, will ob-viously affect real salaries and the return on capital, busi-ness profits. These are all reasons why it is very important to include it within the dimension of the Economy. Varied productivity levels may explain differences in the stan-dard of living of a city’s workers and the sustainability of the productive system over time.
Other indicators selected as being representative of this dimension make it possible to measure certain aspects of a city’s business environment, such as the number of headquarters for publicly traded (NHQ) companies, ca-pacity and entrepreneurial opportunities for the inhabi-tants of a city (TEA), time required to start a business (TSB) and ease of starting a business in regulatory terms (EDB). These indicators measure the capacity for sustai-nability over time of a city and potential ability to improve the quality of life of its inhabitants. The TSB and EDB indicators are incorporated into the Economy dimension with a negative bearing, since lower values indicate grea-ter ease of starting a business, while the NHQ and ASD have a positive relation, since high values in these indica-tors reflect cities prepared for the creation and develop-ment of businesses.
PUBLIC MANAGEMENT Public Management is understood in this report to be highly correlated with a city’s or country’s state of public finance. In this sense, public accounts have a decisive effect on citizens’ standard of living and on the sustaina-bility of a city, insofar as it determines the level of present and future taxes which the people and system of produc-tion must pay; the expected increase in the general level of prices; potential public investment in basic social infras-tructure, and the incentives aimed at private investment. Moreover, if the State has a need for funds as a result of a weak public finance system, it will compete with the pri-vate sector for the funds available in the financial system, thereby affecting investment.

IESE Business School - IESE Cities in Motion Index10
The indicators that represent this dimension in this report are the tax ratio in relation to the commercial benefits (TAX), the level of central bank reserves (TR), the level of reserves per capita (TRPC), the type of government (TG), the local government scandals reported in the media (SC), the number of embassies (NE), and the number of Twitter users listed in prominent Twitter directories (NDTU).
The indicator related to the tax system (TAX), which is incor-porated with a negative bearing on the value of the synthe-tic indicator of this dimension, covers aspects of the status of public finances, since the greater the tax burden, the weaker a city’s public accounts become. The TAX measu-res the amount of taxes and mandatory contributions paid by businesses after accounting for allowable deductions and exemptions as a share of commercial profits. This ex-cludes withheld taxes (such as personal income tax) or tho-se collected and remitted to tax authorities (such as value added taxes, sales taxes or taxes on goods and services).
The level of reserves is an indicator of the strength in the short and medium term of public finances, their ability to cope with changing economic cycles, and the strength and sustainabi-lity of the economic structure in relation to the State.
The government type indicator (TG) differentiates between states with participatory governments and those that are not. Participatory governments promote the development of sustainable cities as they have a more transparent, effi-cient, close and participative management.
Local government scandals reported in the media (SC) re-fer to corruption, violence, crime, drugs, etc. A city with more scandalous situations is a city less prepared to carry out strategic plans for innovation and development. This indicator is incorporated with a positive bearing because cities with biggest scandals assume a value of 1 in a reser-ved scale that goes from 1 to 4.
The number of embassies (NE) is an indicator of the inter-national importance of the city to global standards and is based on the allocation of embassies that are made to the city by foreign countries.
The number of active Twitter users with public data con-tained in the Twellow (NDTU) directory are those who self-identified as opinion leaders (e.g., activists, prominent critics of the government, business leaders, writers, jour-nalists, etc). Twitter tends to be utilized by opinion leaders, so global directories provide a guide to the prominence of dissenting voices and ideas within cities. In some autho-ritarian countries, publishing points of view and opinions as a thought leader is taking a risk, therefore there will be fewer critical leaders in Twitter directories. This indicator has a positive bearing.
GOVERNANCEGovernance, a term commonly used to refer to the effec-tiveness, quality and proper orientation of State inter-vention, is represented by four indicators in this report: the Strength of Legal Rights Index (SLR), the Corruption Perceptions Index (CPI), the number of functions of the innovation department of the city (IDF) and the quality of web services of the local government (GWS). The SLR has been incorporated with a positive bearing and mea-sures the degree to which collateral and bankruptcy laws protect the rights of borrowers and lenders and thus fa-cilitate lending. The values range from 0 = low to 12 = high, where higher scores indicate that laws are better designed to expand access to credit. It is a vital role of national or local states to create conditions and ensure effective enforcement of the rights of citizens and compa-nies based in its territory. The perception of compliance with legal rights affects all aspects of life in a country or city, as well as the business environment, investment in-centives or legal certainty, among others.
The index of perceived government corruption is a way of measuring the quality of governance, since a high per-ception of corruption in public statements by the public is an indication that government intervention is not efficient from the standpoint of the social economy, due to the fact that utilities –understood in a broad sense– involve costs that would be higher than if corruption did not exist. In addition, incentives to invest or settle in countries or cities with a high perception of corruption will be lower than in others with low levels, thus negatively influencing the sustainability of the country or city. In the case of the CIMI, it is taken as an explanatory indicator of the governance dimension, with a positive bearing, following the manner of calculating the index by Transparency In-ternational, which assigns a value of 0 for countries with high corruption and 100 for highly transparent countries.
The department of innovation represents a central point of any government policy. The number of functions of this department is an indicator of governmental support of these policies. Therefore, IDF has a positive influence, as departments that have a greater number of functions show greater support for innovation.
The quality of government web services is an evaluation of a government’s capacity to respond to the technologi-cal functions of a city, and the needs of its citizens and visitors (i.e., users of a city). No city can afford to ignore a commitment with users in their city, and every city should have an optimal presence on the internet This indicator has a positive bearing, since higher values relate to hi-gher quality of web services.

IESE Business School - IESE Cities in Motion Index11
ENVIRONMENTThe sustainable development of a city can be defined as “development that meets the needs of the present wi-thout compromising the ability of future generations to meet their own needs.”1. In this sense, the environment is very important because current sustainability to meet the needs of future generations is closely related to this dimension. Since the CIMI also aims to measure the en-vironmental sustainability of cities, the environment is in-cluded as one of the aspects to be measured.
The indicators selected for this dimension are CO2 emis-sions (CO2), the rate of CO2 (CO2i), methane emissions (MET), improvements in water supply as a percentage of total population with access to this (H2O); the PM2.5 and PM10, and the pollution index (PI) and the environmen-tal development index (EPI).
As can be inferred, the first four selected indicators in-clude measurements of air pollution sources and water quality in cities, which are indicators of the quality of life of their inhabitants; and the sustainability of their produc-tion or urban matrix. Emissions of carbon dioxide arise from burning fossil fuels and cement production, while methane emissions arise from human activities such as agriculture and industrial production. CO2 and methane emissions are the factors most commonly used to mea-sure the degree of air pollution, since they are substan-ces that have much to do with the greenhouse effect. In fact, a decrease in the values of these indicators is included as a target in the Kyoto Protocol.
Another important indicator of air pollution in cities are PM2.5 and PM10, a denomination corresponding to small particles, solid or liquid, dust, ash, soot, metal particles, cement or pollen dispersed in the atmosphere and whose diameter is less than 2.5 and 10 micrometers (microns) respectively. These particles are formed mainly by inorganic compounds such as silicates and alumina-tes, heavy metals and organic material associated with carbon particles (soot). This indicator is commonly used in the indexes to measure pollution in the environment. These indicators are supplemented with information pro-vided by the pollution or contamination index (PI) of a city, which estimates the overall pollution in the city. The greatest weight is given to cities with more air pollution.
Last of all, the EPI (Environmental Performance Index), calculated by Yale University, is an indicator based on the two large dimensions related with the environment: Environmental Health and Ecosystem Vitality. The first is divided into three sub-dimensions: effects of air pollu-tion on human health; effects of water quality on human
1 Defi nition used in 1987 by the UN World Commission on Environment and Development, created in 1983.
health, and environmental load of diseases. Ecosystem Vitality has seven sub-dimensions: effects of air pollution on the ecosystem; effects of water quality on the ecosys-tem; biodiversity and habitat; forestation; fish; agricultu-re, and climate change. Given the thorough nature of this indicator –because it includes nearly all of the aspects involving the measurement of a city’s environmental sta-tus and changes in a city’s environment, complemented by the other four indicators which are included in the CIMI– the dimension of The Environment is considered to have been represented in a well-proportioned manner.
Indicators which represent PM10 and PM.2, CO2 and methane emissions the pollution index are considered to have a negative bearing on the dimension, whereas the remaining indicators have a positive effect on the envi-ronment.
MOBILITY AND TRANSPORTATION Mobility and Transportation, in terms of both the highway and road infrastructure and the automobile fleet and pu-blic transportation, affect the standard of living of a city’s inhabitants and may be vital to the sustainability of cities across time. However, perhaps the most important is not this, but rather the externalities that are produced in the productive system, due both to the labor force’s need to commute and the need for production output. Conse-quently, considered as representative of this dimension were the traffic index (TI), the index of inefficiency (INI-DX), the number of road accidents per 100,000 inhabi-tants (RIA), the number of subway stations per 100,000 (NS) and the number of air routes (inputs and outputs) a city has (NF).
The first three indicators are a measure of the efficiency and safety of roads and public transportation which, if effective and has good infrastructure, promotes a decrea-se in vehicular traffic on the roads and reduces the num-ber of accidents. The IT and INIDX are estimates of the inefficiencies in traffic caused by long driving times, as well as by dissatisfaction that these situations generate in the population. These indicators, as well as the number of road accidents, are included with a negative bearing since they have a negative impact on the development of a sustainable city.
The number of subway stations per 100,000 inhabitants (NS) is an indicator of commitment to the development of the city and investment relative to population size. The number of air routes (inputs and outputs) a city has (NF) represents the infrastructure in place to facilitate com-mercial air routes and therefore, movement and pass-enger traffic. Both indicators are included with a positive bearing due to the positive influence they have on this dimension.

IESE Business School - IESE Cities in Motion Index12
URBAN PLANNINGA city’s urban planning involves various sub-dimensions and is closely related with a city’s sustainability. Deficient urban planning leads to a decrease in people’s standard of living in the medium term. It also has a negative effect on investment incentives, because a city which is not planned or is poorly planned creates difficulties and in-creases the costs of logistics and employee transporta-tion, while affecting other factors.
Based on available information, indicators of this dimen-sion are incorporated as measures of the quality of health infrastructure (ISF), the number of people in a household (OCC), the bicycle circulation system (BL) of a city, the number of bike shops per 100,000 inhabitants (NBS) and the number of architects per 100,000 inhabitants (NA).
The quality of health infrastructure (ISF) refers to the percentage of population with at least adequate access to excretion disposal facilities that can effectively prevent human, animal and insect contact with excretion. To be effective, facilities must be correctly built and undergo proper maintenance. This indicator is highly correlated with Urban Planning, as it can demonstrate what inevi-tably becomes poor planning in health problems in the short and medium term.
Additionally, from the point of urban-dwelling view, a city with proper urban planning has generally little or no over-crowding in homes, since usually housing policy in rela-tion to the estimated growth of the population urban is a determining factor in urban planning. Therefore, within the explanatory indicators of this dimension, the number of occupants per household (OCC) was related negatively.
The bicycle is a means of effective, fast, cheap, healthy and environmentally-friendly transportation. The use of this transportation makes a positive impact on the sustai-nable development of a city, since it does not pollute or make use of fuels, among other benefits. Considering this positive effect, two indicators associated with this means of mobility are introduced here. The presence of infras-tructure dedicated to bicycle traffic (BL) paths indicates a city’s commitment to the culture using this medium. This indicator measures the extent and quality of bike lanes in a city. It has a positive bearing, because cities with highest value are those with more developed bike path systems. Also, the number of bike shops per 100,000 inhabitants (NBS) is a positive indicator of the actual use of bicycles (through equipment sales and repairs). This has a positive bearing.
Another indicator considered is the number of architec-tural firms (small, medium and large) that are dedicated
to carrying out projects within a city, per 100,000 inhabi-tants (NA). Engineers, architects and planners are key to the urban transformation of a city, therefore this indicator has a positive impact on the index calculation.
INTERNATIONAL OUTREACH Cities within the same country can have more or less In-ternational Outreach in relation to each other, but this is not independent of the degree of its own openness. This dimension is intended to include these differences and measure the International Outreach of cities.
In this sense, we have included the following indicators: international tourist arrivals (ITA); number of passengers by airlines (AEP), number of hotels in a city (NH), ranking of those most photographed in the world, according Si-ghtsMap (SM) and the number of meetings and conferen-ces taking place in a city (MIT), according to data from the Meeting the International Congress and Convention Asso-ciation. The latter is an important indicator of the Interna-tional Outreach of a city, given that these events usually take place in cities with international hotels, rooms spe-cially equipped for such purposes, positive frequency of international flights, and appropriate security measures.
All indicators of this dimension, with the exception of SM, have a positive impact on the calculation of the CIMI since the higher the values of the indicators, the greater the city’s outreach in the world. SM is introduced with a negative bearing, since the top-ranking positions corres-pond to the most photographed cities.
TECHNOLOGYTechnology, as an integral dimension of CIM, is an aspect of society which improves the current standard of living, and its level of development or widespread usage is an indicator of a society’s achieved or potential quality of life. Moreover, technological development is a dimension that allows cities to be sustainable across time, and to maintain or expand the competitive advantages of their production system and the quality of employment. A city that is technologically outdated has comparative disad-vantages with other cities, both from the perspective of safety, education and health, which are fundamental as-pects in society’s sustainability, and from the perspective of the productive system, which as a result ends up with outmoded production tasks that make it difficult to achie-ve competitiveness without protectionism, a factor which has a negative effect on the city’s ability to consume and invest, as well as reducing productivity in the workplace.
Indicators selected to measure the performance of cities in terms of technological reach and growth in cities are: the number of broadband Internet users per 100 inhabi-tants (FIS) - country-level data on the number of broad-

IESE Business School - IESE Cities in Motion Index13
band users within a city (BIU), the number of IP addres-ses assigned to the city (NIAR), the number companies that offer wifi hotspots (NBW), the number of Facebook users per 1,000 inhabitants, (NF) the number of mobile phones per capita (NMPC), the quality of the websites of municipalities (QMW) and the Innovation Index (ICI), published by the Innovation Cities Program.
The first indicator (FIS) is country-level data and has a high correlation with the overall technological advance-ment of a city, since technological development of appli-cations and devices is necessary for its efficient use. Complementing the FIS, the citywide indicator, BIU, which represents the number of broadband users wi-thin a city as a measure of technological development is employed. The BIU includes wired and wireless connec-tions. The number of IP addresses assigned to the city (NIAR) is a commercial indicator of Internet adoption by citizens. Businesses and citizens equipped for Internet create economic value in the economy through the use of devices and therefore the allocation of IP addresses. The number companies that offer wifi hotspots (NBW) indica-tes the number of quality business wifi hotspots listed in major global directories. The number of Facebook (NF) users per 1,000 inhabitants measures the penetration of Facebook (or in the case of China, Ren Ren) within the city, based on real data from Facebook. Facebook is the network of social media par excellence, and conti-
nues with high penetration rates in many global markets. Facebook data for 2014 are provided by Facebook. For years prior to 2014, algorithmic estimates were used. This indicator is incorporated with a positive bearing. The number of mobile phones per capita (NMPC) is obtained through national data, population data and demographic information. This indicator has a positive influence, since the higher the use of mobile telephony, the more open a society is to the use of technology. The quality of a mu-nicipality’s website (QMW) is an indicator reflecting the government’s commitment to Information Technology policies. If a local government wants to promote the de-velopment of technologies of information and communi-cation (ICT) in the local business sector, it is necessary that its own websites offer good quality services, showing support for strategies in this crucial sector. The ICI index is calculated by making evaluations based on various te-chnological innovation factors in cities, in sectors such as health, general economy or of the population, among others, currently reflecting the most comprehensive indi-cator to measure the degree of innovation development in cities. This is methodologically divided into three as-pects or dimensions: cultural, human infrastructure and networked markets. All indicators of this dimension di-rectly relate to the technological dimension and therefore have a positive bearing.
Table 1 describes, in summary, the indicators used in each of the dimensions, description, units of measure and sources of information.
NO. INDICATOR INITIALS DESCRIPTION / UNIT OF MEASUREDIMENSION /
CLUSTERSOURCE
1Population with secondary and high education
PSHProportion of population with secondary and higher education
Human Capital Euromonitor
2 FT Global MBA Ranking MBAR Number of business schools (TOP 100) Human Capital Financial Times
3International flows of mobile students at the tertiary level
IFSInternational movement of higher education students. Number of students.
Human Capital UNESCO
4 QS World University Ranking 2013 WUR Number of universities Human Capital QS Top Universities
5No. of Museums per 100,000 inhabitants
NMNumber of museums per100,000 inhabitants
Human Capital 2thinknow
6No. of Public Art Galleries per 100,000 inhabitants
NAGNumber of art galleries per100,000 inhabitants
Human Capital 2thinknow
7Consumer Expenditure on Leisure and Recreation per capita
CERSpending on leisure and recreation. Expressed in Millions of USD 2013 prices.
Human Capital / Country Cluster
Euromonitor
8 Death Rate DRRatio of deaths per100,000 population
Social Cohesion Euromonitor
TABLE 1. INDICATORS

IESE Business School - IESE Cities in Motion Index14
NO. INDICATOR INITIALS DESCRIPTION / UNIT OF MEASUREDIMENSION /
CLUSTERSOURCE
9 Crime Index CI Crime rate Social Cohesion Numbeo
10 Health Care Index HCI Health index Social Cohesion Numbeo
11 Unemployment Rate UERUnemployment rate (number unemployed / labor force)
Social Cohesion Euromonitor
12 Gini Index GINGini index, varies from 0-100, with 0 being perfect equality and 100 perfect inequality
Social Cohesion Euromonitor
13 Property prices to income ratio PPIRPrice of property as a percentage of income
Social Cohesion Numbeo
14 Total GDP GDP GDP in million USD at 2013 prices Economy Euromonitor
15 Labour Productivity LPRLabor productivity measured as GDP / employed population (in thousands)
Economy Euromonitor
16 Time Required to Start a Business TSBNumber of calendar days required to make legally operable a business
Economy World Bank
17 Ease of Doing Business Rank EDB
Ease of starting a business. Top positions in the rankings indicate a more favorable regulatory environment for the establishment and operation of a local business.
Economy World Bank
18Global Command and Control
CentresNHQ
Number of parent (headquarters) of publicly traded companies
EconomyGlobalization and World Cities (GaWC)
19Total Early Stage Entrepreneurial
ActivityTEA
Percentage of population aged 18-64 who is an incipient entrepreneur or owner / operator of a new business
EconomyGlobal Entrepreneurship Monitor
20Total tax rate (% of commercial
profits)TAX
Total tax rate. Measures the amount of taxes and mandatory contributions paid by businesses after accounting for allowable deductions and exemptions as a share of commercial profits.
Public Management
World Bank
21 Total reserves TR Total reserves in millions of USDPublic Management
World Bank
22 Total reserves per cápita TRPC Per capita reserves in millions of USDPublic Management
World Bank
23 Type of Government TGGovernment type. Binary variable where 1 corresponds to systems of participatory government.
Public Management
2thinknow
24 Severity of Local Reported Scandals SC
Local government scandals reported in the media. Rating assigned to 1-4 according to the gravity of scandal (murder, violence, drugs / crime, corruption), where extreme situations of scandal assume a value of 1 in a reserved scale that goes from 1 to 4.
Public Management
2thinknow
25No. of Embassies per
100,000 People NE Number of embassies per 100,000 people
Public Management
2thinknow

IESE Business School - IESE Cities in Motion Index15
NO. INDICATOR INITIALS DESCRIPTION / UNIT OF MEASUREDIMENSION /
CLUSTERSOURCE
26 No of Directoried Twitter Users NDTU
Twitter users listed in prominent Twitter directories (e.g. Twellow). Includes users who define themselves as leaders (e.g., writers, activists, business leaders, journalists, etc.) users. In thousands of persons.
Public Management
2thinknow
27 Strength of Legal Rights Index SLR
The index of strength of legal rights measures the degree to which collateral and bankruptcy laws protect the rights of borrowers and lenders and thus facilitate lending. The values range from 0 = low to 12 = high, where higher scores indicate that laws are better designed to expand access to credit.
Governance World Bank
28 Corruption Perceptions Index CPIIndex of perception of corruption. The values range from 0 = very corrupt to 100 = very transparent
GovernanceTransparency International
29 Innovation Department Functions IDFNumber of functions of the innovation department (or ministry, if any) of the city
Governance 2thinknow
30 Govt Web Service Assess GWS
Websites of local government services. Measures the quality of web services for all users of the municipality (residents and visitors). Scale of 1 to 4.
Governance 2thinknow
31 CO2 Emissions CO2Emissions of carbon dioxide from burning fossil fuels and cement manufacturing. Measured in kilotons (kt).
Environment World Bank
32 CO2 Emission Index CO2I CO2 emission rate Environment Numbeo
33 Methane emissions MET
Methane emissions arising from human activities such as agriculture and industrial production of methane. Measured in kt CO2 equivalent
Environment World Bank
34Improved water source, urban (% of
urban population with access)H2O
Percentage of the population with reasonable access to an adequate amount of water coming from an improvement in the water supply.
Environment World Bank
35PM2.5 Annual Mean-micrograms
per cubic meterPM25
PM2.5 measures the amount of airborne particles whose diameter is less than 2.5μm. Annual average.
EnvironmentWorld Health Organization
36PM10 Annual Mean-micrograms per
cubic meterPM10
PM10 measures the amount of airborne particles whose diameter is less than 10 microns. Annual average.
EnvironmentWorld Health Organization
37 Pollution Index 2014 PI Pollution Index Environment Numbeo
38 Environmental Performance Index EPIEnvironmental performance index (1 = poor to 100 = good)
Environment Yale University
39 Traffic Index TI
Traffic rate estimation is based on time spent in traffic and generated dissatisfaction. Estimates of consumption of CO2 and other traffic system inefficiencies are also included.
Mobility and Transportation
Numbeo

IESE Business School - IESE Cities in Motion Index16
NO. INDICATOR INITIALS DESCRIPTION / UNIT OF MEASUREDIMENSION /
CLUSTERSOURCE
40 Inefficiency Index INIDX
Inefficiency index is an estimate of traffic inefficiencies. High values represent high inefficiencies in driving, such as long travel times.
Mobility and Transportation
Numbeo
41 Road Injury Accidents RIANumber of road accidents per 100,000 population
Mobility and Transportation
Euromonitor
42 No. of Subway/Metro Stations NSNumber of metro stations per100,000 population
Mobility and Transportation
2thinknow
43 No. of Flights In/Out 2012 NFNumber of flights in and out (air routes) in a city
Mobility and Transportation
2thinknow
44Improved sanitation facilities
(% of population with access)ISF
Percentage of population with at least adequate access to excretion disposal facilities that can effectively prevent human, animal and insect contact with excretion.
Urban Planning World Bank
45 Occupants per Household OCH Number of people per household Urban Planning Euromonitor
46 Bicycle Lanes BL
Bicycle circulation system. Coding of 1 to 4, where the highest value corresponds to cities that have a well-developed bicycle circulation system.
Urban Planning 2thinknow
47No. of Bicycle Shops per
100,000 inhabitants NBS Bike shops per 100,000 inhabitants Urban Planning 2thinknow
48No. of Architect Firms per
100,000 inhabitants NA
Number of architects per 100,000 inhabitants
Urban Planning 2thinknow
49 International Tourist Arrivals ITANumber of international tourists that visit the city. In thousands.
International Outreach
Euromonitor
50 Airline Passengers AEPNumber of airline passengers. In thousands
International Outreach
Euromonitor
51 No. of Hotels per 100,000 NHNumber of hotels per100,000 inhabitants
International Outreach
2thinknow
52 Sightsmap SM
Ranking of cities according to the number of photos taken in the city and uploaded to Panoramio (online community to share photographs). The first positions correspond to cities with more pictures.
International Outreach
Sightsmap
53 Numbers of Meetings MITNumber of international conferences and meetings held in a city.
International Outreach
International Meeting Congress and Convention Association
54Fixed broadband Internet
SubscribersFIS
Number of subscribers per country to a broadband digital subscriber line, modem cable modem or other high-speed technology, per 100 inhabitants.
Technology World Bank
61 Broadband Internet Users BIUNumber of broadband users within a city, including wired and wireless connections.
Technology 2thinknow

IESE Business School - IESE Cities in Motion Index17
NO. INDICATOR INITIALS DESCRIPTION / UNIT OF MEASUREDIMENSION /
CLUSTERSOURCE
59 No. of Internet Addresses Registered NIARNumber of IP addresses assigned to the city
Technology 2thinknow
56No. of Business Grade WIFI
HotspotsNBW
Number companies offering wifi hotspots. Change of data source from 2012 to 2014.
Technology 2thinknow
57 No. of Facebook Users NFNumber of Facebook users per1,000 inhabitants
Technology 2thinknow
58 Mobile numbers per cápita NMPC Number of mobile phones per capita Technology 2thinknow
60 Quality of Municipality Websites QMWQuality of municipality websites. Scale of 0-5, the maximum corresponding to the web with better quality services.
Technology 2thinknow
55 Innovation Cities Index ICI Innovation Index. Rating 0 = no innovation to 60 = much innovation.
TechnologyInnovation Cities Program
62 Population POP Number of inhabitants City/Country Euromonitor
63Average Household Annual
Disposable Income by Decile (Decil 1)DE1
Income (annual average). Decile 1. Expressed in USD.
City Cluster Euromonitor
64Average Household Annual
Disposable Income by Decile (Decil 2)DE5
Income (annual average). Decile 2. Expressed in USD.
City Cluster Euromonitor
65Average Household Annual
Disposable Income by Decile (Decil 5)DE7
Income (annual average). 5. decile Expressed in USD.
City Cluster Euromonitor
66Average Household Annual
Disposable Income by Decile (Decil 7)DE9
Income (annual average). Decile 7. Expressed in USD.
City Cluster Euromonitor
67Average Household Annual
Disposable Income by Decile (Decil 9)ER
Income (annual average). Decile 9. Expressed in USD.
City Cluster Euromonitor
68 Employment Rate CEE Percentage of employed population. Country Cluster Euromonitor
69Consumer Expenditure on Education
per capitaCEHC
Education spending per capita. Expressed in Millions of USD 2013 prices.
Country Cluster Euromonitor
70
Consumer Expenditure on Health
Goods and Medical Services per
capita
Medical and health expenditures per capita services. Expressed in Millions of USD 2013 prices.
Country Cluster Euromonitor
71Consumer Expenditure on Hotels
and CateringCEH
Expenses in hospitality and catering services per capita. Expressed in Millions of USD 2013 prices.
Country Cluster Euromonitor
72Consumer Expenditure on Housing
per capitaCEH
Housing expenditure per capita. Expressed in Millions of USD 2013 prices.
Country Cluster Euromonitor

IESE Business School - IESE Cities in Motion Index18
INDICATOR LIMITATIONS
Perhaps the most important limitation in calculating the CIMI relates to availability of data. However, several ac-tions were implemented to minimize the impact of this limitation. First, for indicators that did not have availa-ble data for the analysis period, extrapolation techniques were used. For situations in which the values of the indi-cator at the citywide level were inexistent, but had valid values on a relevant countrywide level, individual values were assigned to each one, relating the indicator on an average country level with another variable theoretically linked on a city level. Lastly, there were cases in which indicator values were nonexistent for a specific city or group of cities for the period considered. In these cases, statistical clustering techniques were used. The scope and detail of these tools are explained in the complemen-tary document, “Methodology and Modeling” for 2014.
At the IESE Cities in Motion platform, we continue wor-king for more complete and accurate indicators, while we ask that cities facilitate access to the information ge-nerated.
GEOGRAPHIC COVERAGE
To calculate the CIMI, 148 cities were analyzed, 13 of which were added to the group last year. These new cities were selected based on their population size and econo-mic, cultural, political importance to the country to which they belong. Therefore, 148 cities were included in this study with the geographical distribution shown in Table 2.

IESE Business School - IESE Cities in Motion Index19
TABLE 2 . GEOGRAPHIC DISTRIBUTIN
Afric
aAs
iaW
este
rn E
urop
eN
orth
Am
eric
a
Alex
andr
ia -
Egyp
tBe
ijing
-Ch
ina
Berli
n-G
erm
any
Amst
erda
m-T
he N
ethe
rland
sM
ontr
eal -
Cana
daCa
iro -
Egyp
tGu
angz
hou
-Chi
naCo
loni
a -G
erm
any
Eind
hove
n-T
he N
ethe
rland
sO
ttaw
a -C
anad
aCa
pe T
own
-Sou
th A
fric
aCh
ongq
ing
-Chi
naDu
isbur
g-G
erm
any
Lisb
on-P
ortu
gal
Toro
nto
-Can
ada
Durb
an-S
outh
Afr
ica
Harb
in -
Chin
aFr
ankf
urt -
Germ
any
Port
o -P
ortu
gal
Vanc
ouve
r -Ca
nada
Joha
nnes
burg
-So
uth
Afric
aSh
angh
ai-C
hina
Ham
burg
-Ger
man
yBi
rmin
gham
-U
nite
d Ki
ngdo
mBo
ston
-U
SA
Pret
oria
-So
uth
Afric
aSh
enya
ng -
Chin
aM
unic
h-G
erm
any
Glas
gow
-U
nite
d Ki
ngdo
mCh
icag
o -U
SALa
tinAm
eric
aSh
enzh
en-C
hina
Stut
tgar
t -Ge
rman
yLe
eds -
Uni
ted
King
dom
Dalla
s-U
SABu
enos
Aire
s -Ar
gent
ina
Suzh
ou-C
hina
Linz
-Au
stria
Live
rpoo
l -U
nite
d Ki
ngdo
mPh
oeni
x -U
SACo
rdob
a-A
rgen
tina
Tian
jin -
Chin
aVi
enna
-Aus
tria
Lond
on -
Uni
ted
King
dom
Phila
delp
hia
-USA
Rosa
rio -
Arge
ntin
aW
uhan
-Ch
ina
Brus
sels
-Bel
gium
Man
ches
ter -
Uni
ted
King
dom
Hous
ton
-USA
La P
az -
Boliv
iaHo
ng K
ong
-Chi
naCo
penh
agen
-Den
mar
kN
ottin
gham
-Uni
ted
King
dom
Los A
ngel
es -
USA
Belo
Hor
izont
e -B
razil
Busa
n-S
outh
Kor
eaA
Coru
ña -
Spai
nSt
ockh
olm
-Sw
eden
Mia
mi -
USA
Bras
ilia
-Bra
zilDa
egu
-Sou
th K
orea
Barc
elon
a -S
pain
Goth
enbu
rg -
Swed
enN
ew Y
ork
-USA
Curit
iba
-Bra
zilDa
ejeo
n-S
outh
Kor
eaBi
lbao
-Sp
ain
Base
l -Sw
itzer
land
San
Fran
cisc
o -U
SA
Fort
alez
a -B
razil
Seou
l-So
uth
Kore
aM
adrid
-Sp
ain
Gene
va -
Switz
erla
ndW
ashi
ngto
n -U
SA
Port
o Al
egre
-Br
azil
Man
ila -
Phili
ppin
esM
alag
a-S
pain
Zuric
h -S
wite
rland
Oce
ania
Reci
fe -
Braz
ilBa
ngal
ore
-Ind
iaSe
villa
-Sp
ain
East
ern
Euro
peM
elbo
urne
-Au
stra
liaRi
o de
Jane
iro -
Braz
ilM
umba
i-In
dia
Vale
ncia
-Sp
ain
Sara
jevo
-Bo
snia
-Her
zego
vina
Sydn
ey-A
ustr
alia
Salv
ador
-Br
azil
Calc
utta
-Ind
iaHe
lsink
i -Fi
nlan
dSo
fia-B
ulga
riaAu
ckla
nd -
New
Zea
land
São
Paul
o -B
razil
Delh
i -In
dia
Lille
-Fr
ance
Prag
ue -
Czec
h Re
publ
icM
iddl
eEa
st
Sant
iago
-Ch
ileJa
kart
a-I
ndon
esia
Lyon
-Fr
ance
Buda
pest
-Hu
ngar
yHa
ifa -
Isra
elBo
gota
-Col
ombi
aO
saka
-Ja
pan
Mar
seill
e-F
ranc
eRi
ga -
Latv
iaJe
rusa
lem
-Isr
ael
Cali
-Col
ombi
aTo
kyo
-Jap
anN
ice
-Fra
nce
Wro
claw
-Po
land
Te
l Avi
v -I
srae
lM
edel
lin-C
olom
bia
Kual
a Lu
mpu
r -M
alay
siaPa
ris -
Fran
ceW
arsa
w -
Pola
ndDo
ha -
Qat
arQ
uito
-Ec
uado
rM
osco
w-R
ussia
Athe
ns -
Gree
ceLj
ublja
na -
Slov
enia
Riya
dh -
Saud
i Ara
bia
Sant
o Do
min
go -
Dom
inic
anRe
publ
icSt
. Pet
ersb
urg
-Rus
siaDu
blin
-Ire
land
Anka
ra -
Turk
eyJe
ddah
-Sa
udi A
rabi
aGu
adal
ajar
a -M
exic
oSi
ngap
ore
-Sin
gapo
reFl
oren
ce -
Italy
Burs
a -T
urke
yAb
u Dh
abi -
Uni
ted
Arab
Em
irate
sM
exic
o, D
.F. -
Mex
ico
Kaoh
siung
-Ta
iwan
Mila
n-I
taly
Istan
bul -
Turk
eyDu
bai -
Uni
ted
Arab
Em
irate
sM
onte
rrey
-M
exic
oTa
ichu
ng-T
aiw
anN
aple
s-Ita
lyLi
ma
-Per
uTa
inan
-Tai
wan
Rom
e -I
taly
Mon
tevi
deo
-Uru
guay
Taip
ei-T
aiw
anTu
rin-I
taly
Cara
cas -
Vene
zuel
aBa
ngko
k -T
haila
ndO
slo -
Nor
uega

IESE Business School - IESE Cities in Motion Index20
CITIES IN MOTION. RANKING
The CIMI, which is the indicator that is the subject of this report, is a synthetic indicator and, as such, is a function of the available partial indicators.
The model on which the process for creating the syn-thetic indicator is based is a weighted aggregation of partial indicators that represent each of the 10 dimen-sions which make up the theoretical CIMI model. The dimensions selected to describe the reality of the cities in terms of their sustainability and the standard of living of their inhabitants, in the present and in the future, are as follows: Governance, Urban Planning, Public Mana-gement, Technology, The Environment, International Outreach, Social Cohesion, Mobility and Transportation, Human Capital, and The Economy.
The partial indicators which represent each dimension can also be categorized as synthetic indicators, which are defined as “weighted aggregations of each of the se-lected indicators that represent different factors of each dimension.”
For the calculation of the CIMI, the DP2 technique was used because it is the most used worldwide and the most convenient, given the type of indicator to calculate and available data. Its methodology is based on distances – that is, the difference between a given indicator value and another value taken as a reference or objective. Also, this technique attempts to correct the dependency be-tween the partial indicators that artificially increase the sensitivity of the indicator to variations in certain partial value. The correction consists of applying the same factor for each partial indicator, assuming a linear dependence function2.
2 As linear estimates, variables that have a normal distribution are requi-red, so in some variables log transformation was applied to obtain normality. “Outlier” techniques were also applied to avoid bias and overestimation of coeffi cients.
Given the partial indicators, factors are derived from the complement of the coefficient of determination (R2) of each indicator as compared to the rest of the partial indi-cators. The order in which indicators for each dimension were included, as well as their relative weight in the CIMI are the following: Economy: 1; Human Capital: 0.4887; International Outreach: 0.7327; Mobility and Transport: 0.6308; Environment: 0.7442; Technology: 0.4772; Ur-banism: 0.4187; Public Management: 0.4955; Gover-nance: 0.6925 and Social Cohesion: 0.7388.
While the order in which each synthetic index of each dimension is incorporated influences the value of the CIMI, sensitivity studies conducted conclude that there are no significant variations in it. For more information on the methodology applied, you can see the supplementary document, “Methodology and Modeling”, which was pu-blished last year.
Table 3 shows the CIM ranking of cities, with the index value and a cluster of cities according to their perfor-mance, measured by the value of the synthetic indicator. Cities with a “High” (A) performance were considered those with an index greater than 90; “Relatively high” (RA) performance, between 60 and 90; “Medium” (M), between 45 and 60 and “Low” (B) below 45.

IESE Business School - IESE Cities in Motion Index21
TABLE 3 . CITIES RANKING
Ranking City Performance ICIM Ranking City Performance ICIM1 London-UK A 100.00 62 RA 66.272 New York-USA A 92.24 63 RA 65.853 Seoul-South Korea RA 88.47 64 RA 65.134 Paris-France RA 87.69 65 RA 63.865 Amsterdam-Netherlands RA 85.05 66 RA 63.776 Vienna-Austria RA 84.78 67 RA 63.617 Tokyo-Japan RA 84.15 68 RA 63.158 Geneva-Switzerland RA 83.85 69 RA 62.449 Singapore-Asia Pacific RA 83.37 70 RA 62.14
10 Munich-Germany RA 83.21 71 RA 62.0411 Boston-USA RA 81.67 72 RA 61.9512 Zurich-Switzerland RA 81.43 73 RA 61.7613 Helsinki-Finland RA 80.99 74 RA 61.7514 Oslo-Norway RA 80.64 75 RA 61.7515 Copenhagen-Denmark RA 80.48 76 RA 61.0816 Melbourne-Australia RA 80.44 77 RA 60.6717 Hong Kong, China-Asia Pacific RA 80.40 78 RA 60.5718 Chicago-USA RA 80.24 79 RA 60.5619 Washington-USA RA 79.24 80 RA 60.4920 Liverpool-UK RA 79.23 81 RA 60.1621 San Francisco-USA RA 79.03 82 M 60.0022 Dublin-Ireland RA 78.92 83 M 59.8023 Birmingham-UK RA 78.36 84 M 59.5524 Stockholm-Sweden RA 78.12 85 M 59.5525 Berlin-Germany RA 78.06 86 M 59.4526 Glasgow-UK RA 78.02 87 M 59.1327 Sydney-Australia RA 77.69 88 M 58.8428 Frankfurt-Germany RA 75.54 89 M 58.1829 Basel-Switzerland RA 75.50 90 M 57.6930 Dubai-United Arab Emirates RA 75.30 91 M 57.5131 Manchester-UK RA 74.85 92 M 57.5132 Tel Aviv-Israel RA 74.65 93 M 57.1633 Brussels-Belgium RA 74.59 94 M 56.4734 Barcelona-Spain RA 73.74 95 M 55.8935 Madrid-Spain RA 73.73 96 M 55.1136 Toronto-Canada RA 73.36 97 M 55.0337 Hamburg-Germany RA 73.24 98 M 54.6738 Auckland-New Zealand RA 73.24 99 M 54.5539 Lyon-France RA 73.23 100 M 54.1640 Nottingham-UK RA 73.06 101 M 52.9141 Dallas-United States RA 72.78 102 M 52.5042 Los Angeles-USA RA 72.29 103 M 52.1343 Houston-USA RA 72.28 104 M 51.9244 Linz-Austria RA 72.07 105 M 51.9145 Leeds-UK RA 71.72 106 M 51.8846 Osaka-Japan RA 71.69 107 M 51.7347 Eindhoven-Netherlands RA 71.32 108 M 51.5748 Stuttgart-Germany RA 70.99 109 M 51.1249 Ottawa-Canada RA 70.88 110 M 50.6750 Lille-France RA 70.39 111 M 50.3951 Cologne-Germany RA 69.39 112 M 50.3952 Montreal-Canada RA 69.27 113 M 50.1953 Vancouver-Canada RA 68.72 114 M 49.7854 Gothenburg-Sweden RA 68.53 115 M 49.3555 Abu Dhabi-Arab Emirates RA 68.41 116 M 49.2956 Prague-Czech Republic RA 68.24 117 M 49.1157 Haifa-Israel RA 68.20 118 M 48.5558 Jerusalem-Israel RA 67.79 119 M 48.2459 Philadelphia-USA RA 67.67 120 M 48.0960 Marseille-France RA 67.62 121 M 47.6661 Duisburg-Germany RA 67.24 122
Lisbon-PortugalFlorence-ItalyPhoenix-USA
Budapest-HungaryNice-France
Busan South KoreaRome-Italy
Daegu South-KoreaMiami-USAMilan-Italy
Warsaw-PolandValencia-SpainTaipei-Taiwan
A Coruña-SpainBilbao-SpainRiga-LatviaTurin-Italy
Seville-SpainMalaga-Spainorto-Portugal
Istanbul-TurkeyShanghai-China
Bangkok-ThailandSofia-BulgariaSantiago-Chile
Ljubljana-SloveniaKuala Lumpur-MalaysiaDaejeon South-Korea
Moscow-RussiaBuenos Aires-Argentina
Athens-GreeceMonterrey-MexicoWroclaw-Poland
Mexico, DF-MexicoNaples-Italy
Bogotá-ColombiaBursa-TurkeyBeijing-ChinaDoha-Qatar
Taichung-TaiwanSão Paulo-Brasil
Lima-PeruGuangzhou-China
Riyadh-Saudi ArabiaCordoba-ArgentinaMedellin-Colombia
Ankara-TurkeyMontevideo-Uruguay
Cali-ColombiaCuritiba-BrazilBrasilia-Brazil
Guadalajara-MexicoRosario-Argentina
Saint-Petersburg-RussiaJeddah-Saudi Arabia
Cape Town-South AfricaShenzhen-China
Kaohsiung-TaiwanSarajevo Bosnia and Herzegovina
Quito-EcuadorTainan-Taiwan M 46.81

IESE Business School - IESE Cities in Motion Index22
In 2014, it can be seen that 54.7% of cities (81) reflect a performance of A or RA, according to this ranking, led by London and New York. There are 42 cities with a per-formance of M (28.4%), while B performances comprise 16.9% of the selected cities. No city appears with a MB grade. Among the top 25 cities, 15 are European; five are in the US; four are in Asia and one is in Oceania.
CITIES IN MOTION: RANKING BY DIMENSION
This section includes a ranking of cities using the di-mensions mentioned in the index, including the overall position of the city and its ranking along each individual dimension. To offer a more intuitive and visual reading, the ranking uses dark green to represent the most highly ranked, dark red to denote the least favorably ranked, and yellow tones to indicate intermediary rankings.
An interesting case is that of New York (United States), which ranks second in the overall ranking thanks to its performance in the dimensions of Economy (first place), Technology (second place), Public Sector Management (third place) and Human Capital (fourth place), despite ranking 103rd in Social Cohesion and 111th in Environment.
Another noteworthy case is Dubai (United Arab Emira-tes), which, despite occupying third place worldwide in the Social Cohesion dimension, ranks 30th in the overall ranking due to its relatively low performance in Urban Planning, Human Capital and Environment.
The interpretation of Table 4 is very important in analyzing the results since it highlights the relative posi-tion of all of the cities along each one of the dimensions. The following section offers a more detailed description of ranking by dimension.
HUMAN CAPITALThe city that occupies the first place in this dimension is London (United Kingdom). London stands out as the city with the largest number of universities and top-ranked business schools. Moreover, a large percentage of the city’s population has secondary and higher education.
SOCIAL COHESIONDoha (Qatar) obtained the highest ranking in this di-mension. It’s the city with the lowest unemployment rate (less than 1%). In addition, it also has one of the lowest crime rates and murder rates per 100,000 inhabitants, along with other Middle Eastern cities like Abu Dhabi and Dubai.
ECONOMY New York leads the ranking in this dimension. This city has relatively high rankings in all indicators, particularly in terms of GDP and the number of head offices of pu-blicly traded companies.
PUBLIC SECTOR MANAGEMENTIn this case, London (United Kingdom) once again co-mes first place, earning with high marks for nearly every indicator, especially its per capita reserves.
GOVERNANCEBirmingham (United Kingdom) ranks first in this dimen-sion, standing out for the strength of its legal framework and web services at the local level.
Ranking City Performance ICIM123 Jakarta-Indonesia M 45.13124 Durban-South Africa B 44.96125 Porto Alegre-Brasil B 44.93126 Fortaleza-Brazil B 44.27127 Manila-Philippines B 44.24128 Recife-Brazil B 43.83129 Pretoria-South Africa B 43.23130 Johannesburg-South Africa B 43.12131 Chongqing-China B 43.12132 Delhi-India B 42.94133 Rio de Janeiro-Brazil B 42.64134 Salvador-Brazil B 41.45135 Tianjin-China B 41.18
Ranking City Performance ICIM136 Wuhan-China B 40.78137 Cairo-Egypt B 40.77138 Suzhou-China B 40.71139 Belo Horizonte-Brazil B 39.14140 Bangalore-India B 38.54141 Mumbai-India B 38.21142 Shenyang-China B 38.17143 Alexandria-Egypt B 37.62144 La Paz-Bolivia B 36.93145 Santo Domingo-Dominican Republic B 36.58146 Harbin-China B 36.45147 Caracas-Venezuela B 35.83148 Calcutta-India B 35.35

IESE Business School - IESE Cities in Motion Index23
ENVIRONMENTThe cities that rank highest in this dimension are Zurich and Geneva, Switzerland, and Helsinki, Finland. These cities have low levels of pollution and CO2 emissions and are among the highest ranked in the Environmental Per-formance Indicator.
MOBILITY AND TRANSPORTATIONThe city of Frankfurt (Germany) tops the ranking, with high marks for all of the indicators included in this di-mension.
URBAN PLANNINGOslo (Norway) occupies the first place in this dimension, coming in first place for nearly every indicator.
INTERNATIONAL OUTREACHParis (France) ranks first in this dimension, while Lon-don (United Kingdom) ranks second. This is because Paris is the second city with the most international tou-
rists, occupying the leading position in the ranking for the number of pictures taken of the city and uploads to Panoramio. It is also the city that hosts the most interna-tional conferences and trade fairs. For its part, London is the city with the highest number of airline passengers, which is consistent with the fact that it is among the cities with the most airline route.
TECHNOLOGYHong Kong (China) tops this ranking. This city earns high marks for all of the indicators, especially the num-ber of broadband users. Hong Kong is considered as the window of innovation and technology in the Chinese market and Asia Pacific region.

IESE Business School - IESE Cities in Motion Index24
TABLE 4 . RANKING BY DIMENSIONSCi
tyEc
onom
yHu
man
Cap
ital
Socia
lCo
hesio
nEn
viron
men
tPu
blic
Mana
gem
ent
Gove
rnan
ceUr
ban
Plan
ning
Inte
rnat
iona
lOu
treac
hTe
chno
logy
Mobi
lity a
nd
Tran
spor
tatio
nCi
ties i
n Mo
tion
Lond
on-U
K4
190
281
1321
211
101
New
York-
USA
14
103
111
315
495
228
2Se
oul-S
outh
Kore
a19
1510
6222
1828
254
63
Paris
-Fra
nce
37
7050
8744
631
88
4Am
sterd
am-N
ether
lands
3014
4326
4128
39
1413
5Vi
enna
-Aus
tria39
6055
627
329
840
26
Toky
o-Ja
pan
29
936
8252
3019
1581
7Ge
neva
-Swi
tzerla
nd11
4233
22
307
2338
448
Sing
apor
e-As
ia Pa
cific
1344
5429
2510
7415
933
9Mu
nich-
Germ
any
3220
209
1736
549
263
10Bo
ston-
USA
152
4296
158
6776
1026
11Zu
rich-
Switz
erlan
d20
338
148
3011
5527
1912
Helsi
nki-F
inlan
d38
5331
329
735
6129
913
Oslo-
Norw
ay14
3921
718
531
3244
3214
Cope
nhag
en-D
enma
rk25
8058
2072
128
2932
415
Melbo
urne
-Aus
tralia
2135
2724
4711
2763
1835
16Ho
ng K
ong,
China
-Asia
Pac
ific33
3794
4113
73
813
140
17Ch
icago
-USA
98
8810
128
978
366
1618
Was
hingto
n-US
A8
360
109
48
5548
713
619
Liver
pool-
UK37
3114
1343
452
3010
051
20Sa
n Fra
ncisc
o-US
A6
661
105
615
6240
561
21Du
blin-
Irelan
d22
5810
411
816
2017
6129
22Bi
rming
ham-
UK51
2218
3739
154
7487
3823
Stoc
kholm
-Swe
den
2457
515
3522
1350
3615
24Be
rlin-G
erma
ny63
1337
1816
3912
2233
1725
Glas
gow-
UK53
1129
4342
451
5453
4126
Sydn
ey-A
ustra
lia17
4832
3230
2117
3716
9527
Fran
kfurt-
Germ
any
3616
6614
3364
3370
561
28Ba
sel-S
witze
rland
8524
114
1030
224
114
5929
Duba
i-Unit
ed A
rab E
mira
tes91
107
382
727
9411
5424
30Ma
nche
ster-U
K62
2526
5832
1370
9128
3631
Tel A
viv-Is
rael
5767
2256
526
439
102
8732
Brus
sels-
Belgi
um28
2964
6550
4525
1843
1133
Barce
lona-
Spain
7340
129
4998
2424
649
2034
Madr
id-Sp
ain58
4312
444
5233
4213
557
35To
ronto
-Can
ada
3536
3611
344
540
5630
6336
Hamb
urg-
Germ
any
4126
7721
3629
3710
252
537
Auck
land-
New
Zeala
nd46
9448
875
622
101
2443
38Ly
on-F
ranc
e47
3046
3871
3131
6237
2739
Nottin
gham
-UK
3745
2835
4913
6012
366
6640
Dalla
s-Unit
ed S
tates
1218
6812
020
811
264
2346
41Lo
s Ang
eles-U
SA5
578
130
1323
8043
1910
342
Hous
ton-U
SA7
2147
127
568
4172
2012
343
Linz-A
ustria
2969
4117
2347
1027
111
100
44Le
eds-U
K65
3212
4745
1391
9288
6945
Osak
a-Ja
pan
2765
1352
6220
106
9358
6046
Eind
hove
n-Ne
therla
nds
6668
525
5337
610
831
119
47St
uttga
rt-Ge
rman
y75
8717
2257
1957
118
7023
48Ot
tawa-
Cana
da97
954
9111
248
115
2112
249

IESE Business School - IESE Cities in Motion Index25
City
Econ
omy
Hum
an C
apita
lSo
cial
Cohe
sion
Envir
onm
ent
Publ
icMa
nage
men
tGo
vern
ance
Urba
nPl
anni
ngIn
tern
atio
nal
Outre
ach
Tech
nolo
gyMo
bilit
y and
Tr
ansp
orta
tion
Citie
s in
Motio
nLil
le-Fr
ance
4951
4457
7631
6468
8122
50Co
logne
Germ
any
4372
1540
6780
3285
3918
51Mo
ntrea
l-Can
ada
5462
4010
426
1719
6525
111
52Va
ncou
ver-C
anad
a52
5935
9261
1723
6741
8953
Gothe
nbur
gSw
eden
4556
5010
6351
4752
101
2554
Abu D
habi-
Arab
Emi
rates
1013
06
869
6112
110
946
4755
Prag
ue-C
zech
Rep
ublic
102
4149
1265
7956
4210
614
56Ha
ifa-Is
rael
3166
2459
2175
6153
7210
557
Jeru
salem
-Isra
el64
109
2569
7014
117
7176
8558
Phila
delph
ia-US
1610
101
123
6415
7511
013
8459
Marse
ille-F
ranc
e60
5263
5492
3126
7975
3960
Duisb
urg-
Germ
any
8149
1634
1264
5398
7494
61Lis
bon-
Portu
gal
7192
117
3138
5073
3150
4862
Flore
nce-
Italy
5050
109
1912
371
1635
6886
63Ph
oenix
-US
2617
6512
231
1510
313
948
8264
Buda
pest-
Hung
ary
9554
106
4885
6515
2685
5265
Nice
-Fra
nce
3446
4542
7496
3921
136
6466
Busa
n Sou
th Ko
rea
7893
7671
4043
6614
042
4567
Rome
-Italy
7647
134
6491
104
387
4776
68Da
egu S
outh-
Kore
a79
108
5372
3725
4514
759
6569
Miam
i-US
2319
9912
146
3814
4177
133
70Mi
lan-It
aly55
2812
051
9393
4634
8371
71W
arsa
w-Po
land
8610
092
5519
6234
6610
349
72Va
lencia
-Spa
in88
7179
2710
467
105
7762
3173
Taipe
i-Taiw
an93
6423
134
127
4984
383
106
74A
Coru
ña-S
pain
6155
9839
107
4092
129
9190
75Bi
lbao-
Spain
4081
122
1510
054
101
114
112
3776
Riga
-Latv
ia83
3812
346
3472
5957
109
102
77Tu
rin-It
aly70
7097
8010
856
5882
9354
78Se
ville-
Spain
8976
111
3010
554
2978
8010
179
Malag
a-Sp
ain88
6375
2310
685
109
4784
5580
orto-
Portu
gal
8298
8516
5810
210
773
104
2181
Istan
bul-T
urke
y72
140
1993
8110
982
1251
115
82Sh
angh
ai-Ch
ina92
1295
136
147
5995
1012
3483
Bang
kok-T
haila
nd80
129
3410
814
010
688
1422
5884
Sofia
-Bulg
aria
108
6111
263
5188
4481
9050
85Sa
ntiag
o-Ch
ile44
9983
6824
6371
8712
110
986
Ljublj
ana-
Slov
enia
9885
7133
7868
7713
789
9787
Kuala
Lump
ur-M
alays
ia84
128
5685
141
4612
533
6370
88Da
ejeon
Sou
th-Ko
rea
7989
5370
6973
1814
834
8089
Mosc
ow-R
ussia
4827
139
114
5469
128
5167
6290
Buen
os A
ires-A
rgen
tina
122
112
6989
132
4250
4579
124
91At
hens
-Gre
ece
8784
140
6084
8136
6071
5692
Monte
rrey-M
exico
5696
3987
125
8496
128
128
108
93W
rocla
w-Po
land
118
138
8753
118
6210
012
617
8394
Mexic
o, DF
-Mex
ico59
142
6211
812
455
116
8392
104
95Na
ples-I
taly
9682
116
4511
297
7990
6411
696
Bogo
t-Co
lombia
6811
510
881
121
7889
8411
098
97Bu
rsa-T
urke
y10
111
37
6686
109
124
9612
575
98Be
ijing-
China
9023
105
148
148
9811
04
4512
99

IESE Business School - IESE Cities in Motion Index26
City
Econ
omy
Hum
an C
apita
lSo
cial
Cohe
sion
Envir
onm
ent
Publ
icMa
nage
men
tGo
vern
ance
Urba
nPl
anni
ngIn
tern
atio
nal
Outre
ach
Tech
nolo
gyMo
bilit
y and
Tr
ansp
orta
tion
Citie
s in
Motio
n18
781
119
9911
314
175
148
7410
010
074
3813
511
957
120
111
3512
510
112
110
213
395
9676
8546
6992
102
7711
493
125
8358
113
9413
411
710
310
579
100
137
145
5911
416
6530
104
4214
72
8412
092
142
141
113
146
105
123
116
8673
135
8369
9760
114
106
6912
310
778
131
7813
210
795
107
107
9412
630
9480
101
122
130
116
120
108
109
119
9661
6077
108
9510
813
410
967
122
113
7512
290
130
121
123
112
110
135
9012
876
101
7065
8898
9911
112
773
7367
9499
111
119
138
9611
274
104
5290
133
107
136
120
137
7811
312
310
111
974
134
8343
124
9911
811
411
734
132
115
5594
127
8611
712
811
599
118
5979
117
9213
114
414
057
116
110
121
142
8868
3583
113
124
137
117
106
7774
140
144
9897
2082
4211
811
110
657
138
130
8999
8957
6811
912
975
137
103
7710
076
112
8612
112
010
411
112
777
103
115
129
104
131
9312
111
397
5713
997
105
102
127
7811
012
211
213
511
512
966
9114
369
118
129
123
114
136
135
100
7934
140
143
139
142
124
134
9113
083
110
9568
103
146
8812
513
912
011
411
011
660
9313
112
714
012
612
014
684
124
8911
211
810
010
712
612
713
911
081
107
111
9587
132
132
130
128
116
117
131
9914
103
119
146
144
135
129
103
124
144
116
7348
134
145
119
7913
012
512
582
143
142
5913
528
130
7713
113
314
172
144
113
4114
880
9673
132
131
8614
397
109
9972
5894
131
133
137
105
138
102
115
8786
122
133
9113
410
788
8014
214
698
9811
711
553
135
119
8391
145
143
9813
944
105
113
136
128
137
102
128
5911
112
613
612
614
513
712
412
789
141
138
7413
759
9713
913
814
010
311
810
612
810
810
411
612
014
313
913
613
967
131
114
8214
512
512
213
814
013
214
812
513
210
266
146
106
7314
714
112
413
282
147
139
8690
9912
912
714
213
013
412
111
790
110
123
133
147
144
143
115
131
110
112
136
114
144
135
141
141
144
126
144
136
126
8811
611
513
814
567
145
124
133
8214
612
998
138
105
135
132
146
141
143
141
9895
117
133
134
143
7214
7
Doha
-Qata
rTa
ichun
g-Ta
iwan
São P
aulo-
Bra
ilLim
a-Pe
ruGu
angz
hou-
China
Riya
dh-S
audi
Arab
iaCo
rdob
a-Ar
genti
naMe
dellin
Colom
biaAn
kara
-Tur
key
Monte
video
-Uru
guay
Cali-C
olomb
iaCu
ritiba
-Bra
zilBr
asilia
-Bra
ilGu
adala
jara-
Mexic
oRo
sario
-Arg
entin
aSa
int-P
etersb
urg
Russ
iaJe
ddah
-Sau
di Ar
abia
Cape
Tow
n-So
uth A
frica
Shen
zhen
-Chin
aKa
ohsiu
ng-T
aiwan
Sara
jevo
Bosn
ia an
d Her
zego
vina
Quito
-Ecu
ador
Taina
nTa
iwan
Jaka
rta-In
done
siaDu
rban
-Sou
th Af
rica
Porto
Aleg
re-B
rail
Forta
leza
Braz
ilMa
nila
Philip
pines
Recif
e-Br
azil
Preto
ria-S
outh
Afric
aJo
hann
esbu
rgSo
uth A
frica
Chon
gqing
-Chin
aDe
lhi-In
diaRi
o de J
aneir
o-Br
azil
Salva
dor-B
razil
Tianji
n-Ch
inaW
uhan
-Chin
aCa
iro-E
gypt
Suzh
ou-C
hina
Belo
Horiz
onte
Braz
ilBa
ngalo
re-In
diaMu
mbai-
India
Shen
yang
-Chin
aAl
exan
dria-
Egyp
tLa
Paz
-Boli
viaSa
nto D
oming
o-Do
minic
an R
epub
licHa
rbin-
China
Cara
cas-V
enez
uela
Calcu
tta-In
dia13
814
512
613
312
682
147
142
142
148
148

IESE Business School - IESE Cities in Motion Index27
GOOD URBAN PLANNING ENCOMPASSES 10 DIFFERENT DIMENSIONS TO ASSESS A CITY’S PROSPERITY

IESE Business School - IESE Cities in Motion Index28
REGIONAL RANKING
TOP 5 EUROPE TOP 5 ASIA PACIFIC
TOP 5 LATIN AMERICA TOP 5 MIDDLE EAST
CITY REGIONALPOSITION
GLOBAL POSITION
2012
GLOBAL POSITION
2013
GLOBAL POSITION
2014
London-United Kingdon 1 1 1 1
Paris-France 2 4 4 4
Amsterdam-The
Netherlands3 6 7 5
Vienna-Austria 4 9 6 6
Geneva-Switzerland 5 10 9 8
CITY REGIONALPOSITION
GLOBAL POSITION
2012
GLOBAL POSITION
2013
GLOBAL POSITION
2014
Santiago-Chile 1 89 86 86
Buenos Aires-Argentina 2 92 93 91
Mexico, D.F.-Mexico 3 94 105 95
Bogota-Colombia 4 96 98 97
São Paulo-Brazil 5 101 99 102
CITY REGIONALPOSITION
GLOBAL POSITION
2012
GLOBAL POSITION
2013
GLOBAL POSITION
2014
Seoul-South Korea 1 2 3 3
Tokyo-Japan 2 5 8 7
Singapore-Asia-Pacific 3 20 18 9
Melbourne-Australia 4 13 12 16
Hong Kong-China 5 32 23 17
CITY REGIONALPOSITION
GLOBAL POSITION
2012
GLOBAL POSITION
2013
GLOBAL POSITION
2014
Dubai-United ArabEmirates
1 29 28 30
Tel Aviv-Israel 2 36 35 32
Abu Dhabi-United Arab Emirates
3 53 57 55
Haifa-Israel 4 54 55 57
Jerusalem-Israel 5 66 64 58
In Europe, the city that tops this ranking is London, which also ranks first in the global ranking, a position that it has maintained for the past three years. Within Europe, Lon-don is followed by Paris, Amsterdam and Vienna, which had the biggest jump in the global ranking, ascending three positions. The table concludes with Geneva.
Seoul tops the ranking in the Asia Pacific region, placing third globally and falling back one position since 2012. Tokyo is in second place within the region, followed by Singapore, Melbourne and Hong Kong. It should be no-ted that both Singapore and Hong Kong are the cities that have progressed the most on our index, moving up 11 and 15 positions, respectively.
Santiago, Chile leads the ranking among the best Latin American cities, jumping three positions over the last three years in the global ranking. Buenos Aires is in se-cond place, followed by Mexico City. The table concludes with Bogota and São Paulo. It is worth noting that the progression of the major cities in this geographic region was much more modest than in other emerging markets.
The Middle Eastern ranking is led by the city of Dubai, which is also included in the Top 30 cities in the overall ranking. Tel Aviv tails Dubai by two positions. The cities of Abu Dhabi, Haifa and Jerusalem round out the list of the top five cities in the region. It should be noted that unlike other regions, in which the top five cities are distributed in different countries, the top five Middle Eastern cities are located in only two countries: United Arab Emirates and Israel.

IESE Business School - IESE Cities in Motion Index29
BARCELONA
Listed 34th overall, Barcelona is the highest ranking Spa-nish city. It outperforms Madrid in Human Capital, Urban Planning, International Outreach and Technology.
BOSTON
One of the oldest cities in the United States, Boston is the capital and most populated city of the state of Massachu-setts. It’s considered the economic and cultural center of the region. The city ranks 11th overall and second in the region, earning high marks in Human Capital and Gover-nance.
BUENOS AIRES
Buenos Aires is the capital and most populous city in Argentina. Furthermore, it’s the most visited city in South America and has the second-highest number of skyscra-pers in the region. It ranks 91st overall and second in the region.
This section includes a description of some interesting ca-ses worth highlighting. The study’s annex section includes a graphic analysis of the 148 cities included in Cities in Mo-tion Index.
AMSTERDAM
Amsterdam is the capital of the Netherlands. It is currently the country’s largest city and an internationally renowned financial and cultural hub. This city is listed fifth in the overall ranking and third within its region. It has solid per-formance in all of the dimensions, particularly Urban Plan-ning and International Outreach.
TOP 5 NORTH AMERICA
CITY REGIONALPOSITION
GLOBAL POSITION
2012
GLOBAL POSITION
2013
GLOBAL POSITION
2014
New York-USA 1 3 2 2
Boston-USA 2 24 16 11
Chicago-USA 3 21 13 18
Washington-USA 4 16 26 19
San Francisco-USA 5 30 20 21
In North America, the ranking is led by New York, which ranks second in the overall classification. Boston comes in second place on a regional level and 11th globally. Chicago, Washington D.C. and San Francisco complete the list of the five best North American cities. It is worth mentioning that no Canadian cities are included in the top five cities in this region (Toronto is the highest ranked city in the coun-try in the 36th position).
A FEW NOTABLE CASES

IESE Business School - IESE Cities in Motion Index30
MADRID
Madrid is the second Spanish city included in the ran-king, right behind Barcelona. It stands out in the dimen-sions of Mobility and Transport, where it ranks seventh, and International Outreach, where it occupies the 13th
position.
NEW YORK
New York is among the three largest and most densely populated urban areas in the world, and is second largest metropolitan area in North America after Mexico City. New York ranks second in the overall ranking and first in the region. It is the most important global economic center in the world, and, along with Tokyo, one of the world’s most important economic hubs.
PARIS
The French capital is the world’s most popular tourist destination, drawing more than 42 million international tourists per year. Paris has one of Europe’s most impor-tant business districts, which is home to the headquar-ters of nearly half of France’s leading companies and 20 of the world’s largest 100 firms. It ranks fourth in the ove-rall ranking and first in terms of International Projection. The city also excels in Human Capital, Technology, and Mobility and Transport.
DUBAI
Located in the United Arab Emirates, it is among the ci-ties with the highest growth rates over the past decade. It holds the 30th place in the overall ranking and places first within its region. Especially noteworthy are its marks in Social Cohesion, Public Sector Management and Inter-national Outreach.
HONG KONG
A Special Administrative Region of the People’s Republic of China, Hong Kong is formed by a peninsula and several islands located on the southern coast of the South China Sea. It is currently one of the most influential cities in sou-theastern Asia. It ranks 17th overall and fifth in the region, ranking first in Technology and third in Governance.
LONDON
London is the capital of England and the United Kingdom, and the largest city and urban area of Great Britain. It’s a fundamental hub for the arts, business, education, enter-tainment, fashion, finance, media, research, tourism and transport. For these reasons, it ranks first in the overall ran-king, with high marks in nearly every dimension. It stands out in the dimensions of Human Capital, Public Sector Management and International Projection, and also occu-pies the top positions in Economy, Technology, and Mobi-lity and Transport. Nonetheless, it shows its worst side in Social Cohesion, where it’s positioned 90th in the ranking.

IESE Business School - IESE Cities in Motion Index31
SINGAPORE
Singapore is a city-state located in Southeast Asia. Foun-ded as a British trade colony in 1819, since its indepen-dence it has become of the world’s most prosperous ci-ties and has the most active port in the world. It occupies the ninth place in the overall ranking and third in the re-gion. It stands out in Technology, Governance, Economy and International Outreach.
TEL AVIV
Tel Aviv is the second-largest city in Israel. It’s conside-red the country’s cultural capital due to cosmopolitan and modern character. Although it places 32nd in the ranking, the city ranks fourth in Urban Planning and fifth in Pu-blic Sector Management. Moreover, it ranks second in its region.
TOKYO
The capital of Japan, Tokyo is the world’s most populated metropolis and among the cities with the highest labor productivity rates. It’s in seventh place in the overall ran-king and second in its region. Moreover, it ranks second in the dimension of Economy, and 9th in Human Capital and Social Cohesion.
SANTIAGO, CHILE
The Chilean capital ranks 86th overall and tops the lists among Latin American major cities, surpassing Buenos Aires, São Paulo and Mexico City. In addition, the city stands out for its Public Sector Management, which is listed 24th in the ranking.
SEOUL
The capital South Korea is one of the largest metropolitan areas of the world. The city is home to some of the world’s largest companies, like Samsung, LG Group, Hyundai and Kia Motors, among others. It’s ranked third overall and first in the region. Seoul stands out in Technology, Social Cohesion, and Mobility and Transport, although it ranks among the Top 25 cities in nearly every dimension.
SYDNEY
Sydney is Australia’s largest and most populous city and the country’s main tourist destination. It ranks 27th in the general ranking and earns high marks in Economy, Tech-nology and Urban Planning.

IESE Business School - IESE Cities in Motion Index32
VIENNA
Vienna is the capital of Austria, as well as the country’s most populous city. Given its rich cultural scene and high standard of living, it’s known as the country’s most impor-tant cultural and political center. It ranks sixth overall and is included among the top 5 European cities. It stands out for Mobility and Transport, where it ranks second, as well as Environment, Urban Planning and International Outreach, where it ranks among the top 10.
ZURICH
The capital of Switzerland, Zurich is the financial engi-ne and cultural epicenter of the country. It was chosen as the city with highest standard of living in the world in 2006 and 2008. Zurich occupies 12th place in the ranking and first in Environment. It also stands out in the dimensions of Social Cohesion and Urban Planning.
EVOLUTION OF THE CITIES IN MOTION INDEX
The evolution of a city is vital for understanding where its development goals lie. That is why this section presents the evolution the CIMI over the last three years for the first 50 cities in the ranking of 2014.
The results show certain stability at the top. The most notable changes include Seoul’s drop from the number 2 position, which it held in 2012 and which New York oc-cupied in 2013. Tokyo, which was ranked 5th in 2012, fell 2 places during the period. Vienna reflects the opposite case, rising three spots between the years 2012-2014.
Strides in development taken by Singapore and Hong Kong are noteworthy. Singapore showed major advances during the period of 2012-2014, moving up from 18th pla-ce in 2013 to 9th in 2014. Hong Kong rose 15 positions between 2012-2014, from number 32 to 17. This break-through for the city is largely due to improvements in the dimensions of Human Capital, Environment, Mobility and Transport and Technology.
In the United States, positive developments in cities took place during 2012-2014, with the exception of Los An-geles. A highlight is the evolution of Boston, which rose from 24th to 11th place. This development is chiefly due to improvements in the dimensions of Governance, Social Cohesion and Public Management. Los Angeles expe-rienced a downward trend during this period, particularly due to poorer performance in the dimension of Mobility and Transport, as well as Economy.
Table 5 features the evolution of the index, over the last three years, for the first 50 cities in the 2014 ranking.

IESE Business School - IESE Cities in Motion Index33
TABL 5 . EVOLUTION OF THE INDEX FOR THE FIRST 50 CITIES IN THE 2014 RANKING (THREE LAST YEARS)
City 2012 2013 2014 2012-2013 2013-20141 1 1 0 03 2 2 1 02 3 3 -1 04 4 4 0 06 7 5 -1 29 6 6 3 05 8 7 -3 110 9 8 1 120 18 9 2 98 5 10 3 -524 16 11 8 511 11 12 0 -115 19 13 -4 67 10 14 -3 -417 14 15 3 -113 12 16 1 -432 23 17 9 621 13 18 8 -516 26 19 -10 714 17 20 -3 -330 20 21 10 -125 22 22 3 026 29 23 -3 612 15 24 -3 -918 24 25 -6 -119 25 26 -6 -123 21 27 2 -627 30 28 -3 222 27 29 -5 -229 28 30 1 -234 36 31 -2 536 35 32 1 328 31 33 -3 -247 46 34 1 1231 34 35 -3 -139 32 36 7 -433 33 37 0 -446 42 38 4 437 38 39 -1 -138 37 40 1 -345 39 41 6 -235 44 42 -9 242 41 43 1 -241 43 44 -2 -140 40 45 0 -544 47 46 -3 148 49 47 -1 243 45 48 -2 -355 48 49 7 -156 56 50 0 6
London-UKNew York-USASeoul-South KoreaParis-FranceAmsterdam-NetherlandsVienna-AustriaTokyo-JapanGeneva SwitzerlandSingapore-Asia PacificMunich-GermanyBoston-USAZurich-SwitzerlandHelsinki-FinlandOslo-NorwayCopenhagen-DenmarkMelbourne-AustraliaHong Kong, China-Asia PacificChicago-USAWashington D.C.-USALiverpool-UKSan Francisco-USADublin-IrelandBirmingham-UKStockholm-SwedenBerlin-GermanyGlasgow-UKSydney-AustraliaFrankfurt-GermanyBasel SwitzerlandDubai-United Arab EmiratesManchester-UKTel Aviv-IsraelBrussels-BelgiumBarcelona-SpainMadrid-SpainToronto-CanadaHamburg-GermanyAuckland-New ZealandLyon-FranceNottingham-UKDallas-USLos Angeles-USAHouston-USALinz-AustriaLeeds-UKOsaka-JapanEindhoven-NetherlandsStuttgart-GermanyOttawa-CanadaLille-FranceCologne-Germany 49 50 51 -1 -1

IESE Business School - IESE Cities in Motion Index34
London-UKNew York-USASeoul-South Korea
Paris-FranceAmsterdam-Netherlands
Vienna-Austria
Tokyo-Japan Geneva-SwitzerlandSingapore-Asia Pacific
Munich-Germany Boston-USAZurich-Switzerland
Helsinki-FinlandOslo-Norway
Copenhagen-DenmarkMelbourne-Australia
Hong Kong, China-AsiaPacific
Chicago-USAWashington D.C.-USA
Liverpool-UK San Francisco-USADublin-Ireland
Birmingham-UKStockholm-Sweden
Berlin-GermanyGlasgow-UK
Sydney-Australia Frankfurt-Germany
Basel-SwitzerlandDubai-United Arab Emirates
0
5
10
15
20
25
30
35
0 5 10 15 20 25 30 35
2014
Citi
es in
Mot
ion
Inde
x Ran
king
2012 Cities in Motion Index Ranking
GRAPHIC 1
CITIES IN MOTION VS. REPUTATION INDEX In this section, we perform a comparative study of the CIMI with the Reputation Index (IR), created by the Re-putation Institute, which compiles the opinions of more than 22,000 people worldwide. The IR measures the ex-tent to which people trust, admire, respect and have a good feeling about their city or have an emotional bond with it. This index has been calculated since 1999 for both cities and countries.
Graphic 2 presents a comparison between the rankings of the CIMI and the IR in 2014. All cities above the dia-gonal line enjoy an improved CIM ranking with respect
to the IR position. The opposite happens with cities that are below the line. Particular cases are New York and Seoul, which rank 2nd and 3rd respectively in the CIMI and yet are placed 25th and 77th in the IR. The same applies to cities such as Singapore, Hong Kong and Tel Aviv (Israel). Conversely, cities such as Santo Domingo (Dominican Republic), or Florence and Milan (Italy) en-joy a reputation beyond what is indicated by the CIMI. Vienna (Austria) holds the 1st position in the IR and the 5th in the CIMI.
Cities close to the line are those with a reputation aligned with the criteria of the CIMI. Within this group are, for example, Budapest (Hungary), Toronto (Canada), Frank-furt (Germany) and Stockholm (Sweden).
Graphic 1 shows the positions of the cities, in 2012 and in 2014, for the first 30 cities in the ranking.
Those that experienced positive development are be-low the 45-degree angle that forms the diagonal line;
meanwhile, cities whose evolution was not positive are above that line. For example, Basel had a negative trend since in 2012 it ranked 22th in the rankings, and in 2014, dropped to 29th. In contrast, Hong Kong had a positive evolution, going from 32nd to 17th in 2014.
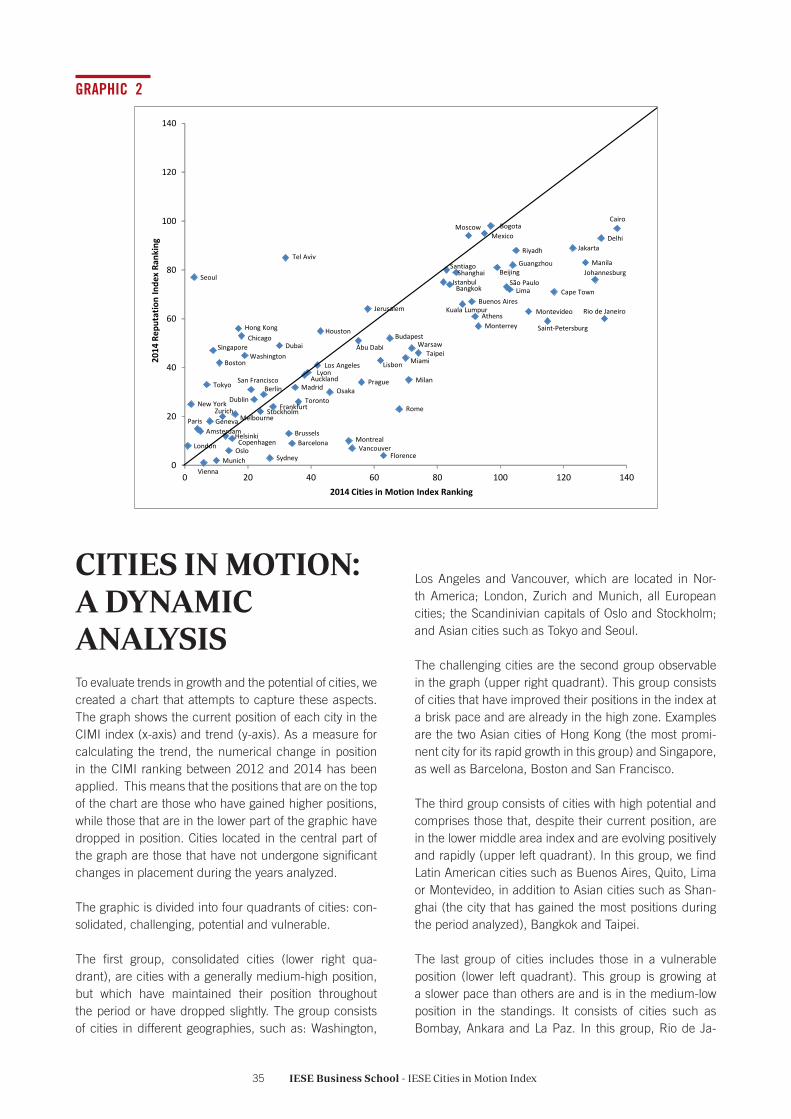
IESE Business School - IESE Cities in Motion Index35
CITIES IN MOTION: A DYNAMIC ANALYSISTo evaluate trends in growth and the potential of cities, we created a chart that attempts to capture these aspects. The graph shows the current position of each city in the CIMI index (x-axis) and trend (y-axis). As a measure for calculating the trend, the numerical change in position in the CIMI ranking between 2012 and 2014 has been applied. This means that the positions that are on the top of the chart are those who have gained higher positions, while those that are in the lower part of the graphic have dropped in position. Cities located in the central part of the graph are those that have not undergone significant changes in placement during the years analyzed.
The graphic is divided into four quadrants of cities: con-solidated, challenging, potential and vulnerable.
The first group, consolidated cities (lower right qua-drant), are cities with a generally medium-high position, but which have maintained their position throughout the period or have dropped slightly. The group consists of cities in different geographies, such as: Washington,
Los Angeles and Vancouver, which are located in Nor-th America; London, Zurich and Munich, all European cities; the Scandinivian capitals of Oslo and Stockholm; and Asian cities such as Tokyo and Seoul.
The challenging cities are the second group observable in the graph (upper right quadrant). This group consists of cities that have improved their positions in the index at a brisk pace and are already in the high zone. Examples are the two Asian cities of Hong Kong (the most promi-nent city for its rapid growth in this group) and Singapore, as well as Barcelona, Boston and San Francisco.
The third group consists of cities with high potential and comprises those that, despite their current position, are in the lower middle area index and are evolving positively and rapidly (upper left quadrant). In this group, we find Latin American cities such as Buenos Aires, Quito, Lima or Montevideo, in addition to Asian cities such as Shan-ghai (the city that has gained the most positions during the period analyzed), Bangkok and Taipei.
The last group of cities includes those in a vulnerable position (lower left quadrant). This group is growing at a slower pace than others are and is in the medium-low position in the standings. It consists of cities such as Bombay, Ankara and La Paz. In this group, Rio de Ja-
GRAPHIC 2
London
New York
Seoul
ParisAmsterdam
Vienna
Tokyo
Geneva
Singapore
Munich
Boston
Zurich
Helsinki
Oslo
Hong Kong
Melbourne
Chicago
Copenhagen
Washington
San Francisco
Dublin
Stockholm
Berlin
Sydney
Dubai
Frankfurt
Tel Aviv
BrusselsBarcelona
Madrid
Toronto
Auckland
Los Angeles
Houston
Lyon
Osaka
MontrealVancouver
Abu Dabi
Prague
Lisbon
Jerusalem
Florence
Budapest
Rome
Miami
Milan
WarsawTaipei
IstanbulBangkok
ShanghaiSantiago
Kuala Lumpur
Moscow
Buenos Aires
AthensMonterrey
MexicoBogota
BeijingSão Paulo
Guangzhou
Riyadh
Lima
Montevideo
Saint-Petersburg
Cape Town
Jakarta
ManilaJohannesburg
Delhi
Rio de Janeiro
Cairo
0
20
40
60
80
100
120
140
0 20 40 60 80 100 120 140
2014
Rep
utat
ion
Inde
xRa
nkin
g
2014 Cities in Motion Index Ranking

IESE Business School - IESE Cities in Motion Index36
neiro stands out as the city that has dropped the largest number of positions during the period analyzed.
The chart above is complemented with a variance analy-sis of the dimensions of the cities. This is because it is necessary not only to understand how much they have developed, but also how they have done this. To do this, we calculate the variation of the different dimensions for each of the cities. Cities in the bottom of the part of the graphic are cities that have similar positions in all dimen-sions and therefore have a more homogeneous distribu-tion. Those in the top part are cities that stand out in one or more dimensions, but in others are placed in a relatively low position. This information, combined with the current position of each city, allows us to identify four categories of cities.
The first category is “Balanced” cities (lower right qua-drant): those cities that are positioned in the upper mi-ddle of the graphic and have relatively high values in all dimensions. Within this category are cities such as Am-sterdam, Seoul, Melbourne, Helsinki, Stockholm, Zurich and Vienna.
The second category is “Differentiated” cities (upper ri-ght quadrant), which are those cities in high positions in the ranking and do very well in some dimensions, but relatively poorly in others. An example is the city of Hong Kong, which is located among the top positions in the dimensions of technology and International Outreach but is among the worst in terms of Public Administration.
Or the city of New York, which is located among the top positions of various dimensions (economy, technology, International Outreach) but does relatively poorly in the dimensions of Social Cohesion and the Environment. In this category are cities such as Dubai, Barcelona, Los Angeles and Ottawa.
The third quadrant (upper left quadrant) reflects cities that are at the bottom of the table but which excel in one dimension. An example is the city of Beijing, which is among the top 5 cities in International Outreach, but below position 100 in the dimensions of Social Cohesion, Environment, Public Management and urbanism. In this category, we find cities such as Shanghai, Riyadh and Doha.
The last quadrant (lower left quadrant) are those cities that make them relatively poor in (almost) all dimensions. An example is the city of La Paz, located below the 100th position in all dimensions. In this category, we find cities such as Caracas, Manila and Quito.
Vulnerable
Potential
Consolidated
Challengers
Tend
ency
Current position
London
New York
Seoul
Vienna
Tokyo
Singapore
Boston
Oslo
Melbourne
Hong Kong
Chicago
Washington
Liverpool
San Francisco
Stockholm
BerlinGlasgow
FrankfurtDubai
Tel Aviv
Brussels
Barcelona
Auckland
Dallas
Los Angeles
Osaka
Eindhoven
Ottawa
Cologne
Vancouver
Abu Dabi
Prague
JerusalemPhiladelphia
Florence
Rome
Daegu
Miami
Milan
WarsawTaipei
PortoIstanbul
Shanghai
Bangkok
Sofia
Santiago
Ljubljana
Kuala Lumpur
Moscow
Buenos Aires
Athens
Mexico, D.F.Bogota
Beijing
Doha
Lima
Riad
Medellin
Ankara
Montevideo
Cape Town
Sarajevo
Quito
JakartaManila
Pretoria
Chongqing
Delhi
Rio de Janeiro
Cairo
Suzhou
Mumbai
La Paz
Santo Domingo
CaracasCalcutta
Toronto
Lisbon
ParisAmsterdam
Geneva
Munich
HelsinkiCopenhagen
Zurich
Sydney
Dublin
Madrid

IESE Business School - IESE Cities in Motion Index37
CONCLUSIONS
The CIM synthetic index provides, through an objective calculation methodology, a ranking of cities that takes into account various factors. The 10 dimensions analyzed offer a broad and integrated vision what a city represents, while allowing a deeper understanding of its composition and evolution over time. A comparative and in-depth analysis of the distinct profiles reflected the different ci-ties in the CIMI analysis offers the following conclusions:
• There is no single model of success.The cities that top the rankings are not identical, but they prioritize diffe-rent dimensions (see Annex graph). There are different ways through which a city can climb to the top of the index. This means that cities must reject the “one-si-ze-fits-all” approach. The evidence presented in this report is consistent with the message that our platform managers transmits to cities: the first step to be a better city is to define what kind of city it wants to be and in what dimensions you want to improve.
• It is not enough to be good in one dimension. There are cities located at the top of the ranking in certain di-mensions. Such are the cases of Taipei, in Technology (3); Beijing in International Outreach (4) and Riyadh on Social Cohesion (2), which, in the general ranking, are located in positions 74, 99 and 105, respectively.
These are the cities that the variance analysis we have called “unbalanced.” If they want to play in the Cham-pions League, the recommendation for these cities is that they should aspire to achieve an acceptable mini-mum in all dimensions.
• It is important to consider the whole and break out of “silos”. In relation to the previous point, and consistent with the proposed model, it is important to instill a com-prehensive vision of the process of urban management. The separation of the 10 dimensions is a useful tool for facilitating the analysis. However, in practice, the ele-ments are linked. For example, models for Mobility and Transportation that a city chooses will affect its envi-ronment dimension, in the same way Governance and Public Management are not independent. One of the main responsibilities of city managers is to understand the links among a city’s different dimensions, as well as their advantages and disadvantages. In this sense, the city’s structure should reflect these interrelationships avoiding “silos” between different departments in mu-nicipalities and strike an appropriate balance.
• The perfect city does not exist. It is very difficult for a city to maximize all dimensions. Even those that are located at the top of the ranking have weaknesses. For example, cities like London and New York have a long way to go in the Social Cohesion dimension. These ci-ties have been classified as “differentiated” cities and
Stalled
Balanced
DifferentiatedUnbalanced
London
New York
Seoul
Paris
Amsterdam
Vienna
Tokyo
Singapore
Boston
Oslo
Copenhagen
Melbourne
Hong Kong
Chicago
Washington
San Francisco
Dublin
Birmingham
Berlin
Sydney
Frankfurt
Basel
Dubai
Tel Aviv
Brussels
Barcelona
Toronto
Lyon
Dallas Houston
Osaka
Eindhoven
Ottawa
Vancouver
Abu Dabi
Prague
Jerusalem
Philadelphia
Lisbon
Phoenix
Busan
Rome
Miami
Milan
Warsaw
Taipei
Istanbul
Shanghai
Bangkok
Sofia
Santiago
Kuala Lumpur
MoscowBuenos Aires
Athens
Mexico, D.F.
Bogota
Beijing
Doha
São Paulo
Lima
Riad
Medellin
Ankara
Montevideo
Cape TownShenzhen
Sarajevo
Quito
Jakarta
Durban
Porto Alegre
Manila
Recife
Pretoria
Chongqing
Delhi
Cairo
Suzhou
Belo Horizonte
Bangalore
Mumbai
Alexandria
La Paz
Caracas
CalcuttaSanto Domingo
Rio de JaneiroFortaleza
MunichZurich
Madrid
HelsinkiStockholm Geneva
Varia
nce
Current position
Auckland
Los Angeles

IESE Business School - IESE Cities in Motion Index38
we recommend that they leverage the dimensions hel-ping them to advance overall in the positions where they are behind. For example, a city can leverage its technological leadership to improve its Environment di-mension. Cities classified as “balanced” (such as Am-sterdam, Melbourne and Seoul), should not “rest on their laurels.” Despite more harmonious growth, they still have room for improvement.
• Change is slow for most cities. While our temporal analysis of CIMI indicates that there are cities that are able to make great progress in a relatively short time and move up quickly (Singapore, Boston, Barcelona, Hong Kong, Shanghai), in general, change in position among cities in the ranking was not significant from one year to another. This is due, in large part, to the time needed for major projects to crystallize. Therefore, cities that seek to make necessary changes to become smart and sustainable cities should adopt long-term policies as soon as possible –especially those that are less well-placed and what we call in our analysis “stag-nant.” There are many cities that still have problems dealing with the major challenges such as: lack of co-llaboration among public and private organizations, ci-vic institutions and citizens; inability to promote new business models that provide financing for new busi-nesses; and a myopic view of intelligent cities. Many of these cities still see technology as the main ingredient of a smart city and do not consider other critical dimen-sions that define the urban reality.
• The use of CIMI as a planning tool. In order to define the city of future that it wants to be, that is, its vision, it is important to start with a good diagnosis. This re-port provides a conceptual framework and empirical evidence that can assist cities included in the index, as well as those that have been left out to make that diagnosis. For the first group, it offers the current status of each, indicating in what respects there is room for improvement. For the latter, this report can serve to identify the relevant dimensions to consider in urban planning, as well as help define the group of cities it would like to emulate. In this sense, benchmarks pro-vided by the CIMI should be understood as such; the index does not present a roadmap to follow to the letter. It is also important to note that our recommendation to urban managers is to pay more attention to the trend (dynamic analysis) than to position.
• Cities do not always have the reputation they deserve. The comparative study of what the city is (CIMI) and the perception that the general public has of the city (IR) indicate that there are cities that should work more effectively at communicating their virtues (e.g., Seoul, which is ranked 3rd in the CIMI, but 77th in the IR).
Moreover, there are cities that enjoy a reputation above what is indicated by the CIMI (such as Florence, which is positioned as 63rd in the CIMI, but ranks 4th in the IR). These cities must be careful, because if the distan-ce between “what the city really is” and “what it says it is” is very wide, this may negatively affect its legitimacy.
• Cities do not operate in isolation. Every city is diffe-rent, but none operates in isolation from the realities of the country in which they find themselves. While it is true that investors, talent, and tourists tend to compare and decide among cities, these decisions are not inde-pendent of the conditions of the countries where these cities are located. Thus, the urban manager must be able to identify threats and opportunities that the natio-nal context offers to avoid the first and take advantage of the latter.
Urbanization is one of the most important challenges of the 21st century. As the world’s population increasingly moves to cities, existing problems grow and generate new ones, which also are deeply influenced by the globali-zation process. This trend implies a closer relationship between global dynamics and cities, generating local im-pact: effects on the economy, demographics, social divi-sions and environmental impact.
Despite these challenges, cities and their leaders or ma-nagers have little time and few tools to step back and analyze their problems, find out what other cities do or learn what best practices are being carried out in other parts of the world. The day-to-day management of the city makes it difficult for cities to ask questions, such as how to promote the positive effects of urbanization and reduce the negative one. That’s why the IESE Cities in Motion platform seeks to create awareness and generate innovative tools to help foster smarter governments. With this index, we hope to have contributed toward reaching this goal.

IESE Business School - IESE Cities in Motion Index39
Below is a graphic analysis of 148 cities included in the CIMI, based on 10 key dimensions. These radar charts are intended to facilitate the interpretation of each city
GRAPHIC ANNEX. PROFILES OF 148 CITIES
profile, identifying the values of different dimensions. At the same time, they permit a quick comparison of two or more cities.
020406080
100
Seoul-South KoreaEconomy
Human Capital
International Outreach
Mobility andTransportation
Environment
Technology
UrbanPlanning
PublicManagement
Governance
SocialCohesion
020406080
100
Paris-FranceEconomy
Human Capital
International Outreach
Mobility andTransportation
Environment
Technology
UrbanPlanning
PublicManagement
Governance
SocialCohesion
020406080
100
Amsterdam-NetherlandsEconomy
Human Capital
International Outreach
Mobility andTransportation
Environment
Technology
UrbanPlanning
PublicManagement
Governance
SocialCohesion
020406080
100
Vienna-AustriaEconomy
Human Capital
International Outreach
Mobility andTransportation
Environment
Technology
UrbanPlanning
PublicManagement
Governance
SocialCohesion
020406080
100Economy
Human Capital
International Outreach
Mobility andTransportation
Environment
Technology
UrbanPlanning
PublicManagement
Governance
SocialCohesion
London-UK
020406080
100
New York-USAEconomy
Human Capital
International Outreach
Mobility andTransportation
Environment
Technology
UrbanPlanning
PublicManagement
Governance
SocialCohesion

IESE Business School - IESE Cities in Motion Index40
020406080
100
Singapore-Asia PacificEconomy
Human Capital
International Outreach
Mobility andTransportation
Environment
Technology
UrbanPlanning
PublicManagement
Governance
SocialCohesion
020406080
100
Munich-GermanyEconomy
Human Capital
International Outreach
Mobility andTransportation
Environment
Technology
UrbanPlanning
PublicManagement
Governance
SocialCohesion
020406080
100
Boston-USAEconomy
Human Capital
International Outreach
Mobility andTransportation
Environment
Technology
UrbanPlanning
PublicManagement
Governance
SocialCohesion
020406080
100
Zurich-SwitzerlandEconomy
Human Capital
International Outreach
Mobility andTransportation
Environment
Technology
UrbanPlanning
PublicManagement
Governance
SocialCohesion
020406080
100
Helsinki-FinlandEconomy
Human Capital
International Outreach
Mobility andTransportation
Environment
Technology
UrbanPlanning
PublicManagement
Governance
SocialCohesion
020406080
100
Oslo-NorwayEconomy
Human Capital
International Outreach
Mobility andTransportation
Environment
Technology
UrbanPlanning
PublicManagement
Governance
SocialCohesion
020406080
100
Tokyo-JapanEconomy
Human Capital
International Outreach
Mobility andTransportation
Environment
Technology
UrbanPlanning
PublicManagement
Governance
SocialCohesion
020406080
100
Geneva-SwitzerlandEconomy
Human Capital
International Outreach
Mobility andTransportation
Environment
Technology
UrbanPlanning
PublicManagement
Governance
SocialCohesion

IESE Business School - IESE Cities in Motion Index41
020406080
100
Hong Kong, China-Asia PacificEconomy
Human Capital
International Outreach
Mobility andTransportation
Environment
Technology
UrbanPlanning
PublicManagement
Governance
SocialCohesion
020406080
100
Chicago-USAEconomy
Human Capital
International Outreach
Mobility andTransportation
Environment
Technology
UrbanPlanning
PublicManagement
Governance
SocialCohesion
020406080
100
Washington-USAEconomy
Human Capital
International Outreach
Mobility andTransportation
Environment
Technology
UrbanPlanning
PublicManagement
Governance
SocialCohesion
020406080
100
Liverpool-UKEconomy
Human Capital
International Outreach
Mobility andTransportation
Environment
Technology
UrbanPlanning
PublicManagement
Governance
SocialCohesion
020406080
100
San Francisco-USAEconomy
Human Capital
International Outreach
Mobility andTransportation
Environment
Technology
UrbanPlanning
PublicManagement
Governance
SocialCohesion
020406080
100
Dublin-IrelandEconomy
Human Capital
International Outreach
Mobility andTransportation
Environment
Technology
UrbanPlanning
PublicManagement
Governance
SocialCohesion
020406080
100
Copenhagen-DenmarkEconomy
Human Capital
International Outreach
Mobility andTransportation
Environment
Technology
UrbanPlanning
PublicManagement
Governance
SocialCohesion
020406080
100
Melbourne-AustraliaEconomy
Human Capital
International Outreach
Mobility andTransportation
Environment
Technology
UrbanPlanning
PublicManagement
Governance
SocialCohesion

IESE Business School - IESE Cities in Motion Index42
020406080
100
Berlin-GermanyEconomy
Human Capital
International Outreach
Mobility andTransportation
Environment
Technology
UrbanPlanning
PublicManagement
Governance
SocialCohesion
020406080
100
Glasgow-UKEconomy
Human Capital
International Outreach
Mobility andTransportation
Environment
Technology
UrbanPlanning
PublicManagement
Governance
SocialCohesion
020406080
100
Sydney-AustraliaEconomy
Human Capital
International Outreach
Mobility andTransportation
Environment
Technology
UrbanPlanning
PublicManagement
Governance
SocialCohesion
020406080
100
Frankfurt-GermanyEconomy
Human Capital
International Outreach
Mobility andTransportation
Environment
Technology
UrbanPlanning
PublicManagement
Governance
SocialCohesion
020406080
100
Basel-SwitzerlandEconomy
Human Capital
International Outreach
Mobility andTransportation
Environment
Technology
UrbanPlanning
PublicManagement
Governance
SocialCohesion
020406080
100
Dubai-United Arab EmiratesEconomy
Human Capital
International Outreach
Mobility andTransportation
Environment
Technology
UrbanPlanning
PublicManagement
Governance
SocialCohesion
020406080
100
Birmingham-UKEconomy
Human Capital
International Outreach
Mobility andTransportation
Environment
Technology
UrbanPlanning
PublicManagement
Governance
SocialCohesion
020406080
100
Stockholm-SwedenEconomy
Human Capital
International Outreach
Mobility andTransportation
Environment
Technology
UrbanPlanning
PublicManagement
Governance
SocialCohesion

IESE Business School - IESE Cities in Motion Index43
020406080
100
Brussels-BelgiumEconomy
Human Capital
International Outreach
Mobility andTransportation
Environment
Technology
UrbanPlanning
PublicManagement
Governance
SocialCohesion
020406080
100
Barcelona-SpainEconomy
Human Capital
International Outreach
Mobility andTransportation
Environment
Technology
UrbanPlanning
PublicManagement
Governance
SocialCohesion
020406080
100
Madrid-SpainEconomy
Human Capital
International Outreach
Mobility andTransportation
Environment
Technology
UrbanPlanning
PublicManagement
Governance
SocialCohesion
020406080
100
Toronto-CanadaEconomy
Human Capital
International Outreach
Mobility andTransportation
Environment
Technology
UrbanPlanning
PublicManagement
Governance
SocialCohesion
020406080
100
Hamburg-GermanyEconomy
Human Capital
International Outreach
Mobility andTransportation
Environment
Technology
UrbanPlanning
PublicManagement
Governance
SocialCohesion
020406080
100
Auckland-New ZealandEconomy
Human Capital
International Outreach
Mobility andTransportation
Environment
Technology
UrbanPlanning
PublicManagement
Governance
SocialCohesion
020406080
100
Manchester-UKEconomy
Human Capital
International Outreach
Mobility andTransportation
Environment
Technology
UrbanPlanning
PublicManagement
Governance
SocialCohesion
020406080
100
Tel Aviv-IsraelEconomy
Human Capital
International Outreach
Mobility andTransportation
Environment
Technology
UrbanPlanning
PublicManagement
Governance
SocialCohesion

IESE Business School - IESE Cities in Motion Index44
020406080
100
Dallas-USA Economy
Human Capital
International Outreach
Mobility andTransportation
Environment
Technology
UrbanPlanning
PublicManagement
Governance
SocialCohesion
020406080
100
Los Angeles-USAEconomy
Human Capital
International Outreach
Mobility andTransportation
Environment
Technology
UrbanPlanning
PublicManagement
Governance
SocialCohesion
020406080
100
Houston-USAEconomy
Human Capital
International Outreach
Mobility andTransportation
Environment
Technology
UrbanPlanning
PublicManagement
Governance
SocialCohesion
020406080
100
Linz-AustriaEconomy
Human Capital
International Outreach
Mobility andTransportation
Environment
Technology
UrbanPlanning
PublicManagement
Governance
SocialCohesion
020406080
100
Leeds-UKEconomy
Human Capital
International Outreach
Mobility andTransportation
Environment
Technology
UrbanPlanning
PublicManagement
Governance
SocialCohesion
020406080
100
Osaka-JapanEconomy
Human Capital
International Outreach
Mobility andTransportation
Environment
Technology
UrbanPlanning
PublicManagement
Governance
SocialCohesion
020406080
100
Lyon-FranceEconomy
Human Capital
International Outreach
Mobility andTransportation
Environment
Technology
UrbanPlanning
PublicManagement
Governance
SocialCohesion
020406080
100
Nottingham-UKEconomy
Human Capital
International Outreach
Mobility andTransportation
Environment
Technology
UrbanPlanning
PublicManagement
Governance
SocialCohesion

IESE Business School - IESE Cities in Motion Index45
020406080
100
Ottawa-CanadaEconomy
Human Capital
International Outreach
Mobility andTransportation
Environment
Technology
UrbanPlanning
PublicManagement
Governance
SocialCohesion
020406080
100
Lille-FranceEconomy
Human Capital
International Outreach
Mobility andTransportation
Environment
Technology
UrbanPlanning
PublicManagement
Governance
SocialCohesion
020406080
100
Cologne-GermanyEconomy
Human Capital
International Outreach
Mobility andTransportation
Environment
Technology
UrbanPlanning
PublicManagement
Governance
SocialCohesion
020406080
100
Montreal-CanadaEconomy
Human Capital
International Outreach
Mobility andTransportation
Environment
Technology
UrbanPlanning
PublicManagement
Governance
SocialCohesion
020406080
100
Vancouver-CanadaEconomy
Human Capital
International Outreach
Mobility andTransportation
Environment
Technology
UrbanPlanning
PublicManagement
Governance
SocialCohesion
020406080
100
Gothenburg-SwedenEconomy
Human Capital
International Outreach
Mobility andTransportation
Environment
Technology
UrbanPlanning
PublicManagement
Governance
SocialCohesion
020406080
100
Eindhoven-NetherlandsEconomy
Human Capital
International Outreach
Mobility andTransportation
Environment
Technology
UrbanPlanning
PublicManagement
Governance
SocialCohesion
020406080
100
Stuttgart-GermanyEconomy
Human Capital
International Outreach
Mobility andTransportation
Environment
Technology
UrbanPlanning
PublicManagement
Governance
SocialCohesion

IESE Business School - IESE Cities in Motion Index46
020406080
100
Haifa-IsraelEconomy
Human Capital
International Outreach
Mobility andTransportation
Environment
Technology
UrbanPlanning
PublicManagement
Governance
SocialCohesion
020406080
100
Jerusalem-IsraelEconomy
Human Capital
International Outreach
Mobility andTransportation
Environment
Technology
UrbanPlanning
PublicManagement
Governance
SocialCohesion
020406080
100
Philadelphia-USAEconomy
Human Capital
International Outreach
Mobility andTransportation
Environment
Technology
UrbanPlanning
PublicManagement
Governance
SocialCohesion
020406080
100
Marseille-FranceEconomy
Human Capital
International Outreach
Mobility andTransportation
Environment
Technology
UrbanPlanning
PublicManagement
Governance
SocialCohesion
020406080
100
Duisburg-GermanyEconomy
Human Capital
International Outreach
Mobility andTransportation
Environment
Technology
UrbanPlanning
PublicManagement
Governance
SocialCohesion
020406080
100
Lisbon-PortugalEconomy
Human Capital
International Outreach
Mobility andTransportation
Environment
Technology
UrbanPlanning
PublicManagement
Governance
SocialCohesion
020406080
100
Abu Dhabi-Arab EmiratesEconomy
Human Capital
International Outreach
Mobility andTransportation
Environment
Technology
UrbanPlanning
PublicManagement
Governance
SocialCohesion
020406080
100
Prague-Czech RepublicEconomy
Human Capital
International Outreach
Mobility andTransportation
Environment
Technology
UrbanPlanning
PublicManagement
Governance
SocialCohesion

IESE Business School - IESE Cities in Motion Index47
020406080
100
Budapest-HungaryEconomy
Human Capital
International Outreach
Mobility andTransportation
Environment
Technology
UrbanPlanning
PublicManagement
Governance
SocialCohesion
020406080
100
Nice-FranceEconomy
Human Capital
International Outreach
Mobility andTransportation
Environment
Technology
UrbanPlanning
PublicManagement
Governance
SocialCohesion
020406080
100
Busan-South KoreaEconomy
Human Capital
International Outreach
Mobility andTransportation
Environment
Technology
UrbanPlanning
PublicManagement
Governance
SocialCohesion
020406080
100
Roma-ItalyEconomy
Human Capital
International Outreach
Mobility andTransportation
Environment
Technology
UrbanPlanning
PublicManagement
Governance
SocialCohesion
020406080
100
Daegu-South KoreaEconomy
Human Capital
International Outreach
Mobility andTransportation
Environment
Technology
UrbanPlanning
PublicManagement
Governance
SocialCohesion
020406080
100
Miami-USAEconomy
Human Capital
International Outreach
Mobility andTransportation
Environment
Technology
UrbanPlanning
PublicManagement
Governance
SocialCohesion
020406080
100
Florence-ItalyEconomy
Human Capital
International Outreach
Mobility andTransportation
Environment
Technology
UrbanPlanning
PublicManagement
Governance
SocialCohesion
020406080
100
Phoenix-USAEconomy
Human Capital
International Outreach
Mobility andTransportation
Environment
Technology
UrbanPlanning
PublicManagement
Governance
SocialCohesion

IESE Business School - IESE Cities in Motion Index48
020406080
100
Valencia-SpainEconomy
Human Capital
International Outreach
Mobility andTransportation
Environment
Technology
UrbanPlanning
PublicManagement
Governance
SocialCohesion
020406080
100
Taipei-TaiwanEconomy
Human Capital
International Outreach
Mobility andTransportation
Environment
Technology
UrbanPlanning
PublicManagement
Governance
SocialCohesion
020406080
100
A Coruña-SpainEconomy
Human Capital
International Outreach
Mobility andTransportation
Environment
Technology
UrbanPlanning
PublicManagement
Governance
SocialCohesion
020406080
100
Bilbao-SpainEconomy
Human Capital
International Outreach
Mobility andTransportation
Environment
Technology
UrbanPlanning
PublicManagement
Governance
SocialCohesion
020406080
100
Riga-LatviaEconomy
Human Capital
International Outreach
Mobility andTransportation
Environment
Technology
UrbanPlanning
PublicManagement
Governance
SocialCohesion
020406080
100
Turin-ItalyEconomy
Human Capital
International Outreach
Mobility andTransportation
Environment
Technology
UrbanPlanning
PublicManagement
Governance
SocialCohesion
020406080
100
Milan-ItalyEconomy
Human Capital
International Outreach
Mobility andTransportation
Environment
Technology
UrbanPlanning
PublicManagement
Governance
SocialCohesion
020406080
100
Warsaw-PolandEconomy
Human Capital
International Outreach
Mobility andTransportation
Environment
Technology
UrbanPlanning
PublicManagement
Governance
SocialCohesion

IESE Business School - IESE Cities in Motion Index49
020406080
100
Porto-PortugalEconomy
Human Capital
International Outreach
Mobility andTransportation
Environment
Technology
UrbanPlanning
PublicManagement
Governance
SocialCohesion
020406080
100
Istanbul-TurkeyEconomy
Human Capital
International Outreach
Mobility andTransportation
Environment
Technology
UrbanPlanning
PublicManagement
Governance
SocialCohesion
020406080
100
Shanghai-ChinaEconomy
Human Capital
International Outreach
Mobility andTransportation
Environment
Technology
UrbanPlanning
PublicManagement
Governance
SocialCohesion
020406080
100
Bangkok-ThailandEconomy
Human Capital
International Outreach
Mobility andTransportation
Environment
Technology
UrbanPlanning
PublicManagement
Governance
SocialCohesion
020406080
100
Sofia-BulgariaEconomy
Human Capital
International Outreach
Mobility andTransportation
Environment
Technology
UrbanPlanning
PublicManagement
Governance
SocialCohesion
020406080
100
Santiago-ChileEconomy
Human Capital
International Outreach
Mobility andTransportation
Environment
Technology
UrbanPlanning
PublicManagement
Governance
SocialCohesion
020406080
100
Sevilla-SpainEconomy
Human Capital
International Outreach
Mobility andTransportation
Environment
Technology
UrbanPlanning
PublicManagement
Governance
SocialCohesion
020406080
100
Malaga-SpainEconomy
Human Capital
International Outreach
Mobility andTransportation
Environment
Technology
UrbanPlanning
PublicManagement
Governance
SocialCohesion

IESE Business School - IESE Cities in Motion Index50
020406080
100
Daejeon South-KoreaEconomy
Human Capital
International Outreach
Mobility andTransportation
Environment
Technology
UrbanPlanning
PublicManagement
Governance
SocialCohesion
020406080
100
Moscow-RussiaEconomy
Human Capital
International Outreach
Mobility andTransportation
Environment
Technology
UrbanPlanning
PublicManagement
Governance
SocialCohesion
020406080
100
Moscow-RussiaEconomy
Human Capital
International Outreach
Mobility andTransportation
Environment
Technology
UrbanPlanning
PublicManagement
Governance
SocialCohesion
020406080
100
Athens-GreeceEconomy
Human Capital
International Outreach
Mobility andTransportation
Environment
Technology
UrbanPlanning
PublicManagement
Governance
SocialCohesion
020406080
100
Monterrey-MexicoEconomy
Human Capital
International Outreach
Mobility andTransportation
Environment
Technology
UrbanPlanning
PublicManagement
Governance
SocialCohesion
020406080
100
Wroclaw-PolandEconomy
Human Capital
International Outreach
Mobility andTransportation
Environment
Technology
UrbanPlanning
PublicManagement
Governance
SocialCohesion
020406080
100
Ljubljana-SloveniaEconomy
Human Capital
International Outreach
Mobility andTransportation
Environment
Technology
UrbanPlanning
PublicManagement
Governance
SocialCohesion
020406080
100
Kuala Lumpur-MalaysiaEconomy
Human Capital
International Outreach
Mobility andTransportation
Environment
Technology
UrbanPlanning
PublicManagement
Governance
SocialCohesion

IESE Business School - IESE Cities in Motion Index51
020406080
100
Bogota-ColombiaEconomy
Human Capital
International Outreach
Mobility andTransportation
Environment
Technology
UrbanPlanning
PublicManagement
Governance
SocialCohesion
020406080
100
Bursa-TurkeyEconomy
Human Capital
International Outreach
Mobility andTransportation
Environment
Technology
UrbanPlanning
PublicManagement
Governance
SocialCohesion
020406080
100
Beijing-ChinaEconomy
Human Capital
International Outreach
Mobility andTransportation
Environment
Technology
UrbanPlanning
PublicManagement
Governance
SocialCohesion
020406080
100
Doha-QatarEconomy
Human Capital
International Outreach
Mobility andTransportation
Environment
Technology
UrbanPlanning
PublicManagement
Governance
SocialCohesion
020406080
100
Taichung-TaiwanEconomy
Human Capital
International Outreach
Mobility andTransportation
Environment
Technology
UrbanPlanning
PublicManagement
Governance
SocialCohesion
020406080
100
São Paulo-BrazilEconomy
Human Capital
International Outreach
Mobility andTransportation
Environment
Technology
UrbanPlanning
PublicManagement
Governance
SocialCohesion
020406080
100
Mexico, D.F.-MexicoEconomy
Human Capital
International Outreach
Mobility andTransportation
Environment
Technology
UrbanPlanning
PublicManagement
Governance
SocialCohesion
020406080
100
Naples-ItalyEconomy
Human Capital
International Outreach
Mobility andTransportation
Environment
Technology
UrbanPlanning
PublicManagement
Governance
SocialCohesion

IESE Business School - IESE Cities in Motion Index52
020406080
100
Riyadh-Saudi ArabiaEconomy
Human Capital
International Outreach
Mobility andTransportation
Environment
Technology
UrbanPlanning
PublicManagement
Governance
SocialCohesion
020406080
100
Cordoba-ArgentinaEconomy
Human Capital
International Outreach
Mobility andTransportation
Environment
Technology
UrbanPlanning
PublicManagement
Governance
SocialCohesion
020406080
100
Medellin-ColombiaEconomy
Human Capital
International Outreach
Mobility andTransportation
Environment
Technology
UrbanPlanning
PublicManagement
Governance
SocialCohesion
020406080
100
Ankara-TurkeyEconomy
Human Capital
International Outreach
Mobility andTransportation
Environment
Technology
UrbanPlanning
PublicManagement
Governance
SocialCohesion
020406080
100
Montevideo-UruguayEconomy
Human Capital
International Outreach
Mobility andTransportation
Environment
Technology
UrbanPlanning
PublicManagement
Governance
SocialCohesion
020406080
100
Cali-ColombiaEconomy
Human Capital
International Outreach
Mobility andTransportation
Environment
Technology
UrbanPlanning
PublicManagement
Governance
SocialCohesion
020406080
100
Lima-PeruEconomy
Human Capital
International Outreach
Mobility andTransportation
Environment
Technology
UrbanPlanning
PublicManagement
Governance
SocialCohesion
020406080
100
Guangzhou-ChinaEconomy
Human Capital
International Outreach
Mobility andTransportation
Environment
Technology
UrbanPlanning
PublicManagement
Governance
SocialCohesion

IESE Business School - IESE Cities in Motion Index53
020406080
100
Guadalajara-MexicoEconomy
Human Capital
International Outreach
Mobility andTransportation
Environment
Technology
UrbanPlanning
PublicManagement
Governance
SocialCohesion
020406080
100
Rosario-ArgentinaEconomy
Human Capital
International Outreach
Mobility andTransportation
Environment
Technology
UrbanPlanning
PublicManagement
Governance
SocialCohesion
020406080
100
Saint Petersburg-RussiaEconomy
Human Capital
International Outreach
Mobility andTransportation
Environment
Technology
UrbanPlanning
PublicManagement
Governance
SocialCohesion
020406080
100
Jeddah-Saudi ArabiaEconomy
Human Capital
International Outreach
Mobility andTransportation
Environment
Technology
UrbanPlanning
PublicManagement
Governance
SocialCohesion
020406080
100
Cape Town-South AfricaEconomy
Human Capital
International Outreach
Mobility andTransportation
Environment
Technology
UrbanPlanning
PublicManagement
Governance
SocialCohesion
020406080
100
Shenzhen-ChinaEconomy
Human Capital
International Outreach
Mobility andTransportation
Environment
Technology
UrbanPlanning
PublicManagement
Governance
SocialCohesion
020406080
100
Curitiba-BrazilEconomy
Human Capital
International Outreach
Mobility andTransportation
Environment
Technology
UrbanPlanning
PublicManagement
Governance
SocialCohesion
020406080
100
Brasilia-BrazilEconomy
Human Capital
International Outreach
Mobility andTransportation
Environment
Technology
UrbanPlanning
PublicManagement
Governance
SocialCohesion

IESE Business School - IESE Cities in Motion Index54
020406080
100
Quito-EcuadorEconomy
Human Capital
International Outreach
Mobility andTransportation
Environment
Technology
UrbanPlanning
PublicManagement
Governance
SocialCohesion
020406080
100
Tainan-TaiwanEconomy
Human Capital
International Outreach
Mobility andTransportation
Environment
Technology
UrbanPlanning
PublicManagement
Governance
SocialCohesion
020406080
100
Jakarta-IndonesiaEconomy
Human Capital
International Outreach
Mobility andTransportation
Environment
Technology
UrbanPlanning
PublicManagement
Governance
SocialCohesion
020406080
100
Durban-South AfricaEconomy
Human Capital
International Outreach
Mobility andTransportation
Environment
Technology
UrbanPlanning
PublicManagement
Governance
SocialCohesion
020406080
100
Porto Alegre-BrazilEconomy
Human Capital
International Outreach
Mobility andTransportation
Environment
Technology
UrbanPlanning
PublicManagement
Governance
SocialCohesion
020406080
100
Fortaleza-BrazilEconomy
Human Capital
International Outreach
Mobility andTransportation
Environment
Technology
UrbanPlanning
PublicManagement
Governance
SocialCohesion
020406080
100
Kaohsiung-TaiwanEconomy
Human Capital
International Outreach
Mobility andTransportation
Environment
Technology
UrbanPlanning
PublicManagement
Governance
SocialCohesion
020406080
100
Sarajevo-Bosnia and HerzegovinaEconomy
Human Capital
International Outreach
Mobility andTransportation
Environment
Technology
UrbanPlanning
PublicManagement
Governance
SocialCohesion
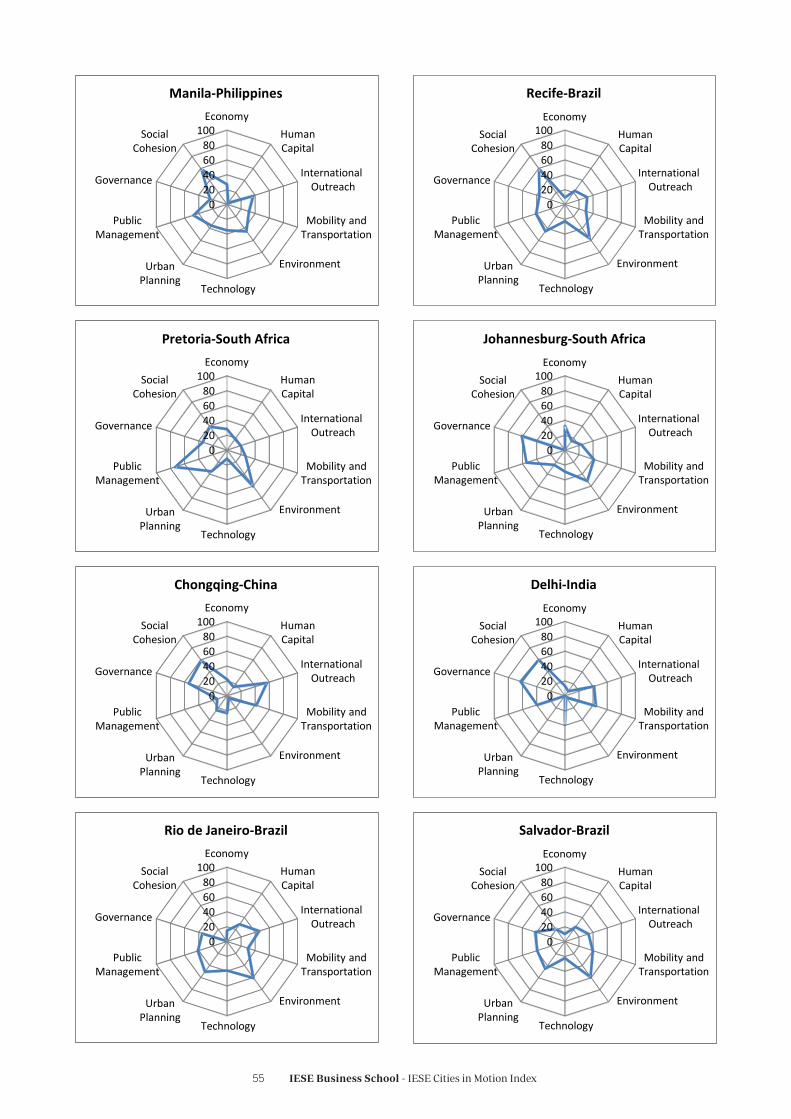
IESE Business School - IESE Cities in Motion Index55
020406080
100
Pretoria-South AfricaEconomy
Human Capital
International Outreach
Mobility andTransportation
Environment
Technology
UrbanPlanning
PublicManagement
Governance
SocialCohesion
020406080
100
Johannesburg-South AfricaEconomy
Human Capital
International Outreach
Mobility andTransportation
Environment
Technology
UrbanPlanning
PublicManagement
Governance
SocialCohesion
020406080
100
Chongqing-ChinaEconomy
Human Capital
International Outreach
Mobility andTransportation
Environment
Technology
UrbanPlanning
PublicManagement
Governance
SocialCohesion
020406080
100
Delhi-IndiaEconomy
Human Capital
International Outreach
Mobility andTransportation
Environment
Technology
UrbanPlanning
PublicManagement
Governance
SocialCohesion
020406080
100
Rio de Janeiro-BrazilEconomy
Human Capital
International Outreach
Mobility andTransportation
Environment
Technology
UrbanPlanning
PublicManagement
Governance
SocialCohesion
020406080
100
Salvador-BrazilEconomy
Human Capital
International Outreach
Mobility andTransportation
Environment
Technology
UrbanPlanning
PublicManagement
Governance
SocialCohesion
020406080
100
Manila-PhilippinesEconomy
Human Capital
International Outreach
Mobility andTransportation
Environment
Technology
UrbanPlanning
PublicManagement
Governance
SocialCohesion
020406080
100
Recife-BrazilEconomy
Human Capital
International Outreach
Mobility andTransportation
Environment
Technology
UrbanPlanning
PublicManagement
Governance
SocialCohesion

IESE Business School - IESE Cities in Motion Index56
020406080
100
Cairo-EgyptEconomy
Human Capital
International Outreach
Mobility andTransportation
Environment
Technology
UrbanPlanning
PublicManagement
Governance
SocialCohesion
020406080
100
Suzhou-ChinaEconomy
Human Capital
International Outreach
Mobility andTransportation
Environment
Technology
UrbanPlanning
PublicManagement
Governance
SocialCohesion
020406080
100
Belo Horizonte-BrazilEconomy
Human Capital
International Outreach
Mobility andTransportation
Environment
Technology
UrbanPlanning
PublicManagement
Governance
SocialCohesion
020406080
100
Bangalore-IndiaEconomy
Human Capital
International Outreach
Mobility andTransportation
Environment
Technology
UrbanPlanning
PublicManagement
Governance
SocialCohesion
020406080
100
Mumbai-IndiaEconomy
Human Capital
International Outreach
Mobility andTransportation
Environment
Technology
UrbanPlanning
PublicManagement
Governance
SocialCohesion
020406080
100
Shenyang-ChinaEconomy
Human Capital
International Outreach
Mobility andTransportation
Environment
Technology
UrbanPlanning
PublicManagement
Governance
SocialCohesion
020406080
100
Tianjin-ChinaEconomy
Human Capital
International Outreach
Mobility andTransportation
Environment
Technology
UrbanPlanning
PublicManagement
Governance
SocialCohesion
020406080
100
Wuhan-ChinaEconomy
Human Capital
International Outreach
Mobility andTransportation
Environment
Technology
UrbanPlanning
PublicManagement
Governance
SocialCohesion

IESE Business School - IESE Cities in Motion Index57
020406080
100
Santo Domingo-Dominican RepublicEconomy
Human Capital
International Outreach
Mobility andTransportation
Environment
Technology
UrbanPlanning
PublicManagement
Governance
SocialCohesion
020406080
100
Harbin-ChinaEconomy
Human Capital
International Outreach
Mobility andTransportation
Environment
Technology
UrbanPlanning
PublicManagement
Governance
SocialCohesion
020406080
100
Caracas-VenezuelaEconomy
Human Capital
International Outreach
Mobility andTransportation
Environment
Technology
UrbanPlanning
PublicManagement
Governance
SocialCohesion
020406080
100
Calcutta-IndiaEconomy
Human Capital
International Outreach
Mobility andTransportation
Environment
Technology
UrbanPlanning
PublicManagement
Governance
SocialCohesion
020406080
100
Alexandria-EgyptEconomy
Human Capital
International Outreach
Mobility andTransportation
Environment
Technology
UrbanPlanning
PublicManagement
Governance
SocialCohesion
020406080
100
La Paz-BoliviaEconomy
Human Capital
International Outreach
Mobility andTransportation
Environment
Technology
UrbanPlanning
PublicManagement
Governance
SocialCohesion

BarcelonaAv. Pearson, 21 08034 Barcelona, Spain (+ 34) 93 253 42 00
MadridCamino del Cerro del Águila, 3 28023 Madrid, Spain(+34) 91 211 30 00
New York165 W. 57th Street New York, NY 10019-2201 USA(+1) 646 346 8850
MunichMaria-Theresia-Straße 1581675 Munich, Germany(+49) 89 24 20 97 90
Sao PauloRua Martiniano de Carvalho, 573 Bela Vista 01321001 Sao Paulo, Brazil(+55) 11 3177 8221
Follow us
IESE Business School
IESE Business School
iesebs
iese
Copyright © 2022 FDOKUMEN

