


Bahasa
Halaman
Hukum


This article was downloaded by: [McGill University Library]On: 31 October 2013, At: 08:00Publisher: Taylor & FrancisInforma Ltd Registered in England and Wales Registered Number: 1072954 Registered office: Mortimer House,37-41 Mortimer Street, London W1T 3JH, UK
Computer Methods in Biomechanics and BiomedicalEngineeringPublication details, including instructions for authors and subscription information:http://www.tandfonline.com/loi/gcmb20
Identification process based on shear wavepropagation within a phantom using finite elementmodelling and magnetic resonance elastographyGwladys E. Leclerca, Fabrice Charleuxb, Marie-Christine Ho Ba Thoa & Sabine F. Bensamouna
a Laboratoire de BioMécanique et BioIngénierie, Centre de Recherches de Royallieu,Université de Technologie de Compiègne (UTC), UMR CNRS 7338, Rue Personne de Roberval,BP 20529, 60205, Compiègne Cedex, Franceb ACRIM-Polyclinique Saint Côme, Compiègne, FrancePublished online: 15 Aug 2013.
To cite this article: Gwladys E. Leclerc, Fabrice Charleux, Marie-Christine Ho Ba Tho & Sabine F. Bensamoun , ComputerMethods in Biomechanics and Biomedical Engineering (2013): Identification process based on shear wave propagation withina phantom using finite element modelling and magnetic resonance elastography, Computer Methods in Biomechanics andBiomedical Engineering, DOI: 10.1080/10255842.2013.818664
To link to this article: http://dx.doi.org/10.1080/10255842.2013.818664
PLEASE SCROLL DOWN FOR ARTICLE
Taylor & Francis makes every effort to ensure the accuracy of all the information (the “Content”) containedin the publications on our platform. However, Taylor & Francis, our agents, and our licensors make norepresentations or warranties whatsoever as to the accuracy, completeness, or suitability for any purpose of theContent. Any opinions and views expressed in this publication are the opinions and views of the authors, andare not the views of or endorsed by Taylor & Francis. The accuracy of the Content should not be relied upon andshould be independently verified with primary sources of information. Taylor and Francis shall not be liable forany losses, actions, claims, proceedings, demands, costs, expenses, damages, and other liabilities whatsoeveror howsoever caused arising directly or indirectly in connection with, in relation to or arising out of the use ofthe Content.
This article may be used for research, teaching, and private study purposes. Any substantial or systematicreproduction, redistribution, reselling, loan, sub-licensing, systematic supply, or distribution in anyform to anyone is expressly forbidden. Terms & Conditions of access and use can be found at http://www.tandfonline.com/page/terms-and-conditions
Identification process based on shear wave propagation within a phantom using finite elementmodelling and magnetic resonance elastography
Gwladys E. Leclerca, Fabrice Charleuxb, Marie-Christine Ho Ba Thoa and Sabine F. Bensamouna*aLaboratoire de BioMecanique et BioIngenierie, Centre de Recherches de Royallieu, Universite de Technologie de Compiegne (UTC),
UMR CNRS 7338, Rue Personne de Roberval, BP 20529, 60205 Compiegne Cedex, FrancebACRIM-Polyclinique Saint Come, Compiegne, France
(Received 1 August 2012; final version received 19 June 2013)
Magnetic resonance elastography (MRE), based on shear wave propagation generated by a specific driver, is a non-invasiveexam performed in clinical practice to improve the liver diagnosis. The purpose was to develop a finite element (FE)identification method for the mechanical characterisation of phantom mimicking soft tissues investigated with MREtechnique. Thus, a 3D FE phantom model, composed of the realistic MRE liver boundary conditions, was developed tosimulate the shear wave propagation with the software ABAQUS. The assumptions of homogeneity and elasticity wereapplied to the FE phantom model. Different ranges of mesh size, density and Poisson’s ratio were tested in order to developthe most representative FE phantom model. The simulated wave displacement was visualised with a dynamic implicitanalysis. Subsequently, an identification process was performed with a cost function and an optimisation loop provided theoptimal elastic properties of the phantom. The present identification process was validated on a phantom model, and theperspective will be to apply this method on abdominal tissues for the set-up of new clinical MRE protocols that could beapplied for the follow-up of the effects of treatments.
Keywords: magnetic resonance elastography; finite element modelling; phantom; identification process; mechanicalproperties
1. Introduction
Clinical diagnosis established from imaging tests (MRI, CT
scan and ultrasound) is primarily based on an analysis of the
structural properties of the tissue represented by its texture
and morphology (Zuberi et al. 1999; Van Beers et al. 2012).
In addition to the common anatomical acquisition, a second
image can now reveal the cartography of the tissue stiffness,
provided by clinical elastography techniques (Bensamoun
et al. 2006, 2008; Shinohara et al. 2010; Niitsu et al. 2011).
Thus, the association of the morphological and mechanical
properties of the tissue has allowed the clinician to better
diagnose, in a non-invasive way, the pathology, such as the
stage of fibrosis in the liver (Huwart et al. 2008). To further
improve the medical diagnosis, the structural and functional
properties were then implemented in constitutive models in
order to accurately simulate the tissue behaviour used for
surgery training and planning (Mazza et al. 2008; Nava et al.
2008).
Finite element modelling (FEM) was combined with
clinical imaging techniques such as elastography, based on
the shear wave propagation within the soft tissue, in order
to simulate the propagation of the wave. From this
displacement, the mechanical properties could be either
experimentally measured or numerically determined using
finite element (FE) inversion algorithms (Perriez et al.
2010; Doyley 2012). Thus, the V-shaped wave patterns
observed in the biceps brachii along the direction of
muscle fibres were simulated through 3D-coupled
harmonic oscillator calculations (Sack et al. 2002)
including the muscle morphology. In addition to the
simulation of complex wave patterns, computer models
were used to simulate in vivo experiments in order to
provide an evaluation of the method. Indeed, in vivoMRE
protocols can be difficult to set-up for certain organs
including the brain (Atay et al. 2008; Clayton et al. 2011)
or for the analysis of the atherosclerotic plaque (Thomas-
Seale et al. 2011).
Since 1995 (Muthupillai et al. 1995), the MRE
technique has demonstrated its capability to measure the
mechanical properties of a large range of soft tissues
(muscle, cartilage, lung, heart and carotid artery) and was
recently recognised as a clinical test for the liver. In order
to implement other magnetic resonance elastography
(MRE) clinical protocols, FEM was used to determine the
feasibility of the MRE method to characterise the eye
(Litwiller et al. 2010) and the brain (Clayton et al. 2011).
In parallel to in vivo experiments performed with
MRE, FE simulation was used for the validation of the
MRE stiffness measurement (Atay et al. 2008) through the
development of different types of gel phantoms (bovine,
q 2013 Taylor & Francis
*Corresponding author. Email: [email protected]
Computer Methods in Biomechanics and Biomedical Engineering, 2013
http://dx.doi.org/10.1080/10255842.2013.818664
Dow
nloa
ded
by [
McG
ill U
nive
rsity
Lib
rary
] at
08:
00 3
1 O
ctob
er 2
013

agarose and wirosil). Furthermore, phantoms were com-
posed of taut band (Chen et al. 2007) to mimic the wave
patternswithin the trapeziusmuscle, ormadewith inclusions
(Glaser et al. 2006) to simulate the tissue behaviour within
breast cancer. In addition, various boundary conditions of
MRE technique can be tested on a phantom before applying
in vivo experiments, and the use of FEM aids in
understanding the shear wave behaviour (Chen et al. 2005,
2006) leading to the stiffness tissue measurement.
The purpose was to develop an FE identification method
for the characterisation of the mechanical properties with
MRE technique. This inverse method was validated on a
phantommodel,mimicking soft tissues, through a simulation
of the shear wave propagation performed with an FE model
composed of realistic MRE boundary conditions.
2. Materials and methods
2.1 MRE test performed on phantom
It must be noted that the following protocol was described
in a previous study (Leclerc et al. 2012) and is briefly
summarised here. A homogeneous phantom (diameter ¼25 cm, height ¼ 5 cm), composed of 45% softener and 55%
liquid plastic (LureCraft, LaGrande, OR, USA) was created
tomimic the stiffness of soft biological tissues. The phantom
was placed inside a 1.5T MRI machine (GE, Signa HDx,
Milwaukee, WI, USA) and shear waves were generated
through the phantom with a cylindrical pneumatic driver as
shown in Figure 1(A). This driver is composed of a thin
flexiblemembrane (10mm)made of polycarbonate enclosed
by rigid walls (Ehman et al. 2005), and the maximal
displacement of the membrane was 39.2mm for a frequency
( f) of 60Hz (Leclerc et al. 2012). A head coil was used and
MRE imageswere collectedwith a gradient echo sequence, a
flip angle of 458, a 30 cm £ 30 cm field of view and a 256
£ 64 acquisition matrix. Four offsets were recorded with a
echo time (TE) corresponding to the minimum TE (28ms)
allowing for motion encoding, a repetition time equal to
50ms and an acquisition time of 38ms. MRE technique
providedphase images showing the shearwavedisplacement
within the phantom (Figure 1(B)). A white profile was
manually placed in the radial direction of the shear wave
propagation. The wavelength (l) was measured as the
distance between two consecutive peaks, and the elastic
property (shear stiffness: m) of the phantom was calculated
with the following equation: m ¼ rl 2f 2 (r ¼ 1000kg/m3
the density of the phantom). It is also assumed that the
phantom is composed of an isotropic, homogeneous and
elastic media.
2.2 FE models
To simulate the propagation of the shear wave through the
phantom, a 3D FE model, composed of two FE models
represented by the exciting membrane of the driver
(Figure 1(C)) and the phantom (Figure 1(D)), was
developed with the software ABAQUS 6.9-1 Standard
(Simulia Dassault Systems, Providence, RI, USA).
The FE model of the membrane was represented with
the same material properties and boundary conditions as
the one that constituted the MRE liver clinical exam
(Leclerc et al. 2013). Thus, a cylindrical shell with a 16 cm
diameter and a 10mm thickness (Ehman et al. 2005) was
numerically generated (Figure 1(C)). The membrane was
meshed with S4R (four-node shell) elements of 10mm and
the prescribed mechanical properties were taken from the
literature (Trotignon et al. 1982) and fixed to 2400MPa for
the Young’s modulus (E), to 0.37 for the Poisson’s ratio (n)and to 1200 kg/m3 for the density. Realistic boundary
conditions were imposed to the membrane’s model, i.e.
edges clamped, a mechanical excitation varying sinusoid-
ally at 60Hz in the Z-direction with a corresponding
vertical displacement (UZ) imposed on each node (Figure 1
(C)). This displacement was obtained from the theoretical
bending definition for a cylindrical, isotropic, homo-
geneous plate subjected to a uniform pressure with
clamped edges in cylindrical coordinates, associated with
a bending rigidity. In a previous study (Leclerc et al. 2012),
a mapping of the displacement of the membrane was
established and a maximal deflection of 39.2mm was
found at the centre of the membrane, for a mechanical
excitation of 60Hz.
The FE model of the phantom (Figure 1(D)) was
modelled as a 3D homogeneous, isotropic cylinder
(diameter: 25 cm and height: 5 cm) and different densities,
close to the soft tissues, were tested (range: 900–1100 kg/
m3) to match with the experimental shear wave
propagation. The FE mesh was composed of C3D8R
(eight-node linear brick) elements and different mesh sizes,
10mm (corresponding to the membrane mesh size), 5 and
2mm, were tested in order to find a compromise between
the accuracy of the simulated displacement and the
calculation time. In addition, due to the assumption that
the phantom was almost incompressible (n ¼ 0.5),
different Poisson’s ratios (0.49, 0.495 and 0.499) were
tested. According to the stiffness referenced in the literature
(Huwart et al. 2008; Bensamoun et al. 2011) for soft
biological tissues, the elastic properties of the phantom,
represented by theYoung’smodulus (EPhantom), varied from
0.1 to 30 kPa (E ¼ 3m therefore 0.03 , m , 10 kPa) with
an increment of 0.1 kPa.
The FE membrane and the FE phantom models
(Figure 1(E)) were combined using a tie constraint in
order to observe the propagation of the shear wave
through the plastic phantom, and only the outer base of
the phantom was fixed in all directions (UX ¼ UY ¼UZ ¼ 0) (Figure 1(D)). The tie constraint consisted of
putting in contact a master surface (membrane) to a slave
surface (phantom) in ABAQUS software. To reduce the
G.E. Leclerc et al.2
Dow
nloa
ded
by [
McG
ill U
nive
rsity
Lib
rary
] at
08:
00 3
1 O
ctob
er 2
013

resolution time (CPU time) of the 3D FE model, a 2D
cross-sectional FE model (Figure 1(E)), represented the
membrane and the phantom, was performed with an
axisymmetric assumption. The dimensions, the mechan-
ical properties and the boundary conditions of the 2D
cross-sectional FE model were the same as those
constituted by the 3D FE model, except for the mesh
definition of the membrane (nine nodes, eight elements)
and the phantom (286 nodes, 250 elements) represented
by MAX1 (two-node linear axisymmetric membrane) and
CAX4R (four-node bilinear axisymmetric quadrilateral)
elements, respectively.
2.3 FE analysis and identification process
To visualise the propagation of the shear wave, the
FE model was analysed with a dynamic implicit analysis,
and the total time was fixed to 200ms with a time
increment of 1ms (Figure 1(F)). The material damping
was assumed to be zero. The simulated propagation of the
shear wave was visualised after nine periods in order to
obtain a steady state. Similar to the MRE post-processing
(Figure 1(B)), a profile was manually placed along the
simulated shear wave propagation in order to visualise
the simulated wave displacement (UZ_FEM) along the
profile (Figure 1(G)).
Figure 1. Identification process based on the comparison of the shear wave propagation obtained experimentally, with the MREtechnique, and numerically with the development of a finite element model.
Computer Methods in Biomechanics and Biomedical Engineering 3
Dow
nloa
ded
by [
McG
ill U
nive
rsity
Lib
rary
] at
08:
00 3
1 O
ctob
er 2
013

2.4 Identification process
The identification process (Figure 1(H)) was made with
the following cost function (J, mm2):
J ¼X
yi
UZ_MRE 2 UZ_FEM
� �2: ð1Þ
A least squared analysis based on the relative error,
between the experimental (UZ_MRE) and the 2D numerical
(UZ_FEM) wave displacements for each y-abscissa,
represented by the grey surface was performed. The
discretisation of both splines was constituted with the
same number of points.
Then, the optimisation loop was performed and the
cost function values were recorded and plotted as a
function of the shear stiffness in order to identify the
global minimum value revealing the optimal elastic
properties of the phantom (Figure 1(I)).
3. Results
3.1 Stiffness measurement with MRE technique
In vitro phase images of the phantom (Figure 1(B))
were obtained with the following boundary conditions:
frequency of 60Hz and displacement of the cylindrical
pneumatic driver membrane. The displacement of the
shear waves through the phantom was clearly pro-
pagated and the measurement of the wavelength
revealed a shear stiffness (m) of 4.16 ^ 0.14 kPa
corresponding to the material properties of different
abdominal tissues such as healthy spleen, healthy kidneys
or fibrotic liver.
3.2 Influence of mesh, Poisson’s ratio and density onthe FE phantom model
The result of the 10mm mesh size revealed a coarse
visualisation of the shear wave displacement along the
profile compared to the 5 and 2mm mesh sizes, which
provided optimal simulated displacements. However, the
5mm was applied due to the increase of the calculation
time for elements of 2mm (<28000 s) compared to
elements of 5mm (<918 s). To further reduce the
calculation time using the 5mm elements, the identifi-
cation process was performed on a 2D FE model leading to
a final calculation time of only 9 s.
The comparison between the numerical wave dis-
placements (obtained from the three different Poisson’s
ratios and densities, Figure 2(A),(B)) and the experimental
propagation revealed that the optimal Poisson’s ratio and
density were 0.499 (Figure 2(A)) and 1000 kg/m3,
(Figure 2(B)), respectively.
3.3 Optimisation of the numerical shear wavedisplacement
To visualise the simulated propagation of the shear wave
within the phantom, the increment time for the FE analysis
must be smaller than the period (16.6ms) corresponding to
the mechanical excitation (60Hz). Thus, the optimal
increment was found for 1ms. In addition, the visualisa-
tion of the simulated shear wave propagation was
performed at different times (from 150 to 167ms) in
order to identify the optimal time revealing the entire
representation of the shear wave behaviour. The results
revealed an optimal time of 163ms corresponding to 9.75
periods.
Figure 2. Comparison of the experimental (MRE) and numerical (FE) wave displacements. Different Poisson’s ratios (A) and density(B) were tested to find the most representative simulated wave behaviour to the experimental one.
G.E. Leclerc et al.4
Dow
nloa
ded
by [
McG
ill U
nive
rsity
Lib
rary
] at
08:
00 3
1 O
ctob
er 2
013
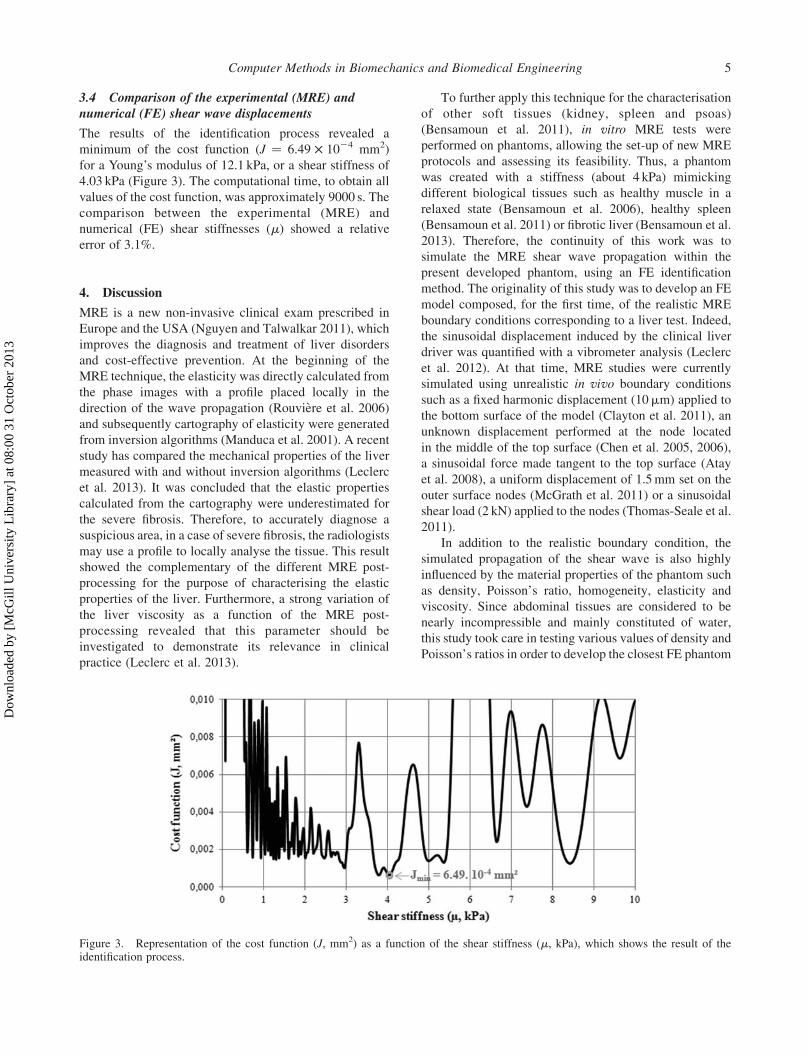
3.4 Comparison of the experimental (MRE) andnumerical (FE) shear wave displacements
The results of the identification process revealed a
minimum of the cost function (J ¼ 6.49 £ 1024 mm2)
for a Young’s modulus of 12.1 kPa, or a shear stiffness of
4.03 kPa (Figure 3). The computational time, to obtain all
values of the cost function, was approximately 9000 s. The
comparison between the experimental (MRE) and
numerical (FE) shear stiffnesses (m) showed a relative
error of 3.1%.
4. Discussion
MRE is a new non-invasive clinical exam prescribed in
Europe and the USA (Nguyen and Talwalkar 2011), which
improves the diagnosis and treatment of liver disorders
and cost-effective prevention. At the beginning of the
MRE technique, the elasticity was directly calculated from
the phase images with a profile placed locally in the
direction of the wave propagation (Rouviere et al. 2006)
and subsequently cartography of elasticity were generated
from inversion algorithms (Manduca et al. 2001). A recent
study has compared the mechanical properties of the liver
measured with and without inversion algorithms (Leclerc
et al. 2013). It was concluded that the elastic properties
calculated from the cartography were underestimated for
the severe fibrosis. Therefore, to accurately diagnose a
suspicious area, in a case of severe fibrosis, the radiologists
may use a profile to locally analyse the tissue. This result
showed the complementary of the different MRE post-
processing for the purpose of characterising the elastic
properties of the liver. Furthermore, a strong variation of
the liver viscosity as a function of the MRE post-
processing revealed that this parameter should be
investigated to demonstrate its relevance in clinical
practice (Leclerc et al. 2013).
To further apply this technique for the characterisation
of other soft tissues (kidney, spleen and psoas)
(Bensamoun et al. 2011), in vitro MRE tests were
performed on phantoms, allowing the set-up of new MRE
protocols and assessing its feasibility. Thus, a phantom
was created with a stiffness (about 4 kPa) mimicking
different biological tissues such as healthy muscle in a
relaxed state (Bensamoun et al. 2006), healthy spleen
(Bensamoun et al. 2011) or fibrotic liver (Bensamoun et al.
2013). Therefore, the continuity of this work was to
simulate the MRE shear wave propagation within the
present developed phantom, using an FE identification
method. The originality of this study was to develop an FE
model composed, for the first time, of the realistic MRE
boundary conditions corresponding to a liver test. Indeed,
the sinusoidal displacement induced by the clinical liver
driver was quantified with a vibrometer analysis (Leclerc
et al. 2012). At that time, MRE studies were currently
simulated using unrealistic in vivo boundary conditions
such as a fixed harmonic displacement (10mm) applied to
the bottom surface of the model (Clayton et al. 2011), an
unknown displacement performed at the node located
in the middle of the top surface (Chen et al. 2005, 2006),
a sinusoidal force made tangent to the top surface (Atay
et al. 2008), a uniform displacement of 1.5mm set on the
outer surface nodes (McGrath et al. 2011) or a sinusoidal
shear load (2 kN) applied to the nodes (Thomas-Seale et al.
2011).
In addition to the realistic boundary condition, the
simulated propagation of the shear wave is also highly
influenced by the material properties of the phantom such
as density, Poisson’s ratio, homogeneity, elasticity and
viscosity. Since abdominal tissues are considered to be
nearly incompressible and mainly constituted of water,
this study took care in testing various values of density and
Poisson’s ratios in order to develop the closest FE phantom
Figure 3. Representation of the cost function (J, mm2) as a function of the shear stiffness (m, kPa), which shows the result of theidentification process.
Computer Methods in Biomechanics and Biomedical Engineering 5
Dow
nloa
ded
by [
McG
ill U
nive
rsity
Lib
rary
] at
08:
00 3
1 O
ctob
er 2
013
model possible for mimicking soft tissues. It must be also
noted that the strong assumption of homogeneity was
applied in the present FE model as a first step to visualise
the shear wave propagation (Chen et al. 2005, 2006).
However, this hypothesis should be significantly modified
in the future in order to take into account the non-
homogeneity properties of the soft biological tissues
(Eskandari et al. 2011) and to truly visualise the shear
wave propagation. In addition, these tissues were
characterised with a viscoelastic behaviour and in this
study, the FE model of the phantom was composed of only
elastic properties revealing the global elasticity of the
tissue using the linear elastic assumption in ABAQUS
software. This choice was based on the relevance of this
parameter compared to the viscous one that represents the
micro-structural changes. Moreover, in the literature
(Chen et al. 2005, 2006, 2007; McGrath et al. 2011),
most of the MRE FE models were developed only with the
elastic properties. In the future, it will be of interest to
develop an FE model with the realistic viscoelastic
properties of the soft tissues and to analyse the effect of the
viscous component on the shear wave propagation.
Furthermore, in case of a more complex FE model, the
use of a genetic algorithm will be necessary to more
rapidly identify the optimal mechanical properties from
the minimisation of the cost function.
The present identification process, based on the
displacement analysis along a profile, was validated on a
phantom model composed of a cylindrical geometry with a
homogeneous media and characterised with elastic
material properties. To improve this inverse method,
these assumptions should be adapted to the biological
tissues that are not cylindrical, non-homogeneous and
revealed a viscoelastic behaviour. In addition, another
perspective will be to adapt this method in order to use the
cartography in the identification process. The next step
will be to use this validated identification process on
different soft tissues. Thus, the simulation of the shear
wave propagation will allow the set-up of new clinical
MRE protocols that could be applied for the follow-up of
the effects of treatments.
Acknowledgement
This work was supported by Region Picardie.
References
Atay SM,KroenkeCD, SabetA, Bayly PV. 2008.Measurement ofthe dynamic shear modulus of mouse brain tissue in vivo bymagnetic resonance elastography. J Biomech Eng. 130:1–11.
Bensamoun SF, Leclerc GE, Debernard L, Cheng X, Robert L,Charleux F, Rhein C, Latrive JP. 2013. Cutoff values foralcoholic liver fibrosis using magnetic resonance elastogra-phy technique. Alcohol Clin Exp Res. 37:811–817.
Bensamoun SF, Ringleb SI, Littrell L, Chen Q, Brennan M,Ehman RL, An KN. 2006. Determination of thigh musclestiffness using magnetic resonance elastography. J MagReson Imaging. 23:242–247.
Bensamoun SF, Robert L, Leclerc GE, Debernard L, Charleux F.2011. Stiffness imaging of the kidney and adjacentabdominal tissues measured simultaneously using magneticresonance elastography. Clin Imaging. 35:284–287.
Bensamoun SF, Wang L, Robert L, Charleux F, Latrive J-P, HoBa Tho M-C. 2008. Measurement of liver stiffness with twoimaging techniques: magnetic resonance elastography andultrasound elastometry. J Magn Reson Imaging. 28:1287–1292.
Chen Q, Bensamoun SF, Basford JR, Thompson JM, An K-N.2007. Identification and quantification of myofascial tautbands with magnetic resonance elastography. Arch PhysMed Rehabil. 88:1658–1661.
Chen Q, Ringleb SI, Manduca A, Ehman RL, An K-N. 2005.A finite element model for analyzing shear wave propagationobserved in magnetic resonance elastography. J Biomech.38:2198–2203.
Chen Q, Ringleb SI, Manduca A, Ehman RL, An K-N. 2006.Differential effects of pre-tension on shear wave propagationin elastic media with different boundary conditions asmeasured by magnetic resonance elastography and finiteelement modeling. J Biomech. 39:1428–1434.
Clayton EH, Garbow JR, Bayly PV. 2011. Frequency-dependentviscoelastic parameters of mouse brain tissue estimated byMR elastography. Phys Med Biol. 56:2391–2406.
Doyley MM. 2012. Model-based elastography: a survey ofapproaches to the inverse elasticity problem. Phys Med Biol.57:R35–R73.
Ehman RL, Rossman PJ, Hulshizer TC, Dresner AM. 2005.Pressure activated driver for magnetic resonance elastogra-phy. U.S. Patent 20050270029.
Eskandari H, Salcudean SE, Rohling R, Bell I. 2011. Real-timesolution of the finite element inverse problem of viscoelas-ticity. Inverse Probl. 27(085002):1–16.
Glaser KJ, Felmlee JP, Ehman RL. 2006. Rapid MR elastographyusing selective excitations. Magn Reson Med. 55:1381–1389.
Huwart L, Sempoux C, Vicaut E, Salameh N, Annet L, Danse E,Peeters F, ter Beek LC, Rahier J, Sinkus R, et al., 2008.Magnetic resonance elastography for the noninvasive stagingof liver fibrosis. Gastroenterology. 135:32–40.
Leclerc GE, Charleux F, Robert L, Ho Ba Tho MC, Rhein C,Latrive JP, Bensamoun SF. Forthcoming 2013. Analysis ofthe liver viscosity behavior as a function of the multi-frequency magnetic resonance elastography (MMRE) post-processing. J Magn Reson Imaging. doi:10.1002/jmri.23986.
Leclerc GE, Debernard L, Foucart F, Robert L, Pelletier KM,Charleux F, Ehman R, Ho Ba Tho M-C, Bensamoun SF.2012. Characterization of a hyper-viscoelastic phantommimicking biological soft tissue using an abdominalpneumatic driver with magnetic resonance elastography(MRE). J Biomech. 45:952–957.
Litwiller DV, Lee SJ, Kolipaka A, Mariappan YK, Glaser KJ,Pulido JS, Ehman RL. 2010. MR elastography of the ex vivobovine globe. J Magn Reson Imaging. 32:44–51.
Manduca A, Oliphant TE, Dresner MA, Mahowald JL, Kruse SA,Amromin E, Felmlee JP, Greenleaf JF, Ehman RL. 2001.Magnetic resonance elastography: noninvasive mapping oftissue elasticity. Med Image Anal. 5:237–254.
G.E. Leclerc et al.6
Dow
nloa
ded
by [
McG
ill U
nive
rsity
Lib
rary
] at
08:
00 3
1 O
ctob
er 2
013

Mazza E, Grau P, Hollenstein M, Bajka M. 2008. Constitutivemodeling of human liver based on in vivo measurements.Med Image Comput Comput-Assist Interv. 11:726–733.
McGrath DM, Foltz WD, Al-Mayah A, Niu CJ, Brock KK. 2011.Quasi-static magnetic resonance elastography at 7 T tomeasure the effect of pathology before and after fixation ontissue biomechanical properties. Magn Reson Med.doi:10.1002/mrm.23223.
Muthupillai R, Lomas DJ, Rossman PJ, Greenleaf JF, ManducaA, Ehman RL. 1995. Magnetic resonance elastography bydirect visualization of propagating acoustic strain waves.Science. 269:1854–1857.
Nava A, Mazza E, Furrer M, Villiger P, Reinhart WH. 2008.In vivo mechanical characterization of human liver. MedImage Anal. 12:203–216.
Nguyen D, Talwalkar JA. 2011. Noninvasive assessment of liverfibrosis. Hepatology. 53:2107–2110.
Niitsu M, Michizaki A, Endo A, Takei H, Yanagisawa O. 2011.Muscle hardness measurement by using ultrasound elasto-graphy: a feasibility study. Acta Radiol. 52:99–105.
Perriez PR, Kennedy FE, Van Houten EEW, Weaver JB, PaulsenKD. 2010. Magnetic resonance poroelastography: analgorithm for estimating the mechanical properties of fluid-saturated soft tissues. IEEE Trans Med Imaging.29:746–755.
Rouviere O, Yin M, Dresner MA, Rossman PJ, Burgart LJ, FidlerJL, Ehman RL. 2006. MR elastography of the liver:preliminary results. Radiology. 240:440–448.
Sack I, Bernarding J, Braun J. 2002. Analysis of wave patterns inMR elastography of skeletal muscle using coupled harmonicoscillator simulations. Magn Reson Imaging. 20:95–104.
Shinohara M, Sabra K, Gennisson J, Fink M, Tanter M. 2010.Real time visualization of muscle stiffness distribution withultrasound shear wave imaging during muscle contraction.Muscle Nerve. 42:438–441.
Thomas-Seale LEJ, Klatt D, Pankaj P, Roberts N, Sack I, HoskinsPR. 2011. A simulation of the magnetic resonanceelastography steady state wave response through idealisedatherosclerotic plaques. IAENG Int J Comput Sci.38:2636–2639.
Trotignon J-P, Piperaud J, Verdu J, Dobraczynski A. 1982. Precisde matieres plastiques: structures, proprietes, mise en oeuvreet normalisation. AFNOR, Nathan, Courbevoie; Paris.
Van Beers B, Doblas S, Sinkus R. 2012. New acquisitiontechniques: fields of application. Abdom Imaging. 37:155–163.
Zuberi S, Matta N, Nawaz S, Stephenson J, McWilliam R,Hollman A. 1999. Muscle ultrasound in the assessment ofsuspected neuromuscular disease in childhood. NeuromusculDisord. 9:203–207.
Computer Methods in Biomechanics and Biomedical Engineering 7
Dow
nloa
ded
by [
McG
ill U
nive
rsity
Lib
rary
] at
08:
00 3
1 O
ctob
er 2
013
Top Related
Copyright © 2022 FDOKUMEN

