


Bahasa
Halaman
Hukum

Identification of KIF3A as a Novel Candidate Gene forChildhood Asthma Using RNA Expression and PopulationAllelic Frequencies DifferencesMelinda Butsch Kovacic1,2, Jocelyn M. Biagini Myers1, Ning Wang1, Lisa J. Martin2, Mark Lindsey1,
Mark B. Ericksen1, Hua He2, Tia L. Patterson1, Tesfaye M. Baye1, Dara Torgerson11, Lindsey A. Roth11,
Jayanta Gupta1, Umasundari Sivaprasad1, Aaron M. Gibson1, Anna M. Tsoras1, Donglei Hu3,4, Celeste
Eng3,4, Rocıo Chapela5, Jose R. Rodrıguez-Santana6, William Rodrıguez-Cintron7, Pedro C. Avila8,
Kenneth Beckman9, Max A. Seibold10, Chris Gignoux4, Salma M. Musaad1, Weiguo Chen1, Esteban
Gonzalez Burchard3,4,11, Gurjit K. Khurana Hershey1*
1 Division of Asthma Research, Cincinnati Children’s Hospital Medical Center, Cincinnati, Ohio, United States of America, 2 Division of Biostatistics and Epidemiology,
Cincinnati Children’s Hospital Medical Center, Cincinnati, Ohio, United States of America, 3 The Lung Biology Center, San Francisco General Hospital, San Francisco,
California, United States of America, 4 The Institute for Human Genetics, University of California San Francisco, San Francisco, California, United States of America,
5 Instituto Nacional de Enfermedades Respiratorias, Mexico City, Mexico, 6 Centro de Neumologıa Pediatrica, CSP, San Juan, Puerto Rico, United States of America, 7 San
Juan Veterans Affairs Medical Center, University of Puerto Rico School of Medicine, San Juan, Puerto Rico, United States of America, 8 Division of Allergy-Immunology,
Northwestern University, Chicago, Illinois, United States of America, 9 Biomedical Genomics Center, University of Minnesota, Minneapolis, Minnesota, United States of
America, 10 Department of Medicine, National Jewish Health, Denver, Colorado, United States of America, 11 The Department of Biopharmaceutical Sciences, University
of California San Francisco, San Francisco, California, United States of America
Abstract
Background: Asthma is a chronic inflammatory disease with a strong genetic predisposition. A major challenge forcandidate gene association studies in asthma is the selection of biologically relevant genes.
Methodology/Principal Findings: Using epithelial RNA expression arrays, HapMap allele frequency variation, and theliterature, we identified six possible candidate susceptibility genes for childhood asthma including ADCY2, DNAH5, KIF3A,PDE4B, PLAU, SPRR2B. To evaluate these genes, we compared the genotypes of 194 predominantly tagging SNPs in 790asthmatic, allergic and non-allergic children. We found that SNPs in all six genes were nominally associated with asthma(p,0.05) in our discovery cohort and in three independent cohorts at either the SNP or gene level (p,0.05). Further, wedetermined that our selection approach was superior to random selection of genes either differentially expressed inasthmatics compared to controls (p = 0.0049) or selected based on the literature alone (p = 0.0049), substantiating thevalidity of our gene selection approach. Importantly, we observed that 7 of 9 SNPs in the KIF3A gene more than doubled theodds of asthma (OR = 2.3, p,0.0001) and increased the odds of allergic disease (OR = 1.8, p,0.008). Our data indicate thatKIF3A rs7737031 (T-allele) has an asthma population attributable risk of 18.5%. The association between KIF3A rs7737031 andasthma was validated in 3 independent populations, further substantiating the validity of our gene selection approach.
Conclusions/Significance: Our study demonstrates that KIF3A, a member of the kinesin superfamily of microtubuleassociated motors that are important in the transport of protein complexes within cilia, is a novel candidate gene forchildhood asthma. Polymorphisms in KIF3A may in part be responsible for poor mucus and/or allergen clearance from theairways. Furthermore, our study provides a promising framework for the identification and evaluation of novel candidatesusceptibility genes.
Citation: Butsch Kovacic M, Biagini Myers JM, Wang N, Martin LJ, Lindsey M, et al. (2011) Identification of KIF3A as a Novel Candidate Gene for Childhood AsthmaUsing RNA Expression and Population Allelic Frequencies Differences. PLoS ONE 6(8): e23714. doi:10.1371/journal.pone.0023714
Editor: Igor Mokrousov, St. Petersburg Pasteur Institute, Russian Federation
Received February 10, 2011; Accepted July 23, 2011; Published August 30, 2011
Copyright: � 2011 Butsch Kovacic et al. This is an open-access article distributed under the terms of the Creative Commons Attribution License, which permitsunrestricted use, distribution, and reproduction in any medium, provided the original author and source are credited.
Funding: This work was supported by the National Institutes of Health [U19A170235 to GKKH, R21016830 to MBK, and U19AI77439 to EGB]. The funders had norole in study design, data collection and analysis, decision to publish, or preparation of the manuscript.
Competing Interests: Mr. Chris Gignoux has indicated that he holds stock in 23andMe, Inc. The other authors do not have any conflicts of interest or financialdisclosures, including declarations of financial interest, to report.
* E-mail: gurjit.hershey @cchmc.org
Introduction
The amount of genetic information available with high
throughput screens has increased exponentially in the last decade,
with the potential for information on three billion base pairs being
available through genome wide sequencing. While the genome
wide approach has been successfully used to identify numerous
genetic variants associated with complex human diseases [1], most
variants identified so far confer relatively small increments in risk,
and explain only a small proportion of disease heritability. This
PLoS ONE | www.plosone.org 1 August 2011 | Volume 6 | Issue 8 | e23714

has led to considerable speculation regarding the sources of the
‘‘missing heritability’’ [2]. Common diseases such as asthma are
heterogeneous and may actually be a compilation of disorders with
numerous subphenotypes. Current studies are not designed to
examine specific subphenotypes of disease due to the large sample
sizes required for genome wide approaches. Genome wide
approaches require thousands of cases and controls to have
sufficient power to properly evaluate such associations. As with
many complex diseases such as asthma, analysis of large sample
sizes made up of heterogeneous phenotypes may make it more
difficult to identify true associations. By focusing on regions with a
priori evidence of gene involvement, the candidate gene approach
has the advantage of requiring smaller sample sizes as fewer
statistical tests are performed. One of the major challenges of the
candidate gene approach for genetic studies is selection of
appropriate genes for evaluation. Methods that have been utilized
thus far include selection of genes based on published biologic
function, findings from mouse models of asthma, and chromo-
somal location in ‘hot-spots’ that have been linked to disease
phenotypes in genome wide association studies (GWAS) and
linkage studies. While over 600 studies have used these strategies
to identify more than 120 different genes to be associated with
asthma or its related phenotypes, only a limited number of genes
have been replicated leaving much variation yet unexplained [3].
Another promising strategy to narrow the numerous potential
disease-associated genes in a less biased way involves examining
differences in allele frequencies between populations in conjunc-
tion with differences in gene expression within relevant cell types
or tissues [4]. Inclusion of an analysis of allele frequency
differences between populations may be a beneficial strategy for
any disease that shows significant differences in prevalence
between groups. A recent study by Frank et. al [5] integrated
global gene expression arrays, DNA sequence variation arrays,
and public databases to identify new previously untested candidate
genes for further testing. This more targeted approach allows
researchers to reduce the overall number of genes to be tested and
hence increases statistical power to detect an association by
lowering the multiple testing burden.
The overall objective of our study was to develop an innovative
approach for identifying candidate genes for genetic association
studies with complex diseases including asthma. We combined the
unbiased characteristics typically obtained using GWAS or
expression arrays with the more focused quality of traditional
literature-based candidate gene approaches. The basis of our
resulting approach takes advantage of our previously published
evaluation of nasal epithelial cell-derived RNA from asthmatic and
non-allergic children [6], population differences in asthma preva-
lence, tagging SNPs in the HapMap database, and the published
literature. Importantly, nasal epithelial cell samples were used as our
source tissue, because of their ability to interface with and function
as a physical barrier to the environment, their importance in
initiating the immune response to environmental triggers and their
role in modulating allergic inflammation [7,8]. Further, compared
to collection of bronchial lavage fluid or bronchial biopsies, nasal
epithelial cell collection is less invasive and has been shown to be a
good surrogate for the lower airway epithelium [9,10].
Using our approach, we identified five novel genes that had not
been previously implicated in asthma and a sixth gene (PDE4B)
that was recently linked to asthma (Table 1) [11]. Upon analysis,
we determined that all six genes were nominally associated with
pediatric asthma in our discovery population (p,0.05). SNPs in a
single gene, KIF3A, were significant even after considering multiple
comparisons (p,0.0001). Our results substantiate the validity of
our candidate gene selection approach.
Methods
EthicsThe study protocol was approved by the Cincinnati Children’s
Hospital Medical Center Institutional Review Board. Parents gave
written informed consent for the children’s participation, and
children gave their assent.
Table 1. Selected genes and functions.
#SNPsa Gene Full Gene Name Chr.ArrayFindingsb Reported Processes and Functionc
Reported AssociatedDiseases
9 KIF3A kinesin familymember 3A
5q31 Down protein binding, ATP binding,microtubule motor activity,nucleotide binding
53 DNAH5 dynein, axonemal,heavy polypeptide 5
5p15 Down microtubule motor activity, ATPbinding, ATPase activity,nucleotide binding
primary ciliary dyskinesia,ciliary motility disorders
68 ADCY2 adenylate cyclase 2 5p15 Down adenylate cyclase activity, magnesiumion binding, phosphorus-oxygenlyase activity
7 PLAU plasminogenactivator,urokinase
10q24 Up kinase activity, peptidase activity,plasminogen activator activity,serine-type endopeptidase activity
acantholysis, alzheimersrheumatoid arthritis,cancer, endometriosis
53 PDE4B phosphodiesterase4B
1p31 Up 39,59-cyclic-AMP phosphodiesteraseactivity, 39,59-cyclic-nucleotidephosphodiesterase activity, catalyticactivity, hydrolase activity
chronic kidneyfailure, schizophrenia
4 SPRR2B small proline-richprotein 2B
1q21 Up structural molecule activity,keratinization
aIndicates the total number of genotyped SNPs.bIndicates the direction of gene expression of uncontrolled asthmatics versus non-allergic controls.cObtained from Gene Ontology website (www.geneontology.org).doi:10.1371/journal.pone.0023714.t001
Novel Method Identifies Six Asthma Candidate Genes
PLoS ONE | www.plosone.org 2 August 2011 | Volume 6 | Issue 8 | e23714
Study PopulationsThe discovery population consisted of a subset of 4 to 17 year
old Caucasian participants enrolled in either the Greater
Cincinnati Pediatric Clinic Repository (GCPCR) or the Genomic
Control Cohort (GCC), a cohort supported by the Cincinnati
Children’s Hospital Medical Center (CCHMC). The GCPCR
includes over 6,200 patients with various diagnoses visiting
CCHMC outpatient specialty clinics, the Emergency Department
or recruited from the community. Participants completed
questionnaires, and provided buccal or saliva samples for genetic
analyses. The GCC includes over 1,080 children recruited to be
representative of the Greater Cincinnati area. All GCC partici-
pants completed a questionnaire that included asthma, allergy and
skin questions similar to those included in GCPCR and provided a
blood sample for genetic analysis. Non-asthmatic/non-allergic
control children were not proactively recruited into the GCPCR
for this study due to the availability of appropriate GCC controls.
GCC asthmatics were not included in the analyses of the discovery
cohort, because their asthma diagnoses were based on parent
report alone. Inclusion criteria and case-control definitions are
described in Table 2.
In addition to our discovery population, four additional
populations were used to replicate our findings (see Table 2).
Cincinnati-based African American children selected from the
GCPCR and GCC were identified as described in our discovery
Caucasian population. Cases for a second Greater Cincinnati
Caucasian population consisted of children with parent-
reported asthma from the GCC and compared to the Cincinnati
Control Cohort (CCC), a population based cohort of Caucasian
adults with no personal or family history of asthma (by self-
report) representative of Greater Cincinnati.with no personal or
family history of asthma (by self-report) from a population-based
representative adults sample from Greater Cincinnati. These
controls were chosen because we could conclusively indicate
their absence of pediatric and adult asthma, unlike similar aged
controls that may develop asthma with age. Genotyping data
from Affymetrix 6.0 SNP chip was also available for the GCC
and CCC. The third and fourth populations consisted of Banked
DNA was utilized for genotyping of Puerto Ricans and
Mexicans parent- child trios with banked DNA for genotyping
participating in the Genetics of Asthma in Latino Americans
(GALA) Study [12], a multicenter international collaborative
effort designed to identify clinical and genetic risk factors
associated with asthma.
DNA Isolation and GenotypingGenomic DNA was isolated from buccal swabs with either the
Zymo Research Genomic DNA II Kit (Zymo Research Corp.,
Orange, CA) or the Purgene DNA Purification System (Gentra
Systems Minneapolis, MN), and from Oragene saliva samples
per the kit’s instructions. Alternatively, genomic DNA was
extracted from blood samples using Manual PerfectPure DNA
Blood Kit (Invitrogen, Carlsbad, CA). Genotyping from
discovery cases and controls and African American samples
was performed using a custom Illumina Golden Gate assay
according to manufacturer’s protocol (http://www.illumina.
com; San Diego, CA). Genotypes were assigned using Bead-
Studio’s genotyping module (BeadStudio v3.2, San Diego, CA).
For GALA, genotyping of KIF3A rs7737031 was accomplished
using the Roche LightTyper 480 (Roche Diagnostics, India-
napolis, IN) and the KIF3A rs7737031 using TaqMan SNP
Genoptyping Assay (assay ID C_25973778_10; Applied Biosys-
tems, Foster City, CA).
Statistical AnalysisGenetic Association. SNPs failing Hardy Weinberg
Equilibrium in the non-allergic control group (p,0.0001),
having minor allele frequencies below 10%; or missing call rates
greater than 10% were excluded. In addition, individuals with
more than 20% of their total SNPs missing were excluded.
Principal component analyses were performed using the 30
included ancestry-informative markers (AIMs) and the computer
program EIGENSTRAT [13,14] to account for potential
population stratification. When examining the 194 SNPs in the
six genes, the genomic inflation factor was 1.0, suggesting minimal
impact of population stratification for these 30 AIMs. Therefore,
no population stratification adjustment was required for analyses
of asthmatics versus non-allergic controls in the discovery or
African-American populations likely due to the fact that selection
of the study population was from a single geographic region.
However, the first principal component score was included as a
covariate in comparisons of allergic versus non-allergic children in
the discovery population as the genomic inflation factor was
greater than 1.0 (l= 1.33 before adjustment and l= 1.02 after
adjustment). Using PLINK [15], associations with asthma were
tested adjusting for age and gender using the additive logistic
regression model stratified by race. To address multiple testing, we
first determined the average pairwise LD (a measured by r2) for all
SNP combinations (160 SNPs, correlation = 0.13) and using this
correlation, calculated the Bonferroni correction using the freely
available Simple Interactive Statistical Analyses Software (http://
www.quantitativeskills.com/sisa/). Associations were therefore
considered significant at or below the 0.0006 level. For our
second Caucasian population, six of the seven SNPs were imputed
from the AffymetrixH 6.0 SNP data using MACH and HapMap
CEU (release 22) as the reference [16,17]. Imputed KIF3A SNPs
were tested for association with asthma status again using additive
logistic regression models in PLINK. The family-based association
test (FBAT) [18] was used to assess associations between KIF3A
rs7737031 and asthma in the GALA trios. Mexican and Puerto
Rican samples were analyzed independently. HWE was tested in
parents only. The population attributable risk for KIF3A
rs7737031 was estimated using the R software package pARccs
(v0.2–2; www.r-project.org) [19].
SNP Imputation. Estimation of SNPs not genotyped in the
study was performed to increase statistical power as well as to
detect novel associations26. Based on HapMap CEU results
(release 22), imputation was performed after filtering out SNPs
with genotyping call rates ,10%, minor allele frequencies ,10%,
and HWE p-value,0.0001 using MACH 1.0.16 (http://www.sph.
umich.edu/csg/MaCH), which uses a hidden Markov model to
estimate an underlying set of unphased genotypes for each subject.
We only considered SNPs that could be imputed with relatively
high quality (RSQ.0.4). For the replication populations and
validation of our approach, the available Affymetrix 6.0 SNP chip
genotype data (http://www.ncbi.nlm.nih.gov/gap) from the
populations described above were used. Imputed SNPs were
tested for association with asthma status using PLINK software as
described above.
Validation. To test whether FST is a proxy for minor allele
frequency (MAF), we estimated Spearman correlation coefficients,
as the MAF and FST were not normally distributed. For the
comparison of SNPs with high and low FST values, pair-wise FST
was determined using Python (http://www.python.org) scripts and
HapMap data [20]. We selected 24 genes containing SNPs with
the largest FST values (range 0.25–0.73) and 24 genes containing
SNPs with the lowest FST values (range 0.00–0.10). We performed
a case control analysis between self-reported child asthmatics from
Novel Method Identifies Six Asthma Candidate Genes
PLoS ONE | www.plosone.org 3 August 2011 | Volume 6 | Issue 8 | e23714
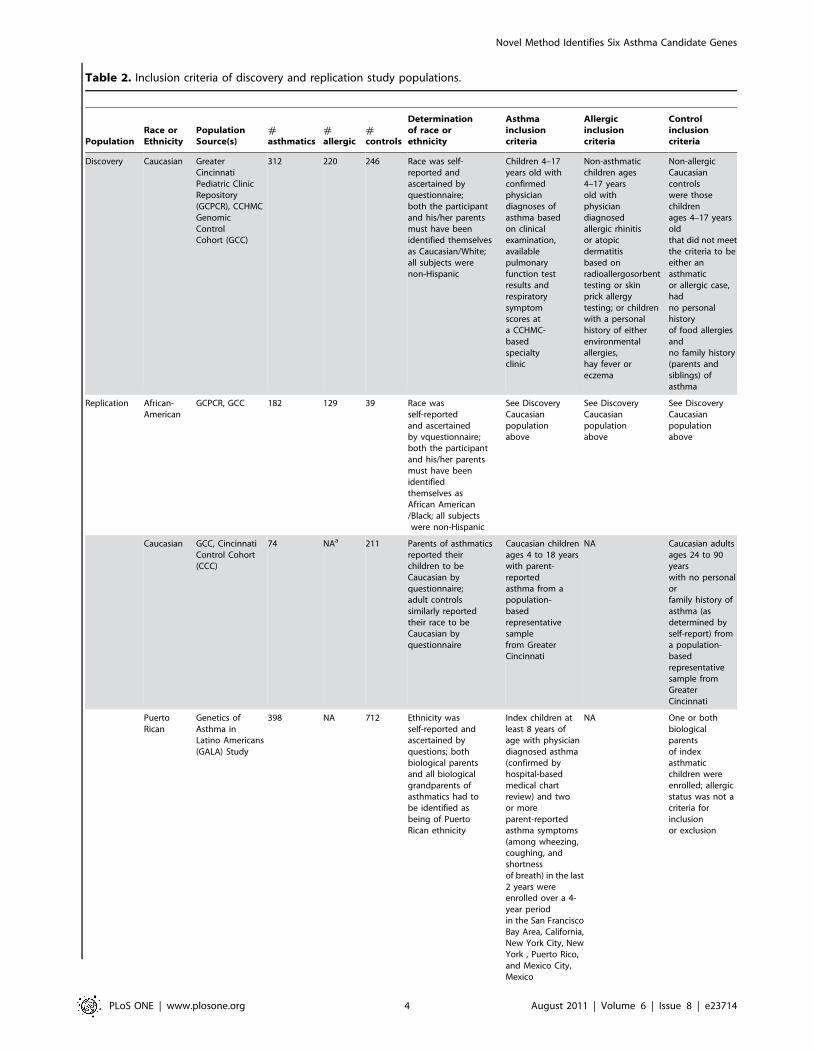
Table 2. Inclusion criteria of discovery and replication study populations.
PopulationRace orEthnicity
PopulationSource(s)
#asthmatics
#allergic
#controls
Determinationof race orethnicity
Asthmainclusioncriteria
Allergicinclusioncriteria
Controlinclusioncriteria
Discovery Caucasian GreaterCincinnatiPediatric ClinicRepository(GCPCR), CCHMCGenomicControlCohort (GCC)
312 220 246 Race was self-reported andascertained byquestionnaire;both the participantand his/her parentsmust have beenidentified themselvesas Caucasian/White;all subjects werenon-Hispanic
Children 4–17years old withconfirmedphysiciandiagnoses ofasthma basedon clinicalexamination,availablepulmonaryfunction testresults andrespiratorysymptomscores ata CCHMC-basedspecialtyclinic
Non-asthmaticchildren ages4–17 yearsold withphysiciandiagnosedallergic rhinitisor atopicdermatitisbased onradioallergosorbenttesting or skinprick allergytesting; or childrenwith a personalhistory of eitherenvironmentalallergies,hay fever oreczema
Non-allergicCaucasiancontrolswere thosechildrenages 4–17 yearsoldthat did not meetthe criteria to beeither anasthmaticor allergic case,hadno personalhistoryof food allergiesandno family history(parents andsiblings) ofasthma
Replication African-American
GCPCR, GCC 182 129 39 Race wasself-reportedand ascertainedby vquestionnaire;both the participantand his/her parentsmust have beenidentifiedthemselves asAfrican American/Black; all subjectswere non-Hispanic
See DiscoveryCaucasianpopulationabove
See DiscoveryCaucasianpopulationabove
See DiscoveryCaucasianpopulationabove
Caucasian GCC, CincinnatiControl Cohort(CCC)
74 NAa 211 Parents of asthmaticsreported theirchildren to beCaucasian byquestionnaire;adult controlssimilarly reportedtheir race to beCaucasian byquestionnaire
Caucasian childrenages 4 to 18 yearswith parent-reportedasthma from apopulation-basedrepresentativesamplefrom GreaterCincinnati
NA Caucasian adultsages 24 to 90yearswith no personalorfamily history ofasthma (asdetermined byself-report) froma population-basedrepresentativesample fromGreaterCincinnati
PuertoRican
Genetics ofAsthma inLatino Americans(GALA) Study
398 NA 712 Ethnicity wasself-reported andascertained byquestions; bothbiological parentsand all biologicalgrandparents ofasthmatics had tobe identified asbeing of PuertoRican ethnicity
Index children atleast 8 years ofage with physiciandiagnosed asthma(confirmed byhospital-basedmedical chartreview) and twoor moreparent-reportedasthma symptoms(among wheezing,coughing, andshortnessof breath) in the last2 years wereenrolled over a 4-year periodin the San FranciscoBay Area, California,New York City, NewYork , Puerto Rico,and Mexico City,Mexico
NA One or bothbiologicalparentsof indexasthmaticchildren wereenrolled; allergicstatus was not acriteria forinclusionor exclusion
Novel Method Identifies Six Asthma Candidate Genes
PLoS ONE | www.plosone.org 4 August 2011 | Volume 6 | Issue 8 | e23714

the GCC (n = 74) and controls with no personal or family history
of asthma from the GCC (n = 226) using all Affymetrix 6.0 SNPs
within 1000 kb of these genes. We then tested whether SNPs with
high FST values (FST$0.1) are more likely to show association with
asthma (p#0.05) than SNPs with low FST values (FST = 0). To test
whether our gene selection strategy was superior to random
selection, we again evaluated the available Affymetrix data from
the 74 GCC asthmatics and 238 CCC controls. From this analysis,
four of our six genes exhibited significant evidence of association
(p#0.05). Results from this analysis were then utilized to select six
genes from the 161 differentially regulated genes using a random
number generator. We noted how many of the six genes had at
least one SNP with nominal association (p#0.05). We repeated
this analysis 10,000 times. To determine the empirical level of
significance, we determined how many times the random selection
obtained evidence in at least four genes added one and divided by
the number of replicates (10,000).
Gene Expression StudiesBalb/c mice (Jackson Labs; Bar Harbor, ME) were sensitized
twice intraperitoneally with 10 mg house dust mite (HDM,
Dermatophagoides pteronyssinus; Greer Laboratories, Lenoir, NC) in
100 ml phosphate buffered saline (PBS) or 100 ml of PBS alone,
and then challenged intratracheally with 100 mg HDM in 50 ml
PBS or 50 ml PBS alone, euthanized 24 hours later, lung RNA
extracted in TRIzol (Invitrogen, Carlsbad, CA) and cDNA
prepared (Superscript First Strand cDNA synthesis kit; Invitrogen,
Carlsbad, CA). Quantitative PCR on mouse and human cDNA
samples collected previously [6] were performed using the Roche
Light Cycler 480 SYBR Green 1 Master kit (Mannheim,
Germany). The annealing temperature for primers sets was
60uC and the extension time was 5 seconds. After amplification,
values from KIF3A were normalized to respective housekeeping
genes values (glyceraldehyde 3-phosphate dehydrogenase
(GAPDH) or actin). Primers used to amplify both human and
mouse KIF3A include: Forward- 59-GGAGGAGACGAGCT-
GAG-39; Reverse- 59-CTCTGACTTTGCAGCCA-39. Primers
used to amplify human GAPDH: Forward- 59-AAATCCCAT-
CACCATCTTCC-39; Reverse- 59-TCACACCCATGACGAAC-
A-39. Primers used to amplify mouse actin: Forward - 59-
GGCAATGCGGCTGCAA-39; Reverse- 59-GGGTACCCACG-
CGAATCAC-39. For the human epithelial gene expression
studies, statistical analysis was performed using PRISM software
(GraphPad Software Inc., La Jolla, CA) using one-way ANOVA
followed by a Tukey-Kramer post-hoc test (for statistical
significance between groups). For comparisons showing significant
differences, precise p-values were calculated using a two-tailed t-
test comparing the two groups under consideration. In the mouse
studies, statistical significance was determined using a two-tailed t-
test in PRISM.
Results
Gene Selection ApproachWe previously published a RNA expression study in nasal
epithelial samples from uncontrolled and controlled pediatric
asthmatics compared to non-allergic controls [6]. The results of
our study revealed that compared to the non-allergic control group
(n = 4), the mean gene expression levels of 161 genes (142 known
genes) were consistently up or down regulated in the group of
uncontrolled asthmatics (n = 4) (one-way ANOVA ; p,0.01)
(Fig. 1). To further reduce the pool of 161 candidate genes
identified, we compared allele frequencies of SNPs within these
genes in two distinct populations shown to have large differences in
population prevalence of asthma. We hypothesized that specific
alleles in genes with large inter-population frequency differences
might be partly responsible for observed variations in asthma
susceptibility. In fact, a recently published genome-wide estimation
of the fixation index (FST), a measure of population differentiation
devised by Wright [21,22], on approximately 4 million SNPs from
the HapMap project, found that genes associated with complex
diseases showed a significantly higher mean value of FST
suggesting that population genetic differentiation, particularly in
genes associated with complex diseases may explain discrepancies
in disease prevalence between different populations [23].
For our analysis, we used Wright’s FST to quantify genetic
differentiation between the Phase I HapMap CEU (Utah residents
with Northern and Western European ancestry, n = 60) and the
CHB (Han Chinese in Beijing, China, n = 45). We selected these
populations based on the largest reported disparity in asthma
prevalence in the ISAAC report [24] available at the time among
the four Phase I HapMap populations ($10% asthma prevalence
for Caucasians vs. ,5% for Chinese, respectively). FST was
calculated for individual SNPs (FST = (p12p2)2/(4p(12p)), where p1
is the allele frequency in the Caucasian population, p2 is the
frequency of the same allele in the Han Chinese population and p
is the average allele frequency of each allele across each population
[25,26]. As FST has a theoretical minimum of 0 indicating no
genetic differences, and a theoretical maximum of 1 indicating
fixation for alternative alleles, we hypothesized that genes with
PopulationRace orEthnicity
PopulationSource(s)
#asthmatics
#allergic
#controls
Determinationof race orethnicity
Asthmainclusioncriteria
Allergicinclusioncriteria
Controlinclusioncriteria
Mexican GALA 300 NA 585 Ethnicity wasself-reported andascertained byquestionnaire;both biologicalparents of asthmaticchildren and allbiological grandparentshad to be identifiedas being of Mexicanethnicity
See Puerto Ricanpopulation above
NA See PuertoRican populationabove
aNot applicable.doi:10.1371/journal.pone.0023714.t002
Table 2. Cont.
Novel Method Identifies Six Asthma Candidate Genes
PLoS ONE | www.plosone.org 5 August 2011 | Volume 6 | Issue 8 | e23714

larger FST values between populations that differ in disease
prevalence are more likely to be associated with disease. Using this
approach, we identified 16/161 genes (or 14/142 known genes)
showing differential expression between cases and controls to have
relatively large differences in allele frequencies in least one SNP
(FST$0.25; Fig. 1).
Next, these 16 genes were subjected to an extensive literature
review using publicly available databases such as PubMed. Our
investigation revealed that six of these genes (PDE4B, SPRR2B,
ADCY2, KIF3A, DNAH5, and PLAU; see Table 1) were located in
chromosomal regions that had been previously linked to asthma or
other allergic disease phenotypes and had been shown to be
regulated during allergic inflammation [1] (Table 1). Furthermore,
we identified five of the same six genes (ADCY2, DNAH5, KIF3A,
PDE4B, SPRR2B) when substituting FST values calculated using
the HapMap CEU and YRI (Yorubans from Ibadan, Nigeria)
populations for the CEU and CHB populations.
Tagging SNP SelectionConsequently and independent of the SNPs evaluated in our
analysis of FST, a total of 172 tagging SNPs were selected for
inclusion on a custom Illumina Golden Gate platform for the six
genes of interest using Haploview and Tagger (http://www.broad.
mit.edu/mpg/haploview). All tagging SNPs included were re-
quired to have minor allele frequencies greater than 0.05 and
patterns of linkage disequilibrium (LD; r2.0.8) in the public
HapMap Phase I CEU and YRI populations (http://hapmap.
ncbi.nlm.nih.gov) [27,28,29].The rationale for using tagging SNPs
is that genetic variants that are near each other and in LD tend to
be inherited together as a result of shared ancestry. The strong
correlations between markers within haplotype blocks help to
enable accurate representation of a gene region by a small number
of tagging SNPs and further ensures the efficient capture all the
common genetic variation in the genes selected. We selected SNPs
from the CEU and YRI populations because our discovery
population consisted of children of Caucasian ancestry, and the
availability of African American children for a replication cohort.
We also included an additional 18 non-synonymous SNPs, four
promoter SNPs, and 30 unlinked ancestry-informative markers
(AIMs) [30] to estimate global population structure. AIMs were
selected based on the criterion previously described by Rosenberg
et al., 2003 [30]. Twenty of these AIMs were included to
specifically distinguish between Northern and Southern Europeans
[31] and the remaining ten AIMs were chosen to specifically
distinguish between Europeans and people of African descent.
Asthma and Allergic Disease Genetic AssociationsGenotyping was performed first on 790 Caucasian children
from the Cincinnati Metropolitan area. Our SNP call rate was
uniformly .95%. SNPs with call rates ,10% (N = 9) or minor
allele frequencies ,10% (N = 25) were removed from the analysis.
None of the SNPs failed Hardy-Weinberg Equilibrium in the non-
allergic control population (p,0.001). When the more conserva-
tive cut off of 0.01 was used, only three additional SNPs would
have been excluded. Individuals with more than 20% of their total
SNPs missing were also excluded from the analysis (N = 12;
Table 3). The mean age of the remaining children was slightly, but
significantly less for asthmatic (p = 3.961029) and allergic
Figure 1. Novel unbiased approach to identify candidate asthma susceptibility genes. The approach consisted of three stages with anevaluation of RNA expression of 14,500 genes in nasal epithelial samples in stage 1. Next, 142 known genes with .3-fold difference betweenuncontrolled asthmatics and non-allergic controls (P,0.05) were taken forward to stage 2. In stage 2, using HapMap data, the allelic frequencies ofCaucasians (Utah residents of European ancestry; CEU) and the Han Chinese (Beijing, China; CHB) were compared and 14 known genes with a fixationindex (FST).0.25 were identified. Six of these genes, which mapped to chromosomal regions that had been linked to asthma previously, wereincluded in the next phase. In stage 3, tagging SNPs including all CEU and YRI (Yoruban residents of Ibadan, Nigeria) SNPs with minor allele frequencyless than 0.05 in the 6 genes were genotyped in children with asthma, allergic rhinitis or atopic dermatitis without asthma, and in non-allergic controlchildren using a custom Illumina Golden Gate SNP Chip. Seven SNPs in a single gene, KIF3A, were significantly associated with asthma after adjustingfor multiple comparisons (p-value,0.0006).doi:10.1371/journal.pone.0023714.g001
Novel Method Identifies Six Asthma Candidate Genes
PLoS ONE | www.plosone.org 6 August 2011 | Volume 6 | Issue 8 | e23714
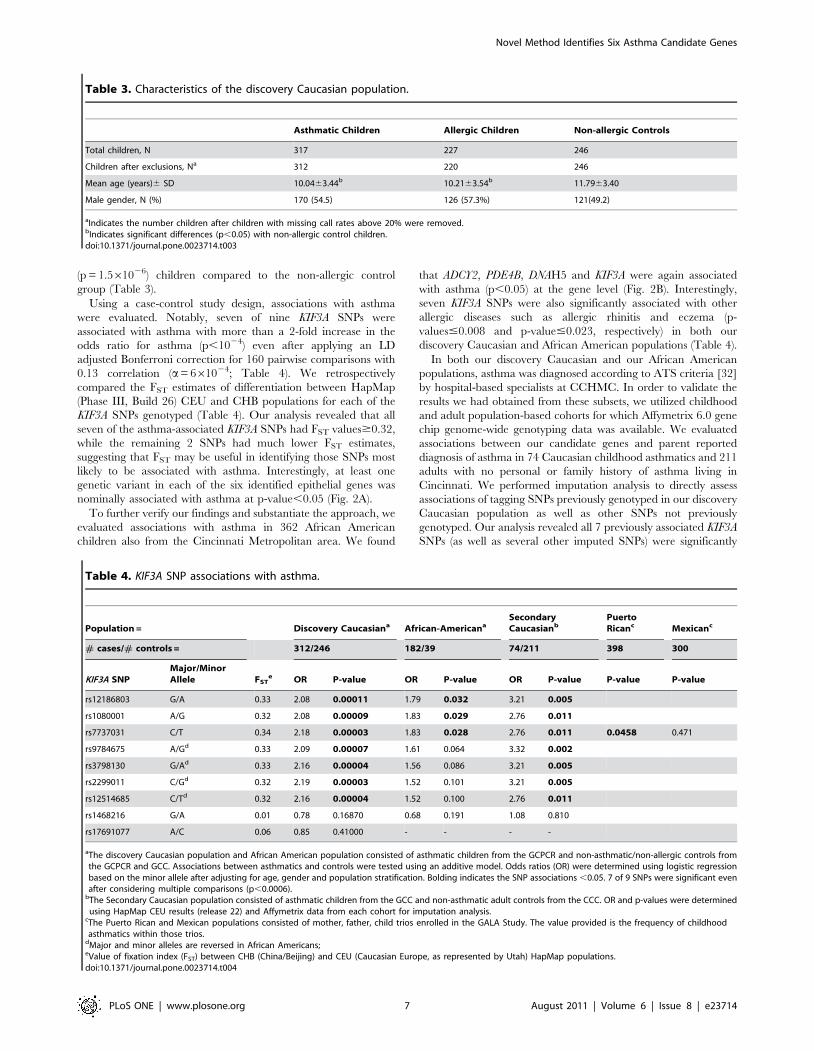
(p = 1.561026) children compared to the non-allergic control
group (Table 3).
Using a case-control study design, associations with asthma
were evaluated. Notably, seven of nine KIF3A SNPs were
associated with asthma with more than a 2-fold increase in the
odds ratio for asthma (p,1024) even after applying an LD
adjusted Bonferroni correction for 160 pairwise comparisons with
0.13 correlation (a= 661024; Table 4). We retrospectively
compared the FST estimates of differentiation between HapMap
(Phase III, Build 26) CEU and CHB populations for each of the
KIF3A SNPs genotyped (Table 4). Our analysis revealed that all
seven of the asthma-associated KIF3A SNPs had FST values$0.32,
while the remaining 2 SNPs had much lower FST estimates,
suggesting that FST may be useful in identifying those SNPs most
likely to be associated with asthma. Interestingly, at least one
genetic variant in each of the six identified epithelial genes was
nominally associated with asthma at p-value,0.05 (Fig. 2A).
To further verify our findings and substantiate the approach, we
evaluated associations with asthma in 362 African American
children also from the Cincinnati Metropolitan area. We found
that ADCY2, PDE4B, DNAH5 and KIF3A were again associated
with asthma (p,0.05) at the gene level (Fig. 2B). Interestingly,
seven KIF3A SNPs were also significantly associated with other
allergic diseases such as allergic rhinitis and eczema (p-
values#0.008 and p-value#0.023, respectively) in both our
discovery Caucasian and African American populations (Table 4).
In both our discovery Caucasian and our African American
populations, asthma was diagnosed according to ATS criteria [32]
by hospital-based specialists at CCHMC. In order to validate the
results we had obtained from these subsets, we utilized childhood
and adult population-based cohorts for which Affymetrix 6.0 gene
chip genome-wide genotyping data was available. We evaluated
associations between our candidate genes and parent reported
diagnosis of asthma in 74 Caucasian childhood asthmatics and 211
adults with no personal or family history of asthma living in
Cincinnati. We performed imputation analysis to directly assess
associations of tagging SNPs previously genotyped in our discovery
Caucasian population as well as other SNPs not previously
genotyped. Our analysis revealed all 7 previously associated KIF3A
SNPs (as well as several other imputed SNPs) were significantly
Table 3. Characteristics of the discovery Caucasian population.
Asthmatic Children Allergic Children Non-allergic Controls
Total children, N 317 227 246
Children after exclusions, Na 312 220 246
Mean age (years)6 SD 10.0463.44b 10.2163.54b 11.7963.40
Male gender, N (%) 170 (54.5) 126 (57.3%) 121(49.2)
aIndicates the number children after children with missing call rates above 20% were removed.bIndicates significant differences (p,0.05) with non-allergic control children.doi:10.1371/journal.pone.0023714.t003
Table 4. KIF3A SNP associations with asthma.
Population = Discovery Caucasiana African-AmericanaSecondaryCaucasianb
PuertoRicanc Mexicanc
# cases/# controls = 312/246 182/39 74/211 398 300
KIF3A SNPMajor/MinorAllele FST
e OR P-value OR P-value OR P-value P-value P-value
rs12186803 G/A 0.33 2.08 0.00011 1.79 0.032 3.21 0.005
rs1080001 A/G 0.32 2.08 0.00009 1.83 0.029 2.76 0.011
rs7737031 C/T 0.34 2.18 0.00003 1.83 0.028 2.76 0.011 0.0458 0.471
rs9784675 A/Gd 0.33 2.09 0.00007 1.61 0.064 3.32 0.002
rs3798130 G/Ad 0.33 2.16 0.00004 1.56 0.086 3.21 0.005
rs2299011 C/Gd 0.32 2.19 0.00003 1.52 0.101 3.21 0.005
rs12514685 C/Td 0.32 2.16 0.00004 1.52 0.100 2.76 0.011
rs1468216 G/A 0.01 0.78 0.16870 0.68 0.191 1.08 0.810
rs17691077 A/C 0.06 0.85 0.41000 - - - -
aThe discovery Caucasian population and African American population consisted of asthmatic children from the GCPCR and non-asthmatic/non-allergic controls fromthe GCPCR and GCC. Associations between asthmatics and controls were tested using an additive model. Odds ratios (OR) were determined using logistic regressionbased on the minor allele after adjusting for age, gender and population stratification. Bolding indicates the SNP associations ,0.05. 7 of 9 SNPs were significant evenafter considering multiple comparisons (p,0.0006).
bThe Secondary Caucasian population consisted of asthmatic children from the GCC and non-asthmatic adult controls from the CCC. OR and p-values were determinedusing HapMap CEU results (release 22) and Affymetrix data from each cohort for imputation analysis.
cThe Puerto Rican and Mexican populations consisted of mother, father, child trios enrolled in the GALA Study. The value provided is the frequency of childhoodasthmatics within those trios.
dMajor and minor alleles are reversed in African Americans;eValue of fixation index (FST) between CHB (China/Beijing) and CEU (Caucasian Europe, as represented by Utah) HapMap populations.doi:10.1371/journal.pone.0023714.t004
Novel Method Identifies Six Asthma Candidate Genes
PLoS ONE | www.plosone.org 7 August 2011 | Volume 6 | Issue 8 | e23714

associated with asthma in this population (p-value#0.01; Table 4).
Furthermore, at least one previously associated SNP within
ADCY2 and DNAH5 was associated with asthma (Fig. 3A). Imputed
SNPs within PDE4B not previously genotyped were also
significantly associated with asthma.
We next examined associations between imputed SNPs and
asthma in 398 Puerto Rican and 300 Mexican family trios enrolled
in the Genetics of Asthma in Latino Americans (GALA) Study
[12]. Puerto Ricans living in the US have higher asthma
prevalence (26%), morbidity, and mortality rate than Caucasians
Figure 2. Genetic associations with childhood asthma. A. We evaluated associations in our discovery Caucasian population between asthmaand 160 directly genotyped SNPs within the six epithelial genes using the additive model after adjusting for age and gender. The upper dashed linecorresponds to a p-value of 0.0006, the Bonferroni adjustment after considering LD correlation between SNPs. SNPs significant at this level (all inKIF3A) include rs12186803 (p = 0.00011), rs3798130 (p = 0.00004), rs2299011 (p = 0.00003), rs12514685 (p = 0.00004), rs7737031 (p = 0.00003),rs1080001 (p = 0.00009), and rs9784675 (p = 0.00007). The lower dashed line corresponds to a p-value of 0.05. SNPs significant at this level includers11747117 (p = 0.0188), rs7714830 (p = 0.0219), and rs13174121 (p = 0.0113) in ADCY2, rs2896111 (p = 0.0335) and rs17263496 (p = 0.0136) in DNAH5,rs12060491 (p = 0.0369) in PDE4B, rs6693927 (p = 0.0496) in SPRR2B and rs2227562 (p = 0.0044) in PLAU. B. Associations between asthma and 160directly genotyped SNPs within the six epithelial genes were evaluated among African American children from Cincinnati using an additive modelafter adjusting for age and gender. The dashed line corresponds to a p-value of 0.05. SNPs significant at this level include rs11742602 (p = 0.038),rs2017214 (p = 0.014) and rs1032719 (p = 0.048) in ADCY2, rs30168 (p = 0.030) in DNAH5, rs11208834 (p = 0.032) in PDE4B, rs12186803 (p = 0.032),rs1080001 (p = 0.029) and rs7737031 (p = 0.028) in KIF3A.doi:10.1371/journal.pone.0023714.g002
Novel Method Identifies Six Asthma Candidate Genes
PLoS ONE | www.plosone.org 8 August 2011 | Volume 6 | Issue 8 | e23714

Figure 3. Associations with asthma in three additional independent populations. SNPs not genotyped in the study were imputed basedon HapMap CEU results (release 22) with MACH software using the available from the Affymetrix 6.0 genotype data. Imputed SNPs were then testedfor associations with asthma using PLINK. The dashed line corresponds to a p-value of 0.05. A. Associations in a second Cincinnati-based Caucasianpopulation. B. Asthma associations in the GALA Puerto Rican trios. C. Associations in the GALA Mexican trios.doi:10.1371/journal.pone.0023714.g003
Novel Method Identifies Six Asthma Candidate Genes
PLoS ONE | www.plosone.org 9 August 2011 | Volume 6 | Issue 8 | e23714

living in the US, and Mexicans living in the US have a lower
asthma prevalence (10%), morbidity, and mortality rate
[33,34,35,36,37,38]. Our analysis provided evidence for gene
level replication of ADCY2, DNAH5, KIF3A, and PDE4B (Fig. 3B,
C, respectively). As only KIF3A achieved significance after
correction for multiple testing, this replication is essential to
minimize false positive findings. To further support our findings,
we directly genotyped KIF3A rs7737031, the SNP with the most
significant association in our discovery population, and again
observed a significant association with asthma in the Puerto Rican
(p-value = 0.0458), but not the Mexican trios (p-value = 0.471)
(Table 4).
Validation of Candidate Gene SelectionTo validate our approach, we tested whether identifying
candidate genes based on higher values of FST is a proxy for
identifying more common SNPs with more power to detect an
association, or whether information is gained from measures of
population differentiation. We found that FST values for the 161
differentially expressed genes in uncontrolled asthma were not
significantly correlated with minor allele frequency (Spearman
rho = 0.05, p-value = 0.52), suggesting that including measures of
FST to identify candidate genes is not simply identifying SNPs with
greater power to detect an association, but rather provides
information beyond that of minor allele frequency.
Second, we compared the HapMap CEU and CHB populations
and determined whether SNPs with high FST values were more
likely to exhibit association with asthma than those SNPs with low
FST values. We evaluated Affymetrix 6.0 data of 74 asthmatic and
238 non-allergic control children from Cincinnati. Of the 161
differentially regulated genes identified by our expression array, we
determined that the 241 SNPs within the 24 genes with the highest
FST values (FST$0.1; including SNPs within the final six genes
selected - KIF3A, ADCY2, DNAH5, PDE4B, PLAU, SPRR2B) were
significantly more likely (p = 0.0008, Fisher’s Exact Test; 6% of
SNPs reached p#0.05) to be associated with asthma than the 190
SNPs in the 24 genes with the lowest FST values (FST = 0; 0.5% of
SNPs reached p#0.05).
Finally, again using the Affymetrix 6.0 data of the 74 Caucasian
asthmatic children and 238 control children described above, we
randomly selected six genes among those differentially expressed
in asthmatics versus controls and asked how often we would
observe at least four of the six genes having at least one SNP
significantly associated with asthma (p-value = 0.05). Notably, we
found that the random selection of genes using differences in
expression alone was superior to our proposed selection approach
(e.g. fewer genes were identified using random selection) in only 48
out of 10,000 permutations (p = 0.0049), and conclude that the
addition of FST and the published literature search together
provides a valuable tool for candidate gene selection.
RNA Expression AnalysesAs we found the most significant results with KIF3A and as our
earlier expression array findings indicate that KIF3A expression
was down-regulated in nasal epithelial children with acute asthma
[6], we wanted to corroborate this observation. To this end,
quantitative PCR for KIF3A was performed on nasal epithelial
RNA samples from the asthmatic children and controls previously
included on the array (Fig. 4). Consistent with our array data, we
observed that KIF3A expression was significantly down-regulated
(p,0.05). As an additional independent validation of our results,
we also measured expression of KIF3A in lung RNA isolated from
a house dust mite-induced murine asthma model. Our results
indicate that KIF3A expression is significantly reduced compared
to phosphate buffered saline-treated controls [6] (Fig. 4).
Discussion
A major challenge for candidate gene association studies is the
selection of biologically relevant genes for evaluation. Our unique
approach utilized multiple lines of evidence to select relevant
candidate genes (Fig. 1). First, as nasal epithelial cells have been
previously shown to be a good surrogate for bronchial epithelial
cells [10], we took advantage of expression microarray data from
these cells to identify genes differentially expressed in asthmatics
and non-asthmatic controls. Next, using HapMap, we compared
the allelic variation across each of these genes in populations with
marked differences in asthma prevalence (CEU vs. CHB),
reviewed the published literature to identify specific genes having
potential application in the lung and genotyped tagging SNPs
Figure 4. KIF3A gene expression of human epithelial RNA fromchildren with uncontrolled asthma and of mouse models withasthma is decreased compared to controls. Gene expression ofKIF3A in nasal epithelial-derived RNA from non-allergic children,controlled and uncontrolled asthmatics was determined by quantitativePCR. GAPDH was used to normalize for expression. To induce anasthma-like phenotype, wild type Balb/c mice were sensitized andchallenged with 100 mg of house dust mite (asthma model) andcompared to mice sensitized and challenged with phosphate bufferedsaline (control). One day post-treatment, RNA was extracted from lungsand gene expression measured by quantitative PCR. Actin was used tonormalize for gene expression.doi:10.1371/journal.pone.0023714.g004
Novel Method Identifies Six Asthma Candidate Genes
PLoS ONE | www.plosone.org 10 August 2011 | Volume 6 | Issue 8 | e23714
across these genes. Using this approach, we determined that SNPs
within six genes were associated with asthma (Fig. 2A). Many of
these associations were also observed in one or more of our 4
independent populations either at the SNP or gene level (Fig. 2B
and Fig. 3), and the association with KIF3A was associated in three
of four populations examined in addition to our discovery
population. The Puerto Rican and Mexican GALA trios not only
allowed us to evaluate our results across racial/ethnic groups, but
to evaluate genetic associations in populations with potentially
different environmental exposures.
For candidate gene selection, researchers have used gene
expression results [6], FST [21,22], and biologic relevance as
gleaned from the literature [1], but no study has combined these
strategies. We found that the combination of approaches for
candidate gene selection was superior to using one type of data.
Indeed, in an independent screen of SNPs in genes found to have
dysregulated epithelial gene expression in uncontrolled asthmatics,
we found that SNPs with high FST values were more likely to be
associated with asthma than those with low FST values, including
the six genes evaluated in this study, supporting the validity of our
gene selection approach. Further, when we randomly selected
genes from those that were differentially expressed, we found our
selection method was statistically superior. These data point to a
strong relationship between epithelial cells and asthma and
substantiate the validity of this approach to identify genetic
biomarkers of complex disease. Collectively, our approach may be
applicable to other complex diseases that show varying preva-
lences across human populations, and may be a useful tool to select
novel gene candidates for assessment of disease associations in
other pertinent cell types and tissues.
Using this approach, we have identified KIF3A as a possible
susceptibility gene for childhood asthma and allergic disease. We
found that seven of nine KIF3A SNPs genotyped were significantly
associated with asthma in our discovery Caucasian population and
in independent Caucasian and African American populations – all
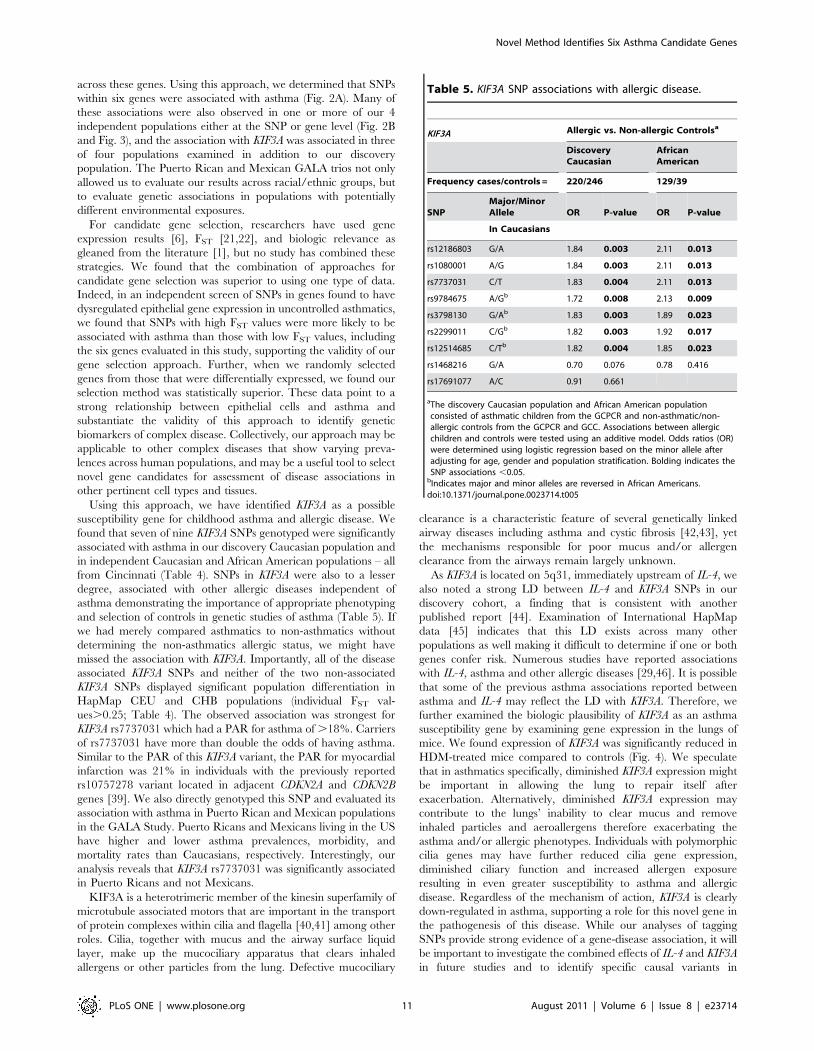
from Cincinnati (Table 4). SNPs in KIF3A were also to a lesser
degree, associated with other allergic diseases independent of
asthma demonstrating the importance of appropriate phenotyping
and selection of controls in genetic studies of asthma (Table 5). If
we had merely compared asthmatics to non-asthmatics without
determining the non-asthmatics allergic status, we might have
missed the association with KIF3A. Importantly, all of the disease
associated KIF3A SNPs and neither of the two non-associated
KIF3A SNPs displayed significant population differentiation in
HapMap CEU and CHB populations (individual FST val-
ues.0.25; Table 4). The observed association was strongest for
KIF3A rs7737031 which had a PAR for asthma of .18%. Carriers
of rs7737031 have more than double the odds of having asthma.
Similar to the PAR of this KIF3A variant, the PAR for myocardial
infarction was 21% in individuals with the previously reported
rs10757278 variant located in adjacent CDKN2A and CDKN2B
genes [39]. We also directly genotyped this SNP and evaluated its
association with asthma in Puerto Rican and Mexican populations
in the GALA Study. Puerto Ricans and Mexicans living in the US
have higher and lower asthma prevalences, morbidity, and
mortality rates than Caucasians, respectively. Interestingly, our
analysis reveals that KIF3A rs7737031 was significantly associated
in Puerto Ricans and not Mexicans.
KIF3A is a heterotrimeric member of the kinesin superfamily of
microtubule associated motors that are important in the transport
of protein complexes within cilia and flagella [40,41] among other
roles. Cilia, together with mucus and the airway surface liquid
layer, make up the mucociliary apparatus that clears inhaled
allergens or other particles from the lung. Defective mucociliary
clearance is a characteristic feature of several genetically linked
airway diseases including asthma and cystic fibrosis [42,43], yet
the mechanisms responsible for poor mucus and/or allergen
clearance from the airways remain largely unknown.
As KIF3A is located on 5q31, immediately upstream of IL-4, we
also noted a strong LD between IL-4 and KIF3A SNPs in our
discovery cohort, a finding that is consistent with another
published report [44]. Examination of International HapMap
data [45] indicates that this LD exists across many other
populations as well making it difficult to determine if one or both
genes confer risk. Numerous studies have reported associations
with IL-4, asthma and other allergic diseases [29,46]. It is possible
that some of the previous asthma associations reported between
asthma and IL-4 may reflect the LD with KIF3A. Therefore, we
further examined the biologic plausibility of KIF3A as an asthma
susceptibility gene by examining gene expression in the lungs of
mice. We found expression of KIF3A was significantly reduced in
HDM-treated mice compared to controls (Fig. 4). We speculate
that in asthmatics specifically, diminished KIF3A expression might
be important in allowing the lung to repair itself after
exacerbation. Alternatively, diminished KIF3A expression may
contribute to the lungs’ inability to clear mucus and remove
inhaled particles and aeroallergens therefore exacerbating the
asthma and/or allergic phenotypes. Individuals with polymorphic
cilia genes may have further reduced cilia gene expression,
diminished ciliary function and increased allergen exposure
resulting in even greater susceptibility to asthma and allergic
disease. Regardless of the mechanism of action, KIF3A is clearly
down-regulated in asthma, supporting a role for this novel gene in
the pathogenesis of this disease. While our analyses of tagging
SNPs provide strong evidence of a gene-disease association, it will
be important to investigate the combined effects of IL-4 and KIF3A
in future studies and to identify specific causal variants in
Table 5. KIF3A SNP associations with allergic disease.
KIF3A Allergic vs. Non-allergic Controlsa
DiscoveryCaucasian
AfricanAmerican
Frequency cases/controls = 220/246 129/39
SNPMajor/MinorAllele OR P-value OR P-value
In Caucasians
rs12186803 G/A 1.84 0.003 2.11 0.013
rs1080001 A/G 1.84 0.003 2.11 0.013
rs7737031 C/T 1.83 0.004 2.11 0.013
rs9784675 A/Gb 1.72 0.008 2.13 0.009
rs3798130 G/Ab 1.83 0.003 1.89 0.023
rs2299011 C/Gb 1.82 0.003 1.92 0.017
rs12514685 C/Tb 1.82 0.004 1.85 0.023
rs1468216 G/A 0.70 0.076 0.78 0.416
rs17691077 A/C 0.91 0.661
aThe discovery Caucasian population and African American populationconsisted of asthmatic children from the GCPCR and non-asthmatic/non-allergic controls from the GCPCR and GCC. Associations between allergicchildren and controls were tested using an additive model. Odds ratios (OR)were determined using logistic regression based on the minor allele afteradjusting for age, gender and population stratification. Bolding indicates theSNP associations ,0.05.
bIndicates major and minor alleles are reversed in African Americans.doi:10.1371/journal.pone.0023714.t005
Novel Method Identifies Six Asthma Candidate Genes
PLoS ONE | www.plosone.org 11 August 2011 | Volume 6 | Issue 8 | e23714

KIF3A.These findings emphasize the importance of evaluating
multiple genes and critically exploring the biological relevance of
genes previously unknown to influence disease susceptibility.
In summary, our study took advantage of our previously
published evaluation of nasal epithelial cell-derived RNA from
asthmatic and non-allergic children [6], population differences in
asthma prevalence, tagging SNPs in the HapMap database, and
the published literature to identify six genes (ADCY2, DNAH5,
KIF3A, PDE4B, PLAU, SPRR2B) for detailed and targeted genetic
testing. The most strongly associated gene, KIF3A, was first
reported by our group as having a role in asthma in 2009 [47].
KIF3A has also been associated with aspirin sensitive asthma [48].
Here, we verify that KIF3A is a novel candidate gene for childhood
asthma and show that its expression is down regulated in nasal
epithelial cells in asthmatics. Our success supports the validity of
our approach for identifying asthma candidate genes with a high
likelihood of exhibiting association in specific variants. As the level
of genomic data continues to increase, it will be imperative to
develop methods which can help focus studies. By demonstrating
that we can identify associations using this approach and that these
associations can be replicated, we have provided a novel
framework for the identification of candidate genes.
Acknowledgments
We thank the physicians, nurses and staff of Cincinnati Children’s Hospital
Medical Center Allergy and Immunology clinics, Pulmonary clinics,
Dermatology clinics, Headache Center clinics, Dental clinics, Orthopedic
clinics and Emergency Department as well as the investigators and staff of
the Cincinnati Children’s Hospital Genomic Control Cohort. We thank all
the patients and their families who participated in this study. We thank the
investigators and staff of the Cincinnati Control Cohort and the Genetics of
Asthma in Latino Americans Study for the use of their specimens and/or
data. We thank Dr. Daniel Nebert, MD, in the Department of
Environmental Health, University of Cincinnati and Dr. Jessica Woo,
PhD in the Division of Biostatistics and Epidemiology at Cincinnati
Children’s Hospital Medical Center for their critical review of this
manuscript.
Author Contributions
Conceived and designed the experiments: GKKH NW. Performed the
experiments: MBE JG AMT TP WC US AMG. Analyzed the data: NW
HH LR CG DH LJM TMB CE MS. Contributed reagents/materials/
analysis tools: RC JRR-S WR-C PCA KB EGB. Wrote the paper: MBK
JMBM. Provided conceptual advice and critical review of the manuscript:
GKKH LJM US TMB DT JG. Directed the statistical analysis: MBK
JMBM LJM DT. Planned and oversaw the discovery cohort and African
American subject recruitment, data collection and storage: MBK JMBM
TP GKKH. Oversaw the data storage and management and prepared the
data for analysis: ML JMBM MBK. Oversaw selection of SNPs for
placement on the custom SNP array: NW SM GKKH. Recruited subjects:
MBE JG AMT TP.
References
1. Weiss ST, Raby BA, Rogers A (2009) Asthma genetics and genomics 2009. CurrOpin Genet Dev 19: 279–282.
2. Manolio TA, Collins FS, Cox NJ, Goldstein DB, Hindorff LA, et al. (2009)
Finding the missing heritability of complex diseases. Nature 461: 747–753.
3. Ober C, Hoffjan S (2006) Asthma genetics 2006: the long and winding road to
gene discovery. Genes Immun 7: 95–100.
4. Akey JM, Zhang G, Zhang K, Jin L, Shriver MD (2002) Interrogating a high-density SNP map for signatures of natural selection. Genome Res 12:
1805–1814.
5. Franke L, Jansen RC (2009) eQTL analysis in humans. Methods Mol Biol 573:311–328.
6. Guajardo JR, Schleifer KW, Daines MO, Ruddy RM, Aronow BJ, et al. (2005)Altered gene expression profiles in nasal respiratory epithelium reflect stable
versus acute childhood asthma. J Allergy Clin Immunol 115: 243–251.
7. Frieri M (2005) Asthma concepts in the new millennium: update in asthmapathophysiology. Allergy Asthma Proc 26: 83–88.
8. Cookson W (2004) The immunogenetics of asthma and eczema: a new focus on
the epithelium. Nat Rev Immunol 4: 978–988.
9. Gaga M, Lambrou P, Papageorgiou N, Koulouris NG, Kosmas E, et al. (2000)
Eosinophils are a feature of upper and lower airway pathology in non-atopicasthma, irrespective of the presence of rhinitis. Clin Exp Allergy 30: 663–669.
10. McDougall CM, Blaylock MG, Douglas JG, Brooker RJ, Helms PJ, et al. (2008)
Nasal epithelial cells as surrogates for bronchial epithelial cells in airway
inflammation studies. Am J Respir Cell Mol Biol 39: 560–568.
11. Himes BE, Hunninghake GM, Baurley JW, Rafaels NM, Sleiman P, et al. (2009)Genome-wide association analysis identifies PDE4D as an asthma-susceptibility
gene. Am J Hum Genet 84: 581–593.
12. Burchard EG, Avila PC, Nazario S, Casal J, Torres A, et al. (2004) Lowerbronchodilator responsiveness in Puerto Rican than in Mexican subjects with
asthma. Am J Respir Crit Care Med 169: 386–392.
13. Price AL, Patterson NJ, Plenge RM, Weinblatt ME, Shadick NA, et al. (2006)
Principal components analysis corrects for stratification in genome-wideassociation studies. Nat Genet 38: 904–909.
14. Narayanaswamy CRaR, D. (1991) Principal Component Analysis for Large
Dispersion Matrices. App Stat 40: 309–316.
15. Purcell S, Neale B, Todd-Brown K, Thomas L, Ferreira MA, et al. (2007)
PLINK: a tool set for whole-genome association and population-based linkageanalyses. Am J Hum Genet 81: 559–575.
16. Howie BN, Donnelly P, Marchini J (2009) A flexible and accurate genotype
imputation method for the next generation of genome-wide association studies.PLoS Genet 5: e1000529.
17. Nothnagel M, Ellinghaus D, Schreiber S, Krawczak M, Franke A (2009) Acomprehensive evaluation of SNP genotype imputation. Hum Genet 125:
163–171.
18. Laird PW, Zijderveld A, Linders K, Rudnicki MA, Jaenisch R, et al. (1991)Simplified mammalian DNA isolation procedure. Nucleic Acids Res 19: 4293.
19. Ramsch C, Pfahlberg AB, Gefeller O (2009) Point and interval estimation of
partial attributable risks from case-control data using the R-package ‘pARccs’.
Comput Methods Programs Biomed 94: 88–95.
20. McKeigue PM (1998) Mapping genes that underlie ethnic differences in disease
risk: methods for detecting linkage in admixed populations, by conditioning on
parental admixture. Am J Hum Genet 63: 241–251.
21. Wright S Variability within and among Natural Populations: University of
Chicago Press.
22. Wright S (1951) The genetic structure of populations. Ann Eugen 15: 323–354.
23. Amato R, Pinelli M, Monticelli A, Marino D, Miele G, et al. (2009) Genome-
wide scan for signatures of human population differentiation and their
relationship with natural selection, functional pathways and diseases. PLoS
One 4: e7927.
24. The International Study of Asthma and Allergies in Childhood (ISAAC)
Steering Committee (1998) Worldwide variation in prevalence of symptoms of
asthma, allergic rhinoconjunctivitis, and atopic eczema: ISAAC. Lancet 351:
1225–1232.
25. Nei M (1986) Definition and estimation of fixation indices. Evolution 40:
643–645.
26. Weir B (1984) Estimating F-statistics for the analysis of population structure.
Evolution 38: 1358–1370.
27. Carlson CS, Eberle MA, Rieder MJ, Yi Q, Kruglyak L, et al. (2004) Selecting a
maximally informative set of single-nucleotide polymorphisms for association
analyses using linkage disequilibrium. Am J Hum Genet 74: 106–120.
28. Ke X, Cardon LR (2003) Efficient selective screening of haplotype tag SNPs.
Bioinformatics 19: 287–288.
29. Sebastiani P, Lazarus R, Weiss ST, Kunkel LM, Kohane IS, et al. (2003)
Minimal haplotype tagging. Proc Natl Acad Sci U S A 100: 9900–9905.
30. Rosenberg NA, Li LM, Ward R, Pritchard JK (2003) Informativeness of genetic
markers for inference of ancestry. Am J Hum Genet 73: 1402–1422.
31. Tian C, Gregersen PK, Seldin MF (2008) Accounting for ancestry: population
substructure and genome-wide association studies. Hum Mol Genet 17:
R143–150.
32. (1987) Standards for the diagnosis and care of patients with chronic obstructive
pulmonary disease (COPD) and asthma. This official statement of the American
Thoracic Society was adopted by the ATS Board of Directors, November 1986.
Am Rev Respir Dis 136: 225–244.
33. Akinbami LJ, Rhodes JC, Lara M (2005) Racial and ethnic differences in asthma
diagnosis among children who wheeze. Pediatrics 115: 1254–1260.
34. Arif AA, Delclos GL, Lee ES, Tortolero SR, Whitehead LW (2003) Prevalence
and risk factors of asthma and wheezing among US adults: an analysis of the
NHANES III data. Eur Respir J 21: 827–833.
35. Beckett WS, Belanger K, Gent JF, Holford TR, Leaderer BP (1996) Asthma
among Puerto Rican Hispanics: a multi-ethnic comparison study of risk factors.
Am J Respir Crit Care Med 154: 894–899.
Novel Method Identifies Six Asthma Candidate Genes
PLoS ONE | www.plosone.org 12 August 2011 | Volume 6 | Issue 8 | e23714

36. Carter-Pokras OD, Gergen PJ (1993) Reported asthma among Puerto Rican,
Mexican-American, and Cuban children, 1982 through 1984. Am J PublicHealth 83: 580–582.
37. Flores G, Fuentes-Afflick E, Barbot O, Carter-Pokras O, Claudio L, et al. (2002)
The health of Latino children: urgent priorities, unanswered questions, and aresearch agenda. JAMA 288: 82–90.
38. Lara M, Akinbami L, Flores G, Morgenstern H (2006) Heterogeneity ofchildhood asthma among Hispanic children: Puerto Rican children bear a
disproportionate burden. Pediatrics 117: 43–53.
39. Helgadottir A, Thorleifsson G, Manolescu A, Gretarsdottir S, Blondal T, et al.(2007) A common variant on chromosome 9p21 affects the risk of myocardial
infarction. Science 316: 1491–1493.40. Yamazaki H, Nakata T, Okada Y, Hirokawa N (1995) KIF3A/B: a
heterodimeric kinesin superfamily protein that works as a microtubule plusend-directed motor for membrane organelle transport. J Cell Biol 130:
1387–1399.
41. Zhang Y, Hancock WO (2004) The two motor domains of KIF3A/B coordinatefor processive motility and move at different speeds. Biophys J 87: 1795–1804.
42. Fliegauf M, Benzing T, Omran H (2007) When cilia go bad: cilia defects andciliopathies. Nat Rev Mol Cell Biol 8: 880–893.
43. Mall MA (2008) Role of cilia, mucus, and airway surface liquid in mucociliary
dysfunction: lessons from mouse models. J Aerosol Med Pulm Drug Deliv 21:13–24.
44. Kleinrath T, Gassner C, Lackner P, Thurnher M, Ramoner R (2007)
Interleukin-4 promoter polymorphisms: a genetic prognostic factor for survivalin metastatic renal cell carcinoma. J Clin Oncol 25: 845–851.
45. Frazer KA, Ballinger DG, Cox DR, Hinds DA, Stuve LL, et al. (2007) A secondgeneration human haplotype map of over 3.1 million SNPs. Nature 449:
851–861.
46. Kabesch M, Tzotcheva I, Carr D, Hofler C, Weiland SK, et al. (2003) Acomplete screening of the IL4 gene: novel polymorphisms and their association
with asthma and IgE in childhood. J Allergy Clin Immunol 112: 893–898.47. Sivaprasad U, Gibson AM, Wang N, Hershey GKK (2009) Expression of Cilia
Structural Genes is Downregulated in Asthma and Single NucleotidePolymorphisms in These Genes Correlate with Asthma. The Journal of Allergy
and Clinical Immunology 123: S81.
48. Kim JH, Cha JY, Cheong HS, Park JS, Jang AS, et al. (2011) KIF3A, a ciliastructural gene on chromosome 5q31, and its polymorphisms show an
association with aspirin hypersensitivity in asthma. Journal of ClinicalImmunology 31: 112–121.
Novel Method Identifies Six Asthma Candidate Genes
PLoS ONE | www.plosone.org 13 August 2011 | Volume 6 | Issue 8 | e23714
Top Related
Copyright © 2022 FDOKUMEN

