


Bahasa
Halaman
Hukum

COMMUNITY AND ECOSYSTEM ECOLOGY
Ichneumonoidea (Hymenoptera) Community Diversity in anAgricultural Environment in the State of Yucatan, Mexico
DAVID A. CHAY-HERNANDEZ,1 HUGO DELFIN-GONZALEZ,1,2 AND VICTOR PARRA-TABLA3
Environ. Entomol. 35(5): 1286Ð1297 (2006)
ABSTRACT Ichneumonoidea is an important group in terrestrial ecosystems, although its commu-nity structure in tropical agricultural environments is unknown. Consequently, a characterization ofichneumonoid communities was done in an agricultural environment consisting of a cultivated areawith and without surrounding vegetation in the state of Yucatan, Mexico. The characterization helpedto understand how Ichneumonoidea diversity changes in the vegetation structure adjacent a crop.Three sampling sites were established: nine experimental plots in open area with continual agriculturaluse without surrounding vegetation (NSV), nine experimental plots with surrounding vegetation ina remaining patch (WSV), and nine plots inside of secondary vegetation of a remaining 7-yr-old patch(SV). Ichneumonoidea specimens were collected with Malaise and yellow pan traps. A total of 1,715specimens were collected, divided into 40 subfamilies, resulting in 138 genera and 480 species. Of these,Braconidae accounted for 1,115 specimens from 21 subfamilies, 84 genera, and 342 species, whereasIchneumonidae was represented by 600 individuals from 19 subfamilies with 54 genera and 142 species.Braconidae had higher species richness, abundance, and diversity than Ichneumonidae. Both familiesexhibited higher diversity in the treatment with surrounding vegetation. Koinobiont species were mostcommon in both families. We suggest that vegetation structure and spatial distribution seem to havegreater effect on community structure. Our results suggest that Ichneumonoidea could be a betterindicator of the degree of disturbance than of environmental preservation.
KEY WORDS agricultural landscape, parasitoids, Braconidae, Ichneumonidae
Parasitoids account for 80% of Hymenoptera (LaSalleand Gauld 1991) and are an important guild in natu-rally maintaining insect population densities beloweconomic threshold levels. They have a signiÞcanteffect in the control of potentially damaging pest spe-cies, contributing to the natural balance of terrestrialecosystems (LaSalle and Gauld 1993, Hawkins et al.1997). As a result, they are ecologically important andcould be the most successful parasitoids in biologicalcontrol programs (Price 1975, Greathead 1986, God-fray 1994).
Many parasitoids used in biological control pro-grams have been obtained from tropical areas (Gauldand Bolton 1988, Altieri 1991, LaSalle and Gauld 1991,Garcõa 1998). These areas are currently experiencingserious biodiversity loss as a result of anthropogenicactivities, such as agriculture and cattle (Chapin et al.2000). The effect of this transformation on parasitoiddiversity is largely unknown or has only been gener-ally addressed (Cirelli and Penteado-Dias 2003a, b,Scatolini and Pentado-Dias 2003). One of the para-sitoid groups, Ichneumonoidea (Braconidae andIchneumonidae), can be used to evaluate variable
patterns of habitat disturbance and modiÞcation (Hol-loway and Stork 1991, Kremen et al. 1993, Samways1993, Delfõn and Burgos 2000), because they are sen-sitive to environmental changes (Lewis and WhitÞeld1999).
Diversity of these two families in agricultural sys-tems is inßuenced by vegetation diversity in andaround the system and the speciÞc cropÕs management(Hawkins 1994, Kuniata and Sweet 1994, Cerda 1995,Khan et al. 1997, Chay-Hernandez 1999, Nicholls andAltieri 1999). It is still unclear, however, if diversiÞ-cation of that systems favors high parasitoid diversity.Some authors have reported that temperate simpliÞedagricultural systems and open areas have higher para-sitoid diversity than diversiÞed systems and preservedareas (Lewis and WhitÞeld 1999, Menalled et al. 1999,Klein et al. 2002). Establishment of local level agri-cultural production systems involves handling the sur-rounding vegetation in different areas with differentmanagement and preservation methods. Conse-quently, the response of parasitoid communities to theestablishment of these systems need to be understoodto support development of local parasitoid manage-ment strategies.
It is also important to evaluate the response of spe-cialist (koinobionts: temporarily paralyzed host) andgeneralist species (idiobionts: permanently paralyzedhost) (Askew and Shaw 1986, Shaw and Huddleston
1 Departamento de Zoologõa, Universidad Autonoma de Yucatan,Carretera Merida-Xmatkuil Km. 15.5, Merida, Yucatan, Mexico.
2 Corresponding author, e-mail: gdelÞ[email protected] Departamento de Ecologõa, Universidad Autonoma de Yucatan,
Carretera Merida-Xmatkuil Km. 15.5, Merida, Yucatan, Mexico.
0046-225X/06/1286Ð1297$04.00/0 � 2006 Entomological Society of America
1991) before the implementation of agricultural pro-duction systems and the vegetation surrounding them.Price (1991) proposeed that, in temperate regions, thekoinobiont species dominate in the Þrst sucesionalstages and that the proportion of idiobionts graduallyincreases in late sucesional stages, based on previousresearch (Southwood et al. 1979, Coley et al. 1985,Southwood 1988, Coley and Aide 1991). Hawkins(1994) proposed a different scheme in which idio-biont species in temperate areas are more abundant inthe arboreal vegetation, whereas koinobionts aremore abundant in the herbaceous vegetation of cul-tivated areas and in the arboreal vegetation of pre-served areas. This has signiÞcant ecological implica-tions in that the specialist species are more suitable forbiological control programs because they increasethese programsÕ probability of success (Askew andShaw 1986). Therefore, it is important to evaluate ifthe distribution patterns exist locally in these life his-tory strategies especially in tropical agricultural envi-ronment.
The goal of this research was to characterize Ich-neumonoidea communities in an agricultural environ-ment consisting of cultivated areas with and withoutsurrounding vegetation in the northern Yucatan Pen-insula, Mexico, to understand how Ichneumonoideadiversity respond to differences in surrounding veg-etation. Assuming that ichneumonoid species re-sponse to this changes, high diversity and abundancelevels are expected in secondary vegetation (season-ally dry tropical forest) and low diversity is expectedin crops (either with or without surrounding vegeta-tion). Also, koinobiont species are expected to bemore diverse and abundant in recovering vegetationthan in recently established crops.
Materials and Methods
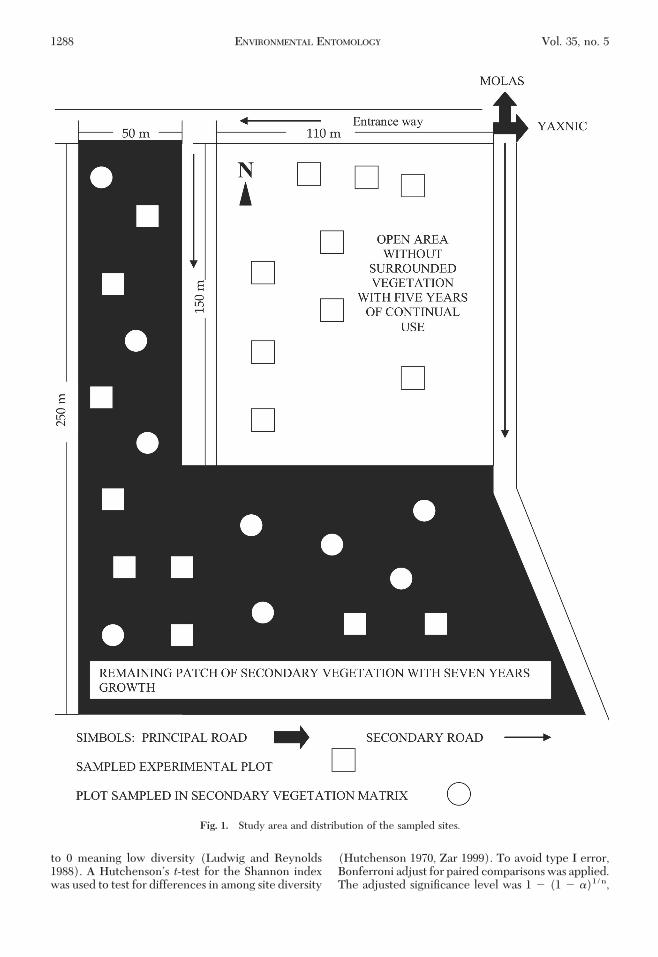
The study area was located 2.1 km south of Molastown and 550 m west of Yaxnic town, in a formerhenequen growing region of the state of Yucatan,Mexico (20�47�778� N and 89�37�750� W). Averageannual temperature in the area is 26�C; average rainfallis 940 mm (Flores and Espejel 1994). The area has avegetation mosaic formed mainly of secondary sea-sonally dry tropical forest with 7 yr of regrowth(Flores 2001) and average height of 3Ð4 m in patchesranging from 0.5 to 1.0 ha. The patches are inter-spersed with open areas of 1.5 ha characterized by 5 yrof continual agricultural use under the swidden (slash-and-burn) system and with vegetation of 40 cm aver-age height. Three sampling sites (treatments) (Fig. 1)were established as follows.
(1) Nine experimental plots were established in anopen area with continual agricultural use without sur-rounding vegetation (NSV). This area was used as asheep pasture site with frequent use of fertilizersand insecticides. The principal crops in this area wereZea mays L. (corn), Phaseolus lunatus L. (bean), Cu-curbita moschata Duch. (pumpkin), Citrullus lanatus(Thumb.) Matsumara and Nakai. (watermelon), Cap-
sicum annuum L. variety aviculare (Dierb.) D. Arcyand Exhbaugh. (chili), and Panicum maximum Jacq.(Guinean grass).
(2) Nine experimental plots were established insidethe remaining vegetation patch (WSV); thus, the ex-perimental plots were surrounded with vegetation.This area had 7 yr of fallow.
(3) Nine points inside of the secondary vegetationmatrix of the remaining vegetation patch with 7 yr offallow (SV). Experimental plots were not establishedhere. The list of species in each site is shown in Table 1.
Experimental plots placed in the Þrst two sites were225 m2; these were prepared using the swidden systemwithout a main crop and with two clearings, one inDecember and another in March. Space between plotsin the open area was 10 m and in the remaining patchwas 30 m. One Malaise trap (Martõn 1977, Wayman1994) and six yellow pan traps, randomly distributedin each plot, were used to collect the Ichneumonoidea(BarÞeld 1986). Traps were placed in each samplingsite for 48 h. Two monthly samplings were conductedbetween October 2000 and April 2001. Yellow pan trapsamplings are negatively affected by rainfall; there-fore, this research was performed during the dry sea-son in which rainfall occurs occasionally (Moya et al.2003). Collected specimens were mounted using con-ventional curatorial techniques (Shaw and Fitton1993), and determinations to genus level were madeby the authors using taxonomic keys (Townes andTownes 1966, Townes 1969a, b, 1970a, b, 1971, Gauld1991, 1997, 1998, Wharton et al. 1997). Because manyof the tropical Ichneumonoidea genera have not beenreviewed, most of the species could not be deter-mined; instead, a morphospecies criterion was used toevaluate diversity (Mayr and Ashlock 1991). Col-lected specimens were deposited in the Regional En-tomological Collection of Universidad Autonoma deYucatan.
Richness at each site was established using a Þrst-order CHAO estimator (Chao1) that allows predic-tions of expected richness for each of the areas basedon the number of observed species and their abun-dances at uniformly sized samples. This estimator wascalculated with the EstimateS (ver. 6.0b1) statisticssoftware program (Colwell 2000). To determine pos-sible differences between site communities in terms ofrichness and species dominance at each site, diversityÐabundance curves were generated using the abun-dances of the species recorded at the sites (Magurran1988).
Site diversity was estimated by Þrst establishingcommunity structure using HillÕs numbers and even-ness index, calculated with the BIODIV program (nat-ural logarithmic base) (Hill 1973, Baev and Penev1995). This number series measures the effective num-ber of species in a sample and indicates how abun-dance is distributed among them. It consists of threenumbers: N0 � total species; N1 � common species(Shannon index; Shannon 1948); and N2 � dominantspecies (inverse of SimpsonÕs index; Simpson 1949).HillÕs evenness represents community diversity, withvalues near to 1 meaning high diversity and those near
October 2006 CHAY-HERNANDEZ ET AL.: ICHNEUMONOIDEA IN AGRICULTURAL LANDSCAPE 1287
to 0 meaning low diversity (Ludwig and Reynolds1988). A HutchensonÕs t-test for the Shannon indexwas used to test for differences in among site diversity
(Hutchenson 1970, Zar 1999). To avoid type I error,Bonferroni adjust for paired comparisons was applied.The adjusted signiÞcance level was 1 � (1 � �)1/n,
Fig. 1. Study area and distribution of the sampled sites.
1288 ENVIRONMENTAL ENTOMOLOGY Vol. 35, no. 5
where n is the number of sites sampled (Bland andAltman 1995).
The use of indexes to generate categories (e.g.,dominant, common, and rare) is useful for numericallydescribing communities. Their signiÞcance must notbe overestimated, because the same species can berare, common, or dominant depending on small dif-ferences in abundance. Therefore, categories gener-ated are considered here as least common species ifthey present 1Ð5 individuals, common species if theypresent 6Ð10 individuals, and most common species ifthey have �10 individuals. A life history strategiecriterion (i.e., koinobiont, idiobiont) was also used ascomplement of the Ichneumonoidea community de-scription (Hawkins 1994). To compare the proportionof the two life strategies, their percentage on therecorded species in each site was determined, and a �2
test was applied to determine if the koinobiont andidiobiont frequencies were or were not associatedwith the site.
Possible similarity between the communities in thesites was determined by making comparisons using thesimilarity indexes of Morisita-Horn (Krebs 1989) andCody (1993). The Þrst is based on a species relativeabundance and is highly signiÞcant, whereas the sec-ond considers the rate of species turnover betweendifferent sites. The Morisita-Horn index was calcu-lated using the EstimateS ver. 6.0b1 software program(Colwell 2000) and the Cody index was determinedwith the BIODIV program (natural logarithmic base)(Baev and Penev 1995).
Results
A total of 1,715 individual specimens were collectedand belonged to 40 subfamilies, 138 genera and 480species. Of these, 1,115 individuals were Braconidae,
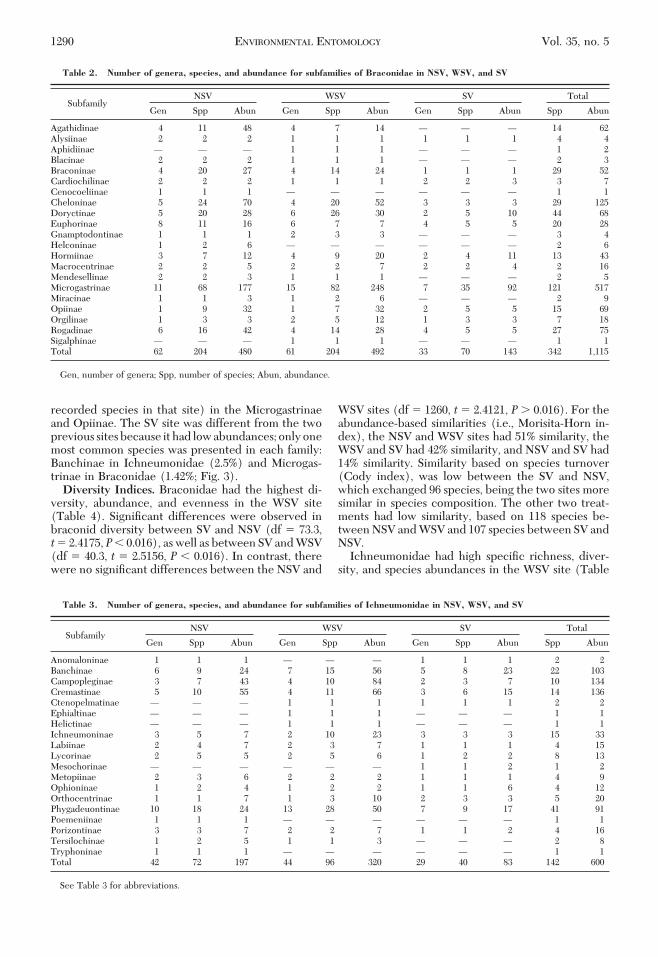
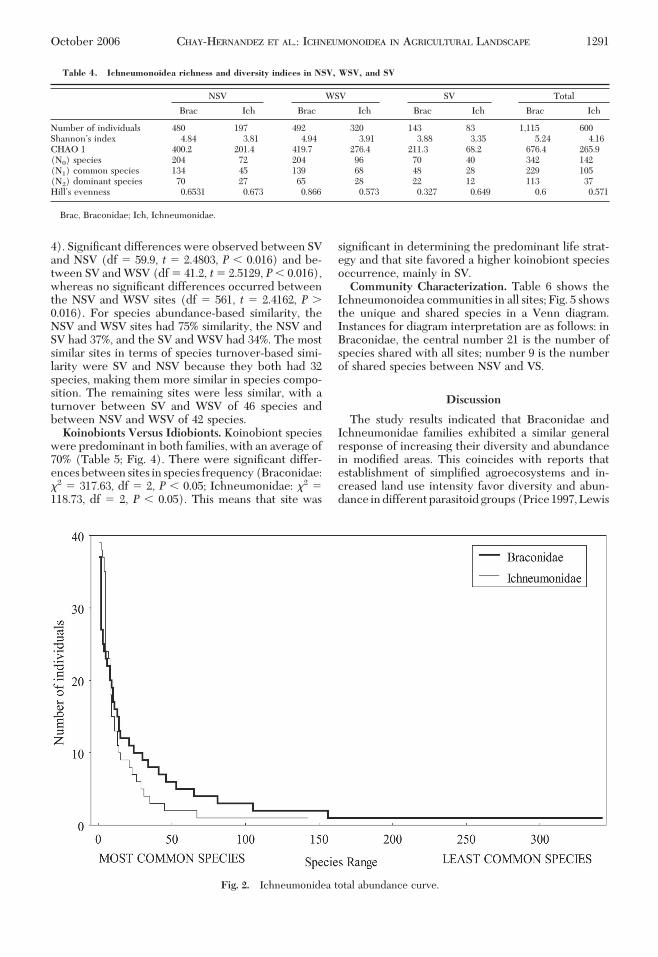
representing 21 subfamilies, 84 genera, and 342 species(Table 2), and 600 individuals were Ichneumonidaerepresenting 19 subfamilies, 54 genera, and 142 species(Table 3).
CHAO 1 estimator indicates that 676 Braconidaespecies and 266 Ichneumonidae species should havebeen found, meaning that the observed species rep-resent 50.40% (Braconidae) and 53.38% (Ichneu-monidae) of the expected value (Table 4). Number ofcollected species representing Braconidae and Ich-neumonid within the various sites were 50.96 and35.74% in the NSV site, 48.59 and 34.72% for the WSV,and 33.11 and 58.60% for SV, respectively.
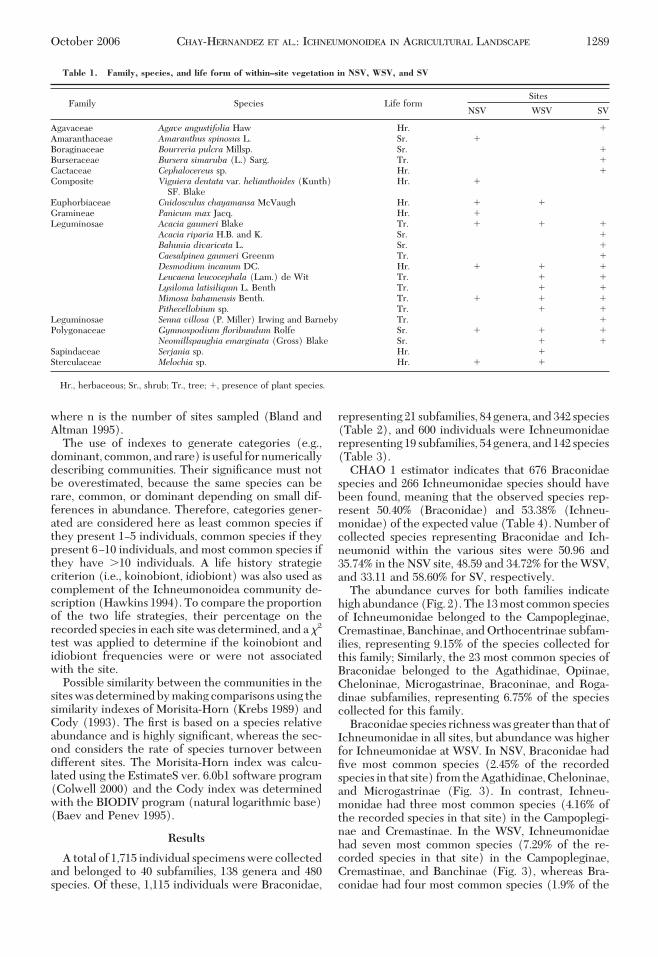
The abundance curves for both families indicatehigh abundance (Fig. 2). The 13 most common speciesof Ichneumonidae belonged to the Campopleginae,Cremastinae, Banchinae, and Orthocentrinae subfam-ilies, representing 9.15% of the species collected forthis family; Similarly, the 23 most common species ofBraconidae belonged to the Agathidinae, Opiinae,Cheloninae, Microgastrinae, Braconinae, and Roga-dinae subfamilies, representing 6.75% of the speciescollected for this family.
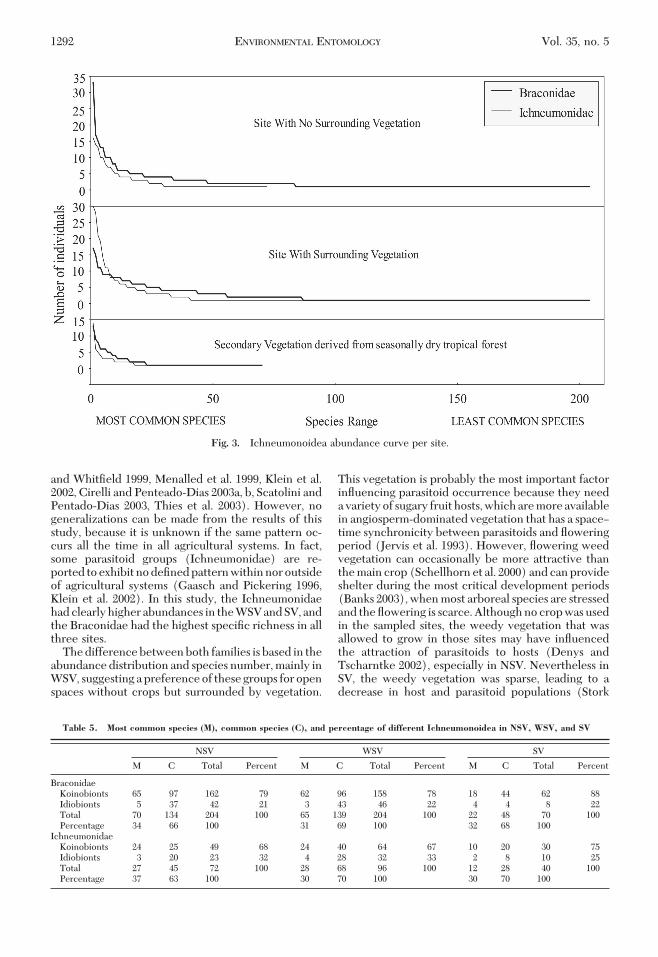
Braconidae species richness was greater than that ofIchneumonidae in all sites, but abundance was higherfor Ichneumonidae at WSV. In NSV, Braconidae hadÞve most common species (2.45% of the recordedspecies in that site) from the Agathidinae, Cheloninae,and Microgastrinae (Fig. 3). In contrast, Ichneu-monidae had three most common species (4.16% ofthe recorded species in that site) in the Campoplegi-nae and Cremastinae. In the WSV, Ichneumonidaehad seven most common species (7.29% of the re-corded species in that site) in the Campopleginae,Cremastinae, and Banchinae (Fig. 3), whereas Bra-conidae had four most common species (1.9% of the
Table 1. Family, species, and life form of within–site vegetation in NSV, WSV, and SV
Family Species Life formSites
NSV WSV SV
Agavaceae Agave angustifolia Haw Hr. �Amaranthaceae Amaranthus spinosus L. Sr. �Boraginaceae Bourreria pulcra Millsp. Sr. �Burseraceae Bursera simaruba (L.) Sarg. Tr. �Cactaceae Cephalocereus sp. Hr. �Composite Viguiera dentata var. helianthoides (Kunth)
SF. BlakeHr. �
Euphorbiaceae Cnidosculus chayamansa McVaugh Hr. � �Gramineae Panicum max Jacq. Hr. �Leguminosae Acacia gaumeri Blake Tr. � � �
Acacia riparia H.B. and K. Sr. �Bahunia divaricata L. Sr. �Caesalpinea gaumeri Greenm Tr. �Desmodium incanum DC. Hr. � � �Leucaena leucocephala (Lam.) de Wit Tr. � �Lysiloma latisiliqum L. Benth Tr. � �Mimosa bahamensis Benth. Tr. � � �Pithecellobium sp. Tr. � �
Leguminosae Senna villosa (P. Miller) Irwing and Barneby Tr. �Polygonaceae Gymnospodium floribundum Rolfe Sr. � � �
Neomillspaughia emarginata (Gross) Blake Sr. � �Sapindaceae Serjania sp. Hr. �Sterculaceae Melochia sp. Hr. � �
Hr., herbaceous; Sr., shrub; Tr., tree; �, presence of plant species.
October 2006 CHAY-HERNANDEZ ET AL.: ICHNEUMONOIDEA IN AGRICULTURAL LANDSCAPE 1289
recorded species in that site) in the Microgastrinaeand Opiinae. The SV site was different from the twoprevious sites because it had low abundances; only onemost common species was presented in each family:Banchinae in Ichneumonidae (2.5%) and Microgas-trinae in Braconidae (1.42%; Fig. 3).Diversity Indices. Braconidae had the highest di-
versity, abundance, and evenness in the WSV site(Table 4). SigniÞcant differences were observed inbraconid diversity between SV and NSV (df � 73.3,t� 2.4175, P� 0.016), as well as between SV and WSV(df � 40.3, t � 2.5156, P � 0.016). In contrast, therewere no signiÞcant differences between the NSV and
WSV sites (df � 1260, t� 2.4121, P� 0.016). For theabundance-based similarities (i.e., Morisita-Horn in-dex), the NSV and WSV sites had 51% similarity, theWSV and SV had 42% similarity, and NSV and SV had14% similarity. Similarity based on species turnover(Cody index), was low between the SV and NSV,which exchanged 96 species, being the two sites moresimilar in species composition. The other two treat-ments had low similarity, based on 118 species be-tween NSV and WSV and 107 species between SV andNSV.
Ichneumonidae had high speciÞc richness, diver-sity, and species abundances in the WSV site (Table
Table 2. Number of genera, species, and abundance for subfamilies of Braconidae in NSV, WSV, and SV
SubfamilyNSV WSV SV Total
Gen Spp Abun Gen Spp Abun Gen Spp Abun Spp Abun
Agathidinae 4 11 48 4 7 14 Ñ Ñ Ñ 14 62Alysiinae 2 2 2 1 1 1 1 1 1 4 4Aphidiinae Ñ Ñ Ñ 1 1 1 Ñ Ñ Ñ 1 2Blacinae 2 2 2 1 1 1 Ñ Ñ Ñ 2 3Braconinae 4 20 27 4 14 24 1 1 1 29 52Cardiochilinae 2 2 2 1 1 1 2 2 3 3 7Cenocoeliinae 1 1 1 Ñ Ñ Ñ Ñ Ñ Ñ 1 1Cheloninae 5 24 70 4 20 52 3 3 3 29 125Doryctinae 5 20 28 6 26 30 2 5 10 44 68Euphorinae 8 11 16 6 7 7 4 5 5 20 28Gnamptodontinae 1 1 1 2 3 3 Ñ Ñ Ñ 3 4Helconinae 1 2 6 Ñ Ñ Ñ Ñ Ñ Ñ 2 6Hormiinae 3 7 12 4 9 20 2 4 11 13 43Macrocentrinae 2 2 5 2 2 7 2 2 4 2 16Mendesellinae 2 2 3 1 1 1 Ñ Ñ Ñ 2 5Microgastrinae 11 68 177 15 82 248 7 35 92 121 517Miracinae 1 1 3 1 2 6 Ñ Ñ Ñ 2 9Opiinae 1 9 32 1 7 32 2 5 5 15 69Orgilinae 1 3 3 2 5 12 1 3 3 7 18Rogadinae 6 16 42 4 14 28 4 5 5 27 75Sigalphinae Ñ Ñ Ñ 1 1 1 Ñ Ñ Ñ 1 1Total 62 204 480 61 204 492 33 70 143 342 1,115
Gen, number of genera; Spp, number of species; Abun, abundance.
Table 3. Number of genera, species, and abundance for subfamilies of Ichneumonidae in NSV, WSV, and SV
SubfamilyNSV WSV SV Total
Gen Spp Abun Gen Spp Abun Gen Spp Abun Spp Abun
Anomaloninae 1 1 1 Ñ Ñ Ñ 1 1 1 2 2Banchinae 6 9 24 7 15 56 5 8 23 22 103Campopleginae 3 7 43 4 10 84 2 3 7 10 134Cremastinae 5 10 55 4 11 66 3 6 15 14 136Ctenopelmatinae Ñ Ñ Ñ 1 1 1 1 1 1 2 2Ephialtinae Ñ Ñ Ñ 1 1 1 Ñ Ñ Ñ 1 1Helictinae Ñ Ñ Ñ 1 1 1 Ñ Ñ Ñ 1 1Ichneumoninae 3 5 7 2 10 23 3 3 3 15 33Labiinae 2 4 7 2 3 7 1 1 1 4 15Lycorinae 2 5 5 2 5 6 1 2 2 8 13Mesochorinae Ñ Ñ Ñ Ñ Ñ Ñ 1 1 2 1 2Metopiinae 2 3 6 2 2 2 1 1 1 4 9Ophioninae 1 2 4 1 2 2 1 1 6 4 12Orthocentrinae 1 1 7 1 3 10 2 3 3 5 20Phygadeuontinae 10 18 24 13 28 50 7 9 17 41 91Poemeniinae 1 1 1 Ñ Ñ Ñ Ñ Ñ Ñ 1 1Porizontinae 3 3 7 2 2 7 1 1 2 4 16Tersilochinae 1 2 5 1 1 3 Ñ Ñ Ñ 2 8Tryphoninae 1 1 1 Ñ Ñ Ñ Ñ Ñ Ñ 1 1Total 42 72 197 44 96 320 29 40 83 142 600
See Table 3 for abbreviations.
1290 ENVIRONMENTAL ENTOMOLOGY Vol. 35, no. 5
4). SigniÞcant differences were observed between SVand NSV (df � 59.9, t � 2.4803, P � 0.016) and be-tween SV and WSV (df � 41.2, t� 2.5129, P� 0.016),whereas no signiÞcant differences occurred betweenthe NSV and WSV sites (df � 561, t � 2.4162, P �0.016). For species abundance-based similarity, theNSV and WSV sites had 75% similarity, the NSV andSV had 37%, and the SV and WSV had 34%. The mostsimilar sites in terms of species turnover-based simi-larity were SV and NSV because they both had 32species, making them more similar in species compo-sition. The remaining sites were less similar, with aturnover between SV and WSV of 46 species andbetween NSV and WSV of 42 species.Koinobionts Versus Idiobionts. Koinobiont species
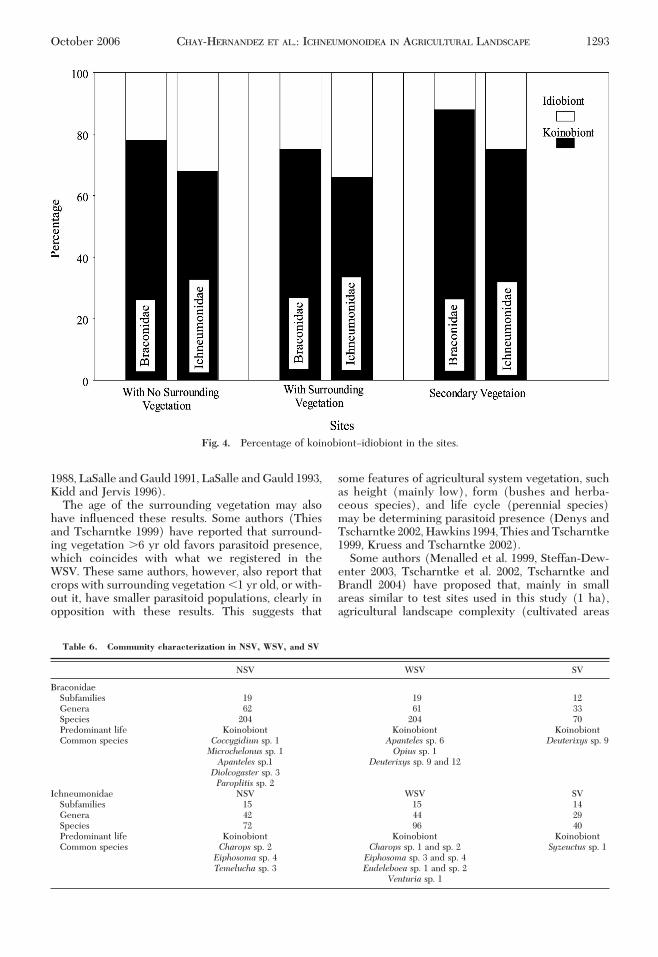
were predominant in both families, with an average of70% (Table 5; Fig. 4). There were signiÞcant differ-encesbetweensites in species frequency(Braconidae:�2 � 317.63, df � 2, P � 0.05; Ichneumonidae: �2 �118.73, df � 2, P � 0.05). This means that site was
signiÞcant in determining the predominant life strat-egy and that site favored a higher koinobiont speciesoccurrence, mainly in SV.Community Characterization. Table 6 shows the
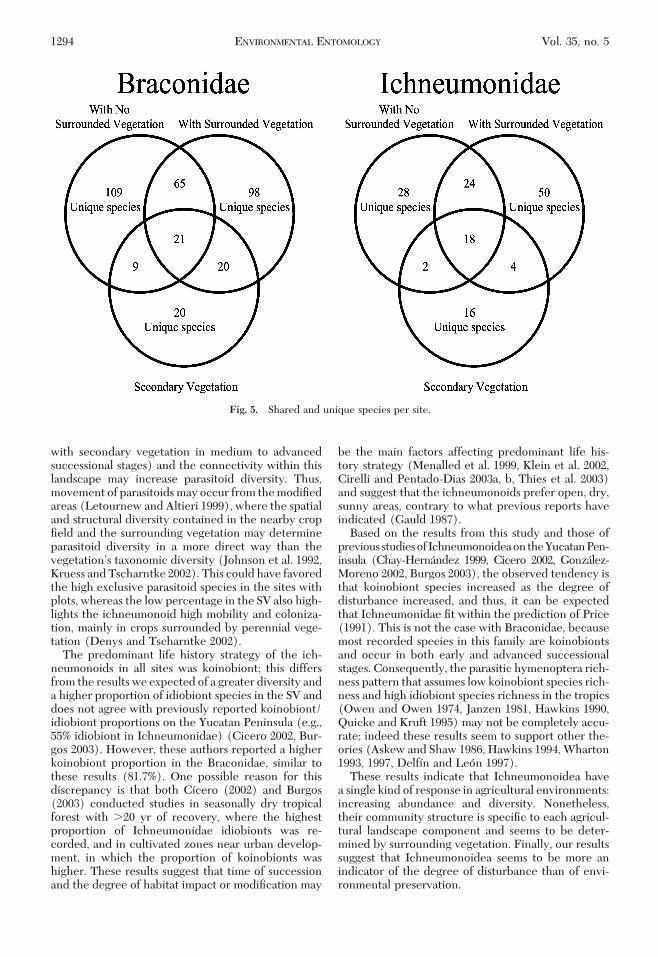
Ichneumonoidea communities in all sites; Fig. 5 showsthe unique and shared species in a Venn diagram.Instances for diagram interpretation are as follows: inBraconidae, the central number 21 is the number ofspecies shared with all sites; number 9 is the numberof shared species between NSV and VS.
Discussion
The study results indicated that Braconidae andIchneumonidae families exhibited a similar generalresponse of increasing their diversity and abundancein modiÞed areas. This coincides with reports thatestablishment of simpliÞed agroecosystems and in-creased land use intensity favor diversity and abun-dance in different parasitoid groups (Price 1997, Lewis
Fig. 2. Ichneumonidea total abundance curve.
Table 4. Ichneumonoidea richness and diversity indices in NSV, WSV, and SV
NSV WSV SV Total
Brac Ich Brac Ich Brac Ich Brac Ich
Number of individuals 480 197 492 320 143 83 1,115 600ShannonÕs index 4.84 3.81 4.94 3.91 3.88 3.35 5.24 4.16CHAO 1 400.2 201.4 419.7 276.4 211.3 68.2 676.4 265.9(N0) species 204 72 204 96 70 40 342 142(N1) common species 134 45 139 68 48 28 229 105(N2) dominant species 70 27 65 28 22 12 113 37HillÕs evenness 0.6531 0.673 0.866 0.573 0.327 0.649 0.6 0.571
Brac, Braconidae; Ich, Ichneumonidae.
October 2006 CHAY-HERNANDEZ ET AL.: ICHNEUMONOIDEA IN AGRICULTURAL LANDSCAPE 1291
and WhitÞeld 1999, Menalled et al. 1999, Klein et al.2002, Cirelli and Penteado-Dias 2003a, b, Scatolini andPentado-Dias 2003, Thies et al. 2003). However, nogeneralizations can be made from the results of thisstudy, because it is unknown if the same pattern oc-curs all the time in all agricultural systems. In fact,some parasitoid groups (Ichneumonidae) are re-ported toexhibitnodeÞnedpatternwithinnoroutsideof agricultural systems (Gaasch and Pickering 1996,Klein et al. 2002). In this study, the Ichneumonidaehad clearly higher abundances in the WSV and SV, andthe Braconidae had the highest speciÞc richness in allthree sites.
The difference between both families is based in theabundance distribution and species number, mainly inWSV, suggesting a preference of these groups for openspaces without crops but surrounded by vegetation.
This vegetation is probably the most important factorinßuencing parasitoid occurrence because they needa variety of sugary fruit hosts, which are more availablein angiosperm-dominated vegetation that has a spaceÐtime synchronicity between parasitoids and ßoweringperiod (Jervis et al. 1993). However, ßowering weedvegetation can occasionally be more attractive thanthe main crop (Schellhorn et al. 2000) and can provideshelter during the most critical development periods(Banks 2003), when most arboreal species are stressedand the ßowering is scarce. Although no crop was usedin the sampled sites, the weedy vegetation that wasallowed to grow in those sites may have inßuencedthe attraction of parasitoids to hosts (Denys andTscharntke 2002), especially in NSV. Nevertheless inSV, the weedy vegetation was sparse, leading to adecrease in host and parasitoid populations (Stork
Fig. 3. Ichneumonoidea abundance curve per site.
Table 5. Most common species (M), common species (C), and percentage of different Ichneumonoidea in NSV, WSV, and SV
NSV WSV SV
M C Total Percent M C Total Percent M C Total Percent
BraconidaeKoinobionts 65 97 162 79 62 96 158 78 18 44 62 88Idiobionts 5 37 42 21 3 43 46 22 4 4 8 22Total 70 134 204 100 65 139 204 100 22 48 70 100Percentage 34 66 100 31 69 100 32 68 100
IchneumonidaeKoinobionts 24 25 49 68 24 40 64 67 10 20 30 75Idiobionts 3 20 23 32 4 28 32 33 2 8 10 25Total 27 45 72 100 28 68 96 100 12 28 40 100Percentage 37 63 100 30 70 100 30 70 100
1292 ENVIRONMENTAL ENTOMOLOGY Vol. 35, no. 5
1988, LaSalle and Gauld 1991, LaSalle and Gauld 1993,Kidd and Jervis 1996).
The age of the surrounding vegetation may alsohave inßuenced these results. Some authors (Thiesand Tscharntke 1999) have reported that surround-ing vegetation �6 yr old favors parasitoid presence,which coincides with what we registered in theWSV. These same authors, however, also report thatcrops with surrounding vegetation �1 yr old, or with-out it, have smaller parasitoid populations, clearly inopposition with these results. This suggests that
some features of agricultural system vegetation, suchas height (mainly low), form (bushes and herba-ceous species), and life cycle (perennial species)may be determining parasitoid presence (Denys andTscharntke 2002, Hawkins 1994, Thies and Tscharntke1999, Kruess and Tscharntke 2002).
Some authors (Menalled et al. 1999, Steffan-Dew-enter 2003, Tscharntke et al. 2002, Tscharntke andBrandl 2004) have proposed that, mainly in smallareas similar to test sites used in this study (1 ha),agricultural landscape complexity (cultivated areas
Fig. 4. Percentage of koinobiontÐidiobiont in the sites.
Table 6. Community characterization in NSV, WSV, and SV
NSV WSV SV
BraconidaeSubfamilies 19 19 12Genera 62 61 33Species 204 204 70Predominant life Koinobiont Koinobiont KoinobiontCommon species Coccygidiun sp. 1 Apanteles sp. 6 Deuterixys sp. 9
Microchelonus sp. 1 Opius sp. 1Apanteles sp.1 Deuterixys sp. 9 and 12Diolcogaster sp. 3Paroplitis sp. 2
Ichneumonidae NSV WSV SVSubfamilies 15 15 14Genera 42 44 29Species 72 96 40Predominant life Koinobiont Koinobiont KoinobiontCommon species Charops sp. 2 Charops sp. 1 and sp. 2 Syzeuctus sp. 1
Eiphosoma sp. 4 Eiphosoma sp. 3 and sp. 4Temelucha sp. 3 Eudeleboea sp. 1 and sp. 2
Venturia sp. 1
October 2006 CHAY-HERNANDEZ ET AL.: ICHNEUMONOIDEA IN AGRICULTURAL LANDSCAPE 1293
with secondary vegetation in medium to advancedsuccessional stages) and the connectivity within thislandscape may increase parasitoid diversity. Thus,movement of parasitoids may occur from the modiÞedareas (Letournew and Altieri 1999), where the spatialand structural diversity contained in the nearby cropÞeld and the surrounding vegetation may determineparasitoid diversity in a more direct way than thevegetationÕs taxonomic diversity (Johnson et al. 1992,Kruess and Tscharntke 2002). This could have favoredthe high exclusive parasitoid species in the sites withplots, whereas the low percentage in the SV also high-lights the ichneumonoid high mobility and coloniza-tion, mainly in crops surrounded by perennial vege-tation (Denys and Tscharntke 2002).
The predominant life history strategy of the ich-neumonoids in all sites was koinobiont; this differsfrom the results we expected of a greater diversity anda higher proportion of idiobiont species in the SV anddoes not agree with previously reported koinobiont/idiobiont proportions on the Yucatan Peninsula (e.g.,55% idiobiont in Ichneumonidae) (Cicero 2002, Bur-gos 2003). However, these authors reported a higherkoinobiont proportion in the Braconidae, similar tothese results (81.7%). One possible reason for thisdiscrepancy is that both Cõcero (2002) and Burgos(2003) conducted studies in seasonally dry tropicalforest with �20 yr of recovery, where the highestproportion of Ichneumonidae idiobionts was re-corded, and in cultivated zones near urban develop-ment, in which the proportion of koinobionts washigher. These results suggest that time of successionand the degree of habitat impact or modiÞcation may
be the main factors affecting predominant life his-tory strategy (Menalled et al. 1999, Klein et al. 2002,Cirelli and Pentado-Dias 2003a, b, Thies et al. 2003)and suggest that the ichneumonoids prefer open, dry,sunny areas, contrary to what previous reports haveindicated (Gauld 1987).
Based on the results from this study and those ofpreviousstudiesofIchneumonoideaontheYucatanPen-insula (Chay-Hernandez 1999, Cicero 2002, Gonzalez-Moreno 2002, Burgos 2003), the observed tendency isthat koinobiont species increased as the degree ofdisturbance increased, and thus, it can be expectedthat Ichneumonidae Þt within the prediction of Price(1991). This is not the case with Braconidae, becausemost recorded species in this family are koinobiontsand occur in both early and advanced successionalstages. Consequently, the parasitic hymenoptera rich-ness pattern that assumes low koinobiont species rich-ness and high idiobiont species richness in the tropics(Owen and Owen 1974, Janzen 1981, Hawkins 1990,Quicke and Kruft 1995) may not be completely accu-rate; indeed these results seem to support other the-ories (Askew and Shaw 1986, Hawkins 1994, Wharton1993, 1997, Delfõn and Leon 1997).
These results indicate that Ichneumonoidea havea single kind of response in agricultural environments:increasing abundance and diversity. Nonetheless,their community structure is speciÞc to each agricul-tural landscape component and seems to be deter-mined by surrounding vegetation. Finally, our resultssuggest that Ichneumonoidea seems to be more anindicator of the degree of disturbance than of envi-ronmental preservation.
Fig. 5. Shared and unique species per site.
1294 ENVIRONMENTAL ENTOMOLOGY Vol. 35, no. 5
Acknowledgments
The authors thank the Consejo Nacional de Ciencia yTecnologõa for Þnancially supporting this research throughGrant 25016N.
References Cited
Altieri, M. A. 1991. Classical biological control and socialequity. Bull. Entomol. Res. 81: 365Ð369.
Askew,R.R., andM.R. Shaw. 1986. Parasitoid communities:their size, structure and development, pp. 225Ð264. InJ. Waage and D. Greathead (eds.), Insect parasitoids,Academic, London, UK.
Baev, P., and L. Penev. 1995. BIODIV: program for calcu-lating biological diversity parameters, similarity, nicheoverlap and cluster analysis. PENSOFT. Sofõa-Moscu,Russian Republic.
Banks, J. E. 2003. Inßuence of plant diversity on herbivoresand natural enemies, pp. 112Ð120. In O. Koul and G.S.Dhaliwal (eds.), Predators and parasitoids. Taylor andFrancis Group, London, UK.
Barfield, C. S. 1986. El muestreo en el manejo integrado deplagas, pp. 145Ð162. In K. L. Andrews and J. R. Quezada(eds.), Manejo integrado de plagas insectiles en la agri-cultura, estado actual y futuro. Tegucigalpa, Honduras.
Bland, J. M., and D. G. Altman. 1995. Multiple signiÞcancetests: the Bonferroni method. Br. Med. J. 310: 170.
Burgos, R. D. 2003. Evaluacion de las comunidades de hy-menopteros parasitoides y las relaciones huesped-para-sitoide en una milpa de roza-tumba y quema en el Estadode Yucatan, Mexico. MS thesis, Universidad Autonoma deYucatan, Mexico.
Cerda, O.G.M. 1995. Respuesta de la fauna beneÞca delcafeto (Coffea arabica) a varias frecuencias de aplicacionde endosulfan, en Costa Rica. MS thesis, Centro Agro-nomico Tropical de Investigacion y Ensenanza, Turrialba,Costa Rica.
Chay-Hernandez, D. A. 1999. Diversidad y abundancia dela comunidad de braconidos (Hymenoptera: Ichneu-monoidea) en cultivos de cucurbitaceas y solanaceas y enuna selva baja caducifolia en Yucatan, Mexico. BSc dis-sertation, Universidad Autonoma de Yucatan, Mexico.
Chapin, S. F., III, E. S. Zavaleta, T. E. Valerie, L. R. Ypecul,M. Ypecu, M. P. Vitousek, L. H. Reynolds, U. D. Hooper,S. Lavorel, E. O. Salai, E. S. Hobbie, C. M. Mack, andS. Dıaz. 2000. Consequences of changing biodiversity.Nature (Lond.) 405: 234Ð242.
Cicero, J. L. 2002. Estructura y comportamiento estacionalde comunidades de Ichneumonidae (Hymenoptera) y sucomparacion con Braconidae (Hymenoptera) en dos sel-vas bajas del estado de Yucatan. BSc dissertation, Uni-versidad Autonoma de Yucatan, Mexico.
Cirelli, N.R.K., and M. A. Pentado-Dias. 2003a. Analise dariqueza da fauna de Braconidae (Hymenoptera, Ichneu-monoidea) em remanescentes naturais da Area de Pro-tecao Ambiental (APA) de Descalvado, SP. Rev. Braz.Entomol. 47: 89Ð98.
Cirelli, N.R.K., and M. A. Pentado-Dias. 2003b. Fenologiados Braconidae (Hymenoptera, Ichneumonoidea) daArea de Protecao Ambiental (APA) de Descalvado, SP.Rev. Braz. Entomol. 47: 99Ð105.
Cody, M. 1993. Bird diversity components within and be-tween habitats in Australia. In R. Ricklefsy and D.Schluter (eds.), Species diversity in ecological commu-nities, historical and geographical perspectives. The Uni-versity of Chicago Press, Chicago, IL.
Coley, P.D., andT.M.Aide. 1991. Comparison of herbivoryand plant defenses in temperate and tropical broad-leaved forest, pp. 25Ð49. In P. W. Price, T. M. Lewinsohn,G.W.Fernandes, andN.B.Woodruff (eds.),Plant-animalinteractions: evolutionary ecology in tropical and tem-perate regions. Wiley, New York.
Coley, P. D., P. Bryant, and F. S. Chapin. 1985. Resourceavailability and plant anti-herbivore defense. Science 230:895Ð899.
Colwell, R. K. 2000. Estimates: Statistical estimation ofspecies richness and shared species from samples. Version6.0 b1. UserÕs guide and application. http: //viceroy.eeb.uconn.edu/estimates.
Delfın, G. H., and F. Leon. 1997. Generos de Braconidae(Hymenoptera) en Yucatan. Algunos elementos para elplanteamiento de Patrones de Riqueza. Acta Zool. Mex.70: 65Ð77.
Delfın, G. H., and D. Burgos. 2000. Los Braconidos (Hy-menoptera: Braconidae) como grupo parametro de biodi-versidad en las selvas deciduas del tropico: una discusionacerca de su posible uso. Acta Zool. Mex. 79: 43Ð56.
Denys, C., and T. Tscharntke. 2002. Plant-insect communi-ties and predator-prey ratios in Þeld margin strips, adja-cent crop Þelds, and fallows. Oecologia (Berl.) 130: 315Ð324.
Flores, J. S. 2001. Leguminosae. Etnoßora Yucatanense 18:1Ð320.
Flores, J. S., and I. Espejel. 1994. Tipos de vegetacion de lapenõnsula de Yucatan. Etnoßora Yucatanense 3: 65Ð70.
Garcıa, E. R. 1998. Manejo de agroecosistemas tropicales,pp. 120. In C. R. Ferrera and M. J. Perez (eds.), Manejode agroecosistemas sostenibles. Universidad Vera-cruzana, Mexico.
Gaasch,M.C., and J. Pickering. 1996. Distribution and com-munity succession of specialist and generalist parasiticwasps (Hymenoptera: Ichneumonidae) in a heteroge-nous landscape in Georgia�s Piedmont. Insect DiversityProject. University of Georgia, Athens, GA.
Gauld, I. 1987. Some factors affecting the composition oftropical ichneumonid faunas. Biol. J. Linn. Soc. 30: 299Ð312.
Gauld, I. 1991. The Ichneumonidae of Costa Rica, 1. Intro-duction, keys to subfamilies, and keys to species of thelower pimpliform subfamilies Rhyssinae, Pimplinae,Poemeniinae, Acaennitinae and Cyllocerinae. Mem. Am.Entomol. Inst. 47: 1Ð589.
Gauld, I. 1997. The Ichneumonidae of Costa Rica, 2. Intro-duction and keys to species of the smaller subfamiliesAnomalinae, Ctenopelmatinae, Diplazontinae, Lycorini-nae, Phrudinae, Tryphoninae, (excluding. Netelia) andXoridinae, with ann appendix on the Rhyssinae. Mem.Am. Entomol. Inst. 57: 1Ð485.
Gauld, I., and B. Bolton. 1988. The Hymenoptera. BritishMuseum (Natural History) and Oxford University Press.Oxford, UK.
Gauld, I.D., J. A. Ugalde-Gomez, andP.Hanson. 1998. Guõade los Pimplinae de Costa Rica (Hymenoptera: Ichneu-monidae). Rev. Biol. Trop. 46 (suppl 1): 1Ð189.
Godfray,H.C.J. 1994. Parasitoids. Behavioral and evolution-ary ecology. Princeton University Press, Princeton, NJ.
Gonzalez-Moreno, A. 2002. Estructura de las comunidadesde Braconidae (Hymenoptera: Ichneumonoidea) en unaselva baja caducifolia decidua y en una selva baja caduci-folia espinosa de Yucatan, Mexico. BSc dissertation, Uni-versidad Autonoma de Yucatan, Mexico.
Greathead,D. J. 1986. Parasitoids in classical biological con-trol, pp. 290Ð318. In J. Waage and D. Greathead (eds.),Insect parasitoids. Academic, London, UK.
October 2006 CHAY-HERNANDEZ ET AL.: ICHNEUMONOIDEA IN AGRICULTURAL LANDSCAPE 1295
Hawkins, B. A. 1990. Global patterns of parasitoid assem-blage size. J. Anim. Ecol. 59: 57Ð72.
Hawkins, B. A. 1994. Pattern and process in host-parasitoidinteractions. Cambridge University Press, Ascot, UK.
Hawkins, B. A., V. H. Cornell, and M. E. Hochberg. 1997.Predators, parasitoids, and pathogens as mortality agentsin phytophagous insect populations. Ecology 78: 2145Ð2152.
Hill, M. O. 1973. Diversity and evenness. A unifying nota-tion and its consequences. Ecology 54: 427Ð432.
Holloway, J. D., and N. E. Stork. 1991. The dimensions ofbiodiversity: the use of invertebrates as indicators ofhuman impact, pp. 37Ð62. InD. L. Hawksworth (ed.), Thebiodiversity of microorganisms and invertebrates: its rolein sustainable agriculture. CAB International, Walling-ford, UK.
Hutchenson, K. 1970. A test for comparing diversities basedon the Shannon formula. J. Theor. Biol. 29: 151Ð154.
Janzen, D. H. 1981. The peak in North American ichneu-monid species richness lies between 38� and 42� N. Ecol-ogy 62: 532Ð537.
Jervis,M.A.,A.N.Kidd,G.M.Fitton, andA.H.Dawah. 1993.Flower-visiting by hymenopteran parasitoids. J. Nat. Hist.27: 67Ð105.
Johnson, A. R., J. A.Wiens, B. T.Milne, andT.O.Crist. 1992.Animal movements and population dynamics in hetero-geneous landscapes. Landscape Ecol. 7: 63Ð75.
Khan, Z. R., K. Ampong-Nyarko, P. Chiliswa, A. Hassanali,S. Kimani, W. Lwande, W. A. Overholt, J. A. Pickett,L. E. Smart, L. J. Wadhams, and C. M. Woodcock. 1997.Intercropping increases parasitism of pests. Nature(Lond.) 388: 631Ð632.
Kidd, N.A.C., and M. A. Jervis. 1996. Population dynamics,pp. 293Ð374. InM. A. Jervis and N.A.C. Kidd (eds.), Insectnatural enemies, practical approaches to their study andevaluation. Chapman & Hall. London, UK.
Klein, A. M., I. Steffan-Dewenter, D. Bulhori, and T.Tscharntke. 2002. Effects of land-use intensity in tropi-cal agroforestry systems on Coffe ßower-visiting and trap-nesting bees and wasps. Conserv. Biol. 6: 1003Ð1014.
Krebs, C. J. 1989. Ecological methodology. New York:Harper Collins.
Kremen, C., R. Colwell, T. Erwin, D. Murphy, R. Noss, andM. Sanjayan. 1993. Terrestrial arthropod assemblages:their use in conservation planning. Conserv. Biol. 7: 796Ð808.
Kruess, A., and T. Tscharntke. 2000. Species richness andparasitism in a fragmented landscape: experiments andÞeld studies with insects on Vicia sepium. Oecology 122:129Ð137.
Kruess, A., and T. Tscharntke. 2002. Contrasting responsesof plant and insect diversity to variation in grazing in-tensity. Biol. Control 106: 293Ð302.
Kuniata,L. S., andC.P.M.Sweet. 1994. Management ofSesa-mia griscens Walker (Lep.: Noctuidae), a sugar-caneborer in Papua New Guinea. Crop Prot. 13: 488Ð493.
LaSalle, J., and I. D. Gauld. 1991. Parasitic Hymenopteraand the biodiversity crisis. Redia 74: 315Ð334.
LaSalle, J., and I. D. Gauld. 1993. Hymenoptera and thebiodiversity. CAB. Wallingford, Oxon, UK.
Letournew, K. D., and M. A. Altieri. 1999. Enviromentalmanagement to enhance biological control in agroeco-systems, pp. 319Ð354. In S. T. Bellows and W. T. Fisher(eds.), Handbook of biological control. Academic, SanDiego, CA.
Lewis, C. N., and J. B. Whitfield. 1999. Braconid wasp (Hy-menoptera: Braconid) diversity in forest plots under dif-
ferent silvicultural methods. Environ. Entomol. 6: 986Ð997.
Ludwig, J. A., and J. F. Reynolds. 1988. Statistical ecology. Aprimer on methods and computing. John Wiley & Sons:Canada.
Magurran, A. E. 1988. Ecological diversity and its measure.Princeton University Press, Princeton, NJ.
Martın, J.E.H. 1977. The insects and arachnids of Canada.Part 1: collecting, preparing and preserving insects, mitesand spiders. Research Branch Canada Department ofAgriculture, Ottawa, Canada.
Mayr, E., and P. D. Ashlock. 1991. Principles of systematiczoology. McGraw-Hill, New York.
Menalled, F., C. P. Marino, S. Gage, and A. D. Landis. 1999.Does agricultural landscape structure affect parasitismand parasitoid diversity? Ecol. Appl. 9: 634Ð641.
Moya, G. X., A. Caamal, K. B. Ku, X. E. Chan, I. Armendariz,J. Flores, J.Moguer, P.M.Noh,M. Rosales, andD. J. Xool.2003. La agricultura campesina de los mayas en Yucatan.LEISA Rev. De Agro. Edicion Especial. S/N: 7Ð17.
Nicholls, I. C., andM. A. Altieri. 1999. Control biologico enagroecosistemas mediante el manejo de insectos ento-mofagos. Bol. Agroecol. Lima, Peru.
Owen, D. F., and J. Owen. 1974. Species diversity in tem-perate and tropical Ichneumonidae. Nature (Lond.) 249:583Ð584.
Price, W. P. 1975. Insect ecology. Wiley, New York.Price, W. P. 1991. Evolutionary theory of host and parasi-
toid interactions. Biol. Control 1: 83Ð93.Price, W. P. 1997. Insect ecology. Wiley, New York.Quicke, D. L., and R. A. Kruft. 1995. Latitudinal gradients
in North American braconid wasp species richness andbiology. J. Hym. Res. 4: 194Ð203.
Samways, M. J. 1993. Insects in biodiversity conservation:some perspectives and directives. Biodiv. Conserv. 2:258Ð282.
Scatolini, D., and M. A. Pentado-Dias. 2003. Analise faunõs-tica de Braconidae (Hymenoptera) em tres areas de matanativa do Estado de Parana, Brasil. Rev. Braz. Entomol. 47:187Ð195.
Schellhorn, N. A., J. P. Harmon, and D. A. Andow. 2000.Using cultural practices to enhance insect pest control bynatural enemies, pp. 147Ð170. In J. E. Rechcigl andN. A. Rechcigl (eds.), Insect pest management. LewisPublishers, USA.
Shannon, C. E. 1948. A mathematical theory of communi-cation. The Bell System. Tech. J. 27: 379Ð423, 623Ð656.
Shaw, M. R., and T. Huddleston. 1991. ClassiÞcation andbiology of braconid wasps. (Hymenoptera: Braconidae).Handbooks for the identiÞcation of British insects. RoyalEntomology Society, London, UK.
Shaw,M.R., andM.G. Fitton. 1993. Rearing and preservingparasitoids (Hymenoptera and Diptera) of butterßiesand other Lepidoptera. Natural Museum of Scotland,Edinburg, Scotland.
Simpson, E. H. 1949. Measurement of diversity. Nature(Lond.) 163: 688.
Southwood, T.R.E. 1988. Tactics, strategies and templets.Oikos 52: 3Ð18.
Southwood, T.R.E., V. K. Brown, and P. M. Reader. 1979.The relationship of plant and insect diversities in succes-sion. Biol. J. Linn. Soc. 12: 327Ð348.
Steffan-Dewenter, I. 2003. Importance of habitat area andlandscape context for species richness of bees and waspin fragmented orchard meadows. Conserv. Biol. 17: 1036Ð1044.
Stork, N. E. 1998. Insect diversity: facts and ypeculation.Biol. J. Linn. Soc. 35: 321Ð337.
1296 ENVIRONMENTAL ENTOMOLOGY Vol. 35, no. 5
Thies,C., andT.Tscharntke. 1999. Landscape structure andbiological control in agroecosystems. Science 285: 893Ð895.
Thies, C., I. Steffan-Dewenter, and T. Tscharntke. 2003. Ef-fects of landscape context on herbivory and parasitism atdifferent spatial scales. Oikos 101: 18Ð25.
Townes, H. 1969a. The genera of Ichneumonidae, part 1.Mem. Am. Entomol. Inst. 11: 1Ð300.
Townes, H. 1969b. The genera of Ichneumonidae, part 4.Mem. Am. Entomol. Inst. 17: 1Ð372.
Townes, H. 1970a. The genera of Ichneumonidae, part 2.Mem. Am. Entomol. Inst. 12: 1Ð537.
Townes, H. 1970b. The genera of Ichneumonidae, part 3.Mem. Am. Entomol. Inst. 13: 1Ð307.
Townes, H. 1971. The genera of Ichneumonidae, part 4.Mem. Am. Entomol. Inst. 17: 1Ð367.
Townes, H., and M. Townes. 1966. A catalogue and reclas-siÞcation of the neotropic Ichneumonidae. Mem. Am.Entomol. Inst. 8: 1Ð367.
Tscharntke, T., and R. Brandl. 2004. Plant-insect interac-tions in fragmented landscapes. Annu. Rev. Entomol. 49:405Ð430.
Tscharntke, T., I. Steffan-Dewenter, A. Kruess, and C. Thies.2002. Contribution of small habitat fragments to conser-
vation of insect communities of grassland-cropland land-scapes. Ecol. Appl. 12: 354Ð364.
Wayman, L. D. 1994. Spatial distribution and sex ratios ofparasitic Hymenoptera (Ichneumonidae: Campoplegi-nae and Ichneumoninae, Braconidae: Aphidius ervi) in adisturbed Georgia piedmont landscape. MS thesis, Uni-versity of Georgia, Athens, GA.
Wharton, R. A. 1993. Bionomics of the Braconidae. Annu.Rev. Entomol. 38: 121Ð143.
Wharton, R. A. 1997. Introduction. In R. A. Wharton,P. Marsh, and M. J. Sharkey (eds.), Manual of the NewWorld genera of the family Braconidae. InternationalSociety of Hymenopterists, Washington, DC. Pp. 1Ð438.
Wharton, R. A., P. Marsh, and M. J. Sharkey (eds). 1997.Manual of the New World genera of the family Bra-conidae. International Society of Hymenopterists, Wash-ington, DC.
Zar, J. H. 1999. Biostatistical analysis. Prentice-Hall, UpperSaddle River, NJ.
Received for publication 11 October 2004; accepted 27 May2006.
October 2006 CHAY-HERNANDEZ ET AL.: ICHNEUMONOIDEA IN AGRICULTURAL LANDSCAPE 1297
Top Related
Copyright © 2022 FDOKUMEN

