


Bahasa
Halaman
Hukum


ORIGINAL ARTICLE
Hydrogeology and hydrogeochemistry of Gunyuzu semi-aridbasin (Eskisehir, Central Anatolia)
Muhterem Demiroglu • Yuksel Orgun •
Cenk Yaltırak
Received: 25 May 2009 / Accepted: 8 February 2011 / Published online: 4 March 2011
� Springer-Verlag 2011
Abstract Groundwater is often the only water source in
semi-arid regions of Turkey. Gunyuzu Basin, located in
the Sakarya River basin, SW of Eskisehir, exhibits semi-
arid conditions. The study area is composed of Paleozoic
metamorphic rocks, Eocene granitic rocks, Neogene sed-
imentary rocks, and Quaternary alluvium. In the basin,
Paleozoic Marbles are the main reservoir rocks for hot
and cold water, bordered by impermeable diabases dykes
at the sides and by impermeable granites and schists.
Neogene-aged limestones, conglomerates and alluvium
represent the other significant aquifers. Water samples
chosen to exemplify the aquifer characteristics, were
collected from springs and wells in both the dry and the
wet seasons. The cation and anion permutation of the
samples show that carbonates are the dominant lithology
in the formation of chemical composition. d18O (-11.2 to
-8.9%) and d2H (-79 to -60%) isotopic values show
that all waters (thermal and cold) are meteoric in origin.
The hydrological, hydrochemical, and isotopic properties
of the waters reveal that there exist two main groups of
groundwater systems; one of these is deep circulating,
while the other one is shallow. Tritium values, 0–4 TU
(Tritium Unit) indicate the presence of old, static water in
these aquifer systems.
Keywords Aquifer � Gunyuzu basin � Groundwater �Hydrogeochemistry � Isotope
Introduction
The feature that differentiates groundwater from other nat-
ural sources is that they are renewable except for fossil water.
Groundwaters are too valuable to be consumed rapidly and
polluted, since they are formed under paleoclimatic condi-
tions that lasted hundreds of thousands of years. There is
some imbalance between recharge and discharge which is
significant because groundwater is the principal water source
in arid, semi-arid regions. Therefore, it is very important to
know about the renewable time of the groundwater.
Recently, important developments have been recorded in the
recharge calculations of semi-arid basins (Gieske and De
Vries 1990; Shurbaji and Campbell 1997; Dennis and Mur-
ray 2002; Aquilina et al. 2005). Especially in karstic areas,
geological drainage area, and topographic drainage area are
not coincident, which complicates the rainfall and recharge
calculations (Dennis and Murray 2002; Kacaroglu 1999). In
the definition of the hydrodynamic structures of the karstic
aquifers, and in the calculations of the water budget, stable
and radiogenic isotope analyses and geographic information
technologies such as data collection and processing tech-
niques have been used (Tezcan 1993; Zuber 1983; Ozaydınet al. 2001; White 2002; Dennis and Murray 2002; Aydın2005; Shaban et al. 2006).
In this study, hydrogeological and hydrogeochemical
characteristics of the Gunyuzu basin (Fig. 1) were defined
using precipitation data, in-situ pumping test data, and
seasonal water chemistry and isotopic analyses. A con-
ceptual hydrogeological model of the basin was con-
structed using this information.
M. Demiroglu (&) � Y. Orgun � C. Yaltırak
ITU Mining Faculty, Geological Engineering,
Istanbul Technical University, 34469 Ayazaga,
Istanbul, Turkey
e-mail: [email protected]
123
Environ Earth Sci (2011) 64:1433–1443
DOI 10.1007/s12665-011-0967-2

Material and method
Eighteen groundwater samples were collected in nine sites
during dry (August and September 2005) and wet (March
and April 2006) periods in accordance with United State
Environmental Protection Agency methodologies (US EPA
2000a). The groundwater, from which the samples were
collected through springs and wells, is used for drinking
and irrigation purposes by population in the region. Of
these, one is a thermal spring (K7). Sampling sites repre-
senting different recharge and discharge zones were
selected in terms of aquifer characteristics and the sites are
shown in a hydrogeological map of the study area (Fig. 2).
Information on the basic characteristics of the sampling
sites, such as lithology, temperature (T), and yield (Q) are
given in Table 1.
Fig. 1 a The location map of the study area, b Gunyuzu Basin
1434 Environ Earth Sci (2011) 64:1433–1443
123

Physical properties of the water samples such as pH,
redox potential (Eh; mV), temperature (T; �C), electrical
conductivity (EC; lS/cm), dissolved oxygen (DO; mg/lt),
total dissolved solids (TDS; mg/l) and salinity (ppt) were
measured in situ with portable devices (YSI 556 MPS)
that were calibrated with standard solutions. Acidity and
Fig. 2 Hydrogeological map of
the study area
Table 1 Basic characteristic of
the sampling locationsSample Type Lithology Discharge
elevation (m)
Yield (l/s) Aver.
temp. (�C)
K1 Spring Marble 887 47 23
K2 Rainfall Sand and clay 1,068 0.2 13
K3 Spring Marble 1,011 5 14
K4 Well Limest.marl.conglom. ? marble 65 30
K5 Spring Limest.marl.conglom ? marble 961 137 29
K6 Spring Conglom. ? marble 1,055 81 19
K7 Spring Limest.marl.conglom. ? marble 925 45 35
K8 Spring Limest.marl ? marble 943 170 23
K9 Spring Sand and clay ? marble 917 87 21
Environ Earth Sci (2011) 64:1433–1443 1435
123

alkalinity in the samples were measured in situ by titrating
with Aquamerck 1.11109.0001 alkalinity and Aquamerck
1.111108 acidity tests, respectively. The anion and cation
samples were filtered (0.45 lm) and stored in new poly-
ethylene bottles, pre-rinsed three times with groundwater.
Cation samples were acidified with 2 ml 65 % HNO3 to
below pH 2. The cations (Ca, Mg, Na, K, Al, Fe, F, Br, Cd,
Cr, Cu, Co, Fe, Li, Mn, Ni, Pb, Si, and Zn) and anions
(HCO3, CO3, Cl, SO4, NH3, NO2, NO3, PO4) were deter-
mined in the Water Chemistry Laboratory of the Interna-
tional Research and Application Center for Karst Water
Resources at Hacettepe University. The ionic balance error
(IBE) computed on the basis of ions expressed in meq/l,
was within the standard limit of ±5%.
Stable isotope compositions of water are expressed
using d notation, which is per mil relative to SMOW.
Sixteen groundwater samples, collected from eight sam-
pling location during dry and wet season, were chosen for18O, 2H (deuterium) and 3H (tritium) analysis. Oxygen-18
and 2H were analyzed at the Nevada Stable Isotope Lab-
oratories in the USA. Tritium analysis was performed at the
Water Chemistry Laboratory at Hacettepe University in
Ankara.
The geological and hydrogeological maps used in this
study were constructed from maps created by earlier
studies that were revised using field observations and
satellite images. Information about deep wells was
obtained from the State Hydraulics Works; the structural
properties of the basin and formation thicknesses were
taken from a study by Onder (1994), who used surficial
resistivity. The names of the formation and other lithologic
information about the region were taken from Umut et al.
(1991).
Geology and hydrogeology
The Gunyuzu basin is a small basin, exhibiting semi-arid
climatic conditions. The average rainfall is 396 mm/year
(Demiroglu 2008). The basin occupies a surface area of
548 km2, ranging from a minimum elevation of 800 m to
summits of 1,814 meter (Arayit Mountain) above sea level.
The surficial outflow of the catchment discharges to the
Sakarya River, and then into the Black Sea (Fig. 1a).
Lithology in the higher areas of the basin is represented
mainly by schists, marbles and granitic rocks. The basin is
drained by a number of ephemeral and intermittent
streams. Groundwater flows principally toward the Sakarya
River.
Five main lithostratigraphic units are recognized in the
study area: Permo-Carboniferous Kertek metamorphic
units, which form the basement of the Gunyuzu basin,
Eocene Sivrihisar granodiorite, Miocene sedimentary units,
Pleistocene terrestrial clastics and Holocene alluvium. A
simplified stratigraphic columnar section of the study area
is as given in Fig. 3. There exist a number of previous
studies on regional geology, geomorphology, and tectonics
for the study area (Weingart 1954; Altınlı 1973; Erdinc
1978; Kulaksız 1981; Gautier 1984; Umut et al. 1991;
Kibici et al. 1993; Gozler et al. 1996; Goncuoglu et al.
1996; Whitney 2002; Orgun et al. 2004, 2005; Yaltirak
et al. 2005; Whitney and Davis 2006).
Based upon these studies and our observations, it is
understood that the study area was influenced by four
different tectonic activities: The Kertek metamorphic units
gained their existing structural features in the first tectonic
stage (in Permo-Carboniferous period). The second tec-
tonic stage is represented by intrusion of the Sivrihisar
granodiorite into the Kertek metamorphic units. This event
intensively modified the structural features of the basement
in Paleocene-Eocene period. Uplifting and faulting of
Kertek metamorphic units and Sivrihisar granodiorite
(Oligocene–Miocene period) represent the third stage of
the tectonic activities. The last stage is represented by
current seismic activity which occurred by reactivation of
old faults.
Based on structural features and hydrogeological char-
acteristics, such as permeability and porosity, all the rocks
in the basin may be classified as locally rich, medium, and
poor aquifers and aquicludes (Fig. 2).
Permo-Carboniferous marbles within the Kertek meta-
morphic unit represent the higher parts of the aquifer sys-
tem. The thickness of the marbles is more than 100 m
(Fig. 3). The marbles, mapped as locally rich and medium
aquifers both contain and conduct considerable amounts of
groundwater. Also, the marbles play a significant role in
recharge of the basin. The K3 and K2 springs are
recharged, circulate, and discharge through these marbles.
This circulation happens at shallow depths and the uniform
chemical properties of the springs imply laminar flow
conditions. Karstic springs and aquifer systems are illus-
trated in a conceptual model (Fig. 4). Pump tests in the
marbles yielded hydraulic conductivities from 1.19
to 98.9 m/day and specific capacity ranges from 0.64 to
75 l/s/m. The highest hydraulic conductivity and specific
capacity were associated with karstic structures. Other
shallow circulated water (K6, K8, and K9) mostly are
recharged from the marbles, but discharge from Miocene
units such as limestone, conglomerate and sandstone.
These values indicate that the system is heterogeneous.
Recharge is greatest where the marbles are exposed in
the highest elevations. Karstic conditions permit deep cir-
culation of this recharged water and faults in the marble
permit significant vertical movement and discharge at
springs (K1, K4, K5, and K7). Shallow circulation occurs
in partly developed conduits, with infiltration in old karstic
1436 Environ Earth Sci (2011) 64:1433–1443
123

structures such as sinkholes, fractures and joints. Turbulent
flow in the vadose zone is inferred from the discharge rates
of the K5 spring (Demiroglu 2008).
Miocene limestones constitute the second important
aquifer in the basin and they are mapped as local medium
aquifers (Fig. 2). According to the data obtained from
pump tests carried out at wells drilled in these unit, the
hydraulic conductivity values vary between 1.39 and
4.1 m/day and specific capacity varies from 1.8 to 2.9 l/
sec/m. The hydraulic conductivity and specific capacity
values of the Miocene conglomerates vary from 0.27 to
0.39 m/day and 0.38 to 0.55 l/s/m, respectively. The
ultrabasic rocks and schists of the Kertek metamorphic
unit, Eocene granitic rocks and diabases, and Miocene marl
and clays are impermeable (Demiroglu 2008).
The following precipitation stations were used to esti-
mate the input to the water budget: Sivrihisar (1929–2005),
Gunyuzu (1969–2000) meteorological stations, Gumusko-
nak (1969–2001) and Ahiler (1964–2005) DSI (State
Hydraulic Works) stations (Fig. 1b). The main factors that
influence of the recharge are altitude, season, rainfall type,
and intensity. As expected, the amount of precipitation
increases with altitude and the precipitation–altitude rela-
tionship was used within the 3D analyst-surface tool of
Arc-Map 9 to assign precipitation. Precipitation by area
from highest to lowest elevation is 40 9 106 m3/year
Fig. 3 Simplified stratigraphic
columnar section of the study
area (Demiroglu 2008)
Environ Earth Sci (2011) 64:1433–1443 1437
123
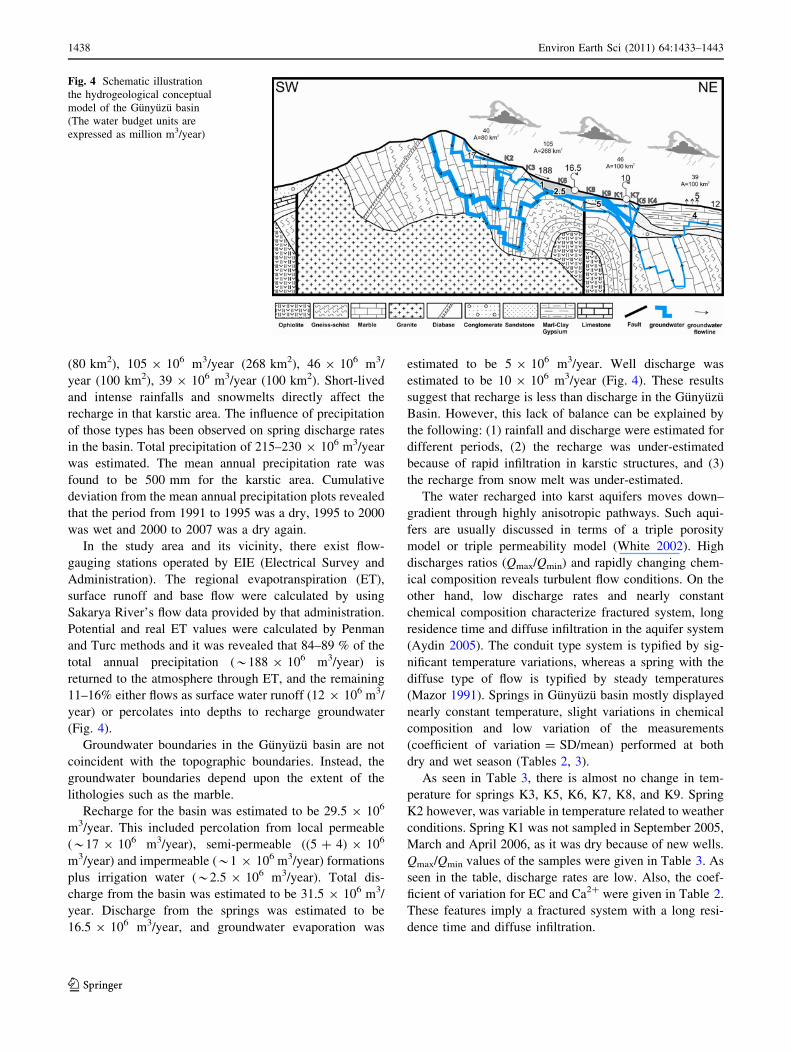
(80 km2), 105 9 106 m3/year (268 km2), 46 9 106 m3/
year (100 km2), 39 9 106 m3/year (100 km2). Short-lived
and intense rainfalls and snowmelts directly affect the
recharge in that karstic area. The influence of precipitation
of those types has been observed on spring discharge rates
in the basin. Total precipitation of 215–230 9 106 m3/year
was estimated. The mean annual precipitation rate was
found to be 500 mm for the karstic area. Cumulative
deviation from the mean annual precipitation plots revealed
that the period from 1991 to 1995 was a dry, 1995 to 2000
was wet and 2000 to 2007 was a dry again.
In the study area and its vicinity, there exist flow-
gauging stations operated by EIE (Electrical Survey and
Administration). The regional evapotranspiration (ET),
surface runoff and base flow were calculated by using
Sakarya River’s flow data provided by that administration.
Potential and real ET values were calculated by Penman
and Turc methods and it was revealed that 84–89 % of the
total annual precipitation (*188 9 106 m3/year) is
returned to the atmosphere through ET, and the remaining
11–16% either flows as surface water runoff (12 9 106 m3/
year) or percolates into depths to recharge groundwater
(Fig. 4).
Groundwater boundaries in the Gunyuzu basin are not
coincident with the topographic boundaries. Instead, the
groundwater boundaries depend upon the extent of the
lithologies such as the marble.
Recharge for the basin was estimated to be 29.5 9 106
m3/year. This included percolation from local permeable
(*17 9 106 m3/year), semi-permeable ((5 ? 4) 9 106
m3/year) and impermeable (*1 9 106 m3/year) formations
plus irrigation water (*2.5 9 106 m3/year). Total dis-
charge from the basin was estimated to be 31.5 9 106 m3/
year. Discharge from the springs was estimated to be
16.5 9 106 m3/year, and groundwater evaporation was
estimated to be 5 9 106 m3/year. Well discharge was
estimated to be 10 9 106 m3/year (Fig. 4). These results
suggest that recharge is less than discharge in the Gunyuzu
Basin. However, this lack of balance can be explained by
the following: (1) rainfall and discharge were estimated for
different periods, (2) the recharge was under-estimated
because of rapid infiltration in karstic structures, and (3)
the recharge from snow melt was under-estimated.
The water recharged into karst aquifers moves down–
gradient through highly anisotropic pathways. Such aqui-
fers are usually discussed in terms of a triple porosity
model or triple permeability model (White 2002). High
discharges ratios (Qmax/Qmin) and rapidly changing chem-
ical composition reveals turbulent flow conditions. On the
other hand, low discharge rates and nearly constant
chemical composition characterize fractured system, long
residence time and diffuse infiltration in the aquifer system
(Aydin 2005). The conduit type system is typified by sig-
nificant temperature variations, whereas a spring with the
diffuse type of flow is typified by steady temperatures
(Mazor 1991). Springs in Gunyuzu basin mostly displayed
nearly constant temperature, slight variations in chemical
composition and low variation of the measurements
(coefficient of variation = SD/mean) performed at both
dry and wet season (Tables 2, 3).
As seen in Table 3, there is almost no change in tem-
perature for springs K3, K5, K6, K7, K8, and K9. Spring
K2 however, was variable in temperature related to weather
conditions. Spring K1 was not sampled in September 2005,
March and April 2006, as it was dry because of new wells.
Qmax/Qmin values of the samples were given in Table 3. As
seen in the table, discharge rates are low. Also, the coef-
ficient of variation for EC and Ca2? were given in Table 2.
These features imply a fractured system with a long resi-
dence time and diffuse infiltration.
Fig. 4 Schematic illustration
the hydrogeological conceptual
model of the Gunyuzu basin
(The water budget units are
expressed as million m3/year)
1438 Environ Earth Sci (2011) 64:1433–1443
123

Spring temperatures are used to provide initial infor-
mation on the depth of circulation (Mazor 1991; Linan
et al. 2009) and the hydrochemical, isotopic values are used
to confirm this result. Circulation depth values are given in
Table 4, together with discharge elevation and average
temperature of the samples.
Hydrogeochemistry
Data on measured physicochemical characteristics (pH, Eh,
EC, TDS, DO, HCO, SO, Cl, Ca, Mg, Na, K) of ground-
water samples from Gunyuzu basin are summarized in
Tables 5 and 6. The dissolved oxygen (DO) values did not
display differences between sampling seasons. The DO
concentrations of the samples were plotted with respect to
the circulation depths (Fig. 5). There exists a negative
correlation between DO values and the circulation depths
(r2 = 0.9147). DO values tend to increase with the
decrease in circulation depths. In the same way, EC and
TDS values tend to increase with the increase in circulation
depth. However, both the EC values and TDS values of
some samples taken in wet season were generally higher
than that of dry season. The other parameters of the sam-
ples, taken during both seasons individually, exhibit no
salient variations (see Tables 5, 6). So it may be concluded
that both the shallow- and deeply-circulated waters have
not been exposed to different hydrogeochemical evolving
processes during circulation.
Hydrochemical compositions of the groundwater sam-
ples were plotted in trilinear equivalence diagrams (Fig. 6).
These plots did not vary by season. The samples were
identical in cation contents and the waters are often
Table 2 Springs Qmax/Qmin and variation of the measurements
Spring no. Spring name Qmax (l/s) Qmin (l/s) Qmax/Qmin CVec CVca Observation date
K1 Yenicıktı 108 49 2.2 10.3 8.04 1986–2006
K2 Musluk cesmesi 0.5 0 ? – – 2004–2006
K5 Subası 181 112 1.61 11.9 8.9 2000–2006
K6 Atlas 91 50 1.82 19.07 0.21 1998–2006
K7 Cardak hamamı 140 39 3.58 26.6 4.2 1991–2006
K8 Nasrettin hoca 219 152 1.44 3.96 6.63 1994–2006
K9 Babadat 100 68 1.47 4.95 6.01 1979–2006
CV coefficient of variation
Table 3 Springs temperatures (T, �C)
Spring no. Spring name Agust 2005 (T, �C) Sept. 2005 (T, �C) March 2006 (T, �C) April 2006 (T, �C) May 2006 (T, �C)
K1 Yenicıktı 22.82 – – 22.91 –
K2 Musluk cesmesi 24.88 – 5.35 10.39 12.31
K3 Cukurcesme 13.95 14.09 13.44 13.36 13.56
K5 Subası 29.90 29.76 31.07 31.06 31.06
K6 Atlas 18.96 19.02 18.80 18.94 18.97
K7 Cardak hamamı 35.00 34.50 33.70 34.82 34.81
K8 Nasrettin hoca 22.70 22.80 22.07 22.25 22.21
K9 Babadat 20.50 20.50 20.46 20.46 20.46
Table 4 Geographic coordinate, discharge elevation, circulation
depth and average temperature of the samples (Coordinates UTM 35)
Sample Spring name X (N) m Y (E) m Elv.
(m)
Depth
(m)
T (�C)
K1 Yenicıktı 43,419,80 3,993,53 887 382 22.8
K2 Musluk
cesmesi
43,476,58 3,95,851 1,068 12 13.2
K3 Cukurcesme 4,35,1171 3,967,69 1,011 88 14.0
K5 Subası 4,35,3611 3,992,17 961 622 30.0
K6 Atlas 4,35,6938 3,934,66 1,055 255 19.0
K7 Cardak
hamamı4,36,6839 3,901,27 925 788 35.0
K8 Nasrettin
hoca
4,37,3481 3,852,92 943 378 22.7
K9 Babadat 4,37,4508 3,805,58 917 305 20.5
Environ Earth Sci (2011) 64:1433–1443 1439
123

characterized by being rich in Ca. With respect to anion,
the waters were enriched in bicarbonate (HCO3-). Thus,
the groundwater is involved in (Ca ? Mg)–HCO3 type,
except sample K7. K7 represents hot water and is enriched
in Na?, slightly. That sample characterizes the (Ca ? Na ?
Mg)–HCO3 type.
The groundwater samples are moderately alkaline and
reflect the moderately hard and hard water characteristics.
The decreasing abundances of major ions in the waters
figures Ca [ Mg [ Na [ K and HCO3 [ SO4 [ Cl
alignment, whereas it displays as Ca [ Na [ Mg [ K and
HCO3 [ Cl [ SO4 order in hot water (K7). Based on
these hydrochemical characteristics along with observed
lithological and mineralogical data, it is inferred that
the waters evolved largely through preferential dissolution
of carbonate minerals with a lesser degree of silicates
(Fig. 7).
Some trace elements in water samples were analyzed to
identify existing contaminants. The concentrations of the
most toxic elements such as Al, Cd, Co, Fe, Mn, Ni, Pb,
and Zn are found to be less than limits for drinking water of
World Health Organization (WHO 1996) and US Envi-
ronmental Protection Agency (US EPA 2000a). The F,
NO2, and NO3 values in the waters vary from 0.001 to 0.25,
0.08 to 0.16, and 2.5 to 35 mg/l, respectively (Demiroglu
2008).
Stable oxygen is plotted versus stable hydrogen in
Fig. 8. All groundwater samples plotted between the local
(Ankara) meteoric line (d2H = 8 9 d18O ? 14.5) and the
global meteoric line (d2H = 8 9 d18O ? 10), except for
the sample from spring K3. This sample was influenced by
evaporation because the spring is stored in the cistern
before it is discharged from an old fountain.
Table 5 Physicochemical data of samples in wet season
No. EC (ls/cm) TDS (mg/l) DO (mg/l) pH Asidite
(mmol/l)
Alkalinite
(mmol/l)
Ca?2 Mg?2 Na? K? Cl- SO4-2 HCO3
-2
K1 603.00 464.00 4.90 6.96 0.80 4.90 3.58 2.07 0.47 0.04 0.18 1.12 4.23
K2 309.50 272.00 10.52 7.34 0.20 4.30 3.74 0.36 0.21 0.02 0.09 0.27 3.51
K3 331.50 276.00 8.89 7.21 0.30 3.90 2.60 1.55 0.26 0.23 0.29 0.34 3.44
K4 803.00 467.50 4.69 6.87 1.05 6.60 5.32 2.65 0.55 0.07 0.21 2.85 5.10
K5 798.00 474.00 4.46 6.86 1.20 6.40 4.65 2.05 0.55 0.06 0.19 0.88 5.51
K6 440.00 323.50 7.96 6.68 0.65 5.75 3.88 1.08 0.2 0.03 0.06 0.15 4.58
K7 958.50 525.00 2.21 7.02 1.40 7.45 3.89 1.23 1.37 0.06 0.8 0.32 5.03
K8 404.50 278.50 7.36 7.16 0.35 4.55 3.21 1.04 0.25 0.02 0.09 0.23 3.73
K9 415.50 296.00 7.75 7.09 0.35 4.50 3.11 1.14 0.33 0.03 0.15 0.22 3.73
Table 6 Physicochemical data of samples in dry season
No. EC (ls/cm) TDS (mg/l) DO (mg/l) pH Asidite
(mmol/l)
Alkalinite
(mmol/l)
Ca?2 Mg?2 Na? K? Cl- SO4-2 HCO3
-2
K1 590 400 7.49 7.08 0.60 6.20 3.89 2.34 0.48 0.04 0.19 0.70 4.69
K2 411 268 8.90 8.27 0.40 4.00 3.83 0.48 0.23 0.01 0.09 0.17 3.89
K3 346 286 9.11 7.15 0.30 4.00 2.54 1.72 0.32 0.29 0.37 0.42 3.54
K4 1,216 724 4.12 6.98 1.70 6.50 4.66 2.19 0.54 0.06 0.18 0.57 5.97
K5 778 456 4.81 6.94 1.50 7.10 4.69 2.18 0.52 0.06 0.19 0.66 5.92
K6 418 304 8.13 6.80 1.30 5.50 3.84 1.19 0.2 0.03 0.07 0.10 4.95
K7 935 512 2.89 6.93 1.50 7.90 4.70 1.68 1.82 0.07 1.07 0.38 6.68
K8 403 274 7.68 7.17 0.30 4.50 3.12 1.09 0.27 0.02 0.12 0.27 3.87
K9 405 288 8.06 6.92 0.40 4.60 3.18 1.26 0.32 0.02 0.17 0.31 4.03
Fig. 5 Plot of DO versus circulation depth for the water samples
1440 Environ Earth Sci (2011) 64:1433–1443
123

Isotope hydrology studies have shown that an elevation
effect in weighted mean precipitation exists of between
-0.15 and -0.50% d18O per 100 m elevation (Clark and
Fritz 1997). For the Gunyuzu basin, d18O was found to be
-0.32% per 100 m elevation. Four sample points were
chosen to represent precipitation from different altitudes in
Fig. 6 Piper diagram of the
sampling points
Schoeller Diagram
0,01
0,1
1
10
Ca++ Mg++ Na+ K+ Cl - SO4- HCO3-
on
s m
eq/l
K1
K2
K3
K4
K5
K6
K7
K8
K9
Fig. 7 Schoeller diagram of the
sampling points
Fig. 8 d18O–d2H relationship of the waters from the study area
Fig. 9 Plot of d18O versus elevation for the water samples from the
study area
Environ Earth Sci (2011) 64:1433–1443 1441
123

Gunyuzu (K2) and nearby basin (Gunay 2006) (Fig. 9).
Two samples were collected at the Gocenoluk, Akpınar and
Gumusbel springs respectively. Four samples were col-
lected at the Musluk cesmesi (K2) spring. The recharge
elevation of the springs was found using d18O—elevation
relationship and given together with the discharge eleva-
tions in Table 7.
The EC–tritium relationship indicates the existence of
waters with different circulating depth (Fig. 10). The sam-
ples can be divided into two main groups based on the EC
and tritium (3H) conditions: the waters with high EC
(590–1216 lS/cm) and low 3H (0–4 TU) and the waters with
low EC (309–440 mg/l) and high 3H (4–10 TU). The first
group represents the deep circulating water (K5, K4, and
K7). The second group represents the shallow circulating
waters (K2, K3, K6, K8, and K9) and physicochemical
properties of these waters are likely to reflect the effects of
mixing of the shallow waters and the deep waters (cool
groundwater) in various proportions during their ascent to
the surface or during storm events (Demiroglu et al. 2007).
Conclusions
The study area with annual average precipitation of
393 mm/year is a semi-arid region. Thus the water budget
is dominated by evapotranspiration. Less than 20 % of the
annual input becomes either stream flow or groundwater.
The largest groundwater discharge is from karstic springs.
Chemical and isotopic analyses reveal the existence of two
groundwater flow systems, a deep thermal system and a
shallow system. Both systems are meteoric.
The waters are dominantly characterized by rich Ca and
HCO3 ion contents and reflect the (Ca ? Mg)–HCO3 type.
Decreasing orders of the absolute abundances of major ions
in the waters are Ca [ Mg [ Na [ K and HCO3 [SO [ Cl and these orders imply that the waters evolved
largely through preferential dissolution of carbonate min-
erals with a lesser degree of silicate minerals. Major (Ca,
Mg, Na, K, SO4, Cl, HCO3, NO2, NO3) and trace element
(Cd, Co, Cu, F, Fe, Mn, Ni, Pb, Zn) concentrations in the
waters do not show any potential contamination and their
values fall below the standards for fresh water.
During recent years, there has been a shift from agri-
cultural to domestic land use within the study area. This
shift has led to an increased need for groundwater sup-
plies. Thus the concept of sustainable water management
is important because of the increased pumping of
groundwater within Gunyuzu basin. In this study, a con-
ceptual model of aquifer behavior has been constructed,
but defining the safe yield is not possible because of the
existence of old static water. However, water level
drawdown can be controlled by limited pumping rates
and by avoiding new drilling in the Gumuskonak and
Yenicikri areas (Demiroglu 2008). During the studies, it
was observed that water from the new wells dug near
Yenicikri and Subasi springs caused a change in the
groundwater levels (as of June 3, 2007 a drop of 5–7 m in
the water level of the wells) and Yenicıkrı spring had
dried up. If this trend of increased use continues, it will
cause the existing springs to dry, the water levels in the
wells to drop, and the discharge to the Sakarya River to
decrease.
Acknowledgments This work was supported by TUBITAK-CAY-
DAG (Project No: 105Y145) and ITU-BAP (Project no: 31880). We
would like to thank Tolga Yalcın for he manages the TUBITAK
Table 7 Averages recharge
elevations of the water samples
as defined by their oxygen-18
isotope contents
Sample Sample name d18O Discharge
elevation (m)
Recharge
elevation (m)
K1 Yenicıkrı spring -10.90 887 1,465
K3 Cukurcesme spring -9.40 991 996
K4 55886/A well -10.95 910 1,480
K5 Subası spring -10.85 951 1,450
K6 Atlas spring -11.00 1,065 1,497
K7 Cardak hamamı -10.55 919 1,356
K8 Nasrettin Hoca -10.55 934 1,356
K9 Babadat spring -10.40 904 1,309
Fig. 10 Tritium–EC relationship of the water samples from the study
area
1442 Environ Earth Sci (2011) 64:1433–1443
123

Project. We also acknowledge to Mehmet Ekmekci from Hacettepe
University for commentaries.
References
Altınlı E (1973) Orta Sakarya Jeolojisi (Geology of middle Sakarya)
Cumhuriyetin 50. Yılı Yerbilimleri Kongresi, Bildiriler Kitabı,159–192
Aquilina L, Ladouche B, Dolfliger N (2005) Recharge processes in
karstic systems investigated through the correlation of chemical
and isotopic composition of rain and spring waters. Appl
Geochem 20:2189–2206
Aydın H (2005) Harmankoy-Belyayla (Bilecik) Investigation of
morphology-hydrogeology relations in Harmankoy-Beyyayla
(Bilecik) karst system, PhD Thesis, Hacettepe University,
Institute of Science and Technology (In Turkish with English
summary)
Clark D, Fritz P (1997) Environmental ısotopes in hydrogeology.
CRC Press, Boca Raton, p 312
Demiroglu M (2008) Hydrogeology and hydrochemistry of Eskisehir-
Sivrihisar-Gunyuzu Basin. PhD Thesis, Istanbul Technical
University, Institute of Science and Technology (In Turkish
with English summary)
Demiroglu M, Yalcın T, Orgun Y, Yaltırak C, Akdeniz U (2007)
Hydrogeochemical characteristics of groundwater in Gunyuzu
basin (Sivrihisar-Eskisehir) Western Turkey. In: The 23rd
International Applied Geochemistry Symposium, Extended
Abstracts, Oviedo, Spain, p 129
Dennis PC, Murray BS (2002) Karst groundwater basin delineation,
Fort Knox. Ky Eng Geol 65:125–131
Erdinc H (1978) Sivrihisar kristalin masifinin jeolojisi ve petrolojisi,
Istanbul Universitesi, Fen Fakultesi, Mineraloji ve Petrografi
Kursusu, PhD Thesis (Unpublished)
Gautier Y (1984) Deformations et Metamorphismes Associes a la
Suture Tethysienne en Anatolie Centrae, (Region de Sivrihisar,
Turquie), PhD Thesis, University de Paris-Sud Centre D’Orsay,
p 236
Gieske A, De Vries JJ (1990) Conceptual and computational aspects
of the mixing cell method to determine groundwater recharge
components. J Hydrol 121:277–292
Goncuoglu MC, Turhan N, Senturk S, Uysal S, Ozcan A (1996) Orta
Sakarya’da Nallıhan- Sarıcakaya arasındaki yapısal birimlerin
jeolojik ozellikleri, MTA Derleme, No: 9973, Ankara (Unpub-
lished report)
Gozler MZ, Cevher F, Ergul E, Asutay HJ (1996) Orta Sakarya ve
guneyinin jeolojisi, MTA Derleme No: 9973, Ankara (Unpub-
lished report)
Gunay G (2006) Hydrology and hydrogeology of Sakaryabası karstic
springs, Cifteler, Turkey. Env Geol 51:229–240
Kacaroglu F (1999) Review of groundwater polltion and protection in
karst areas. Water Air Soil Pollut 113:337–356
Kibici Y, Dag N, Ozgenc I (1993) Sivrihisar-Gunyuzu (Eskisehir)
granitoyid kusagının mineralojik ve petrografik ozellikleri.
Yerbilimleri 23:97–112
Kulaksız S (1981) Sivrihisar kuzeybatısının jeolojisi. Yerbilimleri
8:103–124
Linan C, Andreo B, Mudry J, Carrasco F (2009) Groundwater
temperature and electrical conductivity as tools to characterize
flow patterns in carbonate aquifers: The Sierra de las Nieves
karst aquifer, Southern Spain. Hydrogeol J 17:843–853
Mazor E (1991) Applied chemical and isotopic groundwater hydrol-
ogy. Halsted Press, New York
Onder I (1994) Turkiye Rejyonal Jeoelektrik Haritalar Projesi
Eskisehir-Sivrihisar-Gunyuzu-G.konak Sahaları Rezistivite Etut
Raporu (Geophysical study of the Eskisehir-Sivrihisar-Gunyuzu-
G.konak fields), MTA Derleme No: 9921, Ankara (Unpublished
report)
Orgun Y, Gultekin AH, Altınsoy N, Celebi N, Karahan G (2004)
Hydrogeochemical characteristics and radioactivity levels of
some of the groundwater from western Anatolia. In: Proceedings
of ınternational symposium on earth system sciences, 8–10
September, Istanbul, pp 643–650
Orgun Y, Altinsoy N, Gultekin AH, Karahan G, Celebi N (2005)
Natural radioactivity levels in granitic plutons and groundwater
in southeast part of Eskisehir, Turkey. Appl Radiat Isot
63:267–275
Ozaydın V, Sendil U, Altınbilek D (2001) Stable isotope mass
balance method to find water budget of a lake. Turk J Eng Env
Sci 25:329–344
Shaban A, Khawlie M, Chadi A (2006) Use of remote sensing and
GIS to determine recharge potential zones: the case of
Occidental Lebanon. Hydrogeol J 14:433–443
Shurbaji AR, Campbell AR (1997) Study of evaporation and recharge
in desert soil using environmental tracers, New Mexsico, USA.
Env Geol 29:147–151
Tezcan L (1993) Karst Akifer Sistemlerinin Trityum Izotopu
Yardımıyla Matematiksel Modellemesi (Mathematical model
of karst aquifer systems by tritium isotope), PhD Thesis,
Hacettepe University, Institute of Science and Technology (In
Turkish with English summary)
Umut M, Acarlar M, Gedik I, Guner E, Saclı L, Sen AM (1991)
Cifteler-Holanta (Eskisehir ili) Celtik (Konya ili) ve dolayınınjeolojisi. MTA Derleme No: 9204 (Unpublished report)
US EPA (US Environmental Protection Agency) (2000a) Drinking
water regulations and health advisories. US EPA, Washington
DC
Weingart W (1954) 56/4 (Sivrihisar) ve 57/1, 57/3 (Ankara)
paftalarının jeoloji haritası hakkında. MTA rapor No: 2248
(Unpublished report)
White WB (2002) Karst hydrology; recent developments and open
questions. Eng Geol 65:85–105
Whitney DL (2002) Coexisting andalusite, kyanite, and sillimanite:
sequential formation of three Al2SiO5 polymorphs during
progressive metamorphism near the triple point, Sivrihisar,
Turkey. Am Min 87:405–416
Whitney DL, Davis PB (2006) Why is lawsonite eclogite so rare?
Metamorphism and preservation of lawsonite eclogite, Sivrihi-
sar. Turk Geol Soc Am 34:473–476
World Health Organization (WHO) (1996) Guidelines for drinking
water quality. recommendations. Health criteria and other
supporting ınformation, vol 2. WHO, Geneva
Yaltirak C, Yalcın T, Yuce G, Bozkurtoglu E (2005) Water-level
changes in shallow wells before and after the 1999 Izmit and
Duzce earthquakes and comparison with long-term water-level
observations (1999–2004), NW Turkey. Turk J Earth Sci
14:281–309
Zuber A (1983) On the environmental isotope method for determining
the water balance components of some lakes. J Hydrol
61:409–427
Environ Earth Sci (2011) 64:1433–1443 1443
123
Top Related
Copyright © 2022 FDOKUMEN

