


Bahasa
Halaman
Hukum


ORIGINAL
Hydrodynamic, neotectonic and climatic control of the evolutionof a barrier beach in the microtidal environment of the NE IonianSea (eastern Mediterranean)
Serafim E. Poulos & George Ghionis & Efthymia Verykiou & Grigoris Roussakis &Dimitrios Sakellariou & Aikaterini Karditsa & George Alexandrakis & Stelios Petrakis &
Dafni Sifnioti & Ioannis P. Panagiotopoulos & Periklis Andris & Panos Georgiou
Received: 17 June 2014 /Accepted: 31 October 2014# Springer-Verlag Berlin Heidelberg 2014
Abstract The existence of barrier beaches is crucial, as theyact as a buffer zone to the associated wetlands, whilst they aresensitive to climate change. The present study offers an insightinto the processes controlling the formation and evolution ofthe Gyra barrier beach (NW coast of the island of Lefkada) inthe microtidal, tectonically very active Ionian Sea under theinfluence of regional climate change and human interference.Such investigations are sparse in the literature. Existing infor-mation regarding regional geology, sediment availability andhuman intervention is combined with the collection of geo-physical data, field observations and simulations of nearshorehydro- and sediment dynamics, analysis of climatic variationswith respect to offshore wind/wave patterns (including storm-iness), in situ measurements of recent morphometric changes(2006–2008) and historical shoreline changes (since the1960s). The recent formation and evolution (mostly underretreat) of the Gyra barrier beach is shown to be the combinedresult of the regional seismotectonic setting, relative increaseof sea level, coastal sediment transport patterns, as well ashuman impact (negative) on primarily terrestrial sedimentinfluxes. The current erosional trend of the barrier beach is
associated with a shift in the wind and wave direction (fromSW to NW) of extreme storm events in the Ionian Sea sincethe 1980s. The regional climatic variations of the last decadesare well correlated with the trend of the North AtlanticOscillation.
Introduction
Barrier beaches are among the most vulnerable coastal fea-tures (Leatherman 1988), constantly changing and shiftinglandwards as they respond to coastal hydrodynamic forces,sediment availability, geological setting and gradual sea levelrise. These processes operate at different timescales rangingfrom hours to decades to centuries (e.g. Leatherman 1979;Dingler and Reiss 1990; Davis 1994). At small timescales ofhours to days, cross-shore processes during storms can erodethe foreshore and overwash its back-barrier side (e.g.Sallenger 2000; Canizares and Irish 2008; Krestenitis et al.2011), as usually happens in the case of barrier islands. Overseasonal, annual and decadal time spans, changes in sedimentsupply and sediment transport can cause erosion and/or accre-tion of a barrier beach, whereas at timescales ranging fromdecades to centuries (and/or longer) geological processes (e.g.regional downwarping or uplift, sediment consolidation)and eustatic sea level changes contribute to the long-term evolution (e.g. FitzGerald et al. 2008).
The existence of barrier beaches is crucial as they act asbuffer zones to the associated wetlands, protecting also theirecosystems from coastal winds, waves and storm surges, andproviding habitats for resident and migrant populations (e.g.Moore et al. 1990). Although an ever-increasing number ofpublications have assessed the impact of storms on bothmainland beaches (e.g. Castelle et al. 2008; Sancho-García
S. E. Poulos (*) :G. Ghionis : E. Verykiou :A. Karditsa :S. Petrakis :D. Sifnioti : P. AndrisDepartment of Geography & Climatology, Faculty of Geology &Geoenvironment, University of Athens,15784 Panepistimioupolis-Zografou, Attica, Greecee-mail: [email protected]
G. Roussakis :D. Sakellariou : I. P. Panagiotopoulos : P. GeorgiouHellenic Centre for Marine Research, Institute of Oceanography,46.7 km Athens-Sounion Avenue, 19013 Anavyssos, Attica, Greece
G. Ghionis :G. AlexandrakisInstitute of Applied and Computational Mathematics, Foundation forResearch and Technology, Hellas, N. Plastira 100, Vasilika Vouton,70013 Heraklion, Greece
Geo-Mar LettDOI 10.1007/s00367-014-0390-2

et al. 2013; Shtienberg et al. 2014) and barrier beaches world-wide (e.g. Guillen et al. 1994; Wamsley and Hathaway 2004;Freeman et al. 2004;Matias et al. 2008; Benavente et al. 2013;Gracia et al. 2013), work on the evolution (including erosion)of barrier beaches formed in microtidal waters (tidal range <2m; cf. Andrew and Cooper 2005) is overall sparse, in partic-ular for those associated with local tectonism. To date, themicrotidal research hotspots include the Gulf of Mexico andthe Mediterranean, the latter being the region of the presentstudy, and where complex interactions between natural andman-induced causes of erosion are posing growing challengesto barrier beach management (e.g. Jiménez and Sánchez-Arcilla 2004; Genç et al. 2013; Ružić et al. 2014).
Furthermore, large-scale weather oscillation indices arenowadays being increasingly examined along with regionalwave and wind climate variability and their influence oncoastal landforms worldwide. For example, Hemer et al.(2007) explored waves and climate change along theAustralian coast in relation to the Southern Oscillation index,the Southern Annual Mode Index (SAMI), the Indian OceanDipole (IOD) index, the Nino-4 SST index, the Nino-3 SSTindex and the Pacific Decadal Oscillation (PDO). In a moredetailed evaluation, Kim et al. (2013) identified the influenceof the North Atlantic Oscillation (NAO) on salt marsh dynam-ics in the Danish Wadden Sea.
The present work offers an insight into the natural process-es (including climate change) as well as human impacts af-fecting the recent and ongoing evolution of the Gyra barrierbeach of Lefkada island in the NE Ionian Sea, formed in themicrotidal waters of the eastern Mediterranean Sea in a veryactive seismotectonic region. In order to provide an analyticaldescription of these processes, datasets on beach morphome-try, granulometry and subbottom acoustic tomography werecollected in 2007 and 2008, while simulations of nearshoresediment transport were conducted on the basis of the regionalwind/wave regime. The new datasets were combined withexisting information related mostly to tectonic activity andterrestrial sediment influxes. For the local wave and windclimate, the ERA-Interim database was statistically analysedand related to the NAO index variations.
Physical setting
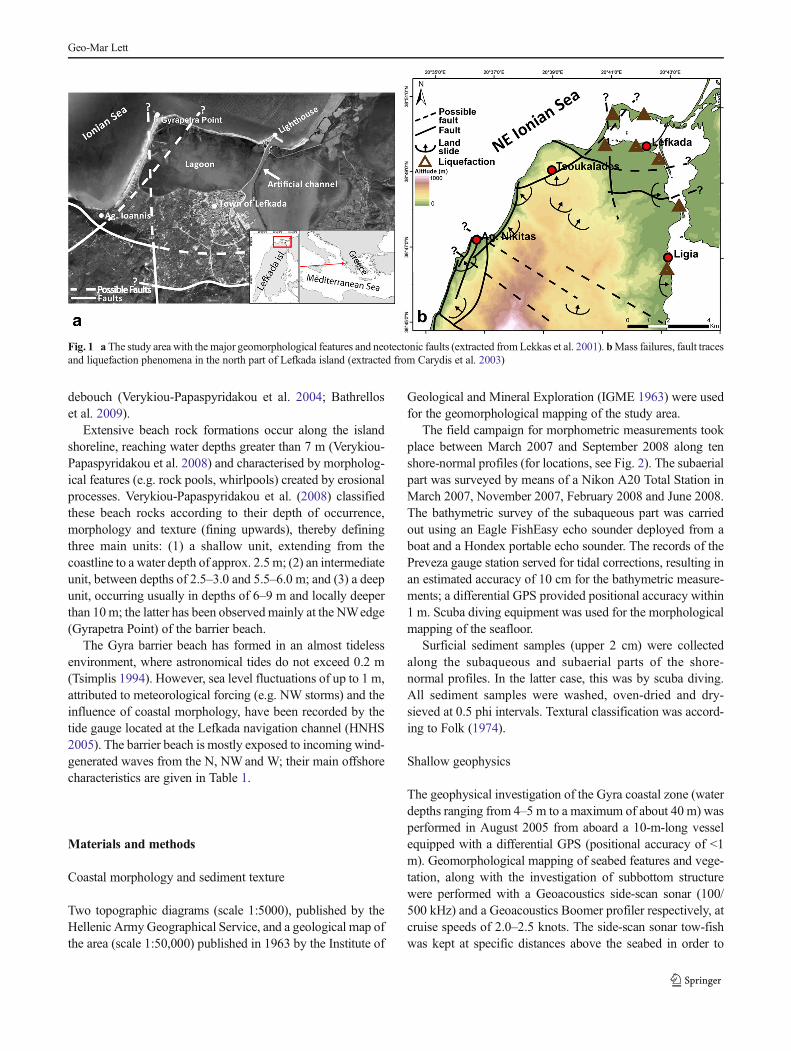
The Gyra barrier beach extends along the northeast coast ofthe island of Lefkada, with a swampy area at its eastern sidethat separates the island from the Greek mainland (Fig. 1). Anartificially dredged channel across this swamp provides easiernavigational access to the eastern and southern coasts. Thewest coast is linear with steep cliffs and extensive sandybeaches in several places, whereas the north, east and southcoasts incorporate many small bays (Bathrellos et al. 2009).
Lefkada island is mostly mountainous with an average eleva-tion of 500 m, the maximum elevation being 1,158 m.
The sector of the Ionian Sea comprising Lefkada island istectonically very active due to its proximity to the Hellenictrench (south) and the area of collision (north) between theApulian platform (west) and the external Hellenides (east;Doutsos and Kokkalas 2001; Benetatos et al. 2004). Thetransition between these geotectonic regions is related to theKephallonia transform fault that runs parallel to the west coastof Kephallonia and Lefkada islands (Sachpazi et al. 2000). Inaddition, Lekkas et al. (2001) have analytically describednumerous active neotectonic (Plio-Quaternary) gravity andstrike-slip faults running NNE–SSW or almost E–W acrossLefkada island (Fig. 1b), which can be related with landslidesand rock falls.
Due to the tectonic setting and associated crustal move-ments, the broader region is considered as one of the mostseismically active not only in the Mediterranean but alsoglobally. Since 464 BC, the region has experienced more than25 earthquake events exceeding magnitude 5 on the Richterscale (Papazachos and Papazachou 2003). The most recentevent took place on 14th August 2003 with a magnitude of6.2R (Benetatos et al. 2005, 2007), followed by an aftershocksequence of three intense earthquakes of 5.3R, 5.4R and 4.7R.This seismic activity caused several types of damage, includ-ing extensive landslides and rock falls along the western cliffs,ground fissures, liquefaction phenomena and small coastlinechanges (Carydis et al. 2003). This intense seismic activity hasbeen accompanied by sporadic tsunami events. Evidence ofsuch events has been detected at various places along theadjacent mainland coast by Vött et al. (2006, 2007, 2009)and May et al. (2012).
Amoderate sea level rise of ca. 3.5 m has been documentedduring the last 6,000 years (Kapsimalis et al. 2009), whilst thehydro-isostatic model of Lambeck (1996) estimates a relativesea level increase of ca. 5 m during the same period. Eventhough Vött (2007) has detected differences in relative sealevel rise at various locations of the neighbouring mainland,that author states that, in general in NW Greece, relative sealevel since the mid-Holocene has never been higher thantoday.
The Gyra barrier beach is 8 km long and 70–100 m widewith a maximum elevation of 3 m. It can be distinguishedfurther into aW-facing sector, exposed to the open Ionian Sea,and a N-facing sector that is more sheltered from wave action(Fig. 1). It consists of sand (mostly coarse-grained) and gravel(granules to pebbles) and is characterised by a steep but broadseaward side and a slightly dipping landward side (May et al.2012). Most of the sediment that contributes to the barrier’sevolution is related to sediment advection from the west coastof Lefkada island (Rousakis et al. 2008; May et al. 2012),where coastal cliff erosion (landslides, rock falls) takes place(Carydis et al. 2003) and a number of ephemeral streams
Geo-Mar Lett
debouch (Verykiou-Papaspyridakou et al. 2004; Bathrelloset al. 2009).
Extensive beach rock formations occur along the islandshoreline, reaching water depths greater than 7 m (Verykiou-Papaspyridakou et al. 2008) and characterised by morpholog-ical features (e.g. rock pools, whirlpools) created by erosionalprocesses. Verykiou-Papaspyridakou et al. (2008) classifiedthese beach rocks according to their depth of occurrence,morphology and texture (fining upwards), thereby definingthree main units: (1) a shallow unit, extending from thecoastline to a water depth of approx. 2.5 m; (2) an intermediateunit, between depths of 2.5–3.0 and 5.5–6.0 m; and (3) a deepunit, occurring usually in depths of 6–9 m and locally deeperthan 10m; the latter has been observedmainly at the NWedge(Gyrapetra Point) of the barrier beach.
The Gyra barrier beach has formed in an almost tidelessenvironment, where astronomical tides do not exceed 0.2 m(Tsimplis 1994). However, sea level fluctuations of up to 1 m,attributed to meteorological forcing (e.g. NW storms) and theinfluence of coastal morphology, have been recorded by thetide gauge located at the Lefkada navigation channel (HNHS2005). The barrier beach is mostly exposed to incoming wind-generated waves from the N, NWand W; their main offshorecharacteristics are given in Table 1.
Materials and methods
Coastal morphology and sediment texture
Two topographic diagrams (scale 1:5000), published by theHellenic ArmyGeographical Service, and a geological map ofthe area (scale 1:50,000) published in 1963 by the Institute of
Geological and Mineral Exploration (ΙGΜE 1963) were usedfor the geomorphological mapping of the study area.
The field campaign for morphometric measurements tookplace between March 2007 and September 2008 along tenshore-normal profiles (for locations, see Fig. 2). The subaerialpart was surveyed by means of a Nikon A20 Total Station inMarch 2007, November 2007, February 2008 and June 2008.The bathymetric survey of the subaqueous part was carriedout using an Eagle FishEasy echo sounder deployed from aboat and a Hondex portable echo sounder. The records of thePreveza gauge station served for tidal corrections, resulting inan estimated accuracy of 10 cm for the bathymetric measure-ments; a differential GPS provided positional accuracy within1 m. Scuba diving equipment was used for the morphologicalmapping of the seafloor.
Surficial sediment samples (upper 2 cm) were collectedalong the subaqueous and subaerial parts of the shore-normal profiles. In the latter case, this was by scuba diving.All sediment samples were washed, oven-dried and dry-sieved at 0.5 phi intervals. Textural classification was accord-ing to Folk (1974).
Shallow geophysics
The geophysical investigation of the Gyra coastal zone (waterdepths ranging from 4–5 m to a maximum of about 40 m) wasperformed in August 2005 from aboard a 10-m-long vesselequipped with a differential GPS (positional accuracy of <1m). Geomorphological mapping of seabed features and vege-tation, along with the investigation of subbottom structurewere performed with a Geoacoustics side-scan sonar (100/500 kHz) and a Geoacoustics Boomer profiler respectively, atcruise speeds of 2.0–2.5 knots. The side-scan sonar tow-fishwas kept at specific distances above the seabed in order to
Fig. 1 a The study area with the major geomorphological features and neotectonic faults (extracted fromLekkas et al. 2001). bMass failures, fault tracesand liquefaction phenomena in the north part of Lefkada island (extracted from Carydis et al. 2003)
Geo-Mar Lett

attain an across-track resolution of about 50 cm. The Boomerprofiler operated at a frequency of 0.7–2.0 kHz and at ashooting rate of 250 ms with pulse duration of 2 ms, achievingan across-track resolution of about 0.7–1.5 m. The locations ofthe geophysical tracklines are presented in Fig. 2.
Nearshore hydrodynamics and sediment transport
The nearshore hydrodynamics associated with the prevailingwind-induced incoming waves was evaluated based on the
wind and wave data presented in Table 1.The seaward limit ofinfluence of maximum storm waves on nearshore seabedsediments was estimated in terms of closure depth, hc(Hallermeier 1981):
hc ¼ 2:28 H e− 68:5H2
e
gT2e
� �
where He and Te are the effective significant wave height andeffective wave period respectively (based on conditions
Table 1 Offshore wave characteristics: annual frequency of occurrence (f), significant height (H0), period (T0), and energy (E0) under the prevailingwind directions
Wind Wave characteristics
Direction Fetch (km) Annual freq. (%) Most frequent Maximum conditions
H0 (m) T0 (s) f (%) E0 (J/m) H0 (m) T0 (s) f (%) E0 (J/m)
W 351 8.58 0.65 4.36 2.94 15.6 6.8 12 0.18 105.2
NW 117 25.28 1.58 6.35 6.92 217.1 6.1 10 0.03 14.0
N 25.6 13.98 0.67 3.71 3.56 20.1 2.4 5.7 0.03 2.2
Total 13.42 252.8 0.24 121.4
Fig. 2 Bathymetric map of the study area, also showing the locations ofthe various field measurements and the tracklines of the geophysicalcampaign (north lines 1–6, 8; west lines 1, 3–18). 1–10 Shore-normal
profiles, A–J beach sections corresponding to the shore-normal profiles,S-I, S-II, S-III beach sectors
Geo-Mar Lett

exceeded only 12 h per year, i.e. 0.14% of the total time), andg is the acceleration of gravity. He was calculated from theannual mean significant wave height (H ) and correspondingstandard deviation (σH):
H e ¼ H þ 5:6⋅σH
The extreme wave run-up (R2%) was estimated based onStockdon et al. (2006):
R2% ¼ 1:1⋅ 0:35β
ffiffiffiffiffiffiffiffiffiffiffiH0
L0þ
rH0L0 0:563β2 þ 0:004
� �� �1=22
!
and, for dissipative beaches (ξ0<0.3)
R2% ¼ 0:043ffiffiffiffiffiffiffiffiffiffiffiH0L0
pwhere H0 is the offshore significant wave height, L0the offshore wavelength, β the beach slope, and ξ0 the
Iribarren number (Iribarren and Nogales 1949) calcu-lated as:
ξ0 ¼ tanβ
ffiffiffiffiffiffiffiL0H0
r
For the estimation of the potential longshore sedimenttransport rate (Ql, in m3/day), the empirical equation devel-oped by Komar (1988) was used:
Ql ¼ 1:1 ρ g3=2H
5=2b sin αbð Þcos αbð Þ
where ρ is the seawater density (1.025 kg/m3),Hb the waveheight at breaking, and αb the wave angle at breaking (Hb andαb were estimated by means of CEDAS 4.0 software).
The estimation of the potential cross-shore sediment trans-port rates (Qc) was based on Bailard (1981):
Qc ¼ ρC fu3m
εBtanϕ
y1 þ3
2δu−
tanβtanϕ
u�3
� �þ um
wsεS y2 þ 4δuu
�3−
umws
εSu�5tanβ
� �
where εΒ=0.2, εS=0.025, Cf is the seabed drag coefficient, ws
is the sediment fall velocity (cf. van Rijn et al. 2003), and φ isthe angle of internal friction of the beach sediment. Thevelocity components um, u3
∗ and u5∗ (in cm/s), the normalized
mean onshore current δu, and the skewness parameters Ψ1 andΨ2 were estimated from the offshore significant wave height(in cm) using the regression equations provided by Bailard(1981):
δu ¼ 0:458þ 0:00157 H0; um ¼ 31:9þ 0:403 H0; u�3 ¼ 0:548þ 0:000733 H0; u�5 ¼ 1:5−0:00346 H0;Ψ1 ¼ 0:303−0:00144 H0; Ψ2 ¼ 0:603−0:0051 H0
The direction of cross-shore sediment transport was deter-mined applying the Hattori and Kawamata (1980) equation:
gH0 tan βT0
L0ws
< 0:5 onshore transport> 0:5 offshore transport
�
Shoreline changes
Long-term shoreline changes were studied using four series ofaerial photographs taken in 1960, 1972, 1987 and 2006 by theHellenic Army Geographical Service (HAGS). In order to ex-tract the shoreline position, the photographs were digitized at1,200 dpi and radiometrically corrected. The digitized datasetswere then geometrically corrected with the aid of an IntergraphZ/I Imaging photogrammetric station, and geo-referenced in
ArcGIS. The maximum total error in reconstructing shorelinechange was estimated at ±3.75 m. Therefore, coastline changesexceeding 7.5 m were considered as significant, and the corre-sponding coastline sectors were subsequently classified as underaccretion or under erosion.
Finally, possible relationships between observed beacherosion and decadal variations in offshore winds and incom-ing wave characteristics were investigated, the latter datahaving been extracted from the ERA-Interim reanalysisdataset (Dee et al. 2011). This was in terms of the frequencyof occurrence of waves with pre-specified directionality (i.e.SW and NW) grouped in four classes of significant waveheight, namely <1, 1–2, 2–4 and >4 m, for the period 1979–2010. In addition, possible correlation between inter-annualvariations in the local wave climate and the NAO index wasexamined.
Geo-Mar Lett

Results
Geomorphology and sediment texture
The west side of the barrier beach (Fig. 3, shore-normalprofiles 1–6), which extends from Ag. Ioannis to GyrapetraPoint, has a maximum elevation of 2.5 m above mean sealevel. The surficial sediments of the subaerial part of the beachconsist of slightly gravelly sand ((g)S) at the foot of the beachto sandy gravel (sG) at the top. The beach face has sandysediments with small patches of gravelly material (i.e. (g)S togS). The nearshore subaqueous area is covered by beach rockformations that extend down to 4–5 m (locally 6 m) waterdepth (as observed by scuba diving), interspersed with sandpatches. In water depths greater than 4–5 m the seabed iscovered by Posidonia oceanica meadows (Fig. 3, profiles 3–5). The subaqueous slope gradient of the northern and south-ern sections of the W-facing beach sector is generally steep,ranging between 4–5% for the shallow part (<15 m waterdepth) and 6–7% for the deeper part (>15 m water depth;Fig. 3). This change is associated with the presence of asubmerged feature that has the characteristics of an ex-
barrier (i.e. distinctive morphology and sediment thickness),most probably formed during an earlier stage of the latesttransgression.
In the bottom left-hand panel of Fig. 4, the shallow part of anorthern subbottom profile (line 5 in Fig. 2) is characterisedby the occurrence of the acoustic basement at the seafloor.Visual observations by divers have proved the presence ofbeach rocks mostly in water depths less than 6 m, with somesand patches and Posidonia meadows. The shallow part of asouthern subbottom profile (bottom right-hand panel of Fig. 4,line 15 in Fig. 2) demonstrates the dominance of sandy de-posits (1–2 m thick) in an area extending from water depths of4–5 m (observed by diving and verified by granulometricanalysis) down to 10 m. Posidonia meadows prevail in waterdepths from 10 to 15 m, whereas in greater depths the seaflooris covered either by P. oceanica or by other seagrass species(Fig. 4). The subbottom profiler records also show that thethickness of the detected sandy deposits increases gradually(>2 m) with depth.
At the north side of the barrier beach (shore-normal profiles7–10, Fig. 5), extending from Gyrapetra Point to the artificialnavigation channel, the barrier reaches a maximum elevation
Fig. 3 Surficial sediment types and morphology along the shore-normal profiles (1–6) on the west side of the Gyrapetra barrier beach
Geo-Mar Lett

of ~3 m and consists mostly of coarse-grained material (sG-G). In particular, the texture of the beach face varies fromsandy gravel (sG) near Gyrapetra Point to finer materialeastwards, becoming slightly gravelly sand ((g)S) at the east-ern end (Fig. 5). Similarly to the west side of the barrier beach,extensive beach rock formations interspersed with patchysandy deposits (of varying thickness) are present at waterdepths <6 m, with the exception of the vicinity of profile 10where beach rocks appear only in depths greater than 7 m; thisis probably due to the beach rock formations in shallowerwaters having been covered by sediments. Additionally,Posidonia meadows are observed in water depths generallygreater than 4 m along all profiles (Fig. 5).
In Fig. 6, the two subbottom profiles selected as represen-tative of the north side of the barrier beach (cf. lines 8 and 2 inFig. 2) display morphological and textural characteristics verysimilar to those of the west side (Fig. 3) and, particularly, to itssouthern part. The seafloor off the western part of the N-facingbarrier beach dips with a slope of 3–4% down to 25 m waterdepth, and of 1.5% beyond 25 m (line 8, left, Fig. 6). Off theeastern part, the slope values are generally 3.0–3.5% down to10 m water depth and decrease to 1.0–1.1% beyond the 10 misobath. This change of slope denotes, again, the existence of apossible ex-barrier formation at 10–12 m water depth off the
eastern part, whereas a smaller seafloor slope change can beobserved at 20–22 m (right, Fig. 6). Beach rock formationsextend down to 5 m depth, with sandy deposits of a fewmetres thickness occurring in deeper waters and lying discor-dantly over older (pre-Holocene) sedimentary layers that areinclined to the north (Fig. 6). Posidonia meadows occupy anarea extending from a depth of 10 m down to 20 m, thedeepest meadows being more extensive and enclosing severalsand patches.
Nearshore hydrodynamics and sediment transport
For the study of nearshore hydrodynamics, the Gyra barrierbeach was subdivided into three sectors (S-I, S-II, S-III)according to the shoreline orientation (Fig. 3): from the south-west end of the barrier beach (Ag. Ioannis) to profile 2 (S-I),from profile 2 to Gyrapetra Point (S-II), and from GyrapetraPoint to the navigational channel (S-III). Subsequently, thehydrodynamic limits of the beach zone (i.e. closure depth andwave run-up) for the expected maximum wave conditionswere calculated (Table 2). The strongest nearshore hydrody-namic conditions are induced by NW and W waves due totheir long fetches and the associated larger wave heights andperiods. The highest waves propagating from the W and NW
Fig. 4 Representative sonographs (upper images) and subbottom profiler records (lower images) from the west side of the Gyra barrier beach. Forlocations, see Fig. 2
Geo-Mar Lett

are capable of mobilising seafloor sediments down to a depthof ~12 m and reach swash elevations up to ~2.8 m above thestill-water level on the beach face (Table 2). In contrast, thewaves propagating from the N are associated with muchshallower closure depths (<4 m) and lower run-up (<1 m).The breaker zone, which coincides with the zone of highestsediment mobility and also defines the seaward limit forlongshore sediment transport, is restricted to water depths lessthan 2–3 m.
Τhe estimates of the mean potential longshore and cross-shore sediment transport rates (m3/year) at the locations of theten shore-normal profiles (1–10; see Fig. 2) are presented inTable 3. The potential total annual sediment volume movingeastwards (along sectors I and III) and southwards (alongsector II) in the longshore direction varies from 21.1×10³ to31.3×103 m3. The potential total annual sediment transport inthe cross-shore direction does not exceed 6×10³ m3, movinglandwards with the exception of profile 2 where the directionof transport is seawards. In absolute values, the rates of cross-shore sediment transport (Qc) are 4 to 18 times lower thanthose of the longshore sediment transportQl (seeQl:Qc ratio inTable 3).
According to the estimated annual potential sediment trans-port rates (Table 3) in beach sector S-I (beach section A andpart of section B), the longshore sediment movement is to-wards the east, whilst the cross-shore transport is landwards atprofile 1 and seawards at profile 2. The longshore transportalong this sector, in combination with the southward sedimenttransport along the southern part of beach sector II (i.e. sec-tions C–E), suggest the existence of a sediment loss zone inthe area south of profile 2, especially during storms. This isconsistent with the lack of sediment and the presence of
extensive beach rock formations in the nearshore zone, to-gether with extensive shoreline retreat in the vicinity of profile2 (see Fig. 2). Beach section F is characterised by relativelyhigher potential longshore sediment transport rates comparedto sections E and D (Table 3), which favour sediment accu-mulation. To the north in beach sector S-III, the eastwarddirection of sediment transport explains the observed accumu-lation of sediment in the area of profile 10 and at the northernedge of the navigational channel, where a spit has formed andis periodically dredged to deepen the channel and avoid itsblockage. Finally, the aforementioned divergent movement ofsediment on either side of Gyrapetra Point explains the ob-served paucity of sediment in that area.
Morphodynamic changes
Seasonal changes
The seasonal morphological changes along the shore-normalprofiles are presented schematically in Fig. 7. Data on thehorizontal shoreline displacement, the associated width of theactive beach and the maximum vertical variation of the sub-aerial beach relief are given in Table 4.
The west side of the barrier beach is characterised by anactive beach width ranging between 29 and 49 m, with theexception of the Ag. Ioannis beach (at the southwest end of thewest side) where the width of the active beach ranges from15.6 m at profile 1 and 9 m at profile 2 to <1 m in the areabetween profiles 1 and 2. Both sides of the barrier beach(north and west) undergo similar vertical changes of theirsubaerial part, ranging from –0.3 up to –0.8 m. In addition,the maximum shoreline retreat of up to 2 m recorded between
Fig. 5 Surficial sediment types and morphology along the shore-normal profiles (7–10) on the north side of the Gyra barrier beach
Geo-Mar Lett

March 2007 and June 2008 is attributed to an extreme stormevent that took place on 9–11 November 2007. The corre-sponding volumetric changes along specific shore-normalprofiles at the west side of the beach (assuming that eachprofile represents a beach segment of 1 m width) range from–10.2 to +3 m3/m (Table 4). These changes are, on average,much higher than those recorded for the north side of thebarrier beach (–0.6 to –5.8 m3/m). At least 80% of these
changes can be attributed to the storm event of November2007. On the other hand, at the locations of profiles 1, 2, 9 and10 (Fig. 7) this storm event resulted in sediment depositionand a temporary recovery of the beach.
Assuming that profiles 1–10 are representative of the mor-phology of the corresponding beach sections A–J (see Fig. 2),and based on the volumetric change of each beach sectiongiven in Table 4, the Gyra barrier beach has lost about 30×103
Fig. 6 Representative seabed sonographs (upper images) and subbottom profiler records (lower images) from the north side of the Gyrapetra barrierbeach. For locations, see Fig. 2
Table 2 Extreme run-up eleva-tions (R2%max.) and closure depth(hc) in the three sectors (seeFig. 2) of the Gyra barrier beach,for the maximum and most fre-quent incoming waves
Sector Mean bottom slope Wind/wave direction Run-up R2%max. (m) Closure depth hc (m)
S-I 9.0% N 0.81 3.79
NW 2.49 11.17
W 1.98 11.93
S-II 7.5% N 0.67 3.79
NW 2.07 11.17
W 2.49 11.93
S-III 8.5% N 0.76 3.79
NW 2.35 11.17
W 2.82 11.93
Geo-Mar Lett

m3 of sediment from its west side (sections C–F), which isalmost triple the volume (~11×103 m3) removed from its northside (sections G–J). It should be emphasised that the sedimentloss from the west side during the 2-day extreme storm eventof November 2007 exceeded the total sediment loss during the15-month study period by ~5.9×10³ m3, indicating that somematerial has gradually returned to the beach after the storm. Incontrast, the north side has been much less affected by thestorm event, since the removed sediment volume is estimatedto be less than 10% of the total volume lost during the studyperiod (Table 4).
Inter-annual changes
The extraction of the shoreline position of the Gyra barrierbeach from the aerial photographs of 1960, 1972, 1987 and2006 (Fig. 8) showed that its west side has retreated more than20 m, with the maximum retreat (>40 m) observed in the areaof profile 2. Erosion in this area can be first observed in theaerial photographs of 1987; its initiation is inferred to bebetween 1972 and 1987, and is partially attributed to theconstruction of a road in the upper part of the beach in the1980s. This road substantially reduced the actual effectivebeach width for wave energy dissipation, enhancing wavereflection and the offshore-directed undertow flow. The shore-line retreat at the north side of the barrier beach is muchsmaller, ranging from <5 to 15 m; minimum retreat is ob-served at the eastern end of the barrier beach, consistent withthis area receiving sediments through longshore transport. Ingeneral, more than 50% of the Gyra barrier beach retreatoccurred from 1972 to 1987, whereas erosional processesare still active on the Ag. Ioannis beach. The north side ofthe Gyra barrier beach, however, shows some localised accre-tion (<2 m) and an overall reduction in erosion rates since1987, consistent with it experiencing lower wave energycompared to the west side.
In order to correlate the phases of shoreline retreat withpossible changes in sediment availability linked to the north-ward sediment transport along the cliffs of the west coast ofLefkada island (Rousakis et al. 2008; May et al. 2012), chang-es in wave regime were explored by using the ECMWF ERA-
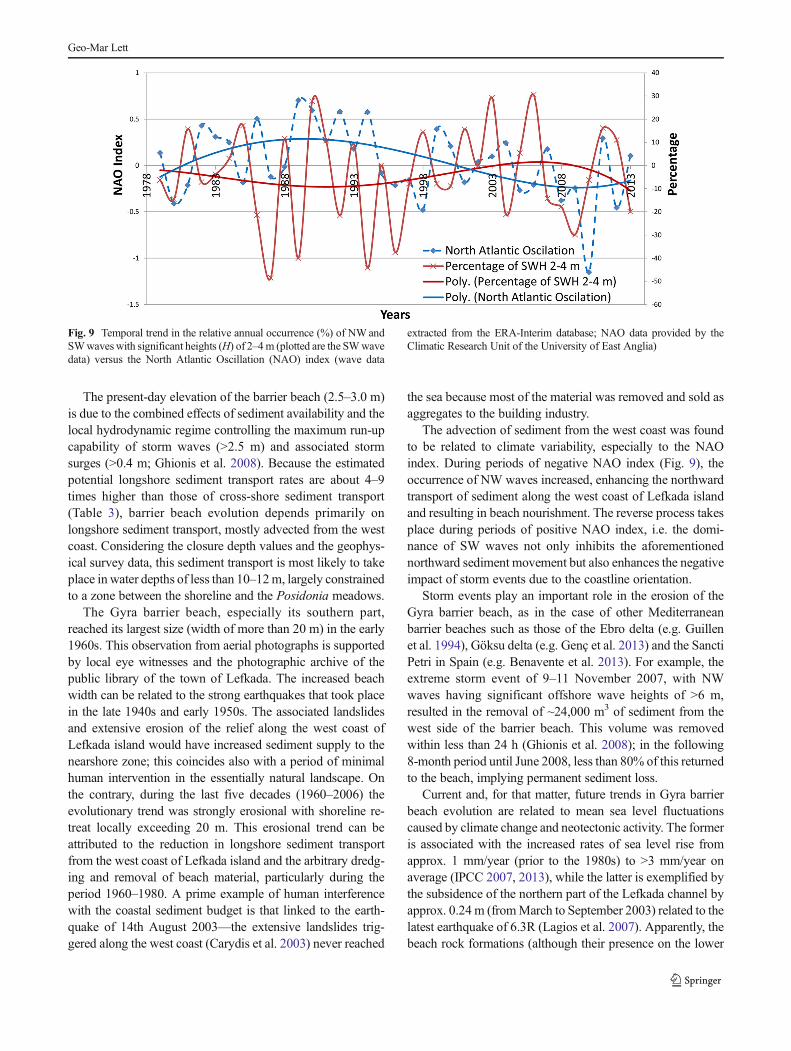
Interim reanalysis database. The significant wave height datawere grouped into four subcategories: 0–1, 1–2, 2–4 and >4m. In this work, only the results of the analysis for the 2–4 mgroup are presented, as these were found to be the mostsignificant for sediment transport. The analysis was appliedto pre-specified wave directions, i.e. the SW incoming wavesthat favour sediment advection from the west coast of Lefkadatowards the barrier beach, and the NW incoming waves thatare responsible for the re-arrangement of the advected sedi-ment and for the loss of sediment to the nearshore zone duringstorms. This investigation revealed a significant inter-annualvariability in the frequency of occurrence of waves ap-proaching from the SW (180–270°) and NW (270–360°).Moreover, changes in the relative frequencies of occurrenceof NW and SW waves with significant heights of 2–4 m(expressed in percentages) were found to be in good agree-ment with inter-annual fluctuations in the NAO index (Fig. 9).Thus, negative NAO index values coincide with increasedoccurrence of NW waves, whereas SW waves dominate dur-ing periods of positive NAO index, enhancing the northwardmovement of sediment along the west coast of Lefkada island.
Discussion
The Gyra barrier beach, like the majority of its counterpartsworldwide, must have started forming after the termination ofthe rapid phase of sea level rise at 6±1 ka BP (e.g. Masselinkand Gehrels 2014); this period corresponds to a mean sea levelthat was 5–6 m lower than the present level (Lambeck 1996).The shape of the Gyra barrier beach, characterised by a 90°change in orientation at Gyrapetra Point, seems to have beencontrolled by the local geotectonic setting (Bornovas 1964;Sachpazi et al. 2000), especially at the early stages of itsformation. This is supported by the SSW–NNE and WNW–ESE orientation of the main active neotectonic fault zones(Lekkas et al. 2001), which cause a differential downlift of thebroader barrier beach area. It is also in accordance with thedepth of occurrence of the suspected barrier-like formationwith transgressive characteristics (cf. Thom 1984; Cattaneo
Table 3 Annual potential longshore (Ql) and cross-shore (Qc) sediment transport rates (103 m3/year) under the combined action of N, NWandWwavesalong the ten profiles (for locations, see Fig. 2)a
Sector I Sector II Sector III
P1 P2 P3 P4 P5 P6 P7 P8 P9 P10
Ql 33.3 29.3 –18.8 –25.3 –23.1 –27.2 26.5 29.3 12.9 16.2
Qc –3.7 +1.6 –3.9 –5.8 –4.0 –4.4 –4.0 –4.0 –4.0 –4.0
Ql:Qc 9.0:1 18.3:1 4.3:1 4.3:1 5.7:1 6.3:1 6.6:1 7.3:1 3.2:1 4.1:1
a Positive longshore values: transport from Ag. Ioannis towards the navigational channel; positive cross-shore values: seaward transport
Geo-Mar Lett

Fig. 7 Seasonal morphological changes of the shore-normal profiles 1–10
Geo-Mar Lett

and Steel 2003) observed at ~15 and 10–12 m water depth atthe west and north side of the barrier respectively. These waterdepths could reflect the combined effect of Holocene sea levelrise and localised neotectonic activity. Thus, its formationwould have commenced at the very early stages of the slowphase of sea level rise, i.e. prior to 6 ka BP, when the mean sealevel was 6–8 m lower than it is today (Lambeck and Purcell2005), or perhaps even lower if a stronger variation in sea levelchange is accepted, as Brückner et al. (2010) stated for the BlackSea and van de Plassche (1985) for the northern Dutch coast.
Neotectonic activity is also shown by the step-like mor-phology of the existing beach rock formations, which appeardown to water depths exceeding 6 m (Verykiou-Papaspyridakou et al. 2008) and are the deepest beach rocksfound in Greek waters. In comparison, Desruelles et al. (2009)and Fouache and Pavlopoulos (2005) have reported similarbeach rocks in the rather tectonically stable Cyclades Plateau
of the Aegean Sea in depths smaller than 5 m. Ongoingseismotectonic activity (see below) can also explain the differencein the depth of the ex-barrier formation between the west andnorth sides of the Gyra barrier beach. Indeed, this can be associ-ated with a differential rate of downlift of the neotectonic unit ofLefkada town (Fig. 1a, b), described by Lekkas et al. (2001) as atectonic graben controlled mainly by the W–E-trendingneotectonic faults. In addition, Pirazzoli et al. (1994) and Stiros(2001) have referred to co-seismic subsidence phenomena onLefkada island at about 350–300 BC and 500–700 AD.
The late Holocene formation and evolution of the Gyrabarrier beach might also incorporate tsunami events commonin Greek waters (Papazachos and Papazachou 2003); suchevents may have induced sudden barrier-beach formationpulses by reorganizing the beach configuration produced bylonger-term processes such as longshore sediment transport(May et al. 2012).
Table 4 Estimated volume changes along the shore-normal profiles (1–10) and in the corresponding sections (A–J) of the barrier beach during the studyperiod (March 2007–June 2008), including the November 2007 extreme storm event (as described by Ghionis et al. 2008)a
Profile AW HC VC ΑT ΑS Section Section length VT VS(m) (m3/m) (m) (103 m3)
1 15.6 –2.5 0.6 +3.0 +0.4 A 850 2.00 0.34
2 9.0 –1.5 0.8 –0.2 +1.5 B 125 –0.02 0.18
3 29.0 –0.5 0.6 –9.0 –7.9 C 932 –8.38 –7.36
4 32.8 –1.3 0.3 –9.6 –8.1 D 341 –6.04 –2.90
5 49.0 –2.1 0.5 –10.2 –8.2 E 364 –3.71 –2.98
6 42.0 –1.0 0.4 –6.3 –7.4 F 1,545 –9.73 –11.43
Total 4,157 –29.88 –24.15
7 29.0 –0.8 0.4 –0.6 –2.8 G 1,000 –0.60 –2.80
8 26.5 –0.4 0.4 –5.8 –2.3 H 1,000 –5.80 –2.30
9 20.0 –1.4 0.8 –2.3 +3.2 I 1,175 –2.70 3.76
10 27.0 +1.5 0.8 –1.5 +0.4 J 1,110 –1.66 +0.44
Total 4,285 –10.76 –0.90
a AW, active beach width; HC, horizontal shoreline displacement; VC, maximum change in elevation; AT volume change along each profile (assuming 1m width), VT volume change in beach sections, AS and VS corresponding volume changes related to storm event
Fig. 8 Shoreline displacementsat the shore-normal profiles (1–9)along the Gyra barrier beach from1960–2006
Geo-Mar Lett
The present-day elevation of the barrier beach (2.5–3.0 m)is due to the combined effects of sediment availability and thelocal hydrodynamic regime controlling the maximum run-upcapability of storm waves (>2.5 m) and associated stormsurges (>0.4 m; Ghionis et al. 2008). Because the estimatedpotential longshore sediment transport rates are about 4–9times higher than those of cross-shore sediment transport(Table 3), barrier beach evolution depends primarily onlongshore sediment transport, mostly advected from the westcoast. Considering the closure depth values and the geophys-ical survey data, this sediment transport is most likely to takeplace in water depths of less than 10–12m, largely constrainedto a zone between the shoreline and the Posidonia meadows.
The Gyra barrier beach, especially its southern part,reached its largest size (width of more than 20 m) in the early1960s. This observation from aerial photographs is supportedby local eye witnesses and the photographic archive of thepublic library of the town of Lefkada. The increased beachwidth can be related to the strong earthquakes that took placein the late 1940s and early 1950s. The associated landslidesand extensive erosion of the relief along the west coast ofLefkada island would have increased sediment supply to thenearshore zone; this coincides also with a period of minimalhuman intervention in the essentially natural landscape. Onthe contrary, during the last five decades (1960–2006) theevolutionary trend was strongly erosional with shoreline re-treat locally exceeding 20 m. This erosional trend can beattributed to the reduction in longshore sediment transportfrom the west coast of Lefkada island and the arbitrary dredg-ing and removal of beach material, particularly during theperiod 1960–1980. A prime example of human interferencewith the coastal sediment budget is that linked to the earth-quake of 14th August 2003—the extensive landslides trig-gered along the west coast (Carydis et al. 2003) never reached
the sea because most of the material was removed and sold asaggregates to the building industry.
The advection of sediment from the west coast was foundto be related to climate variability, especially to the NAOindex. During periods of negative NAO index (Fig. 9), theoccurrence of NW waves increased, enhancing the northwardtransport of sediment along the west coast of Lefkada islandand resulting in beach nourishment. The reverse process takesplace during periods of positive NAO index, i.e. the domi-nance of SW waves not only inhibits the aforementionednorthward sediment movement but also enhances the negativeimpact of storm events due to the coastline orientation.
Storm events play an important role in the erosion of theGyra barrier beach, as in the case of other Mediterraneanbarrier beaches such as those of the Ebro delta (e.g. Guillenet al. 1994), Göksu delta (e.g. Genç et al. 2013) and the SanctiPetri in Spain (e.g. Benavente et al. 2013). For example, theextreme storm event of 9–11 November 2007, with NWwaves having significant offshore wave heights of >6 m,resulted in the removal of ~24,000 m3 of sediment from thewest side of the barrier beach. This volume was removedwithin less than 24 h (Ghionis et al. 2008); in the following8-month period until June 2008, less than 80% of this returnedto the beach, implying permanent sediment loss.
Current and, for that matter, future trends in Gyra barrierbeach evolution are related to mean sea level fluctuationscaused by climate change and neotectonic activity. The formeris associated with the increased rates of sea level rise fromapprox. 1 mm/year (prior to the 1980s) to >3 mm/year onaverage (IPCC 2007, 2013), while the latter is exemplified bythe subsidence of the northern part of the Lefkada channel byapprox. 0.24m (fromMarch to September 2003) related to thelatest earthquake of 6.3R (Lagios et al. 2007). Apparently, thebeach rock formations (although their presence on the lower
Fig. 9 Temporal trend in the relative annual occurrence (%) of NW andSWwaveswith significant heights (H) of 2–4m (plotted are the SWwavedata) versus the North Atlantic Oscillation (NAO) index (wave data
extracted from the ERA-Interim database; NAO data provided by theClimatic Research Unit of the University of East Anglia)
Geo-Mar Lett

beach face is evidence of loss of beach material) are currentlyacting as a protective element providing wave energy dissipationover a stabilized seabed. Their potential partial removal (e.g. for abetter access for swimmers) could be rather catastrophic for theGyra barrier beach and the associated lagoonal ecosystem.
Conclusions
1. The formation and evolution of the Gyra barrier beachduring the late Holocene have been controlled primarilyby the regional relative sea level change associated withlocal seismotectonic activity, by sediment advectionmost-ly from the west coast of Lefkada island, and by severehuman interference.
2. In the absence of significant astronomical tides, the mor-phometric characteristics of the barrier beach are con-trolled by the wave climate, whereby extensive morpho-logical changes caused by storm events could be decisivein terms of long-term instability.
3. The nearshore geomorphology is characterised by thepersistent occurrence of beach rocks found locally inwater depths exceeding 7 m, these being among thedeepest found in the eastern Mediterranean. Their step-like morphology and the presence of a newly discoveredbarrier-like formation in 12–15 m water depth are indic-ative of the tectonic downlift of the area.
4. The pre-1960s accretional phase of beach barrier forma-tion has been followed by a strong erosional phase affect-ing tens of metres of shoreline. This is attributed tochanges in sediment availability due to both natural andanthropogenic factors. The former seem to be related toclimate variability, as shown by the good relationshipbetween the wave regime and the NAO index. The lattercan be associated with the arbitrary extraction of beachmaterial (mostly prior to 1980) and human obstruction ofterrestrial sediment reaching the west coastline of theisland, which is the main sediment source of theGyrapetra barrier beach.
5. Interrelationships between the NAO index and the shiftsin direction and frequency of major storms in the IonianSea deserve further investigation, as this could serve toexplain and predict long-term cycles of accretion anderosion not only for the Gyra barrier beach but also formany other Ionian beaches.
Acknowledgements The authors are grateful to the General Secretariatfor the Environment of the Ministry of Environment, Planning and PublicWorks for funding this work within the framework of the ‘Study for themitigation of the erosion of the tourist beaches of the north coast of theLefkada Island’ (research grant 187265/3965/08-12-06). The geophysicalsurvey was carried out by the Institute of Oceanography of the HellenicCentre for Marine Research within the framework of the study of coastalerosion and deposition along the west and north coast of the town of
Lefkada, funded by the municipality of Lefkada in 2004. Useful feedbackfrom E. Karymbalis, an anonymous reviewer and the journal editorshelped in improving the article.
References
Andrew J, Cooper G (2005) Microtidal coasts. In: Encyclopedia ofCoastal Science. Springer, Heidelberg, p 638
Bailard JA (1981) An energetics total load sediment transport model for aplane sloping beach. J Geophys Res 86(C11):10938–10954
Bathrellos GD, Antoniou VE, Skilodimou HD (2009) Morphotectoniccharacteristics of Lefkas Island during the Quaternary (Ionian Sea,Greece). Bulgarian Academy of Science, Sofia, Geol Balcan 38(1–3):23–33
Benavente J, del Río L, Plomaritis TA, Menapace W (2013) Impact ofcoastal storms in a sandy barrier (Sancti Petri, Spain). J Coast Res SI65:666–671
Benetatos C, Kiratzi A, Papazachos C, Karakasis G (2004) Focal mech-anisms of shallow and intermediate depth earthquakes along theHellenic arc. J Geodyn 37:253–296
Benetatos C, Kiratzi A, Roumelioti Z, Stavrakakis G, Drakatos G,Latoussakis I (2005) The 14 August 2003 Lefkada Island (Greece)earthquake: focal mechanisms of the mainshock and of the after-shock sequence. J Seismol 9:171–190
Benetatos C, Dreger D, Kiratzi A (2007) Complex and segmented ruptureassociated with the 14 August 2003Mw 6.2 Lefkada, Ionian Islands,Earthquake. Bull Seismol Soc Am 97(1B):35–51
Bornovas IM (1964) The Geology of the Lefkada Island (in Greek). SpecPubl vol X(1), Institute of Geological and Mineral Exploration,Athens
Brückner H, KelterbaumD,Marunchak O, PorotovA, Vött A (2010) TheHolocene sea level story since 7500 BP – Lessons from the EasternMediterranean, the Black and the Azov Seas. Quat Int 225:160–179
Canizares R, Irish JL (2008) Simulation of storm-induced barrier islandmorphodynamics and flooding. Coast Eng 55(12):1089–1101
Carydis P, Lekkas E, Lozios S, Skourtsos E, Danamos G (2003)Preliminary observations on the August 14, 2003, Lefkada Island(Western Greece) Earthquake. Earthquake Engineering ResearchInstitute (EERI), Athens, https://www.eeri.org/lfe/pdf/greece_lefkada_eeri_preliminary_rpt.pdf
Castelle B, Le Corre Y, Tomlinson R (2008) Can the Gold Coast beacheswithstand extreme events? Geo-Mar Lett 28:23–30
Cattaneo A, Steel RJ (2003) Transgressive deposits: a review of theirvariability. Earth-Sci Rev 62:187–228
Davis RA Jr (1994) Barrier island systems – A geologic overview. In:Davis RA Jr (ed) Geology of Holocene barrier island systems.Springer, New York, pp 435–456
Dee DP, with 35 co-authors (2011) The ERA-Interim reanalysis: config-uration and performance of the data assimilation system. Q J RMeteorol Soc 137:553–597
Desruelles S, Fouache É, Ciner A, Dalongeville R, Pavlopoulos K, KosunE, Coquinot Y, Potdevin J-L (2009) Beachrocks and sea levelchanges since Middle Holocene: comparison between the insulargroup of Mykonos–Delos–Rhenia (Cyclades, Greece) and thesouthern coast of Turkey. Global Planet Change 66:19–33
Dingler JR, Reiss TE (1990) Cold-front driven storm erosion andoverwash in the central part of the Isles Dernieres, a Louisianabarrier-island arc. Mar Geol 91:195–206
Doutsos T, Kokkalas S (2001) Stress and deformation patterns in theAegean region. J Struct Geol 23:455–472
FitzGerald DM, Fenster MS, Argow BA, Buynevich IV (2008) Coastalimpacts due to sea-level rise. Annu Rev Earth Planet Sci 36:601–647
Folk RL (1974) Petrology of sedimentary rocks. Hemphill, Austin, TX
Geo-Mar Lett

Fouache E, Pavlopoulos K (eds) (2005) Sea level changes in EasternMediterranean during Holocene: indicators and human impacts. ZGeomorphol 137
Freeman CW, Bernstein DJ, Mitasova H (2004) Rapid response 3Dsurvey techniques for seamless topo/bathy modeling: 2003Hatteras Breach, North Carolina. Shore & Beach 72(2):3–7
Genç AN, İnan A, Yılmaz N, Balas L (2013) Modeling of erosion atGöksu coasts. J Coast Res SI 65:2155–2160
Ghionis G, Poulos S, Kampanis N, Verikiou E, Karditsa A, AlexandrakisG, Andris P (2008) The effects of a severe storm event on the NWcoast of Lefkada Island, Ionian Sea (Greece). Geophys Res Abstr10:EGU2008-A-00617
Gracia V, Garcia M, Grifoll M, Sanchez-Arcilla A (2013) Breaching of abarrier under extreme events. The role of morphodynamic simula-tions. J Coast Res SI 65:951–956
Guillen J, Camp J, Palanques A (1994) Short-time evolution of amicrotidal barrier-lagoon system affected by storm andoverwashing: the Trabucador Bar (Ebro Del ta , NWMediterranean). Z Geomorphol 38(3):267–281
Hallermeier RJ (1981) A profile zonation for seasonal sand beaches fromwave climate. Coast Eng 4:253–277
Hattori M, Kawamata R ((1980) Onshore-offshore transport and beachprofile changes. In: Proc 17th Conf Coastal Engineering, ASCE,New York, vol 2, pp 1175–1193
Hemer MA, Church JA, Hunter JR (2007) Waves and climate change onthe Australian coast. J Coast Res 50:432–437
HNHS (2005) Tides of the Greek Ports. Hellenic Navy HydrographicService, Athens
IGME (1963) Geological map of the Lefkada Island (1:50,000). Institutefor Geological and Mineral Exploration, Athens
IPCC (2007) Climate Change 2007: The physical science basis.Contribution of Working Group I to the Fourth Assessment Reportof the Intergovernmental Panel on Climate Change. CambridgeUniversity Press, Cambridge
IPCC (2013) Summary for Policymakers. In: Climate Change 2013: Thephysical science basis. Contribution ofWorking Group I to the FifthAssessment Report of the Intergovernmental Panel on ClimateChange. Cambridge University Press, Cambridge
Iribarren CR, Nogales C (1949) Protection des Ports. In: XVII IntNavigation Congress, Section II, Communication, pp 31–80
Jiménez JA, Sánchez-Arcilla A (2004) A long-term (decadal scale)evolution model for microtidal barrier islands. Coast Eng 51(8–9):749–764
Kapsimalis V, Pavlopoulos K, Panagiotopoulos I, Drakopoulou P,Vandarakis D, Sakel lar iou D, Anagnostou C (2009)Geoarchaeological challenges on the Cyclades shelf (Aegean sea).Z Geomorphol 53(1):169–190
Kim D, Grant WE, Cairns DM, Bartholdy J (2013) Effects of the NorthAtlantic Oscillation and wind waves on salt marsh dynamics in theDanish Wadden Sea: a quantitative model as proof of concept. Geo-Mar Lett 33:253–261
Komar PD (1988) Environmental controls on littoral transport. In: Proc21st Int Coastal Engineering Conf, American Society of CivilEngineers, pp 1238–1252
Krestenitis YN, Androulidakis YS, Kontos YN, Georgakopoulos G(2011) Coastal inundation in the north-eastern Mediterranean coast-al zone due to storm surge events. J Coast Conserv 15:353–368
Lagios Ε, Sakkas V, Papadimitriou P, Parcaridis I, Damiata BN,Chousianitis K, Vassilopoulou S (2007) Crustal deformation in theCentral Ionian Islands (Greece): results from DGPS and DInSARanalyses (1995–2006). Tectonophysics 444:119–145
Lambeck K (1996) Sea-level change and shore-line evolution in AegeanGreece since Upper Palaeolithic time. Antiquity 70:588–611
Lambeck K, Purcell A (2005) Sea-level change in the Mediterranean Seasince the LGM: model predictions for tectonically stable areas. QuatSci Rev 24:1969–1988
Leatherman SP (1979) Barrier dune systems: a re-assessment. SedimentGeol 24:1–16
Leatherman SP (1988) Barrier Island Handbook. Coastal PublicationsSeries, Laboratory for Coastal Research, University of Maryland
Lekkas EL, Danamos GD, Lozios SG (2001) Neotectonic structure andevolution of Lefkada Island (in Greek). Bull Geol Soc GreeceXXXΙV(1):157–163
Masselink G, Gehrels R (eds) (2014) Coastal environments and globalchange. AGU, Wiley, New York
Matias A, Ferreira Ó, Vila-Concejo A, Garcia T, Dias JA (2008)Classification of washover dynamics in barrier islands.Geomorphology 97:655–674
May SM, Vött A, Brückner H, Grapmayer R, Handl M, Wennrich V(2012) The Lefkada barrier and beachrock system (NW Greece) –Controls on coastal evolution and the significance of extreme waveevents. Geomorphology 139–140:330–347
Moore FR, Kerlinger P, Simons TR (1990) Stopover on a Gulf coast barrierisland by spring trans-gulf migrants. Wilson Bull 102(3):487–500
Papazachos V, Papazachou K (2003) The earthquakes of Greece, 3rd edn(in Greek). Ziti Publications, Thessaloniki
Pirazzoli PA, Stiros SC, Laborel J, Laborel-Deguen F, Arnold M,Papageorgiou S, Morhangel C (1994) Late-Holocene shorelinechanges related to palaeoseismic events in the Ionian Islands,Greece. The Holocene 4:397–405
Rousakis G, Sakellariou D, Georgiou P, Anagnostou Ch, Lykousis V(2008) Coastal erosion along the western and northern shore ofLefkada island. In: Proc 4th Hellenic Congr Management andImprovement of the Coastal Zone, 23–27 September 2008,Mytilini, Greece, pp 337–346
Ružić I, Marović I, Benac Č, Ilić S (2014) Coastal cliff geometry derivedfrom structure-from-motion photogrammetry at Stara Baška, KrkIsland, Croatia. Geo-Mar Lett 34. doi:10.1007/s00367-014-0380-4
Sachpazi M, Hirn A, Clément C, Haslinger F, Laigle M, Kissling E,Charvis P, Hello Y, Lépine J-C, Sapin M, Ansorge J (2000) WesternHellenic subduction and Cephalonia Transform: local earthquakesand plate transport and strain. Tectonophysics 319:301–319
Sallenger AH Jr (2000) Storm impact scale for barrier islands. J Coast Res16(3):890–895
Sancho-García A, Guillén J, Ojeda E (2013) Storm-induced readjustmentof an embayed beach after modification by protection works. Geo-Mar Lett 33:159–172
Shtienberg G, Zviely D, Sivan D, Lazar M (2014) Two centuries ofcoastal change at Caesarea, Israel: natural processes vs. humanintervention. Geo-Mar Lett 34:365–379
Stiros SC (2001) The AD 365 Crete earthquake and possible seismicclustering during the fourth to sixth centuries AD in the easternMediterranean: a review of historical and archaeological data. JStruct Geol 23:545–562
Stockdon H, Holman RA, Howd PA, Sallenger AH (2006) Empiricalparameterisation of setup, swash and run-up. Coast Eng 53:573–588
Thom BG (1984) Transgressive and regressive stratigraphies of coastalsand barriers in southeast Australia. Mar Geol 56(1–4):137–158
Tsimplis MN (1994) Tidal oscillations in the Aegean and the Ionian Seas.Estuar Coast Shelf Sci 39:201–208
van de Plassche O (1985) Time-limit assessment of some Holocenetransgressive and regressive periods in the northern Netherlands.Eiszeitalter Gegenwart 35:43–48
van Rijn LC, Walstra DJR, Grasmeijer B, Sutherland J, Pan S, Sierra JP(2003) The predictability of cross-shore bed evolution of sandybeaches at the time scale of storms and seasons using process-based Profile models. Coast Eng 47:295–327
Verykiou-Papaspyridakou E, Leivaditis G, Poulos S, Katopoulos N(2004) Modern changes of the Agios Nikitas beach (LefkadaIsland: natural processes and human interference) (in Greek). In:Proc 7th Panhellenic Geographical Congr, 14–17 October 2004,Μytillini, Α, pp 175–182
Geo-Mar Lett

Verykiou-Papaspyridakou Ε, Andris PD, Karditsa A, Alexandrakis G,Poulos S, Ghionis G (2008) Study of the beach rocks at theGyrapetra region of the Lefkada Island (in Greek). Bull Geol SocGreece XLII(I):105–113
Vött A (2007) Relative sea level changes and regional tectonic evolutionof seven coastal areas in NW Greece since the mid-Holocene. QuatSci Rev 26:894–919
Vött A, May M, Brückner H, Brockmüller S (2006) Sedimentary evi-dence of Late Holocene tsunami events near Lefkada Island (NWGreece). Z Geomorphol suppl 146:139–172
Vött A, Brückner H, May M, Lang F, Herd R, Brockmüller S (2007)Strong tsunami impact on the Bay of Aghios Nikolaos and itsenvirons (NW Greece) during Classical–Hellenistic times. Quat Int181:105–122
Vött A, Brückner H, Brockmüller S, Handl M, Maya SM, Gaki-Papanastassiou K, Herd R, Lang F, Maroukian H, Nelle O,Papanastassiou D (2009) Traces of Holocene tsunamis across theSound of Lefkada, NW Greece. Global Planet Change 66:112–128
Wamsley TV, HathawayKK (2004)Monitoringmorphology and currentsat the Hatteras Breach. Shore & Beach 72(2):9–14
Geo-Mar Lett
Top Related
Copyright © 2022 FDOKUMEN

