


Bahasa
Halaman
Hukum

How to Improve Teaching Practice? Experimental Comparison of Centralized Training and In-classroom Coaching
Jacobus Cilliers, Brahm Fleisch, Cas Prinsloo Stephen Taylor
RISE-WP-18/024
WORKING PAPER September 2018
Thefindings,interpretations,andconclusionsexpressedinRISEWorkingPapersareentirelythoseoftheauthor(s).CopyrightforRISEWorkingPapersremainswiththeauthor(s).www.riseprogramme.org
How to improve teaching practice? Experimentalcomparison of centralized training and in-classroom
coaching.∗
Jacobus Cilliers,† Brahm Fleisch,‡ Cas Prinsloo§ Stephen Taylor¶
July 2018
Abstract
We experimentally compare two modes of in-service professional development for South Africanpublic primary school teachers. In both programs teachers received the same learning material anddaily lesson plans, aligned to the official literacy curriculum. Pupils exposed to two years of theprogram improved their reading proficiency by 0.12 standard deviations if their teachers receivedcentralized Training, compared to 0.24 if their teachers received in-class Coaching. Classroom ob-servations reveal that teachers were more likely to split pupils into smaller reading groups, whichenabled individualized attention and more opportunities to practice reading. Results vary by classsize and baseline pupil reading proficiency.
∗Results reported on in this study forms part of the Early Grade Reading Study (EGRS) which was lead by the Depart-ment of Basic Education to find out how to improve early grade reading. We are grateful for useful feedback from Servaasvan der Berg, David Evans, Clare Leaver, Rob Garlick, James Habyarimana, and an anonymous pair of reviewers. CarolNuga-Deliwe, Janeli Kotze and Mpumi Mohohlwane provided excellent research assistance and management support. TheInternational Initiative for Impact Evaluation provided funding for the evaluation. Many partners contributed to funding theprogram: UNICEF, Zenex foundation, North West Department of Education, Anglo American Chairman’s Fund, and theDepartment of Planning, Monitoring and Evaluation. The University of the Witwatersrand and the Human Sciences ResearchCouncil provided additional administrative and research support. All errors and omissions are our own.†McCourt School of Public Policy, Georgetown University‡University of Witwatersrand’s School of Education, South Africa§Human Sciences Resource Council¶Department of Basic Education, Government of South Africa
1

1 Introduction
In most of the developing world, children are attending school without adequately learning to read. InSouth Africa, for example, a striking 78 percent of students still cannot read with meaning after four yearsof schooling (Mullins et al. 2017).1 Such low levels of reading proficiency have also been documentedin South Asia and elsewhere in sub-Saharan Africa (Banerji et al. 2013, Bold et al. 2017). Since readingis a gateway to future learning, addressing these shortcomings should be a policy priority.
Evidence suggests great potential to accelerate learning by improving the quality of teaching, butchanging ingrained teaching practices presents a significant change. Numerous studies have found thatteachers play a critical role in shaping a child’s learning trajectory (Das et al. 2007, Clotfelter et al.2010, Rivkin et al. 2005, Staiger & Rockoff 2010). And good teaching practices correlate with fasterlearning (Allen et al. 2013, Araujo et al. 2016). Yet, teacher quality is highly variable, both within andbetween countries. In recognition of this, government and donors invest billions of dollars annually onin-service teacher professional development,2 but with disappointing results. For example, many studiesin the United States have found no impact of professional development programs on student learning,especially when conducted by government at scale;3 and a recent meta-analysis of evaluations of in-service teacher training programs in developing countries concluded that “teacher training programsvary enormously, both in their form and their effectiveness” (Popova et al. 2016). One possible reasonfor the failure is that many programs focus only on imparting knowledge, yet teaching is a skill thatneeds to be developed through ongoing practice (Kennedy 2016).
Broadly defined, there are two common approaches to in-service teacher professional development:training at a centralized venue, or classroom visits by coaches who observe teaching, provide feedback,and demonstrate correct teaching techniques. The first approach provides more time for a deeper con-ceptual understanding to develop before actually implementing the new techniques, but it might not besufficient to change behavior. The second approach could facilitate a change in behavior by encouragingpractice, which may in turn lead to learning by doing; and targeted feedback could assure correct ap-plication of techniques. There is promising evidence that this approach can succeed at shifting teachingpractice and improving student learning (Kraft et al. 2018), but it is generally considered more expensive(Knight 2012). Recent evidence has also shown that low-cost adaptations to coaching, such as usingonline technology, is less effective (Oreopoulos & Petronijevic 2018).
A possible cost-effective way to encourage adoption of new techniques is the use of scripted lessonplans (Jackson & Makarin 2018), but they are not without controversy. Lesson plans can reduce thecost to teachers of switching to a new technique, and provide daily prompts and reminders to encourage
1This is the percentage of children scoring less than the low international benchmark score, as defined by the Progress inInternational Reading Study (PIRLS)
2By some estimates the United States spends 18 billion annually on teacher professional development (Fryer 2017). Ac-cording to a nationally representative survey conducted in 38 developed countries, 91 percent of teachers received professionaldevelopment in the past 12 months (Strizek et al. 2014). And Popova, Evans & Arancibia 2016 calculate that nearly two thirdsof World Bank-funded education programs include a professional development component.
3Jacob & Lefgren (2004), Harris & Sass (2011), Garet et al. (2011, 2008), Jacob & Lefgren (2004), Randel et al. (2011)
2

practice. But some are concerned that they could reduce teacher autonomy and thus hinder a goodteacher’s ability to cater his/her teaching to the needs of the child (Dresser 2012).
Is a short centralized training program —combined with daily lesson plans that prompt and guide theimplementation of the new practice— sufficient to ensure use of new practice? How important is ongoingindividualised observation and feedback, provided by an expert coaches, for ensuring that new practicesare implemented and implemented well? How does this depend on the characteristics of the student,teacher or the class size? Ultimately, which approach —training or coaching— is more cost-effective atimproving student learning?
To answer these questions, we conduct a randomized evaluation in 180 public primary schools inSouth Africa, comparing two different approaches to improving the teaching of home language readingin the early grades. The first approach (which we refer to as Training) follows the traditional modelcommonly employed by governments: short, intensive training held at a central venue.4 In the secondapproach (which we refer to as Coaching), specialist reading coaches visit the teachers on a monthly basisto observe teaching practice and provide feedback. The average duration of exposure to the programsover the course of the year is roughly equivalent.5 Both interventions also provide teachers with dailylesson plans and educational materials such as graded reading booklets, flash cards, and posters. Thelesson plans are based on official government curriculum and mirror exactly the pedagogical techniquesprescribed by government, but at a higher level of specificity. Moreover, the same individuals deliveredboth training and the coaching, so any differences we observe cannot be due to differences in the qualityof implementation. Coaching costs roughly 43 USD per student annually, compared to 31 USD forTraining.
We assessed the reading ability of a random sample of 20 students in each school at three points intime: once as they entered grade one prior to the roll-out of the interventions (February 2015), and againat the end of their first and second academic years (November 2016 and 2017 respectively). During theseschool visits, we also surveyed teachers and the school principal.
We also conducted detailed lesson observations in a stratified random sample of 60 schools in October2016— 20 schools in each evaluation arm. The lesson observation instrument was explicitly designed tocapture the teaching practices prescribed by government and thus targeted by the program.
We find that, after two years of exposure to the program, students’ reading proficiency increasedby 0.12 and 0.24 standard deviations if their teachers received Training or Coaching respectively. Theimpacts are larger still —0.18 and 0.29 standard deviations respectively— when we exclude the smallsample of multi-grade classrooms, a setting where the program was never intended to work. We concludethat Coaching is more cost-effective than Training with an estimated 0.57 standard deviation increase inreading proficiency per 100 USD spent per student annually, compared to 0.39 in the case of Training.
4In our case, teachers receive two training sessions, once at the beginning and once in the middle of the year, each lastingtwo days.
5We estimate that the average number of hours of exposure to the programs were 32 and 37 hours for the Training andCoaching arms respectively. So, roughly 4/5 days in total.
3
Next, our classroom observation allows us to unpack mechanisms by measuring how teaching prac-tice changed in the classrooms. We find that even though there is no change in the frequency that the students are practicing reading in the classroom, there is a big change in how they practice reading: teachers in both treatment arms are more likely to implement a technically challenging teaching tech-nique called group-guided reading, where the students read aloud in smaller groups. As a result, students are more likely to receive individual attention from the teacher when they read, and more students are also using the graded reading booklets. The largest improvement is consistently observed in classrooms where the teachers received Coaching. Notably, we see no change in other activities that are also re-quired to take place at a daily basis, but are easier to teach.6 We perform mediation analysis, following Acharya et al. (2016), and conclude that more than half of the impact of Coaching can be explained by the improvements in group-guided reading.
Taken together, our results show that a combination of training and lesson plans can shift teaching practice and improve learning, but the shift is far larger when teachers receive ongoing observation and feedback from a coach, especially for the more difficult techniques.
Our paper contributes to growing evidence from developing countries demonstrating that a bundled intervention of training, lesson plans, and coaching can dramatically improve students’ proficiency in early-grade reading (Piper et al. 2014, 2018, Lucas et al. 2014, Kerwin et al. 2017). This is also con-sistent with the conclusion from a recent review that structured pedagogic programs —a combination of highly specified curricula, training on instructional methods, and additional learning materials— have great potential to improve learning (Snilstveit et al. 2016). This paper makes a unique contribution in two important ways. First, we experimentally vary two common forms of teacher professional develop-ment: training versus coaching. This allows us to unpack which components are uniquely responsible for the learning gains, and test for the importance of observation and feedback in developing skills. This is important, since one-off training is the most common form of government teacher professional devel-opment, yet most research looks at a more resource-intensive model of coaching. Second, the detailed classroom observations, which were explicitly developed to measure the teaching practices emphasized by the program, shed light on the underlying mechanisms.
Results of this study also contribute to debates around teacher autonomy. There is often push-back against a prescribed curriculum and set pedagogical standards, because of the fear that it will undermine teacher autonomy and limit a teacher’s ability to cater her teaching to the level of the child. Our study demonstrates the benefits of a structured pedagogical program. Teacher satisfaction with the program was high, underscoring the fact that teachers value the structure provided by standardized lesson plans. There was no detectable negative impact on any segment of the pupil population, so the reduced teacher autonomy does not come at a cost of lower learning for some types of pupils. However, it is concerning there was no detectable positive impact for the weakest students, despite the fact that programs improved the enactment of the national curriculum.
6Phonics and letter recognition are also required to be taught daily and are typically taught through whole-class reading, where all the children in the classroom follow or read with the teacher. This is a far easier form of teaching.
4
The paper proceeds as follows: section 2 describes the interventions and the motivating theoretical channels, section 3 describes the evaluation design and empirical strategy, section 4 reports results, and section 5 concludes.
2 Program description and theoretical framework
2.1 Program
Working with the South African government, we designed two related interventions aimed at improving early-grade reading in one’s home language.7 Both interventions provide teachers with lesson plans, which describe in detail the content that should be covered and pedagogical techniques that should be applied for each instructional day.8 In addition, teachers receive supporting materials, such as graded reading booklets, flash cards, and posters. The graded reading booklets provide a key resource for the teacher to use in group-guided reading (discussed in more detail below) so as to facilitate reading practice at an appropriate pace and sequence of progression. The program was led and managed by government, who appointed a service provider, Class Act, to implement the interventions.
The two interventions differ in their approach to improving teacher pedagogical practice. The one intervention trains the teachers on how to use the lesson plans and accompanying materials through central training sessions, each lasting two days and occurring twice yearly (at the beginning of the first and second semester respectively). During these training sessions, roughly a quarter of the training time was meant to be spent on teachers practicing the techniques. The ratio of facilitators to teachers during the training was roughly 7 : 1.9 The trainers also performed follow-up visits to most of the schools, in order to encourage them to continue with the program. We refer to this intervention as Training.
The second intervention, which we refer to as Coaching, provides exactly the same set of instructional materials. However, instead of central training sessions, specialist reading coaches visit the teachers on a monthly basis over the duration of the academic year in order to improve teacher content knowledge, and pedagogical techniques, and professional confidence. During these visits the coaches observe teaching, provide feedback on how to improve, and demonstrate correct teaching techniques. The coaches also hold information session with all the teachers at the start of each term to hand out new materials; and occasionally hold afternoon workshops (one to three a year) with a small cluster of nearby schools that are part of this intervention. There were three coaches, each serving 16-17 schools. The coaches are educated —all three had at least a bachelors degree— and have past experience as both teachers and coaches. They received additional training from Class Act at the start of every term.10
7In South Africa, most children are taught in their home language in grades one to three and then experience a transition to English as the language of instruction in grade four.
8Teachers were strongly encouraged to use the lesson plans, but this was not enforced.9Roughly 140 teachers and head teachers participated in the training. Given the large number of teachers participating,
two training sessions were conducted per semester with roughly 70 teachers per group. Ten facilitators participated in each of the training sessions.
10The training focused on coaching and mentoring, school curriculum, and teaching skills.
5

The coaches also conducted the training, so the differences between the programs cannot be attributedto the expertise of those administering the programs.
The program was implemented over a period of two years: in the first year all the grade one teachersin the treatment schools received training/coaching, in the second year all grade two teachers in treatmentschools received it. Thus, the same cohort of students benefited from the program, but a different set ofteachers participated each year. Figure B.1 provides a schematic breakdown of the timeline.
Figure 1 shows the distribution of teacher exposure to the coaching program in 2016, based on datacollected by Class Act. We see that the median number of visits that a teacher received was ten, but someteachers received far fewer visits. There was also high variation in the number of afternoon workshopsthat teachers attended. Putting this all together, we calculate that the average number of hours of exposureto the program was 36.7.11 According to administrative data, teacher attendance for Training was high—98 and 93 percent for the two sessions held in 2016— and there were a total of 157 follow-up visits.The organization held follow-up training for the teachers who missed the initial training. The averagenumber of hours of exposure to the program is roughly 34.12
It is important to note that both treatments follow the same curriculum as in the control. The les-son plans are fully aligned official government curriculum, both in terms of the topics covered andinstructional techniques prescribed. The lesson plans are also integrated with the government-providedworkbooks, which detail daily exercises to be completed by students.
Any difference we observe is therefore due to the modality of support the teachers receive, not thepedagogical content.
2.2 Theoretical framework
How (not) to teach reading? Despite debates around specific methodologies of teaching literacy, thereis general consensus on how students learn to read.13 Acquisition of reading proficiency requires sys-tematic practice of all the different components of reading at the appropriate sequence and pace: startingfrom the development of vocabulary, to recognizing sounds and letters (decoding), and moving towardsrecognizing words and eventually reading extended texts. The ultimate goal of reading with comprehen-sion can only be reached once someone can read fluently— i.e. when reading becomes automatic andrequires no conscious effort. This requires continual practice, as well as individual feedback to correct astudent if she is reading incorrectly.
In this regard, the South African literacy curriculum is well-aligned with international best practice. Itprescribes in detail the frequency with which different teaching activities should take place. For example,group-guided reading —where smaller groups of students read the same text under the direction of the
11Assuming that each information session lasts five hours, each coaching visit lasts one and a half hours (one hour obser-vation and 30 minutes feedback), and each afternoon session lasts two hours.
12Assuming that teachers spent on average 20 minutes talking to the teacher when visited by the trainers. The trainers wereonly supposed to talk to the school principals, but inevitably also talked to the teachers.
13See, for example, Langenberg et al. (2000).
6

teacher— is supposed to take place at a daily basis (Department of Basic Education, 2011).14 Thisactivity is an important ingredient to learning, since it provides opportunities for students to practicereading and receive individual feedback from their teacher, but it is difficult to implement.
However, in South Africa there is a significant gap between existing practice and what is prescribedin the curriculum (Hoadley 2012). The dominant norms of practice in South Africa involve an over-reliance on teacher-directed strategies and whole-class activities, such as “chorusing”, where the teachersand student all read together, or repeat after a teacher. With these activities, there is a risk that studentsdo not attempt to read themselves and merely mimic what the teacher is reading. In the worse possibleequilibrium, the students pretend to be reading and the teachers pretend to be teaching. There is alsodocumented evidence of highly incomplete curriculum coverage, and ineffective curriculum sequencingand pacing by teachers (Taylor et al. 2011).15
How to change teaching practice? Both interventions of this study are built around the assumptionthat, just like learning to read, teaching is a skill that needs to be developed through regular practice, andteachers might need additional guidance and support to ensure consistent and correct application of thenew techniques. Skill acquisition could lead to a sustained change in behavior, either by increasing themarginal product of effort for intrinsically motivated teachers (who now see the fruits of their labor), orby reducing the marginal cost of effort (once-difficult tasks now become easy to implement).
The lesson plans provide several mechanisms for ensuring that the methods are actually implementedand implemented well. Firstly, the provision of fully scripted lesson plans can reduce the effort costof transition to a new set of practices, since teachers do not need to develop daily plans themselves.Secondly, even before a teacher has a deep understanding of the methods or curriculum topics, thelesson plans prompt enactment, thus creating the possibility for learning by doing. In this way, theregular routines embedded in the lesson plans foster an iterative relationship between knowing and doingthrough which the teachers own instructional repertoire is expanded. Lesson plans also provide a wayto ensure that new reading materials are used and are integrated into a lesson in a coherent way. Lastly,lesson plans provide a focus for the entire intervention guiding not only the use of time and materials butproviding a point of focus for all training or coaching interactions. In these ways, lesson plans can beviewed as providing a set of mechanisms to encourage correct implementation of the curriculum and ofwhat is taught at training sessions.
A significant initial dose of training might be important if a thorough conceptual understanding ofnew topics and methods is necessary before effective implementation is possible. However, there maybe other practical and emotional constraints to introducing a new set of routines and activities into anexisting classroom space.
14These groups should ideally be sorted by ability: the teacher is expected assess reading ability by observing each studentas she reads a text.
15This is possibly because the curriculum has been revised several times in recent decades, but most teachers were notproperly trained to implement new methods and did not have all the necessary reading materials.
7

The coaching intervention, whilst not relying on deep knowledge before implementation, does pro-vide an additional set of mechanisms to ensure that new methods are being attempted (somebody isthere to observe thus playing a monitoring role), to facilitate an evaluation of how new practices arebeing implemented, and to encourage re-implementation in a better way through both guidance and evenmodelling best practice themselves.
3 Evaluation Design
3.1 Sampling and Random Assignment
The study is set in two districts in the North West Province, in which the main home language isSetswana. This province is relatively homogeneous linguistically and is one of the poorer provincesin South Africa. Our sample is restricted to non-fee public schools schools that use Setswana as themain language of instruction, and were identified as unlikely to practice multi-grade teaching.16 Werandomly drew a sample of 230 schools from this population and created 10 strata of 23 similar schoolsbased on school size, socio-economic status, and previous performance in the the national standardizedexam, called the Annual National Assessments (ANA). Within each stratum we then randomly assigned5 schools to each treatment group and 8 to the control group. All treatment schools with exception ofone in the Coaching arm agreed to participate in the program. We included this school in the sample oftreatment schools.17
We chose to exclude schools that practice multi-grade classes, since the interventions are grade-specific and unlikely to work in such settings, but we were unable to ex ante exclude all those schools:roughly 6 per cent of grade two teachers in each treatment arm reported teaching pupils from multiplegrades in the same classroom. For sake of transparency we report results on both the full sample and therestricted sample that excludes pupils who were taught in a multi-grade setting.
3.2 Data collection
We visited each school three times: once prior to the start of the interventions (February 2015), againafter the first year of implementation (November 2015), and finally at the end of the second year (Novem-ber 2016). During these school visits we administered four different survey instruments: A pupil test onreading proficiency and aptitude conducted on a random sample of 20 pupils who entered grade one atthe start of the study, a school principal questionnaire, a teacher questionnaire, and a parent/guardianquestionnaire. We assessed the same pupils in every round of data collection, but surveyed a differentset of teachers between midline and endline, because pupils generally have different teachers in different
16Approximately 65% of South African children attend non-fee schools. Schools serving communities with higher socio-economic status are allowed to charge fees, but receive a smaller government subsidy as a consequence.
17The full evaluation also consisted of a third treatment arm with a different focus on parental involvement (rather thanteacher training), the result of which we will discuss in a separate paper.
8
grades. Finally, we also conducted lesson observations on a stratified random sub-set of 60 teachers inSeptember 2016. The data-collection and data-capture organizations are independent from the imple-menting organization and research team, and were blind to the treatment assignment.
We registered a pre-analysis plan at the AEA RCT registry in October 2016, before we had access tothe endline data.
3.2.1 Pupil assessment
The pupil test was designed in the spirit of the Early Grade Reading Assessment (EGRA) and was ad-ministered orally by a fieldworker to one child at a time. The letter recognition fluency, word recognitionfluency and sentence reading components of the test were based on the Setswana EGRA instrument,which had already been developed and validated in South Africa. To this, we also added a phonologicalawareness component in every round of assessment. The baseline instrument did not include all the samesub-tasks as the midline/endline instruments, because of different levels of reading proficiency expectedover a two-year period. For baseline, we also included a picture comprehension (or expressive vocab-ulary) test since this was expected to be an easier pre-literacy skill testing vocabulary, and thus usefulfor avoiding a floor effect at the start of grade 1 when many children are not expected to read at all.Similarly, we included a digit span memory test.18 The logic of including this test of working memoryis that it is known to be a strong predictor of learning to read and would thus serve as a good baselinecontrol to improve statistical power. For the midline and endline, we added a writing and a paragraphreading sub-task. For endline, we further added a comprehension test.
Out of the 3, 539 pupils surveyed in baseline, we were able to re-survey 2, 951 in endline, yieldingan attrition rate of 16.6 per cent. The attriters had either moved school (90 per cent of attriters) orwere absent on the day of assessment (10 per cent of attriters). Moreover, an additional 13% of ouroriginal sample were repeating grade one. Figure B.2 shows the breakdown of attrition and repetitionby treatment arm. Column (1) in table A.1. regresses treatment assignments on attrition status, aftercontrolling for stratification. It shows there is no statistically significant difference in attrition ratesacross treatment arms. Columns (2) to (4) regress different student characteristics —student age, gender,and baseline reading proficiency— on treatment status, attrition, and an interaction between attritionand treatment status. Attriters in the control are slightly older and less likely to be female. However,the coefficients on the interaction terms show that there are no differences in the characteristics of theattriters across evaluation arms, with the exception that attriters in the Training arm are slightly morelikely to be female, relative to the control. We control for student gender in all our student-level analysis.
18This involved repeating by memory first two numbers, then three, and so forth up to six numbers, and the same 5 itemsfor sequences of words.
9

3.2.2 Survey data and document inspection
The teacher survey contained questions on basic demographics (education, gender, age, home language), teaching experience, curriculum knowledge, and teaching practice. For curriculum knowledge, we asked the frequencies with which the teacher performs the following activities: group-guided reading, spelling tests, phonics, shared reading, and creative writing. The prescribed frequency of performing these activ-ities is stipulated in the government curriculum and also reflected in the lesson plans. Performing these activities at the appropriate frequency is thus a measure of knowledge and mastery of the curriculum, as well as fidelity to the lesson plans. Note that even if there is risk of social desirability bias, these mea-sures still accurately capture knowledge of the appropriate routines, since some activities are supposed to take place infrequently.19.
The questions on teaching practice covered important pupil-teacher interactions that flow from group-guided reading: whether teachers ask pupils to read out loud, provide one-on-one assessment, and sort reading groups by ability.
Finally, the teacher survey also included a voluntary comprehension test, which was completed by 75, 89, and 98 per cent of teachers who completed the teacher survey at baseline, midline and endline respectively.
In the endline, we have teacher survey data for 275 teachers in 175 schools. As a result, for 81 percent of the 2, 951 pupils assessed at endline, we also have data on their teacher.20 In column (5) in Table A.1 we regress treatment assignment dummies on an indicator for whether a pupil’s teacher also completed the teacher survey. We see that teacher non-response was random across treatment arms.
We also conducted classroom and document inspection for the surveyed teachers. Fieldworkers counted the number of days that writing exercises were completed in the exercise book, and the number of pages completed in the government workbook.21 To minimize risk of bias due to strategic selection of exercise and workbooks, the teacher was asked to provide books of one of the most proficient pupils in his/her class. Furthermore, fieldworkers indicated if the teacher has a list for the reading groups—the names of the students as they are assigned to each reading group, and rated on a 4-point Likert scale the sufficiency and quality of the following print material: a reading corner (box library), graded reading booklets, Setswana posters, and flashcards.
The school principal survey includes basic demographic questions, questions on school policies, school location, school access to resources, and a rough estimate of parent characteristics: the language spoken most commonly in the community, and highest overall education of the majority of parents.
19With social desirability bias, we would expect teachers to say that they perform all activities more frequently20We cannot tell what proportion of teachers did not respond, because children are randomly drawn at a school level, so we
do not know how many teachers pupils with missing teacher data would have matched with.21To reduce data capture error, we asked the fieldworker to only count pages completed for three specific days. We chose
three days that should have been covered by teachers by the end of the year, regardless of their choice of sequencing.
10
3.2.3 Lesson observations
To gain a better understanding of how teaching practice changed in the classroom, we also conducteddetailed lesson observations in October 2016 in a stratified random subset of 60 schools— 20 schools pertreatment arm. We observed the lesson of one teacher per school. We stratified by school-average pupilreading proficiency in order to assure representation across the distribution of school performance. Wealso over-sampled urban schools, where the impacts of the programs were largest at midline.22 An experton early-grade reading developed the classroom observation instrument, in close consultation with ClassAct and the evaluation team.
The instrument covered teaching and classroom activities that we expect to be influenced by the pro-gram. For example, the fieldworkers were required to record the number of pupils who read or handlebooks; the number of pupils who practice the different types of reading activities (this includes activitiessuch as vocabulary development, phonics, word/letter recognition, reading sentences or extended texts);how reading is practiced in the classroom (e.g. read individually or in a group; read silently or aloud);and the frequency and types of writing activities taking place. The instrument also captured student-teacher interactions related to group-guided reading: whether reading groups are grouped by ability, howfrequently pupils receive individual feedback from the teacher, and how frequently pupils are individu-ally assessed. This final set of indicators mirror the questions that were asked in the teacher survey. Theinstrument was very detailed, but unlike some lesson observation instruments, did not require the field-workers to record time devoted to different activities. Rather, questions related to frequency of differentactivities were generally coded on a Likert scale.23
Since it was a detailed and comprehensive instrument, we decided to limit ourselves to six qualifiedfieldworkers, all of whom were proficient in Setswana and had at least a bachelors degree in education.To further assure consistency across fieldworkers, the project manager visited at least one school witheach of the fieldworkers at the start of the data collection, and data quality checks were conducted on alldata collected in the first two days.
After the completion of the lesson observations, the fieldworkers also asked some questions about thetype of teaching support they received the past year. These were open-ended questions, which allowedus to code whenever a teacher mentioned receiving training or coaching from Class Act, or is using theprogram’s graded reading booklets or lesson plans.
3.2.4 Administrative data
To add precision to our estimates, we further complemented these survey measures with 2011 censusdata and results from a standardized primary school exam conducted in 2014. From the 2011 census,
22In particular, we randomly drew schools from each treatment group in the following manner: (i) six urban schools; (ii)five schools in the top tercile and five schools in the bottom tercile in terms of average performance across both baseline andmidline; (iii) four schools in the top tercile in terms largest improvement between baseline and midline.
23For example, when coding frequency of different types of reading activities, the fieldworkers recorded: never, sometimes,mostly, and always.
11

we constructed a community wealth index derived from several questions about household possessions, and we also calculated the proportion of 13 to 18 year-olds in the community that are attending an educational institution.24 We also have data on each school’s quintile in terms of socio-economic status, as coded by government.
3.2.5 Aggregation of indicators
In order to minimize the risk of over-rejection of the null hypotheses due to multiple different indicators, we aggregated data in the following ways. First, for own main outcome measure of success —reading proficiency— we combined all the sub-tasks into one aggregate score using principal components. We did this separately for each round of assessment. For the midline and endline scores, we used the factor loading of the control group to construct the index. This score was then standardized into a z-score: subtracting the control group mean and dividing by the standard deviation in the control. The treatment impact on the aggregate score can thus be interpreted in terms of standard deviations.
Furthermore, we grouped the potential mediating factors of changed teaching practice and classroom environment into five broad categories that are theoretically distinct inputs into learning to read: (i) curriculum coverage; (ii) fidelity to routine specified in curriculum; (iii) teacher-pupil interactions related to group-guided reading; (iv) frequency of practicing different reading activities; and (v) pupils’ use of reading materials. For each category we created a mean index, using the method proposed by Kling et al.(2007), which is a average of the z-scores of all the constituent indicators.
3.3 Balance and descriptive statistics
Table 1 shows balance and basic descriptive statistics of our evaluation sample. Each row represents a separate regression of the baseline variable on treatment assignments and strata dummies, clustering standard errors at the school level. The first column indicates the mean in the control. Columns (2) and (4) indicate the coefficient on the treatment dummies. Column (6) reports the number of observations, and column (7) reports the p-value for the test of equality between Training and Coaching.
Our sample of schools come predominantly from poor communities: 46.3 per cent of schools are in bottom quintile in terms of socio-economic status, and 85 per cent are from rural areas. In only 44 per cent of schools do the majority of parents have a high school degree or higher. In almost all schools the main language spoken in the community is Setswana. A small fraction of classrooms ended up being multi-grade classrooms (6.2 percent of grade two classes). We were thus not perfectly able to identify and exclude ex ante all schools that do multi-grade teaching. The teachers are mostly female and are educated: 85 and 95 per cent of the grade one and two teachers respectively have a degree or diploma. Nonetheless, reading comprehension levels are low: The average score for the simple comprehension test is 66 per cent. The median number of grade 2 teachers per school is one ( 57 percent of schools);
24We acknowledge Stellenbosch University, and Asmus Zoch in particular, for constructing the dataset linking census data to schools data.
12

and one school has four teachers. We observe slight imbalance on baseline pupil reading proficiency andthe school community’s socio-economic status for the Training treatment arm. We control for all thesevariables in the main regression specification.
Panels (a) to (e) in Figure B.3 show the distribution of student scores by treatment status for eachsub-task administered at baseline. Panel (f) shows the aggregate score. There are clearly floor effectsfor many of the sub-tasks, although there is a better spread for the aggregate score. Floor effects forbaseline measures will not bias results, but could reduce statistical power. Panels (a) and (b) in FigureB.4 show distribution of the aggregate reading score at midline and endline. Our endline measure isnormally distributed and shows no existence of ceiling or floor effects.
3.3.1 Sub-sample where we conducted lesson observations.
Table A.2. compares the sample where we conducted the lesson observations with the full evaluationsample. In each column we regress another independent variable on a dummy variable indicating whetherthe pupil/school is in the sample where we conducted the lesson observation. In columns (1) to (4)the data is at the individual level; in column (5) the data is at the school level. In column (1) thedependent variable is midline reading proficiency, including the full set of controls used in the mainanalysis (equation 1, below). A significant coefficient could thus be interpreted as the ‘value-added’, overand above the average learning trajectory of a pupil. Columns (1) to (4) in table A.2. show that there is nostatistically significant difference between schools where we conducted the lesson observations and therest of our evaluation sample, both in terms of pupil reading proficiency evaluated at baseline, midlineand endline, and a value-added measure between baseline and endline. As expected given our samplingstrategy, a far higher proportion of schools where we conducted lesson observations are urban: 36.7 percent, compared to 20 per cent in our overall sample. Figure B.5 in the appendix further shows that thedistribution of baseline and endline pupil reading proficiency is very similar, when comparing the lessonobservation sample with the rest of the evaluation sample. When conducting the Kolmogorov-Smirnofequality of distribution test for the baseline and endline measures of reading proficiency, we cannot rejectthe null that the distributions are the same.
In addition, Table A.3 shows that the reduced sample where we conduct our lesson observations isbalanced between treatment groups.
3.4 Empirical Strategy
Our main estimating equation is:
yicsb1 = β0 + β1(Training)s + β2(Coaching)s +X ′isb0Γ + ρb + εicsb1, (1)
where yicsb1 is the endline (end of second year) aggregate score of reading proficiency for pupil iwho is taught by a teacher in class c, school s and strata b; (Training)s and (Coaching)s are the relevant
13
treatment dummies; ρb refers to strata fixed effects; Xicsb0 is a vector of baseline controls; and εicsb1 isthe error term clustered at the school level.
In order to increase statistical power, we control separately for each domain of reading proficiencycollected at baseline: vocabulary, letter recognition, working memory, phonological awareness, wordrecognition, words read, and sentence comprehension. To further increase statistical power and accountfor any incidental differences that may exist between treatment groups, we control for individual andcommunity-level characteristics which are highly correlated with yisb1 or were imbalanced at baseline.25
Where data is missing for some observations for the control variables, we imputed missing values andadded a dummy indicating missingness as a control.26
When we examine dynamic impacts, we reshape the data in a wide format and estimate:
(2)yicsbt = β0 + β1Pt + β2(Training)s + β3(Training× P )st+ β4(Coaching)s + β5(Coaching× P )st +X ′
isb0Γ + ρb + εicsbt,
where t ∈ (1, 2) indicates the round of data collection, and P is a dummy variable set to one forendline data. The estimated coefficients, β2 and β4 , now show the respective treatment impact at midline,and β3 and β5 show the improvements over time.
When investigating treatment impacts on teacher behavior, we estimate:
Mcs = α1 + β1(Training)s + β2(Coaching)s + ρb + εcsb1, (3)
where Mcs is the mediating variable of interest for a teacher in class c and school s. Standard errorsare clustered at the school level for teacher survey data.27 With classroom observation data we also in-clude fieldworker fixed effects and day fixed effects, to account for the fact that not all teaching activitiesobserved were supposed to take place at a daily basis, 28 Results are robust to the exclusion of fieldworkerand day fixed effects.
Finally, when testing heterogeneous treatment impacts, we estimate the following equation:
(4)yicsb1 = β0 + β1(Training)s + β2(Coaching)s + β3(Training× σ)ms
+ β4(Coaching× σ)m +X ′icsb0Γ + ρb + εicsb1,
where σm is the moderating variable of interest, which could either be at the individual or class level,m ∈ (c, i). The moderating variable is now also included in the vector of baseline controls. When the
25The additional controls include: pupil gender, pupils’ parents’ education, district dummy (schools were randomly spreadacross two districts), performance in the most recent standardized Annual National Assessments (ANA), a community-levelwealth index, and average secondary school attendance rate in the community surrounding the school.
26For categorical variables, we assigned missing values to zero; for continuous variables we assigned missing observationsto equal the sample mean.
27We only observed one teacher per school in the classroom observations, so there is no need to cluster our standard errorsat the school level. But we surveyed all the grade 2 teachers in each school, often more than one teacher per school.
28According to the lesson plans, creative writing is supposed to take place on Fridays, which provides fewer opportunitiesto practice reading.
14

moderating variable of interest is at a teacher/class level, we further re-weigh the observations so thateach teacher/class receives equal weight.29
4 Results
4.1 Quality of implementation
As a first step in our analysis, we examine the quality of implementation. Rows (1) to (4) in Table 2show results from the teacher questionnaire administered to all teachers in the evaluation sample. Rows(4) to (6) in Table 2 show results from the in-depth teacher survey conducted in a sub-set of 60 schools.
We see that that the program was well-implemented: 97 and 94 per cent of teachers in the Trainingand Coaching arms respectively state that they have received in-service training on teaching Setswana asa home language during that year. The support was also generally well-received: 45 and 66 per cent inthe Training and Coaching arms respectively state they received very good support in teaching Setswana,relative to 17 per cent in the Control.30 Teacher satisfaction also increased in the Coaching arm: teachersthat received Coaching are 28.4 percentage points more likely to strongly agree with the statement: “Ifeel supported and recognized for their work”. Moreover, results from the sample of teachers interviewedduring the lesson observations reveal that exposure to the program was high: 79% and 90% of the regulargrade 2 teachers in the Training and Coaching arms respectively state to use the program’s lesson plans;95 and 90 percent respectively claim to have received some training or support from Class Act; 95
percent in both treatment arms use the program’s graded reading booklets; and 84 percent of teachers inthe Coaching arm reported that they were visited by the program’s reading coach that year.31 The factthat compliance is not always 100% could be due to treated teachers transferring to another school, orassigned to another grade in the same school.32
It is also worth noting that the control teachers also received a high level of support from government.For example, over 79 per cent of teachers in the control received in-service training on teaching Setswanaas a home language the past year; and 96 per cent of teachers have at least some graded reading bookletsin the classroom. The results of this program should therefore be interpreted as impacts relative to thestatus quo of government involvement.
4.2 Impacts on learning
Next we turn to the mean impacts of the programs on student reading proficiency at endline. Table 3shows the regression results on different indicators of reading proficiency, estimated using equation (1).
29We have the same number of pupils per school, but due to random sampling of pupils, we do not have the same numberof pupils per teacher/class.
30Although interestingly teachers in the Coaching arm are more likely to state that they received too much support.31Four of the sampled teachers in the classroom observations were not the regular grade 2 teachers.32Although we believe the latter is unlikely, since teachers typically teacher the same class for the duration of the year.
15
As recommended by Athey & Imbens (2017), the p-values are constructed using randomization-basedinference.
We see from column (1) that Training and Coaching improved aggregate learning by 0.12 and 0.24
standard deviations respectively (p = 0.175 and p = 0.001). Column (2) shows that, for both treatmentarms, the impacts are larger when we exclude students in multi-grade classrooms”: 0.18 and 0.29 stan-dard deviations respectively (p = 0.041 and p < 0.001). The program was never expected to be effectivein such settings. Moreover, column (3) shows that the impacts are larger still when we exclude repeaters.These are students who had shorter exposure to the program, because they were not taught by the treatedteachers in the second year.
Columns (4) to (10) further unpacks the results, looking separately at each domain of reading pro-ficiency that constitutes the aggregate score. It is encouraging to note that Coaching had a statisticallysignificant impact on learning across all the domains of reading proficiency at endline. The impact ofTraining, in contrast, was more muted: we only see statistical significance for phonological awarenessand non-word decoding. The starkest difference between Training and Coaching is in comprehension(p = 0.086). This is arguably the most important indicator, since the ultimate goal of literacy is readingwith comprehension.
Since there was imbalance in baseline learning in the Training arm (students in the Training wereunder-performing relative to the control), as a robustness check we test if the impact of Training variesdramatically if we exclude the worst-performing students from the Training arm. Moving from column(1) to column (4) in Table A.4, we see that there is only a very small change in the magnitude of theimpact of Training as we consecutively trim a larger proportion of the sample in the Training arm: the5th, 10th, and 15th percentiles respectively in terms of baseline student performance. For comparison,columns (5) to (8) show the balance tests with the restricted sample: the difference between the Trainingand control is converging to zero as we restrict a larger proportion of the sample, and is no longerstatistically significant after trimming the 5th percentile. It therefore does not seem that imbalance isdriving the smaller impact of the Training arm.
4.3 Dynamic impacts
Table 4 reports results on dynamic impacts, estimated using equation 2. The estimated coefficients in thefirst and third rows indicate the treatment impacts at midline, whereas the coefficients in the second andfourth rows show the improvements from midline to endline. Table A.5 in the appendix reports the sameresults, but in terms of standard deviations.
We see that students in the Coaching and Training arms experienced different trends over the twoyears of the program. The impacts are very similar in magnitude at midline— 0.13 and 0.141 stan-dard deviations in the Training and Coaching treatment arms respectively (p = 0.107 and p = 0.081).However, over the course of the second year, students in the Coaching arm continued with their fasterpace of learning relative to the control (p = 0.131), whereas students in the Training arm stagnated or
16

even slightly reversed back to the control (p = 0.842). The difference in second-year treatment impactsbetween Training and Coaching is statistically significant (p = 0.096).
Moreover, columns (2) to (7) show that the dynamic impacts also vary by domain of reading profi-ciency. At midline, the largest impact for Coaching was phonological awareness (0.22 standard devia-tions, p = 0.003), and there were no statistically significant impacts on the number of letters and wordsread, nor paragraph reading. In the second year, the impacts on phonological awareness and writingactually decreased, but the impacts on reading of words, non-words and paragraphs accelerated in theCoaching arm. This is possibly because the teaching activities in grade 2 focused more on reading text,rather than recognition of sounds and letters.
4.4 Interpreting the magnitude of effect sizes
In order to interpret the magnitude of the effect sizes, we benchmark the results of this study both withthe effect sizes of other similar programs, and with the learning that took place in the control. A recentmeta-analysis of 44 evaluations of coaching programs in the United States found a pooled effect size of0.11 SD on academic achievement for large-scale effectiveness studies with 100 teachers or more (Kraftet al. 2018). Conn (2014) found that the average impact of pedagogical interventions in sub-SaharanAfrica was 0.228 standard deviations. A systematic review by McEwan (2015) found a mean effectof teacher professional development programs of 0.12 standard deviations. And a systematic reviewby Snilstveit et al. (2016) found that structured pedagogical programs have an average impact of 0.23
standard deviations on learning. Taken together, our estimated effect size of 0.232 standard deviationsfor Coaching is in line, and perhaps slightly larger than similar interventions implemented in developingcountries.
When we benchmark the treatment impacts with learning that took place in the control, we focuson the two domains of paragraph reading and comprehension. The coefficient on “Endline” in Table4 shows the growth that took place in the control over the second year of the evaluation. We estimatethat the second-year impact of Coaching is equivalent to 26 percent (4.34/16.62) of the improvementsin paragraph reading in the control. Moreover, since comprehension was not asked at midline, we canplace an upper bound on learning by assuming that everyone in the control would have scored zero forthe test at baseline. With this approach we estimate from Table 3 that Coaching is equivalent to at least24 percent (0.3/1.234) of the learning that took place over the two years in the control.
4.5 Cost-effectiveness analysis
Since we found that the more costly program is more effective, it is important to determine which inter-vention was relatively more cost-effective. For thus purpose we calculate the ratio of gains to costs fortwo different outcomes: aggregate reading proficiency and performance in the comprehension test.33 For
33We consider the latter indicator, because reading with comprehension is arguably the ultimate goal of literacy develop-ment. We divide the score by 4 so the outcome is the proportion of questions answered correctly.
17
cost estimates we use the program budget for the second year of implementation, since implementationwas likely more streamlined compared to the first year. We also exclude fixed costs of material devel-opment (lesson plans, training material, reading booklets), since its contribution to average per studentcost will be nominal if the program gets scaled up.34 Based on these estimates, the per student cost ofthe Training and Coaching programs are 31 USD and 43 USD per year respectively.35 Table A.6. in theAppendix provides a breakdown of costs by category. The big cost driver for Training is the cost of thevenue and paying for teachers’ transport, food and accommodation. This cost is almost as high as theoverall annual salary cost for the three coaches. The training also had many facilitators, with a teacherto facilitator ratio of roughly 7 : 1.36
Given these estimates we conclude that Coaching is more cost-effective: it improves reading profi-ciency by 0.57 standard deviations per 100 USD spent per student per year, compared to 0.39 increase inthe case of Training. Coaching is substantially more cost-effectiveness at improving reading comprehen-sion, with a 17 percentage point improvement in the comprehension test per 100 USD spent per studentper year, compared to a 6 percentage points in the Training arm.
It is perhaps surprising that Coaching is not more expensive relative to Training. Clearly there couldbe ways to reduce the cost of Training (for example, having a series of smaller workshops in a clusterof nearby schools, or reducing the number of facilitators, or reducing the number of training sessions, ornot inviting the head teachers), but we do not know if the impacts would remain the same. Moreover,given the large differences in effect sizes, the cost of Training would need to be dramatically reducedbefore Training becomes more cost-effective.
4.6 Changing teaching practice
In this section we investigate underlying mechanisms by measuring how the learning environment, teach-ing practice, and classroom activities changed as a result of the program. For this purpose we draw fromthree different data-sources: the teacher survey and document inspection administered for the full evalu-ation sample of teachers, and lesson observations conducted in a stratified random sub-set of 60 schools.As discussed in section 3, we group the potential mediating factors into five broad categories: (i) curricu-lum coverage; (ii) adherence to the teaching routine as prescribed in the curriculum; (iii) teacher-pupilinteractions related to group-guided reading; (iv) frequency of practicing reading; and (v) pupils’ use of
34A further challenge in allocating costs is that one organization jointly implemented both interventions, so some costs(such as program management, administration, and quality assurance) were shared across the programs. We asked Class Actto provide their best estimate of how time was allocated across the different interventions, and we allocated costs accordingly.
35The cost of implementing the program in 50 schools are 114, 210 USD and 160, 221 USD in the Training and Coachingarms respectively. Given an average size of 74.6 of students per school at the start of the program, this surmounts to per-student costs of 31 USD and 43 USD respectively. If we exclude overhead costs for Coaching and only consider the keyvariable costs— materials, salary and transport— then the per-pupil cost is 29 USD
36Note that the salary costs in the Training arm does not include the time that the coaches dedicates to training. The overalltraining salary costs would therefore be higher if the programs were implemented separately.
18
reading material. The regression results, estimated using equation 3, are reported in Tables 6 to 8.37
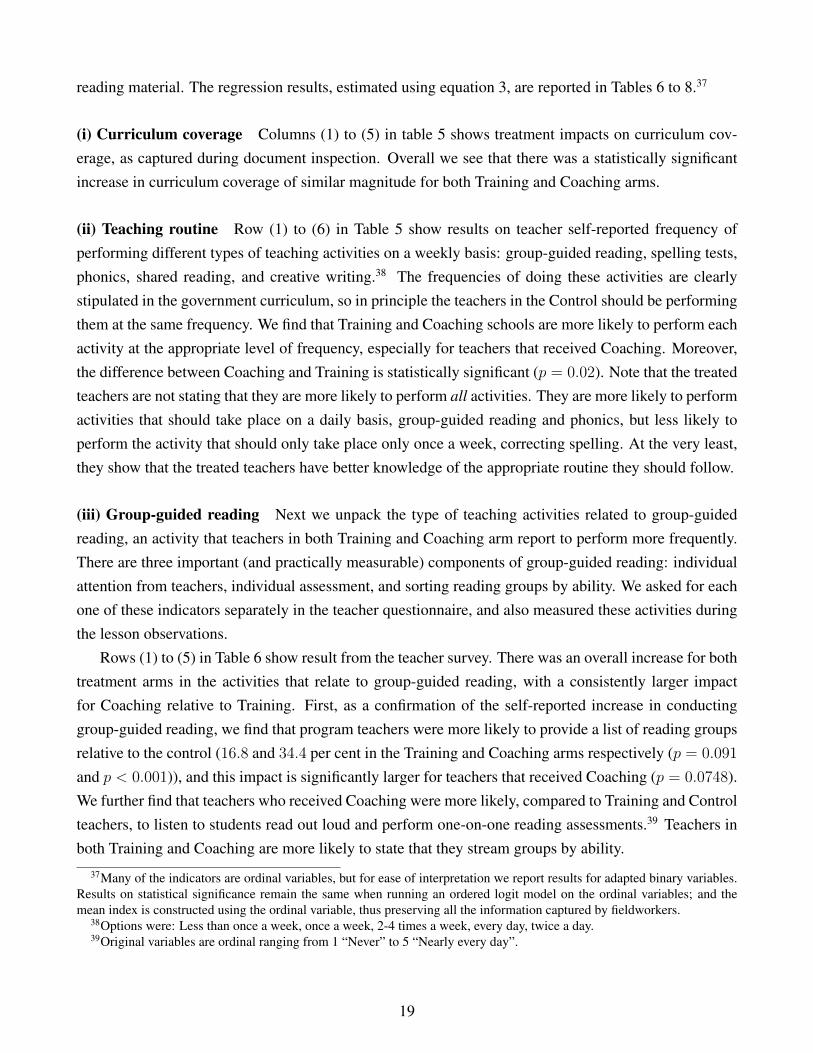
(i) Curriculum coverage Columns (1) to (5) in table 5 shows treatment impacts on curriculum cov-erage, as captured during document inspection. Overall we see that there was a statistically significantincrease in curriculum coverage of similar magnitude for both Training and Coaching arms.
(ii) Teaching routine Row (1) to (6) in Table 5 show results on teacher self-reported frequency ofperforming different types of teaching activities on a weekly basis: group-guided reading, spelling tests,phonics, shared reading, and creative writing.38 The frequencies of doing these activities are clearlystipulated in the government curriculum, so in principle the teachers in the Control should be performingthem at the same frequency. We find that Training and Coaching schools are more likely to perform eachactivity at the appropriate level of frequency, especially for teachers that received Coaching. Moreover,the difference between Coaching and Training is statistically significant (p = 0.02). Note that the treatedteachers are not stating that they are more likely to perform all activities. They are more likely to performactivities that should take place on a daily basis, group-guided reading and phonics, but less likely toperform the activity that should only take place only once a week, correcting spelling. At the very least,they show that the treated teachers have better knowledge of the appropriate routine they should follow.
(iii) Group-guided reading Next we unpack the type of teaching activities related to group-guidedreading, an activity that teachers in both Training and Coaching arm report to perform more frequently.There are three important (and practically measurable) components of group-guided reading: individualattention from teachers, individual assessment, and sorting reading groups by ability. We asked for eachone of these indicators separately in the teacher questionnaire, and also measured these activities duringthe lesson observations.
Rows (1) to (5) in Table 6 show result from the teacher survey. There was an overall increase for bothtreatment arms in the activities that relate to group-guided reading, with a consistently larger impactfor Coaching relative to Training. First, as a confirmation of the self-reported increase in conductinggroup-guided reading, we find that program teachers were more likely to provide a list of reading groupsrelative to the control (16.8 and 34.4 per cent in the Training and Coaching arms respectively (p = 0.091
and p < 0.001)), and this impact is significantly larger for teachers that received Coaching (p = 0.0748).We further find that teachers who received Coaching were more likely, compared to Training and Controlteachers, to listen to students read out loud and perform one-on-one reading assessments.39 Teachers inboth Training and Coaching are more likely to state that they stream groups by ability.
37Many of the indicators are ordinal variables, but for ease of interpretation we report results for adapted binary variables.Results on statistical significance remain the same when running an ordered logit model on the ordinal variables; and themean index is constructed using the ordinal variable, thus preserving all the information captured by fieldworkers.
38Options were: Less than once a week, once a week, 2-4 times a week, every day, twice a day.39Original variables are ordinal ranging from 1 “Never” to 5 “Nearly every day”.
19

The results from the teacher survey provide evidence that group-guided reading was far more likely totake place in both treatment arms, with the largest increase observed for teachers who received Coaching.However, these results are all self-reported. To test if these practices actually changed in the classroom,we next turn to results from the lesson observations.
Rows (6) to (11) in Table 6 show that the results from the teacher survey on group-guided readingare broadly supported by the lesson observations: there is a large increase in the mean index of 0.58 and0.635 standard deviations in the Training and Coaching groups respectively (p = 0.031 and p = 0.009).When examining the different components of group-guided reading, we see that there is a large increasein the Coaching arm in the probability that students read aloud in groups (37.8 percentage point increase,p = 0.022), and that the students read individually to the teacher (39.7 percentage point increase, p =
0.059).40 The impact for these two indicators is smaller for the Training arm, and not always statisticallysignificant. However, we do not find strong evidence for any improvement in the probability of providingindividual assessment and grouping by ability.41
Note that not all types of reading activities are more likely to take place. For sake of comparison,rows (12) to (14) show that teachers are no more likely to perform whole-class reading, where the wholeclass reads aloud with the teacher. Teachers are also no more/less likely to read aloud with the studentsfollowing silently. Whole-class reading is an easy activity to perform in the classroom, and almost allteachers in the control are already doing it.
(iv) Practicing reading and phonics Results from rows (1) to (10) in table 7 show that students areno more likely to practice reading in the classroom because of the programs, nor is there any evidencethat teachers are more likely to teach phonics.42 Although the mean index for reading frequency is notsignificant, we see in columns (8) and (9) that students in both the Training and Coaching arms are morelikely to read extended texts (3-5 sentences).
(v) Student use of reading material Rows (11) to (13) in Table 7 report results on use of books andreading material. We see a substantial increase in use of reading material, especially in the number ofchildren who have opportunities to read. The average number of students who read the booklets increasedby 1.6 and 4.6 in the Training and Coaching arms respectively (p = 0.057 and p = 0.002). The differencebetween Training and Coaching is large and statistically significant at the 1 percent level, this despite thefact that teachers in both treatment arms received the same number and type of reading booklets. Note
40These indicators were first recorded as ordinal variables ranked from 1 to 4. For ease of interpretation we created a binaryindicator for these two indicators, indicating if any activity took place.
41There is a small increase in the probability of providing individual assessment, which is statistically significant only inthe Training arm.
42The fieldworkers were asked to record how many students in the classroom are involved with reading letters, words,sentences, or extended texts. The answers were recorded as 5-point Likert scale, ranging from none to all the students. Theyalso recorded the extent to which teacher covers phonics on a 4-point Likert scale. As before we construct binary variablesfor ease of interpretation (equal to one, if at least some students are reading; and equal to one if the teacher teaches phonicsat least some of the time).
20
that the graded reading booklets are meant to be used during group-guided reading.
To summarize, for both treatments we find improvements in curriculum coverage and teaching prac-tice. Moreover, Coaching had a larger impact relative to Training in activities related to group-guidedreading: more students received individual attention from a teacher and opportunities to practice readingaloud; and more students were reading the graded reading booklets. This result is consistent with theobservation that students in the Coaching arm progressed at a faster pace in “higher-order” domains ofreading proficiency, such as paragraph reading and reading comprehension, relative to students whoseteachers receiving Training.43 But can these improvements in teaching practice be uniquely attributed tothe learning gains? We turn to this question below.
4.7 Mediation analysis
What proportion of the treatment-induced learning gains can be explained by improvements in teachingpractice? To answer this question, we conduct mediation analysis, employing both the linear structuralequation model (see, for example Imai et al. (2010)) and the sequential g estimation as proposed byAcharya et al. (2016). Both approaches make strong identifying assumptions, so these results should bemerely treated as suggestive. Section A in the appendix describes the methods in more detail.
Panel A in Table 8 report regression outputs for the linear structural equation model. Column (1)shows the regression results from equation 1, restricted to pupils for whom we also have teacher data.The regressions in rows (2) to (18) successively include a different mediating variable as one of theindependent variables. We consider all the intermediate outcomes collected from the teacher surveyand document inspection. We do not report any results for data collected during lesson observations,because limited sample size means that we do not have sufficient statistical power to draw any definitiveconclusions.44 The row headings indicate the mediator of interest.
Two trends are worth highlighting. First, we see from column (1) in rows (14) to (18) that there is astatistically significant positive relationship between learning and almost all variables related to group-guided reading, even after controlling for treatment assignment. For example, row (15) shows that pupilstaught by a teacher who could produce a list of reading groups scored on average 0.159 standard devia-tions higher, compared to pupils taught by teachers who could not produce a reading list. These resultssuggest that at least part of the treatment impacts are driven by an increase in the probability that teachersenact group-guided reading in the classroom. In contrast, there is no positive relationship between cur-riculum coverage and learning. The positive relationship between routine and learning is driven, in part,by increased propensity to conduct group-guided reading. Second, by comparing the regression results
43In contrast, the programs had a similar impact on phonological awareness. Phonics is typically taught using “wholeclass” teaching activities, which is easy to do and already widely implemented.
44After matching lesson observation with students learning data, we are left with a sample of 53 teachers, compared to 275teachers from the survey data.
21
in row (1) with the subsequent regressions, we see that the treatment impact of Coaching is reduced by 25
percent (from 0.281 to 0.212), after accounting for the contribution of group-guided reading to learning.Panel B, row (19), reports regression outputs for the final step of the sequential g estimation. This
approach is considered an improvement to Imai et al. (2010), since it allows one to control for additionalpost-treatment confounders.45 For possible confounders, we include the mean indices for curriculumcoverage and routine, and also an index of the print richness in the classroom. The coefficient estimatescan be interpreted as what the treatment impacts would have been, if it had no impact on group-guidedreading. The reduction in treatment impacts from row (1) to row (19) thus captures the indirect effect:the share of the treatment impact which is explained by treatment-induced changes in the mediator. Withthis approach as much as 68 percent of the treatment impact of Coaching is mediated by changes ingroup-guided reading.
We therefore have suggestive evidence that improvements in group-guided reading is at least partlyresponsible for the gains in reading proficiency of the Coaching arm.
4.8 Heterogeneous treatment impacts
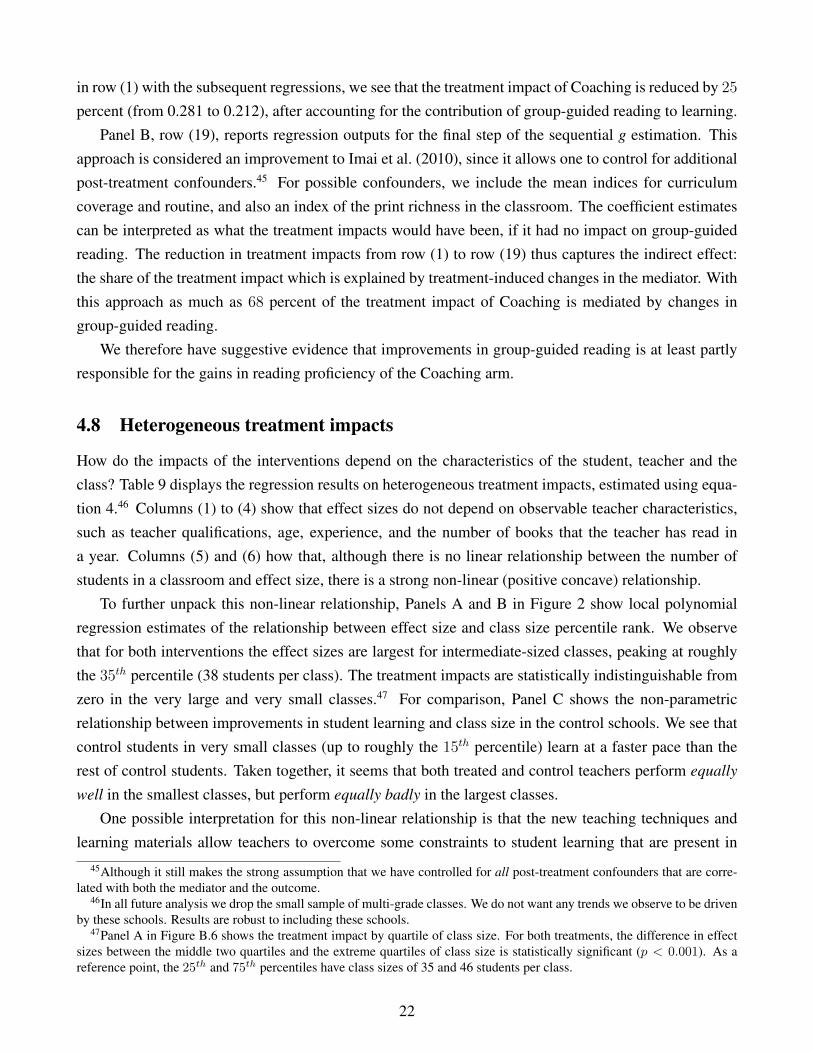
How do the impacts of the interventions depend on the characteristics of the student, teacher and theclass? Table 9 displays the regression results on heterogeneous treatment impacts, estimated using equa-tion 4.46 Columns (1) to (4) show that effect sizes do not depend on observable teacher characteristics,such as teacher qualifications, age, experience, and the number of books that the teacher has read ina year. Columns (5) and (6) how that, although there is no linear relationship between the number ofstudents in a classroom and effect size, there is a strong non-linear (positive concave) relationship.
To further unpack this non-linear relationship, Panels A and B in Figure 2 show local polynomialregression estimates of the relationship between effect size and class size percentile rank. We observethat for both interventions the effect sizes are largest for intermediate-sized classes, peaking at roughlythe 35th percentile (38 students per class). The treatment impacts are statistically indistinguishable fromzero in the very large and very small classes.47 For comparison, Panel C shows the non-parametricrelationship between improvements in student learning and class size in the control schools. We see thatcontrol students in very small classes (up to roughly the 15th percentile) learn at a faster pace than therest of control students. Taken together, it seems that both treated and control teachers perform equally
well in the smallest classes, but perform equally badly in the largest classes.One possible interpretation for this non-linear relationship is that the new teaching techniques and
learning materials allow teachers to overcome some constraints to student learning that are present in
45Although it still makes the strong assumption that we have controlled for all post-treatment confounders that are corre-lated with both the mediator and the outcome.
46In all future analysis we drop the small sample of multi-grade classes. We do not want any trends we observe to be drivenby these schools. Results are robust to including these schools.
47Panel A in Figure B.6 shows the treatment impact by quartile of class size. For both treatments, the difference in effectsizes between the middle two quartiles and the extreme quartiles of class size is statistically significant (p < 0.001). As areference point, the 25th and 75th percentiles have class sizes of 35 and 46 students per class.
22
larger classes, but teachers are either unable to implement these techniques in the largest classes, or thesetechniques are less effective in the largest classes. For example, since control teachers mostly perform“whole class” teaching (the whole class reads aloud with the teacher), it is plausible that students inlarger classes are less likely to receive individual feedback from a teacher and have fewer opportunitiesto practice reading, compared to smaller classes. In contrast, group-guided reading activities can providestudents with these opportunities. However, teachers might find it impossible to implement group-guidedreading in extremely large classes;48 or, group-guided reading becomes less effective on average since alower proportion of students get opportunities to read in front of the teacher on any given day.
Turning to student-level interactions, Panels A and B in Figure 3 show local polynomial regressionestimates of the relationship between effect size and a student’s percentile rank in terms of baselineacademic performance. We see that in the Coaching arm students who performed worse at baselinebenefit least from the program. In fact, Panel B in Figure B.6 in the appendix shows that there is nostatistically significant impact for the bottom fifth of students. Panels A and B in Figure 4 shows that theimpact does not vary by a student’s relative rank within her class. This suggests that the pupil’s absolutelevel of reading proficiency is the constraint to learning, rather than her relative position in the class.
There can be many possible explanations for this trend, none of which we can conclusively rule out.It could be because the worst-performing students do not have a strong enough foundation to benefitfrom the new teaching techniques. The teachers might be covering curriculum at too fast a pace, orapplying curriculum that is too ambitious to start off with. Or it might be that these students lack othercomplementary inputs to reading acquisition, such as literate and involved parents; or because weakerstudents are more likely to be in worse-quality schools that are less responsive to the treatments.
5 Conclusion
We report the results of a randomized evaluation of two different approaches to improving the instruc-tional practices of early-grade reading teachers in public primary schools in South Africa. The firstapproach (Training) follows the traditional model of a once-off training conducted at a central venue.In the other approach (Coaching), teachers are visited on a monthly basis by a specialist reading coachwho monitors teaching, provides feedback, and demonstrates correct teaching practices. We find thatCoaching had a large and statistically significant impact on student reading proficiency, more than twicethe size of the Training arm. Coaching was also more cost-effective.
Detailed classroom observations and document inspection gives insight into which teaching practiceschanged. We find that teachers in both treatments are more likely to practice a difficult teaching tech-nique called group-guided reading: students are more likely to read aloud in smaller groups, and receiveindividual attention from their teacher when they are reading. In contrast, teachers in the control mosttypically conduct “whole-class” teaching, where the whole class reads aloud with the teacher. Students
48Teachers complained during the exit surveys that group-guided reading is too difficult to implement in large classes.
23
are also more likely to handle books and read the graded reading booklets— an activity that is supposedto take place during group-guided reading. This impact is larger for teachers that received Coaching,compared to Training. Furthermore, mediation analysis shows that improvements in group-guided read-ing explain a large proportion of learning gains in the Coaching arm.
These results suggest that coaches play an important role in the adoption of more technically chal-lenging teaching techniques. Group-guided reading is particularly difficult to implement: teachers needto re-organize the classroom and keep the rest of the classroom busy as they provide targeted feedback tothe smaller reading group. Indeed, during the exit surveys, teachers complained that group-guided read-ing is difficult, especially in larger classes, and that the training was too short for them to fully understandgroup-guided reading.
Our finding on the use of reading material also reveal important complementarities in the educationproduction function between access to resources, teaching practice, and use of resources. The purposeof the graded readers is to provide opportunities to practice reading. Pupils are provided this opportunityduring group-guided reading, an activity that teachers find challenging to implement. These resourcestherefore cannot be used without appropriate enactment of a new teaching method. Coaching thus en-abled teachers to use more effectively the resources that are available to them.
It is important to note that both programs are bundled interventions, so we cannot attribute the learn-ing gains exclusively to the coaching/training component. For example, the lesson plans might have hadthe same impact in the Training arm even in absence of training, and the Training/Coaching arms mighthave had no impact if not combined with learning aids and lesson plans. This is an inevitable limitationto evaluating bundled interventions. But this is also a strength of the program, since it was designed withthe premise that the different components complement each other.
How generalizable are these results to other contexts? Seen in the context of other evaluations ofsimilar programs, we feel it is likely that these results are generalizable, at least for improving early-gradereading within sub-Saharan Africa. Other studies in sub-Saharan Africa have found that the combinationof reading coaches and supporting learning material can improve students’ proficiency in early-gradereading (Piper et al. 2014, 2018, Lucas et al. 2014, Kerwin et al. 2017). Moreover, a previous quasi-experimental evaluation of a very similar coaching program in a different province in South Africa alsofound positive impacts on learning (Fleisch et al. 2016), even though the context was very different:schools in this study are predominantly urban and multilingual. However, we clearly cannot concludethat this type of intervention will have similar impacts when targeted at different grade levels or subjectsareas.
Looking forward, a key question is if and how the Coaching program can be scaled up. Capacity andresource constraints makes us hesitant to conclude that government should scale the program as currentlydesigned. The per-pupil cost of Coaching is a small fraction of government’s overall education budget(roughly 8.6 percent), but is a large fraction of government’s discretionary budget.49 Government could
4980-90 percent of the budget is earmarked to teacher salaries
24

rely on existing staff, such as the district-appointed subject advisors, to do the coaching. But is unclearif they will have the right capacity and set of incentives to provide the appropriate support. This programrelied on only three coaches, and it was implemented by a non-governmental organization with strongincentives to demonstrate positive impact. We do not know if coaches will have the same impact if theyare less-qualified, or visit less often, or connect remotely rather than in person.
Nonetheless, the quasi-experimental evidence from Fleisch et al. (2016) provides encouraging evi-dence that this could be a scalable model, since the program was implemented in over 1, 000 schools.Moreover, the fact that teacher behavior changed in the Training arm, without any visits by a readingcoach, suggests the possibility of positive impact, even with less-qualified coaches. And scaling does notmean it needs to be implemented in all schools at the same time: it could be staggered implementation,where the same group of reading coaches visit a different cluster of schools every couple of years.
In sum, we believe the program has potential to be implemented at a larger scale, but there are manyunanswered questions: Does the coaching model rely on highly-qualified coaches, or could the mere actof monitoring teaching encourage practice and thus facilitate the adoption of new teaching techniques?Can virtual coaching have the same impact as in-person coaching? Can a year of coaching lead to asustained change in teaching practice? These questions will be a focus of future research.
25

6 Tables and Figures
26

(1) (2) (3) (4) (5) (6) (7)
Control Training = Coaching
Mean Coef. Std error Coef. Std error Obs P-value
Pupil Characteristics
Age 6.481 0.078 (0.0520) -0.0244 (0.0524) 3,523 0.0669
Female 0.479 -0.016 (0.0220) -0.0120 (0.0207) 3,518 0.884
Reading proficiency 0.0380 -0.209* (0.118) 0.0666 (0.146) 3,539 0.0658
Grd 2 Teacher Characteristics
Diploma or degree 0.947 0.013 (0.0312) 0.0413 (0.0253) 271 0.262
Age 48.92 -1.566 (1.365) -0.287 (1.217) 273 0.311
Female 1 -0.0138 (0.0134) 0.00001 (0.00234) 271 0.305
Experience 19.43 -1.147 (1.614) -0.318 (1.498) 271 0.597
Books read 3.109 -0.0307 (0.553) 0.551 (0.793) 260 0.482
Class size 42.17 -1.993 (1.464) -3.174** (1.589) 271 0.420
Multi-grade 0.0619 0.00698 (0.0333) 0.00253 (0.0293) 271 0.905
Comprehension test 0.663 -0.0425 (0.0304) -0.00419 (0.0326) 269 0.237
School characteristics
Setswana most common 1 -0.0418 (0.0284) -0.0216 (0.0213) 167 0.559
Most parents - highschool 0.443 -0.106 (0.0871) 0.0341 (0.0823) 179 0.129
Rural 0.850 -0.0700 (0.0679) -0.110 (0.0691) 180 0.623
Bottom quintile (SES) 0.463 0.0975* (0.0520) -0.0425 (0.0392) 180 0.007
Pass rate (ANA) 55.35 -1.184 (0.894) -0.981 (0.917) 180 0.845
Wealth index -3.077 -0.522 (0.497) -0.616 (0.496) 180 0.853
Kenneth district 0.212 -0.0125 (0.0705) 0.0875 (0.0771) 180 0.223
Training Coaching
Table 1. Descriptive and balance statistics
Notes: Each row indicates a separate regression on treatment dummies controlling for strata indicators. Column one shows the
control mean, columns (2) and (4) the coefficient on the two treatment dummies. Standard errors are indicated in columns (3) and
(5) and are clustered at the school level. *** p<0.01, ** p<0.05, * p<0.1
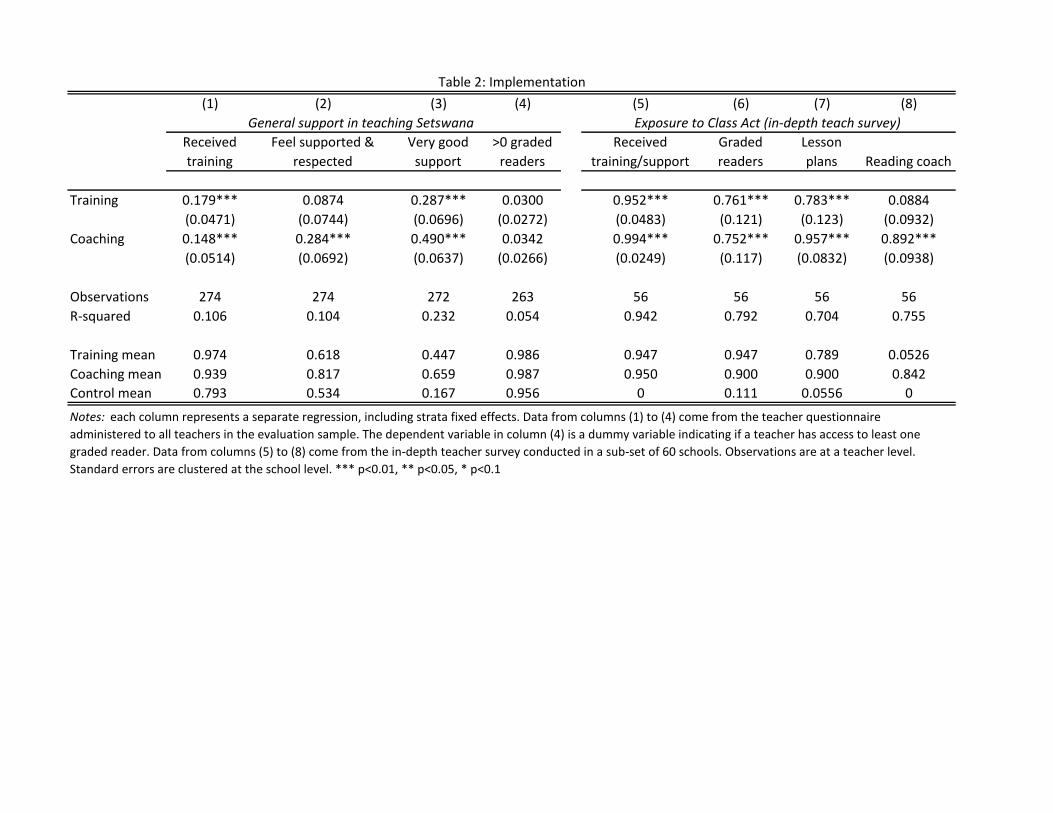
(1) (2) (3) (4) (5) (6) (7) (8)
Received
training
Feel supported &
respected
Very good
support
>0 graded
readers
Received
training/support
Graded
readers
Lesson
plans Reading coach
Training 0.179*** 0.0874 0.287*** 0.0300 0.952*** 0.761*** 0.783*** 0.0884
(0.0471) (0.0744) (0.0696) (0.0272) (0.0483) (0.121) (0.123) (0.0932)
Coaching 0.148*** 0.284*** 0.490*** 0.0342 0.994*** 0.752*** 0.957*** 0.892***
(0.0514) (0.0692) (0.0637) (0.0266) (0.0249) (0.117) (0.0832) (0.0938)
Observations 274 274 272 263 56 56 56 56
R-squared 0.106 0.104 0.232 0.054 0.942 0.792 0.704 0.755
Training mean 0.974 0.618 0.447 0.986 0.947 0.947 0.789 0.0526
Coaching mean 0.939 0.817 0.659 0.987 0.950 0.900 0.900 0.842
Control mean 0.793 0.534 0.167 0.956 0 0.111 0.0556 0
General support in teaching Setswana Exposure to Class Act (in-depth teach survey)
Table 2: Implementation
Notes: each column represents a separate regression, including strata fixed effects. Data from columns (1) to (4) come from the teacher questionnaire
administered to all teachers in the evaluation sample. The dependent variable in column (4) is a dummy variable indicating if a teacher has access to least one
graded reader. Data from columns (5) to (8) come from the in-depth teacher survey conducted in a sub-set of 60 schools. Observations are at a teacher level.
Standard errors are clustered at the school level. *** p<0.01, ** p<0.05, * p<0.1
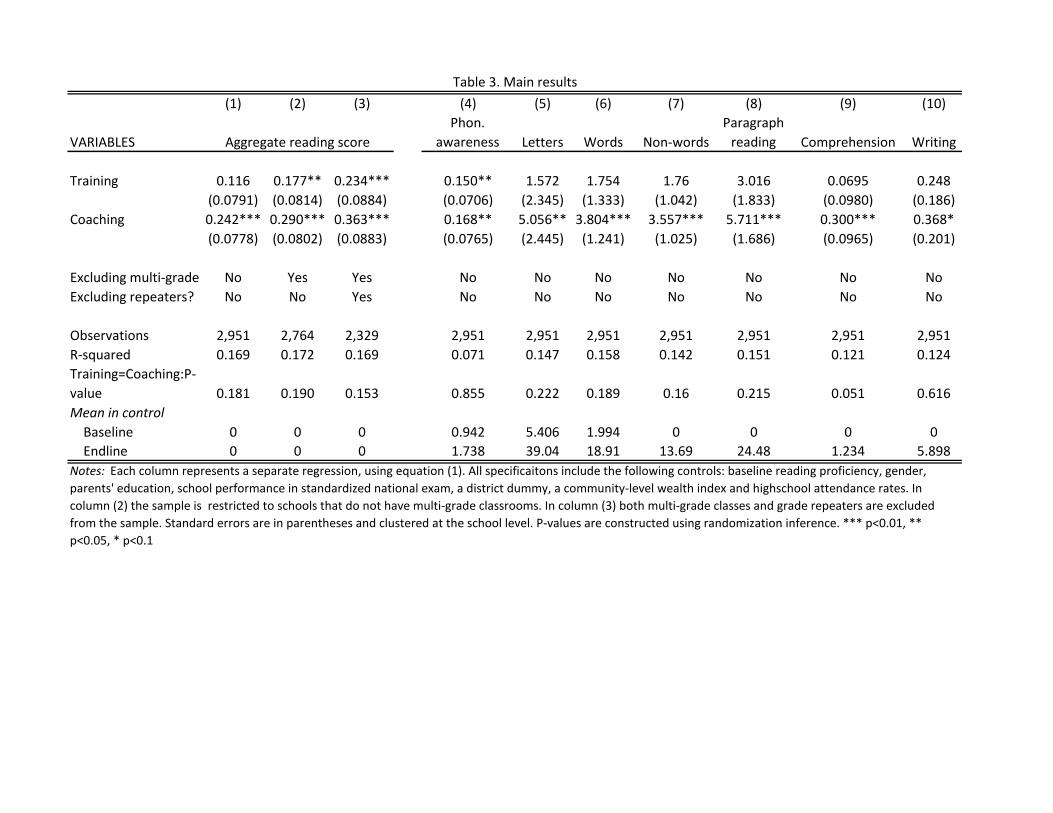
(1) (2) (3) (4) (5) (6) (7) (8) (9) (10)
VARIABLES
Phon.
awareness Letters Words Non-words
Paragraph
reading Comprehension Writing
Training 0.116 0.177** 0.234*** 0.150** 1.572 1.754 1.76 3.016 0.0695 0.248
(0.0791) (0.0814) (0.0884) (0.0706) (2.345) (1.333) (1.042) (1.833) (0.0980) (0.186)
Coaching 0.242*** 0.290*** 0.363*** 0.168** 5.056** 3.804*** 3.557*** 5.711*** 0.300*** 0.368*
(0.0778) (0.0802) (0.0883) (0.0765) (2.445) (1.241) (1.025) (1.686) (0.0965) (0.201)
Excluding multi-grade? No Yes Yes No No No No No No No
Excluding repeaters? No No Yes No No No No No No No
Observations 2,951 2,764 2,329 2,951 2,951 2,951 2,951 2,951 2,951 2,951
R-squared 0.169 0.172 0.169 0.071 0.147 0.158 0.142 0.151 0.121 0.124
Training=Coaching:P-
value 0.181 0.190 0.153 0.855 0.222 0.189 0.16 0.215 0.051 0.616
Mean in control
Baseline 0 0 0 0.942 5.406 1.994 0 0 0 0
Endline 0 0 0 1.738 39.04 18.91 13.69 24.48 1.234 5.898
Table 3. Main results
Notes: Each column represents a separate regression, using equation (1). All specificaitons include the following controls: baseline reading proficiency, gender,
parents' education, school performance in standardized national exam, a district dummy, a community-level wealth index and highschool attendance rates. In
column (2) the sample is restricted to schools that do not have multi-grade classrooms. In column (3) both multi-grade classes and grade repeaters are excluded
from the sample. Standard errors are in parentheses and clustered at the school level. P-values are constructed using randomization inference. *** p<0.01, **
p<0.05, * p<0.1
Aggregate reading score
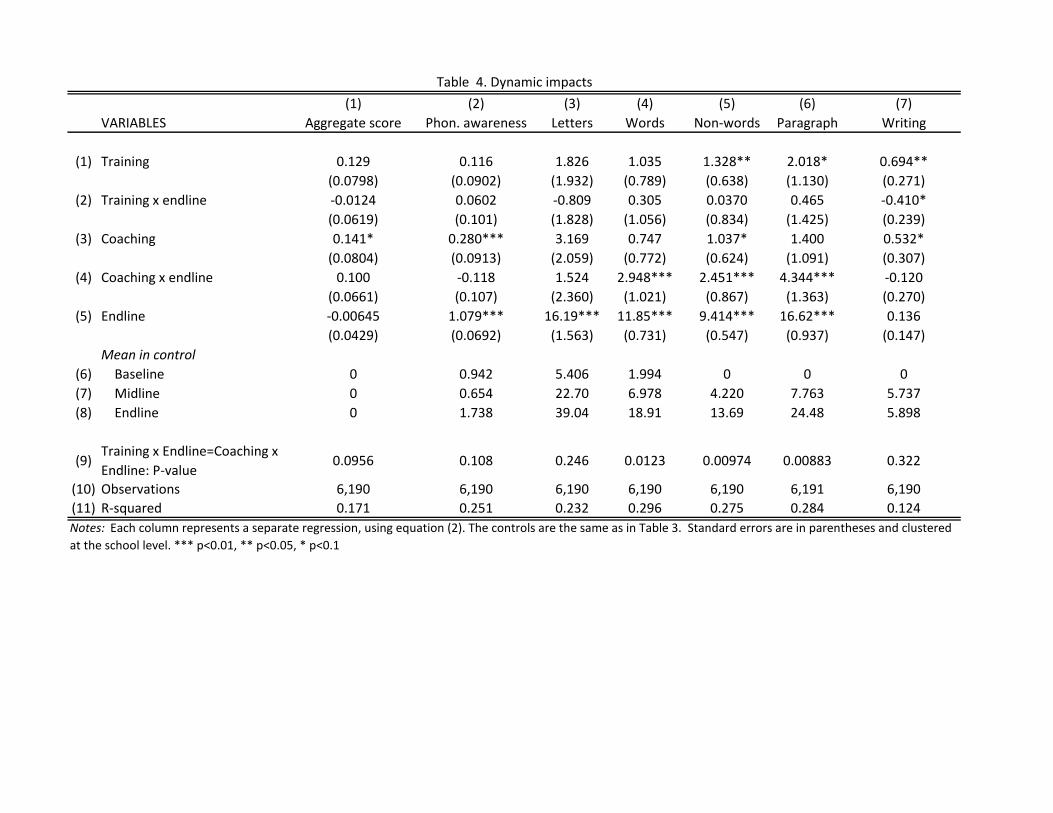
(1) (2) (3) (4) (5) (6) (7)
VARIABLES Aggregate score Phon. awareness Letters Words Non-words Paragraph Writing
(1) Training 0.129 0.116 1.826 1.035 1.328** 2.018* 0.694**
(0.0798) (0.0902) (1.932) (0.789) (0.638) (1.130) (0.271)
(2) Training x endline -0.0124 0.0602 -0.809 0.305 0.0370 0.465 -0.410*
(0.0619) (0.101) (1.828) (1.056) (0.834) (1.425) (0.239)
(3) Coaching 0.141* 0.280*** 3.169 0.747 1.037* 1.400 0.532*
(0.0804) (0.0913) (2.059) (0.772) (0.624) (1.091) (0.307)
(4) Coaching x endline 0.100 -0.118 1.524 2.948*** 2.451*** 4.344*** -0.120
(0.0661) (0.107) (2.360) (1.021) (0.867) (1.363) (0.270)
(5) Endline -0.00645 1.079*** 16.19*** 11.85*** 9.414*** 16.62*** 0.136
(0.0429) (0.0692) (1.563) (0.731) (0.547) (0.937) (0.147)
Mean in control
(6) Baseline 0 0.942 5.406 1.994 0 0 0
(7) Midline 0 0.654 22.70 6.978 4.220 7.763 5.737
(8) Endline 0 1.738 39.04 18.91 13.69 24.48 5.898
(9)Training x Endline=Coaching x
Endline: P-value0.0956 0.108 0.246 0.0123 0.00974 0.00883 0.322
(10) Observations 6,190 6,190 6,190 6,190 6,190 6,191 6,190
(11) R-squared 0.171 0.251 0.232 0.296 0.275 0.284 0.124
Table 4. Dynamic impacts
Notes: Each column represents a separate regression, using equation (2). The controls are the same as in Table 3. Standard errors are in parentheses and clustered
at the school level. *** p<0.01, ** p<0.05, * p<0.1
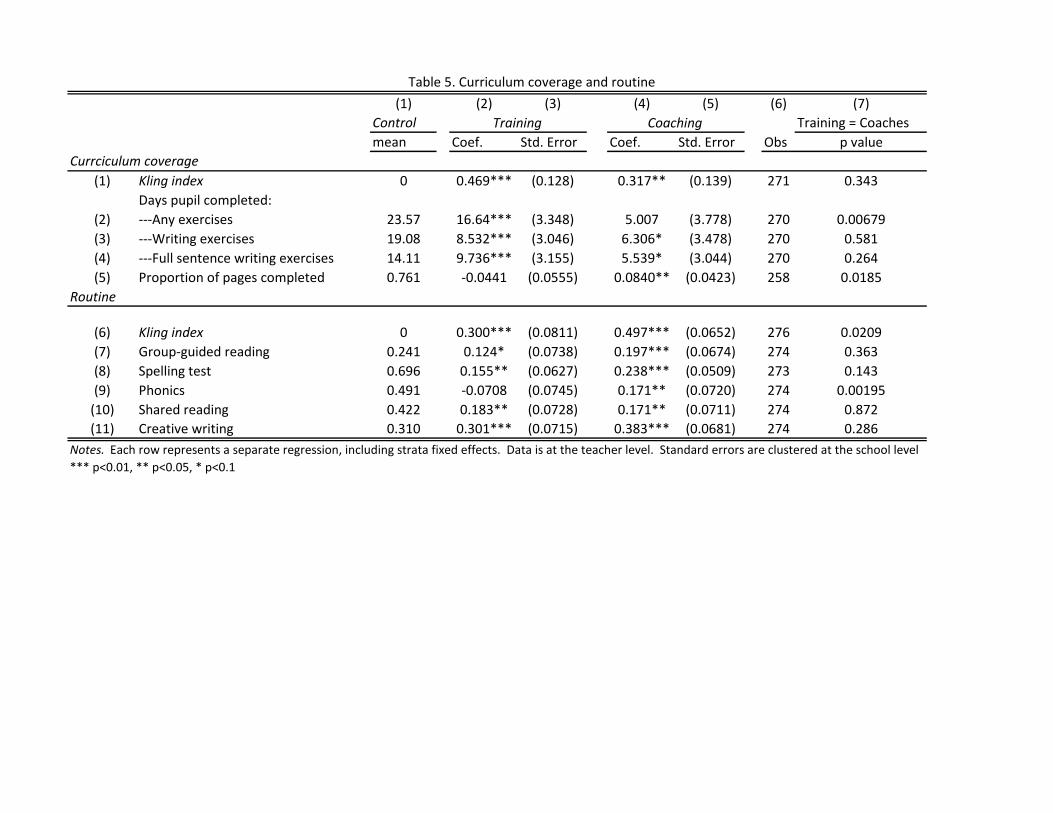
(1) (2) (3) (4) (5) (6) (7)
Control Training = Coaches
mean Coef. Std. Error Coef. Std. Error Obs p value
(1) Kling index 0 0.469*** (0.128) 0.317** (0.139) 271 0.343
Days pupil completed:
(2) ---Any exercises 23.57 16.64*** (3.348) 5.007 (3.778) 270 0.00679
(3) ---Writing exercises 19.08 8.532*** (3.046) 6.306* (3.478) 270 0.581
(4) ---Full sentence writing exercises 14.11 9.736*** (3.155) 5.539* (3.044) 270 0.264
(5) Proportion of pages completed 0.761 -0.0441 (0.0555) 0.0840** (0.0423) 258 0.0185
(6) Kling index 0 0.300*** (0.0811) 0.497*** (0.0652) 276 0.0209
(7) Group-guided reading 0.241 0.124* (0.0738) 0.197*** (0.0674) 274 0.363
(8) Spelling test 0.696 0.155** (0.0627) 0.238*** (0.0509) 273 0.143
(9) Phonics 0.491 -0.0708 (0.0745) 0.171** (0.0720) 274 0.00195
(10) Shared reading 0.422 0.183** (0.0728) 0.171** (0.0711) 274 0.872
(11) Creative writing 0.310 0.301*** (0.0715) 0.383*** (0.0681) 274 0.286
Training Coaching
Table 5. Curriculum coverage and routine
Notes. Each row represents a separate regression, including strata fixed effects. Data is at the teacher level. Standard errors are clustered at the school level
*** p<0.01, ** p<0.05, * p<0.1
Routine
Currciculum coverage
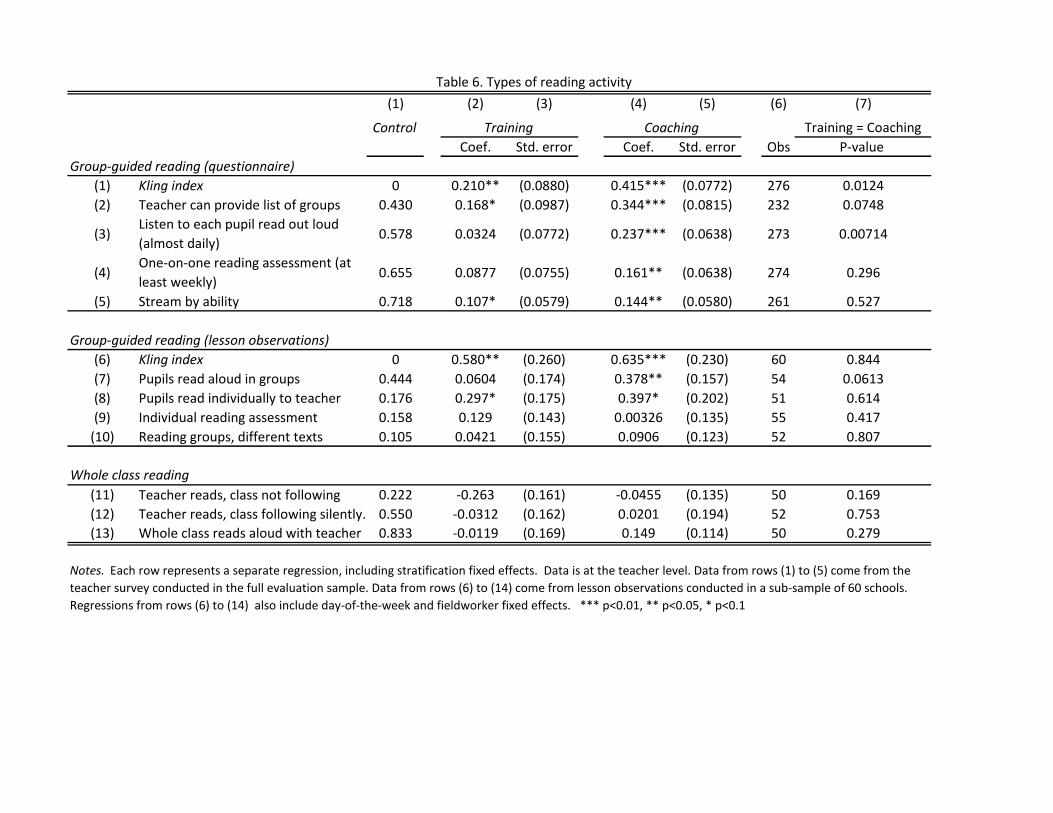
(1) (2) (3) (4) (5) (6) (7)
Control Training = Coaching
Coef. Std. error Coef. Std. error Obs P-value
(1) Kling index 0 0.210** (0.0880) 0.415*** (0.0772) 276 0.0124
(2) Teacher can provide list of groups 0.430 0.168* (0.0987) 0.344*** (0.0815) 232 0.0748
(3)Listen to each pupil read out loud
(almost daily)0.578 0.0324 (0.0772) 0.237*** (0.0638) 273 0.00714
(4)One-on-one reading assessment (at
least weekly)0.655 0.0877 (0.0755) 0.161** (0.0638) 274 0.296
(5) Stream by ability 0.718 0.107* (0.0579) 0.144** (0.0580) 261 0.527
(6) Kling index 0 0.580** (0.260) 0.635*** (0.230) 60 0.844
(7) Pupils read aloud in groups 0.444 0.0604 (0.174) 0.378** (0.157) 54 0.0613
(8) Pupils read individually to teacher 0.176 0.297* (0.175) 0.397* (0.202) 51 0.614
(9) Individual reading assessment 0.158 0.129 (0.143) 0.00326 (0.135) 55 0.417
(10) Reading groups, different texts 0.105 0.0421 (0.155) 0.0906 (0.123) 52 0.807
(11) Teacher reads, class not following 0.222 -0.263 (0.161) -0.0455 (0.135) 50 0.169
(12) Teacher reads, class following silently. 0.550 -0.0312 (0.162) 0.0201 (0.194) 52 0.753
(13) Whole class reads aloud with teacher 0.833 -0.0119 (0.169) 0.149 (0.114) 50 0.279
Whole class reading
Notes. Each row represents a separate regression, including stratification fixed effects. Data is at the teacher level. Data from rows (1) to (5) come from the
teacher survey conducted in the full evaluation sample. Data from rows (6) to (14) come from lesson observations conducted in a sub-sample of 60 schools.
Regressions from rows (6) to (14) also include day-of-the-week and fieldworker fixed effects. *** p<0.01, ** p<0.05, * p<0.1
CoachingTraining
Table 6. Types of reading activity
Group-guided reading (lesson observations)
Group-guided reading (questionnaire)
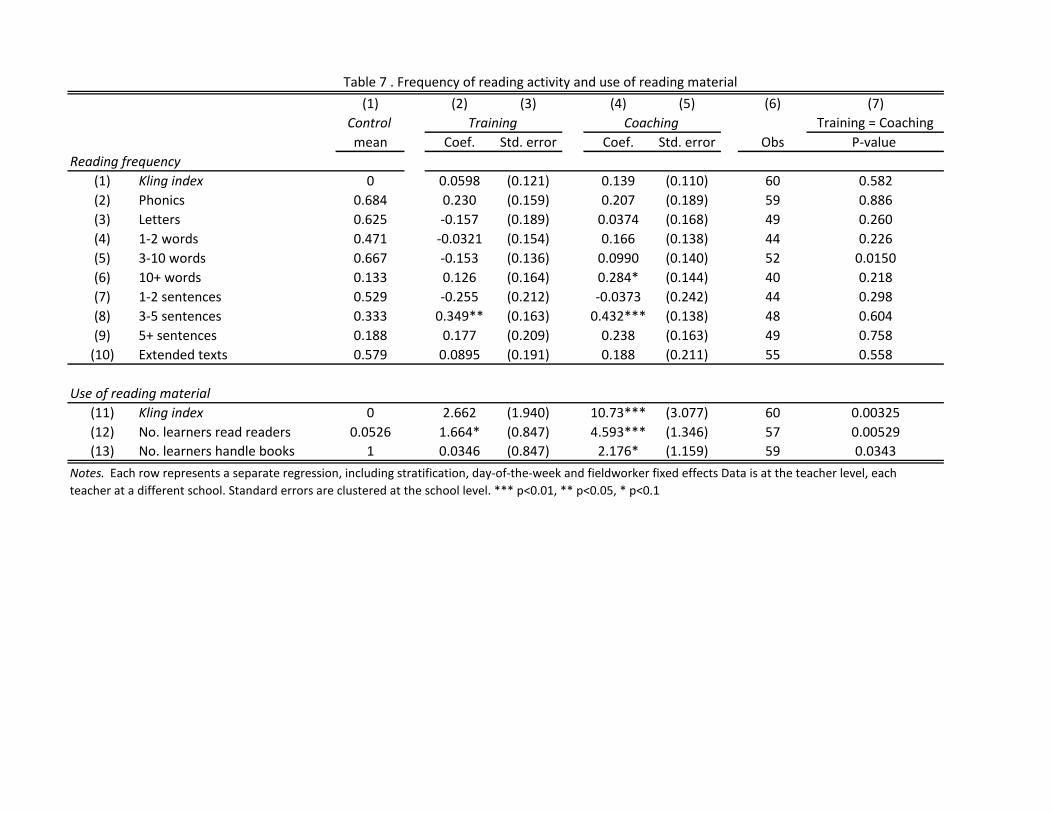
(1) (2) (3) (4) (5) (6) (7)
Control Training = Coaching
mean Coef. Std. error Coef. Std. error Obs P-value
Reading frequency
(1) Kling index 0 0.0598 (0.121) 0.139 (0.110) 60 0.582
(2) Phonics 0.684 0.230 (0.159) 0.207 (0.189) 59 0.886
(3) Letters 0.625 -0.157 (0.189) 0.0374 (0.168) 49 0.260
(4) 1-2 words 0.471 -0.0321 (0.154) 0.166 (0.138) 44 0.226
(5) 3-10 words 0.667 -0.153 (0.136) 0.0990 (0.140) 52 0.0150
(6) 10+ words 0.133 0.126 (0.164) 0.284* (0.144) 40 0.218
(7) 1-2 sentences 0.529 -0.255 (0.212) -0.0373 (0.242) 44 0.298
(8) 3-5 sentences 0.333 0.349** (0.163) 0.432*** (0.138) 48 0.604
(9) 5+ sentences 0.188 0.177 (0.209) 0.238 (0.163) 49 0.758
(10) Extended texts 0.579 0.0895 (0.191) 0.188 (0.211) 55 0.558
Use of reading material
(11) Kling index 0 2.662 (1.940) 10.73*** (3.077) 60 0.00325
(12) No. learners read readers 0.0526 1.664* (0.847) 4.593*** (1.346) 57 0.00529
(13) No. learners handle books 1 0.0346 (0.847) 2.176* (1.159) 59 0.0343
Notes. Each row represents a separate regression, including stratification, day-of-the-week and fieldworker fixed effects Data is at the teacher level, each
teacher at a different school. Standard errors are clustered at the school level. *** p<0.01, ** p<0.05, * p<0.1
Training Coaching
Table 7 . Frequency of reading activity and use of reading material
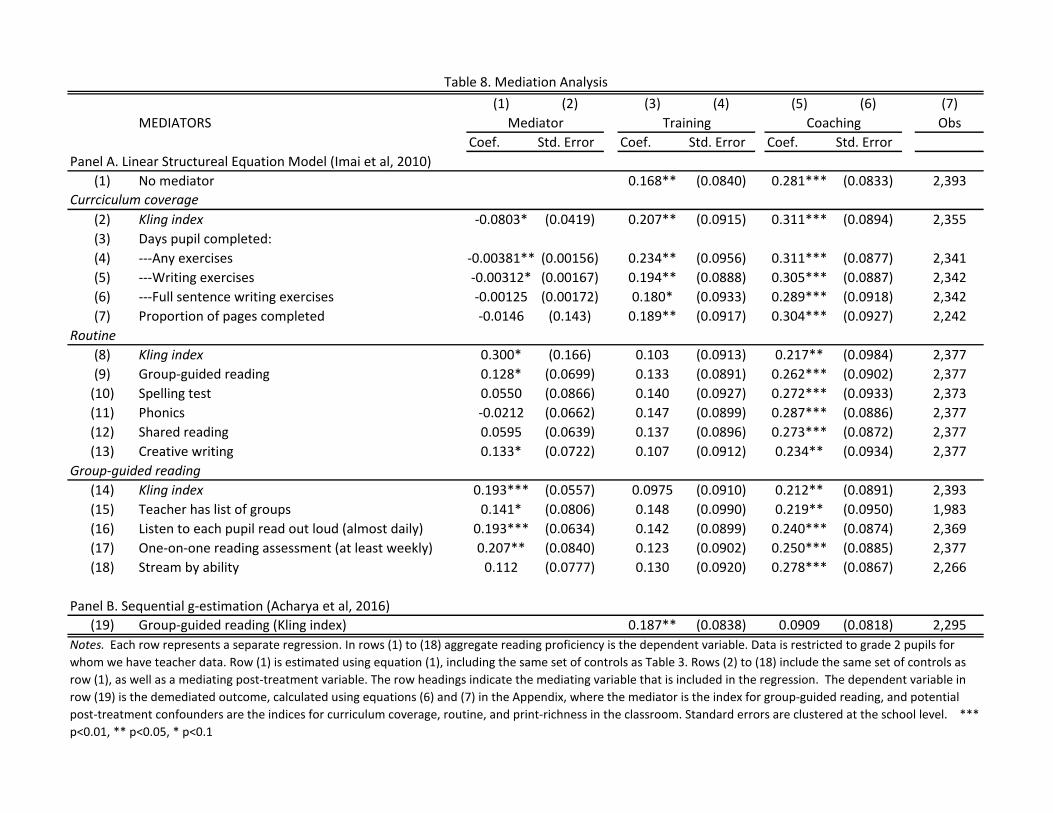
(1) (2) (3) (4) (5) (6) (7)
MEDIATORS Obs
Coef. Std. Error Coef. Std. Error Coef. Std. Error
Panel A. Linear Structureal Equation Model (Imai et al, 2010)
(1) No mediator 0.168** (0.0840) 0.281*** (0.0833) 2,393
(2) Kling index -0.0803* (0.0419) 0.207** (0.0915) 0.311*** (0.0894) 2,355
(3) Days pupil completed:
(4) ---Any exercises -0.00381** (0.00156) 0.234** (0.0956) 0.311*** (0.0877) 2,341
(5) ---Writing exercises -0.00312* (0.00167) 0.194** (0.0888) 0.305*** (0.0887) 2,342
(6) ---Full sentence writing exercises -0.00125 (0.00172) 0.180* (0.0933) 0.289*** (0.0918) 2,342
(7) Proportion of pages completed -0.0146 (0.143) 0.189** (0.0917) 0.304*** (0.0927) 2,242
Routine
(8) Kling index 0.300* (0.166) 0.103 (0.0913) 0.217** (0.0984) 2,377
(9) Group-guided reading 0.128* (0.0699) 0.133 (0.0891) 0.262*** (0.0902) 2,377
(10) Spelling test 0.0550 (0.0866) 0.140 (0.0927) 0.272*** (0.0933) 2,373
(11) Phonics -0.0212 (0.0662) 0.147 (0.0899) 0.287*** (0.0886) 2,377
(12) Shared reading 0.0595 (0.0639) 0.137 (0.0896) 0.273*** (0.0872) 2,377
(13) Creative writing 0.133* (0.0722) 0.107 (0.0912) 0.234** (0.0934) 2,377
Group-guided reading
(14) Kling index 0.193*** (0.0557) 0.0975 (0.0910) 0.212** (0.0891) 2,393
(15) Teacher has list of groups 0.141* (0.0806) 0.148 (0.0990) 0.219** (0.0950) 1,983
(16) Listen to each pupil read out loud (almost daily) 0.193*** (0.0634) 0.142 (0.0899) 0.240*** (0.0874) 2,369
(17) One-on-one reading assessment (at least weekly) 0.207** (0.0840) 0.123 (0.0902) 0.250*** (0.0885) 2,377
(18) Stream by ability 0.112 (0.0777) 0.130 (0.0920) 0.278*** (0.0867) 2,266
Panel B. Sequential g-estimation (Acharya et al, 2016)
(19) Group-guided reading (Kling index) 0.187** (0.0838) 0.0909 (0.0818) 2,295
Notes. Each row represents a separate regression. In rows (1) to (18) aggregate reading proficiency is the dependent variable. Data is restricted to grade 2 pupils for
whom we have teacher data. Row (1) is estimated using equation (1), including the same set of controls as Table 3. Rows (2) to (18) include the same set of controls as
row (1), as well as a mediating post-treatment variable. The row headings indicate the mediating variable that is included in the regression. The dependent variable in
row (19) is the demediated outcome, calculated using equations (6) and (7) in the Appendix, where the mediator is the index for group-guided reading, and potential
post-treatment confounders are the indices for curriculum coverage, routine, and print-richness in the classroom. Standard errors are clustered at the school level. ***
p<0.01, ** p<0.05, * p<0.1
Mediator Training Coaching
Table 8. Mediation Analysis
Currciculum coverage
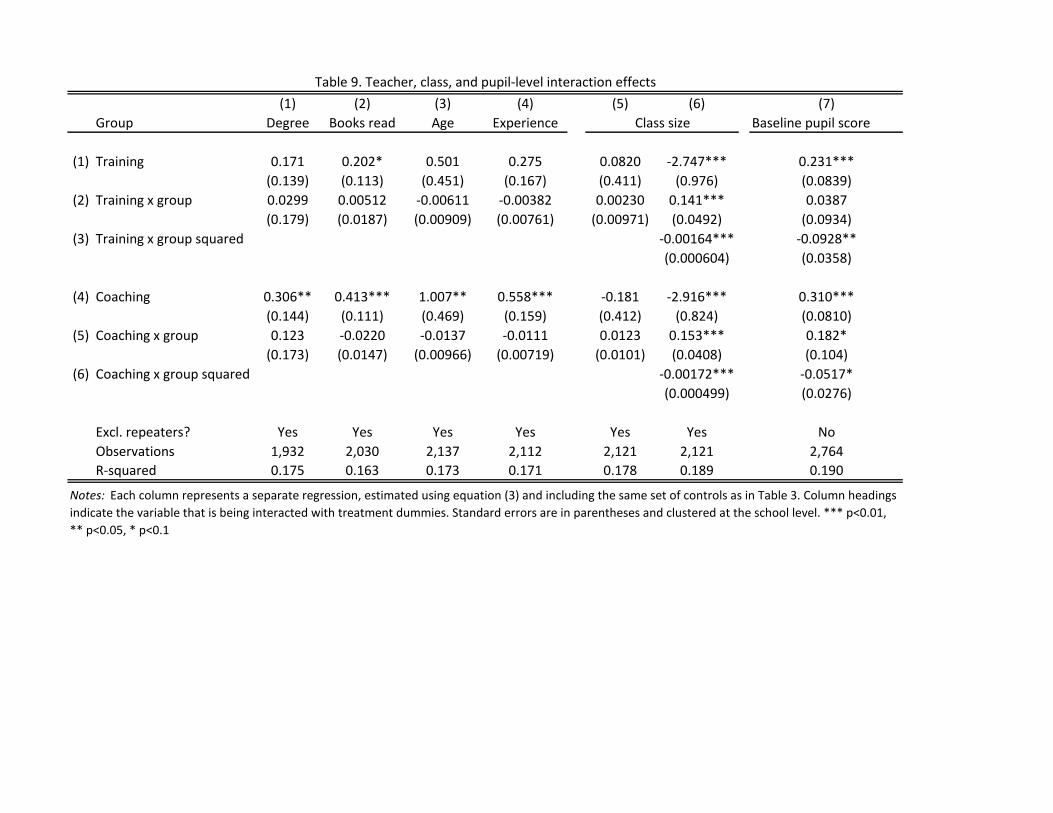
(1) (2) (3) (4) (5) (6) (7)
Group Degree Books read Age Experience Baseline pupil score
(1) Training 0.171 0.202* 0.501 0.275 0.0820 -2.747*** 0.231***
(0.139) (0.113) (0.451) (0.167) (0.411) (0.976) (0.0839)
(2) Training x group 0.0299 0.00512 -0.00611 -0.00382 0.00230 0.141*** 0.0387
(0.179) (0.0187) (0.00909) (0.00761) (0.00971) (0.0492) (0.0934)
(3) Training x group squared -0.00164*** -0.0928**
(0.000604) (0.0358)
(4) Coaching 0.306** 0.413*** 1.007** 0.558*** -0.181 -2.916*** 0.310***
(0.144) (0.111) (0.469) (0.159) (0.412) (0.824) (0.0810)
(5) Coaching x group 0.123 -0.0220 -0.0137 -0.0111 0.0123 0.153*** 0.182*
(0.173) (0.0147) (0.00966) (0.00719) (0.0101) (0.0408) (0.104)
(6) Coaching x group squared -0.00172*** -0.0517*
(0.000499) (0.0276)
Excl. repeaters? Yes Yes Yes Yes Yes Yes No
Observations 1,932 2,030 2,137 2,112 2,121 2,121 2,764
R-squared 0.175 0.163 0.173 0.171 0.178 0.189 0.190
Class size
Table 9. Teacher, class, and pupil-level interaction effects
Notes: Each column represents a separate regression, estimated using equation (3) and including the same set of controls as in Table 3. Column headings
indicate the variable that is being interacted with treatment dummies. Standard errors are in parentheses and clustered at the school level. *** p<0.01,
** p<0.05, * p<0.1

(1) (2) (3) (4) (5) (6)
VARIABLES Kling index
Teacher has list of
groups
Listen to each
pupil read out
loud
One-on-one
reading
assessment
Stream by
ability
Group-guided
reading
Training 1.216*** 1.216** 0.686** 0.272 0.224 -0.209
(0.397) (0.522) (0.325) (0.312) (0.303) (0.431)
Training x Class size -0.0238** -0.0246** -0.0157** -0.00447 -0.00252 0.00820
(0.00926) (0.0122) (0.00756) (0.00735) (0.00701) (0.0102)
Coaching 0.654* 0.251 0.769*** 0.162 0.129 0.368
(0.363) (0.466) (0.279) (0.262) (0.310) (0.347)
Coaching x Class size -0.00534 0.00304 -0.0131* 0.000372 5.18e-05 -0.00373
(0.00849) (0.0112) (0.00666) (0.00613) (0.00746) (0.00843)
Observations 254 216 253 254 245 254
R-squared 0.167 0.214 0.095 0.091 0.079 0.073
Table 10. Group-guided reading by class size
Notes: Each column represents a separate regression, estimated using equation (3). Column headings indicate the dependent variable. Standard errors are in
parentheses and clustered at the school level. *** p<0.01, ** p<0.05, * p<0.1

Figu
re1:
Qua
lity
ofim
plem
enta
tion
inC
oach
ing
arm
(a)
Num
bero
fvis
itsby
aco
ach
(b)
Num
bero
fgro
upw
orks
hops
Not
e:So
urce
:C
lass
Act
mon
itori
ngda
tafo
rth
esa
mpl
eof
89te
ache
rs(f
rom
49sc
hool
s)in
the
Coa
chin
gar
m
37
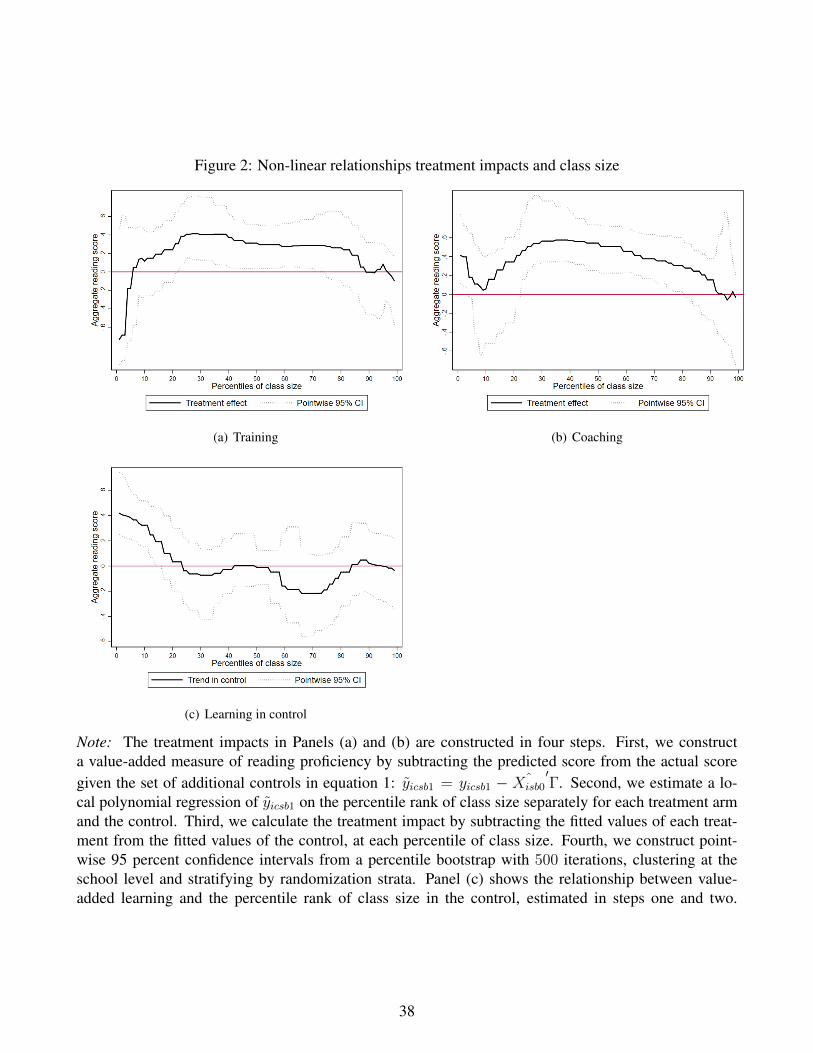
Figure 2: Non-linear relationships treatment impacts and class size
(a) Training (b) Coaching
(c) Learning in control
Note: The treatment impacts in Panels (a) and (b) are constructed in four steps. First, we constructa value-added measure of reading proficiency by subtracting the predicted score from the actual scoregiven the set of additional controls in equation 1: yicsb1 = yicsb1 − ˆXisb0
′Γ. Second, we estimate a lo-
cal polynomial regression of yicsb1 on the percentile rank of class size separately for each treatment armand the control. Third, we calculate the treatment impact by subtracting the fitted values of each treat-ment from the fitted values of the control, at each percentile of class size. Fourth, we construct point-wise 95 percent confidence intervals from a percentile bootstrap with 500 iterations, clustering at theschool level and stratifying by randomization strata. Panel (c) shows the relationship between value-added learning and the percentile rank of class size in the control, estimated in steps one and two.
38

Figure 3: Non-linear relationship between treatment impacts and baseline student performance
(a) Training (b) Coaching
Note: The treatment impacts in Panels (a) and (b) are constructed in four steps. First, we constructa value-added measure of reading proficiency by subtracting the predicted score from the actual score,given the vector controls included in equation 1: yicsb1 = yicsb1 − ˆXisb0
′Γ. Second, we estimate a lo-
cal polynomial regression of yicsb1 on the percentile rank of baseline student performance separatelyfor each treatment arm and the control. Third, we calculate the treatment impact by subtracting thefitted values of each treatment from the fitted values of the control, at each percentile of baseline stu-dent performance. Fourth, we construct pointwise 95 percent confidence intervals from a percentilebootstrap with 500 iterations, clustering at the school level and stratifying by randomization strata.
39
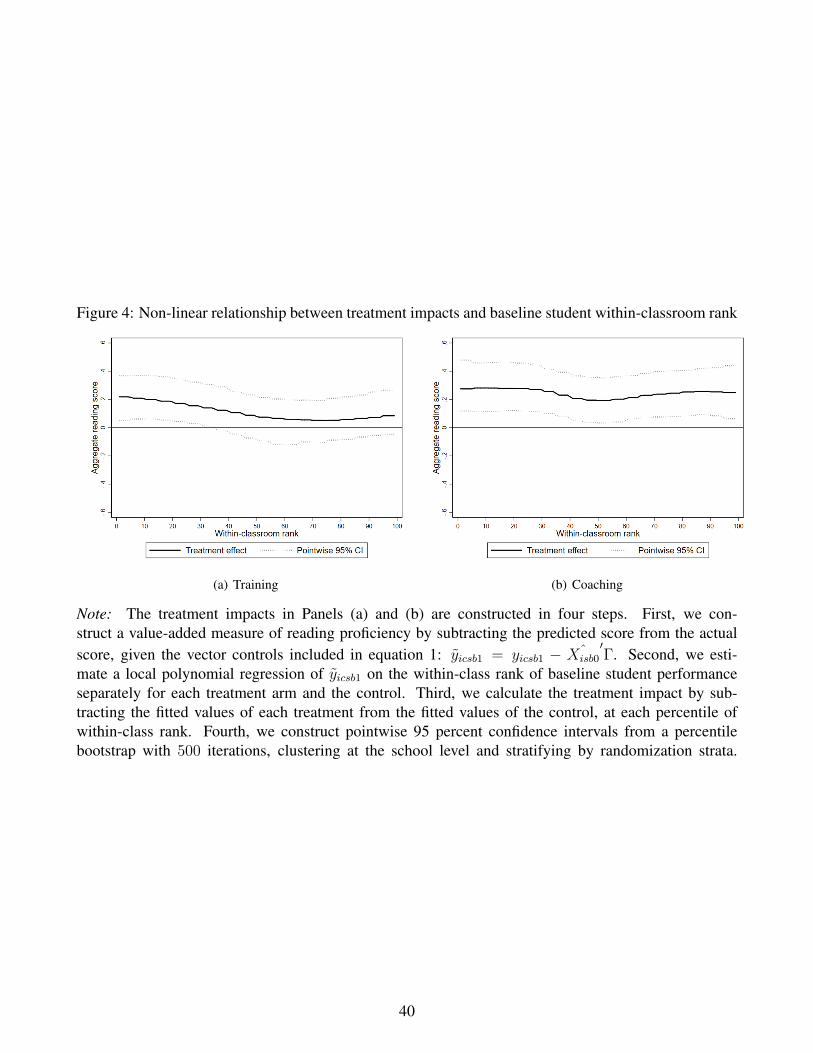
Figure 4: Non-linear relationship between treatment impacts and baseline student within-classroom rank
(a) Training (b) Coaching
Note: The treatment impacts in Panels (a) and (b) are constructed in four steps. First, we con-struct a value-added measure of reading proficiency by subtracting the predicted score from the actualscore, given the vector controls included in equation 1: yicsb1 = yicsb1 − ˆXisb0
′Γ. Second, we esti-
mate a local polynomial regression of yicsb1 on the within-class rank of baseline student performanceseparately for each treatment arm and the control. Third, we calculate the treatment impact by sub-tracting the fitted values of each treatment from the fitted values of the control, at each percentile ofwithin-class rank. Fourth, we construct pointwise 95 percent confidence intervals from a percentilebootstrap with 500 iterations, clustering at the school level and stratifying by randomization strata.
40

References
Acharya, A., Blackwell, M. & Sen, M. (2016), ‘Explaining causal findings without bias: Detecting andassessing direct effects’, American Political Science Review 110(3), 512–529.
Allen, J., Gregory, A., Mikami, A., Lun, J., Hamre, B. & Pianta, R. (2013), ‘Observations of effectiveteacher-student interactions in secondary school classrooms: Predicting student achievement with theclassroom assessment scoring system-secondary’, School Psychology Review 42(1), 76.
Araujo, M. C., Carneiro, P., Cruz-Aguayo, Y. & Schady, N. (2016), ‘Teacher quality and learning out-comes in kindergarten’, The Quarterly Journal of Economics 131(3), 1415–1453.
Athey, S. & Imbens, G. W. (2017), ‘The econometrics of randomized experiments’, Handbook of Eco-
nomic Field Experiments 1, 73–140.
Banerji, R., Bhattacharjea, S. & Wadhwa, W. (2013), ‘The annual status of education report (aser)’,Research in Comparative and International Education 8(3), 387–396.
Bold, T., Filmer, D., Martin, G., Molina, E., Stacy, B., Svensson, J. & Wane, W. (2017), ‘Enrolment with-out learning: Teacher effort, knowledge, and skill in primary schools in africa’, Journal of Economic
Perspectives 31(4).
Clotfelter, C. T., Ladd, H. F. & Vigdor, J. L. (2010), ‘Teacher credentials and student achievement in highschool a cross-subject analysis with student fixed effects’, Journal of Human Resources 45(3), 655–681.
Conn, K. (2014), Identifying Effective Education Interventions in Sub-Saharan Africa: A meta-analysis
of rigorous impact evaluations, Columbia University.
Das, J., Dercon, S., Habyarimana, J. & Krishnan, P. (2007), ‘Teacher shocks and student learning evi-dence from zambia’, Journal of Human resources 42(4), 820–862.
Dresser, R. (2012), ‘The impact of scripted literacy instruction on teachers and students’, Issues in
Teacher Education 21(1), 71.
Fleisch, B., Schoer, V., Roberts, G. & Thornton, A. (2016), ‘System-wide improvement of early-grademathematics: New evidence from the gauteng primary language and mathematics strategy’, Interna-
tional Journal of Educational Development 49, 157–174.
Fryer, R. G. (2017), ‘The production of human capital in developed countries: Evidence from 196 ran-domized field experimentsa’, Handbook of Economic Field Experiments 2, 95–322.
41
Garet, M. S., Cronen, S., Eaton, M., Kurki, A., Ludwig, M., Jones, W., Uekawa, K., Falk, A., Bloom,H. S., Doolittle, F. et al. (2008), ‘The impact of two professional development interventions on earlyreading instruction and achievement. ncee 2008-4030.’, National Center for Education Evaluation and
Regional Assistance .
Garet, M. S., Wayne, A. J., Stancavage, F., Taylor, J., Eaton, M., Walters, K., Song, M., Brown, S.,Hurlburt, S., Zhu, P. et al. (2011), ‘Middle school mathematics professional development impact study:Findings after the second year of implementation’, National Center for Education Evaluation and
Regional Assistance .
Harris, D. N. & Sass, T. R. (2011), ‘Teacher training, teacher quality and student achievement’, Journal
of public economics 95(7), 798–812.
Hoadley, U. (2012), ‘What do we know about teaching and learning in south african primary schools?’,Education as Change 16(2), 187–202.
Imai, K., Keele, L. & Tingley, D. (2010), ‘A general approach to causal mediation analysis.’, Psycholog-
ical methods 15(4), 309.
Jackson, C. K. & Makarin, A. (2018), ‘Simplifying teaching: A field experiment with online” off-the-shelf” lessons’, AEJ: Applied .
Jacob, B. A. & Lefgren, L. (2004), ‘The impact of teacher training on student achievement quasi-experimental evidence from school reform efforts in chicago’, Journal of Human Resources 39(1), 50–79.
Kennedy, M. M. (2016), ‘How does professional development improve teaching?’, Review of Educa-
tional Research 86(4), 945–980.
Kerwin, J. T., Thornton, R. et al. (2017), ‘Making the grade: Understanding what works for teachingliteracy in rural uganda’, Unpublished manuscript. University of Illinois, Urbana, IL .
Kling, J. R., Liebman, J. B. & Katz, L. F. (2007), ‘Experimental analysis of neighborhood effects’,Econometrica 75(1), 83–119.
Knight, D. S. (2012), ‘Assessing the cost of instructional coaching’, Journal of Education Finance
38(1), 52–80.
Kraft, M. A., Blazar, D. & Hogan, D. (2018), ‘The effect of teacher coaching on instruction and achieve-ment: A meta-analysis of the causal evidence’, Review of Education Research .
Langenberg, D., Correro, G., Ferguson, G., Kamil, M., Samuels, S., Shaywitz, S., Williams, J., Yatvin,J., Ehri, L., Garza, N., Marrett, C., Shanahan, T., Trabasso, T. & Willows, D. (2000), Report of the
42
national reading panel: Teaching children to read: An evidence-based assessment of the scientificresearch literature on reading and its implications for reading instruction: Reports of the subgroups,Technical report.
Lucas, A. M., McEwan, P. J., Ngware, M. & Oketch, M. (2014), ‘Improving early-grade literacy in eastafrica: Experimental evidence from kenya and uganda’, Journal of Policy Analysis and Management
33(4), 950–976.
McEwan, P. J. (2015), ‘Improving learning in primary schools of developing countries: A meta-analysisof randomized experiments’, Review of Educational Research 85(3), 353–394.
Mullins, I., Martin, M., Foy, P. & Hooper, M. (2017), Pirls 2016 international results in reading, Technicalreport, International Association for the Evaluation of Educational Achievement.
Oreopoulos, P. & Petronijevic, U. (2018), ‘Student coaching: How far can technology go?’, Journal of
Human Resources 53(2), 299–329.
Piper, B., Zuilkowski, S. S., Dubeck, M., Jepkemei, E. & King, S. J. (2018), ‘Identifying the essentialingredients to literacy and numeracy improvement: Teacher professional development and coaching,student textbooks, and structured teachers guides’, World Development 106, 324–336.
Piper, B., Zuilkowski, S. S. & Mugenda, A. (2014), ‘Improving reading outcomes in kenya: First-yeareffects of the primr initiative’, International Journal of Educational Development 37, 11–21.
Popova, A., Evans, D. K. & Arancibia, V. (2016), ‘Inside in-service teacher training: What works andhow do we measure it?’.
Randel, B., Beesley, A. D., Apthorp, H., Clark, T. F., Wang, X., Cicchinelli, L. F. & Williams, J. M.(2011), ‘Classroom assessment for student learning: Impact on elementary school mathematics in thecentral region. final report. ncee 2011-4005.’, National Center for Education Evaluation and Regional
Assistance .
Rivkin, S. G., Hanushek, E. A. & Kain, J. F. (2005), ‘Teachers, schools, and academic achievement’,Econometrica 73(2), 417–458.
Snilstveit, B., Stevenson, J., Menon, R., Phillips, D., Gallagher, E., Geleen, M., Jobse, H., Schmidt, T.& Jimenez, E. (2016), ‘The impact of education programmes on learning and school participation inlow-and middle-income countries’.
Staiger, D. O. & Rockoff, J. E. (2010), ‘Searching for effective teachers with imperfect information’,The Journal of Economic Perspectives 24(3), 97–117.
Strizek, G. A., Tourkin, S. & Erberber, E. (2014), ‘Teaching and learning international survey (talis)2013: Us technical report. nces 2015-010.’, National Center for Education Statistics .
43

Taylor, S. et al. (2011), Uncovering indicators of effective school management in south africa using thenational school effectiveness study, Technical report.
44
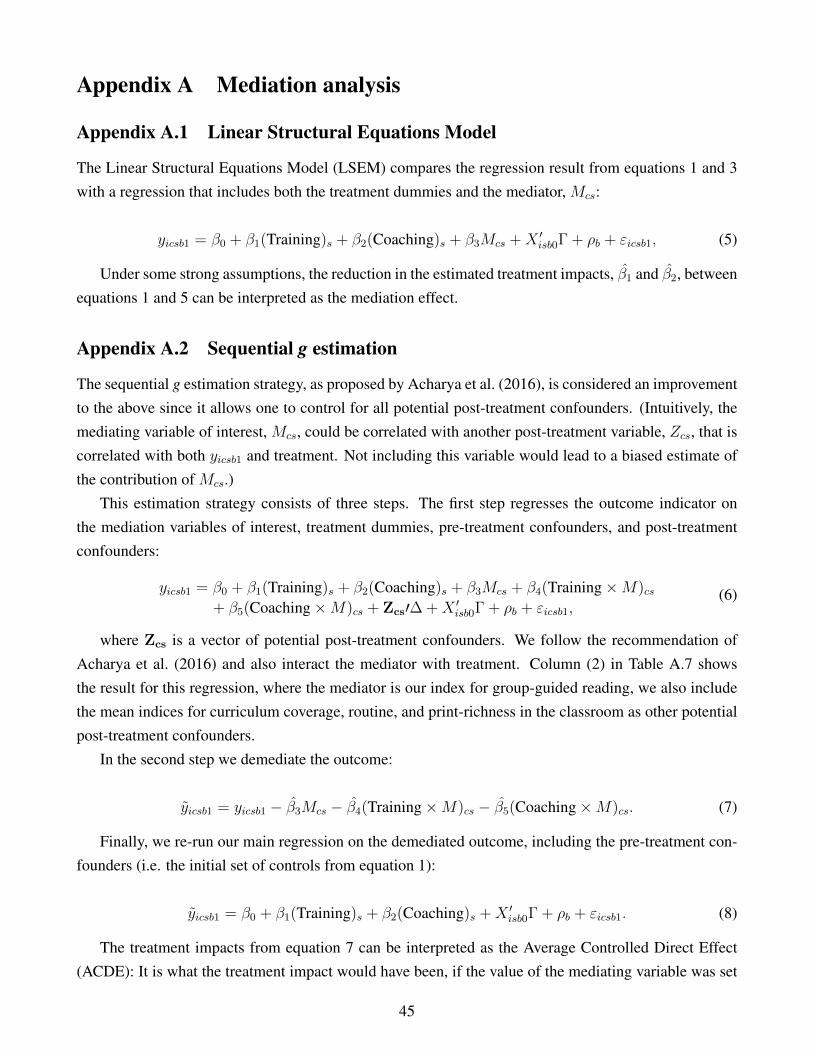
Appendix A Mediation analysis
Appendix A.1 Linear Structural Equations Model
The Linear Structural Equations Model (LSEM) compares the regression result from equations 1 and 3with a regression that includes both the treatment dummies and the mediator, Mcs:
yicsb1 = β0 + β1(Training)s + β2(Coaching)s + β3Mcs +X ′isb0Γ + ρb + εicsb1, (5)
Under some strong assumptions, the reduction in the estimated treatment impacts, β1 and β2, betweenequations 1 and 5 can be interpreted as the mediation effect.
Appendix A.2 Sequential g estimation
The sequential g estimation strategy, as proposed by Acharya et al. (2016), is considered an improvementto the above since it allows one to control for all potential post-treatment confounders. (Intuitively, themediating variable of interest, Mcs, could be correlated with another post-treatment variable, Zcs, that iscorrelated with both yicsb1 and treatment. Not including this variable would lead to a biased estimate ofthe contribution of Mcs.)
This estimation strategy consists of three steps. The first step regresses the outcome indicator onthe mediation variables of interest, treatment dummies, pre-treatment confounders, and post-treatmentconfounders:
(6)yicsb1 = β0 + β1(Training)s + β2(Coaching)s + β3Mcs + β4(Training×M)cs+ β5(Coaching×M)cs + Zcs′∆ +X ′
isb0Γ + ρb + εicsb1,
where Zcs is a vector of potential post-treatment confounders. We follow the recommendation ofAcharya et al. (2016) and also interact the mediator with treatment. Column (2) in Table A.7 showsthe result for this regression, where the mediator is our index for group-guided reading, we also includethe mean indices for curriculum coverage, routine, and print-richness in the classroom as other potentialpost-treatment confounders.
In the second step we demediate the outcome:
yicsb1 = yicsb1 − β3Mcs − β4(Training×M)cs − β5(Coaching×M)cs. (7)
Finally, we re-run our main regression on the demediated outcome, including the pre-treatment con-founders (i.e. the initial set of controls from equation 1):
yicsb1 = β0 + β1(Training)s + β2(Coaching)s +X ′isb0Γ + ρb + εicsb1. (8)
The treatment impacts from equation 7 can be interpreted as the Average Controlled Direct Effect(ACDE): It is what the treatment impact would have been, if the value of the mediating variable was set
45

to zero (in our case, this is the same as setting the mediating variable equal to the mean in the control).The difference between β1 and β1 in equations 1 and 8 can therefore be interpreted as the indirect impactof the treatment through the mediator— i.e. the contribution of the mediator to the overall treatmentimpact.
Column (3) in Table A.7 shows the regression results from equation 8. As a comparison, column(1) shows the regression results from 1, when restricting the sample to the same set of observations asin equations 7 and 8. The reduction in treatment impact is much larger when using the sequential g
estimator, compared to the LSEM. The reason for this is the large positive interaction between Coachingand group-guided reading.
46

Appendix B Further tables and figures
47
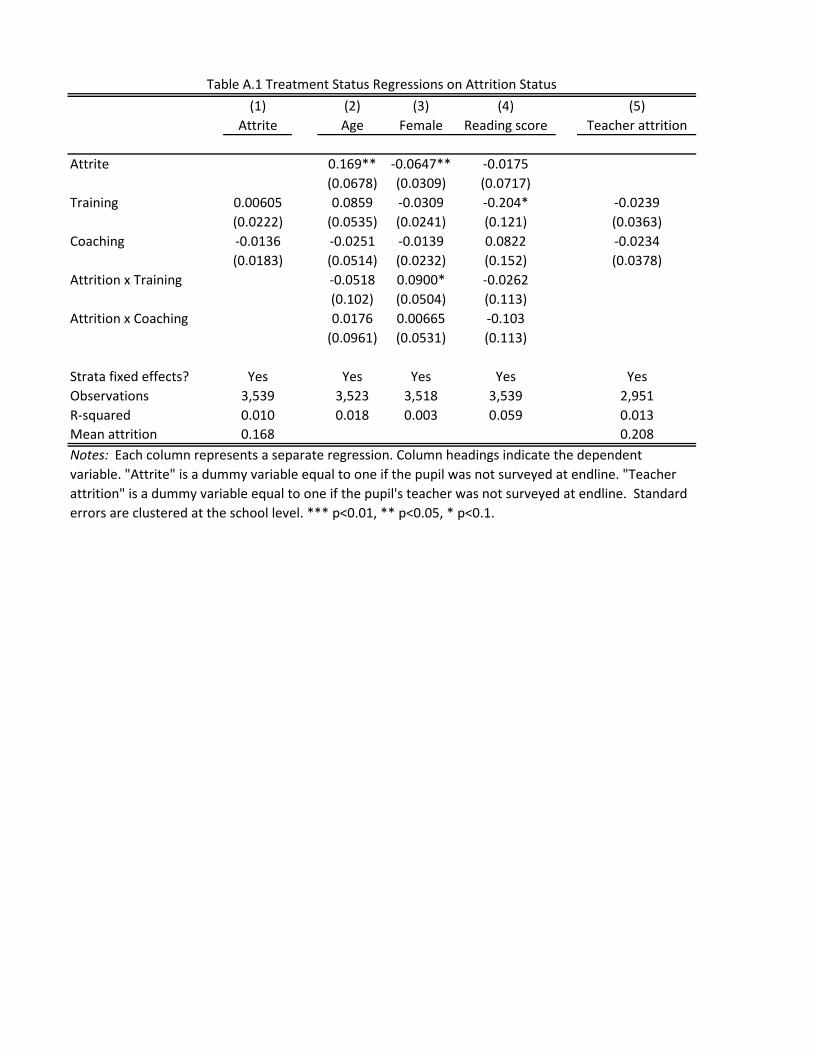
(1) (2) (3) (4) (5)
Attrite Age Female Reading score Teacher attrition
Attrite 0.169** -0.0647** -0.0175
(0.0678) (0.0309) (0.0717)
Training 0.00605 0.0859 -0.0309 -0.204* -0.0239
(0.0222) (0.0535) (0.0241) (0.121) (0.0363)
Coaching -0.0136 -0.0251 -0.0139 0.0822 -0.0234
(0.0183) (0.0514) (0.0232) (0.152) (0.0378)
Attrition x Training -0.0518 0.0900* -0.0262
(0.102) (0.0504) (0.113)
Attrition x Coaching 0.0176 0.00665 -0.103
(0.0961) (0.0531) (0.113)
Strata fixed effects? Yes Yes Yes Yes Yes
Observations 3,539 3,523 3,518 3,539 2,951
R-squared 0.010 0.018 0.003 0.059 0.013
Mean attrition 0.168 0.208
Table A.1 Treatment Status Regressions on Attrition Status
Notes: Each column represents a separate regression. Column headings indicate the dependent
variable. "Attrite" is a dummy variable equal to one if the pupil was not surveyed at endline. "Teacher
attrition" is a dummy variable equal to one if the pupil's teacher was not surveyed at endline. Standard
errors are clustered at the school level. *** p<0.01, ** p<0.05, * p<0.1.
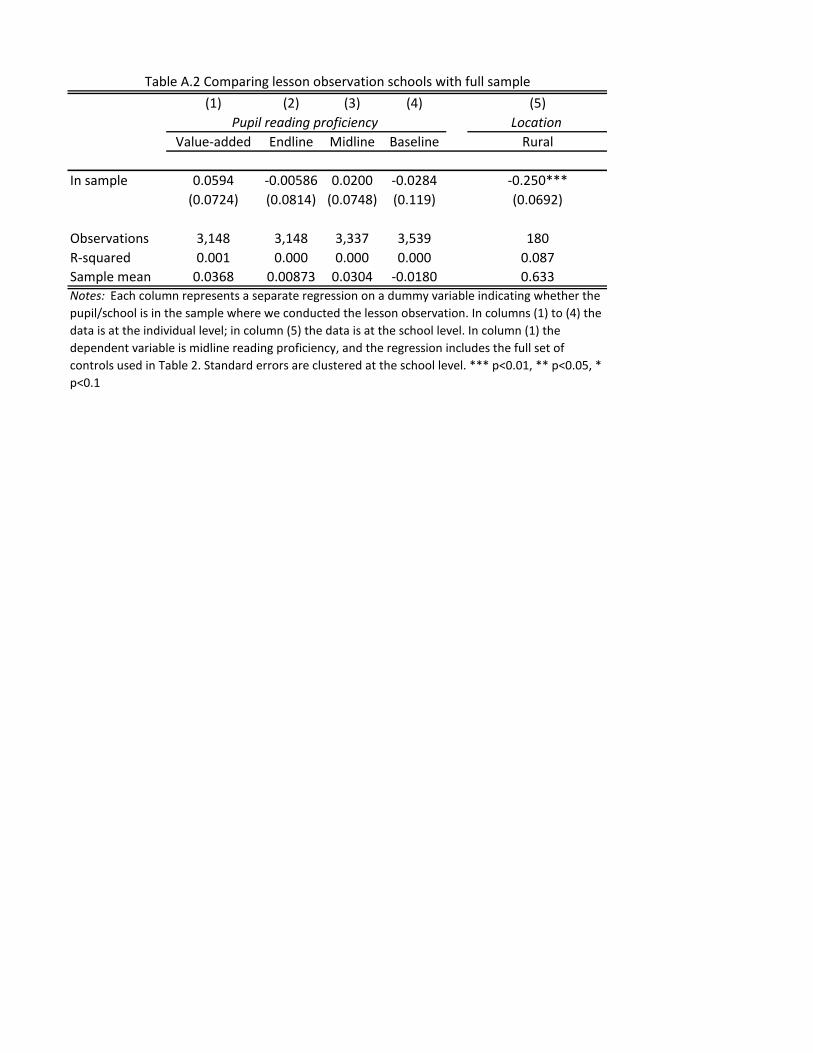
(1) (2) (3) (4) (5)
Location
Value-added Endline Midline Baseline Rural
In sample 0.0594 -0.00586 0.0200 -0.0284 -0.250***
(0.0724) (0.0814) (0.0748) (0.119) (0.0692)
Observations 3,148 3,148 3,337 3,539 180
R-squared 0.001 0.000 0.000 0.000 0.087
Sample mean 0.0368 0.00873 0.0304 -0.0180 0.633
Table A.2 Comparing lesson observation schools with full sample
Notes: Each column represents a separate regression on a dummy variable indicating whether the
pupil/school is in the sample where we conducted the lesson observation. In columns (1) to (4) the
data is at the individual level; in column (5) the data is at the school level. In column (1) the
dependent variable is midline reading proficiency, and the regression includes the full set of
controls used in Table 2. Standard errors are clustered at the school level. *** p<0.01, ** p<0.05, *
p<0.1
Pupil reading proficiency
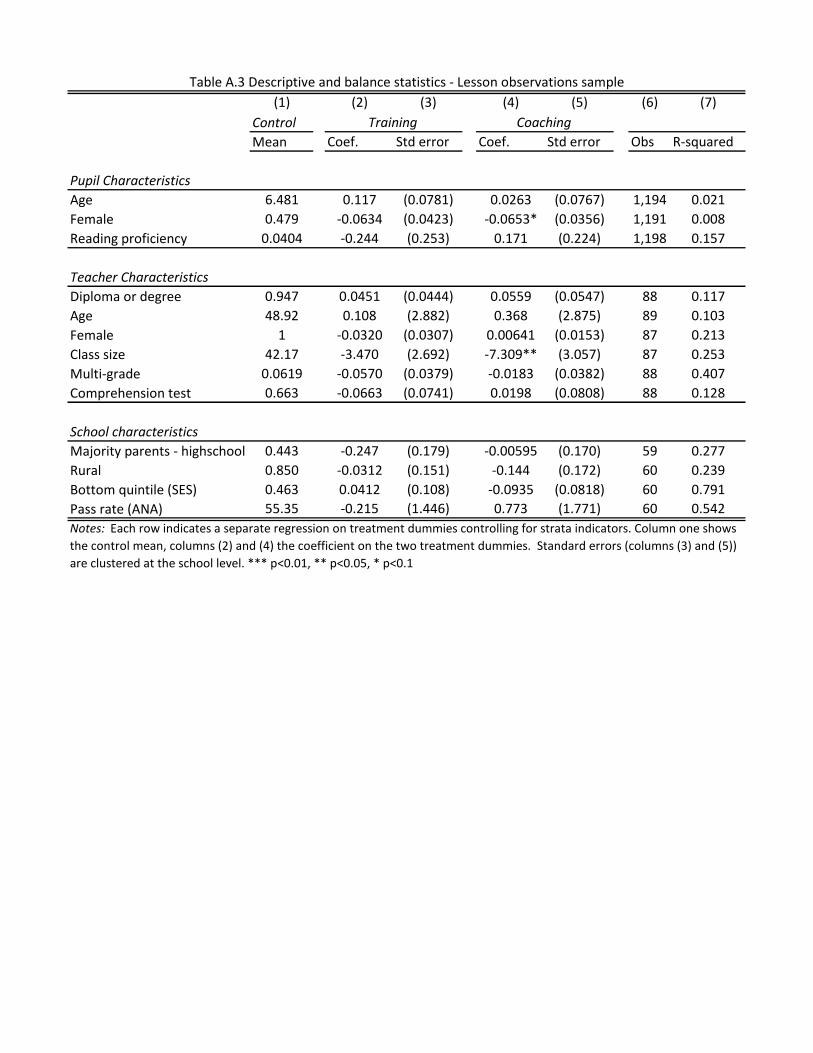
(1) (2) (3) (4) (5) (6) (7)
Control
Mean Coef. Std error Coef. Std error Obs R-squared
Pupil Characteristics
Age 6.481 0.117 (0.0781) 0.0263 (0.0767) 1,194 0.021
Female 0.479 -0.0634 (0.0423) -0.0653* (0.0356) 1,191 0.008
Reading proficiency 0.0404 -0.244 (0.253) 0.171 (0.224) 1,198 0.157
Teacher Characteristics
Diploma or degree 0.947 0.0451 (0.0444) 0.0559 (0.0547) 88 0.117
Age 48.92 0.108 (2.882) 0.368 (2.875) 89 0.103
Female 1 -0.0320 (0.0307) 0.00641 (0.0153) 87 0.213
Class size 42.17 -3.470 (2.692) -7.309** (3.057) 87 0.253
Multi-grade 0.0619 -0.0570 (0.0379) -0.0183 (0.0382) 88 0.407
Comprehension test 0.663 -0.0663 (0.0741) 0.0198 (0.0808) 88 0.128
School characteristics
Majority parents - highschool 0.443 -0.247 (0.179) -0.00595 (0.170) 59 0.277
Rural 0.850 -0.0312 (0.151) -0.144 (0.172) 60 0.239
Bottom quintile (SES) 0.463 0.0412 (0.108) -0.0935 (0.0818) 60 0.791
Pass rate (ANA) 55.35 -0.215 (1.446) 0.773 (1.771) 60 0.542
Table A.3 Descriptive and balance statistics - Lesson observations sample
Training Coaching
Notes: Each row indicates a separate regression on treatment dummies controlling for strata indicators. Column one shows
the control mean, columns (2) and (4) the coefficient on the two treatment dummies. Standard errors (columns (3) and (5))
are clustered at the school level. *** p<0.01, ** p<0.05, * p<0.1
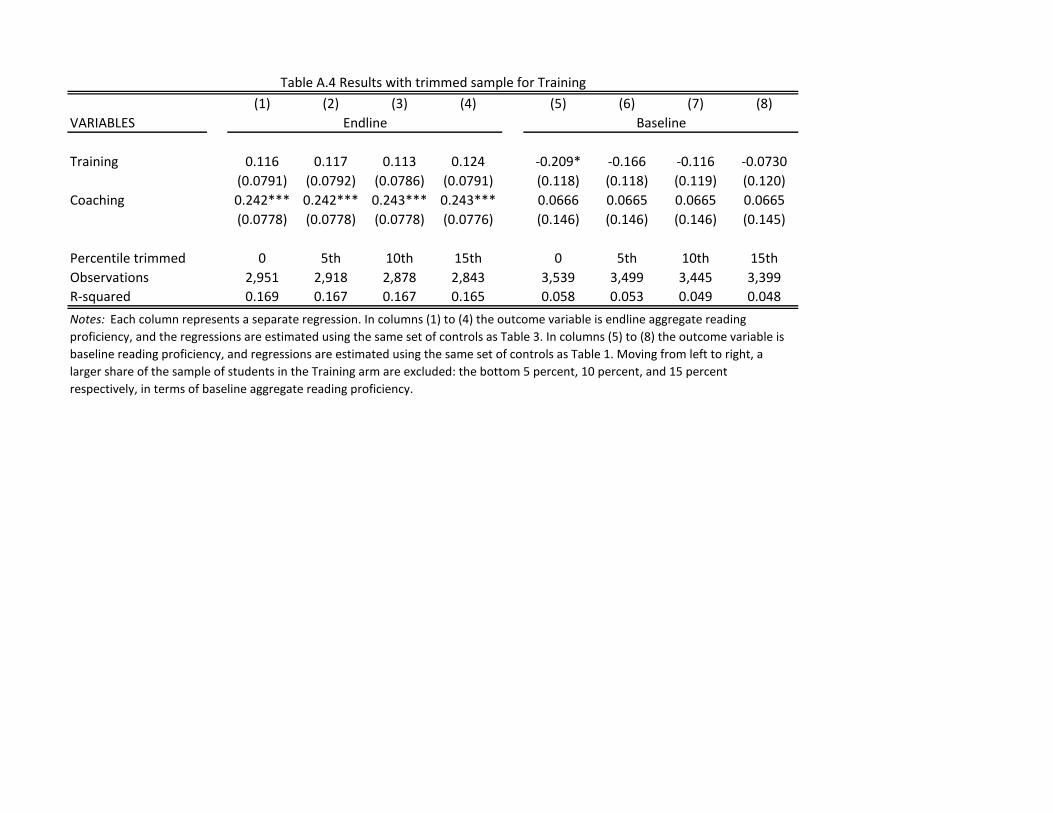
(1) (2) (3) (4) (5) (6) (7) (8)
VARIABLES
Training 0.116 0.117 0.113 0.124 -0.209* -0.166 -0.116 -0.0730
(0.0791) (0.0792) (0.0786) (0.0791) (0.118) (0.118) (0.119) (0.120)
Coaching 0.242*** 0.242*** 0.243*** 0.243*** 0.0666 0.0665 0.0665 0.0665
(0.0778) (0.0778) (0.0778) (0.0776) (0.146) (0.146) (0.146) (0.145)
Percentile trimmed 0 5th 10th 15th 0 5th 10th 15th
Observations 2,951 2,918 2,878 2,843 3,539 3,499 3,445 3,399
R-squared 0.169 0.167 0.167 0.165 0.058 0.053 0.049 0.048
BaselineEndline
Table A.4 Results with trimmed sample for Training
Notes: Each column represents a separate regression. In columns (1) to (4) the outcome variable is endline aggregate reading
proficiency, and the regressions are estimated using the same set of controls as Table 3. In columns (5) to (8) the outcome variable is
baseline reading proficiency, and regressions are estimated using the same set of controls as Table 1. Moving from left to right, a
larger share of the sample of students in the Training arm are excluded: the bottom 5 percent, 10 percent, and 15 percent
respectively, in terms of baseline aggregate reading proficiency.
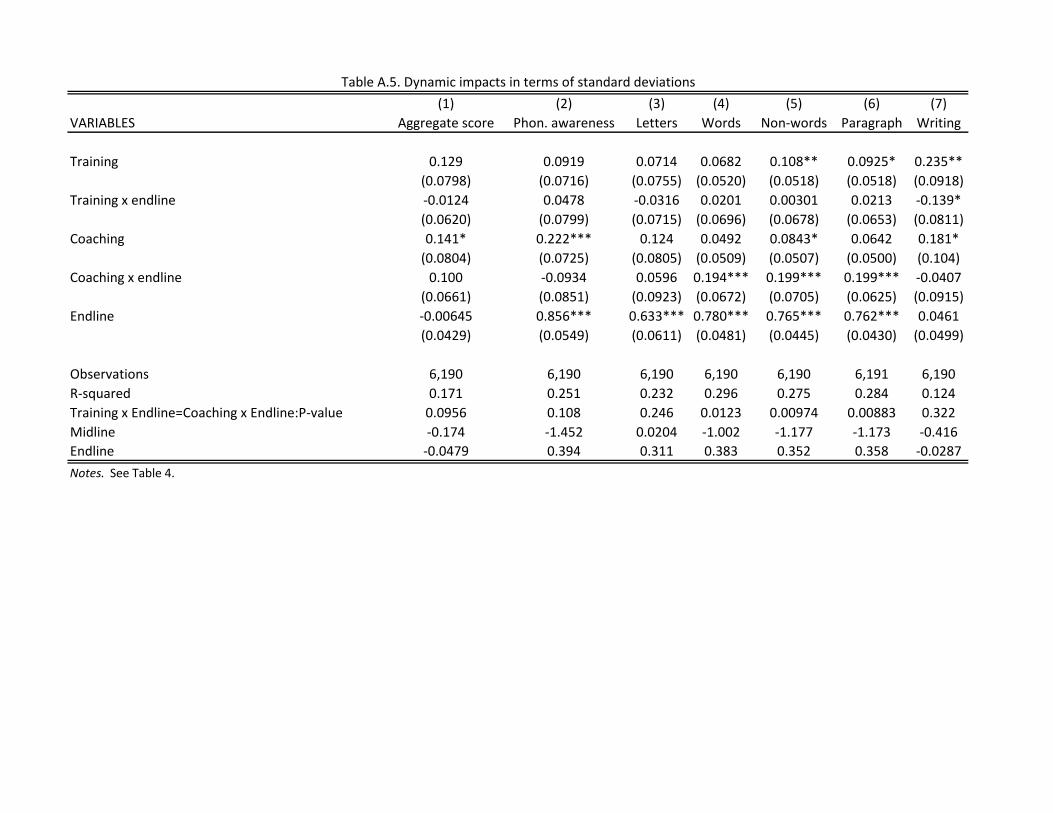
(1) (2) (3) (4) (5) (6) (7)
VARIABLES Aggregate score Phon. awareness Letters Words Non-words Paragraph Writing
Training 0.129 0.0919 0.0714 0.0682 0.108** 0.0925* 0.235**
(0.0798) (0.0716) (0.0755) (0.0520) (0.0518) (0.0518) (0.0918)
Training x endline -0.0124 0.0478 -0.0316 0.0201 0.00301 0.0213 -0.139*
(0.0620) (0.0799) (0.0715) (0.0696) (0.0678) (0.0653) (0.0811)
Coaching 0.141* 0.222*** 0.124 0.0492 0.0843* 0.0642 0.181*
(0.0804) (0.0725) (0.0805) (0.0509) (0.0507) (0.0500) (0.104)
Coaching x endline 0.100 -0.0934 0.0596 0.194*** 0.199*** 0.199*** -0.0407
(0.0661) (0.0851) (0.0923) (0.0672) (0.0705) (0.0625) (0.0915)
Endline -0.00645 0.856*** 0.633*** 0.780*** 0.765*** 0.762*** 0.0461
(0.0429) (0.0549) (0.0611) (0.0481) (0.0445) (0.0430) (0.0499)
Observations 6,190 6,190 6,190 6,190 6,190 6,191 6,190
R-squared 0.171 0.251 0.232 0.296 0.275 0.284 0.124
Training x Endline=Coaching x Endline:P-value 0.0956 0.108 0.246 0.0123 0.00974 0.00883 0.322
Midline -0.174 -1.452 0.0204 -1.002 -1.177 -1.173 -0.416
Endline -0.0479 0.394 0.311 0.383 0.352 0.358 -0.0287
Table A.5. Dynamic impacts in terms of standard deviations
Notes. See Table 4.
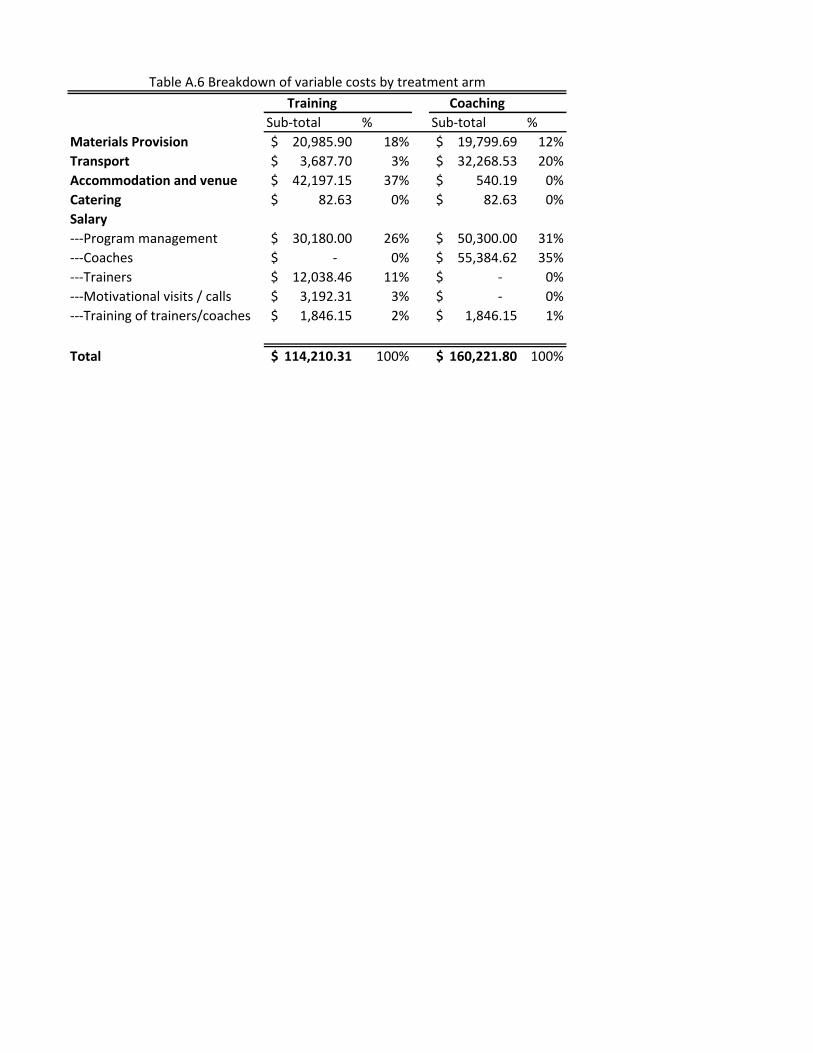
Training Coaching
Sub-total % Sub-total %
Materials Provision 20,985.90$ 18% 19,799.69$ 12%
Transport 3,687.70$ 3% 32,268.53$ 20%
Accommodation and venue 42,197.15$ 37% 540.19$ 0%
Catering 82.63$ 0% 82.63$ 0%
Salary
---Program management 30,180.00$ 26% 50,300.00$ 31%
---Coaches -$ 0% 55,384.62$ 35%
---Trainers 12,038.46$ 11% -$ 0%
---Motivational visits / calls 3,192.31$ 3% -$ 0%
---Training of trainers/coaches 1,846.15$ 2% 1,846.15$ 1%
Total 114,210.31$ 100% 160,221.80$ 100%
Table A.6 Breakdown of variable costs by treatment arm
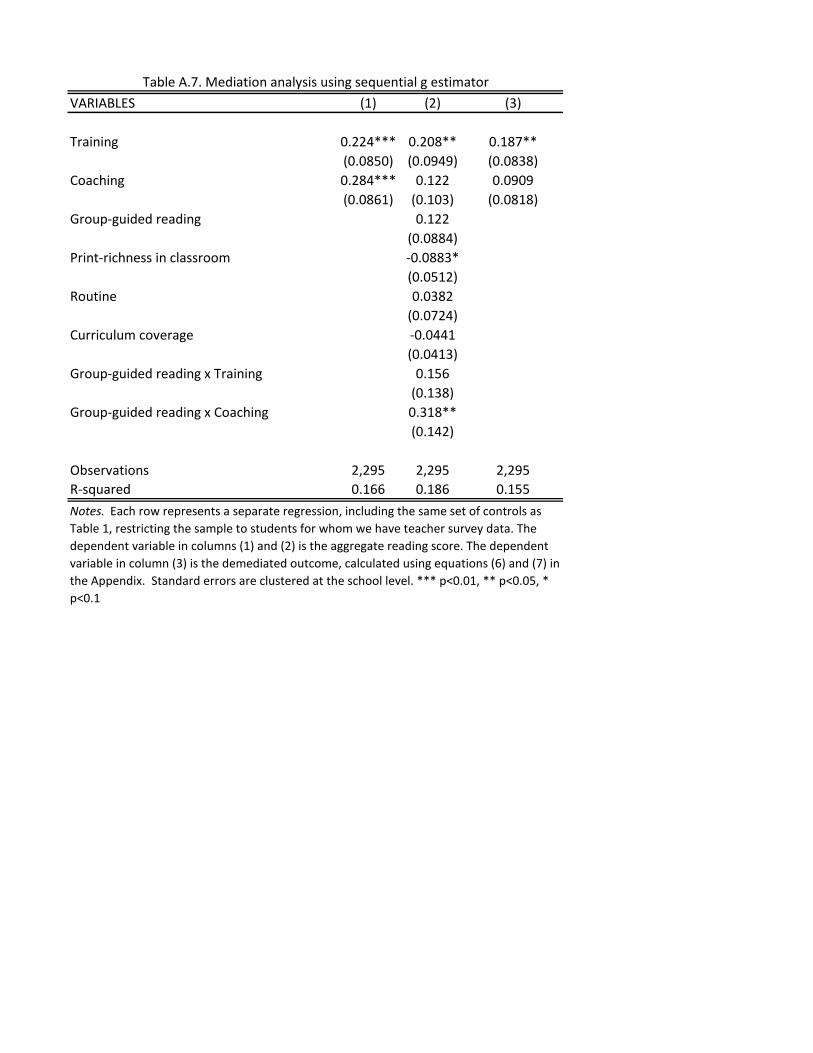
VARIABLES (1) (2) (3)
Training 0.224*** 0.208** 0.187**
(0.0850) (0.0949) (0.0838)
Coaching 0.284*** 0.122 0.0909
(0.0861) (0.103) (0.0818)
Group-guided reading 0.122
(0.0884)
Print-richness in classroom -0.0883*
(0.0512)
Routine 0.0382
(0.0724)
Curriculum coverage -0.0441
(0.0413)
Group-guided reading x Training 0.156
(0.138)
Group-guided reading x Coaching 0.318**
(0.142)
Observations 2,295 2,295 2,295
R-squared 0.166 0.186 0.155
Table A.7. Mediation analysis using sequential g estimator
Notes. Each row represents a separate regression, including the same set of controls as
Table 1, restricting the sample to students for whom we have teacher survey data. The
dependent variable in columns (1) and (2) is the aggregate reading score. The dependent
variable in column (3) is the demediated outcome, calculated using equations (6) and (7) in
the Appendix. Standard errors are clustered at the school level. *** p<0.01, ** p<0.05, *
p<0.1

Figu
reB
.1:T
imel
ine
ofst
udy
55
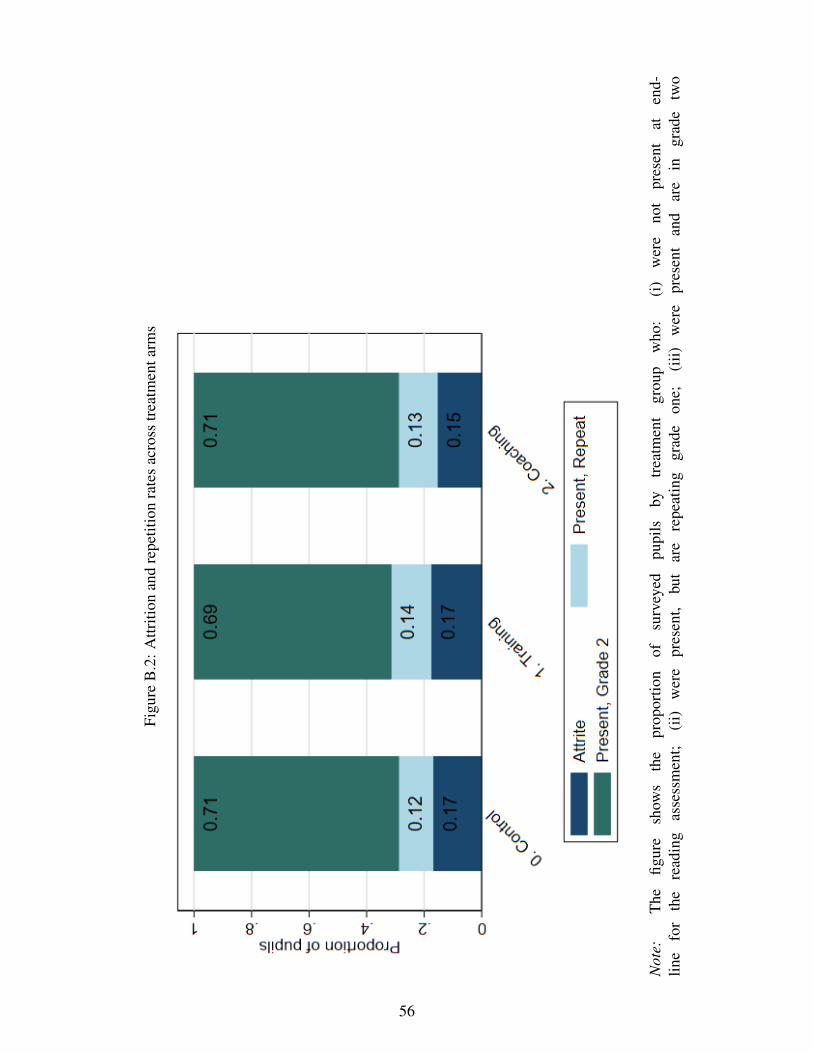
Figu
reB
.2:A
ttriti
onan
dre
petit
ion
rate
sac
ross
trea
tmen
tarm
s
Not
e:T
hefig
ure
show
sth
epr
opor
tion
ofsu
rvey
edpu
pils
bytr
eatm
ent
grou
pw
ho:
(i)
wer
eno
tpr
esen
tat
end-
line
for
the
read
ing
asse
ssm
ent;
(ii)
wer
epr
esen
t,bu
tar
ere
peat
ing
grad
eon
e;(i
ii)w
ere
pres
ent
and
are
ingr
ade
two
56
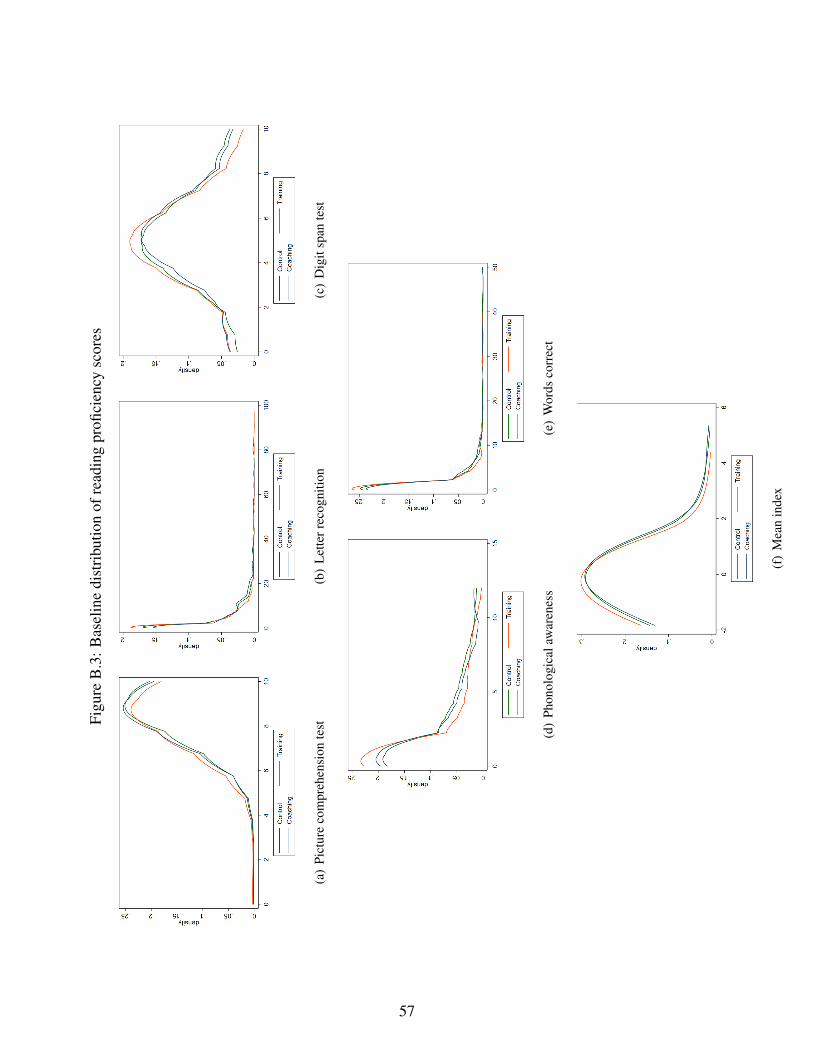
Figu
reB
.3:B
asel
ine
dist
ribu
tion
ofre
adin
gpr
ofici
ency
scor
es
(a)
Pict
ure
com
preh
ensi
onte
st(b
)L
ette
rrec
ogni
tion
(c)
Dig
itsp
ante
st
(d)
Phon
olog
ical
awar
enes
s(e
)W
ords
corr
ect
(f)
Mea
nin
dex
57
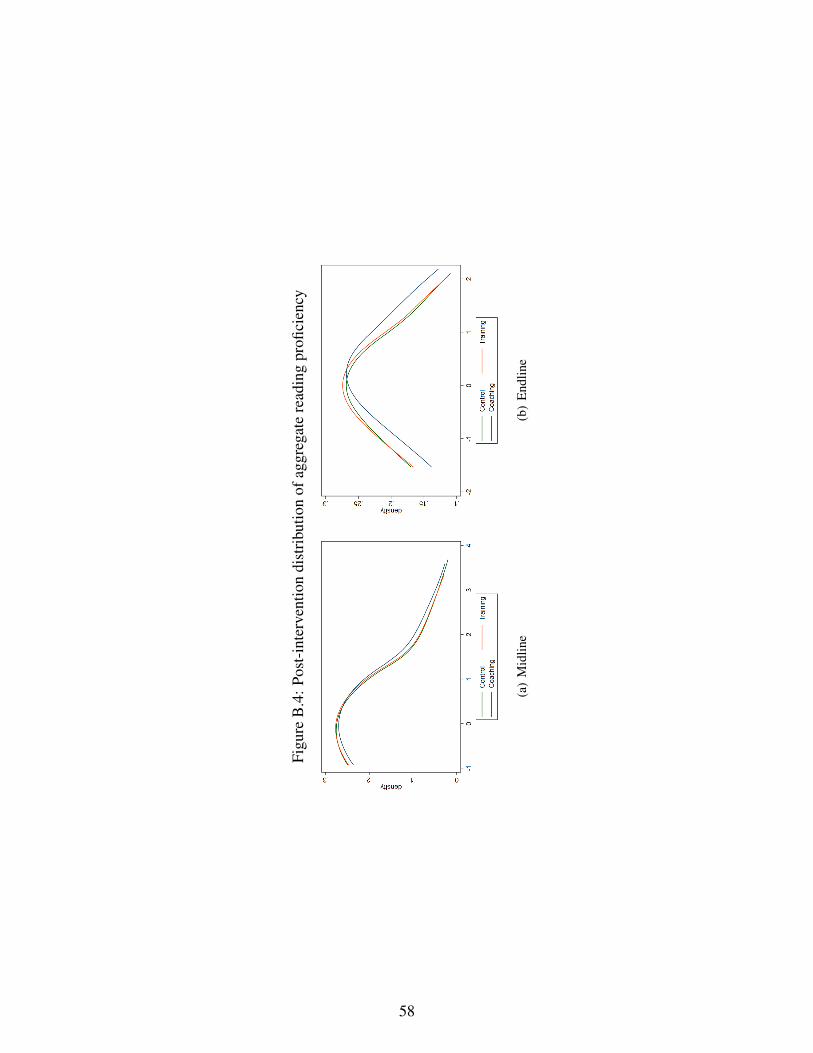
Figu
reB
.4:P
ost-
inte
rven
tion
dist
ribu
tion
ofag
greg
ate
read
ing
profi
cien
cy
(a)
Mid
line
(b)
End
line
58
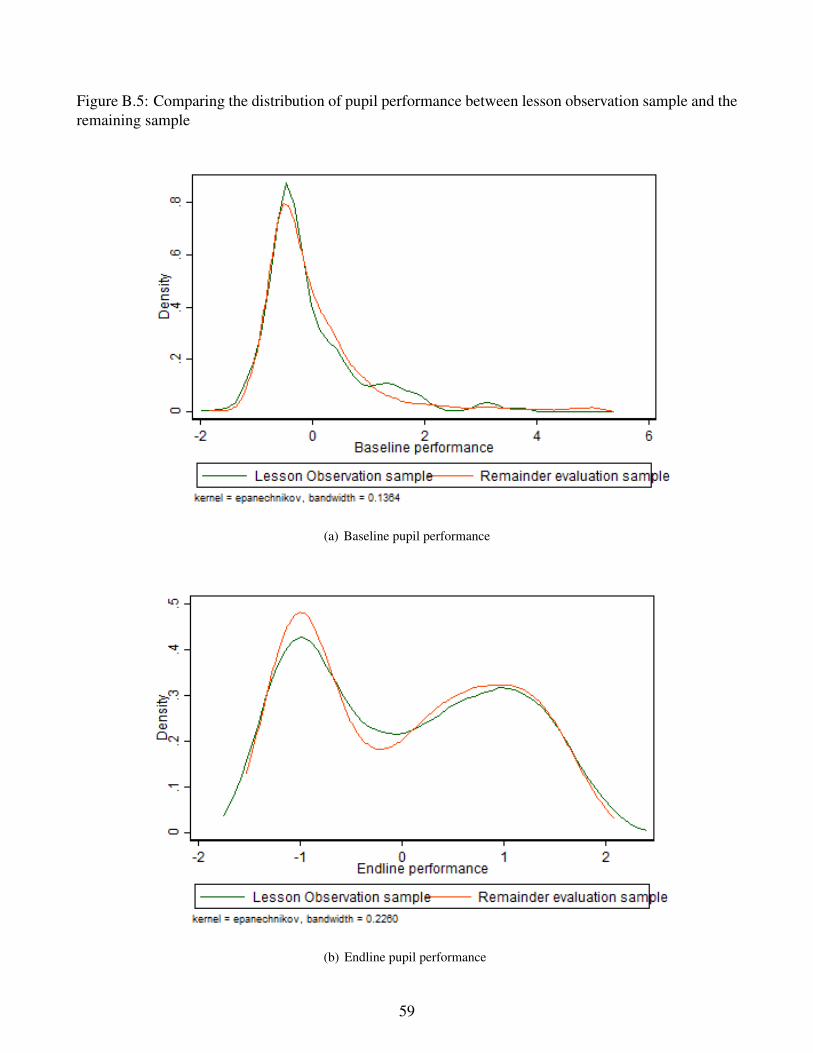
Figure B.5: Comparing the distribution of pupil performance between lesson observation sample and theremaining sample
(a) Baseline pupil performance
(b) Endline pupil performance
59
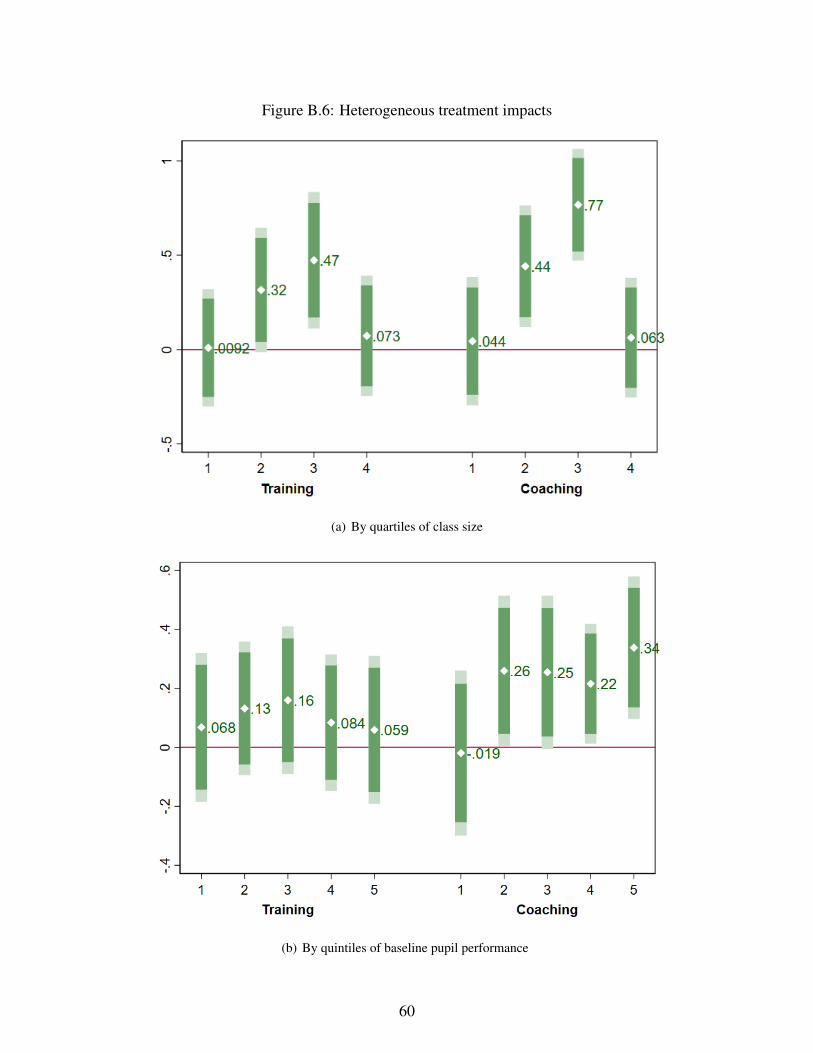
Figure B.6: Heterogeneous treatment impacts
(a) By quartiles of class size
(b) By quintiles of baseline pupil performance
60
Top Related
Copyright © 2022 FDOKUMEN

