


Bahasa
Halaman
Hukum

Ht
BDa
b
c
d
a
ARRAA
KOLHE
1
va(msiac
PT
0d
Drug and Alcohol Dependence 118 (2011) 259– 264
Contents lists available at ScienceDirect
Drug and Alcohol Dependence
jo u rn al hom epage: www.elsev ier .com/ locate /drugalcdep
ealth related quality of life trajectories of patients in opioid substitutionreatment
ohdan Nosyka,∗, Daphne P. Guha, Huiying Suna, Eugenia Oviedo-Joekesa,b, Suzanne Brissettec,avid C. Marshd, Martin T. Schechtera,b, Aslam H. Anisa,b
Centre for Health Evaluation and Outcome Sciences, British Columbia, Canada V6Z 1Y6School of Population and Public Health, University of British Columbia, British Columbia, Canada V6T 1Z3Centre de recherche du l’Université de Montreal, Quebec, Canada H3T 1J7Northern Ontario School of Medicine, Ontario, Canada P3E 2C6
r t i c l e i n f o
rticle history:eceived 23 January 2011eceived in revised form 3 April 2011ccepted 4 April 2011vailable online 4 May 2011
eywords:pioid dependenceatent class growth analysisealth related quality of lifeQ-5D
a b s t r a c t
Background: While opioid substitution treatment (OST) provides the opportunity for substantial improve-ments in health related quality of life (HRQoL), this relationship is seldom documented and poorlyunderstood. Our objectives were to identify differences in trajectories of HRQoL among chronic opioid-dependent patients and factors associated with improvement and deterioration in HRQoL followingenrolment in opioid substitution treatment.Methods: In the North American Opiate Medication Initiative (NAOMI) randomized controlled trial, theEuroqol (EQ-5D) and other measures of demographic, health and drug use characteristics were collectedat baseline and quarterly follow-up. Latent class growth analysis was applied to identify classes of HRQoLtrajectories during treatment, while baseline correlates of class membership and factors associated withchanges in HRQoL were identified in multivariate analyses.Results: Three classes of individual HRQoL growth trajectories were identified: class 1: low and constant(19.5%), class 2: moderate and improved (61.2%), and class 3: high and constant (19.3%). Class 1 memberswere younger and more likely to be female, while class 3 members were less likely to have chronicconditions and had lower illicit drug use severity at baseline. Changes in HRQoL were associated with
improvements in housing status (positive), medical events (negative) and decreases in illicit drug use(positive).Conclusions: Insight into the extent of HRQoL response and characteristics of patients responding to treat-ment can be used to design interventions that maximize HRQoL improvement. Given its role in economicevaluation and subsequent resource allocation decisions, HRQoL should be considered an endpoint inopio
treatment evaluations for. Introduction
Opioid dependence is well-known to be associated with ele-ated risks of mortality, however this chronic, recurrent conditionlso substantially impairs health-related quality of life (HRQoL)Millson et al., 2006). Engagement in opiate substitution treat-
ent (OST) can potentially improve patients’ HRQoL or healthtatus through mediation of withdrawal symptoms, decreased anx-
ety resulting from drug-seeking behaviour and the potential toccess additional psychosocial and pharmacological treatment foro-morbid conditions, as recommended in best practices guide-∗ Corresponding author at: Centre for Health Evaluation & Outcome Sciences, St.aul’s Hospital, 620B-1081 Burrard Street, Vancouver, BC, Canada V6Z 1Y6.el.: +1 604 806 8692; fax: +1 604 806 8778.
E-mail addresses: [email protected], [email protected] (B. Nosyk).
376-8716/$ – see front matter © 2011 Elsevier Ireland Ltd. All rights reserved.oi:10.1016/j.drugalcdep.2011.04.003
id dependence.© 2011 Elsevier Ireland Ltd. All rights reserved.
lines (National Consensus Development Panel on Effective MedicalTreatment of Opiate Addiction, 1998; Health Canada, 2005).
Improvements in health status among patients successfullyreaching study endpoints have been limited in some contexts.A systematic review of experimental OST evaluations could notdraw any conclusions on the effect of OST on HRQoL due to alack of HRQoL evidence collected in past studies (Amato et al.,2005). Studies using other measures related to ‘quality of life’(combining domains such as living situation, leisure activities, reli-gion, finances, legal and safety, family relations, social relationsand health) have shown some improvement in general well-being,mental and physical health (Giacomuzzi et al., 2003; Ponizovskyand Grinshpoon, 2007; Winklbaur et al., 2008), however the
broader use of these measures has been limited in comparison togeneric health status measures such as the Short-Form SF-36 or theEuroqol EQ-5D, both of which are also amenable to calculation ofquality-adjusted life years for use in health economic evaluations.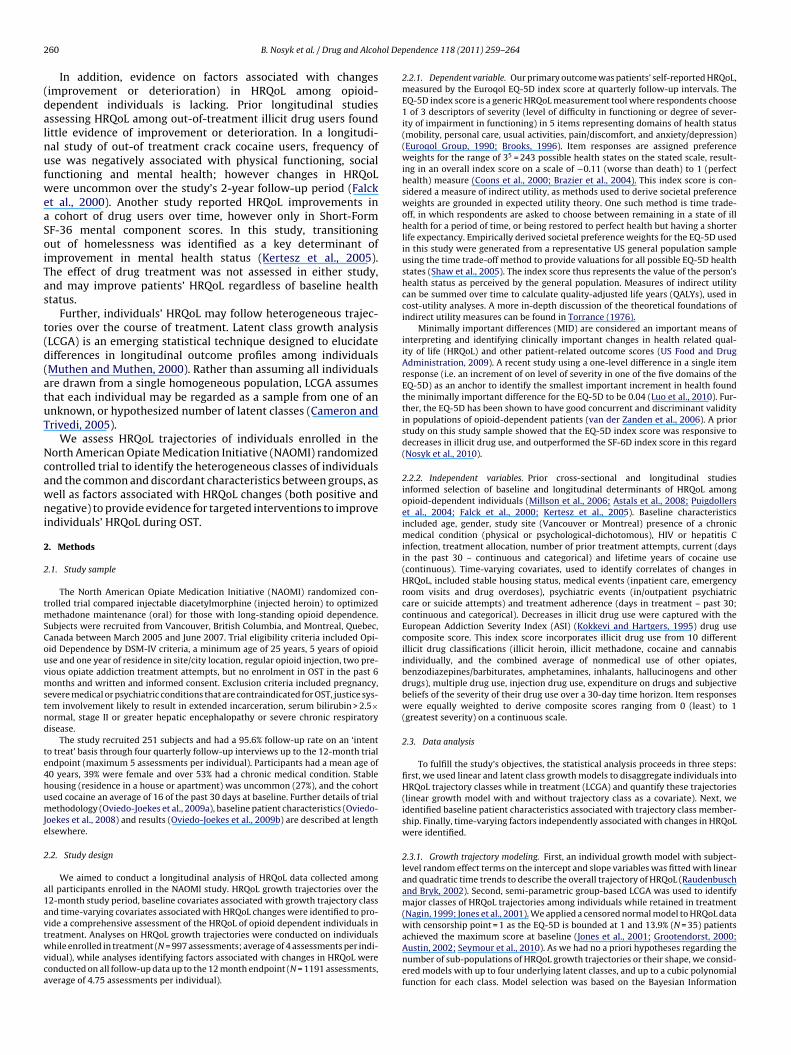
2 ol Dep
(dalnufweaSoiTas
t(d(atuT
Ncawni
2
2
tmSCouvmstnd
te4humJe
2
a1avtwvca
60 B. Nosyk et al. / Drug and Alcoh
In addition, evidence on factors associated with changesimprovement or deterioration) in HRQoL among opioid-ependent individuals is lacking. Prior longitudinal studiesssessing HRQoL among out-of-treatment illicit drug users foundittle evidence of improvement or deterioration. In a longitudi-al study of out-of treatment crack cocaine users, frequency ofse was negatively associated with physical functioning, socialunctioning and mental health; however changes in HRQoLere uncommon over the study’s 2-year follow-up period (Falck
t al., 2000). Another study reported HRQoL improvements in cohort of drug users over time, however only in Short-FormF-36 mental component scores. In this study, transitioningut of homelessness was identified as a key determinant ofmprovement in mental health status (Kertesz et al., 2005).he effect of drug treatment was not assessed in either study,nd may improve patients’ HRQoL regardless of baseline healthtatus.
Further, individuals’ HRQoL may follow heterogeneous trajec-ories over the course of treatment. Latent class growth analysisLCGA) is an emerging statistical technique designed to elucidateifferences in longitudinal outcome profiles among individualsMuthen and Muthen, 2000). Rather than assuming all individualsre drawn from a single homogeneous population, LCGA assumeshat each individual may be regarded as a sample from one of annknown, or hypothesized number of latent classes (Cameron andrivedi, 2005).
We assess HRQoL trajectories of individuals enrolled in theorth American Opiate Medication Initiative (NAOMI) randomizedontrolled trial to identify the heterogeneous classes of individualsnd the common and discordant characteristics between groups, asell as factors associated with HRQoL changes (both positive andegative) to provide evidence for targeted interventions to improve
ndividuals’ HRQoL during OST.
. Methods
.1. Study sample
The North American Opiate Medication Initiative (NAOMI) randomized con-rolled trial compared injectable diacetylmorphine (injected heroin) to optimized
ethadone maintenance (oral) for those with long-standing opioid dependence.ubjects were recruited from Vancouver, British Columbia, and Montreal, Quebec,anada between March 2005 and June 2007. Trial eligibility criteria included Opi-id Dependence by DSM-IV criteria, a minimum age of 25 years, 5 years of opioidse and one year of residence in site/city location, regular opioid injection, two pre-ious opiate addiction treatment attempts, but no enrolment in OST in the past 6onths and written and informed consent. Exclusion criteria included pregnancy,
evere medical or psychiatric conditions that are contraindicated for OST, justice sys-em involvement likely to result in extended incarceration, serum bilirubin > 2.5×ormal, stage II or greater hepatic encephalopathy or severe chronic respiratoryisease.
The study recruited 251 subjects and had a 95.6% follow-up rate on an ‘intento treat’ basis through four quarterly follow-up interviews up to the 12-month trialndpoint (maximum 5 assessments per individual). Participants had a mean age of0 years, 39% were female and over 53% had a chronic medical condition. Stableousing (residence in a house or apartment) was uncommon (27%), and the cohortsed cocaine an average of 16 of the past 30 days at baseline. Further details of trialethodology (Oviedo-Joekes et al., 2009a), baseline patient characteristics (Oviedo-
oekes et al., 2008) and results (Oviedo-Joekes et al., 2009b) are described at lengthlsewhere.
.2. Study design
We aimed to conduct a longitudinal analysis of HRQoL data collected amongll participants enrolled in the NAOMI study. HRQoL growth trajectories over the2-month study period, baseline covariates associated with growth trajectory classnd time-varying covariates associated with HRQoL changes were identified to pro-ide a comprehensive assessment of the HRQoL of opioid dependent individuals in
reatment. Analyses on HRQoL growth trajectories were conducted on individualshile enrolled in treatment (N = 997 assessments; average of 4 assessments per indi-idual), while analyses identifying factors associated with changes in HRQoL wereonducted on all follow-up data up to the 12 month endpoint (N = 1191 assessments,verage of 4.75 assessments per individual).
endence 118 (2011) 259– 264
2.2.1. Dependent variable. Our primary outcome was patients’ self-reported HRQoL,measured by the Euroqol EQ-5D index score at quarterly follow-up intervals. TheEQ-5D index score is a generic HRQoL measurement tool where respondents choose1 of 3 descriptors of severity (level of difficulty in functioning or degree of sever-ity of impairment in functioning) in 5 items representing domains of health status(mobility, personal care, usual activities, pain/discomfort, and anxiety/depression)(Euroqol Group, 1990; Brooks, 1996). Item responses are assigned preferenceweights for the range of 35 = 243 possible health states on the stated scale, result-ing in an overall index score on a scale of −0.11 (worse than death) to 1 (perfecthealth) measure (Coons et al., 2000; Brazier et al., 2004). This index score is con-sidered a measure of indirect utility, as methods used to derive societal preferenceweights are grounded in expected utility theory. One such method is time trade-off, in which respondents are asked to choose between remaining in a state of illhealth for a period of time, or being restored to perfect health but having a shorterlife expectancy. Empirically derived societal preference weights for the EQ-5D usedin this study were generated from a representative US general population sampleusing the time trade-off method to provide valuations for all possible EQ-5D healthstates (Shaw et al., 2005). The index score thus represents the value of the person’shealth status as perceived by the general population. Measures of indirect utilitycan be summed over time to calculate quality-adjusted life years (QALYs), used incost-utility analyses. A more in-depth discussion of the theoretical foundations ofindirect utility measures can be found in Torrance (1976).
Minimally important differences (MID) are considered an important means ofinterpreting and identifying clinically important changes in health related qual-ity of life (HRQoL) and other patient-related outcome scores (US Food and DrugAdministration, 2009). A recent study using a one-level difference in a single itemresponse (i.e. an increment of on level of severity in one of the five domains of theEQ-5D) as an anchor to identify the smallest important increment in health foundthe minimally important difference for the EQ-5D to be 0.04 (Luo et al., 2010). Fur-ther, the EQ-5D has been shown to have good concurrent and discriminant validityin populations of opioid-dependent patients (van der Zanden et al., 2006). A priorstudy on this study sample showed that the EQ-5D index score was responsive todecreases in illicit drug use, and outperformed the SF-6D index score in this regard(Nosyk et al., 2010).
2.2.2. Independent variables. Prior cross-sectional and longitudinal studiesinformed selection of baseline and longitudinal determinants of HRQoL amongopioid-dependent individuals (Millson et al., 2006; Astals et al., 2008; Puigdollerset al., 2004; Falck et al., 2000; Kertesz et al., 2005). Baseline characteristicsincluded age, gender, study site (Vancouver or Montreal) presence of a chronicmedical condition (physical or psychological-dichotomous), HIV or hepatitis Cinfection, treatment allocation, number of prior treatment attempts, current (daysin the past 30 – continuous and categorical) and lifetime years of cocaine use(continuous). Time-varying covariates, used to identify correlates of changes inHRQoL, included stable housing status, medical events (inpatient care, emergencyroom visits and drug overdoses), psychiatric events (in/outpatient psychiatriccare or suicide attempts) and treatment adherence (days in treatment – past 30;continuous and categorical). Decreases in illicit drug use were captured with theEuropean Addiction Severity Index (ASI) (Kokkevi and Hartgers, 1995) drug usecomposite score. This index score incorporates illicit drug use from 10 differentillicit drug classifications (illicit heroin, illicit methadone, cocaine and cannabisindividually, and the combined average of nonmedical use of other opiates,benzodiazepines/barbiturates, amphetamines, inhalants, hallucinogens and otherdrugs), multiple drug use, injection drug use, expenditure on drugs and subjectivebeliefs of the severity of their drug use over a 30-day time horizon. Item responseswere equally weighted to derive composite scores ranging from 0 (least) to 1(greatest severity) on a continuous scale.
2.3. Data analysis
To fulfill the study’s objectives, the statistical analysis proceeds in three steps:first, we used linear and latent class growth models to disaggregate individuals intoHRQoL trajectory classes while in treatment (LCGA) and quantify these trajectories(linear growth model with and without trajectory class as a covariate). Next, weidentified baseline patient characteristics associated with trajectory class member-ship. Finally, time-varying factors independently associated with changes in HRQoLwere identified.
2.3.1. Growth trajectory modeling. First, an individual growth model with subject-level random effect terms on the intercept and slope variables was fitted with linearand quadratic time trends to describe the overall trajectory of HRQoL (Raudenbuschand Bryk, 2002). Second, semi-parametric group-based LCGA was used to identifymajor classes of HRQoL trajectories among individuals while retained in treatment(Nagin, 1999; Jones et al., 2001). We applied a censored normal model to HRQoL datawith censorship point = 1 as the EQ-5D is bounded at 1 and 13.9% (N = 35) patients
achieved the maximum score at baseline (Jones et al., 2001; Grootendorst, 2000;Austin, 2002; Seymour et al., 2010). As we had no a priori hypotheses regarding thenumber of sub-populations of HRQoL growth trajectories or their shape, we consid-ered models with up to four underlying latent classes, and up to a cubic polynomialfunction for each class. Model selection was based on the Bayesian Information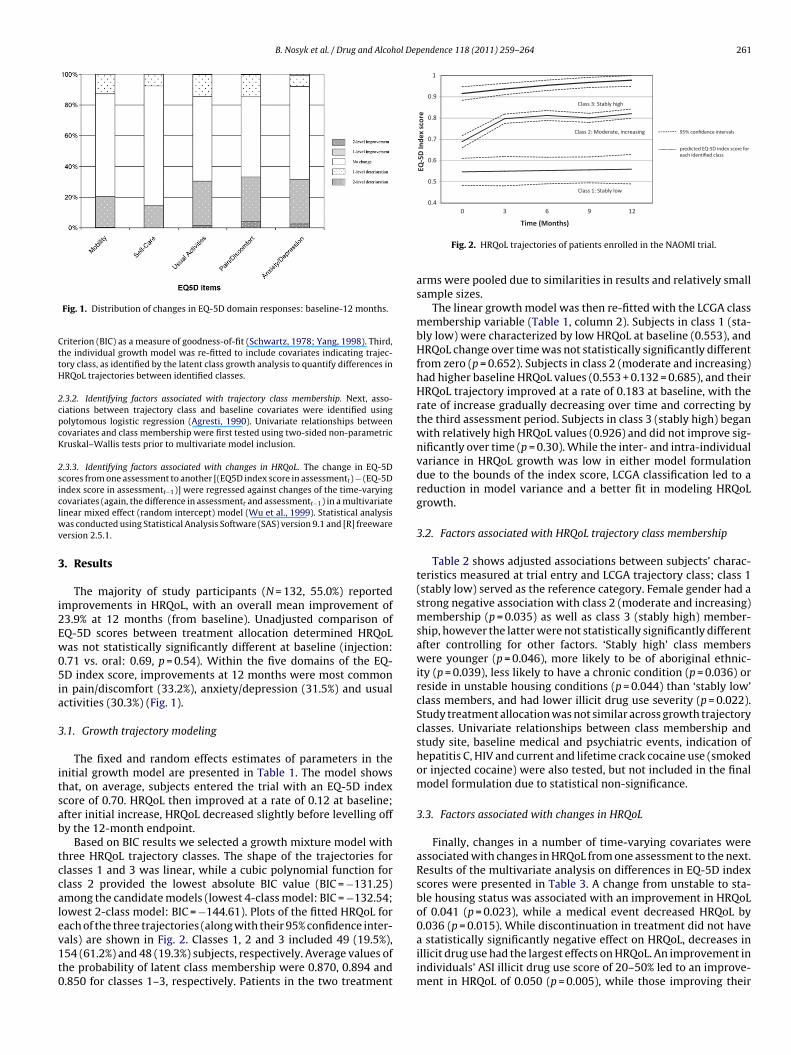
B. Nosyk et al. / Drug and Alcohol Dependence 118 (2011) 259– 264 261
CttH
2cpcK
2siclwv
3
i2Ew05ia
3
itsab
tccalev1t0
0.4
0.5
0.6
0.7
0.8
0.9
1
129630
EQ-5
D In
dex
scor
e
Class 1: Stably low
Class 2: Moderate, increasin g
Class 3: Stably high
predicted EQ-5D index score for each identified class
95% confidence intervals
Fig. 1. Distribution of changes in EQ-5D domain responses: baseline-12 months.
riterion (BIC) as a measure of goodness-of-fit (Schwartz, 1978; Yang, 1998). Third,he individual growth model was re-fitted to include covariates indicating trajec-ory class, as identified by the latent class growth analysis to quantify differences inRQoL trajectories between identified classes.
.3.2. Identifying factors associated with trajectory class membership. Next, asso-iations between trajectory class and baseline covariates were identified usingolytomous logistic regression (Agresti, 1990). Univariate relationships betweenovariates and class membership were first tested using two-sided non-parametricruskal–Wallis tests prior to multivariate model inclusion.
.3.3. Identifying factors associated with changes in HRQoL. The change in EQ-5Dcores from one assessment to another [(EQ5D index score in assessmentt) − (EQ-5Dndex score in assessmentt−1)] were regressed against changes of the time-varyingovariates (again, the difference in assessmentt and assessmentt−1) in a multivariateinear mixed effect (random intercept) model (Wu et al., 1999). Statistical analysis
as conducted using Statistical Analysis Software (SAS) version 9.1 and [R] freewareersion 2.5.1.
. Results
The majority of study participants (N = 132, 55.0%) reportedmprovements in HRQoL, with an overall mean improvement of3.9% at 12 months (from baseline). Unadjusted comparison ofQ-5D scores between treatment allocation determined HRQoLas not statistically significantly different at baseline (injection:
.71 vs. oral: 0.69, p = 0.54). Within the five domains of the EQ-D index score, improvements at 12 months were most common
n pain/discomfort (33.2%), anxiety/depression (31.5%) and usualctivities (30.3%) (Fig. 1).
.1. Growth trajectory modeling
The fixed and random effects estimates of parameters in thenitial growth model are presented in Table 1. The model showshat, on average, subjects entered the trial with an EQ-5D indexcore of 0.70. HRQoL then improved at a rate of 0.12 at baseline;fter initial increase, HRQoL decreased slightly before levelling offy the 12-month endpoint.
Based on BIC results we selected a growth mixture model withhree HRQoL trajectory classes. The shape of the trajectories forlasses 1 and 3 was linear, while a cubic polynomial function forlass 2 provided the lowest absolute BIC value (BIC = −131.25)mong the candidate models (lowest 4-class model: BIC = −132.54;owest 2-class model: BIC = −144.61). Plots of the fitted HRQoL forach of the three trajectories (along with their 95% confidence inter-
als) are shown in Fig. 2. Classes 1, 2 and 3 included 49 (19.5%),54 (61.2%) and 48 (19.3%) subjects, respectively. Average values ofhe probability of latent class membership were 0.870, 0.894 and.850 for classes 1–3, respectively. Patients in the two treatmentTime (Months)
Fig. 2. HRQoL trajectories of patients enrolled in the NAOMI trial.
arms were pooled due to similarities in results and relatively smallsample sizes.
The linear growth model was then re-fitted with the LCGA classmembership variable (Table 1, column 2). Subjects in class 1 (sta-bly low) were characterized by low HRQoL at baseline (0.553), andHRQoL change over time was not statistically significantly differentfrom zero (p = 0.652). Subjects in class 2 (moderate and increasing)had higher baseline HRQoL values (0.553 + 0.132 = 0.685), and theirHRQoL trajectory improved at a rate of 0.183 at baseline, with therate of increase gradually decreasing over time and correcting bythe third assessment period. Subjects in class 3 (stably high) beganwith relatively high HRQoL values (0.926) and did not improve sig-nificantly over time (p = 0.30). While the inter- and intra-individualvariance in HRQoL growth was low in either model formulationdue to the bounds of the index score, LCGA classification led to areduction in model variance and a better fit in modeling HRQoLgrowth.
3.2. Factors associated with HRQoL trajectory class membership
Table 2 shows adjusted associations between subjects’ charac-teristics measured at trial entry and LCGA trajectory class; class 1(stably low) served as the reference category. Female gender had astrong negative association with class 2 (moderate and increasing)membership (p = 0.035) as well as class 3 (stably high) member-ship, however the latter were not statistically significantly differentafter controlling for other factors. ‘Stably high’ class memberswere younger (p = 0.046), more likely to be of aboriginal ethnic-ity (p = 0.039), less likely to have a chronic condition (p = 0.036) orreside in unstable housing conditions (p = 0.044) than ‘stably low’class members, and had lower illicit drug use severity (p = 0.022).Study treatment allocation was not similar across growth trajectoryclasses. Univariate relationships between class membership andstudy site, baseline medical and psychiatric events, indication ofhepatitis C, HIV and current and lifetime crack cocaine use (smokedor injected cocaine) were also tested, but not included in the finalmodel formulation due to statistical non-significance.
3.3. Factors associated with changes in HRQoL
Finally, changes in a number of time-varying covariates wereassociated with changes in HRQoL from one assessment to the next.Results of the multivariate analysis on differences in EQ-5D indexscores were presented in Table 3. A change from unstable to sta-ble housing status was associated with an improvement in HRQoLof 0.041 (p = 0.023), while a medical event decreased HRQoL by0.036 (p = 0.015). While discontinuation in treatment did not have
a statistically significantly negative effect on HRQoL, decreases inillicit drug use had the largest effects on HRQoL. An improvement inindividuals’ ASI illicit drug use score of 20–50% led to an improve-ment in HRQoL of 0.050 (p = 0.005), while those improving their
262 B. Nosyk et al. / Drug and Alcohol Dependence 118 (2011) 259– 264
Table 1Parameter estimates for fixed and random effects components growth curve analysis before and after inclusion of latent class membership variables.
Parameter Linear growth model Linear growth model with LCGA class variables
Estimate (SE) p-Value Estimate (SE) p-Value
Fixed effectsIntercept 0.704 (0.012) <0.001 0.553 (0.022) <0.001Timea 0.116 (0.026) <0.001 −0.027 (0.059) 0.652Time2 −0.053 (0.017) <0.001 0.004 (0.038) 0.911Time3 0.008 (0.003) <0.001Trajectory class 1: stably low – – (Ref)Trajectory class 2: moderate and increasing – – 0.132 (0.025) <0.001Trajectory class 3: stably high – – 0.374 (0.032) <0.001Time × trajectory class 1 – – (Ref)Time × trajectory class 2 – – 0.210 (0.067) 0.001Time × trajectory class 3 – – 0.048 (0.084) 0.568Time2 × trajectory class 1 – – (Ref)Time2 × trajectory class 2 – – −0.085 (0.043) 0.050Time2 × trajectory class 3 – – −0.009 (0.054) 0.864Time3 × trajectory class 1 – – (Ref)Time3 × trajectory class 2 – – 0.010 (0.007) 0.151Time3 × trajectory class 3 – – 0.000 (0.009) 0.996
SE, standard error.a Units for time: 3-month intervals from trial entry.
Table 2Adjusted associations of patient characteristics measured at trial entry with HRQoL trajectory classes.
Moderately increasing vs. stably low Stably high vs. stably low
OR 95% C.I. p-Value OR 95% C.I. p-Value
Age 0.965 0.927 1.004 0.075 0.946 0.896 0.999 0.046Gender
MaleFemale 0.493 0.256 0.952 0.035 0.404 0.160 1.017 0.054
EthnicityNon-aboriginalAboriginal 1.392 0.621 3.120 0.422 3.020 1.057 8.632 0.039
Chronic medical conditiona
NoYes 1.112 0.571 2.167 0.755 0.395 0.165 0.943 0.036
ASI Drug composite score 0.989 0.965 1.013 0.358 0.962 0.930 0.994 0.022Housing stability
StableUnstable 0.551 0.274 1.106 0.094 0.377 0.146 0.975 0.044
Treatment allocationOralInjection 1.275 0.675 2.407 0.454 1.500 0.623 3.612 0.366
Polytomous logistic regression analysis using class 1 (stably low) as the reference categora Physical or psychological chronic medical condition.
Table 3Factors associated with changes in EQ-5D index scores.
Covariatesa ˇb 95% CI p-Value
Intercept −0.002 (−0.026, 0.022) 0.876Housing status 0.041 (0.006, 0.076) 0.023Medical event −0.036 (−0.065, −0.007) 0.015Psychiatric event −0.011 (−0.055, 0.032) 0.626Treatment discontinuation −0.020 (−0.053, 0.013) 0.249Decrease in illicit drug use
<20% (Ref)20–50% 0.050 (0.014, 0.085) 0.005>50% 0.055 (0.022, 0.088) 0.002
Treatment allocationOral (Ref)Injection 0.005 (−0.022, 0.032) 0.750
ˇ: regression coefficient; 95% CI: 95% confidence interval.a All covariates aside from treatment allocation are the change in the status of the
covariate from time period t − 1 to t.b Interpretation of regression coefficients: all covariates dichotomous; e.g. a
change in housing status (unstable to stably housed) leads to an EQ-5D index scoreimprovement of 0.041, controlling for all other factors.
y. OR: odds ratio; CI: confidence interval.
illicit drug use composite scores greater than 50% experienced anHRQoL improvement of 0.055 (p = 0.002). Finally, changes in HRQoLamong patients in the injection and oral treatment arms were notstatistically significantly different (p = 0.750).
4. Discussion
In this study, we sought to identify longitudinal trajectories ofHRQoL improvement among chronic opioid dependent patientsin OST, predictors of trajectory class and factors associated withchanges in HRQoL. The primary finding of the study was that HRQoLcould, in fact, be improved through effective treatment whichdecreases individuals’ illicit drug use, with 55% of patients reportinghigher EQ-5D index scores during study follow-up than at baseline.
Improvements were most common in the ‘pain/discomfort’,‘anxiety/depression’ and ‘usual activities’ domains. This may beinterpreted as indicating decreased pain or discomfort as a result
of opiate withdrawal and potentially other conditions addressedduring treatment, lower anxiety and depression from the demandsof daily drug acquisition and a subsequent return to usual activitiesin absence of these demands.
ol Dep
fiatcpsTembTah
parodmismifdcswihnr
dlthsoiC2rm2
aodwtttr(strbtttwf
B. Nosyk et al. / Drug and Alcoh
Three latent classes of HRQoL growth trajectories were identi-ed, grouping patients with stably low, moderate and increasing,nd stably high HRQoL. The majority of study participants fell inhe moderate and increasing class, where improvements were oflinical as well as statistical significance, being greater than thereviously stated MID of 0.04. It is of concern that patients in thetably low HRQoL class (class 1) did not improve as a result of OST.hese patients were more likely to be females than class 2 (mod-rate and increasing) members, had higher drug use severity, wereore likely to have a chronic medical condition and reside in unsta-
le housing conditions than class 3 (stably high HRQoL) members.argeted interventions, ensuring requisite ancillary medical carend the potential to access stabilized housing may be required toelp low-HRQoL patients realize health benefits from treatment.
While retention in treatment at 12 months is a commonly usedrimary outcome measure in phase-III clinical trials in substancebuse, we found that decreases in illicit drug use, rather thanetention in treatment, had a large and clinically significant effectn self-reported HRQoL. This finding provides further support forecreases in illicit drug use (ideally confirmed by urinalysis) as theost relevant primary outcome measure in experimental studies
n OST. The positive and clinically significant effect of transition totable housing was supported by Kertesz et al. (2005). While bothedical and psychiatric events had a negative impact on changes
n HRQoL, only the former was statistically significantly differentrom zero. These findings can be attributed to their lower inci-ence during follow-up and high psychiatric severity among studylients reported at baseline (Oviedo-Joekes et al., 2008). Finally, thekewed distribution of females in the lower trajectory class is note-orthy, however the absence of an indicator of lifetime sex work
nvolvement, as well as other gender-specific measures which mayelp explain this finding, leave the investigation into the determi-ants of low HRQoL in opioid dependent females a topic for furtheresearch.
Our findings indicating improvements in HRQoL among opioid-ependent patients in treatment are sparsely supported in the
iterature thus far. One study comparing patients responsive toreatment to non-responders found no differences in changes inealth status using the ASI medical and psychiatric compositecores (Belding et al., 1998). Another large observational studyf patients entering OST reported no significant improvementsn mental health and ‘quality of life’, measured within the WHOomposite International Diagnostic Interview (Wittchen et al.,008). Other trials of injectable diacetylmorphine, which may haveecruited subjects already in treatment, reported modest improve-ent in HRQoL during treatment (March et al., 2006; Dijkgraaf et al.,
005).We believe this contrast in results may have been observed for
t least four reasons. The first was the analytic approach chosen inur analysis. Presentation of overall trends in HRQoL may obscureistinctions between improving and non-improving patients, ase have uncovered. Second, the contrast may have been due
o differences in the conceptual content and responsiveness ofhe measures employed. Accumulated evidence on the validity ofhe ASI Medical and Psychiatric composite scores was questionedecently, while responsiveness had not previously been testedMakela, 2004); evidence of the latter is largely absent in healthtatus measurement of illicit drug users (Nosyk et al., 2010). Fur-her, the EQ-5D is based on physical, mental and social functioning,ather than ‘general health perceptions’ or other concepts coveredy comparative instruments (Nosyk et al., 2010). Third, the charac-eristics of the patient population assessed in this study were unlike
hose assessed previously. Trial inclusion criteria likely led to selec-ion of lower-HRQoL individuals for whom HRQoL improvementas plausible. Finally, treatment modality and service delivery dif-ered from prior studies assessing HRQoL during substance abuse
endence 118 (2011) 259– 264 263
treatment. Treatment in NAOMI was optimized in keeping withHealth Canada Best Practices (2005). Higher doses of methadonewere delivered to clients (average dose = 96 mg pd) compared tothose receiving treatment at the population level (Oviedo-Joekeset al., 2009a; Nosyk et al., 2009), and efforts were made to linkpatients with psychosocial care and medical or psychiatric treat-ment where possible.
Our study was not without limitations. First, while a relativelysmall proportion of study participants were lost to follow-up, insome cases these losses were informative. Mixed effects regressionmodels do not require the assumption that observations were miss-ing completely at random and control for the effect of unmeasuredsubject-level heterogeneity. They are therefore recommended toprovide unbiased coefficient estimates in analyzing longitudinalHRQoL data with missing observations (Fairclough et al., 2008). Fur-ther, we relied on self-reported measures of drug use, which maybe subject to underreporting; however random urine tests admin-istered at the treatment clinic supported self-reported heroin use(Oviedo-Joekes et al., 2009a). Finally, as noted previously, NAOMIparticipants were selected based on the chronic nature of theirdrug abuse and unsuccessful prior treatment attempts and thusmay not be representative of broader populations of individualsentering OST (Oviedo-Joekes et al., 2008). Results of LCGA analysesmay be sample-specific; further analyses in disparate study popula-tions are required to verify or modify this initial evidence on HRQoLgrowth trajectories of opioid dependent individuals in treatment.
Insight into the extent of response to treatment and the typesof patients that respond can be used to design interventions thatcan maximize HRQoL improvements. Furthermore, this study hasdemonstrated that HRQoL among chronic, treatment resistant opi-oid dependent patients can be meaningfully improved througheffective, patient-centered treatment. Given its suitably as a healthoutcome measure in opioid dependent individuals and its rolein cost-effectiveness analysis and subsequent resource allocationdecisions, HRQoL should be considered an endpoint in evaluationsof treatment for opioid dependence and other forms of substanceabuse treatment.
Role of funding source: CIHR played no role in the developmentor decision to submit this manuscript for publication.
Contributors: BN lead the design of the manuscript, executedstatistical analysis and lead manuscript preparation; DG and HSprovided guidance for the development of the statistical analy-sis and manuscript preparation and approved the final draft forsubmission; EOJ provided support for the design of the study andmanuscript preparation and approved the final draft; SB, DCM, MTSand AHA lead the design of the NAOMI study and data collection,contributed to the design of the study and approved the final draft.
Conflict of interest: No conflict declared.
Acknowledgements
The NAOMI study is funded by the Canadian Institutes of HealthResearch (CIHR). Bohdan Nosyk was supported by doctoral researchawards from the Michael Smith Foundation for Health Research, theCanadian Institutes of Health Research, and the Research in Addic-tions and Mental Health Policy & Services CIHR strategic traininginitiative. Dr Schechter is a tier I Canada Research Chair.
References
Agresti, A., 1990. Categorical Data Analysis. Wiley, New York (NY).Amato, L., Davoli, M., Perucci, C.A., Ferri, M., Faggiano, F., Mattick, R.P., 2005. An
overview of systematic reviews of the effectiveness of opiate maintenance ther-apies: available evidence to inform clinical practice and research. J. Subst. AbuseTreat. 28, 321–329.
Astals, M., Domingo-Salvany, A., Buenaventura, C.C., Tato, J., Vazquez, J.M., Martín-Santos, R., Torrens, M., 2008. Impact of substance dependence and dual diagnosis
2 ol Dep
A
B
B
BC
C
D
E
F
F
G
G
H
J
K
K
L
M
M
M
M
N
64 B. Nosyk et al. / Drug and Alcoh
on the quality of life of heroin users seeking treatment. Subst. Use Misuse 43,612–632.
ustin, P.C., 2002. A comparison of methods for analyzing health-related quality-of-life measures. Value Health 5, 329–337.
elding, M.A., McLellan, A.T., Zanis, D.A., Incmikoski, R., 1998. Characterizing “non-responsive” methadone patients. J. Subst. Abuse Treat., 485–492.
razier, J., Roberts, J., Tsuchiya, A., Busschbach, J., 2004. A comparison of the EQ-5Dand SF-6D across seven patient groups. Health Econ. 13, 873–884.
rooks, R., 1996. EuroQol: the current state of play. Health Policy 37, 53–72.ameron, A.C., Trivedi, P.K., 2005. Microeconometrics: Methods and Applications.
Cambridge University Press, New York (NY).oons, S.J., Rao, S., Keininger, D.L., Hays, R.D., 2000. A comparative review of generic
quality of life instruments. Pharmacoeconomics 17, 13–35.ijkgraaf, M.G.W., van der Zanden, B.P., de Borgie, C.A.J.M., Blanken, P., van Ree, J.M.,
van den Brink, W., 2005. Cost utility analysis of co-prescribed heroin comparedwith methadone maintenance treatment in heroin addicts in two randomizedtrials. BMJ 330, 1297–1302.
uroqol Group, 1990. Euroqol—a new facility for the measurement of health-relatedquality of life. Health Policy 16, 199–208.
alck, R.S., Wang, J., Siegal, H.A., Carlson, R.G., 2000. Longitudinal application ofthe Medical Outcomes Study 36-item Short Form Health Survey with not-in-treatment crack cocaine users. Med. Care 38, 902–910.
airclough, D.L., Thijs, H., Huang, I.-C., Finnern, H.W., Wu, A.W., 2008. Handling miss-ing quality of life data in HIV clinical trials what is practical? Qual. Life Res. 17,61–73.
iacomuzzi, S.M., Riemer, Y., Ertl, M., Kemmler, G., Rossler, H., Hinterhuber, H.,Kurz, M., 2003. Buprenorphine versus methadone maintenance treatment inan ambulant setting: a health-related quality of life assessment. Addiction 98,693–702.
rootendorst, P., 2000. Censoring in statistical models of health status: what hap-pens when one can do better than ‘1’. Qual. Life Res. 9, 911–914.
ealth Canada, 2005. Best Practices, Methadone Maintenance Treatment.,http://www.hc-sc.gc.ca/hc-ps/pubs/adp-apd/methadone-bp-mp/index-eng.php [accessed June 1, 2009].
ones, B.L., Nagin, D.S., Roeder, K., 2001. A SAS procedure based on mixture modelsfor estimating developmental trajectories. Soc. Methods Res. 29, 374–393.
ertesz, S.G., Larson, M.J., Horton, N.J., Winter, M., Saitz, R., Samet, J.H., 2005. Home-less chronicity and health-related quality of life trajectories among adults withaddictions. Med. Care 43, 574–585.
okkevi, A., Hartgers, C., 1995. EuropASI: European adaptation of a multidimensionalassessment instrument for drug and alcohol dependence. Eur. Addict. Res. 1,208–210.
uo, N., Johnson, J., Coons, S.J., 2010. Using instrument-defined health state tran-sitions to estimate minimally important differences for four preference-basedhealth-related quality of life instruments. Med. Care 48, 365–371.
akela, K., 2004. Studies of the reliability and validity of the addiction severity index.Addiction 9, 398–410 (discussion 411–418).
arch, J.C., Oviedo-Joekes, E., Perea-Milla, E., Carrasco, F., PEPSA team, 2006. Con-trolled trial of prescribed heroin in the treatment of opioid addiction. J. Subst.Abuse Treat. 1, 203–211.
illson, P., Challacombe, L., Villeneuve, P.J., Strike, C.J., Fischer, B., Myers, T., Shore, R.,Hopkins, S., 2006. Determinants of health-related quality of life of opiate usersat entry to low-threshold methadone programs. Eur. Addict. Res. 12, 74–82.
uthen, B., Muthen, L.K., 2000. Integrating person-centered and variable-centeredanalysis: growth mixture modeling with latent trajectory classes. Alcohol. Clin.Exp. Res. 24, 882–891.
agin, D.S., 1999. Analyzing developmental trajectories: a semi-parametric, group-based approach. Psychol. Methods 4, 139–157.
endence 118 (2011) 259– 264
National Consensus Development Panel on Effective Medical Treatment of OpiateAddiction, 1998. Effective medical treatment of opiate addiction. JAMA 280,1936–1943.
Nosyk, B., MacNab, Y.C., Sun, H., Marsh, D.C., Fischer, B., Schechter, M.T., Anis, A.H.,2009. Proportional hazards frailty models for recurrent methadone maintenancetreatment. Am. J. Epidemiol. 170, 783–792.
Nosyk, B., Sun, H., Guh, D., Oviedo-Joekes, E., Marsh, D.C., Brissette, S., Schechter,M.T., Anis, A.H., 2010. An empirical comparison of eight health status measuresfor chronic opioid dependence. J. Clin. Epidemiol. 63, 1132–1144.
Oviedo-Joekes, E., Brissette, S., Marsh, D.C., Lauzon, P., Guh, D., Anis, A., Schechter,M.T., 2009a. A randomized trial of diacetylmorphine vs. methadone fortreatment-refractory opioid addiction. N. Engl. J. Med. 361, 777–786.
Oviedo-Joekes, E., Nosyk, B., Brissette, S., Chettiar, J., Schneeberger, P., Marsh, D.C.,Krausz, M., Anis, A., Schechter, M.T., 2008. The North American Opiate Medica-tion Initiative (NAOMI): profile of participants in North America’s first trial ofheroin-assisted treatment. J. Urban Health 85, 812–825.
Oviedo-Joekes, E., Nosyk, B., Marsh, D.C., Guh, D., Brissette, S., Gartry, C., Krausz,M., Anis, A., Schechter, M.T., 2009b. Scientific and political challenges in NorthAmerica’s first randomized controlled trial of heroin-assisted treatment forsevere heroin addiction: rationale and design of the NAOMI study. Clin. Trials 6,261–271.
Ponizovsky, A.M., Grinshpoon, A., 2007. Quality of life among heroin users onbuprenorphine versus methadone maintenance. Am. J. Drug Alcohol Abuse 33,631–642.
Puigdollers, E., Domingo-Salvany, A., Brugal, M.T., Torrens, M., Alvarós, J., Castillo,C., Magrí, N., Martín, S., Vázquez, J.M., 2004. Characteristics of heroin addictsentering methadone maintenance treatment: quality of life and gender. Subst.Use Misuse 39, 1353–1368.
Raudenbusch, S.W., Bryk, A.S., 2002. Hierarchical Linear Models: Applications andData Analysis Methods. Sage Publications, Thousand Oaks (CA).
Schwartz, G., 1978. Estimating the dimension of a model. Ann. Stat. 6, 461–464.Seymour, J., McNamee, P., Scott, A., Tinelli, M., 2010. Shedding new light onto the
ceiling and floor? A quantile regression approach to compare EQ-5D and SF-6Dresponses. Health Econ. 19, 683–696.
Shaw, J.W., Johnson, J.A., Coons, S.J., 2005. US valuation of the EQ-5D health states:are the US and UK different? Med. Care 43, 221–228.
Torrance, G.W., 1976. Toward a utility theory foundation for health status indexmodels. Health Serv. Res. 1, 349–369.
US Food and Drug Administration, 2009. Guidance for Industry: Patient-ReportedOutcome Measures: Use in Medical Product Development to SupportLabeling Claims, February, Available at: http://www.fda.gov/downloads/Drugs/GuidanceComplianceRegulatoryInformation/Guidances/UCM193282.pdf[accessed February 24, 2011].
van der Zanden, B.P., Dijkgraaf, M.G., Blanken, P., de Borgie, C.A., van Ree, J.M., van denBrink, W., 2006. Validity of the EQ-5D as a generic health outcome instrumentin a heroin-dependent population. Drug Alcohol Depend. 82, 111–118.
Winklbaur, B., Jagsch, R., Ebner, N., Thau, K., Fischer, G., 2008. Quality of life inpatients receiving opioid maintenance therapy. Eur. Addict. Res. 14, 99–105.
Wittchen, H.U., Apelt, S.M., Soyka, M., Gastpar, M., Backmund, M., Gölz, J., Kraus, M.R.,Tretter, F., Schäfer, M., Siegert, J., Scherbaum, N., Rehm, J., Bühringer, G., 2008.Feasibility and outcome of substitution treatment of heroin-dependent patientsin specialized substitution centers and primary care facilities in Germany: anaturalistic study in 2694 patients. Drug Alcohol Depend. 95, 245–257.
Wu, A.W., Gray, S.M., Brookmeyer, R., 1999. Application of random effects modelsand other methods to the analysis of multidimensional quality of life data in anAIDS clinical trial. Med. Care 37, 249–258.
Yang, C., 1998. Finite Mixture Model Selection with Psychometric Applications. Uni-versity of California, Los Angeles, Los Angeles, CA.
Top Related
Copyright © 2022 FDOKUMEN

