


Bahasa
Halaman
Hukum


(A Govt. of Maharashtra Enterprise Under Ministry of Environment)
FFIINNAALL RREEPPOORRTT
CCoommpprreehheennssiivvee SSttuuddyy oonn PPoolllluutteedd RRiivveerr SSttrreettcchheess
AAnndd PPrreeppaarraattiioonn ooff AAccttiioonn PPllaann ooff
RRiivveerr GGiirrnnaa ffrroomm MMaalleeggaaoonn ttoo JJaallggaaoonn
CCOONNSSUULLTTAANNTT
UUJJWWAALL PPAATTIILL
19, Siddivinayak Colony, Near Tulshiram Nagar,
Deopur, Dhule - 424002
Mobile : 9423007455, Email: [email protected]

INDEX
Chapter
No.
Chapter Name Page
Nos.
I INTRODUCTION 1-11
II INTRODUCTION OF MAJOR CITIES 12-37
III HYDROCHEMISTRY 38-61
IV CONCLUSION, RECOMMENDATIONS AND
ACTION PLAN
62-71
PHOTO PLATES 72-73

1
CHAPTER-I
INTRODUCTION
Water is the gift of nature making life possible on our planet. It is variable in
quality and availability, and fluctuates from season to season and from year to year.
Its availability is largely dictated by climate.
India is blessed with abundant water resources, which are unevenly distributed
in space and time. When one part of the country is reeling under severe water scarcity
whereas, floods damage in another part. This creates economic losses as some parts of
the country do not have enough water even for raising a single crop and in other parts
excess rainfall plays havoc due to floods. Moreover demand for water is ever
increasing with the increase in population and water is likely to become one of the
limiting resources as well as one with multiple uses.
The Girna river originates at Kem Peak in the Western Ghats range of Nashik
District, and flows east across Nashik District and is joined by the Mausam River and
then east into Jalgaon District where it then swings north to join the Tapti River. The
dams on the Girna are Chanakapur Dam and Girna Dam. Girna Dam was built in
1969. The name Girna derives from the name of the goddess Giraja (Parvati). The
basin of the Girna lies on the Deccan Plateau, and its valley has fertile soils which are
intensively farmed.
The Gazetteer of the Bombay presidency describes the river as... "Rising in the
western hills of the Kalvan sub-division of Nasik, and fed by streams from the
northern slopes of the Chandor or Saptashring range, after a course of about 150
miles, falls into the Tapti near Nander. Its course lies in nearly equal parts in Nasik
and Khandesh. Passing through Nasik almost in a straight line eastwards, in Khandesh
its course changes to north-east, till, near Jalgaon, it bends north and then north-west
flowing for several miles with many windings almost parallel to the Tapti. In
Khandesh, except in one or two places where it is hemmed in by rocky hills, the
Girna, over a broad sandy bed, flows through a well tilled valley gradually spreading
into the great central plain. Its waters, both in Nasik and Khandesh, are much used for
irrigation.

2
Status of Wastewater Generation and Treatment in India (by- R.M.Bhardwaj)
The Central Pollution Control Board carried out studies to assess the status of
wastewater generation and treatment in Class I cities (population > 100,000) and
Class II towns (population between 50,000 and 100,000) during 1978-79, 1989-90,
1994-95 and 2003-04. The latest study indicates that about 26 254 million litres per
day (Ml/d) of wastewater are generated in the 921 Class I cities and Class II towns in
India (housing more than 70% of urban population). The municipal wastewater
treatment capacity developed so far in India is about 7044 Ml/d - accounting for 27%
of wastewater generation in these two classes of urban centers. An attempt is made to
estimate the urban population and resultant wastewater generation for 2005
State Scenario & Local Scenario:
The volume of wastewater generated by domestic, industrial, and commercial
sources has increased with population, urbanization, improved living conditions, and
economic development. It is estimated that about 38,254 million litres per day (mld)
of wastewater is generated in urban centres comprising Class I cities and Class II
towns having population of more than 50,000 (accounting for more than 70 per cent
of the total urban population). The status of wastewater generation and treatment
capacity developed over the decades in urban centres (Class I and Class II) is
presented in Table (1.1).
Table 1.1: The status of wastewater generation and treatment capacity
3
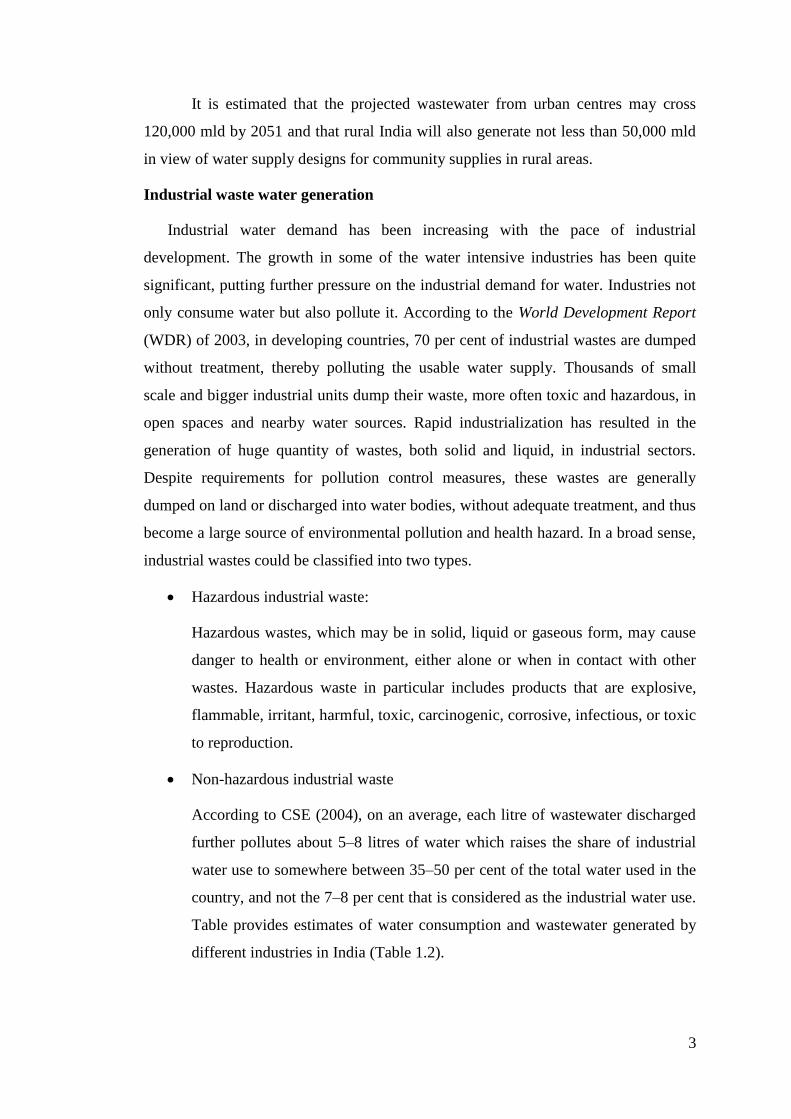
It is estimated that the projected wastewater from urban centres may cross
120,000 mld by 2051 and that rural India will also generate not less than 50,000 mld
in view of water supply designs for community supplies in rural areas.
Industrial waste water generation
Industrial water demand has been increasing with the pace of industrial
development. The growth in some of the water intensive industries has been quite
significant, putting further pressure on the industrial demand for water. Industries not
only consume water but also pollute it. According to the World Development Report
(WDR) of 2003, in developing countries, 70 per cent of industrial wastes are dumped
without treatment, thereby polluting the usable water supply. Thousands of small
scale and bigger industrial units dump their waste, more often toxic and hazardous, in
open spaces and nearby water sources. Rapid industrialization has resulted in the
generation of huge quantity of wastes, both solid and liquid, in industrial sectors.
Despite requirements for pollution control measures, these wastes are generally
dumped on land or discharged into water bodies, without adequate treatment, and thus
become a large source of environmental pollution and health hazard. In a broad sense,
industrial wastes could be classified into two types.
Hazardous industrial waste:
Hazardous wastes, which may be in solid, liquid or gaseous form, may cause
danger to health or environment, either alone or when in contact with other
wastes. Hazardous waste in particular includes products that are explosive,
flammable, irritant, harmful, toxic, carcinogenic, corrosive, infectious, or toxic
to reproduction.
Non-hazardous industrial waste
According to CSE (2004), on an average, each litre of wastewater discharged
further pollutes about 5–8 litres of water which raises the share of industrial
water use to somewhere between 35–50 per cent of the total water used in the
country, and not the 7–8 per cent that is considered as the industrial water use.
Table provides estimates of water consumption and wastewater generated by
different industries in India (Table 1.2).

4
Table 1.2: Estimates of water consumption and wastewater generated by
different industries in India
Together, India’s largest cities generate more than 38,254 million litres of
sewage1 each day. Of this, it is estimated that less than 30 per cent of what is
collected undergoes treatment before it is disposed into freshwater bodies or the sea
Impact on Environment:
The municipal waste material has positive and negative impact on the
environment. Undesirable constituents in wastewater can harm human health as well
as the environment. The negative impact on the environment and human health of
waste is due to the improper treatment of waste disposal. Raw domestic wastewaters
normally carry the full spectrum of pathogenic microorganisms—the causative agents
of bacterial, virus, and protozoan diseases endemic in the community and excreted by
diseased and infected individuals. Toxic chemicals from sewage water transfer to
plants and entire in the food chain and affect public health. Hence, wastewater
irrigation is an issue of concern to public agencies responsible for maintaining public
health and environmental quality.
The semi-arid tropics (SAT) are generally characterized by highly variable,
erratic and low rainfall, low productivity soils and poor development infrastructure.
Due to variations in seasonal rains during the crop growing period, crop may face
drought and occasionally water logging. Thus environmental degradation only leads
to soil and water pollution, natural hazards, and scarcity of water etc.
Today, millions of small-scale farmers in urban and peri-urban areas of
developing countries depend on wastewater or wastewater polluted water sources to

5
irrigate high-value edible crops for urban markets, often because they have no
alternative sources of irrigation water. Hence, wastewater irrigation is an issue of
concern to public agencies responsible for environmental quality.
According to the WHO report on Environment and Sanitation (1998), it was
reported that in most of the peri-urban areas around the world, an increase in
population, water consumption, and a rapid increase in waterborne diseases stresses
on the need of wastewater disposal. Health risks are increased by the fact that
households and surface water drainage systems are always combined, resulting in the
impurification of floodwater with excreta. Diseases like malaria are transmitted by
mosquitoes that breed in block drains and ponds. This issue is particularly persistent,
in locations where piped water is brought before digging drainage channels.
The insufficient physical, organizational structures and facilities for managing
wastewater have resulted into extensive pollution of surface and groundwater thus
worsening issues related to environmental health. The greatest impacts have been felt
by poor communities, who often inhabit low-lying and marginal lands, such as
wetlands and along channels.
In addition to the above, decline in the availability of water resources mainly
due to a rise in demand for the same has left farmers in peri-urban areas with no
option but to use untreated wastewater for their irrigation and aqua farming. While
some wastewater re-use has been in accordance with the usual requirements, the
majority which is in most cases not treated is re-used without formality. Therefore,
this effect poses a serious health risk for communities working under such agricultural
settings and even those feeding on the products obtained under similar conditions.
Wastewater irrigation is a common reality in three fourth of the cities in Asia, Africa,
and Latin America. Wastewater irrigation is known to have its significant contribution
to the heavy metal content of soils (Mapanda et al 2005, Nan et al, 2002).
Due to this the heavy metals often leads to degradation of soil health and
contamination of food chain mainly through the vegetables grown on such soils
(Rattan et al, 2002).Irrigation demand is typically the largest household water
demand, estimated to be about 100 gallons per capita per day or approximately 60 %
of typical homes overall water use (Mayer, 1999). Organic chemicals usually exist in
municipal wastewaters at very low concentrations and ingestion over prolonged
6
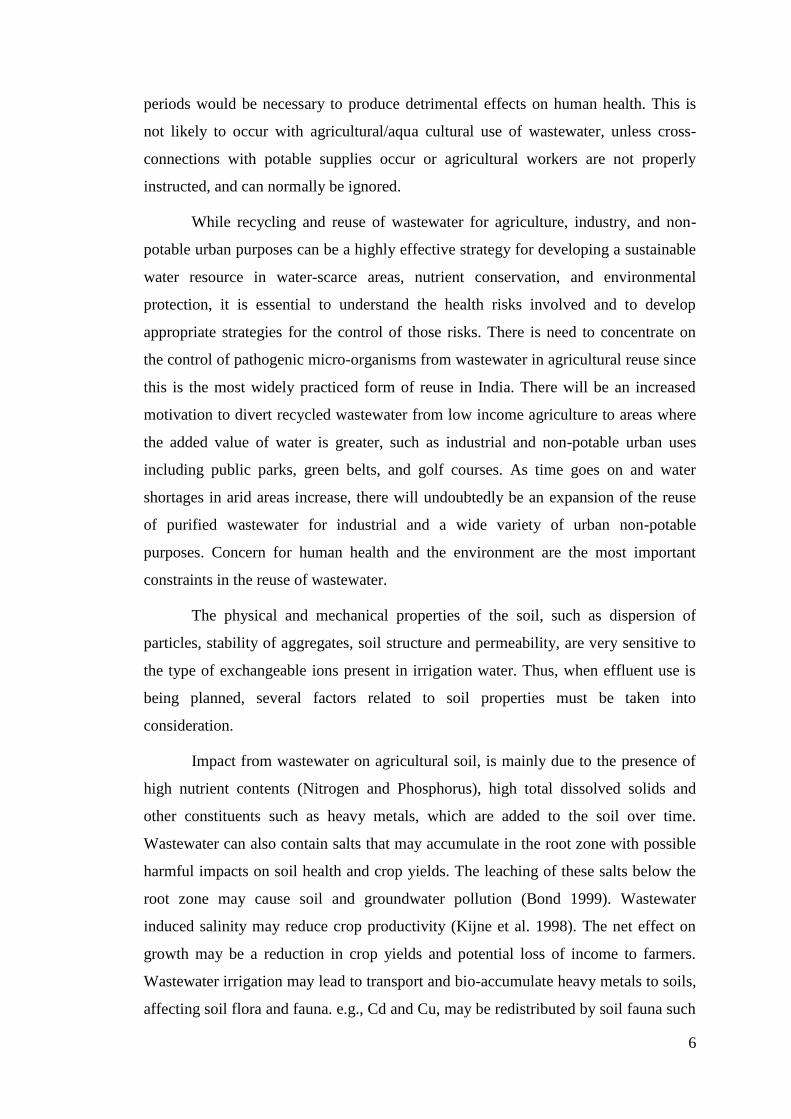
periods would be necessary to produce detrimental effects on human health. This is
not likely to occur with agricultural/aqua cultural use of wastewater, unless cross-
connections with potable supplies occur or agricultural workers are not properly
instructed, and can normally be ignored.
While recycling and reuse of wastewater for agriculture, industry, and non-
potable urban purposes can be a highly effective strategy for developing a sustainable
water resource in water-scarce areas, nutrient conservation, and environmental
protection, it is essential to understand the health risks involved and to develop
appropriate strategies for the control of those risks. There is need to concentrate on
the control of pathogenic micro-organisms from wastewater in agricultural reuse since
this is the most widely practiced form of reuse in India. There will be an increased
motivation to divert recycled wastewater from low income agriculture to areas where
the added value of water is greater, such as industrial and non-potable urban uses
including public parks, green belts, and golf courses. As time goes on and water
shortages in arid areas increase, there will undoubtedly be an expansion of the reuse
of purified wastewater for industrial and a wide variety of urban non-potable
purposes. Concern for human health and the environment are the most important
constraints in the reuse of wastewater.
The physical and mechanical properties of the soil, such as dispersion of
particles, stability of aggregates, soil structure and permeability, are very sensitive to
the type of exchangeable ions present in irrigation water. Thus, when effluent use is
being planned, several factors related to soil properties must be taken into
consideration.
Impact from wastewater on agricultural soil, is mainly due to the presence of
high nutrient contents (Nitrogen and Phosphorus), high total dissolved solids and
other constituents such as heavy metals, which are added to the soil over time.
Wastewater can also contain salts that may accumulate in the root zone with possible
harmful impacts on soil health and crop yields. The leaching of these salts below the
root zone may cause soil and groundwater pollution (Bond 1999). Wastewater
induced salinity may reduce crop productivity (Kijne et al. 1998). The net effect on
growth may be a reduction in crop yields and potential loss of income to farmers.
Wastewater irrigation may lead to transport and bio-accumulate heavy metals to soils,
affecting soil flora and fauna. e.g., Cd and Cu, may be redistributed by soil fauna such

7
as earthworms (Kruse and Barrett 1985). In general, heavy metal accumulation and
translocation is more a concern in sewage sludge application than wastewater
irrigation, because sludge formed during the treatment process consists of
concentrations of most heavy metals. The impact of wastewater irrigation on soil may
depend on a number of factors such as soil properties, plant characteristics and
sources of wastewater.
Heavy Metal Contamination:
The use of untreated wastewater for irrigation, no doubt pose a high risk to
human health in all age group. However, the degree of risk may vary among the
various age groups. Untreated wastewater irrigation leads to relatively higher
prevalence diseases. Impact of wastewater on human health is the valuation of public
health risk associated with wastewater irrigation. The public living within and outside
the wastewater irrigation zone, should be considered as potential exposure groups for
economic valuation purpose.(Meaning). Thus, the wastewater disposal and reuse of
wastewater with treatment is necessary. So the no. of techniques are available for
wastewater treatment but in current situation the economical and environmental
friendly technique is accepted.
Heavy metals in wastewater pose to health risk if they are in high
concentration, it may be toxic to environment. Uptake of heavy metals by plants and
enters in the food chain and affected to animal and human health by consuming such
contaminated vegetables.
Municipal sludge, however, often contain undesirable chemicals which may
be toxic to plants and/or eventually toxic to animals and human that consume edible
parts of such plants [E. Epstain, 1975].
Metals are extensively used in several industries, including mining,
metallurgical, electronic, electroplating and metal finishing. Under certain
environmental conditions, metals may accumulate to toxic level and cause ecological
damage. (Jefferies and firestone, 1984) Heavy metal pollution occurs due to the
untreated effluent from industries, refineries and waste treatment plants and
contaminants indirectly enter to the water supply systems and from the atmosphere
via rain water (Vijayaraghavan and Yun 2008). Now a day the situation become worst
by addition of heavy metals to the environment by increasing of industrial and

8
domestic activities. Human activities also create situations in which the heavy-metals
are incorporated into new compounds and may be spread worldwide (Young, 2000).
A significance rise in metal production began since the beginning of 20th
century, which witnessed increase the in the global population and gross net product
(GNP) of developed countries. Hence, the metals become important role in life of
human being. Increasing environmental pollution by heavy metals results from their
utilization in industrial process (Nriagu and Pacyna, 1998). Thus, in modern days, a
great deal of concern has been expressed over problems of the contamination of the
water and soil due to heavy metals. The rapid development of the industrialization and
urbanization is responsible for increasing of the environmental pollution through out
the world. Apart from natural processes, heavy metals may enter environment through
anthropogenic activities such as mining, smelting, sewage sludge disposal, application
of pesticide and inorganic fertilizers and deposition from atmosphere.(Alloway 1995,
Banuelos and Ajwa 199, Knox et.al 1999, Mc Laughlim and Singh 1999).
The heavy metal pollution related to industrial emission but now days various
types of manmade activities also produce a large amount of waste. The heavy metals
most frequently encountered in this waste include arsenic, cadmium, chromium,
copper, lead, nickel, and zinc, all of which pose risks for human health and the
environment. These elements can accumulate in the plants and animals eventually in
humans also through food chain. The health hazards presented by heavy-metals
depend on the level of exposure and the length of exposure. In general, exposures are
divided into two classes: acute exposure and chronic exposure. Acute exposure refers
to contact with a large amount of the heavy-metal in a short period of time. In some
cases the health effects are immediately apparent; in others the effects are delayed.
Chronic exposure refers to contact with low levels of heavy-metal over a long period
of time (Young, 2000).
Pollution in the Girna River
River Girna is the primary source of drinking water for Malegaon and Jalgaon
City and also for many cities; towns and villages in the neighbouring river, houses
about 86 villages are on the bank of the River from Malegaon to Jalgaon where Girna
meets River Tapi. (Cities and Villages population over 12,61,033), effluents from
unidentified industries may be from household small scale industrial activity and

9
polluting wastes from several other non-point sources are discharged into the river
Girna resulting in its pollution.
In the last few decades, however, there has been a serious concern over the
deterioration in its water quality. The river has been receiving large amounts of
partially treated and untreated wastewater during its course, especially from Malegaon
and Jalgaon. Pollutants flowing into the river are contributed from the waste of the
cities situated along its bank.
From unknown many industrial activities, people living in big colonies, slums
and rural areas, there domestic activities trigar the pollution load in the river with
impunity because of untreated water. Increasing pollution of the Girna has now
become a major issue and a cause of concern for environmentalists.
Two major towns on the bank of the Girna are densely populated. Most of the
unidentified household small scale industries have no effluent treatment facilities and
dump their wastes directly into the river. Once the lifeline of adjoining villages and
towns, Girna has now became the most polluted water resource of the State. It now
looks like a sewer.
Impact of River water pollution
The pollutants include oils, greases, plastics, plasticizers, metallic wastes,
suspended solids, phenols, toxins, acids, salts, dyes, cyanides, pesticides etc. Many of
these pollutants are not easily susceptible to degradation and thus cause serious
pollution problems. Contamination of ground water and fish-kill episodes are the
major effects of the toxic discharges from industries. Discharge of untreated sewage
and industrial effluents leads to number of conspicuous effects on the river
environment (Table 1.3). The impact involves gross changes in water quality viz.
reduction in dissolved oxygen and reduction in light penetration that’s tends loss in
self purification capability of river water.

10
Table 1.3: Environmental implications of the discharge of sewage and industrial
effluents
S.N. Factor Principal
environmental
effect
Potential ecological
consequences
Remedial action
1. High biochemical
oxygen demand
(BOD) caused by
bacterial breakdown
of organic matter
Reduction in
dissolved oxygen
(DO) concentration
Elimination of sensitive
species, increase in some
tolerant species; change in
the community structure
Pretreatment of
effluent, ensure
adequate dilution
2. Partial
biodegradation of
proteins and other
nitrogenous material
Elevated ammonia
concentration;
increased nitrite and
nitrate levels
Elimination of intolerant
species, reduction in
sensitive species
Improved treatment
to ensure complete
nitrification;
nutrient stripping
possible but
expensive
3. Release of suspended
solid matter
Increased turbidity
and reduction of
light penetration
Reduced photosynthesis of
submerge plants; abrasion
of gills or interference with
normal feeding behavior
Provide improved
settlement, insure
adequate dilution
4. Deposition of
organic sludges in
slower water
Release of methane
and hydrogen as
sulphide matter
decomposes
anoxically,
Modification of
substratum by
blanket of sludge
Elimination of normal
benthic community loss of
interstitial species; increase
in the species able to
exploit increased food
source
Discharge where
velocity adequate
to prevent
deposition
Other poisons
1. Presence of
poisonous substances
Change in water
quality
Water directly and acutely
toxic to some organisms,
causing change in
community composition;
consequential effect on
pray- predator relation;
sub- lethal effects on some
species
Increase dilution
Inert solids
1. Particles in
suspension
Increased turbidity.
Possibly increased
abrasion
Reduced photosynthesis of
submerged plant.
Impairing feeding ability
through reduced vision or
interference with collecting
mechanism of filter feeders
(e.g. reduction in nutritive
value of collected
material).Possible abrasion
Improve settlement
2. Deposition of
material
Blanketing of
substratum, filing of
interstices and/or
substrate instability
Change in benthic
community, reduction in
diversity ( increased
number of a few species)
Discharge where
velocity adequate
to ensure
dispersion
Source: S. C Santra

11
On the worldwide scale, the river water pollution leads hazardous impact on
aquatic animals and plants. Some studies show alarming condition of river pollution
implications. Pratap B and Vandana performed detailed study on pesticide
accumulation in Fish species and concluded that, pesticide bioaccumulation was
higher in cat- fishes as compared to carps and have species specific in their tissues
(liver, brain and ovary) causing metabolic and hormonal imbalance affecting at GnRH
and GTH secretion. The reproductive sex steroid hormones were lowered in catfishes
and carps of the polluted rivers. They suggested that the bio accumulated insecticide
in ovary may cause blocking of the receptor site so that natural hormone cannot bind
at the site of estrogen receptor which may cause the dysfunctions of the reproduction
in catfish and carps inhabiting the polluted rivers. They also suggested that the fish
bio accumulated insecticide beyond permissible limit must be avoided for the food
purpose from such polluted rivers.
Contamination by synthetic organic pollutants is a more recent phenomenon
which is even more difficult to demonstrate for lack of appropriate monitoring. Many
streams and rivers in South America, Africa and particularly on the Indian sub-
continent show high coliform levels together with high BOD and nutrient levels.
Eutrophication, which has spread widely to lakes and reservoirs of developing
countries now also, affects slow flowing rivers.

12
CHAPTER II
INTRODUCTION OF MAJOR CITIES
MALEGAON CITY
Malegaon is the city which lies in the north-west region of the Nashik district
of Maharashtra state. Malegaon is situated on the Mumbai-Agra national highway no
NH-3. It is also district administrative center. The local language spoken in Malegaon
is Khandeshi, as it is situated very near to the Dhule district of Khandesh region. The
city is situated at 425 M. above MSL. The general topography is plain sloping
towards the Mosam River which flows North - South direction.
The Mosam River is one of the main features in the Malegaon city and is
tributary of Girna River and divides the Malegaon city into two parts and flows in
West to East direction. The eastern part of the river, houses old Malegaon, which is
main commercial market in the city, whereas western part of the city is new Malegaon
consists of newly developed Hindu Residential areas. Malegaon is also one of the
major producer and exporters of the grapes and pomegranates in the Nashik region.
The predominant soil is Black Cotton soil. The population of Malegaon city as per
2001 census is 4,09,403. It is one of the cities having largest population density in
India today. Malegaon is famous for its Powerlooms business. This business is more
than 100 years old and is prominent with major economic dependence. The Rangeen
Saree made at Malegaon was very famous and was exported to all over the country.
Currently, cotton and synthetic textiles are main product from the power looms
business in the city. The 70% population in the Malegaon city is of Muslim
community mainly came from Uttar Pradesh and Rajasthan. All of them are involved
in weaving business and hence are known as weavers. It has evolved as the regional
growth center, attracting economic activities and providing livelihood for large in-
migrating population.
Malegaon Municipal Corporation is a ‘D’ Class Corporation and has come
into existence on the 17th December 2001. The corporation is constituted under the
provision of Bombay Provincial Municipal Corporations Act, 1949 and is also
governed by the provisions of the 74th Constitutional Amendment Act 1992 (CAA).
The growth of any urban centre has the influence on it from the regional sphere. After
13
attaining a sizable centre it will in turn greatly influence the region. Malegaon city
which has grown rapidly through the last decades has a 4 lakh population at present. It
has reached a stage wherein its growth is interconnected to the growth of Malegaon
Tehsil. So it is necessitated to incorporate a brief study of the Tehsil with district also.
Brief History of Malegaon City
Malegaon city is located in the northwestern Maharashtra state, western India,
on the Girna River, part of the Nasik urban agglomeration, on the Bombay–Agra
highway. An important market for agricultural produce, it was an early centre of the
handloom industry. It has rapidly industrialized and recorded remarkable growth since
the 1940s. Cotton and silk goods are exported to Bombay, Pune and other places.
Despite being known as a city of power looms, Malegaon has seen the infrastructure
and quality of life deteriorate over the years. While population has grown from 1.21
lakh in 1961 to an estimated four lakh people now, the roads, drainage systems and
educational facilities are poor. Around 55 per cent of the residents stay in slums and
44,173 of the 71,245 households lack toilets.
There are almost no open spaces, water supply is erratic and literacy rate is a
dismal 35.5 per cent for women. Half the children are delivered at home and public
health facilities are not able to cater to the population. Most of the residents of this 13
sq-km area around a fort built by Peshwa general Naro Shankar are descendants of
Muslim weavers from Uttar Pradesh who migrated here after 1857. Nearly three-
quarters of Malegaon's population belong to minority Muslim community. It has a
history of communal violence and the town is divided by a river Mosam separating
the two communities which needs to be given special emphasis while planning.
Looking at the development through the decades and existing Infrastructure
inadequacies, renewed efforts have to be taken up to uplift the standard of living and
revive the economy.
Profile of Malegaon City
Malegaon City with a jurisdiction of about 12.95 sq. km., is the headquarter of
the Malegaon Taluka of Nashik District in the Khandesh Region. It has got a very rich
historical background. In A. D. 915 Malegaon was known as “Mahuli Gram” under
the emperor of Indra Raj (Third) who belong to the Rashtrakut King. Then after in
1757, under Mughal Emperor, Malegaon was awarded to a Maratha Sardar of Peshwa

14
– Naro Shankar Raje Bahadur. He built a historical Fort – Bhuicoat, on the left bank
of the river Mosam and to protect the Fort, Raje Bahadur introduced Momin Solders’
army, in future has started the Handloom industries, which has given a historical fame
to Malegaon as big centre in Handloom industry. During their rule, the city expanded
considerably. Malegaon’s heritage structures – Fort, Lord Shiva’s Old Temple, and
old Raja Bahadur Wada in Gaothan area – indicate the historical importance of this
town.
In 1818, after a long war with Maratha and Momin Army, British Rulers
captured the Fort of Malegaon. British Army stayed in the North portion of the city
which is known as Camp Area and the ultimately the development of Camp site was
accelerated.
Alongside, Malegaon has been functioning as one of the engines powering the
Indian economy in power loom. In 1935, Power-loom industries overcome the
handloom industries has multiplied and has drastically increased the employment in
this sector and given a strong shape to this sector and which ultimately became the
traditional look of this City. Every corner of the City has the sound of Power loom as
its characteristic. In 1857 the first revolution for freedom was started and in 1948,
Hyderabad Mukti Sangram took place and because of the fear of British Rulers a large
amount of Muslim people migrated to Malegaon and adopted the traditional power
loom business. Day by days, as industry developed and the employment base
widened, migrant population from the nearest villages, Districts, States to Malegaon
in search of employment and settled in various parts of the town and contributed in
power loom industry to become the identity of Malegaon as one of the biggest centre
in power loom. Through 1.1 lakh power looms, 80000 people are directly employed in
power loom industry with more than Rs.10 Crores daily turnover and also 2.5lakh
people are engaged in textile sector. Today, Malegaon has emerged as the most
vibrant economic belt in power loom industry of the nation. Thus the city became
predominantly a marketplace and mixed land use prevailed.
In general industrial activity in Malegaon town is predominantly power loom
based which forms the main source of and is also considered as a backbone of
livelihood. But apart from the powerloom industries, the other important industries
are Agri-industries, Plastic Pipes manufacturing; cotton spinning, Ginning, Oil Mills,

15
Fabrication, Tile Manufacturing and Lie factories etc. contribute to Industrial base in
Malegaon.
The Civil Administration of the Town was formerly carried out by the
Municipal Council which was functioning since 1863. Council converted into the
Corporation and the Malegaon Municipal Corporation came into existence on 17th
December 2001. Corporation is governed by the Bombay Provincial Municipal
Corporation (BPMC) Act, 1949 and is bound to provide basic infrastructure like water
supply, drainage, sewerage, health, education, roads in present electoral 72 wards of
the city.
Important Events that shaped today’s Malegaon City
Above 200 years back, Malegaon was a kasba (a small place) and was called
Maliwadi (hamlet of gardeners).
One of the Sardars of Bajirao Peshwa, Naroshankar, was given 18 villages
including Maliwadi and he invited a number of engineers, stone cutter an
artisan, who were mostly
Muslims from the north, especially suburbs of Delhi.
These Muslim artisans also brought their language Urdu for the first time to
Maliwadi.
The artisans lived in a basti (settlement) opposite to the fort, across the river,
which is today known as Sangmeshwar and, Maliwadi became Malegaon.
The first Idgah in Malegaon was built by one of the Rohilla sepoys Dilawar
Khan in 1816.
When the British captured the Malegaon fort in 1818, they invited Muslims of
Hyderabad from Nizam's territory to Malegaon.
After the munity in 1857, many Momins, the largest number of Muslims ever
to migrate to Malegaon, came from north India to Malegaon in search of
security.
In 1862, Muslims from Banaras who were mostly weavers, as there was a
famine around this time, too migrated to Malegaon.
Malegaon has become traditional handloom-weaving centre in Maharashtra.
16
The era of power looms in Malegaon emerged after 1935
The cloth industry in Malegaon flourished due to increased productivity.
Many more Muslims weavers from U.P., Khandesh and Deccan migrated to
Malegaon. These migrants created slums for the first time in Malegaon.
Kamalpura, the first and the biggest slum in Malegaon, was established in the
1940s.
Many more slums were created as the political and social turmoil in
Hyderabad in the late 1940s and 50s and the riots in 1960s led to massive
migration of Muslims into Malegaon.
The influx was so large that three new municipal wards came into existence.
Location:-
Malegaon with a jurisdiction of about 12.95 sq. km. is geographically located
at 20032’ North Latitude and 72035’ East Longitude at about 478.44 meter above
mean sea level. Malegaon is well connected with all the nearest States and the
districts of Maharashtra. It is situated on the road linking Mumbai and Agra — now
National Highway No 3 — it was once a small junction known as ‘Maliwadi’ (hamlet
of gardens). Nashik City is located around 110 km. whereas the nearest Railway
Junction, Manmad is about 40 km. from Malegaon. Dhule is nearest City at just 51
km.
The area of the corporation is spread up to the boundary of village Soygaon on
Satana Road, village Dabhadi and Bhaygaon towards west, villages Dyane, Daregaon
on the North side, villages Sayane, Mhalde on East and villages Chandanapuri and
Mhalde on South side.
Climate and Rainfall
The climate of the city is almost dry except southwest monsoon season that
sets in the first week of June and last about 2.5 to 3 months i.e. upto September. The
average annual rainfall in the city is about 550 mm and the temperature range is
between 42.50 (maximum) in summer and 20 centigrade (minimum) during the
winter.

17
Economy
The Economy of Malegaon has passed through phases of transformation over
the years. The growth of modern industry in Malegaon started way back in the
nineteenth century. Malegaon was a city with a predominantly working class
population and its urban economy was heavily dependent on the Powerloom and
Plastic Industries.
Malegaon has been functioning as one of the engines powering the Indian
economy in powerloom. In 1935, Power-loom industries overcome the handloom
industries. It has drastically increased the employment in this sector and gave a strong
shape to this sector and which became the traditional look of this City.
In due course the textile industry has become important economic driver,
providing employment to even migrant people and later on the industry consolidated.
Presently around 1.1 lakh powerlooms operate in various parts of the city employing
about eighty thousand people. More than 5000 industrial units are in operation of all
the sizes of Powerloom. Mainly the powerloom industries are engaged in Grey Cloth,
Synthetic and Cotton Fabrics, Dyed Cloth, Printed / Dyed Sarees, Lungis, Processing
of raw clothing etc. Majority of population is having the weaving to be the main
occupation. Women and children work on the Looms as well undertake the associated
operations.
Major concern of the city is been sprawl of slums estimated to be 132 nos.
with estimated population of 2.67 lakhs and 90% of the slum population is engaged
with the Powerloom associated workings. Low operating and maintenance cost, cheap
material and simple living standard is the main boosting and supporting factor for the
growth of this Sector here. In due course, Malegaon emerged as the most vibrant
economic belt in powerloom industry of the nation. In short, the below mentioned
table describe the entire scenario of Powerloom Industry in the city (Table 2.1).

18
Table 2.1 Assessment of Powerloom Industry
Number of Powerloom in City More than 110000
Employment through Powerloom More than 80000
Employment through entire Textile Sector More than 250000
Daily Production in Powerloom Industry More than 60‐70 lacs meter
Daily turnover through entire Textile Sector More than Rs.10 Crores
(Source: - City Sanitation Plan)
Nearby villages like Kawlana Area, Chalisgaon Phata, Dyana, Ramjanpura,
Mhalde Shiwar, Daregaon Dhiwar are also providing their valuable contribution in
increasing the picture of Powerloom industry in this region. With the strong
economical backing of these villages Malegaon stands very strongly in the line of
Powerloom sector in India. There are 18 lacs total powelooms in India out of that
Bhiwandi (Thane) & Surat is having 7 lacs each, Malegaon – 1.10 lacs and
Ichalkaranji – 1 lacs. This is the third largest powerloom centre in India. Powerloom
industry in Malegaon is known as Manchester of Powerloom of India. For giving a
concrete base to the Powerloom sector including other, “D+ Zone” MIDC industrial
zone with around 160 hectares is under development at Saine which is on NH-3 and
also very close to Malegaon City.
Malegaon has one spinning mill ‘Malegaon Co-op. spinning Mill’. It also has
three sugar factories, which are currently under not working and oil mills in nearby
regions. In general, industrial activity in Malegaon town is predominantly power loom
based which forms the main source of and is also considered as a backbone of
livelihood. But apart from the power loom industries, the other important industries
are Agricultural Plastic Pipes manufacturing; cotton spinning, Ginning, Oil Mills,
Fabrication, Tile Manufacturing and Lie factories etc. are also providing their
contribution in supporting and boosting the industrial activities in Malegaon.
Another important business in the city is PVC pipe manufacturing business.
The business consists of small and medium scale units spread across the outskirts of
the city. Some of the main PVC pipes manufacturing units in the city are Navkiran
Plastics, Sujal Plastics, Kabra Plastics, Nakoda Plastics etc.

19
This is the second largest industrial activity which is on boom and providing a
strong support to the urban economical activities of Malegaon. This is one of the
biggest centres of reprocessing unit in Asia. Raw material for this sector is imported
from various cities of India. From Nashik, Pune, Mumbai, Hyderabad, Ahmedabad,
Surat, Delhi etc. more than 120 tonnes of raw material i.e. minimum 30 trucks a day
of raw material provides activity to the plastic industry in Malegaon.
In Malegaon city, 100 Pipe Units, 200 Gitts/Lumps Units, 300 Sorting
Godwons and 20 Granual & Tubing Units provide employment for more than 70000
people in Plastic Industries while more than 20000 women workers are engaged in
this industrial activity. Because of the poverty, low standard of living and poverty,
huge number of workers is easily available for this sector.
Malegaon being dependent on agrarian activity, trade and commerce in the
city is also driven by the prospects in the agro-sector. Malegaon has emerged as one
of the important regional centers for trade and commerce because –
a) By virtue of Malegaon being the largest urban center in the region it has
emerged has one of the important hubs for trade and commerce particularly for
power loom and agro-based products.
b) Its close proximity as well as good connectivity to other large urban centers
like Nasik, Aurangabad and Pune etc. Historically, the city is known for its
strength in trading of Cotton goods, particularly clothing and readymade
goods. Malegaon is also famous for its regzeen sarees manufacturing which
were exported to many parts of the country.
Agriculture is the one more main economic activity for people of Malegaon
city as well as Taluka which provides the largest employment opportunities. The total
areas available for agricultural activities are 165.828 hectares which is about 23% of
the total geographical area. The principal crops are Corn, Bajara, Maize, Onion,
Groundnut, Tur, Sprouts, Pomogranate, Vegetables, Rice, Wheat, Harbhara, Cotton
and Sugarcane etc.
Malegaon is center for agro based products in the nearer regions. It has
Agricultural Produce Market Committee (APMC) located on the camp road of the city
in 23 acres of area, having administrative building, storage shed, agent’s offices etc.
APMC was established during 1947 AD.

20
Majority of crops exported to Gujarat, Madhya Pradesh, Rajasthan, Uttar
Pradesh, Bihar and rest of Maharashtra. With the help of 135 authorized commission
agents and various other sources, APMC deal with daily turnover of around Rs.80 to
100 Lakhs. Total Gross Income to APMC is Rs.1.39 Crores during the financial year
2005-2006 out of which Rs.33 lakhs is the Net Income. Considering the huge
activities APMC at Camp road, there are certain proposals for expansion of market
yards. They are starting the Onion Market Yard at Mungase – Patan Phata (Agra
Road) by the end of this year and also having proposal for the construction of more
sheds. Currently APMC is having four submarkets at Umarani, Zodge, Nimgaon,
Jalgaon (Nim). Out of these four Umarani is showing huge activities. It is nominated
as first ranker sub-market in Maharashtra State. Daily inflow of Onion is 500 to 600
tractors through with APMC’s annual income is around Rs.63 Lacs.
SEWERAGE
Sewage produced by all human communities is often left to compost naturally
or it is treated using processes that separate solid materials by settlement and then
convert contaminants in to biological sludge and into gases such as carbon dioxide or
methane. Sewage infrastructure is designed as a safety feature that reduces sewage
backups and minimizes public health impacts for residents. In view of fast
development of Malegaon city, population and area-wise it has become most essential
to make disposal of drainage effluent of the city in a scientific and hygienic manner in
public health point of view. Moreover Malegaon is a power loom city and
considerable quantity of effluent arising from the dyeing process of newly produced
cloths is also to be disposed off in scientific manner.
Existing Sewerage System
An underground sewerage scheme was sanctioned for 4 lakhs populations and
drainage works have been executed partly along the pumping stations. Under this
scheme no work has been executed in the entire district No.1, some works of lying of
collecting branch sewer is completed in District No. 2. Sewage Treatment Plant of 15
MLD capacities has been also constructed. In Dist. No. 3 & 4 trunk mains are
completed partly, Pumping stations No. 2 & 3 are completed, Rising mains from Ps -
II to STP site 750 mm dia. CI pipe and from PS - III to manhole chamber of Trunk
line of District No.3600 mm dia are completed 90% of the work of 15 MLD STP has

21
also been completed. The scheme has not been commissioned as envisaged in the
project report.
District-I
This district is on the Eastern part of the corporation area, at the Eastern
boundary the Awadi nalla flows and on the western side the North South ridge line
"NS" is passing as shown in the general plan. No drainage work has been carried out
in this District under the sewerage scheme sanctioned earlier.
The main sewer lines are running north-south as per the natural gradient of the
city. The Sewage from the entire district is carried through the trunk main to the
pumping station-1.
District-II
This district is spread along the left bank of Mosam river from North to South
boundaries of the corporation area and on the East side the ridge line "North - South."
The existing Trunk sewer 250 to 1200 mm dia passing along left bank of Mosam river
in northsouth direction is proposed to be used .To this trunk main all main sewer lines
are joined .The branch lines & laterals in the district are joined to the respective main
lines . The trunk line terminates at Motibag naka on Mosam river.
District-III
This district lays North South on the right bank of Mosam river and on the
west the boundary of the Corporation area. The Girna river is flowing on the southern
boundary of this district. The entire sewage of this district plus 50 % of sewage from
district no 4 is conveyed through above existing 700 to 900 mm dia trunk main up to
Motibag Naka bridge on Mosam river and joined to the existing trunk main of district
No 2 .

22
Fig. 2.1 Existing Sewerage System
District-IV
This district is located on the right bank of Mosam River which flows north-
south direction. The northern boundary is the corporation limit on the western side
villages Dabhadi & Soygaon. The effluent from the entire district is collected in
existing collecting well 6.5 m dia. at the pumping station No.3 through trunk main.
The S.T.P. site is located in village Mhalde on opposite side of NH3 bypass as per the
original scheme sanctioned in 1979. An area of 17.84 Hectare (45 acres) is already
acquired. A STP of 15 MLD capacity was constructed but the scheme was not
commissioned. The waste water and sewage from city collected through the open
drains is directly discharged into the Mosam river and by nallas without any
treatment. The sludge flows through the open drain creating unhealthy atmosphere
and bad smell, thus resulting in unhygienic conditions.
23
The sewerage system in the gaothan area and other dense areas is not working
effectively. In the outer areas houses with independent latrines and septic tanks are
coming up. In most of the developing outer area pucca surface drains are not provided
which result in unhygienic conditions. It is estimated that around 21MLD of sewage
generated is allowed to flow into the natural drains and only some part is treated.
Malegaon city has just 6.00% of the households having closed drainage for
wastewater disposal whereas around 76% of the household have open drainage
channel for wastewater disposal. However, nearly 19% of the household has no
proper drainage connectivity.
JALGAON CITY –
Jalgaon city is situated in north-west Maharashtra bounded by Satpuda
mountain ranges in the north and Ajanta mountain ranges in the south. Jalgaon city is
headquarter of Jalgaon District. Jalgaon City is considered as the agricultural and
commercial capital. The Jalgaon railway junction serves routes to Mumbai, Nagpur,
Delhi and Surat. The city is well developed with good roads, shopping centers and
residential areas with a moderate infrastructure in communication and transport.
Modern Jalgaon now boasts of vast industrial areas, educational institutes and good
hospitals. Jalgaon is also the hometown of her highness Smt. Pratibha Patil,
Honourable President of India.
Geographical Setup: Jalgaon city lies between 75° 31’ 36.39” to 75° 36’ 5.30”E
Longitude and 20° 58’ 22.40” to 21°01’26.35”N Latitude. The average rainfall of the
city is 700-750 mm which categories it as semi-arid region. Temperature extends
from 10° to 46° C. City has a total of 5 lakh population during 2008 with a literacy
rate 76.06%.
Linkages and Connectivity
Road Linkages: Jalgaon city is well connected by road linkages to important places
of the State. The National Highway No. 6 from Mumbai – Nagpur passes through the
length of the city and is the central axis of the city of Jalgaon. Further, the State
Highways are Jalgaon – Ajantha and Jalgaon – Pachora that pass through the South
side of the City and the Jalgaon – Mamurabad State Highway that passes through the
North of the city. Major district roads are Pimprale – Avhane towards the North –

24
West, Jalgaon – Saokhede on South - West, Pimprala – Mamurabad on North and
Jalgaon – Pimprala towards the West.
Rail Linkages: The city of Jalgaon is situated at the centre of the district
geographically, and is well connected by the broad gauge lines of Central and
Western Railway to Bombay, Delhi, Ahmedabad, and Calcutta. The major railway
junction is located about 22 km away from the city (at Bhusawal) which is a major
junction of Central & Western railway of the Mumbai – Delhi and Mumbai – Howrah
line.
Air Linkage: The nearest airport is situated at Aurangabad, which is 155 km away
from the city. A tender has been floated for the proposed development of the Jalgaon
Airport on BOOT basis 3 or through Public Private Partnership basis.
Jalgaon Municipal Corporation:-
Jalgaon Municipal Council was established on 24th November 1864. The State
Government in its notification has announced the formation of Jalgaon City
Municipal Corporation (JCMC) with effect from 21st March 2003. Jalgaon City
Municipal Corporation was formed as a corporate body under the Bombay
Provisional Municipal Corporation (BPMC) Act, 1949.
Jalgaon City Municipal Corporation serves an area of approximately 68.24 sq.
km including the city and its peripheral areas and provides a range of civic services to
citizens of the city of Jalgaon. The BPMC Act entrusts the authority with
responsibility for administering of duties to the city. The Jalgaon City Municipal
Corporation has divided the city into 69 wards. It consists of 69 Councilors who are
elected representatives of the city (ward wise) and 5 persons nominated by the
councilors. The councilors are elected every 5 years. The Mayor is the first citizen of
the city and is elected by the councilors and holds office for a period of two & half
years. The elections to the municipal body are held every five years. The city is
classified under major urban zone (Fig 2.2).
Climate
Jalgaon has a diverse climate. The climate of the town is hot and dry (except
in the monsoon period) with the temperature reaching as high as 47°C. It is
exceptionally hot and dry during summer that lasts from the month of March to May.
The summer is the driest part of the year. Monsoon starts from June to September,

25
which is followed by winter. The monsoon months of June to September receive
about 99% of the annual rainfall with an average of 700 mm rainfall here. The amount
of rainfall received per year does not vary greatly. The relative humidity is highest i.e.
92% in August and lowest i.e. 16% in April. Winters are quiet pleasant in Jalgaon
city. The winter season lasts from December to February.
Topography:
Situated at 201 meters above mean sea level, Jalgaon city is bounded by the
Satpuda ranges in North and Ajanta, Satmala and Chandur ranges in south. The town
is situated in a generally flat terrain. A gentle slope is present towards the south as
hilly areas are present along the Shirsoli and Mohadi roads and towards south-west
along Girna Pumping Station road. The Girna River runs in the north - south direction
along the western boundary of Jalgaon city near Nimkhedi village. The Mehrun tank
is situated at the southern side of the city. The southern and northern sides of the city
are rich agricultural lands (Table 2.2).
Table 2.2: Demography: Population Growth of Jalgaon City
Year Population
Growth
Decade
Growth
% Growth
Growth in
Annual
Growth in
Decade
1951 75,303 -- -- -- --
1961 88,452 13,149 17.46 1.74 --
1971 1,17,312 28,860 32.63 3.26 15,711
1981 1,65,507 48,195 41.08 1.1 19,335
1991 2,42,193 76,686 46.33 4.63 28,491
2001 3,68,000 1,25,807 51.94 5.19 49,121
2011 4,60,228 92228 25.07 2.50 -33,579
(Source: - Census of India)
The population growth of Jalgaon city according to census 2011 is given in
following table 3. The city has expanded due to increase in boundary also & it is
observed that, population density is 53.94 habitants /hectare, the core density in city is
on higher side. The city is presently divided in 69 wards by City Corporation.
26
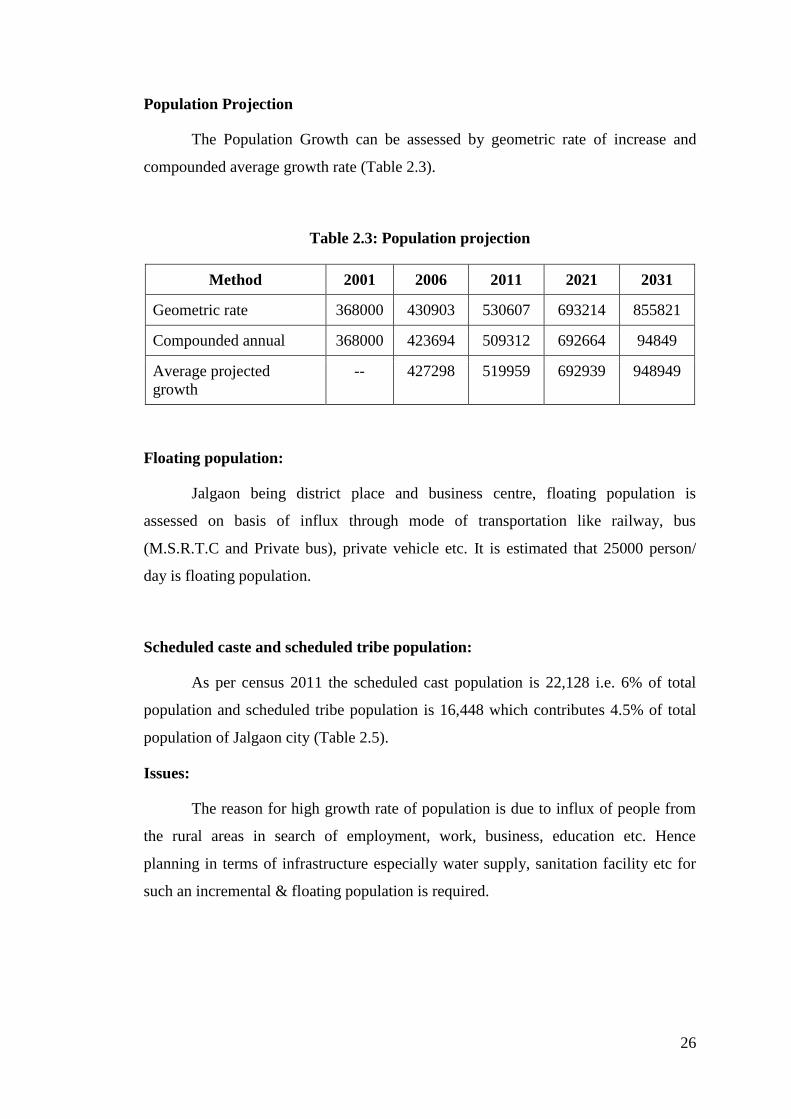
Population Projection
The Population Growth can be assessed by geometric rate of increase and
compounded average growth rate (Table 2.3).
Table 2.3: Population projection
Method 2001 2006 2011 2021 2031
Geometric rate 368000 430903 530607 693214 855821
Compounded annual 368000 423694 509312 692664 94849
Average projected
growth
-- 427298 519959 692939 948949
Floating population:
Jalgaon being district place and business centre, floating population is
assessed on basis of influx through mode of transportation like railway, bus
(M.S.R.T.C and Private bus), private vehicle etc. It is estimated that 25000 person/
day is floating population.
Scheduled caste and scheduled tribe population:
As per census 2011 the scheduled cast population is 22,128 i.e. 6% of total
population and scheduled tribe population is 16,448 which contributes 4.5% of total
population of Jalgaon city (Table 2.5).
Issues:
The reason for high growth rate of population is due to influx of people from
the rural areas in search of employment, work, business, education etc. Hence
planning in terms of infrastructure especially water supply, sanitation facility etc for
such an incremental & floating population is required.

27
Fig. 2.2: Jalgaon Municipal Limits

28
Jalgaon Sanitation:-
Sewerage:
The proper sewerage system is not functional in the city. The entire city has an
open sewage system with the absence of an underground drainage network. The
present quantum of sewerage generated in the city is quantifiable based on population
and water supply. Sewage from houses is being discharged into septic tanks and the
effluent is passed either into soak pits or into surface drains creating are hazardous
and unhygienic conditions in these areas.
Water Supply:
Daily water supply to the citizens is required in the city. There is a water
supply system for provision of the water to all wards of the city. The system is having
underground network for the water supply. If this network is not proper and the water
is not provided, due to inadequate water supply and due to inefficient water supply
system the leakages are observed which may create ditches and water gets
accumulated where mosquitoes and other microorganisms may be surviving and
creating the health problems in the surroundings.
Environment:
Healthy environment is the need of the healthy city. So as to keep the city
pollution free, mass tree plantation programs are necessary. There must be certain
restrictions over the tree cutting in the city. City should be green and clean to provide
the fresh air and oxygen to the city population. The environmental pollution causes
various health related problems in the citizens. To avoid these problems and to make
city totally sanitized, environment must be clean.
Existing System
Sewerage:
A sewerage system proposal was prepared by Environmental Engineering
Department of Maharashtra in 1965 for an estimated flow of 20 MLD. The proposed
sewer network system was laid on the main roads and no branch sewer in the side
streets to pick house connection was provided. At present existing sewerage system is
non -functional .The entire city has an open sewage system with the absence of an

29
underground drainage network. The present quantum of sewerage generated in the
city is quantifiable based on population and water supply. Sewage from houses is
being discharged in to septic tank and the effluent is passed either into soak pits or
into surface drains creating hazardous & unhygienic condition in this areas.
Therefore in absence of any Sewerage system, sewage primarily treated at
septic tank in developed area and untreated from slum area, along with waste water
from kitchen and bathroom, flows through constructed /unconstructed gutters on
surface, ultimately leading to four major natural nallas /streams flowing through
cities.
Water Supply:
Water supply in this area at present is mainly served by three water supply
schemes viz, Girna water pumping station and Dapora filtration plant on Girna River.
The Girna Dam is located 140 km away from Jalgaon .The Dapora filtration plant is
situated 5 km away from the city in proximity to Girna water pumping station. The
water source to this filtration plant is through the Dapora weirs schemes viz, Girna
water pumping station and Dapora filtration plant on Girna river tank through the
rising main.(Table 2.4)
Table 2.4: Details of water supply schemes for the town
Scheme-1 Scheme-2 Scheme-3
Girna Intake
Wells
Dapora
K.T. weir
Waghur Dam
Year of
Commissioning
1927 1987 2008
Capacity of
scheme (MLD)
20.00 30.00 108.20
Financial
assistance and
amount
-- Govt. Grant and
Municipal Funds
Govt. Grant and Municipal
Funds through Hudco
loans
Components
added
Infiltration
wells
Water treatment
plant
Water treatment plant,
pure water gravity main
30
Augmentation to Jalgaon Water Supply Scheme Stage V, Phase –I is an
ongoing project from the water source of Waghur dam, located 16 km southeast of
Jalgaon city. The scheme proposes to serve as a secondary source of water supply to
the city whose population by 2030 is projected to be 8,76,700 persons, with a water
supply requirement of 149 MLD. The scheme is planned at a total cost of Rs. 159.25
Crore (Rs.25.00 Crore-Govt. of Maharashtra, Rs. 47.55 Crore - State Government –
Department of Irrigation and remaining Rs. 84.26 Crore - JCMC through a loan from
HUDCO).
There are 10 Elevated Storage Reservoirs (ESR) & 4 Ground Level Storage
Reservoirs (GLSR) in
Jalgaon city, out of which 9 ESR’s are spread around the city such as:
1. Genda Lal mill located at Shivajinagar ,with a capacity of 2 million litres
2. Akashwani located behind Collectors office with a capacity of 2.5 million
litres
3. DSP Chowk with a capacity 2.8 million Litres
4. Daulat nagar tank with a capacity of 0.3 million litres
5. Pimprala with a capacity of 0.175 million litres
6. Mehrun with a capacity of 0.125 million litres
7. Tambapurawith a capacity of 0.1 million litres
8. Khanderao nagar with a capacity of 28 MLD
9. Nithyanand nagar with a capacity of 28 MLD
10. Girna taki with a capacity of 3.5 million Litres
There are 5 GLSR reservoirs of which two are combined; they are the Hari
Vittal Nagar with a capacity of 0.05 million Litres, Girna Taki 1 & 2 located behind
M J College with a capacity of 2.25 million Litres, Girna Taki No. 3 with a capacity
of 4.5 million Litres and Girna Taki No.4 with a capacity of 3.5 million Litres. Water
supply is provided on alternate day covering 50 % area daily.

31
Sewerage
Wastewater generation, collection, treatment and disposal
JCMC report daily water supply level of 140 Litres per person at consumer
level. In 2001 the population of Jalgaon was 3,68,681 Considering annual growth of
percent (observed in 1991-2001decade) , the population in 2010 is expected to be
about 5,10,130 Assuming a sewage return factor of 0.80 (80 %) ,the current
wastewater generated can be estimated to 57.13 MLD
Sewage return factor is the unit quantity of Sewage (wastewater) generated,
expressed as a percentage (or proportion) of water supply. E.g. sewage return factor of
0.80 indicates that sewage generation is 80% of water supplied.
Jalgaon has industrial area where waste water is treated and utilized as per the
industrial norms. The Municipal wastewater primarily consists of sullage and
overflow from septic tanks. Waste water is mainly disposed through roadside drains
of which some sections are covered in a few cases, latrines discharge is directly into
the drainage. Therefore causes a situation where the drainage system serves a dual
purpose of carrying domestic waste water (mainly sullage and overflow from
individual septic tanks) as well as rainwater runoff. This is not a desirable situation
and needs to be improved. The proposal contained in this report considers safe
containment, treatment & disposal of human excreta and community liquid waste.
The topography of Jalgaon city and the surrounding is such that the natural drainage
system generally slopes towards South-North as shown in plans of UGD project &
city development plan .Domestic wastewater from the city is discharged into four
major nalla. This is not a desirable situation.
Considering the above fact, JCMC has prepared detailed underground
drainage proposal covering 69 wards of the city except, few wards are partly covered.
As per CPHEEO manual, the design period of 30 years is considered from the year of
commissioning of the project. The commissioning year is considered 2013. The
scheme is designed for 2043 population viz.11,64,298 no’s. The Jalgaon city is
divided in to four zones, based on the topography and the availability of location for
sewerage pumping station and sewerage treatment plant .Each zone is generally
related to four major water courses i.e. natural nalla flowing through the city.

32
Zone I: - The zone I contains ward no’s 34, 35 area is completely covered and ward
no. 7,8,9,10,36 &69 are partly covered.
Zone II :-The zone II contains ward no’s 6, 11, 12, 13, 14, 27, 28, 29, 30, 31, 32, 33,
37, 38,39, 40, 54,55,56,57,58,59,60,61,62,63& 64 are completely covered .And ward
no’s 5,7,8,9,10,36,41,53,65,68&69 are partly covered.
Zone III :- The zone III contains ward no’s 1, 2, 3, 4,15,16, 17, 18, 19, 20, 24, 25, 26,
& 42 are completely covered and ward no’s 21, 23, 41, 43, 44, 52, 53 & 66 are partly
covered.
Zone IV:- The zone IV contains ward no’s 22, 45, 46, 47, 48, 49, 50, 51 & 67 are
completely covered. And ward no’s 21, 23, 43, 44, 52, 65, 66&68 are partly covered.
Out of the above wards, some of the wards are repeatedly covered under
consecutive zones according to topography of wards and the zones proposed. The
components of the sewerage scheme are designed for the peak flow 289.21 MLD in
2043 year. The sewer lines are designed for the year 2028 population and pumps and
Sewage treatment plant are proposed and designed for the population in year 2043.
However, construction is proposed in phase manner.
The sewer lines are not respected to receive storm water. The trunk sewers are
proposed along the side of nalla to which mains are proposed to be connected.
Property connections are proposed to connect branch sewer and branch sewer to trunk
sewer. The connection cost of property connection is not included in this proposed
scheme. Minimum size of sewer is 150 mm for gravity pipe line section, concrete
pipes proposed. And for rising main D.I. K-9 pipe are proposed.
Two conventional sewage treatment plants each having the capacity of 50
MLD and in immediate step two plants of 20 MLD are proposed design period of
population up to year 2043. The sewage from low line is proposed to be lifted with
submersible pump. The expected efficiency of these conventional sewage treatment
plants is considered as 85 to 87%. The treated effluent from these treatment plants are
proposed for irrigation purpose and the methane gas liberated will be used in the
premises of the plants for running the machinery and purpose of lighting. The total
cost of the sewage scheme work out is Rs. 183.77 Cr. Net and Rs. 224.20 Cr. (as per
DSR- 2007) Gross including 5% contingencies plus 2% work charge establishment.

33
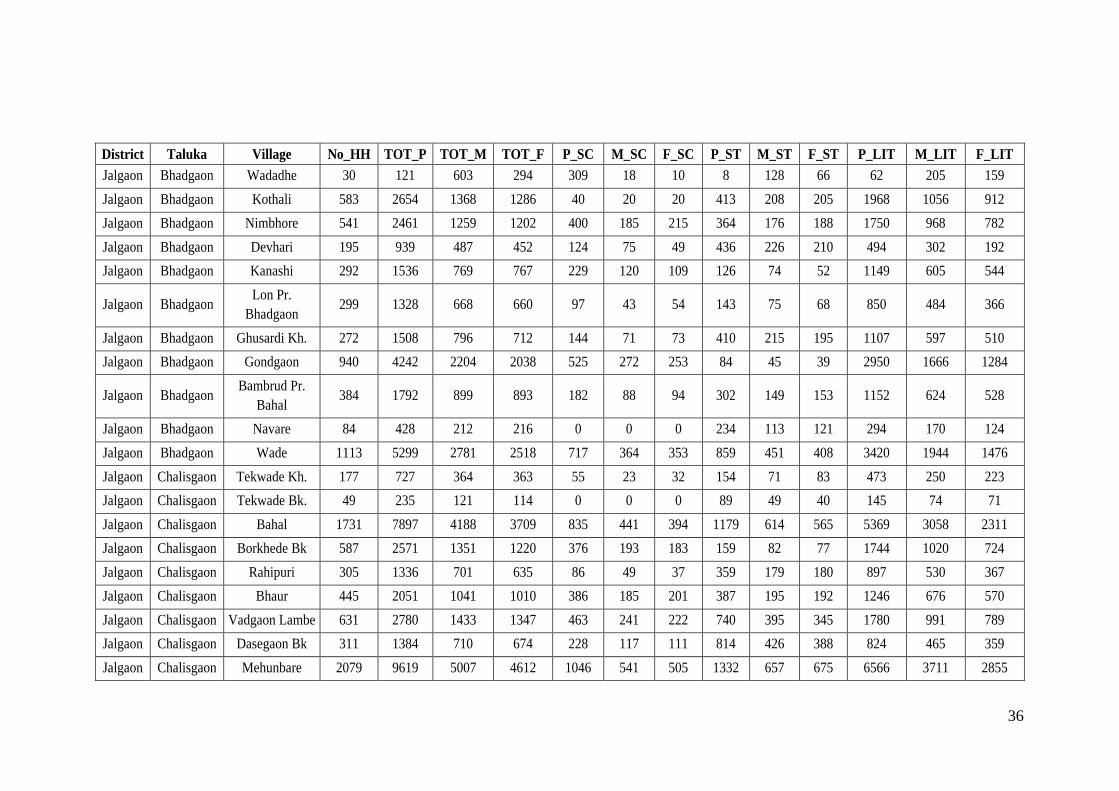
Table 2.5: List of adjoining villages to River Girna or those whose waste water comes to River Girna
District Taluka Village No_HH TOT_P TOT_M TOT_F P_SC M_SC F_SC P_ST M_ST F_ST P_LIT M_LIT F_LIT
Nasik Malegaon Amode 439 2,377 1,302 1,075 91 44 47 794 481 313 1,642 987 655
Nasik Malegaon Nardane 302 1,509 792 717 344 175 169 399 215 184 880 506 374
Nasik Malegaon Borale 413 2,198 1,142 1,056 262 134 128 744 361 383 1,241 724 517
Nasik Malegaon Malgaon 437 1,713 913 800 93 49 44 764 395 369 1,073 637 436
Nasik Malegaon Umbardhe 277 1,392 726 666 151 77 74 645 316 329 777 446 331
Nasik Malegaon Kalamdari 487 2,173 1,135 1,038 111 56 55 777 401 376 1,503 842 661
Nasik Malegaon Dahiwal 660 3,362 1,768 1,594 109 57 52 463 254 209 2,308 1,336 972
Nasik Malegaon Ronzane 255 1,480 780 700 73 37 36 504 261 243 890 510 380
Nasik Malegaon Malagaon 598 3,057 1,591 1,466 358 184 174 743 389 354 1,953 1,112 841
Nasik Malegaon Sitane 146 854 432 422 101 54 47 62 35 27 542 308 234
Nasik Malegaon Ajande Kh 118 786 411 375 66 32 34 582 297 285 343 202 141
Nasik Malegaon Khayade 434 2,232 1,146 1,086 42 21 21 396 193 203 1,600 889 711
Nasik Malegaon Namgule 141 602 332 270 48 30 18 26 11 15 470 278 192
Nasik Malegaon Gilane 360 1,766 925 841 126 66 60 267 134 133 1,274 725 549
Nasik Malegaon Khalane 128 738 388 350 23 9 14 337 172 165 417 257 160
Nasik Malegaon Ajande 236 1,227 621 606 46 25 21 151 70 81 842 456 386
Nasik Malegaon Malhanagaon 254 1,341 720 621 109 63 46 274 132 142 851 497 354
Nasik Malegaon Savandgaon 607 3,275 1,699 1,576 207 104 103 1,401 714 687 1,852 1,082 770
Nasik Malegaon Yesgaon 534 2,430 1,231 1,199 50 25 25 453 217 236 1,615 867 748
Nasik Malegaon Yesgaon Bk 742 3,699 1,904 1,795 371 185 186 726 360 366 2,427 1,373 1,054
Nasik Malegaon Maldhe 1961 11,881 6,071 5,810 53 24 29 543 261 282 7,711 4,065 3,646
Nasik Malegaon Malegaon 78501 471,312 238,868 232,444 18,106 9,143 8,963 6,320 3,166 3,154 345,816 180,272 165,544
Nasik Malegaon Dyane CT 8371 49,192 25,181 24,011 3,031 1,570 1,461 964 487 477 32,565 17,411 15,154

34
District Taluka Village No_HH TOT_P TOT_M TOT_F P_SC M_SC F_SC P_ST M_ST F_ST P_LIT M_LIT F_LIT
Nasik Malegaon Bhuigavahan 135 675 364 311 0 0 0 509 270 239 296 178 118
Nasik Malegaon Soyagaon 7336 34,341 18,070 16,271 2,143 1,100 1,043 1,942 1,015 927 28,172 15,208 12,964
Nasik Malegaon Chandanpuri 1289 6,623 3,376 3,247 743 375 368 2,389 1,190 1,199 4,218 2,365 1,853
Jalgaon Jalgaon Jalgaon 99361 460228 240590 219638 33244 17079 16165 24316 12583 11733 355368 192090 163278
Jalgaon Jalgaon Bambhori Pr.
Chandsar
1179 6392 3515 2877 639 353 286 1112 592 520 4889 2904 1985
Jalgaon Jalgaon Savkhede Bk. 835 3834 1972 1862 627 321 306 413 208 205 2862 1569 1293
Jalgaon Jalgaon Mohadi 667 4102 2297 1805 138 66 72 1307 675 632 2811 1791 1020
Jalgaon Jalgaon Nagziri 27 130 68 62 0 0 0 123 63 60 48 28 20
Jalgaon Jalgaon Shirsoli P.B. 1940 9126 4835 4291 295 150 145 1158 619 539 6185 3491 2694
Jalgaon Jalgaon Dapore 526 2516 1316 1200 99 46 53 706 382 324 1459 859 600
Jalgaon Jalgaon Kurhadade 138 753 397 356 0 0 0 221 109 112 511 313 198
Jalgaon Jalgaon Lamanjan
P.Bornar
154 734 376 358 9 4 5 95 54 41 424 240 184
Jalgaon Jalgaon Mhasawad 1787 8424 4275 4149 647 327 320 327 156 171 5656 3140 2516
Jalgaon Jalgaon Bornar 775 3757 1949 1808 139 75 64 547 279 268 2587 1460 1127
Jalgaon Pachora Dahigaon 455 1822 940 882 174 90 84 342 180 162 1233 729 504
Jalgaon Erandol Pimpri Sim 161 687 363 324 11 5 6 80 41 39 425 252 173
Jalgaon Pachora Varasade
Pr.Bornar
194 843 457 386 83 45 38 158 91 67 578 352 226
Jalgaon Pachora Mahiji 506 2617 1320 1297 267 151 116 88 40 48 1754 1009 745
Jalgaon Erandol Hanmantkhede
Sim
270 1141 597 544 73 41 32 257 129 128 681 416 265

35
District Taluka Village No_HH TOT_P TOT_M TOT_F P_SC M_SC F_SC P_ST M_ST F_ST P_LIT M_LIT F_LIT
Jalgaon Erandol Utran Gujar
Hadd
918 4179 2137 2042 220 114 106 1309 669 640 2466 1404 1062
Jalgaon Pachora Kurangi 791 3524 1796 1728 227 103 124 337 170 167 2136 1236 900
Jalgaon Pachora Bahuleshwar 7 36 21 15 0 0 0 0 0 0 16 9 7
Jalgaon Pachora Dasegaon Bk 311 1384 710 674 228 117 111 814 426 388 824 465 359
Jalgaon Erandol Utran Ahir
Hadd
964 4328 2197 2131 476 243 233 675 349 326 2718 1537 1181
Jalgaon Pachora Pardhade 336 1455 746 709 83 44 39 677 332 345 803 477 326
Jalgaon Pachora Bhatkhande Kh. 317 1,408 730 678 91 45 46 217 121 96 881 518 363
Jalgaon Pachora Anturli
Kh.Pr.Pachora
234 1110 574 536 52 26 26 250 117 133 699 420 279
Jalgaon Pachora Ozar 176 866 464 402 75 40 35 79 43 36 617 357 260
Jalgaon Pachora Mandaki 52 253 130 123 0 0 0 139 69 70 100 57 43
Jalgaon Pachora Pungaon 656 2940 1544 1396 459 247 212 553 278 275 2050 1166 884
Jalgaon Bhadgaon Bhattagaon 144 714 362 352 78 43 35 336 168 168 434 238 196
Jalgaon Pachora Bambarud Kh.
Pr.Pachora 378 1788 913 875 102 55 47 468 233 235 1189 695 494
Jalgaon Pachora Anturli Bk. 392 1686 865 821 219 111 108 343 178 165 1159 644 515
Jalgaon Pachora Lohatar 929 4026 2053 1973 192 91 101 749 377 372 2741 1590 1151
Jalgaon Bhadgaon Tongaon 627 2509 12470 6490 5980 851 431 420 851 433 418 4549 3395
Jalgaon Bhadgaon Bhadgaon (M
Cl) 7736 37214 19334 17880 1940 967 973 3249 1625 1624 26132 14538 11594
Jalgaon Bhadgaon karab 31 127 627 323 304 26 13 13 252 129 123 233 176
36
District Taluka Village No_HH TOT_P TOT_M TOT_F P_SC M_SC F_SC P_ST M_ST F_ST P_LIT M_LIT F_LIT
Jalgaon Bhadgaon Wadadhe 30 121 603 294 309 18 10 8 128 66 62 205 159
Jalgaon Bhadgaon Kothali 583 2654 1368 1286 40 20 20 413 208 205 1968 1056 912
Jalgaon Bhadgaon Nimbhore 541 2461 1259 1202 400 185 215 364 176 188 1750 968 782
Jalgaon Bhadgaon Devhari 195 939 487 452 124 75 49 436 226 210 494 302 192
Jalgaon Bhadgaon Kanashi 292 1536 769 767 229 120 109 126 74 52 1149 605 544
Jalgaon Bhadgaon Lon Pr.
Bhadgaon 299 1328 668 660 97 43 54 143 75 68 850 484 366
Jalgaon Bhadgaon Ghusardi Kh. 272 1508 796 712 144 71 73 410 215 195 1107 597 510
Jalgaon Bhadgaon Gondgaon 940 4242 2204 2038 525 272 253 84 45 39 2950 1666 1284
Jalgaon Bhadgaon Bambrud Pr.
Bahal 384 1792 899 893 182 88 94 302 149 153 1152 624 528
Jalgaon Bhadgaon Navare 84 428 212 216 0 0 0 234 113 121 294 170 124
Jalgaon Bhadgaon Wade 1113 5299 2781 2518 717 364 353 859 451 408 3420 1944 1476
Jalgaon Chalisgaon Tekwade Kh. 177 727 364 363 55 23 32 154 71 83 473 250 223
Jalgaon Chalisgaon Tekwade Bk. 49 235 121 114 0 0 0 89 49 40 145 74 71
Jalgaon Chalisgaon Bahal 1731 7897 4188 3709 835 441 394 1179 614 565 5369 3058 2311
Jalgaon Chalisgaon Borkhede Bk 587 2571 1351 1220 376 193 183 159 82 77 1744 1020 724
Jalgaon Chalisgaon Rahipuri 305 1336 701 635 86 49 37 359 179 180 897 530 367
Jalgaon Chalisgaon Bhaur 445 2051 1041 1010 386 185 201 387 195 192 1246 676 570
Jalgaon Chalisgaon Vadgaon Lambe 631 2780 1433 1347 463 241 222 740 395 345 1780 991 789
Jalgaon Chalisgaon Dasegaon Bk 311 1384 710 674 228 117 111 814 426 388 824 465 359
Jalgaon Chalisgaon Mehunbare 2079 9619 5007 4612 1046 541 505 1332 657 675 6566 3711 2855

37
District Taluka Village No_HH TOT_P TOT_M TOT_F P_SC M_SC F_SC P_ST M_ST F_ST P_LIT M_LIT F_LIT
Jalgaon Chalisgaon Umbarkhede 1514 7159 3658 3501 752 380 372 1397 686 711 4613 2562 2051
Jalgaon Chalisgaon
Pimpalwad
Mhalsa 666 3035 1593 1442 344 182 162 614 313 301 1813 1063 750
Jalgaon Chalisgaon Varkhede Kh. 157 798 389 409 7 3 4 98 47 51 439 251 188
Jalgaon Chalisgaon Varkhede Bk. 683 3420 1792 1628 205 105 100 459 231 228 2074 1213 861
Jalgaon Chalisgaon Tamaswadi 211 971 506 465 14 5 9 431 227 204 495 286 209
Jalgaon Chalisgaon Upkhede 520 2566 1315 1251 242 127 115 667 331 336 1555 877 678
Jalgaon Chalisgaon Mandurne 707 3288 1719 1569 94 52 42 531 274 257 1707 1006 701
Total 244641 1261033 662762 616321 81928 39415 37269 77842 40893 38367 923191 500963 430342

38
CHAPTER III
HYDROCHEMISTRY
Field and laboratory analysis
Direct measurements were made at each site with a digital water analysis field
set of probes, giving readings for electrical conductivity (EC), TDS and pH. In the
laboratory of School of environmental and earth Sciences, North Maharashtra
University, Jalgaon, the samples were analyzed according to the standard methods for
the examination of water and waste water (APHA, 1995) for the major and minor
elements.
All data about the location of the river water for domestic waste & Industrial
effluents used in this study are show in Table 3.1. The results of the whole
geochemical analysis are shown in table 3.1 following various major & minor
elements were described in detail
pH
On the basis of pH values, water can be grouped into three categories, viz.,
less than 7 pH as Acidic, 7 pH as Neutral and more than 7 pH as Alkaline. The pH
value of absolute pure water is 7. The pH values indicate that the all waters samples
are alkaline nature.
In the present study the values of pH in water samples is as follows
1. Surface water Girna: Maximum 8.74 and Minimum 6.9
2. Domestic Water Girna: Maximum 8.44 and Minimum 7.93
3. Industrial Samples: Maximum 8.78 and Minimum 7.38
Electrical conductivity
The electrical conductivity (EC) is a measure of the total salt content of water
based on the flow of electrical current through the sample. The higher salt content, the
greater the flow of electrical current. The range of electrical conductivity values from
the area under study in water samples (in µmohs/cm) are is as follows
1. Surface water Girna: Maximum 1166 and Minimum 349.5
2. Domestic Water Girna: Maximum 4069 and Minimum 522
3. Industrial Samples: Maximum 2920 and Minimum 897

39
Total dissolved solids
Total dissolved solids (TDS) comprise inorganic salts, principally calcium,
magnesium, potassium, sodium, bicarbonates, chlorides and sulfates and some small
amounts of organic matter that are dissolved in water. The TDS concentration is a
secondary drinking water standard and is regulated because of its aesthetic effect
rather than a health hazard. Elevated TDS indicate that the dissolved ions may cause
the water to be corrosive, of salty or brackish taste, resulting in scale formation, and
interfere and decreased efficiency of hot water heaters. It may also indicate that water
may contain elevated levels of ions that are above the primary or secondary drinking
water standards, such as: elevated levels of nitrate, etc. The dissolved substances
combined with H+ or OH
- ions alter the pH of the water and thus upsets the chemical
equilibrium.
From the results it is clear that most of the collected samples of are of fresh water
type due to TDS values less than 1000 mg/L, except 04 water samples of post
monsoon In the present study the values of TDS in water samples is as follows
1) Surface water Girna: Maximum 1166 and Minimum 196
2) Domestic Water Girna: Maximum 3073 and Minimum 394
TH
Hardness is the property of water which prevents the lather formation
with soap and increases the boiling point of water. Hardness of water mainly
depends upon the amount of calcium or magnesium salts or both. According to the
grading standards of TH (as CaCO3), groundwater can be divided into soft water
(TH<150 mg/L), moderately hard water (150<TH<300 mg/L), hard water
(300<TH<450 mg/L) and extremely hard water (TH>450 mg/L).
The range of Total Hardness values in water samples from the study area is as
follows
1. Surface water Girna: Maximum 395 and Minimum 142
2. Domestic Water Girna: Maximum 1167 and Minimum 310
3. Industrial Samples: Maximum 825 and Minimum 310
40
Sulphate
Discharge of industrial wastes and domestic sewerage tends to increase the
SO4 concentration. The utility of water for domestic purposes is severely limited by
high sulphate concentrations (> 250 mg/L). Higher SO4 content was found in the
samples are within the permissible of BIS and WHO.
The range of sulphate values in water samples from the study area is as follows
1. Surface water Girna: Maximum 30.9 and Minimum 5.92
2. Domestic Water Girna: Maximum 142.3 and Minimum 5.72
3. Industrial Samples: Maximum 13.4 and Minimum 9.8
Total Alkalinity (TA)
Higher alkalinity (TA) is noted in the Girna area.
The range of alkalinity values in water samples from the study area is as
follows
1. Surface water Girna: Maximum 340 and Minimum 155
2. Domestic Water Girna: Maximum 688 and Minimum 250
3. Industrial Samples: Maximum 720 and Minimum 280
Nitrate
Nitrate is a very important element to be controlled in the drinking water due
to its negative effects on the human health especially infants less than 2 years old,
when drinking water containing elevated amounts of nitrate (WHO, 1993). Elevated
nitrate concentrations in drinking water are assumed to be responsible for an increased
risk to blue baby specially in children if consumed for long periods. Nitrate is
generally an indication of contamination from major nitrogen sources such as a
sewage disposal system, animal manure, nitrogen fertilizers. Concerning the nitrate
concentration,
1. Surface water Girna: Maximum 39.2 and Minimum 5.92
2. Domestic Water Girna: Maximum 50.8 and Minimum 4.5
3. Industrial Samples: Maximum 7.92 and Minimum 5.9

41
Chemical Oxygen Demand (COD)
COD is measure that total quantity of oxygen required for oxidation of nearly
all organic compounds in waste waters by the action of a strong oxidizing agents
COD values indicates practically the overall pollutional streanth of raw waste,
domestic or Industrial.
Maximum permissible limit of COD for Industrial elements discharged into
inland surface water is 250 mg/l as per BIS 2490
COD values are
1. Surface water Girna: Maximum 114.4 and Minimum 61.6
2. Domestic Water Girna: Maximum 616 and Minimum 79.2
3. Industrial Samples: Maximum 65120 and Minimum 782
Salinity:
Excess of salts concentration adversely impacts on plant growth as well as soil
degradation. This leads to soil salinity.
The salinity is measure with the help of automatic digital water analysis kit.
The permissible limit of salinity is 1400 mg/l. the salinity values are
1. Surface water Girna: Maximum 1166 and Minimum 150.8
2. Domestic Water Girna: Maximum 2012 and Minimum 3456
3. Industrial Samples: Maximum 2280 and Minimum 1148
Dissolved oxygen (DO)
Atmospheric oxygen is not readily soluble in water. Its solubility is directly
proportional to its partial pressure. DO determine the pollution status of the river. DO
level of more than 3mg/l is desirable for the existence & growth of fish & such other
forms of aquatic life.
DO values are ranges from
1. Surface water Girna: Maximum 6.18 and Minimum 5.1
2. Domestic Water Girna: Maximum 7.76 and Minimum 2.48
3. Industrial Samples: Maximum 7.76 and Minimum 5.8
42
Biological Oxygen Demand (BOD)
BOD is defined amount of dissolved oxygen utilized by heterotrophic, organic
matter, present in waste water. BOD is used for determining the pollution strength of
organic waste water, domestic or industrial, inland surface water for use of raw waste
for public water supply and for bathing is 3mg/l as per BIS 2296. Domestic sewage
effluents discharged into inland surface water is 20 mg/l as per BIS 4764
BOD values are ranges from
1. Surface water Girna: Maximum 21.32 and Minimum 4.63
2. Domestic Water Girna: Maximum 98.3 and Minimum 24.63
3. Industrial Samples: Maximum 29.33 and Minimum 5.15
Evaluation of water for domestic use
Drinking water standards respectively MCL’s (Maximum contamination
levels) differ due to different scientific knowledge, different techniques to calculate
risk, economical issues (how much money is a available in a community), availability
of water resources, nature of the water resource, and the political situation. Therefore
variations between the WHO guidelines and national standards are common. The
2003 Indian standards (BIS, 2003) and the WHO (1996) guidelines that are shown in
Table 2.6 will be used as guides for the water quality evaluation of using the water for
the use of human kind.
Trace elements
The trace elements is primarily source of rock due to weathering processes and
their moderately contamination levels are usually harmless to organism. But their
concentration increased considerably harmful to human and other living organism.
Last some year’s trace element in surface water contaminated due to human activities
like agricultural chemicals, fossils fuels burning, and industrial effluent etc. It’s clear
that trace elements are entered in aquatic system from different source either point or
non point source (Elder 1988). The analysis of trace elements from water samples
were determined from different location of Girna river, which also includes domestic
water nearby city or town and industries situated nearby rivers.

43
Iron
Fe concentration maximum permissible limit of 1 mg/l for drinking purpose (BIS
2003) suggest that the all samples of the study area excellent. Fe concentrations in
water samples are observed in the ranges from are.
1. Surface water Girna: Maximum 0.207 and Minimum 0.0495
2. Domestic Water Girna: Maximum 0.13 and Minimum 0.0435
3. Industrial Samples: Maximum 24.14 and Minimum 0.19
Manganese
Mn concentration in the study area is under the maximum permissible limit
(0.5 mg/l- BIS 2003). Manganese is essential nutrient for human if the deficiency of
Mn to disruption of central nervous system and reproductive functions (MC Neely et
al. 1979). Mn concentrations in water samples are observed ranges from
1. Surface water Girna: Maximum 0.264 and Minimum 0.01
2. Domestic Water Girna: Maximum 0.09 and Minimum 0.00 (BDL)
3. Industrial Samples: Maximum 3.455 and Minimum 0.155
Nickel
The concentration of Nickel in all the water samples from the study area
within the permissible limit (0.3 mg/l, BIS -2003). The higher concentration of nickel
is harmful to human health they may be causes of lung cancer (MC Neely et. al.
1979). Ni concentrations in water samples are observed ranges from
1. Surface water Girna: Maximum 0.033 and Minimum BDL
2. Domestic Water Girna: Maximum 0.15 and Minimum BDL
3. Industrial Samples: Maximum 0.176 and Minimum BDL
Copper
The concentration of cu in all water samples collected from the study area
within the maximum permissible limit (1.5 mg/l BIS- 2003). Cu is essential element
for the human health. It has toxic affect on human health if the concentration below
the desirable limit. Anaemia, diaarrohea etc. are caused due to cu deficiency. Copper
values are

44
1. Surface water Girna: Maximum 0.1607 and Minimum 0.0012
2. Domestic Water Girna: Maximum 0.25 and Minimum 0.03
3. Industrial Samples: Maximum 0.39 and Minimum 0.15
Cadmium
The concentration of Cd in 10 (55%) water sample observed above the
maximum permissible limit (0.05 mg/l BIS 2003). Cadmium (Cd) is found in very
low concentrations in most rocks other sources of cadmium in groundwater including
burn of fossil fuels and application of fertilizer, etc. Cadmium element is not essential
to plants, animals and human. Its presence of harmful to human and all living
organism short-term exposure (over days or weeks) to high levels of cadmium in
drinking water can cause vomiting, and diarrhea. Long-term exposure (over years or
decades) to cadmium in drinking water may be cause of kidney damage (WHO 2004).
Cd values are
1. Surface water Girna: Maximum 0.0836 and Minimum BDL
2. Domestic Water Girna: Maximum 0.27 and Minimum 0.01
3. Industrial Samples: Maximum 0.2381 and Minimum 0.085
Cobalt:-
Cobalt (CO) is found in very low concentration in surface or groundwater,
generally co is found in mining area or copper mineral rich area. Cobalt is not
essential to human and animals. It’s presence in living organism they level to toxicity.
According to BIS drinking water limit of CO is 0.001mg/l CO values are
1. Surface water Girna: Maximum 0.121 and Minimum 0.001
2. Domestic Water Girna: Maximum 0.037 and Minimum 0.007
3. Industrial Samples: Maximum 0.369 and Minimum 0.121
Lead (Pb): -
The concentration of Pb in 50% water sample of study area observed above
the maximum permissible limit (0.05mg/l BIS 2003). Suggest that the 50% samples
are not suitable for drinking purpose in the study area. Lead is naturally present in
trace amounts in all biological materials i.e. in soil, water, plants and animals. The
45
main source of lead concentration is transportation. (Smirjakova S and et. Al 2005) Pb
values are
1. Surface water Tapi: Maximum 0.321 and Minimum BDL
2. Domestic Water Tapi: Maximum 0.180 and Minimum BDL
3. Industrial Samples: Maximum 0.434 and Minimum BDL
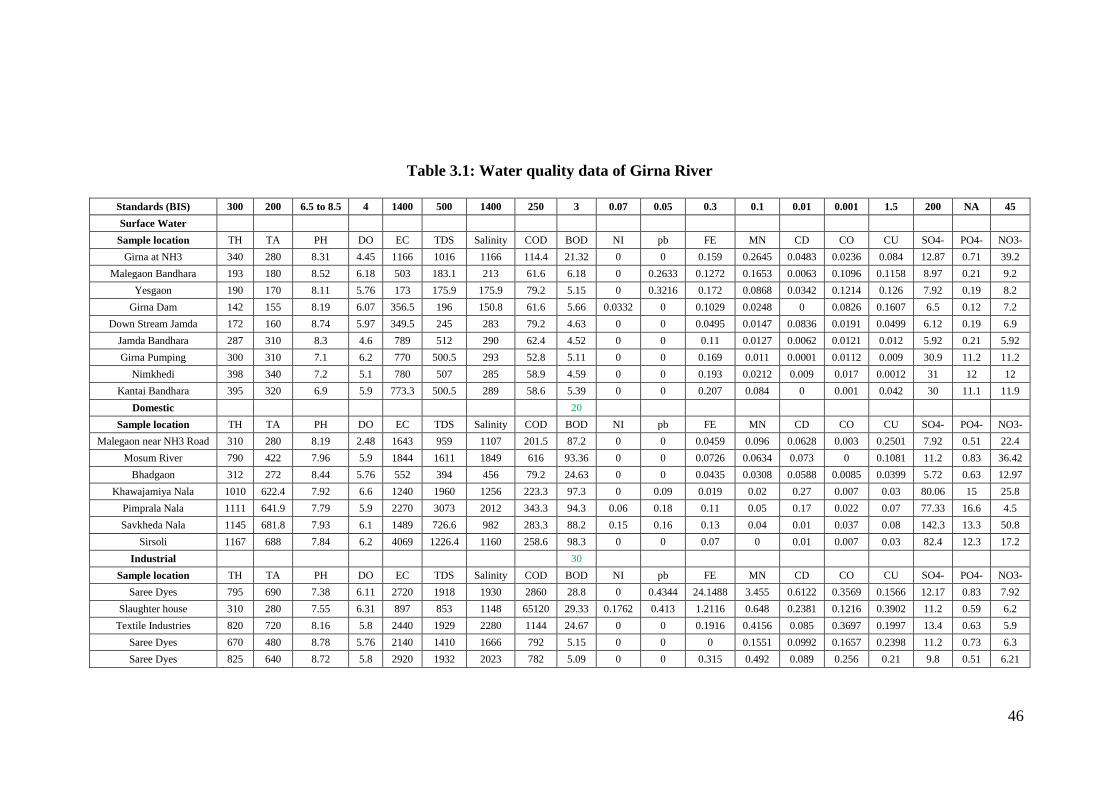
46
Table 3.1: Water quality data of Girna River
Standards (BIS) 300 200 6.5 to 8.5 4 1400 500 1400 250 3 0.07 0.05 0.3 0.1 0.01 0.001 1.5 200 NA 45
Surface Water
Sample location TH TA PH DO EC TDS Salinity COD BOD NI pb FE MN CD CO CU SO4- PO4- NO3-
Girna at NH3 340 280 8.31 4.45 1166 1016 1166 114.4 21.32 0 0 0.159 0.2645 0.0483 0.0236 0.084 12.87 0.71 39.2
Malegaon Bandhara 193 180 8.52 6.18 503 183.1 213 61.6 6.18 0 0.2633 0.1272 0.1653 0.0063 0.1096 0.1158 8.97 0.21 9.2
Yesgaon 190 170 8.11 5.76 173 175.9 175.9 79.2 5.15 0 0.3216 0.172 0.0868 0.0342 0.1214 0.126 7.92 0.19 8.2
Girna Dam 142 155 8.19 6.07 356.5 196 150.8 61.6 5.66 0.0332 0 0.1029 0.0248 0 0.0826 0.1607 6.5 0.12 7.2
Down Stream Jamda 172 160 8.74 5.97 349.5 245 283 79.2 4.63 0 0 0.0495 0.0147 0.0836 0.0191 0.0499 6.12 0.19 6.9
Jamda Bandhara 287 310 8.3 4.6 789 512 290 62.4 4.52 0 0 0.11 0.0127 0.0062 0.0121 0.012 5.92 0.21 5.92
Girna Pumping 300 310 7.1 6.2 770 500.5 293 52.8 5.11 0 0 0.169 0.011 0.0001 0.0112 0.009 30.9 11.2 11.2
Nimkhedi 398 340 7.2 5.1 780 507 285 58.9 4.59 0 0 0.193 0.0212 0.009 0.017 0.0012 31 12 12
Kantai Bandhara 395 320 6.9 5.9 773.3 500.5 289 58.6 5.39 0 0 0.207 0.084 0 0.001 0.042 30 11.1 11.9
Domestic
20
Sample location TH TA PH DO EC TDS Salinity COD BOD NI pb FE MN CD CO CU SO4- PO4- NO3-
Malegaon near NH3 Road 310 280 8.19 2.48 1643 959 1107 201.5 87.2 0 0 0.0459 0.096 0.0628 0.003 0.2501 7.92 0.51 22.4
Mosum River 790 422 7.96 5.9 1844 1611 1849 616 93.36 0 0 0.0726 0.0634 0.073 0 0.1081 11.2 0.83 36.42
Bhadgaon 312 272 8.44 5.76 552 394 456 79.2 24.63 0 0 0.0435 0.0308 0.0588 0.0085 0.0399 5.72 0.63 12.97
Khawajamiya Nala 1010 622.4 7.92 6.6 1240 1960 1256 223.3 97.3 0 0.09 0.019 0.02 0.27 0.007 0.03 80.06 15 25.8
Pimprala Nala 1111 641.9 7.79 5.9 2270 3073 2012 343.3 94.3 0.06 0.18 0.11 0.05 0.17 0.022 0.07 77.33 16.6 4.5
Savkheda Nala 1145 681.8 7.93 6.1 1489 726.6 982 283.3 88.2 0.15 0.16 0.13 0.04 0.01 0.037 0.08 142.3 13.3 50.8
Sirsoli 1167 688 7.84 6.2 4069 1226.4 1160 258.6 98.3 0 0 0.07 0 0.01 0.007 0.03 82.4 12.3 17.2
Industrial
30
Sample location TH TA PH DO EC TDS Salinity COD BOD NI pb FE MN CD CO CU SO4- PO4- NO3-
Saree Dyes 795 690 7.38 6.11 2720 1918 1930 2860 28.8 0 0.4344 24.1488 3.455 0.6122 0.3569 0.1566 12.17 0.83 7.92
Slaughter house 310 280 7.55 6.31 897 853 1148 65120 29.33 0.1762 0.413 1.2116 0.648 0.2381 0.1216 0.3902 11.2 0.59 6.2
Textile Industries 820 720 8.16 5.8 2440 1929 2280 1144 24.67 0 0 0.1916 0.4156 0.085 0.3697 0.1997 13.4 0.63 5.9
Saree Dyes 670 480 8.78 5.76 2140 1410 1666 792 5.15 0 0 0 0.1551 0.0992 0.1657 0.2398 11.2 0.73 6.3
Saree Dyes 825 640 8.72 5.8 2920 1932 2023 782 5.09 0 0 0.315 0.492 0.089 0.256 0.21 9.8 0.51 6.21

47
Graphical representation and analysis representation of Surface water Girna
Fig. 3.1: pH and DO values (Surface water Girna)
The above figure shows values of pH & DO are under prescribed limit of BIS
whereas DO values are declining at Jamda Bhandara & Nimkhedi due to stagnant
water body but it is under limit
Fig. 3.2: EC, TDS and salinity (Surface water Girna)
The above graph shows values are under limit of BIS except Girna at NH3 at
Malegaon, Jamda Bhandara, Nimkhedi shows higher TDS values. It is due to
anthropogenic sources.
0
1 2 3 4 5 6
7 8 9
10
PH
DO

48
Fig. 3.3: COD, and BOD values (Surface water Girna)
The CoD, BoD values of Girna of pH & DO are under prescribed limit of BIS,
where as DO values are declining at Jamda Bhandara & Nimkhedi due to Stagnant
water body but it is under limit
Fig. 3.4: TH and TA values (Surface water Girna)
The above graph shows values trend of TH & TA at last four stations it is due
to stagnant water body and less flow of Girna river water are under limit of BIS
except Girna at NH3 at Malegaon, Jamda Bhandara & Nimkhedi shows higher TDS
values. It is due to anthropogenic sources.
0
20
40
60
80
100
120
140
COD
BOD
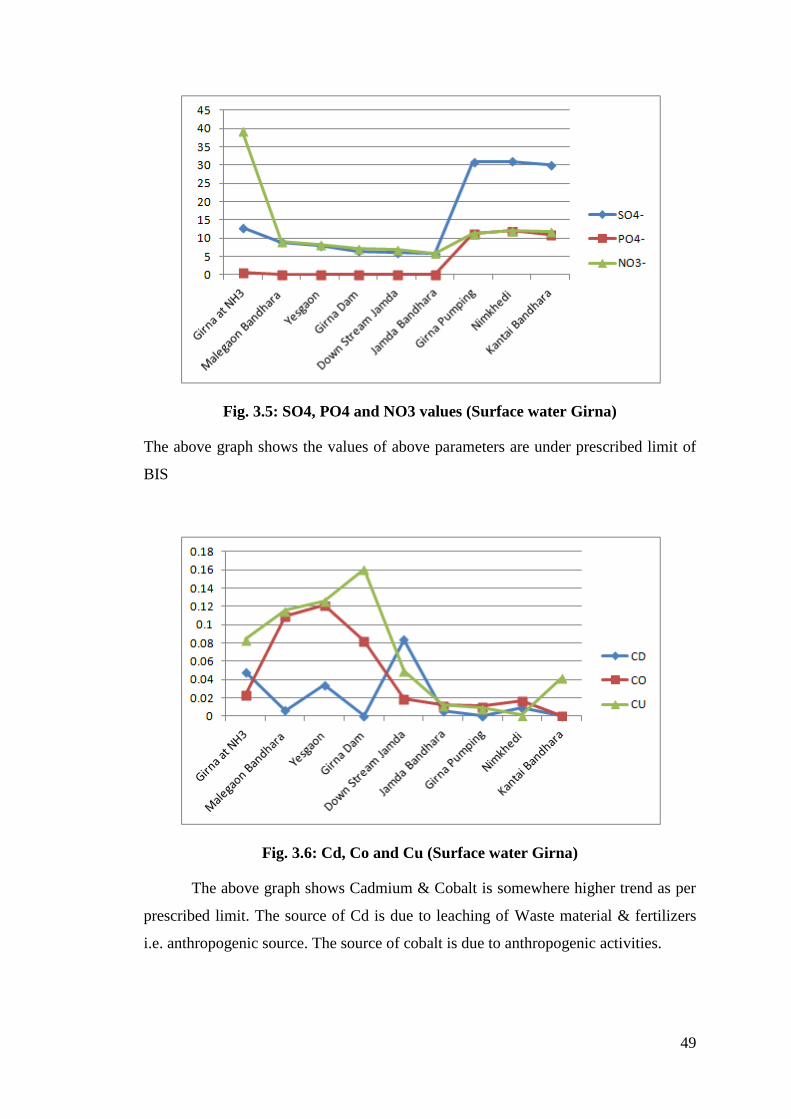
49
Fig. 3.5: SO4, PO4 and NO3 values (Surface water Girna)
The above graph shows the values of above parameters are under prescribed limit of
BIS
Fig. 3.6: Cd, Co and Cu (Surface water Girna)
The above graph shows Cadmium & Cobalt is somewhere higher trend as per
prescribed limit. The source of Cd is due to leaching of Waste material & fertilizers
i.e. anthropogenic source. The source of cobalt is due to anthropogenic activities.
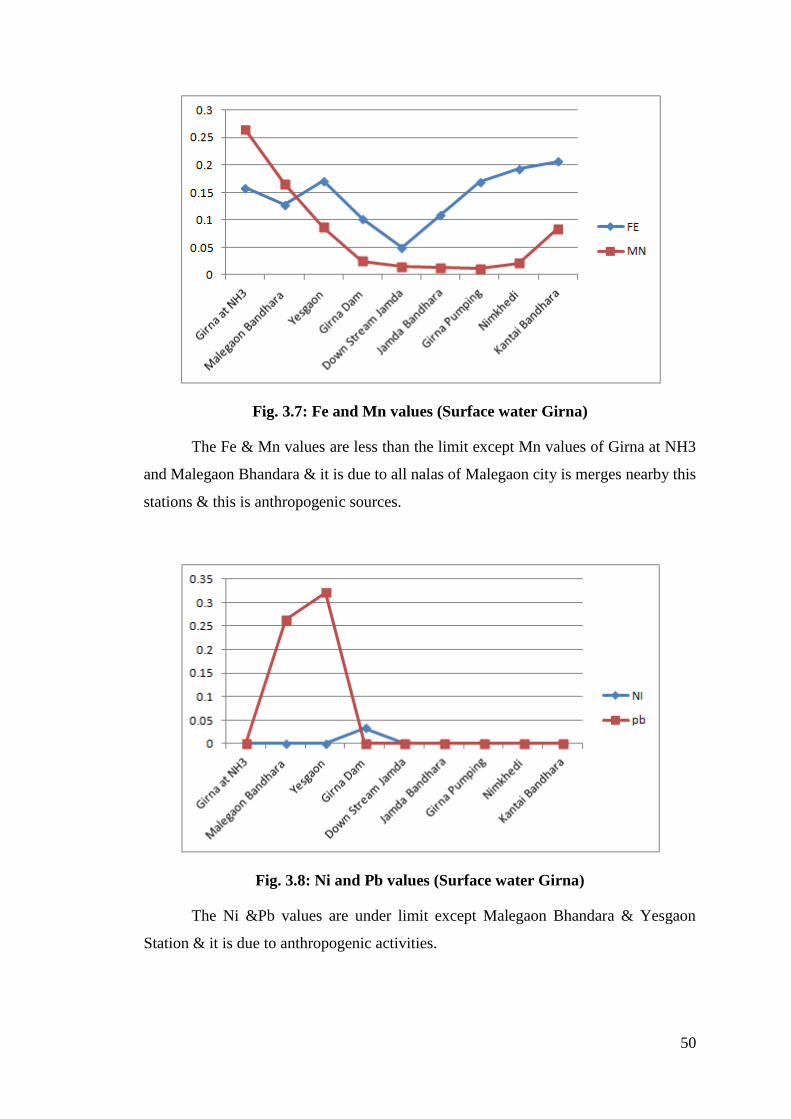
50
Fig. 3.7: Fe and Mn values (Surface water Girna)
The Fe & Mn values are less than the limit except Mn values of Girna at NH3
and Malegaon Bhandara & it is due to all nalas of Malegaon city is merges nearby this
stations & this is anthropogenic sources.
Fig. 3.8: Ni and Pb values (Surface water Girna)
The Ni &Pb values are under limit except Malegaon Bhandara & Yesgaon
Station & it is due to anthropogenic activities.

51
Graphical representation and analysis representation of Domestic waste water
Girna
Fig. 3.9: SO4, PO4 and No3 values (Domestic waste water Girna)
The above graph shows the values of above parameters are under the prescribed limit.
Fig. 3.10: TH and TA values (Domestic waste water Girna)
The above graph shows higher values of TH & TA than the prescribed limit of
BIS. It is due to anthropogenic activities of untreated domestic water.

52
Fig. 3.11: pH and DO values (Domestic waste water Girna)
The above graph shows the values are within the limit except DO value at
NH3 road at Malegaon shows less DO due to Municipal wastewater from Malegaon
city
Fig. 3.12: EC, TDS and salinity values (Domestic waste water Girna)
The above graph showing higher trend of this parameter it is due to untreated
domestic waste water
0 1 2 3 4 5 6 7 8 9
PH
DO
0 500
1000 1500 2000 2500 3000 3500 4000 4500
EC
TDS
Salinity

53
Fig. 3.13: COD and BOD values (Domestic waste water Girna)
COD, BoD values shows higher trend due to dumping waste and untreated
industrial wastewater or somewhere anthropogenic sources.
0
100
200
300
400
500
600
700
COD
BOD

54
Industrial Effluent affecting Girna
Fig. 3.14: pH and Do values (Industrial Effluent affecting Girna)
The above figure shows the values are within the limit
Fig. 3.15: EC, TDS and Salinity values (Industrial Effluent affecting Girna)
The above figure shows higher trend of EC, TDS and Salinity which is above
the prescribed limit. It is due to untreated effluent.
0
1
2
3
4
5
6
7
8
9
10
Saree Dyes Slaughter house
Textile Industries
Saree Dyes Saree Dyes
PH
DO
0
500
1000
1500
2000
2500
3000
3500
Saree Dyes Slaughter house
Textile Industries
Saree Dyes Saree Dyes
EC
TDS
Salinity

55
Fig. 3.16: BOD and COD (Industrial Effluent affecting Girna)
COD/BOD values are above the prescribed limit is due to untreated
wastewater of various Industries
Fig. 3.17: Ni and Pb values (Industrial Effluent affecting Girna)
Ni & Pb is showing higher trend due to untreated effluent
0
10000
20000
30000
40000
50000
60000
70000
Saree Dyes Slaughter house
Textile Industries
Saree Dyes Saree Dyes
COD
BOD
0
0.05
0.1
0.15
0.2
0.25
0.3
0.35
0.4
0.45
0.5
Saree Dyes Slaughter house
Textile Industries
Saree Dyes Saree Dyes
NI
pb
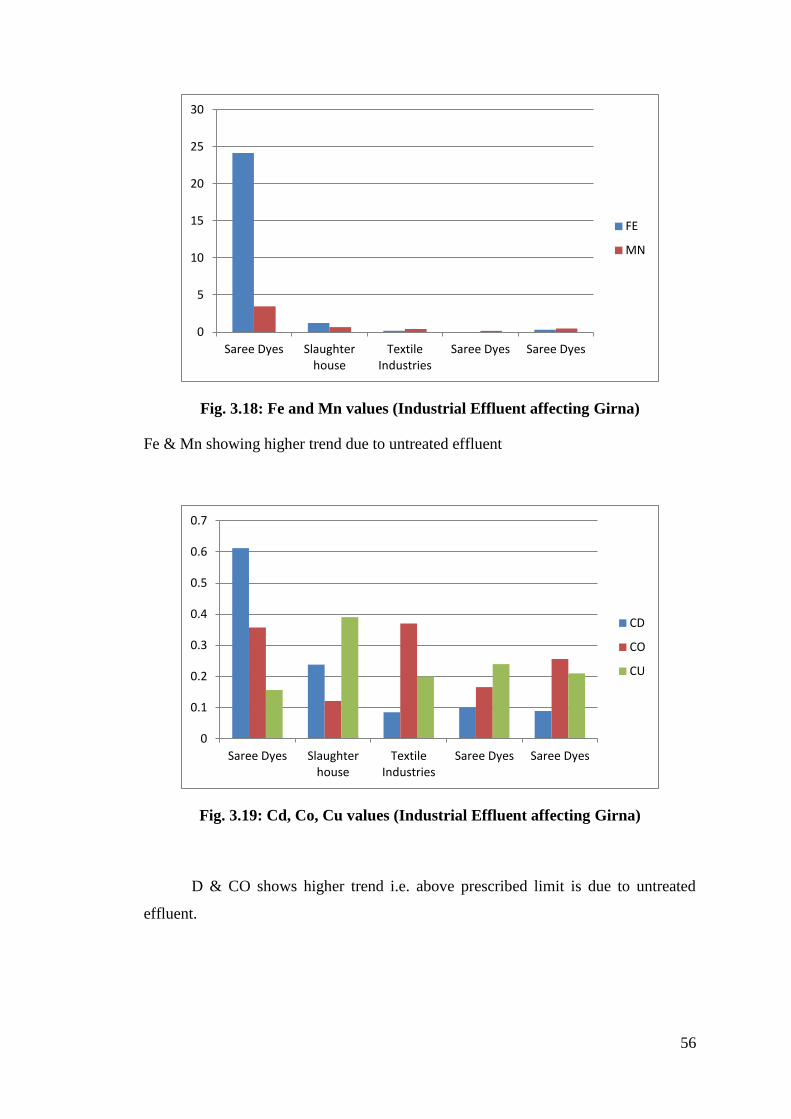
56
Fig. 3.18: Fe and Mn values (Industrial Effluent affecting Girna)
Fe & Mn showing higher trend due to untreated effluent
Fig. 3.19: Cd, Co, Cu values (Industrial Effluent affecting Girna)
D & CO shows higher trend i.e. above prescribed limit is due to untreated
effluent.
0
5
10
15
20
25
30
Saree Dyes Slaughter house
Textile Industries
Saree Dyes Saree Dyes
FE
MN
0
0.1
0.2
0.3
0.4
0.5
0.6
0.7
Saree Dyes Slaughter house
Textile Industries
Saree Dyes Saree Dyes
CD
CO
CU
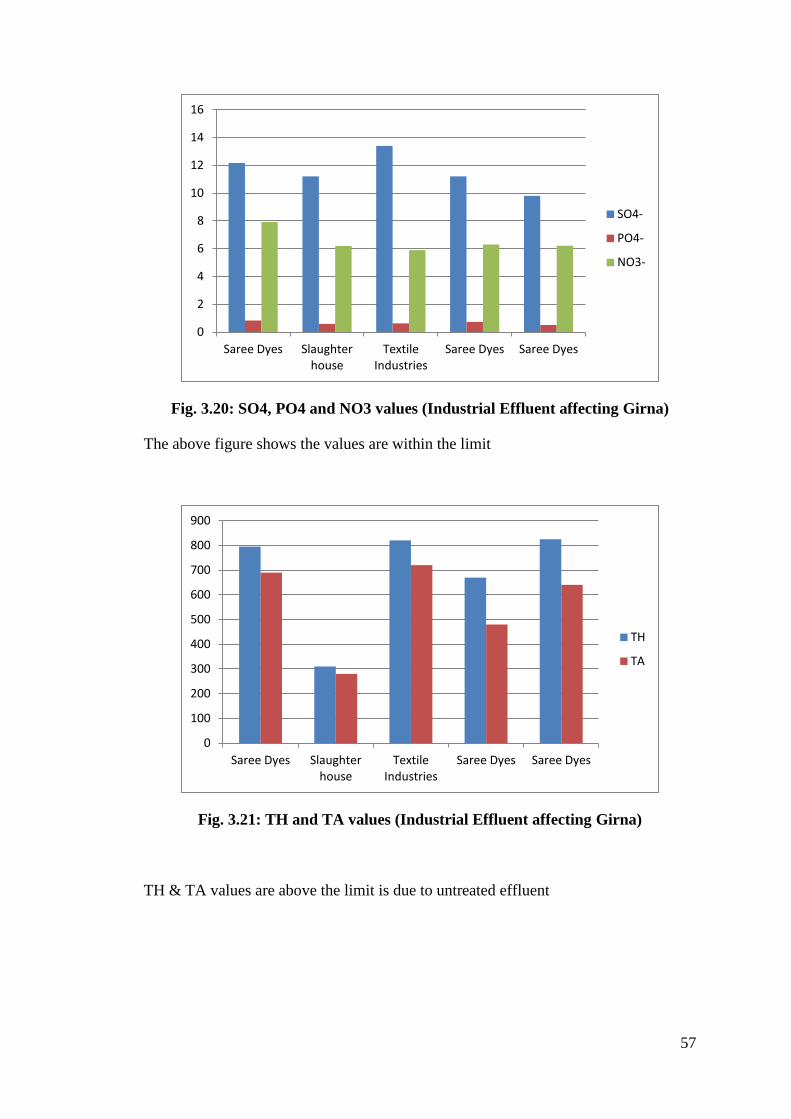
57
Fig. 3.20: SO4, PO4 and NO3 values (Industrial Effluent affecting Girna)
The above figure shows the values are within the limit
Fig. 3.21: TH and TA values (Industrial Effluent affecting Girna)
TH & TA values are above the limit is due to untreated effluent
0
2
4
6
8
10
12
14
16
Saree Dyes Slaughter house
Textile Industries
Saree Dyes Saree Dyes
SO4-
PO4-
NO3-
0
100
200
300
400
500
600
700
800
900
Saree Dyes Slaughter house
Textile Industries
Saree Dyes Saree Dyes
TH
TA

58
Pesticides
Several studies earlier reported that the pesticide exposure lead to cancer. The
relationship have been established with brain, kidney, liver, lung and skin cancers
(Gilden et al., 2010) Increased frequency of cancer has been found among farm
workers who apply these chemicals (McCauley et al. 2006). A mothr’s occupational
exposure to pesticides during pregnancy is associated with increases in her child’s risk
in the form of tumor and brain cancer (Van et al., 2010). Furthermore, studies
indicated that the pesticide exposures are associated with long-term health problems
such as respiratory problems and memory disorders (Beseler et al. 2008).
The pesticide residues are accumulated insoil and then pass to the plant
through the roots (Fismes et al., 2002; Otani et al., 2007). Contamination levels of
other vegetables do not seem to present a danger to human health according to FAQ
and WHO (2001) standards. However, the study shows contaminations of vegetables,
water and soil but it was not possible to determine long-term effects on living
organisms and ecosystem function. It is clear that the absorption of pesticide residues
present in vegetables and fruits produce may present a risk of poisoning when
consumption is associated with a regular intake in small doses (kamdem and Fofiri,
2008).
To carried out pesticide analysis of water samples to know the contamination
levels of pesticide viz. Aldrin, Di Aldrin, Heptachlor, DDT, Endosulphan, Chloro piro
phos, Ethion, Di Methonate, Malathion, Mono croto phos etc.

59
Results of Analysis
Table 3.2: Results of pesticide analysis
Sr. No Parameters Unit Mausom River Bhadgaon BIS Standards
1 DDT µg/Lit BDL BDL 1
2 Endosulphan µg/Lit 0.1 0.1 0.4
3 Aldrin µg/Lit BDL 0.01 0.03
4 Di Aldrin µg/Lit BDL BDL 0.03
5 Heptachlor µg/Lit BDL BDL BDL
6 Chloro Piro Phos µg/Lit BDL BDL BDL
7 Ethion µg/Lit BDL BDL BDL
8 Di Methonate µg/Lit BDL BDL BDL
9 Malathion µg/Lit BDL BDL 190
10 Mono croto phos µg/Lit BDL BDL BDL
Pesticide analysis result shows that the Aldrin, Di Aldrin, Heptachlor, DDT,
Endosulphan, Chloro piro phos, Ethion, Di Methonate, Malathion, Mono croto phos
etc. pesticides are found in water samples. All samples are within the prescribed limits
of BSI.(Table 3.2)

60
Table 3.3: Concentration of pesticide as per BIS Standards
Sr. No Name of Pesticide Standards
1 Aldrin 0.03
2 Dieldrin 0.03
3 Carbonyl NA
4 Chlordane NA
5 DDT 1
6 DDE NA
7 Diazion NA
8 Dichlorophos NA
9 Dicofol NA
10 Diamathoate NA
11 Endosulfan a 0.4
12 Endosulfan b 0.4
13 Fenitrothion Hydrogen Cyanide NA
14 Hexacholorocyclohexane NA
15 Parathion methyl 0.3
16 Malathion 190
17 Monochrotophos 1
18 Phosphamidon NA
19 Chloropyriphos 30
20 Thiometon NA
21 Carbendazim NA
22 Benomy Carbifuran copper NA
23 Fenthion NA
24 Phorate 2
Water samples pesticide residue results show that the examined pesticide were
observed less than 0.1 ppb ( as per above table). Relation of pesticide residue in water
shows that the pesticide values in water is observed to be in traces amount.

61
Girna water samples at Mausom river at Malegaon and Bhadgaon areas this
areas are also famous for agriculture belt & farmers and utilizing chemical fertilizers /
pesticides etc for increasing growth of food grains & it involves into river water
system. Some of traces of endosulphan and Aldrin was observed in Girna river water
system. All concentrations are within the limit but still they observed in traces.

62
CHAPTER IV
CONCLUSION, RECOMMENDATIONS AND
ACTION PLAN
From the foregoing discussions & data generated from field observations it is
clear that observations and suggestions are mostly useful for clear understanding the
area. Further recommendation & suggestions will be useful for scientific planners &
implementation will be beneficial for the management of future of the society.
Girna River originates in Nasik district of Western Ghats in Kalwan areas of
Nasik district. The area occupies under study is from Malegaon to Jalgaon city. Total
area is about 180 kms. There are many streams & nala meet river Girna, Mausom
River meets Girna at Malegaon. Malegaon is a big capital of various sectors. Many
small scale industries are situated in Malegaon. The pollution load is increases day by
day into Girna river water system. The samplings were divided into three categories
viz. surface water, domestic water and Industrial samples. Total 21 samples were
collected out of which 9 samples from surface water, 7 samples from domestic water
and 5 samples from Industrial effluent. Pesticide (two) samples were also collected
for determining the pesticide concentrations in Girna river water system.
To evaluate the overall quality of samples for determining the quality for
domestic purpose and to suggest the remedial measure for strengthening the pollution
free river water system for the benefit of the future of the society. TDS level is higher
in some samples as discussed earlier, it is due to anthropogenic sources some of heavy
metals are observed it is due to anthropogenic sources and Malegaon city waste water
merges with Girna & heavy pollution load is increases day by day so concentration of
heavy metals and other TDS values of surface water and domestic wastewater is
increases, it’s due to untreated wastewater of Malegaon & Jalgaon city. COD/BOD
values are also higher in industrial samples. It reflects that untreated industrial waste
water. So there should be an urgent need to launch treatment plan for every industry
and they should recycle the wastewater and then treated wastewater drain into nala
system. Certain heavy metals are observed above the prescribed limit especially into
Malegaon & Jalgaon city waste water nala which are drains into Girna river water
system.

63
The main source of pollution in the Girna River is untreated domestic
discharge from various villages and towns situated along the river. According to
WHO estimate, about 80% of water pollution in developing country, like India is
caused by domestic waste. The present studies were under taken to investigate the
impact of quality of water for domestic suitability.
The sampling points were chosen to cover the entire span of 180 Km of Girna
River. After primary survey of the area, 16 samples stations along the river starting
from Malegaon shown in Map no 1 were chosen for study to obtain a good
distribution of the area to evaluate the overall quality.
The average value of physicochemical data of various water samples collected
from the 16 sites in the month of Dec 2013 were tabulated in table 1. The sampling
were divided in three categories viz surface water, Domestic and Industrial samples.
Therefore there is an urgent action plan should be enforced for integrated approaches
for pollution free river water system, so that pollutants load should not be increased in
river water system. For good health of every human kind, therefore amendments are
required for utilizing the river water, use of chemical fertilizer/pesticides etc. use of
chemical fertilizer /pesticide etc. utilization in and around surface water bodies and
also domestic wastewater treatment plan, solid waste management plan for every
village or town and major cities in and around major river water areas.
There is an urgent need to launch these Recommendations & remedial
measures as shown in table 4.1 for strengthening and protecting pure water resources
which are need of the society for future.
Following recommendations were made for protecting the surface water
system and treatment is essential for domestic waste water of villages, towns & cities.
Industries should also be note the same regarding treatment of wastewater plant &
reuse the wastewater for their needs and drain treated water for societal domestic
purposes.
Measures control of water pollution:
1. Accurate calculations for water & wastewater to be done from all areas from
city & villages.
2. Underground drainage system should be done in all areas (100%) for waste
water
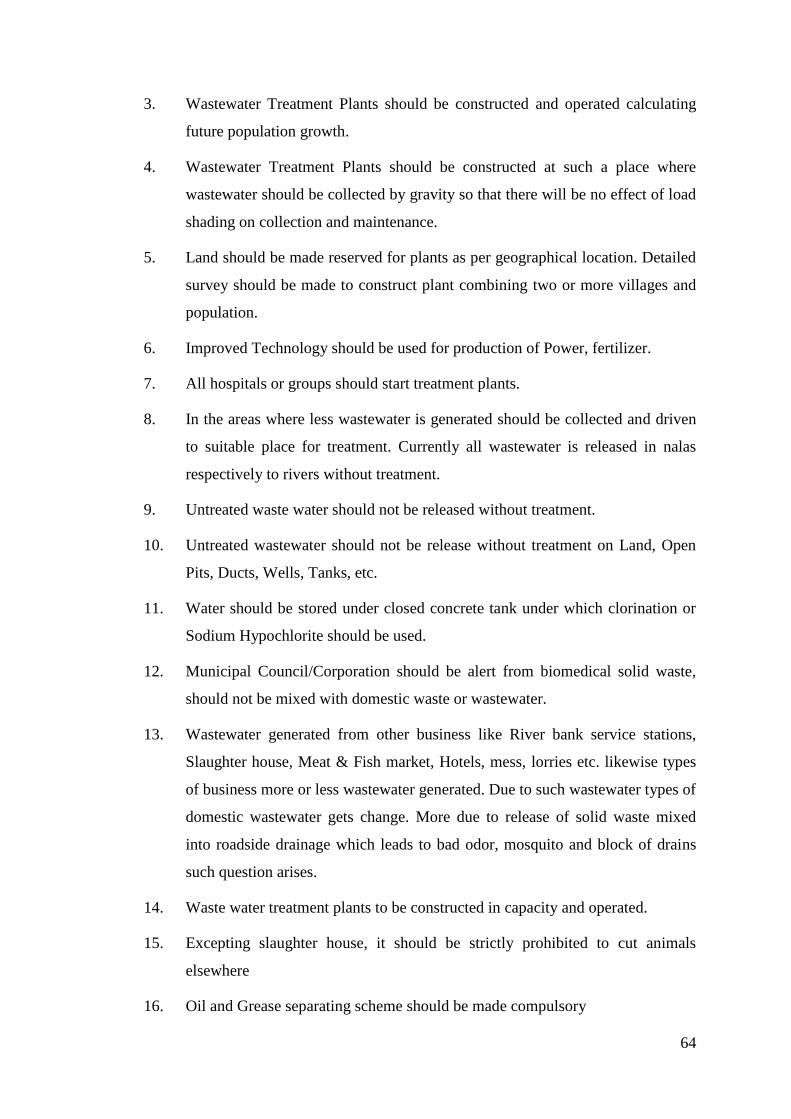
64
3. Wastewater Treatment Plants should be constructed and operated calculating
future population growth.
4. Wastewater Treatment Plants should be constructed at such a place where
wastewater should be collected by gravity so that there will be no effect of load
shading on collection and maintenance.
5. Land should be made reserved for plants as per geographical location. Detailed
survey should be made to construct plant combining two or more villages and
population.
6. Improved Technology should be used for production of Power, fertilizer.
7. All hospitals or groups should start treatment plants.
8. In the areas where less wastewater is generated should be collected and driven
to suitable place for treatment. Currently all wastewater is released in nalas
respectively to rivers without treatment.
9. Untreated waste water should not be released without treatment.
10. Untreated wastewater should not be release without treatment on Land, Open
Pits, Ducts, Wells, Tanks, etc.
11. Water should be stored under closed concrete tank under which clorination or
Sodium Hypochlorite should be used.
12. Municipal Council/Corporation should be alert from biomedical solid waste,
should not be mixed with domestic waste or wastewater.
13. Wastewater generated from other business like River bank service stations,
Slaughter house, Meat & Fish market, Hotels, mess, lorries etc. likewise types
of business more or less wastewater generated. Due to such wastewater types of
domestic wastewater gets change. More due to release of solid waste mixed
into roadside drainage which leads to bad odor, mosquito and block of drains
such question arises.
14. Waste water treatment plants to be constructed in capacity and operated.
15. Excepting slaughter house, it should be strictly prohibited to cut animals
elsewhere
16. Oil and Grease separating scheme should be made compulsory
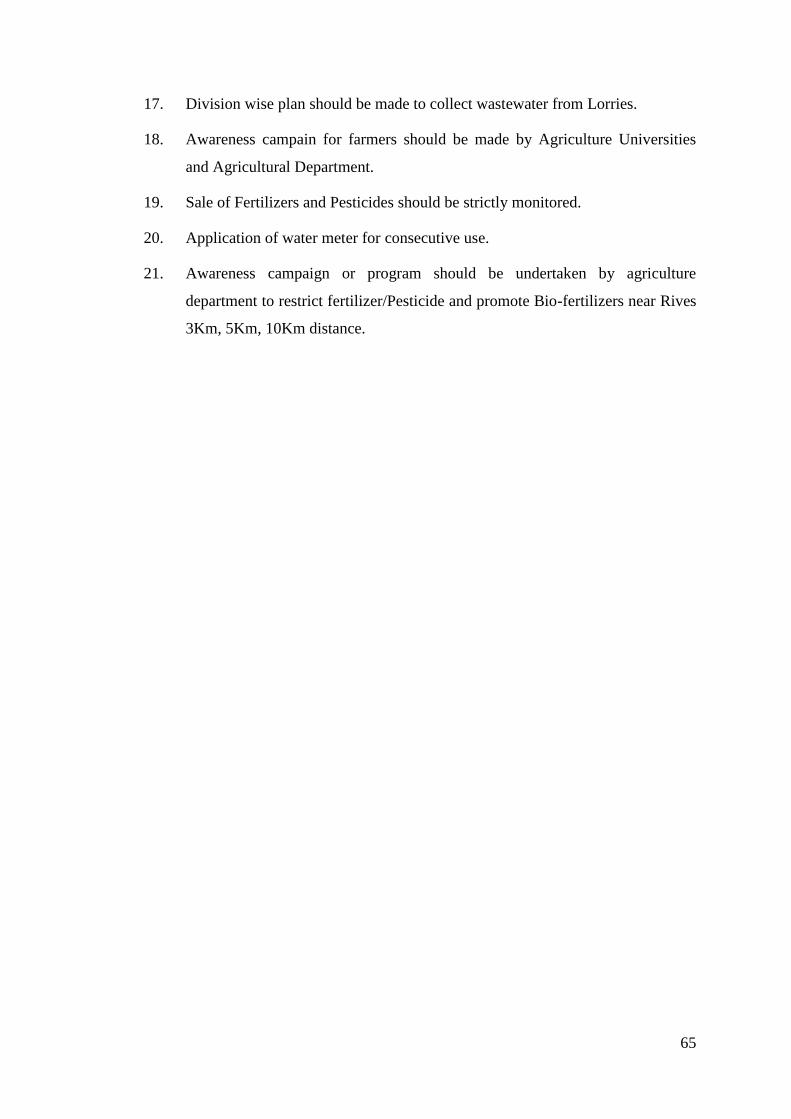
65
17. Division wise plan should be made to collect wastewater from Lorries.
18. Awareness campain for farmers should be made by Agriculture Universities
and Agricultural Department.
19. Sale of Fertilizers and Pesticides should be strictly monitored.
20. Application of water meter for consecutive use.
21. Awareness campaign or program should be undertaken by agriculture
department to restrict fertilizer/Pesticide and promote Bio-fertilizers near Rives
3Km, 5Km, 10Km distance.

66
Table 4.1: Proposed waste water management Plan for River Girna from Malegaon to Jalgaon
Sr.
No
District Taluka Village Total
Population
Water supply
Lit/Day
Waste water
Generation Lit/day
Proposed Waste water Scheme
1 Nasik Malegaon Amode 2,377 95080 76,064 Gutter with Soak Pit
2 Nasik Malegaon Nardane 1,509 60360 48,288 Gutter with Soak Pit
3 Nasik Malegaon Borale 2,198 87920 70,336 Gutter with Soak Pit
4 Nasik Malegaon Malgaon 1,713 68520 54,816 Gutter with Soak Pit
5 Nasik Malegaon Umbardhe 1,392 55680 44,544 Gutter with Soak Pit
6 Nasik Malegaon Kalamdari 2,173 86920 69,536 Gutter with Soak Pit
7 Nasik Malegaon Dahiwal 3,362 134480 107,584 Gutter with Soak Pit
8 Nasik Malegaon Ronzane 1,480 59200 47,360 Gutter with Soak Pit
9 Nasik Malegaon Malagaon 3,057 122280 97,824 Gutter with Soak Pit
10 Nasik Malegaon Sitane 854 34160 27,328 Gutter with Soak Pit
11 Nasik Malegaon Ajande Kh 786 31440 25,152 Gutter with Soak Pit
12 Nasik Malegaon Khayade 2,232 89280 71,424 Gutter with Soak Pit
13 Nasik Malegaon Namgule 602 24080 19,264 Gutter with Soak Pit
14 Nasik Malegaon Gilane 1,766 70640 56,512 Gutter with Soak Pit
15 Nasik Malegaon Khalane 738 29520 23,616 Gutter with Soak Pit
16 Nasik Malegaon Ajande 1,227 49080 39,264 Gutter with Soak Pit
17 Nasik Malegaon Malhanagaon 1,341 53640 42,912 Gutter with Soak Pit
18 Nasik Malegaon Savandgaon 3,275 131000 104,800 Gutter with Soak Pit
19 Nasik Malegaon Yesgaon 2,430 97200 77,760 Gutter with Soak Pit
20 Nasik Malegaon Yesgaon Bk 3,699 147960 118,368 Gutter with Soak Pit
21 Nasik Malegaon Maldhe 11,881 475240 380,192 Gutter with Soak Pit
22 Nasik Malegaon Malegaon 471,312 18852480 15,081,984 Closed Gutter & Treatment Plant

67
Sr.
No
District Taluka Village Total
Population
Water supply
Lit/Day
Waste water
Generation Lit/day
Proposed Waste water Scheme
23 Nasik Malegaon Dyane CT 49,192 1967680 1,574,144 Closed Gutter & Treatment Plant
24 Nasik Malegaon Bhuigavahan 675 27000 21,600 Gutter with Soak Pit
25 Nasik Malegaon Soyagaon 34,341 1373640 1,098,912 Closed Gutter & Treatment Plant
26 Nasik Malegaon Chandanpuri 6,623 264920 211,936 Gutter with Soak Pit
27 Jalgaon Jalgaon Jalgaon 460228 18409120 14,727,296 Closed Gutter & Treatment Plant
28 Jalgaon Jalgaon Bambhori Pr. Chandsar 6392 255680 204,544 Gutter with Soak Pit
29 Jalgaon Jalgaon Savkhede Bk. 3834 153360 122,688 Gutter with Soak Pit
30 Jalgaon Jalgaon Mohadi 4102 164080 131,264 Gutter with Soak Pit
31 Jalgaon Jalgaon Nagziri 130 5200 4,160 Gutter with Soak Pit
32 Jalgaon Jalgaon Shirsoli P.B. 9126 365040 292,032 Gutter with Soak Pit
33 Jalgaon Jalgaon Dapore 2516 100640 80,512 Gutter with Soak Pit
34 Jalgaon Jalgaon Kurhadade 753 30120 24,096 Gutter with Soak Pit
35 Jalgaon Jalgaon Lamanjan P.Bornar 734 29360 23,488 Gutter with Soak Pit
36 Jalgaon Jalgaon Mhasawad 8424 336960 269,568 Gutter with Soak Pit
37 Jalgaon Jalgaon Bornar 3757 150280 120,224 Gutter with Soak Pit
38 Jalgaon Pachora Dahigaon 1822 72880 58,304 Gutter with Soak Pit
39 Jalgaon Erandol Pimpri Sim 687 27480 21,984 Gutter with Soak Pit
40 Jalgaon Pachora Varasade Pr.Bornar 843 33720 26,976 Gutter with Soak Pit
41 Jalgaon Pachora Mahiji 2617 104680 83,744 Gutter with Soak Pit
42 Jalgaon Erandol Hanmantkhede Sim 1141 45640 36,512 Gutter with Soak Pit
43 Jalgaon Erandol Utran Gujar Hadd 4179 167160 133,728 Gutter with Soak Pit
44 Jalgaon Pachora Kurangi 3524 140960 112,768 Gutter with Soak Pit
45 Jalgaon Pachora Bahuleshwar 36 1440 1,152 Gutter with Soak Pit
46 Jalgaon Pachora Dasegaon Bk 1384 55360 44,288 Gutter with Soak Pit

68
Sr.
No
District Taluka Village Total
Population
Water supply
Lit/Day
Waste water
Generation Lit/day
Proposed Waste water Scheme
47 Jalgaon Erandol Utran Ahir Hadd 4328 173120 138469 Gutter with Soak Pit
48 Jalgaon Pachora Pardhade 1455 58200 46560 Gutter with Soak Pit
49 Jalgaon Pachora Bhatkhande Kh. 1,408 56,320 45056 Gutter with Soak Pit
50 Jalgaon Pachora Anturli Kh.Pr.Pachora 1110 44400 35520 Gutter with Soak Pit
51 Jalgaon Pachora Ozar 866 34640 27712 Gutter with Soak Pit
52 Jalgaon Pachora Mandaki 253 10120 8096 Gutter with Soak Pit
53 Jalgaon Pachora Pungaon 2940 117600 94080 Gutter with Soak Pit
54 Jalgaon Bhadgaon Bhattagaon 714 28560 22848 Gutter with Soak Pit
55 Jalgaon Pachora Bambarud Kh.
Pr.Pachora
1788 71520 57216 Gutter with Soak Pit
56 Jalgaon Pachora Anturli Bk. 1686 67440 53952 Gutter with Soak Pit
57 Jalgaon Pachora Lohatar 4026 161040 128832 Gutter with Soak Pit
58 Jalgaon Bhadgaon Tongaon 0 0 Gutter with Soak Pit
59 Jalgaon Bhadgaon Bhadgaon (M Cl) 37214 1488560 1190848 Closed Gutter & Treatment Plant
60 Jalgaon Bhadgaon karab 0 0 Gutter with Soak Pit
61 Jalgaon Bhadgaon Wadadhe 0 0 Gutter with Soak Pit
62 Jalgaon Bhadgaon Kothali 2654 106160 84928 Gutter with Soak Pit
63 Jalgaon Bhadgaon Nimbhore 2461 98440 78752 Gutter with Soak Pit
64 Jalgaon Bhadgaon Devhari 939 37560 30048 Gutter with Soak Pit
65 Jalgaon Bhadgaon Kanashi 1536 61440 49152 Gutter with Soak Pit
66 Jalgaon Bhadgaon Lon Pr. Bhadgaon 1328 53120 42496 Gutter with Soak Pit
67 Jalgaon Bhadgaon Ghusardi Kh. 1508 60320 48256 Gutter with Soak Pit
68 Jalgaon Bhadgaon Gondgaon 4242 169680 135744 Gutter with Soak Pit

69
Sr.
No
District Taluka Village Total
Population
Water supply
Lit/Day
Waste water
Generation Lit/day
Proposed Waste water Scheme
69 Jalgaon Bhadgaon Bambrud Pr. Bahal 1792 71680 57,344 Gutter with Soak Pit
70 Jalgaon Bhadgaon Navare 428 17120 13,696 Gutter with Soak Pit
71 Jalgaon Bhadgaon Wade 5299 211960 169,568 Gutter with Soak Pit
72 Jalgaon Chalisgaon Tekwade Kh. 727 29080 23,264 Gutter with Soak Pit
73 Jalgaon Chalisgaon Tekwade Bk. 235 9400 7,520 Gutter with Soak Pit
74 Jalgaon Chalisgaon Bahal 7897 315880 252,704 Gutter with Soak Pit
75 Jalgaon Chalisgaon Borkhede Bk 2571 102840 82,272 Gutter with Soak Pit
76 Jalgaon Chalisgaon Rahipuri 1336 53440 42,752 Gutter with Soak Pit
77 Jalgaon Chalisgaon Bhaur 2051 82040 65,632 Gutter with Soak Pit
78 Jalgaon Chalisgaon Vadgaon Lambe 2780 111200 88,960 Gutter with Soak Pit
79 Jalgaon Chalisgaon Dasegaon Bk 1384 55360 44,288 Gutter with Soak Pit
80 Jalgaon Chalisgaon Mehunbare 9619 384760 307,808 Gutter with Soak Pit
81 Jalgaon Chalisgaon Umbarkhede 7159 286360 229,088 Gutter with Soak Pit
82 Jalgaon Chalisgaon Pimpalwad Mhalsa 3035 121400 97,120 Gutter with Soak Pit
83 Jalgaon Chalisgaon Varkhede Kh. 798 31920 25,536 Gutter with Soak Pit
84 Jalgaon Chalisgaon Varkhede Bk. 3420 136800 109,440 Gutter with Soak Pit
85 Jalgaon Chalisgaon Tamaswadi 971 38840 31,072 Gutter with Soak Pit
86 Jalgaon Chalisgaon Upkhede 2566 102640 82,112 Gutter with Soak Pit
87 Jalgaon Chalisgaon Mandurne 3288 131520 105,216 Gutter with Soak Pit

70
ACTION PLAN
Action plan is prepared as per scope of work provided by the Maharashtra
Pollution Control Board (MPCB), Mumbai. Here we are prevailing action plan for
implementation of various suggestions for the wellbeing of the society.
Short Term action Plan
Sr.No. Activity Responsibility Time Frame
1 Organize awareness programs
about environment pollution
Malegaon & Jalgaon
Municipal Corporation
and Girna river
adjoining 87
Grampanchyats
One Month
2 To prepare quantum of Solid
Waste and Sewage generated
Malegaon & Jalgaon
Municipal Corporation
and Girna river
adjoining 87
Grampanchyats
One Month
3 Operate existing STP round the
clock in scientific manner
Malegaon & Jalgaon
Municipal Corporation
Immediately
4 Organize awareness programs
about promotion of organic
farming on the River bank of
villages. Restriction of chemical
Pesticide, insecticide, fertilizer
etc.
Agriculture
Department, Malegaon
& Jalgaon Municipal
Corporation and Girna
river adjoining 87
Grampanchyats CO
Immediately
5 Common toilets should be
constructed in all areas to be
covered. Stop open deification
and awareness program should be
conducted in these areas
Malegaon & Jalgaon
Municipal Corporation
and Girna river
adjoining 87
Grampanchyats CO
3 months
6 Vehicle, cloths, animal wash
should be stopped on the bank of
river and awareness program
should be conducted in river bank
areas
Malegaon & Jalgaon
Municipal Corporation
and Girna river
adjoining 87
Grampanchyats CO
3 months
7 Environment expert should be
appointed by the every concern
municipal council and ZP to
monitor the environmental aspects
in the area. Referred by MPCB,
Nasik
Malegaon & Jalgaon
Municipal Corporation
and CO
Immediately
8 For biomedical solid waste, all
hospitals or groups should treat
the same
Private and Govt
Hospital CEO
2 months
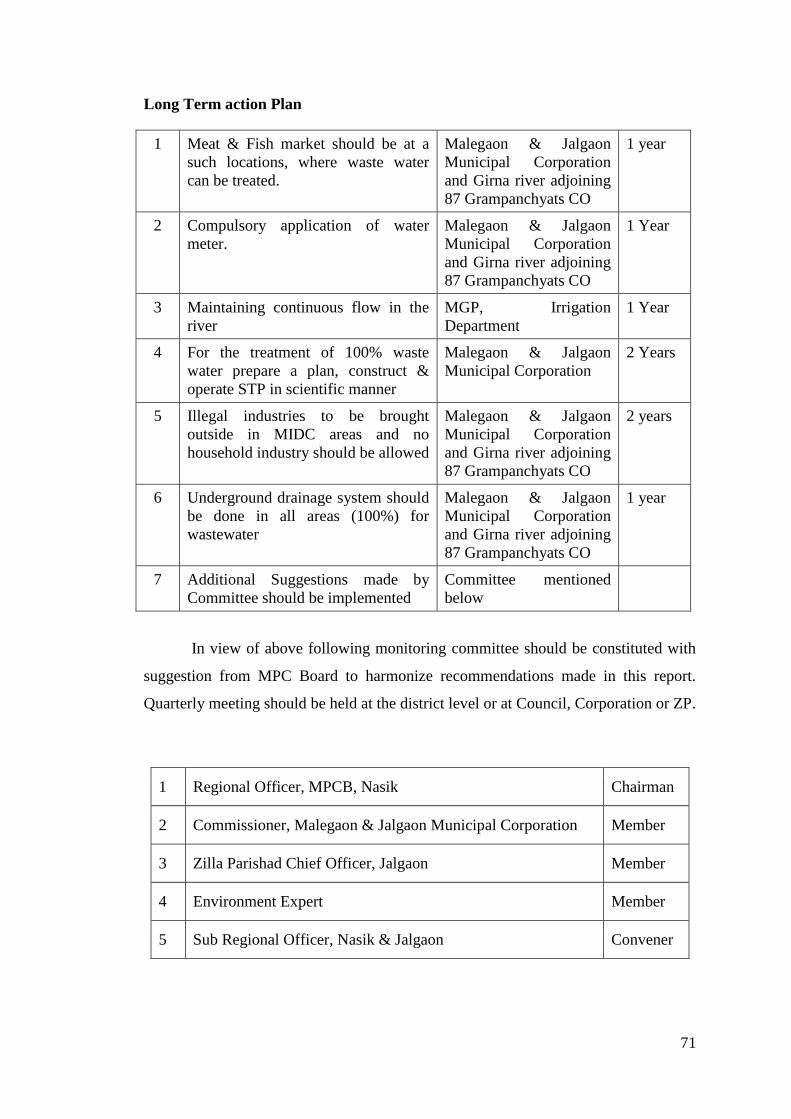
71
Long Term action Plan
1 Meat & Fish market should be at a
such locations, where waste water
can be treated.
Malegaon & Jalgaon
Municipal Corporation
and Girna river adjoining
87 Grampanchyats CO
1 year
2 Compulsory application of water
meter.
Malegaon & Jalgaon
Municipal Corporation
and Girna river adjoining
87 Grampanchyats CO
1 Year
3 Maintaining continuous flow in the
river
MGP, Irrigation
Department
1 Year
4 For the treatment of 100% waste
water prepare a plan, construct &
operate STP in scientific manner
Malegaon & Jalgaon
Municipal Corporation
2 Years
5 Illegal industries to be brought
outside in MIDC areas and no
household industry should be allowed
Malegaon & Jalgaon
Municipal Corporation
and Girna river adjoining
87 Grampanchyats CO
2 years
6 Underground drainage system should
be done in all areas (100%) for
wastewater
Malegaon & Jalgaon
Municipal Corporation
and Girna river adjoining
87 Grampanchyats CO
1 year
7 Additional Suggestions made by
Committee should be implemented
Committee mentioned
below
In view of above following monitoring committee should be constituted with
suggestion from MPC Board to harmonize recommendations made in this report.
Quarterly meeting should be held at the district level or at Council, Corporation or ZP.
1 Regional Officer, MPCB, Nasik Chairman
2 Commissioner, Malegaon & Jalgaon Municipal Corporation Member
3 Zilla Parishad Chief Officer, Jalgaon Member
4 Environment Expert Member
5 Sub Regional Officer, Nasik & Jalgaon Convener

72
PHOTO PLATE I
Mausom River flowing from Malegaon city
Confluence of Girna & Mausom river
Collection of water sample at Malegaon Bhandara
Site visit at recycle plastic factory, Malegaon
Site visit at recycle plastic factory, Malegaon Direct use of wastewater for agriculture & other purposes

73
PHOTO PLATE II
Nala adjacent to Slaughter house at Malegaon
Site visit at Textile industry at Malegaon
Factories under construction in MIDC, Malegaon
Recording information at Yesgaon
Pump house for Malegaon at Girna Dam
Dry portion of Girna River, downstream of Girna Dam
Top Related
Copyright © 2022 FDOKUMEN

