


Bahasa
Halaman
Hukum


NN Munankarmi et al. (2014) Int J Appl Sci Biotechnol, Vol 2(3): 315-327
DOI: 10.3126/ijasbt.v2i3.10950
This paper can be downloaded online at http://ijasbt.org & http://nepjol.info/index.php/IJASBT
A Rapid Publishing Journal
Available online at: http://www.ijasbt.org
&
http://www.nepjol.info/index.php/IJASBT/index
For any type of query and/or feedback don’t hesitate to email us at: [email protected]
I
ISSN 2091-2609
CrossRef, Google Scholar, Global Impact Factor, Genamics, Index Copernicus, Directory of
Open Access Journals, WorldCat, Electronic Journals Library (EZB), Universitätsbibliothek
Leipzig, Hamburg University, UTS (University of Technology, Sydney): Library,
International Society of Universal Research in Sciences (EyeSource), Journal Seeker, WZB,
Socolar, BioRes, Indian Science, Jadoun Science, Jour-Informatics, Journal Directory,
JournalTOCs, Academic Journals Database, Journal Quality Evaluation Report, PDOAJ,
Science Central, Journal Impact Factor, NewJour, Open Science Directory, Directory of
Research Journals Indexing, Open Access Library, International Impact Factor Services,
SciSeek, Cabell’s Directories, Scientific Indexing Services, CiteFactor, UniSA Library,
InfoBase Index, Infomine, Getinfo, Open Academic Journals Index, HINARI, etc.
CODEN (Chemical Abstract Services, USA): IJASKD
Vol-2(3) September, 2014 Impact factor*: 1.422
Scientific Journal Impact factor#: 3.419
IC Value: 4.37
*Impact factor is issued by Universal Impact Factor. Kindly note that this is not the IF of Journal Citation Report (JCR). #Impact factor is issued by SJIF INNO SPACE.

NN Munankarmi et al. (2014) Int J Appl Sci Biotechnol, Vol 2(3): 315-327
DOI: 10.3126/ijasbt.v2i3.10950
This paper can be downloaded online at http://ijasbt.org & http://nepjol.info/index.php/IJASBT
GENETIC DIVERSITY ASSESSMENT OF ACID LIME (Citrus aurantifolia, Swingle)
LANDRACES OF EASTERN NEPAL USING RAPD MARKERS
NN Munankarmi1, *, RL Shrestha2, N Rana3, JKC Shrestha3, S Shrestha3, R Koirala2,3 and S Shrestha3
1Central Department of Biotechnology, Tribhuvan University (T.U.), Kirtipur, Kathmandu, Nepal 2Agricultural Research Station (ARS), Pakhribas, Dhankuta, Nepal
3Nepal Academy of Science and Technology (NAST), Khumaltar, Lalitpur, Nepal
*Corresponding author email: [email protected]
Abstract Acid lime (Citrus aurantifolia Swingle) is an important commercial fruit crop, cultivated from terai to high hill landscapes of Nepal. However,
production and productivity is very low due to various reasons including infestations by various diseases and pests, lack of diseases and pests
resistant and high yielding varieties. In this context, determination of genetic variation at molecular level is fundamental to citrus breeders for
the development of elite cultivars with desirable traits. In the present study, Random Amplified Polymorphic DNA (RAPD) marker technique
has been employed to assess genetic diversity in 60 acid lime landraces representing different agro-ecological zones of eastern Nepal. Nine
selected arbitrary primers generated 79 RAPD fragments of which 75 were polymorphic (94.94%). Phenogram was constructed by NTSYS-
PC ver. 2.21i using UPGMA cluster analysis based on Jaccard’s similarity coefficient to deduce overall genetic diversity and relationships of
the acidlime genotypes under study. Sixty acid lime landraces formed seven clusters and similarity value ranged from 38% to 98% with an
average of 72%. Genetic variation at different agro-ecological zones was assessed using Popgene ver. 1.32 and found 47% to 69.6%
polymorphism. Shannon’s index and Nei’s gene diversity showed highest level of acid lime diversity in Terai zone (PPB, 69.62%; H, 0.213; I,
0.325) followed by mid-hill zone (PPB, 67.09%; H, 0.208; I, 0.317). The results obtained will be useful to citrus breeders for elite cultivar
development. The RAPD-PCR technique is found to be the rapid and effective tool for genetic diversity assessment in acid lime landraces of
Nepal.
Key words: Lime; Citrus; molecular marker; Polymerase Chain Reaction; PCR
Introduction
Acid lime (Citrus aurantifolia Swingle), member species of
family Rutaceae is commonly known as ‘Kagati’ in Nepali.
It is a rich source of vitamin “C” which is used as juice,
pickles and salad preparations. Besides, it also has
medicinal properties and used for the prevention of various
diseases such as bones and joints, piles, dysentery, cold,
influenza, constipation and scurvy (Dhillon and Randhawa,
1993). It is an important commercial fruit crop that ranks
third after mandarin and sweet orange in terms of area
coverage and cultivated in 60 out of 75 districts of terai to
high hill landscapes of Nepal (NCRP, 2012).
Production and productivity of acid lime in Nepal is low at
8.4 ton per ha (MoAC, 2011), as compared to other
countries like Argentina with 19 ton per ha and India with
12.2 ton per ha (FAO, 2006). This might be due to various
reasons including lack of high yielding varieties, low
quality planting materials, lack of use of disease resistant
rootstocks, prevalence of various bacterial, fungal and viral
diseases, lack of use of advanced crop management
practices etc. Development of elite cultivars of acid lime
with desirable qualitative and quantitative traits can be
achieved via conventional and non-conventional breeding,
protoplast fusion, genetic engineering, molecular marker
assisted breeding and mutational breeding (Dominquez et
al., 2002; Viloria and Grosser, 2005; Rauf et al., 2013).
Cultivation range of acid lime in Nepal is 800 m asl to 1400
m asl in the mid hills stretching from east to west, but
potentiality of cultivation range could be much wider from
125 m asl to 1800 m asl. The normal production period is
limited between September and December (Dhakal and
Bhattarai, 2002). High level of variation in fruit quality,
seasonality in flowering, harvesting time, productivity and
disease resistance among acid lime accessions of different
Agro ecological zones have been reported (Sapkota, 2006).
Maximum utilization of any germplasm for breeding can be
achieved by understanding the level of genetic diversity it
contains (Vinu et al., 2013). Genetic diversity estimates are
also important to understand its adaptive potential in
different environments (Lowe et al., 2004). Evaluation of
genetic divergence and relatedness among breeding
materials has significant implications for crop
improvements. And knowledge on genetic diversity in acid
lime accessions could help breeders and geneticists to
Research Article

NN Munankarmi et al. (2014) Int J Appl Sci Biotechnol, Vol 2(3): 315-327
This paper can be downloaded online at http://ijasbt.org & http://nepjol.info/index.php/IJASBT
understand the structure of germplasm and to predict which
combination would produce best offspring and facilitate in
widening up the genetic basis of breeding material for
selection (Singh, 2005).
Genetic diversity within and among different populations or
different agro-ecological regions can be assessed using
morphological, biochemical and molecular approaches
(Chawla, 2005; Vinu et al., 2013). Assessment of genetic
diversity using morphological traits is not promising as such
traits are influenced by environmental factors and
management practices (Reddy et al., 2002). Use of
biochemical markers such as isozymes and seed proteins
has been restricted due to limited availability of
polymorphic markers for genetic analyses (Shrestha, 2001).
In this context, various Polymerase Chain Reaction (PCR) -
based molecular marker tools such as Simple Sequence
Repeats (SSRs), Amplified Fragment Length
Polymorphism (AFLP), Random Amplified Polymorphic
DNA (RAPD) and Inter Simple Sequence Repeats (ISSR)
have emerged as powerful tools for screening biodiversity.
These techniques have been widely used to study the
genetic diversity, taxonomy, cultivar identification (Fang et
al., 1997; Filho et al., 1998; Novelli et al., 2000) and the
construction of genetic linkage maps (Kijas et al., 1997;
Sanker and Moore, 2001) in various Citrus spp. Of these
markers, RAPD markers (Wiliams et al., 1990) that result
from the PCR amplification of genomic DNA fragments
using short oligonucleotides (usually 10-mers) of arbitrary
sequence as primers have been widely used for diversity
analyses as they are simple to use, cost effective and
amplify multiple DNA loci through PCR (Wiliams et al.,
1990; Abkenar and Isshiki, 2003; Baig et al., 2009). Other
advantages of RAPD include requirement of very small
amounts of genomic DNA, elimination of blotting and
radio-active detection steps (Cipriani et al., 1996). For these
reasons many fruit tree crops have been successfully
fingerprinted using RAPD markers, e.g. grape (Huseyin and
Sabitagaoglu, 2008), strawberry (Sugimoto et al., 2005),
olive (Sanz-Cortes et al., 2001) and pineapple (Sripaoraya
et al., 2001). However, despite its limitations such as
sensitivity to reaction conditions, problems with
repeatability, and amplification of non-homologous
sequences, it has been successfully used for the assessment
of genetic diversity in plants (Maria et al., 2008). In citrus
species, RAPD markers have been used for various
purposes such as genetic diversity analysis (Abkenar and
Isshiki, 2003; Mariniello et al., 2004; Campos et al., 2005;
Novelli et al., 2006; Shaaban et al., 2006; Shahsavar et al.,
2007; Hvarleva et al., 2008), and phylogenetic analysis
(Nicolosi et al., 2000).
Acid lime is a cross-pollinated crop with wide sexual
compatibility between Citrus and related genera. Besides,
high frequencies of bud mutation, a high level of genetic
erosion and narrow genetic base have also been reported in
acid lime (Scora, 1988). Furthermore, low quality planting
materials and poor orchard management practices are also
contributing factors for low quality fruits and production
(NCRP, 2012; Shrestha et al., 2012a). A survey conducted
in 14 major cities of Nepal showed that 94.5% (1875.0 tons)
of lime sold from Kalimati market (one of the wholesale
markets at Kathmandu) and 68% of the lime sold in rest 13
cities were imported from India (Dhakal and Bhattarai,
2002). In this context, development of elite acid lime
cultivars with desirable traits such as disease resistance,
nematode resistance, high yield, juice content etc., holds
great promise. Therefore, study of genetic diversity of acid
lime landraces of Nepal at molecular level is one of the
fundamental tasks to be performed for this purpose.
Genetic diversity assessment of acid lime landraces of
Indian origin has been carried out recently using RAPD
markers (Kumar et al., 2013). Prior to this study, SSR based
genetic diversity analysis was carried out using same acid
lime samples of eastern Nepal (Shrestha et al., 2012a).
Selection of elite acid lime genotypes based on phenotypic
attributes and physicochemical properties have also been
carried out using same samples used in this study (Shrestha
et al., 2012b). In the present study, an attempt has been
made to evaluate the genetic diversity of existing acid lime
landraces at different agro ecological zones of Eastern
Nepal using dominant marker system, the RAPD.
Materials and Methods
Sample collection and DNA isolation
A total of 60 young expanding healthy leaf samples (6 - 8
weeks old) were collected for DNA extraction from the
farmer’s orchards of eastern Nepal (Fig. 1) and dried
immediately in silica gel in a air tight plastic container and
brought to Molecular Biotechnology Laboratory, Nepal
Academy of Science and Technology (NAST), Khumaltar
for DNA extraction and subsequent molecular analysis.
Leaf samples were collected randomly, from the selected
trees of three agro-ecological domains representing Terai,
Mid-hills and High-hills (Table 1)
Leaf tissues (100 mg) were ground to a fine powder in liquid
nitrogen. The total genomic DNA was extracted by
following manufacturer’s instruction of DNeasy Plant DNA
extraction mini-kit (QIAGEN, www//qiagen.com). The
extracted DNA (200 µl) was stored at –20˚C until use. The
quantity and quality of DNA were determined by
spectrophotometer (Bio-photometer, Eppendorf, Germany).

NN Munankarmi et al. (2014) Int J Appl Sci Biotechnol, Vol 2(3): 315-327
This paper can be downloaded online at http://ijasbt.org & http://nepjol.info/index.php/IJASBT
Table 1 Altitudinal range, accessions number and locality details of sample collection sites of acid lime landraces
Above 1200 m asl 600-1200 m asl Less than 600 m asl
Acc. No Altitude VDC-Ward no Acc. no Altitude VDC-Ward
no
Acc. No Altitude VDC-Ward
no
LT-1 1605 Okhre-8 LD-49 1185 Bodhe-1 LM-43 135 Sunpur-2
LT-17 1750 Fachmara-7 LKv-60 1285 Balara-1 LM-44 135 Sunpur-2
LT-18 1710 Fachmara-9 LKm-61 1285 Balara-1 LD-45 135 Sunpur-2
LT-15 1655 Fachmara-9 LKr-62 1285 Balara-1 LD-58 135 Sunpur-2
LD-50 1638 Rajarani-9 LD-48 1181 Bodhe-1 LS-34 128 Narsing-2
LT-8 1505 Okhre-8 LD-25 1180 Balara-1 LS-35 128 Narsing-4
LT-22 1505 Sudap-1 LD-26 1175 Balara-1 LS-36 128 Narsing-4
LT-9 1500 Okhre-5 LD-27 1175 Balara-1 LS-37 128 Narsing-4
LT-21 1485 Fachamara-1 LD-28 1175 Balara-1 LS-38 128 Narsing-4
LT-20 1410 Fachamara-8 LD-29 1175 Balara-1 LS-39 128 Narsing-4
LT-16 1405 Fachamara-7 LD-30 1175 Balara-1 LS-40 128 Narsing-4
LT-19 1350 Fachamara-7 LD-59 1175 Balara-1 LS-41 128 Narsing-4
LT-13 1315 Fachamara-7 LT-4 1155 Okhre-1 LS-42 128 Narsing-4
LT-12 1310 Fachamara-7 LT-5 1155 Okhre-3 LS-56 128 Narsing-4
LT-14 1308 Fachamara-7 LT-6 1150 Okhre-3 LS-57 128 Narsing-4
LT-23 1308 Sudap-7 LD-31 1150 Dhnk -3 LM-51 125 Pathari-2
LT-3 1305 Okhre-8 LT-7 1145 Okhre-2 LM-52 125 Pathari-2
LD-24 1290 Balehara-8 LT-10 1135 Okhre-3
LT-2 1285 Okhre-1 LT-11 1130 Okhre-3 LM-54 125 Pathari-2
LD-46 1278 Bodhe-2 LD-32 1130 Balhra-3 LM-55 125 Pathari-2
LD-33 1130 Balhra-1 - - -
Note: LT = Lime Terhathum, LD = Lime Dhankuta, LM = Lime Morang, LS = Lime Sunsari, LKm = Lime Madrasi, LKr =
Lime Rampur, LKv = Lime Bana-rasi, VDC = Village Development Committee, m = meter, asl = above sea level.
Fig. 1: Map of Nepal showing sample collection sites
RAPD-PCR amplification and primer screening
RAPD-PCR reaction conditions were optimized by varying
concentration of different PCR parameters such as template
DNA, MgCl2 and primer. RAPD cycling condition
described by Edwards (1998) was used for the optimization
and subsequent RAPD profiling experiments. The PCR

NN Munankarmi et al. (2014) Int J Appl Sci Biotechnol, Vol 2(3): 315-327
This paper can be downloaded online at http://ijasbt.org & http://nepjol.info/index.php/IJASBT
program consisted of initial denaturation at 95˚C for 2 min,
45 cycles of 95˚C for 20 sec, followed by annealing at 37˚C
for 1 min; extension at 72˚C for 1 min and final elongation
at 72˚C for 10 minute. Using optimized RAPD-PCR
reaction conditions, 40 arbitrary UBC primers (Vancouver,
Canada) were screened using one genomic DNA sample of
acid lime. Of these 40 primers, nine primers that produced
multiple, scorable polymorphic and reproducible bands
were finally selected for RAPD profiling involving all acid
lime landraces under study. PCR amplification was
performed in 25μL reaction volume in Thermal cycler
(Bioer Technology Co. Ltd., China Version 2001.1.0)
containing 0.1 mM dNTPs, 3 mM MgCl2, 2.5 μl of 10× Taq
buffer [100 mM Tris-HCl, pH 8.8 at 25˚C, 500 mM KCl
0.8% (v/v), Nonidet P40], 2.0 U Taq DNA polymerase
(Fermentas, Life sciences; 5 U/μl), 0.4 pmol of each primer
(Eurofins Genomic Test Pvt. Ltd., Banglor, India) and 25
ng of template DNA.
PCR products were analyzed on 1.5% (w/v) agarose gel
after running in 1X TAE Buffer at 100 V for 45 minutes (9.0
V/cm) and Ethidium Bromide staining (0.5μg/ml)
(Sambrook and Russell, 2001) for visualization and
documentation using Gel doc system (Syngene, UK). The
molecular size of PCR products was estimated by
comparing the position of bands with 100 bp plus DNA
ladder (Gene Ruler TM, Fermentas, Life Sciences).
RAPD profiling and data analysis
All nine primers selected from primer screening experiment
were used for RAPD profiling of all 60 acid lime landraces
under study. RAPD profiles generated by each of the nine
primers were used to generate a binary data matrix with
‘0’‘1’ coding, where the presence of the band corresponded
to value 1 and the absence to value 0. Amplification failure
was scored as “9”, which was designated in the analysis
procedure as an indicator of missing data (Transue et al.,
1994). The binary data matrix created was analysed using
MS- Excel 2007 for the estimation of the banding
characteristics namely: 1) Total number of bands (TNB), 2)
number of polymorphic bands (NPB), 3) Percent
Polymorphism (PP), 4) Polymorphic Information Content
(PIC), and 5) Resolving Power (RP) for each primer used,
which are defined by, PP = NPB/TNB generated by each
primer.
Where, Pij is the frequency of the ith pattern revealed by the
jth primer summed across all patterns revealed by the
primers, where P is the proportion of accessions containing
the band. RP was calculated as (Prevost and Wilkinson,
1999).
We used statistical software NTSYS-PC version 1.7 (Rohlf,
2009) to deduce genetic similarity and relationships among
acid lime accessions collected from different agro-
ecological zones and to construct the phenogram. Similarity
indices were calculated using SIMQUAL (Similarity for
Qualitative data) computational algorithm. Based on
similarity matrices, Sequential, Agglomerative, Hierarchial
and Nested (SAHN) clustering was performed using
UPGMA algorithm (Sneath and Sokal, 1973). Estimates of
similarity was computed on the basis of Jaccard’s
coefficient (Jaccard, 1908).
Sij = a/a+b+c
Where,
Sij = the similarity between two individuals, i and j;
a = the number of bands present in both i and j;
b = the number of bands present in i and absent in j;
c = the number of bands present in j and absent in i, and
d = the number of bands absent in both i and j.
Genetic Relationships among the Acidlime accessions were
also studied using a Principal Coordinate Analysis (PCoA)
using (MVSP) Multivariate statistical package version 3.2
(Kovach, 2007). Genetic diversity assessment of Acidlime
landraces in different agro-ecological zones was determined
by computing Shannon’s Information Index (I) and Nei’s
gene diversity (H) (Yeh et al., 1997).
Results
Estimation of genetic polymorphism in acid lime
accessions using RAPD primers
Out of 40 UBC RAPD primers, 26 primers gave
amplification products with acid lime genomic DNA.
However, only nine primers amplified multiple
polymorphic scorable bands and hence selected for RAPD
profiling involving all 60 acid lime landraces. The RAPD
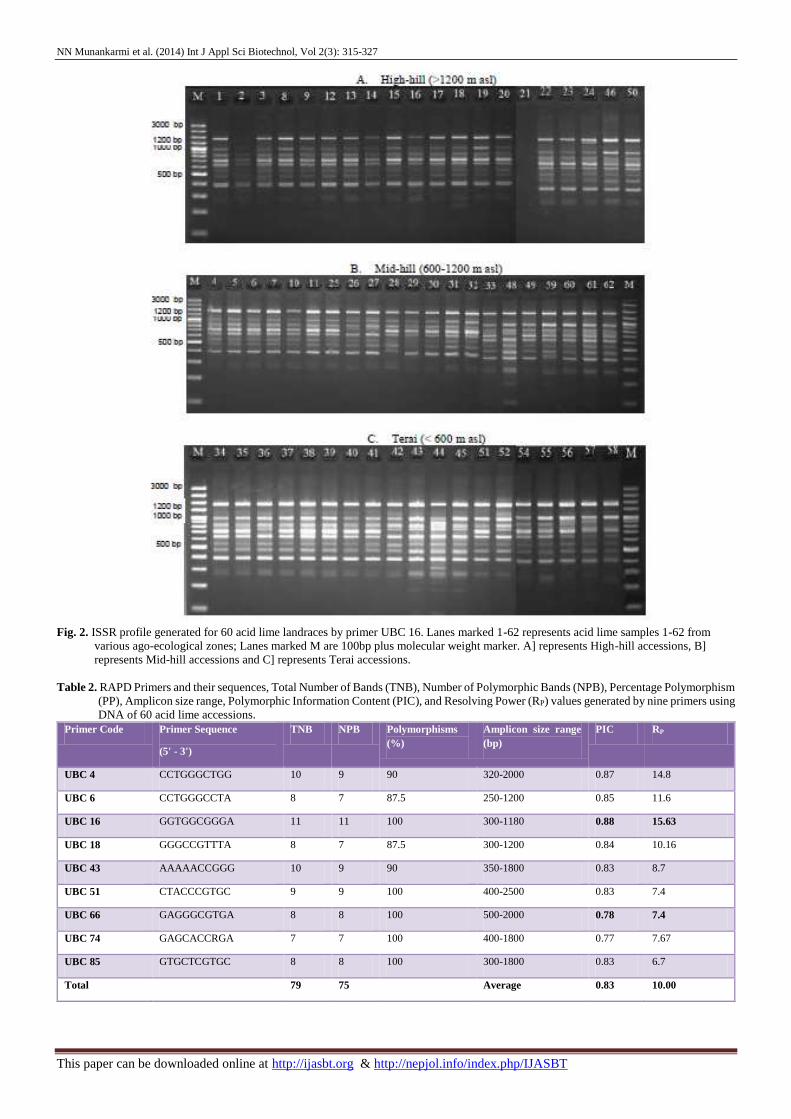
gel picture amplified by primer UBC 16 is shown in Fig. 2.
A total of 79 loci were amplified by nine primers across 60
acid lime accessions, of which 75 were polymorphic and 4
were monomorphic. The average number of bands per locus
was 8.8, where highest number (11) of amplified bands was
observed for primer UBC 11 and lowest (7) for primer UBC
74. The maximum number of polymorphic bands (11) was
amplified by the primer UBC 16 and minimum (7) by
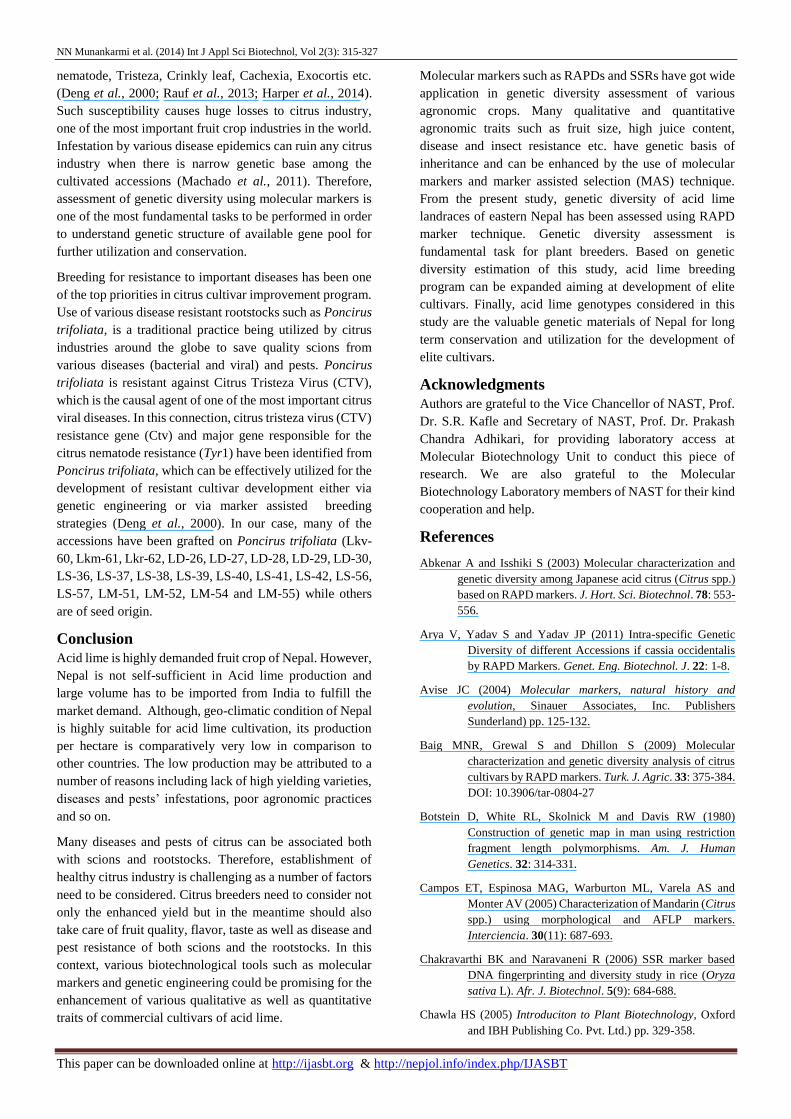
primers UBC 18, UBC 74 and UBC 6. The percentage
polymorphism ranged from 87.5% to 100% with an average
value of 94.94%. The amplicon size ranged from 250 bp to
2500 bp. The PIC value ranged from 0.78 for primer UBC
66 to 0.88 for primer UBC 16 with an average value of 0.83.
Similarly, the Resolving Power (RP) of RAPD primers
ranged from 7.4 (UBC 66) to 15.63 (UBC 16) with an
average of 10.0 (Table 2).
NN Munankarmi et al. (2014) Int J Appl Sci Biotechnol, Vol 2(3): 315-327
This paper can be downloaded online at http://ijasbt.org & http://nepjol.info/index.php/IJASBT
Fig. 2. ISSR profile generated for 60 acid lime landraces by primer UBC 16. Lanes marked 1-62 represents acid lime samples 1-62 from
various ago-ecological zones; Lanes marked M are 100bp plus molecular weight marker. A] represents High-hill accessions, B]
represents Mid-hill accessions and C] represents Terai accessions.
Table 2. RAPD Primers and their sequences, Total Number of Bands (TNB), Number of Polymorphic Bands (NPB), Percentage Polymorphism
(PP), Amplicon size range, Polymorphic Information Content (PIC), and Resolving Power (RP) values generated by nine primers using
DNA of 60 acid lime accessions.
Primer Code Primer Sequence
(5' - 3')
TNB NPB Polymorphisms
(%)
Amplicon size range
(bp)
PIC RP
UBC 4 CCTGGGCTGG 10 9 90 320-2000 0.87 14.8
UBC 6 CCTGGGCCTA 8 7 87.5 250-1200 0.85 11.6
UBC 16 GGTGGCGGGA 11 11 100 300-1180 0.88 15.63
UBC 18 GGGCCGTTTA 8 7 87.5 300-1200 0.84 10.16
UBC 43 AAAAACCGGG 10 9 90 350-1800 0.83 8.7
UBC 51 CTACCCGTGC 9 9 100 400-2500 0.83 7.4
UBC 66 GAGGGCGTGA 8 8 100 500-2000 0.78 7.4
UBC 74 GAGCACCRGA 7 7 100 400-1800 0.77 7.67
UBC 85 GTGCTCGTGC 8 8 100 300-1800 0.83 6.7
Total 79 75 Average 0.83 10.00

NN Munankarmi et al. (2014) Int J Appl Sci Biotechnol, Vol 2(3): 315-327
This paper can be downloaded online at http://ijasbt.org & http://nepjol.info/index.php/IJASBT
Estimation of overall genetic diversity of acid lime
accessions using similarity coefficients and PCoA
The binary data derived from amplified bands of RAPD
markers were used to create similarity matrix to estimate
genetic similarity among acid lime accessions. Based on
Jaccard’s similarity coefficient level (Nei and Li, 1979),
genetic similarity among acid lime landraces ranged from
38% to 100% with an average of 72%. A maximum
similarity of 100% was observed between accessions LS-39
and LS-40 while minimum similarity of 38% was observed
between LS-56 and LT-16 accessions.
Total accessions were separated into two major clusters (I
and II) and five (III, IV, V, VI and VII) minor clusters.
Majority of accessions were grouped into cluster I followed
by cluster II separated at 0.717 similarity coefficient level.
There were narrow genetic distance among cluster groups I,
II and VII (73.1%, 72% and 71.7% respectively), where as
cluster groups III, IV, and VI were observed to have wider
diversity (67.1%, 61.8%, 60% respectively). The cluster
group VII has been observed higher level of dissimilarity
(0.54%) than the other groups (Fig 3).
A PCoA (Principal Co-ordinate analysis) based on the
Euclidean distance matrix revealed that the first axis
comprised of Eigen value of 158.5 and percentage of
variance of 19.209% whereas second axis comprised of
Eigen value of 99.197 and percentage of variance of
12.022% with a cumulative variance of 31.232% (Table 5).
Plots of the first two coordinates were used to generate a
PCoA graph (Fig. 4).
Genetic diversity estimation of acid lime in different agro-
ecological domains
Genetic diversity of acid lime landraces from different agro-
ecological zones were assessed on the basis of Percentage
of Polymorphic Band (PPB), Nei’s Gene Diversity (H) and
Shannon’s Information Index (I) using Popgene ver. 1.32.
All the diversity indices were highest in terai accessions
(PPB, 69.62%; H, 0.213; I, 0.325) followed by mid-hill and
high-hill (Table 4).
Table 3. Two major and four minor clusters along with their accessions.
S.N Clusters Accessions
1 I LT-1, LT-15, LT-3, LT-13, LT-18, LT-17, LT-20, LT-14, LD-24, LT-8, LD-31, LD-27, LD-30, LT-4,
LD-25, LT-6, LT-5, LT-11, LT-7, LT-10, LT-9, LT-12, LD-32, LT-21, LT-22, LT-23, LD-28, LD-29,
LD-33, LS-36, LD-26
2 II LD-46, LS-41, LS-37, LS-38, LS-39, LS-40, LS-34, LS-35, LKm-61, LKr-62, LM-51, LD-50, LD-48,
LS-42, LM-44, LM-43, LD-45, LKv-60, LM-54, LM-55, LD-49, LM-52
3 III LT-19
4 IV LT-16
5 V LD-59, LS-57
6 VI LT-2
7 VII LS-56, LD-58
Table 4 Genetic variation of acid lime landraces at different agro-ecological zones.
Agro-ecological zone Sample Size Number of polymorphic bands PPB (%) H I
High-hill 20 59.49 47.000 0.178 0.272
Mid-hill 21 53.00 67.090 0.208 0.317
Terai 19 55.00 69.620 0.213 0.325
Average 55.83 63.820 0.197 0.300
Species level
(Multiagro-ecological zone)
60 75.00 94.940 0.231 0.369

NN Munankarmi et al. (2014) Int J Appl Sci Biotechnol, Vol 2(3): 315-327
This paper can be downloaded online at http://ijasbt.org & http://nepjol.info/index.php/IJASBT
Fig. 3: UPGMA phenogram derived from similarity matrix of Jaccard’s coefficient, demonstrating the genetic relationships among 60 acid
lime landraces, based on binary data matrix created for 79 RAPD loci generated by nine primers (refer to table 1 for sample details).

NN Munankarmi et al. (2014) Int J Appl Sci Biotechnol, Vol 2(3): 315-327
This paper can be downloaded online at http://ijasbt.org & http://nepjol.info/index.php/IJASBT
Fig. 4: Principal co-ordinates analysis (PCoA) of 60 accessions of Acid lime using MVSP 3.21
Table 5 Eigen values and the percentage for the co-ordinates of
PCoA.
Eigen Values
Axis 1
(Co-ordinate 1)
Axis 2
(Co-ordinate 2)
Eigenvalues 158.500 99.197
Percentage 19.209 12.022
Cum.
Percentage
19.209 31.232
Discussion
RAPD for the assessment of genetic diversity in Acid lime
Assessment of genetic diversity is essential for the
characterization, conservation and utilization of genetic
resources. It is used for selection and monitoring of genetic
resources and contribute to predict the potentiality of the
genotypes for breeding purposes (Chakravarthi and
Naravaneni, 2006). PCR based molecular techniques are
more precise over the morphological and biochemical
markers for genetic diversity assessment (Chawla, 2005;
Weising et al., 2005). RAPD, an arbitrarily primed PCR-
based marker technique is simple, cost effective and
powerful tool for the analysis of plant genome. Although it
is criticized for its low reproducibility, it is usually
overcome by optimizing PCR reaction parameters and
maintaining stringent conditions (Vaishali et al., 2008). It
has therefore been used extensively in assessing genetic
diversity and relationships in wide variety of plant species
(Transue et al., 1994; Sugawara et al., 2002; Sugimoto et
al., 2005; Maria et al., 2008; Vaishali et al., 2008). In
present study also, optimized RAPD-PCR reaction and
cycling conditions were used for RAPD profiling and
genetic diversity assessment of Acidlime landraces.
Experiments with acid lime landraces have demonstrated
the potential of RAPD markers as a rapid, reproducible and
useful method for assessing genetic diversity among acid
lime landraces. Out of 40 RAPD primers screened, only
nine primers gave remarkable polymorphic bands. Average
polymorphism revealed by nine primers for all 60 acid lime
accessions was 94.94% (Table 4), which indicated high
level of genetic diversity among landraces from different
agro-ecological domains. This indicates the heterogeneity
of the genotypes being used from Terai to high hill
landscapes of eastern Nepal. It has been held that
commercial citrus species including limes and lemons are
complex hybrids of true citrus species i. e. mandarin,
pummelo and citron (Uzun and Yesiloglu, 2012). Also,
many varieties of the commercial citrus species arose via
somatic mutations. The number of DNA fragments
amplified ranged from 7 to 11 which is quite consistent with
number reported by other authors such as 3 to 15 (Nicolosi
et al., 2000) and 5 to 14 (Baig et al., 2009). In this
investigation, PIC value ranged from 0.78 (primer UBC 66)
to 0.88 (primer UBC 16) with an average of 0.80. The value
of PIC between 0 and 1 estimates the degree of
polymorphism of the marker (Arya et al., 2011). PIC value
of less than 0.25 indicates low polymorphism, a value
between 0.25 and 0.50 indicate average polymorphism and
a value higher than 0.5 indicates a highly polymorphic locus
(Botstein et al., 1980). It has been reported that primers with
comparably higher PIC value are more useful than others
for distinguishing accessions (Teklewood and Becker,
2006). Therefore, all primers selected for this investigation
are highly informative primers for the assessment of the

NN Munankarmi et al. (2014) Int J Appl Sci Biotechnol, Vol 2(3): 315-327
This paper can be downloaded online at http://ijasbt.org & http://nepjol.info/index.php/IJASBT
genetic diversity of acid lime landraces collected from
different agro-ecological zones of eastern Nepal as PIC
values of all primers are above 0.77. In contrast, PIC value
of SSR based study of same accessions (Shrestha et al.,
2012a), were shown to be comparatively low at 0.18-0.75
with an average of 0.50. This might be due to the difference
in inherent properties of these two marker systems. SSR
being specifically primed PCR of codominant inheritance
and deals with specific loci of organism’s genome, while
RAPD is an arbitrarily primed PCR of dominant inheritance
and searches the genome more widely (Ellegren, 2004;
Chawla, 2005; Shrestha et al., 2005; Wang et al., 2009;
Shrestha, 2014). Resolving power (Rp) is an index
developed to compare the value of different primers in
terms of the informative bands obtained in a given set of
germplasm and has been found to correlate strongly with
genotype diagnosis and so has potential for a number of
applications (Prevost and Wilkinson, 1999). The primer
resolving power (RP) provide quantitative data allowing
direct comparisons between primers (Sokal, 1979) and
primer with high RP value have a greater capacity to
separate different accessions (Prevost and Wilkinson,
1999). In this investigation, the primer UBC 16 that has the
highest PIC (0.88) and RP (15.63) values, is the most
suitable primer to differentiate different Acidlime
accessions of this study.
Morphological traits have been frequently used for the
determination of relationship among plants and its varieties
(Ortiz et al., 1998). Unfortunately, morphological markers
do not often reflect genetic relationships because of their
interaction with the environment epistasis and largely
unknown genetic control of the traits (Smith and Smith,
1998). Based on phenotypic diversity, four landraces (two
from high-hills, LT-17 and LT-23 and each from mid-hills,
LD-49 and terai, LM-44) were found superior and selected
for conservation, breeding and variety development purpose
(Shrestha et al., 2012b). In present investigation, the first
two are clustered in cluster I while remaining two is in
cluster II. Based on Jaccard’s coefficient, they are almost
similar i.e. LT-17 and LT-23 (86.4%), LT-17 and LM-44
(70%), LT-17 and LD-49 (75.5%), LT-23 and LM-44
(64.7%), LM-23 and LD-49 (64.8%) and LM-44 and LD-
49 (66.7%). Molecular marker may provide information on
the history and biology of cultivars, but not necessary to
reflect what may be observed in phenotypic traits (Avise,
2004). There are many controlling genes spread throughout
the genome for the development of quantitative traits like
fruit weight, juice content, total soluble solid etc. (Martin
and Herrmann, 1998). Among the three agro-ecological
zones, high genetic diversity was observed in Terai
landraces than Mid-hills and High-hills. This may be due to
the planting materials carried by the farmers from different
hill districts with migration and introduction from
neighboring country in Terai agro-zone. On the other hand,
low level of genetic variability were observed in mid hill
and high hill as in this zone most of the acid lime trees were
established in natural conditions.
The pair wise similarity matrix was generated from the
binary data using the Jaccard’s coefficient of similarity
which showed the genetic similarity coefficient ranging
from 0.38 to 1.00 with an average of 0.72. RAPD based
similarity is found to be comparatively higher than reported
using SSR markers (0.43-0.53) for same acid lime samples
(Shrestha et al., 2012a). The highest genetic similarity
(100%) was found between the accessions of sunsari i.e.
LS-39 and LS-40 and highest genetic distance (38%
similarity) was observed between LS-56 and LT-16.
Accessions grouped in clusters III, IV, V, VI and VII have
higher level of genetic distance. As RAPD being multilocus
marker and searches the genome more widely than SSR, it
has given different clustering pattern. However, clustering
of some of the accessions such as LD-59, LS-57, and LS-56
away from the rest of the accessions in SSR-based
phenogram is congruent with RAPD-based phenogram also.
In addition to cluster analysis, PCoA (Principal Co-ordinate
Analysis) was carried out to determine the genetic diversity
of acid lime landraces and showed similar results with that
of the phenogram. Genotypes in different clusters of the
phenogram may harbor diverse genetically attributed traits
(both qualitative and quantitative), that should be identified
and utilized further for the development of elite cultivars
through breeding.
Use of RAPD data in Acid lime breeding programs
Improvement and selection of good quality traits are
important steps in the variety development program.
Breeding of good quality traits requires selection of parents
with a wider genetic diversity (Pangali et al., 1997) For this,
sufficient knowledge about genetic diversity in the gene
pool is required to adopt the efficient and valuable breeding
approach. In the present investigation, the value of
Shannon’s information index and Nei’s gene diversity were
found to be 0.325 and 0.213 respectively in terai agro-
ecological zone which shows higher level of diversity
among the accessions studied. This indicates diverse gene
pool in Terai in comparison to mid and high hills, which
might be due to Terai landscapes being more accessible for
the movement of germplasm in country as well as from
neighboring country India.
Production of any crop is related to a number of activities
including agronomic practices, diseases and pest’s
management, use of improved varieties, use of various root
stocks etc. (Machado et al., 2011). A number of sanitary
problems that challenges the citriculture are those of biotic
and abiotic limiting factors. Major biotic constraint is
susceptibility to many diverse pathogens and insects
including virus, viroids, fungi, nematodes and bacteria
resulting into the manifestation of various diseases such as
Citrus Greening Disease (CGD) or Haunglongbing (HLB)
disease, bacterial canker, Alternaria brown spot, Dagger
NN Munankarmi et al. (2014) Int J Appl Sci Biotechnol, Vol 2(3): 315-327
This paper can be downloaded online at http://ijasbt.org & http://nepjol.info/index.php/IJASBT
nematode, Tristeza, Crinkly leaf, Cachexia, Exocortis etc.
(Deng et al., 2000; Rauf et al., 2013; Harper et al., 2014).
Such susceptibility causes huge losses to citrus industry,
one of the most important fruit crop industries in the world.
Infestation by various disease epidemics can ruin any citrus
industry when there is narrow genetic base among the
cultivated accessions (Machado et al., 2011). Therefore,
assessment of genetic diversity using molecular markers is
one of the most fundamental tasks to be performed in order
to understand genetic structure of available gene pool for
further utilization and conservation.
Breeding for resistance to important diseases has been one
of the top priorities in citrus cultivar improvement program.
Use of various disease resistant rootstocks such as Poncirus
trifoliata, is a traditional practice being utilized by citrus
industries around the globe to save quality scions from
various diseases (bacterial and viral) and pests. Poncirus
trifoliata is resistant against Citrus Tristeza Virus (CTV),
which is the causal agent of one of the most important citrus
viral diseases. In this connection, citrus tristeza virus (CTV)
resistance gene (Ctv) and major gene responsible for the
citrus nematode resistance (Tyr1) have been identified from
Poncirus trifoliata, which can be effectively utilized for the
development of resistant cultivar development either via
genetic engineering or via marker assisted breeding
strategies (Deng et al., 2000). In our case, many of the
accessions have been grafted on Poncirus trifoliata (Lkv-
60, Lkm-61, Lkr-62, LD-26, LD-27, LD-28, LD-29, LD-30,
LS-36, LS-37, LS-38, LS-39, LS-40, LS-41, LS-42, LS-56,
LS-57, LM-51, LM-52, LM-54 and LM-55) while others
are of seed origin.
Conclusion
Acid lime is highly demanded fruit crop of Nepal. However,
Nepal is not self-sufficient in Acid lime production and
large volume has to be imported from India to fulfill the
market demand. Although, geo-climatic condition of Nepal
is highly suitable for acid lime cultivation, its production
per hectare is comparatively very low in comparison to
other countries. The low production may be attributed to a
number of reasons including lack of high yielding varieties,
diseases and pests’ infestations, poor agronomic practices
and so on.
Many diseases and pests of citrus can be associated both
with scions and rootstocks. Therefore, establishment of
healthy citrus industry is challenging as a number of factors
need to be considered. Citrus breeders need to consider not
only the enhanced yield but in the meantime should also
take care of fruit quality, flavor, taste as well as disease and
pest resistance of both scions and the rootstocks. In this
context, various biotechnological tools such as molecular
markers and genetic engineering could be promising for the
enhancement of various qualitative as well as quantitative
traits of commercial cultivars of acid lime.
Molecular markers such as RAPDs and SSRs have got wide
application in genetic diversity assessment of various
agronomic crops. Many qualitative and quantitative
agronomic traits such as fruit size, high juice content,
disease and insect resistance etc. have genetic basis of
inheritance and can be enhanced by the use of molecular
markers and marker assisted selection (MAS) technique.
From the present study, genetic diversity of acid lime
landraces of eastern Nepal has been assessed using RAPD
marker technique. Genetic diversity assessment is
fundamental task for plant breeders. Based on genetic
diversity estimation of this study, acid lime breeding
program can be expanded aiming at development of elite
cultivars. Finally, acid lime genotypes considered in this
study are the valuable genetic materials of Nepal for long
term conservation and utilization for the development of
elite cultivars.
Acknowledgments
Authors are grateful to the Vice Chancellor of NAST, Prof.
Dr. S.R. Kafle and Secretary of NAST, Prof. Dr. Prakash
Chandra Adhikari, for providing laboratory access at
Molecular Biotechnology Unit to conduct this piece of
research. We are also grateful to the Molecular
Biotechnology Laboratory members of NAST for their kind
cooperation and help.
References
Abkenar A and Isshiki S (2003) Molecular characterization and
genetic diversity among Japanese acid citrus (Citrus spp.)
based on RAPD markers. J. Hort. Sci. Biotechnol. 78: 553-
556.
Arya V, Yadav S and Yadav JP (2011) Intra-specific Genetic
Diversity of different Accessions if cassia occidentalis
by RAPD Markers. Genet. Eng. Biotechnol. J. 22: 1-8.
Avise JC (2004) Molecular markers, natural history and
evolution, Sinauer Associates, Inc. Publishers
Sunderland) pp. 125-132.
Baig MNR, Grewal S and Dhillon S (2009) Molecular
characterization and genetic diversity analysis of citrus
cultivars by RAPD markers. Turk. J. Agric. 33: 375-384.
DOI: 10.3906/tar-0804-27
Botstein D, White RL, Skolnick M and Davis RW (1980)
Construction of genetic map in man using restriction
fragment length polymorphisms. Am. J. Human
Genetics. 32: 314-331.
Campos ET, Espinosa MAG, Warburton ML, Varela AS and
Monter AV (2005) Characterization of Mandarin (Citrus
spp.) using morphological and AFLP markers.
Interciencia. 30(11): 687-693.
Chakravarthi BK and Naravaneni R (2006) SSR marker based
DNA fingerprinting and diversity study in rice (Oryza
sativa L). Afr. J. Biotechnol. 5(9): 684-688.
Chawla HS (2005) Introduciton to Plant Biotechnology, Oxford
and IBH Publishing Co. Pvt. Ltd.) pp. 329-358.

NN Munankarmi et al. (2014) Int J Appl Sci Biotechnol, Vol 2(3): 315-327
This paper can be downloaded online at http://ijasbt.org & http://nepjol.info/index.php/IJASBT
Cipriani G, Di Bella R and Testolin R (1996) Screening RAPD
primers for molecular taxonomy and cultivar
ingerprinting in the genus Actinidia. Euphytica. 90: 169-
174. DOI: 10.1007/BF00023855
Deng Z, Huang S, Ling P, Chen C, Yu C, Weber CA, Moore GA
and Gimtter Jr FG (2000) Cloning and Characterization
of NBS-LRR class resistance-gene candidate sequences
in citrus. Theor. Appl. Genet. 101: 814-822. DOI:
10.1007/s001220051548
Dhakal DD and Bhattarai S (2002) Production system of lime and
lemon in Nepal: A survey report. Proceedings of
Workshop on ‘Production and Marketing of Lime and
Lemon in Nepal’ organized by IAAS. Rampur at
Lamjung campus 26-28.
Dhillon BS and Randhawa JS (1993) Fruit growth and
development in citrus: Advance in Horticulture, 3
(Malhotra Publishing House) pp. 1667-168.
Dominquez A, de Mendoza A, Guerri J, Cambra M, Navarro L,
Moreno P and Pena L (2002) Pathogen-derived
resistance to Citrus tristeza virus (CTV) in transgenic
mexican lime (Citrus aurantifolia (Christ.) Swing.)
plants expressing its p25 coat protein gene. Mol. Breed.
10(1): 1-10. DOI: 10.1023/A:1020347415333
Ellegren H (2004) Microsatellite: Simple Sequences with
Complex Evolution. Nat. Rev. Genet. 5: 435-445. DOI:
10.1038/nrg1348
Fang DQ, Roose ML, Krueger RR and Federici CT (1997)
Fingerprinting trifoliate orange germplasm accessions
with isozymes, RFLPs and inter-simple sequence repeat
markers. Theor. Appl. Genet. 95: 211–219. DOI:
10.1007/s001220050550
FAO. (2006) Food and Agriculture Organization of the United
Nations Developments in International Citrus Trade in
2004-2005. pp
Filho HDC, Machado MA, Targon MLPN, Moreira MCPQDG
and Pompeu J (1998) Analysis of the Genetic Diversity
among Mandarins (Citrus spp.) Using RAPD Markers.
Euphytica. 102(1): 133-139. DOI:
10.1023/A:1018300900275
Harper SJ, Cowell SJ, Robertson CJ and Dawson WO (2014)
Differential tropism in roots and shoots infected by
Citrus tristeza virus. Virology. 460-461: 91-99. DOI:
10.1016/j.virol.2014.04.035
Huseyin K and Sabitagaoglu Y (2008) Genetic diversity among
Turkish local grape accessions (Vitis vinifera L.) using
RAPD markers. Hereditas. 145: 58-63. DOI:
10.1111/j.0018-0661.2008.02011.x
Hvarleva TT, Kapari-Isaia L, Papayiannis A, Atanassov A,
Hadjinicoli A and Kyriakou A (2008) Characterization
of Citrus cultivars and clones in Cyprus through
microsatellite and RAPD analysis. Biotechnol. Biotec.
Eq. 22: 787-794. DOI:
10.1080/13102818.2008.10817554
Jaccard P (1908) Nouvelles recherche sur la distribution florale.
Bulletin. Societe Vaudoise Sciences Naturelles. 44: 223-
270.
Kijas JMH, Thomas MR, Fowler JCS and Roose ML (1997)
Integration of trinucleotide microsatellites into a linkage
map of Citrus. Theor. Appl. Genet. 94: 701–706. DOI:
10.1007/s001220050468
Kovach WL (2007) MVSP - A Miltivariate Statistical Packages
for Windows ver 3.21. Pentraeth, Wales, U.K, Kovach
Computing Services
Kumar M, Parthiban S, SaralaDevi D and Ponnuswami V (2013)
Genetic Diversity Analysis of Acid lime (Citrus
aurantifolia Swingle) cultivarrs. The Bioscan. 8(2): 481-
484.
Lowe A, Stephen H and Ashton P (2004) Ecological Genetics:
Design, Analysis, and Application, Blackwell
Publishing) pp. 6-100.
Machado MA, Yaly MC and Bastianel M (2011) Breeding,
Genetics and Genomic of Citrus for Disease Resistance.
Rev. Bras. Frutic: 158-172.
Maria D, Angela P and Chialexei L (2008) Characteristics of
RAPD markers inbreeding of Cucumis sativus L.
Roumanian Biotechnological Letters. 13: 3843-3850.
Mariniello L, Sommella MG, Cozzolino A, Di Pierro P, Ercolini
D and Porta R (2004) Identiication of Campania Citrus
limon L. by Random Ampliied Polymorphic DNA
Markers. Food Biotechnol. 18: 289-297. DOI:
10.1081/FBT-200035020
Martin W and Herrmann RG (1998) Gene transfer from organelles
to the nucleus: how much, what happens and why?
Plant. Physiol. 118: 9-17. DOI: 10.1104/pp.118.1.9
MoAC. (2011) Statistical information of Nepalese agriculture.
Agri. Business Promotion and Statistical Division,
Ministry of Agriculture and Cooperatives. Singh
Durbar, Kathmandu, Nepal. pp
NCRP. (2012) Annual Report 2067/68 (2010/11), National Citrus
Research Program, NARC. Paripatle, Dhankuta. pp
Nei M and Li WH (1979) Mathematical model for studying
genetic variation in terms of restriction endonucleases.
Proc. Natl. Acad. Sci. USA. 76: 685-686.
Nicolosi E, Deng ZN, Gentile A, La Malfa S, Continella G and
Tribulato E (2000) Citrus phylogeny and genetic origin
of important species as investigated by molecular
markers. Theor. Appl. Genet. 100(8): 1155–1166. DOI:
10.1007/s001220051419
Novelli VM, Cristofani M, Souza AA and Machado MA (2006)
Development and characterization of polymorphic
microsatellite markers for the sweet orange (Citrus
sinensis L. Osbeck). Gen. Mol. Biol. 29: 90-96. DOI:
10.1590/S1415-47572006000100018
Novelli VM, Machado MA and Lopes CR (2000) Iso-enzymatic
Polymorphism in Citrus spp and P. trifoliata (L.) Raf.
(Rutaceae). Gen. Mol. Biol. 23: 163-168. DOI:
10.1590/S1415-47572000000100030
Ortiz R, Madsen S and Vuylsteke D (1998) Classification of
African plantain landraces and banana cultivars using a
phenotypic distance index of quantitative descriptors.

NN Munankarmi et al. (2014) Int J Appl Sci Biotechnol, Vol 2(3): 315-327
This paper can be downloaded online at http://ijasbt.org & http://nepjol.info/index.php/IJASBT
Theor. Appl. Genet. 96: 904-911. DOI:
10.1007/s001220050818
Pangali PL, Hossain M and Gerpasio RV (1997) Asian rice blows:
the returning crises? International Rice Research
Institute (IRRI), pp. 341.
Prevost A and Wilkinson MJ (1999) A new system of comparing
PCR primers applied to ISSR fingerprinting of potato
cultivars. Theor. Appl. Genet. 98: 107–112. DOI:
10.1007/s001220051046
Rauf S, Iqbal Z and Shahzad M (2013) Genetic Improvement of
Citrus for disease resistance. Arch. Phytopathol. Plant
Protection. 46(17): 2051-2061. DOI:
10.1080/03235408.2013.783982
Reddy MP, Sarla N and Siddiq EA (2002) Inter simple sequence
repeat (ISSR) polymorphism and its application in plant
breeding. Euphytica. 128: 9–17. DOI:
10.1023/A:1020691618797
Rohlf FJ (2009) NTSYSpc: Numerical Taxonomy System
ver.2.21i. New York, Exeter Software: Setauket
Sambrook J and Russell DW (2001) Molecular cloning: A
Laboratory Manual, III (Pub Cold Spring Harbour
Laboratory Press) pp.
Sanker AA and Moore GA (2001) Evaluation of inter–simple
sequence repeat analysis for mapping in citrus and
extension of the genetic linkage map. Theor. Appl.
Genet. 102(2): 206–214. DOI: 10.1007/s001220051637
Sanz-Cortes F, Badenes ML, Paz S, Iniguez A and Llacer G (2001)
Molecular characterization of olive cultivars using
RAPD markers. J. Am. Soc. Hort. 126: 7-12.
Sapkota DP (2006) Characterization and Evaluation of acid lime
landraces at Rampur, Chitwan condition. PhD Thesis
submitted in Tribhuvan University, Chitwan, Nepal:
Scora RW (1988) Biochemistry, taxonomy and evolution of
modern cultivated Citrus, 1 (Oxford & IBH Publishing
Company) pp. 277–289.
Shaaban EA, Abd-EL-Aal SK, Zaied NS and Rizkalla AA (2006)
Assessment of Genetic Variability on Some Orange
Accessions Using RAPD-DNA Markers. Res. J. Agric.
Biol. Sci. 2: 564-570.
Shahsavar AR, Izadpanah K, Tafazoli E and Tabatabaei BE (2007)
Characterization of citrus germplasm including
unknown variants by Inter-simple sequence repeat
(ISSR) markers. Sci. Hortic. 112: 310-314. DOI:
10.1016/j.scienta.2006.12.039
Shrestha RL (2014) Assessment of Phenotypic and Genetic
Diversity of Acid lime (Citrus aurantifolia Swingle)
Landraces in Eastern Nepal. PhD Thesis submitted in
Tri-bhuvan University, Chitwan:
Shrestha RL, Dhakal D, Gautam D, Paudyal KP and Shrestha S
(2012a) Genetic Diversity Assessment of Acid Lime
(Citrus aurantifolia) Landraces in Nepal, Using SSR
Markers. Am. J. Plant. Sci. 3: 1674-1681.
Shrestha RL, Dhakal D, Gautam D, Paudyal KP and Shrestha S
(2012b) Study of Fruits Diversity and Selection of Elite
Acid lime (Citrus aurantifolia Swingle) Genotypes in
Nepal. Am. J. Plant. Sci. 3: 1098-1104. DOI:
10.4236/ajps.2012.38132
Shrestha S (2001) Molecular Systematic of Weedy Sporobolus
species of Australia. PhD Thesis submitted in The
University of Queensland, Australia:
Shrestha S, Adkins SW, Graham GC and Loch DC (2005) An
identification tool for the Australian weedy Sporobolus
species based on random amplifiaction of polymorphic
DNA (RAPD) profiles. Aust. J. Agr. Res. 56(2): 157-
167.
Singh BD (2005) Plant Breeding: Principles and Methods,
Kalyani Publishers) pp. 1-434.
Smith JSC and Smith OS (1998) The Description and assessment
of distance between inbred lines of maize, 11. The utility
of morphological, biochemical and genetic descriptots
and a scheme for testing of distinctiveness between
inbred lines. Maydica. 34: 151-161.
Sneath PHA and Sokal RR (1973) Taxonomy, the principle and
practice of numerical classification, Pub W.H freeman
and company) pp.
Sokal RR (1979) Ecological parameter inferred from spatial
correlograms, ICPH) pp. 167-196.
Sripaoraya S, Blackhall NW, Marchant R, Power JB, Lowe KC
and Davey MR (2001) Relationships in pineapple by
random ampliied polymorphic DNA (RAPD) analysis.
Plant Breed. 120: 265-267. DOI: 10.1046/j.1439-
0523.2001.00606.x
Sugawara K, Wakizuka T, Oowada A, Moriguchi T and Omura M
(2002) Histogenic identiication by RAPD analysis of
leaves and fruit of newly synthesized chimeric Citrus. J.
Am. Soc. Hort. Sci. 127: 104-107.
Sugimoto T, Tamaki K, Matsumoto J, Yamamoto Y, Shiwaku K
and Watanbe K (2005) Detection of RAPD markers
linked to the everbearing gene in Japanese cultivated
strawberry. Plant Breed. 124: 498-501. DOI:
10.1111/j.1439-0523.2005.01144.x
Teklewood A and Becker HC (2006) Geographic pattern of
genetic diversity among 43 Ethiopian mustard (Brassica
carinata A. Braun) accession as revealed by RAPD
analysis. Genet. Res. Crop. Evol. 53: 1173-1185. DOI:
10.1007/s10722-005-2011-4
Transue DK, Fairbanks DJ, Robison LR and Anderson WR (1994)
Species Identification by RAPD analysis of grain
amaranth genetic resources. Crop. Sci. 34: 1385-1389.
DOI: 10.2135/cropsci1994.0011183X003400050044x
Uzun A and Yesiloglu T (2012) Genetic Diversity in Citrus,
InTech) pp. 213-230.
Vaishali I, Khan K and Sharma V (2008) RAPD based assessment
of genetic diversity of Butea monosperma from different
agro-ecological regions of India. Indian J. Biotechnol. 7:
320-327.
Viloria Z and Grosser JW (2005) Acid citrus fruit improvement
via interploid hybridization using allotetraploid somatic

NN Munankarmi et al. (2014) Int J Appl Sci Biotechnol, Vol 2(3): 315-327
This paper can be downloaded online at http://ijasbt.org & http://nepjol.info/index.php/IJASBT
hybrid and autotetraploid breeding parents. J. Am. Soc.
Hort. Sci. 130(3): 392-402.
Vinu V, Singh N, Vasudev S, Yadava DK, Kumar S, Naresh S,
Bhat SR and Prabhu KV (2013) Assessment of genetic
diversity in Brassica juncea (Brassicaceae) genotypes
using phenotypic differences and SSR markers. Rev.
Biol. Trop. 61(4): 1919-1934.
Wang ML, Barkley NA and Jenkins TM (2009) Microsatellite
Markers in Plants and Insects. Part I: Applications of
Biotechnology. Genes. Genomes. Genom. 3(1): 1-10.
Weising K, Nybom H, Wolff K and Kahl G (2005) DNA
fingerprinting in plants Principles, Methods and
Applications. New York, Singapore, CRC Press, Taylor
& Francis Group
Wiliams JGK, kubelik AR, Livak KJ, Rafalski JA and Tingey SV
(1990) DNA polymorphism amplified by arbitrary
primers are useful as genetic markers. Nucleic Acids
Res. 18: 6531-6535. DOI: 10.1093/nar/18.22.6531
Wiliams JGK, Kunelik AR, Livak KJ, Rafalski JA and Tingey SV
(1990) DNA polymorphism amplified by arbitrary
primers are useful as genetic-markers. Nucleic Acids
Res. 18: 6531-6335. DOI: 10.1093/nar/18.22.6531
Yeh FC, Yang RC, Boyle TBJ, Ye ZH and NAo JX (1997)
"POPGENE, the user-friendly shareware for population
genetic analysis."
Top Related
Copyright © 2022 FDOKUMEN

