


Bahasa
Halaman
Hukum

ORIGINAL ARTICLE
Genetic diversity and relationships in Solanum subg.Archaesolanum (Solanaceae) based on RAPD and chloroplastPCR-RFLP analyses
Peter Poczai • Andras Cseh • Janos Taller •
David E. Symon
Received: 13 October 2008 / Accepted: 4 October 2010
� Springer-Verlag 2010
Abstract The subgenus Archaesolanum is a group
composed of eight species with a characteristic chromo-
some number based on n = x = 23 and an area restricted
to the South Pacific. This subgenus is an isolated group of
Solanum for which extensive information about phyloge-
netic relationships based on molecular genetic methods is
lacking. This study represents an approach to analyze
genetic relationships within this group. In this context,
seven species were examined using random amplified
polymorphic DNA (RAPD) markers. In further analysis,
the amplification products of two chloroplast regions
(trnS-trnG and rbcL) were studied with polymerase chain
reaction (PCR) restriction fragment length polymorphism
(RFLP) method. Screening for the presence of unique
mitochondrial rearrangements was also carried out using
universal mitochondrial primers for the detection of
fragment length polymorphisms. We identified two major
groups within the subgenus; one was composed of the
members of ser. Avicularia and Laciniata, while the other
was formed by species belonging to ser. Similia. It is
suggested that the taxonomic status of series within the
Archaesolanum clade should be revised. The hybrid origin
of S. laciniatum was also tested, and two hypotheses
regarding its phylogeny are assumed.
Keywords Archaesolanum � Phylogenetic relationships �Solanum � PCR-RFLP � RAPD � Kangaroo apples
Introduction
The diverse genus Solanum L., with approximately 1,400
species, has worldwide distribution, with center of diversity
in South America. The species belonging to subg.
Archaesolanum Bitter ex Marzell, often called kangaroo
apples, are described as a distinctive group with no obvious
close relatives. The subgenus is represented by eight spe-
cies, which occur only in the South West Pacific region
(New Guinea, Australia, Tasmania, and New Zealand). The
species are short-lived soft-wooded shrubs, 1–3 m tall,
becoming straggly with age, unarmed, glabrescent, with
large (up to 30 cm) deeply lobed leaves in the juvenile
phase, becoming smaller (up to 10 cm) and entire in the
adult stage, with violet–purple flowers in cymes growing
at the axils of stem-fork sites (Symon 1984). The fruits
are greenish, yellowish, or scarlet; the succulent berries
produce numerous seeds (approx. 100–600). White or
yellowish stone cell aggregates are present in the dried
contents of the fruits, mixed with seeds. The fruits are
eaten by birds, which are probably responsible for their
P. Poczai (&) � J. Taller
Department of Plant Sciences and Biotechnology,
Georgikon Faculty, University of Pannonia, Festetics 7,
Keszthely 8360, Hungary
e-mail: [email protected]
J. Taller
e-mail: [email protected]
A. Cseh
Department of Plant Genetic Resources and Organic Breeding,
Agricultural Research Institute of the Hungarian Academy
of Sciences, Brunszvik u. 2, Martonvasar 2462, Hungary
e-mail: [email protected]
D. E. Symon
Department of Environment and Heritage,
Plant Biodiversity Centre, State Herbarium of South Australia,
PO Box 2732, Kent Town, SA 5071, Australia
e-mail: [email protected]
123
Plant Syst Evol
DOI 10.1007/s00606-010-0371-5

distribution throughout Australia, New Zealand, Tasmania,
and New Guinea (Symon 1979).
Plants belonging to this group were first collected by
Forster in Australia during the second voyage of Captain
James Cook. Forster (1786) was the first to publish the
name Solanum aviculare in the ‘‘Dissertatio inauguralis
botanico-medica de plantis esculentis insularum oceani
australis.’’ Since then, the group has been recognized by
several Solanum researchers, e.g., Bitter (1927), Danert
(1970), D’Arcy (1972, 1990), Symon (1981, 1994), and
Hunziker (2001). The subgenus was divided into three
series by Gerasimenko (1970): ser. Avicularia Geras.,
consisting of S. aviculare Forst. (2n = 2x = 46) and
S. multivenosum Symon (2n = 4x = 92); ser. Laciniata
Geras. composed of S. laciniatum Ait. (2n = 4x = 92),
S. vescum F. Muell (2n = 2x = 46), and S. linearifolium
Geras. ex Symon (2n = 2x = 46); and ser. Similia Geras.,
with S. capsiciforme (Domin) Baylis (2n = 2x = 46),
S. simile F. Muell. (2n = 2x = 46), and S. symonii Eichler
(2n = 4x = 92). Symon (1994) mentioned S. cheesemanii
Geras. and S. baylisii Geras. as separate species, but they
are now considered to be synonyms and varieties of
S. aviculare, as suggested by Baylis (1963).
The basic chromosome number in subg. Archaesolanum
is n = x = 23, in contrast to the n = x = 12 typical of
other members of genus Solanum (Randell and Symon
1976). Despite the name, suggesting an archetypal Sola-
num, the chromosome number indicates a derived condi-
tion which has itself become polyploid (Symon 1979),
probably reached by aneuploid loss from n = x = 24
(Randell and Symon 1976). It is clear that all species based
on secondary gametic numbers are polyploid; in the case of
secondary polyploidy (Hair 1966) each number generates
its own polyploid sequence as follows: in the original
series, 2n = 48 (4x) and 72 (6x); in the derived series,
2n = 46 (2x2) (S. aviculare) and 2n = 92 (4x2) (S. lacin-
iatum) (data from Baylis 1954). Whilst these zygotic
numbers are ‘‘diploid’’ and ‘‘tetraploid’’ with respect to the
secondary basic number, x2 = 23, the respective species
are relatively tetraploid and octoploid in terms of the ori-
ginal basic number, x = 12 (Hair 1966).
Symon (1994) provided a preliminary phylogeny for
the subgenus based on morphology, but these concepts
have not been tested using molecular methods. To the
best of our knowledge, no study including all eight spe-
cies and investigating phylogenetic relationships within
the group using molecular tools has yet been published.
Many molecular studies on phylogenetic relationships
within the genus Solanum have included species repre-
senting the subgenus in their analysis. Olmstead and
Palmer (1997) included S. aviculare in an analysis
based on chloroplast restriction site data. Bohs and
Olmstead (2001) and Bohs (2005) gave information about
S. aviculare and S. laciniatum based on data from nuclear
internal transcribed spacers (ITS) and ndhF gene, which
indicated that the members of subg. Archaesolanum
formed a well-supported basal clade in Solanum. Using
RAPD, Poczai et al. (2008) also found that the group was
distinct from the other members of the genus. It thus
seems safe to say that the Archaesolanum clade represents
an isolated group whose closest relatives have not yet
been identified (Bohs 2005). Putative ancestors have
certainly not been recognized in Australia, nor are extra-
Australian relatives apparent (Symon 1979). Although
red-fruited species, such as S. dunalianum Gaudich.,
S. viride Spreng., and S. incanoalabastrum Symon, occur
in New Guinea, these all have stellate hairs and no stone
cells; they are not related to the Archaesolanum group.
Subgenus Archaesolanum represents an ambiguous case,
either representing an early dispersal event in the genus,
or a plausible case of vicariance dating to a time prior to
the separation of South America and Australia (Olmstead
and Palmer 1997). The ndhF data of Bohs and Olmstead
(1997) suggest that the ancestor of the Archaesolanum
clade arrived in Australia early in the evolutionary radi-
ation of Solanum.
Random amplified polymorphic DNA (RAPD) tech-
nique (Williams et al. 1990, 1993; Welsh and McClelland
1990) is a useful tool in population and evolutionary
genetics, since no prior knowledge of the genome structure
or sequence data is required. RAPD has been used in
several studies in the case of Solanum (e.g., Stedje and
Bukenya-Ziraba 2003; Van den Berg et al. 2002; Spooner
et al. 1996; Miller and Spooner 1999) to clarify phyloge-
netic relationships at various levels (Sheng et al. 2006;
Baeza et al. 2007; Liebst 2008).
Organelle DNA sequences have been used extensively
in phylogenetic studies on plants. Chloroplast DNA
(cpDNA) variation has proven to be immensely valuable in
reconstructing phylogenies at the species and higher taxo-
nomic level. PCR amplification with specific or universal
primers, followed by restriction digestion and electropho-
retic separation of the fragments (PCR-RFLP), is fre-
quently applied in plant phylogenetic studies (e.g., Cseh
and Taller 2008; Friesen et al. 1997; Wachowiak et al.
2006; Prentice et al. 2008). The combination of this tech-
nique with other molecular methods such as inter-simple
sequence repeat (ISSR) (Huang et al. 2002), RAPD
(Potokina et al. 1999), and amplified fragment length
polymorphism (AFLP) (Fu et al. 2004) is also widespread.
Compared with standard RFLP analysis using entire
cpDNA or probe cpDNAs, RFLP analysis of PCR-ampli-
fied cpDNA regions has several advantages: simple
procedure, small amounts of tissue required, and reduced
time and expense. Therefore, it is considered to be an easy
and advantageous tool for detecting cpDNA variations.
P. Poczai et al.
123
Another approach for extracting phylogenetic informa-
tion from both cpDNA and mitochondrial DNA (mtDNA)
is to analyze the distribution of major structural rear-
rangements. The mitochondrial genome evolves consider-
ably more slowly at the nucleotide sequence level than the
nuclear or the chloroplast genomes (Palmer 1990; Wolfe
et al. 1987), but the rate of rearrangements is extraordi-
narily faster in plant mtDNA than in cpDNA (Palmer and
Herborn 1988), possibly making it useful in investigations
on distant phylogenetic relationships. The presence or
absence of rearrangements in a particular gene or intron
can be assayed by hybridization using probes specific to the
gene/intron or with the use of the PCR technique. Primers
are synthesized for conserved sequences flanking the
region of interest, and the intervening sequence is amplified
by PCR (Downie and Palmer 1992). Comparing the size of
the resultant PCR product with a sequence of known length
on an agarose or polyacrylamide gel can indicate the
presence or absence of specific gene or intron rearrange-
ments (Bruzdzinski and Gelehrter 1989).
The purpose of this study is to investigate genetic
relationships in subg. Archaesolanum based on RAPD
markers and PCR-RFLP analysis of two chloroplast
regions (trnS-trnG and rbcL). Another objective of this
study is to reveal mitochondrial rearrangements using
universal primers, which could be useful for further anal-
ysis of the group.
Materials and methods
Plant material and DNA extraction
Taxon sampling included seven species belonging to subg.
Archaesolanum, with two accessions from each of the
species S. aviculare, S. laciniatum, and S. simile and one
from each of S. linearifolium, S. capsiciforme, S. symonii,
and S. vescum. For outgroups, seven Solanum species,
representing different subgenera, were included in the
analysis. An accession from outside the genus, Capsicum
annuum, was also added in the experiments, according to
the results reported by Olmstead et al. (1999) and Bohs and
Olmsted (2001). Although we used only one accession for
each species in this study, our ongoing continuous studies
within different lineages of Solanum show that intraspecific
variation does not adversely affect phylogenetic relation-
ships between sections of Solanum, as was also shown
previously in other groups of the genus by Spooner and
Systma (1992). Voucher specimens were deposited at the
herbarium of University of Pannonia, Keszthely, Hungary.
Information about the accessions can be found in Table 1.
Genomic DNA was extracted from approximately 50 mg
of young fresh leaves using the procedure of Walbot and
Warren (1988). RAPD fingerprints were obtained from DNA
bulks, according to Spooner et al. (1997), where five plants
from each accession were bulked for DNA extraction.
Although fragments present in \15% of individuals com-
posing the DNA bulk are often observed to be lost from the
banding patterns of bulked samples (e.g., Divaret et al.
1999), we designed our study to sample as many alleles as
possible within the accessions. Additionally, the aim was to
examine more populations, rather than more individuals,
within a population. Thus the bulking strategy described by
Michelmore et al. (1991) was considered to be useful to
generate a group (e.g., population or accession) fingerprint
by combining DNA from a number of individuals. This
strategy may reduce the noise in the dataset due to markers
segregating within the groups (Bussel et al. 2005) and has
been used successfully in the case of Solanum species (Miller
and Spooner 1999; Rodrıguez and Spooner 1997; Spooner
et al. 1991, 1993, 1995, 1997; Clausen and Spooner 1998).
RAPD amplification
In the RAPD analysis a total of 40 primer pairs were used.
Each reaction was performed twice to verify reproducibil-
ity. The primers were paired arbitrarily, but palindromes
and complementarities within and between primers were
avoided. The sequence of each primer was generated ran-
domly, comprising 12 base oligonucleotides and *50–70%
GC content. The sequences of the primers are available
from the corresponding author upon request. PCR was
carried out on a 96-well RoboCycler (Stratagene, USA)
using a 20 ll reaction mix which contained the following:
10 ll sterile ion-exchanged water, 5 ng template DNA,
1 lM of each primer, 0.2 mM dNTP (Fermentas, Lithua-
nia), 2 ll 109 PCR buffer (1 mM Tris–HCl, pH 8.8 at
25�C, 1.5 mM MgCl2, 50 mM KCl, and 0.1% Triton
X-100), and 0.5 U DyNazyme II (Finnzymes, Finland)
polymerase. Reaction conditions were 1 min at 94�C,
followed by 35 cycles of 30 s at 94�C, 1 min at 37�C, and
2 min at 72�C. A final amplification for 5 min at 72�C was
applied. Amplification products were separated on 1.5%
agarose gels (Promega, USA) in 0.59 TBE buffer (300 V,
1.5 h) and post-stained with ethidium bromide. The gels
were documented using the GeneGenius Bio Imaging Sys-
tem (Syngene, UK). The banding patterns were evaluated
and annotated with the program GeneTools (Syngene, UK).
Chloroplast region amplification and restriction
digestion
trnS-trnG region
The chloroplast intergenic spacer between trnS and trnG
was amplified using the primers described by Hamilton
Genetic diversity and relationships in Solanum subg. Archaesolanum
123
(1999). All PCR reactions were performed in a Master-
Cycler ep384 (Eppendorf, Germany) with the same com-
position as in the RAPD analysis, except that the MgCl2concentration was adjusted to 2 mM. The thermal cycler
program included an initial denaturation at 94�C for 4 min;
40 cycles of 94�C for 45 s, 52�C for 1 min, and 72�C for
1 min; with a final extension at 72�C for 7 min, as
described by Levin et al. (2006).
rbcL1-rbcL2 region
The sequence of the large subunit of the ribulose-1,5-bis-
phosphate carboxylase gene (rbcL) was amplified using the
primers described by Demesure et al. (1995). The 20 ll
reaction solution was the same as that described above. The
thermal cycler program was the following: 94�C for 1 min;
30 s at 94�C, 1 min at 60�C, and 2 min at 72�C for 35
cycles; and a final cycle of 4 min at 72�C. Further infor-
mation about the primers used in the study is given in
Table 2.
The trnS-trnG amplification products were digested
with the restriction endonuclease enzymes HinfI, DdeI,
MboI, MspI, RsaI, TaqaI, and AluI (New England Biolabs
Inc., USA). The reaction conditions recommended by the
supplier were used for all enzymes. The restriction frag-
ments were separated on 2.3% high-resolution MetaPhor
agarose gel (Cambrex Bio Science Rockland, Inc., USA),
after which the products were visualized by ethidium-
bromide staining.
The rbcL1-rbcL2 region was digested with the same
enzymes except that instead of TaqaI the AluI and HhaI
restriction endonucleases were used in the analysis. The
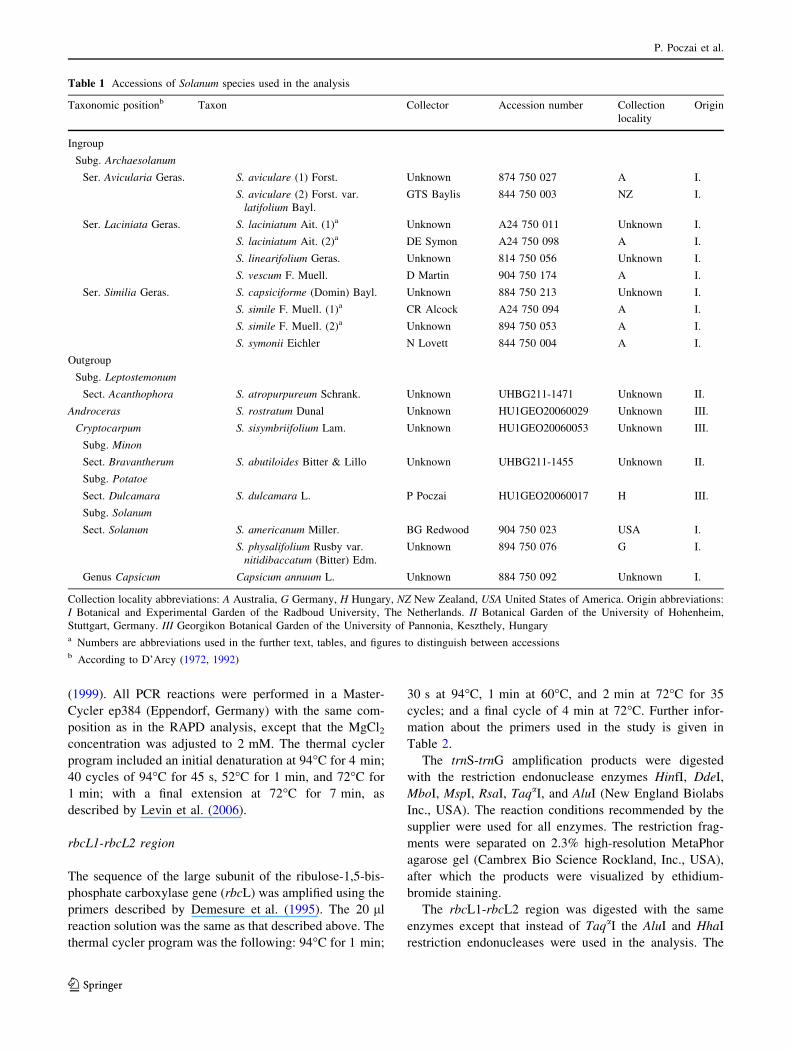
Table 1 Accessions of Solanum species used in the analysis
Taxonomic positionb Taxon Collector Accession number Collection
locality
Origin
Ingroup
Subg. Archaesolanum
Ser. Avicularia Geras. S. aviculare (1) Forst. Unknown 874 750 027 A I.
S. aviculare (2) Forst. var.
latifolium Bayl.
GTS Baylis 844 750 003 NZ I.
Ser. Laciniata Geras. S. laciniatum Ait. (1)a Unknown A24 750 011 Unknown I.
S. laciniatum Ait. (2)a DE Symon A24 750 098 A I.
S. linearifolium Geras. Unknown 814 750 056 Unknown I.
S. vescum F. Muell. D Martin 904 750 174 A I.
Ser. Similia Geras. S. capsiciforme (Domin) Bayl. Unknown 884 750 213 Unknown I.
S. simile F. Muell. (1)a CR Alcock A24 750 094 A I.
S. simile F. Muell. (2)a Unknown 894 750 053 A I.
S. symonii Eichler N Lovett 844 750 004 A I.
Outgroup
Subg. Leptostemonum
Sect. Acanthophora S. atropurpureum Schrank. Unknown UHBG211-1471 Unknown II.
Androceras S. rostratum Dunal Unknown HU1GEO20060029 Unknown III.
Cryptocarpum S. sisymbriifolium Lam. Unknown HU1GEO20060053 Unknown III.
Subg. Minon
Sect. Bravantherum S. abutiloides Bitter & Lillo Unknown UHBG211-1455 Unknown II.
Subg. Potatoe
Sect. Dulcamara S. dulcamara L. P Poczai HU1GEO20060017 H III.
Subg. Solanum
Sect. Solanum S. americanum Miller. BG Redwood 904 750 023 USA I.
S. physalifolium Rusby var.
nitidibaccatum (Bitter) Edm.
Unknown 894 750 076 G I.
Genus Capsicum Capsicum annuum L. Unknown 884 750 092 Unknown I.
Collection locality abbreviations: A Australia, G Germany, H Hungary, NZ New Zealand, USA United States of America. Origin abbreviations:
I Botanical and Experimental Garden of the Radboud University, The Netherlands. II Botanical Garden of the University of Hohenheim,
Stuttgart, Germany. III Georgikon Botanical Garden of the University of Pannonia, Keszthely, Hungarya Numbers are abbreviations used in the further text, tables, and figures to distinguish between accessionsb According to D’Arcy (1972, 1992)
P. Poczai et al.
123

separation and visualization procedure was the same as that
described above. The enzymes for the analysis were
selected based on the virtual digestion of the sequence data
of the fragment trnS-trnG from S. aviculare, submitted to
the NCBI database by Levin et al. (2005) under accession
number AY555458. For this procedure the program
NEBcutter (Vincze et al. 2003) was used.
Mitochondrial region amplification
The universal primers described by Demesure et al. (1995)
for the amplification of different mitochondrial regions
were tested to detect fragment length polymorphism
between the accessions. The contents and concentrations
used in the reaction mixture were the same as described for
the RAPD analysis. The PCR program was the following:
94�C for 1 min; 30 s at 94�C, 1 min at 58�C, and 2 min at
72�C for 35 cycles; and a final cycle of 4 min at 72�C.
The amplified regions and further information about the
primers are summarized in Table 2.
RAPD data analysis
Only distinct, well-resolved, clear bands were scored.
Reliable bands are thought to refer to amplicons found in
replicate reactions. It was assumed that fragments of
equal length had been amplified from corresponding loci,
and the band conventionally assumed to represent a sin-
gle, dominant, nuclear locus with two possible alleles.
The amplified fragments were scored as: 1, for the pres-
ence, or 0, for the absence of homologous bands. From
this binary matrix, a distance matrix was computed
according to Nei and Li (1979) based on Dice’s similarity
coefficient (Dice 1945). A dendrogram was constructed
using the neighbor-joining method described by Saitou
and Nei (1987); the original matrix was bootstrapped
Table 2 Details of the primers used in the study of chloroplast and mitochondrial regions
Genea Primer pairs Size
(bp)
G ? C
(%)
Annealing
temperature (�C)
PCR
product (bp)
Chloroplast
primers
trnS-trnG trnS 50-GCCGCTTTAGTCCACTCAGC-30 20 60 52 *700–735
trnG 30-CACCATTTTCACACTAAGCAAG-50 22 41
rbcL1-rbcL2 rbcL1 50-ATGTCACCACCACAAACAGAGACT-30 24 46 60 *1,371
rbcL2 30-CCTCAGGACTTGATCGACGACGAACACTTC-50 31 52
Mitochondrial
primers
atp6F-atp6R atp6Fb 50-GGAGG(A=I)GGAAA(C=I)TCAGT(A=I)CCAA-30 22 48 58 *589–610
atp6R 30-TAGCATCATTCAAGTAAATACA-50 22 27
cobF-cobR cobF 50-AGTTATTGGTGGGGGTTCGG-30 20 55 58 *290–313
cobR 30-CCCCAAAAGCTCATCTGACCCC-50 22 59
cox1F-cox1R cox1Fb 50-GGTGCCATTGC(T=I)GGAGTGATGG-30 22 59 58 *1,466
cox1R 30-TGGAAGTTCTTCAAAAGTATG-50 21 33
nad3F-nad3R nad3F 50-AATTGTCGGCCTACGAATGTG-30 21 48 58 *237
nad3R 30-TTCATAGAGAAATCCAATCGT-50 21 33
nad5aF-nad5aR nad5aF 50-GAAATGTTTGATGCTTCTTGGG-30 22 41 58 *1,000
nad5aR 30-ACCAACATTGGCATAAAAAAAGT-50 23 30
nad5dF-nad5dR nad5dF 50-ATAAGTCAACTTCAAAGTGGA-30 21 33 58 *1,095–1,136
nad5dR 30-CATTGCAAAGGCATAATGAT-50 20 35
rps14F-rps14R rps14F 50-ATACGAGATCACAAACGTAGA-30 21 38 58 *114
rps14Rb 30-CCAAGACGATTT(C=I)TTTATGCC-50 21 38
nad4exon1-nad4exon2a nad4exon1 50-CAGTGGGTTGGTCTGGTATG-30 20 55 58 *2,058
nad4exon2a 30-TCATATGGGCTACTGAGGAG-50 20 50
a trnS-trnG, intergenic spacer between Ser-tRNA and Gly-tRNA; rbcL1-rbcL2, subunit of the ribulose-1,5-bisphosphate carboxylase gene; atp6 (or
atpF), F0-ATPase subunit 6 gene; cob, apocytochrome b gene; cox1 (or coxI), cytochrome c oxidase subunit 1 gene; nad3 (or nadC, nadhC, nadh3, or
nd3), NADH-ubiquinone oxidoreductase subunit 3 gene; nad5a (or nadF, ndhF, ndh5, nd5), NADH-ubiquinone oxidoreductase subunit 5 gene (intron
1); nad5dF (or nadF, ndhF, ndh5,nd5), NADH-ubiquinone oxidoreductase subunit 5 gene (intron 2); rps14, ribosomal protein subunit 14 gene;
nad4exon1 (or nadD, ndhD, ndh4, nd4) NADH-oxidoreductase subunit 4 gene (intron 1)b Inosine was used in the synthesis instead of the corresponding nucleotide because of the nucleotide variation between plant sequences
Genetic diversity and relationships in Solanum subg. Archaesolanum
123

1,000 times to check the reliability of the branching
patterns and the quality of the resulting phylogenetic
groups. These bootstrap values are shown at the nodes of
the dendrogram as percentages. The FAMD program
(Schluter and Harris 2006) was used for all calculations.
The tree obtained using FAMD was visualized and edited
using the TreeView program (Page 1996).
Parsimony analysis of the restriction fragments
All calculations were carried out using the program pack-
age PHYLIP (Phylogeny Inference Package) published by
Felsenstein (1989). The two data sets (trnS-trnG and
rbcL1-rbcL2) were analyzed separately and in combina-
tion. The discrete character data of the restriction frag-
ments were coded into a series of (0 or 1) two-state
characters. The further analysis was carried out using the
branch-and-bound algorithm of the DOLPENNY program
to find all of the most parsimonious trees implied by the
data. The data analysis was performed with the use of the
Dollo parsimony method. The program was set to report
every 100 trees and 1,000 groups. From the resulting out-
put trees, a consensus tree was built with the CONSENSE
program using the majority rule criterion.
Results
RAPD analysis
The 40 RAPD primer pairs generated 295 reliable frag-
ments from all the accessions analyzed. RAPD analysis
using primer combinations clearly separated the accessions
used in the study. The dendrogram calculated from the data
matrix generated by the formula of Nei and Li (1979) is
presented in Fig. 1. We tried to root the resulting tree by
additionally adding/removing groups and taxa used as
outgroups. In all cases a consistently distinct Archaesola-
num clade was present among the analyzed accessions,
where no significant difference was found in the overall
topology of the groups within the Archaesolanum clade.
The dendrograms in all rooted versions consistently pro-
duced two separate clades; one was composed of the
members of ser. Avicularia and Laciniata, namely two
accessions of S. aviculare, two accessions of S. laciniatum,
S. vescum, and S. linearifolium, which exhibit close affin-
ity based on the bootstrap values. S. vescum is sister to this
group composed of S. aviculare and S. laciniatum; S. lin-
earifolium occupies a basal position in this clade. The
second major clade was formed by members of ser. Similia.
S. capsiciforme is separated from the other members of the
group. S. symonii and the two accessions of S. simile are
grouped together.
Chloroplast and mitochondrial region analysis
One amplification product per sample was obtained for all
the accessions examined. The size of the fragments
amplified with trnS-trnG primers was approximately
710 bp among the species. The size of the rbcL1-rbcL2
fragments was approximately 1,370 bp and showed no
variation. Restriction enzyme assay with seven different
enzymes resulted in variable fragments in the case of the
trnS-trnG region. Approximately 10 bp differences were
observed between the restriction fragments. The PCR-
RFLP fragments of the region clearly separate two groups
in the subgenus. S. laciniatum, S. aviculare, and S. vescum
compose a group with larger fragments, while S. simile,
S. symonii, and S. capsiciforme gave smaller restriction
products. S. linearifolium occupied an ‘‘intermediate’’
position between the two groups according to the fragment
lengths of the PCR-RFLP analysis. An example is shown in
Fig. 2. The observed variability in the restriction products
indicates that there are differences between the Archaeso-
lanum species in the trnS-trnG region (Table 3).
The rbcL1-rbcL2 region was not informative in the case
of subg. Archaesolanum. After digestion with six restric-
tion endonuclease enzymes, no polymorphism was
detectable. However, the selected enzymes had 4–9
restriction sites in the 1,370-bp sequence. This similarity of
the Archaesolanum species and their difference from the
outgroups indicates that, although this region is uninfor-
mative at the subgeneric level, it could be useful in higher
taxonomic analyses. As the rbcL region was not informa-
tive in the present case, it is not discussed in the following.
Eight mitochondrial regions were amplified to detect
different fragment length patterns which could be attrib-
uted to the unique replication of the mitochondrial genome.
For this reason the universal primers described by Deme-
sure et al. (1995) were used, to reveal this type of variation.
The size of the PCR products and the sequence of the
primers are given in Table 2. Polymorphic fragments were
detected with the use of nad5aF-nad5aR. These primers are
designed for the amplification of an intron between exon 1
(nad5aF) and exon 2 (nad5aR) of the nicotinamide adenine
dinucleotide (NADH)-ubiquinone oxidoreductase sub-
unit 5 gene. While all the species had a 1,000-bp fragment,
in the case of S. vescum, S. laciniatum, and S. linearifoli-
um an *690-bp size band was also detectable. Beside
these, S. linearifolium also had a unique *880-bp frag-
ment (Fig. 3).
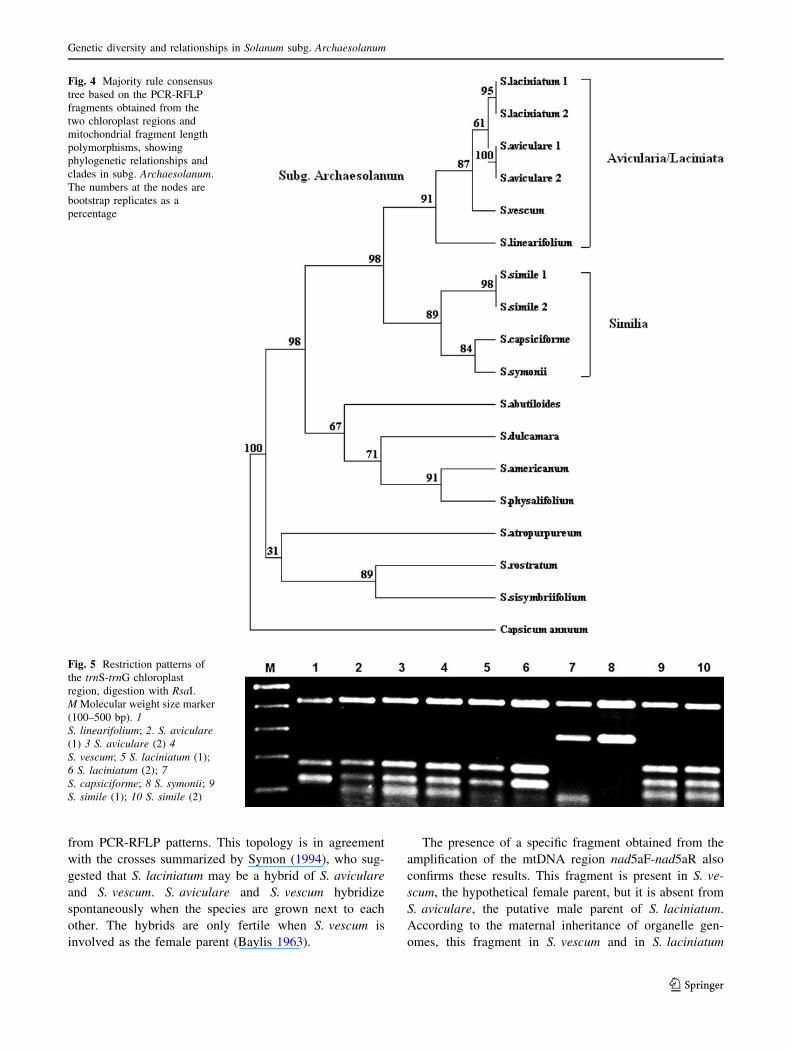
Results of the parsimony analysis
The phylogenetic tree obtained from the analysis of the
consensus tree construction is given in Fig. 4. The topology
of the tree constructed from the chloroplast region
P. Poczai et al.
123

restriction data is almost identical to the tree topology of
the RAPD data. The major difference is that S. symonii and
S. capsiciforme formed a group together in the case of the
chloroplast region. This arrangement was due to the
absence of a restriction site with RsaI in the trnS-trnG
sequence unique for these species (Fig. 5).
Fig. 1 Dendrogram constructed
using the neighbor-joining (NJ)
method from the RAPD data
matrix calculated with the
formula given by Nei and Li
(1979). The numbers at the tree
nodes are bootstrap values as a
percentage
Fig. 2 Restriction patterns of
the trnS-trnG chloroplast
region, digestion with MboI.
M Molecular weight size marker
(100–1,000 bp). 1S. linearifolium; 2 S. aviculare(1), 3 S. aviculare (2); 4 S.vescum; 5 S. laciniatum (1); 6S. laciniatum (2); 7S. capsiciforme; 8 S. symonii; 9S. simile (1); 10 S. simile (2)
Genetic diversity and relationships in Solanum subg. Archaesolanum
123
Discussion
This study represents an approach using genomic DNA
fingerprint markers and other methods to study genetic
relationships in subg. Archaesolanum. The RAPD data
obtained in this study are a random sample, representing all
the polymorphic RAPDs in the germplasm examined.
RAPDs have been shown to be useful as taxonomic
markers for closely related species through concordant
results using other molecular marker systems for closely
related taxa elsewhere in sect. Petota (Cisneros and Quiros
1995; Spooner et al. 1996). In addition, the results indicate
that S. aviculare and S. laciniatum are closely related,
which is strongly supported by bootstrap values. S. avicu-
lare is easily confused with S. laciniatum. Previously
S. laciniatum was treated as a variety of S. aviculare under
the name S. aviculare var. laciniatum (Aiton) Domin. Both
species were commonly cultivated in the former USSR,
Australia, and New Zealand, and they were used in the
alkaloid industry in the 1970s (Knapp 2006). Although
they are difficult to distinguish, there are some morpho-
logical parameters in which they differ. S. aviculare is
diploid (2n = 2x = 46) with bright-orange or red mature
fruits containing approx. 600 seeds per fruit, while
S. laciniatum is tetraploid (2n = 4x = 92), with fruits that
are first green, later paling to yellow or orange-yellow, and
containing approx. 200 seeds per fruit. Baylis (1954)
clearly describes other characteristics: S. laciniatum has
larger pollen grains, flowers, seeds, and stone-cell masses
(in the fruit pulp) than S. aviculare; its corolla is deeper in
color with relatively shallow lobes, the margins of which
flatten more completely, producing an emarginated apex.
The analyses carried out provide results in re-examining
the putative hybrid origin of S. laciniatum, indicating that
it is not of recent hybrid origin. There is a lack of additivity
both in the RAPD patterns and in the PCR-RFLP analysis.
In the dendrogram constructed from RAPD data, S. lacin-
iatum forms a group together with S. aviculare and
S. vescum, and the same topology is present in the tree
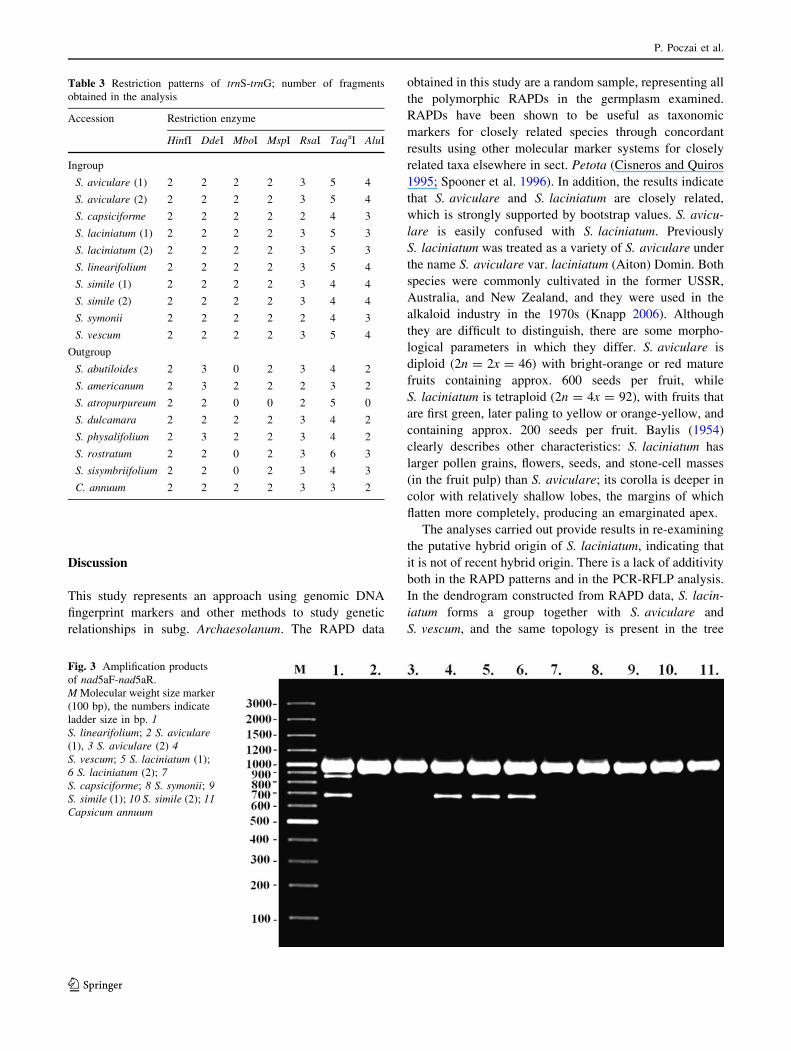
Table 3 Restriction patterns of trnS-trnG; number of fragments
obtained in the analysis
Accession Restriction enzyme
HinfI DdeI MboI MspI RsaI TaqaI AluI
Ingroup
S. aviculare (1) 2 2 2 2 3 5 4
S. aviculare (2) 2 2 2 2 3 5 4
S. capsiciforme 2 2 2 2 2 4 3
S. laciniatum (1) 2 2 2 2 3 5 3
S. laciniatum (2) 2 2 2 2 3 5 3
S. linearifolium 2 2 2 2 3 5 4
S. simile (1) 2 2 2 2 3 4 4
S. simile (2) 2 2 2 2 3 4 4
S. symonii 2 2 2 2 2 4 3
S. vescum 2 2 2 2 3 5 4
Outgroup
S. abutiloides 2 3 0 2 3 4 2
S. americanum 2 3 2 2 2 3 2
S. atropurpureum 2 2 0 0 2 5 0
S. dulcamara 2 2 2 2 3 4 2
S. physalifolium 2 3 2 2 3 4 2
S. rostratum 2 2 0 2 3 6 3
S. sisymbriifolium 2 2 0 2 3 4 3
C. annuum 2 2 2 2 3 3 2
Fig. 3 Amplification products
of nad5aF-nad5aR.
M Molecular weight size marker
(100 bp), the numbers indicate
ladder size in bp. 1S. linearifolium; 2 S. aviculare(1), 3 S. aviculare (2) 4S. vescum; 5 S. laciniatum (1);
6 S. laciniatum (2); 7S. capsiciforme; 8 S. symonii; 9S. simile (1); 10 S. simile (2); 11Capsicum annuum
P. Poczai et al.
123
from PCR-RFLP patterns. This topology is in agreement
with the crosses summarized by Symon (1994), who sug-
gested that S. laciniatum may be a hybrid of S. aviculare
and S. vescum. S. aviculare and S. vescum hybridize
spontaneously when the species are grown next to each
other. The hybrids are only fertile when S. vescum is
involved as the female parent (Baylis 1963).
The presence of a specific fragment obtained from the
amplification of the mtDNA region nad5aF-nad5aR also
confirms these results. This fragment is present in S. ve-
scum, the hypothetical female parent, but it is absent from
S. aviculare, the putative male parent of S. laciniatum.
According to the maternal inheritance of organelle gen-
omes, this fragment in S. vescum and in S. laciniatum
Fig. 4 Majority rule consensus
tree based on the PCR-RFLP
fragments obtained from the
two chloroplast regions and
mitochondrial fragment length
polymorphisms, showing
phylogenetic relationships and
clades in subg. Archaesolanum.
The numbers at the nodes are
bootstrap replicates as a
percentage
Fig. 5 Restriction patterns of
the trnS-trnG chloroplast
region, digestion with RsaI.
M Molecular weight size marker
(100–500 bp). 1S. linearifolium; 2. S. aviculare(1) 3 S. aviculare (2) 4S. vescum; 5 S. laciniatum (1);
6 S. laciniatum (2); 7S. capsiciforme; 8 S. symonii; 9S. simile (1); 10 S. simile (2)
Genetic diversity and relationships in Solanum subg. Archaesolanum
123
represents a unique mitochondrial structure, which sup-
ports the hybridization theory. Although this type of
mitochondrial structure is present in S. linearifolium too, it
separates from them, forming another fragment of
approximately 880 bp. This fragment could be a promising
item for further analysis of the subgenus.
Hybrid speciation could occur at least two ways in this
case: It is possible that S. laciniatum is developed through
diploid hybrid speciation involving S. aviculare and
S. vescum as female parent, and than the entire genome is
duplicated through autopolyploidy. This alternative
hybridization can only be achieved if S. laciniatum is an
ancient hybrid. This could be supported by the unique
mitochondrial rearrangement identified. This diploid
hybrid speciation could result from a normal sexual event
where each gamete has a haploid complement of the
nuclear chromosomes from its parent, but gametes that
form the zygote come from different species (in this case
from S. vescum and S. aviculare). From the crosses
reported by Baylis (1963) it is known that partial fertility
exists between S. vescum as female parent and S. avicu-
lare, and backcrossing is often possible, like in the typical
case of diploid hybrid speciation. However, this hypothesis
could not explain the extensive genomic homology detec-
ted between S. aviculare and S. laciniatum. In the data set
generated by the selected RAPD primers the number of
polymorphic bands was very low, which was also reported
in our previous analysis with a different set of primers
(Poczai 2007; Poczai et al. 2008).
Another alternative hypothesis might be that S. lacini-
atum was developed through autopolyploid formation,
where the normal genome of S. aviculare is duplicated in
its entirety and produced tetraploid offspring which were
postzygotically isolated from their parent. Crosses made
between S. aviculare and S. laciniatum led to very few
seeds, and no successful germination could be detected
(Gerasimenko 1969). This hypothesis could be an expla-
nation for the lack of additive bands in S. laciniatum from
S. vescum and S. aviculare, in the RAPD and cpDNA
region PCR-RFLP profile, and it also would be a reason for
the presence of the high genetic similarity between
S. aviculare and S. laciniatum. However, the latter
hypothesis suggesting an autopolyploid speciation event
for S. laciniatum seems considerably more reasonable than
hybrid introgression through S. vescum.
To clarify the relationship of S. laciniatum to the other
members of the group will require much intensive phylo-
genetic analysis. If S. laciniatum resulted from an ancient
hybridization, additional evidence on the hybrid origin
could be provided with particular analysis of DNA
sequences. To resolve these events, reticulate evolution
should be taken into consideration for further investiga-
tions and cytogenetic analysis should also be carried out to
resolve the origin of S. laciniatum. In addition, improved
taxonomic sampling and/or use of more sensitive markers
would be required for more comprehensive understanding
of the evolutionary history of S. laciniatum/S. aviculare.
Such study based on different DNA fingerprinting markers
and sequences is underway and will be summarized in a
companion paper.
Preliminary phylogeny constructed from the crosses
summarized by Symon (1994) and based on morphology
suggests S. multivenosum as a possible parent of S. lacin-
iatum. However, the role of S. multivenosum in this phy-
logenetic concept remains uncertain, because the present
study did not include samples from S. multivenosum. This
taxon must be included in further investigations on the
phylogenetic relationships in subg. Archaesolanum in
order to clarify its position with respect to S. aviculare,
S. laciniatum, and S. vescum. The species S. multivenosum
is endemic in high-altitude ([2,000 m) sites in Papua New
Guinea, so access to good material is very difficult. Pos-
sibly for this reason, no plant material or herbarium spec-
imen was recorded in the Solanaceae Source, a global
project for taxonomy, or by the Botanical and Experi-
mental Garden of Radboud University Nijmegen, which is
why it was not included in the present analysis.
S. linearifolium formed a basal branch of the cluster
composed of S. aviculare, S. laciniatum, and S. vescum in
all the trees. Based on this topology, its closest relative is
S. vescum, but the two accessions did not form a separate
group. This relationship can be explained by morphological
parameters. The well-developed sinus tissues are diagnos-
tic in the case of S. linearifolium, and the strongly winged
stems (from the sessile, decurrent leaves) in the case of
S. vescum (Baylis 1954).
The other clade separated in the dendrogram is com-
posed of S. capsiciforme, S. symonii, and S. simile (two
accessions). These species belong to ser. Similia. The
separation of this group based on morphology was con-
firmed by data derived from the present investigation using
molecular genetic markers. S. symonii is often confused
with S. simile, as the habit, green fruits, and small flowers
of the two species are very similar. This morphological
similarity between the two species can be detected at DNA
level according to the RAPD data. In this dendrogram the
two species form a group together, which is supported by
strong bootstrap values of 100%. Despite the morphologi-
cal similarity, the chromosome numbers of the two species
are not the same; S. symonii is tetraploid (2n = 4x = 92),
whereas S. simile is diploid (2n = 2x = 46). Crosses
between S. simile and S. symonii and the other members of
the subgenus have been made, but no fertile hybrids could
be obtained (Baylis 1963).
S. capsiciforme is sister to all the other members of this
group in Symon’s (1994) preliminary phylogeny based on
P. Poczai et al.
123

morphology. In the present study it occupied a distinctive
place in the cluster composed of members of ser. Similia.
In the analysis of the restriction patterns of the two chlo-
roplast region trnS-trnG it formed a group with S. symonii.
However, the RAPD data separated S. capsiciforme
from the members of the ser. Similia, and S. symonii is
grouped together with the two accessions of S. simile. This
difference between the results can be explained by the
different nature of the two methods. RAPD amplifies
fragments from the whole genome, but mostly from the
nuclear genome, while the restriction analysis in this study
focused on specific regions of the chloroplast genome,
detecting site variations, in the light of which S. symonii is
more closely related to S. simile at the nuclear genomic
level than to S. capsiciforme. However, there is evidence
from the trnS-trnG restriction site variation that both
S. symonii and S. capsiciforme lack a cleavage site of the
RsaI endonuclease enzyme. This indicates that S. capsici-
forme and S. symonii could share a common maternal
ancestor, but additional data will be required to prove this
hypothesis.
Series Similia can be easily distinguished morphologi-
cally from the other series of subg. Archaesolanum, and the
results of the present study show that this is confirmed by
molecular genetic methods. Such a clear distinction cannot
be made between the members of ser. Avicularia and
Laciniata, which form a single clade in the RAPD data,
while the same topology could be observed in the tree
obtained from the chloroplast data. S. aviculare, the type
species for ser. Avicularia, and S. laciniatum, the type
species for ser. Laciniata, grouped together. From this
topology it is concluded that the existence of these two
taxonomic groups must be reconsidered. S. multivenosum
should also be included in further studies, and more
molecular data will be required to clarify the position of the
Avicularia/Laciniata clade. New formal taxonomic desig-
nations for the series in subg. Archaesolanum will be
needed. It would be reasonable to rise the series to sec-
tional level, since the Archaesolanum group is recognized
as a subgenus. As both the RAPD and cpDNA region
analyses separated two groups, it is suggested to form two
sections in subg. Archaesolanum. The first of these might
be sect. Similia, consisting of former members of ser.
Similia. As the Avicularia/Laciniata clade consists of
members from both ser. Avicularia and ser. Laciniata, a
new section should also be formed by uniting these two
groups, which could be sect. Avicularia, since S. aviculare
was the first name published by Forster (1786).
Subgenus Archaesolanum is a unique group in the
genus. The chromosome structure hypothesized to be
derived from secondary polyploidy and distinctive habit
puts them in the focus of phylogenetic interest. This study
aimed to summarize information about the phylogeny of
this exotic group and to use molecular genetic techniques
to provide more insight into the relationships between the
species of the subgenus. Although implications based on
genetic relationships within this group have been formu-
lated, some burning questions remain unanswered. Little is
known about within- and among-population genetic
diversity of each species, and the closest relatives of the
groups have even not been unambiguously identified.
Analysis of divergence through time and the combination
of different phylogenetic methods capable of resolving
complex evolutionary events would result in certain
information about the group’s radiation, dispersal, and
phylogeny.
Acknowledgments Thanks are due to Gerard M. van der Weerden
for rapid seed transfer, to the workers of the Botanical and Exper-
imental Garden of the Radboud University, Nijmegen, and to Linda
Magyar, Kinga Matyas, and Istvan Cernak for their excellent
assistance. This research represents a partial fulfillment of the
requirements for the degree of Doctor of Philosophy (PhD) in Plant
Genetics and Biotechnology at the University of Pannonia. This
work was carried out in 2007 and it was supported by the Hungarian
State PhD Grant provided for the first author at the University of
Pannonia.
References
Baeza C, Schrader O, Budahn H (2007) Characterization of
geographically isolated accessions in five Alstromeria L. species
(Chile) using FISH of tandemly repeated DNA sequences and
RAPD analysis. Plant Syst Evol 269:1–14
Baylis GTS (1954) Chromosome number and distribution of Solanumaviculare Forst. and S. laciniatum Ait. Trans Roy Soc N Z
82:639–643
Baylis GTS (1963) A cytogenetical study of the Solanum avicularespecies complex. Aust J Bot 11:168–177
Bitter G (1927) Solanaceae. In: Hegi G (ed) Illustrierte Flora von
Mittel-Europa, vol 5, Part 4. J.F. Lehmanns, Munich,
pp 2548–2625
Bohs L (2005) Major clades in Solanum based on ndhF sequences. In:
Keating RC, Hollowell VC, Croat TB (eds) A festschrift for
William G. D’Arcy: the legacy of a taxonomist. Monographs in
Systematic Botany from the Missouri Botanical Garden, vol 104.
Missouri Botanical Garden Press, St. Louis, pp 27–49
Bohs L, Olmstead RG (1997) Phylogenetic relationships in Solanum(Solanaceae) based on ndhF sequences. Syst Bot 22:5–17
Bohs L, Olmstead RG (2001) A reassessment of Normania and
Triguera (Solanaceae). Plant Syst Evol 228:33–48
Bruzdzinski CM, Gelehrter TD (1989) Determination of exon-intron
structure: a novel application of the polymerase chain reaction
technique. DNA 8:691–696
Bussel JD, Waycott M, Chappill JA (2005) Arbitrarily amplified
DNA merkers as characters for phylogenetic inference. Perspect
Plant Ecol 7:3–26
Cisneros PL, Quiros CF (1995) Variation and phylogeny of the
triploid cultivated potato Solanum shaucha Juz. et. Buk. based
on RAPD and isozyme markers. Genet Res Crop Evol
42:373–386
Clausen AM, Spooner DM (1998) Molecular support for the hybrid
origin of the wild potato species Solanum 9 rechei (Solanumsect. Petota). Crop Sci 38:858–865
Genetic diversity and relationships in Solanum subg. Archaesolanum
123
Cseh A, Taller J (2008) Genetic diversity of ragweed (Ambrosiaartemisiifolia L.) a comparision of maternally inherited cpDNA
and mtDNA. J Plant Dis Protect 21(Special Issue):389–394
D’Arcy WG (1972) Solanaceae studies II: typification of subdivisions
of Solanum. Ann Mo Bot Gard 59:262–278
D’Arcy WG (1991) The Solanaceae since 1976, with a review of its
biogeography. In: Hawkes JG, Lester RN, Nee M, Estrada N
(eds) Solanaceae III: taxonomy, chemistry and evolution. Royal
Botanic Gardens, Kew, pp 75–137
Danert S (1970) Infragenerische Taxa der Gattung Solanum L.
Kulturpfl 18:253–297
Demesure BN, Sodzi R, Petit J (1995) A set of universal primers for
amplification of polymorphic non-coding regions of mitochon-
drial and chloroplast DNA in plants. Mol Ecol 4:129–131
Dice LR (1945) Measuring of amount of ecological association
between species. Ecology 26:297–302
Divaret I, Margale E, Thomas G (1999) RAPD markers on seed bulks
efficiently assess the genetic diversity of a Brassica oleracea L.
collection. Theor Appl Genet 98:1029–1035
Downie SR, Palmer JD (1992) Using of Chloroplast DNA rearrange-
ments in reconstructing plant phylogeny. In: Soltis PS, Soltis
DE, Doyle JJ (eds) Molecular systematics of plants. Springer,
Berlin, pp 14–36
Felsenstein J (1989) PHYLIP—Phylogeny Inference Package (Ver-
sion 3.2). Cladistics 5:164–166
Forster JGA (1786) Dissertatio inauguralis botanico-medica de plantis
esculentis insularum oceani australis. Typis Frankianus, Halle
Friesen N, Borisjuk N, Mes THM, Klaas M, Hanelt P (1997)
Allotetraploid origin of Allium altyncolicum (Alliaceae, Alliumsect. Schoenoprasum) as investigated by karyological and
molecular markers. Plant Syst Evol 206:317–335
Fu CH, Chen CL, Guo WW, Deng XX (2004) GISH, AFLP and PCR-
RFLP analysis of an intergeneric somatic hybrid combining
Goutou sour orange and Poncirus trifoliata. Plant Cell Rep
23(6):391–396
Gerasimenko II (1969) Inter and intraspecific hybridisation in the
genus Solanum subgenus Archaesolanum Bitter ex Marzell.
Genetika 5:51–60
Gerasimenko II (1970) Conspectus subgeneris Archaesolanum Bitt.
Ex Marz. Generis Solanum L. Novosti Sist Vyssh Rast
7:270–275
Hair JB (1966) Biosystematics of the New Zealand Flora, 1945–1964.
New Zeal J Bot 4:559–595
Hamilton MB (1999) Four primer pairs for the amplification of
chloroplast intergenic regions with intraspecific variation. Mol
Ecol 8:513–525
Huang J, Corke H, Sun M (2002) Highly polymorphic AFLP markers
as a complementary tool to ITS sequences in assessing genetic
diversity and phylogenetic relationships of sweetpotato (Ip-omoea batatas (L.) Lam.) and its wild relatives. Genet Res Crop
Evol 49(6):541–550
Hunziker AT (2001) Genera Solanacearum. A. R. G. Ganter, Ruggell,
pp 49–85
Knapp S (2006) Solanum aviculare. In: Solanaceae Source, 2008.
Available via http://www.nhm.ac.uk/research-curation/projects/
solanaceaesource/taxonomy/description-detail.jsp?spnumber=1213
Levin RA, Myers NR, Bohs L (2006) Phylogenetic relationships
among the ‘‘spiny solanums’’ (Solanum subgenus Leptostemo-num, Solanaceae) Am J Bot 93:157–169
Liebst B (2008) Do they really hybridize? A field study in artificially
established mixed populations of Euphrasia minima and E.salsburgensis (Orobanchaceae) in the Swiss Alps. Plant Syst
Evol 273:179–189
Michelmore RW, Paran I, Kesseli RV (1991) Identification of
markers linked to disease resistance genes by bulked segregant
analysis: a rapid method to detect markers in specific genomic
regions by using segregating populations. Proc Natl Acad Sci
USA 88:9828–9832
Miller JT, Spooner DM (1999) Collapse of species boundaries in the
wild potato Solanum brevicaule complex (Solanaceae sect.
Petota): molecular data. Plant Syst Evol 214:103–130
Nei M, Li WH (1979) Mathematical model for studying genetic
variation in terms of restriction endonucleases. Proc Natl Acad
Sci USA 76:5269–5273
Olmstead RG, Palmer JD (1997) Implications for the phylogeny,
classification, and biogeography of Solanum from cpDNA
restriction site variation. Syst Bot 22:19–29
Olmstead RG, Sweere JA, Spangler RE, Bohs L, Palmer JD (1999)
Phylogeny and provisional classification of the Solanaceae based
on chloroplast DNA. In: Nee M, Symon DE, Lester RN, Jessop
JP (eds) Solanaceae IV: advances in biology and utilization.
Royal Botanic Gardens, Kew, pp 111–137
Page RDM (1996) TREEVIEW: an application to display phyloge-
netic trees on personal computers. Comput Appl Biosci
12:357–358
Palmer JD (1990) Contrasting modes and tempos of genome
evolution in land plant organelles. Trends Genet 6:115–120
Palmer JD, Herbon LA (1988) Plant mitochondrial DNA evolved
rapidly in structure, but slowly in sequence. J Mol Evol
28(1–2):87–97
Poczai P (2007) Phylogenetic analysis of infrageneric groups in the
genus Solanum. MSc thesis, University of Pannonia
Poczai P, Taller J, Szabo I (2008) Analysis of phylogenetic
relationships in the genus Solanum (Solanaceae) as revaled by
RAPD markers. Plant Syst Evol 275:59–67
Potokina E, Tomooka N, Duncan A, Vaughan DA, Alexandrova T,
Xu RQ (1999) Phylogeny of Vicia Subgenus Vicia (Fabaceae)
based on analysis of RAPDs and RFLP of PCR-amplified
chloroplast genes. Genet Res Crop Evol 46(2):149–161
Prentice HC, Malm JU, Hathaway L (2008) Chloroplast DNA
variation in the European herb Silene dioica (rad campion):
postglacial migration and interspecific introgression. Plant Syst
Evol 272:23–37
Randell BR, Symon DE (1976) Chromosome numbers in Australian
Solanum species. Aust J Bot 24:369–379
Rodrıguez A, Spooner DM (1997) Chloroplast DNA analysis of
Solanum bulbocastanum and S. cardiophyllum, and evidence for
the distinctiveness of S. cardiophyllum subsp. ehrenbergii (sect.
Petota). Syst Bot 22:31–43
Saitou N, Nei M (1987) The neighbor-joining method: a new
method for reconstructing phylogenetic trees. Mol Biol Evol
4:406–425
Schluter PM, Harris SA (2006) Analysis of multilocus fingerprinting
data sets containing missing data. Mol Ecol Not 6:569–572
Sheng HM, An LZ, Chen T, Xu SJ, Liu GX, Zheng XL, Pu LL, Liu
YJ, Lian YS (2006) Analysis of the genetic diversity and
relationships among and within species of Hippophae (Elaeagn-
aceae) based on RAPD markers. Plant Syst Evol 260:25–37
Spooner DM, Systma KJ (1992) Reexamination of series relationships
of Mexican and Central American wild potatoes (Solanum sect.
Petota): evidence from chloroplast DNA restriction site varia-
tion. Syst Bot 17:432–448
Spooner DM, Sytsma KJ, Conti E (1991) Chloroplast DNA evidence
for genome differentiation in wild potatoes (Solanum sect.
Petota: Solanaceae). Am J Bot 78:1354–1366
Spooner DM, Anderson GJ, Jansen RK (1993) Chloroplast DNA
evidence for the interrelationships of tomatoes, potatoes, and
pepinos (Solanaceae). Am J Bot 80:676–688
Spooner DM, Tivang J, Nienhuis J, Miller JT, Douches DS, Contreras
MA (1995) Comparison of four molecular markers in measuring
relationships among the wild potato relatives Solanum section
Etuberosum (subgenus Potatoe). Theor Appl Genet 92:532–540
P. Poczai et al.
123

Spooner DM, Tivang J, Nienhuis J, Miller JT, Douches DS, Contreras
MA (1996) Comparison of four molecular markers in measuring
relationships among the wild potato relatives Solanum section
Etuberosum (subgenus Potatoe). Theor Appl Genet 92(5):532–
540
Spooner DM, Ugarte ML, Skroch PW (1997) Species boundaries and
interrelationships of two closely related sympatric diploid wild
potato species, Solanum astleyi and S. boliviense., based on
RAPDs. Theor Appl Genet 95(5–6):764–771
Stedje B, Bukenya-Ziraba R (2003) RAPD variation in Solanumanguivi Lam. and S. aethiopicum L. (Solanaceae) in Uganda.
Euphytica 131:283–297
Symon DE (1979) The genus Solanum in Australia. In: Hawkes JG,
Lester RN, Skelding AD (eds) The biology and taxonomy of The
Solanaceae. Academic Press, London, pp 125–127
Symon DE (1981) A revision of Solanum in Australia. J Adelaide Bot
Gard 4:1–367
Symon DE (1984) Solanum sect. Archaesolanum (Bitt. Ex Marzell)
Danert. In: van Balgooy MMJ (ed) Pacific plant areas, vol 4.
National Herbarium of the Netherlands, pp 215–245
Symon DE (1994) Kangaroo apples: Solanum sect. Archaesolanum.
Published by the author, Keswick, South Australia
Van den Berg R, Bryan G, Del Rio A, Spooner DM (2002) Reduction
of species in the wild potato Solanum section Petota series
Longipedicellata: AFLP, RAPD and chloroplast SSR data. Theor
Appl Genet 105(8):1109–1114
Vincze T, Posfai J, Robers RJ (2003) NEBcutter: a program to cleave
DNA with restriction enzymes. Nucleic Acids Res 31(13):3688–
3691
Wachowiak W, Stephan BR, Schulze I, Prus-Głowacki W, Ziegen-
hagen B (2006) A critical evaluation of reproductive barriers
between closely related species using DNA markers–a case study
in Pinus. Plant Syst Evol 257:1–8
Walbot V, Warren C (1988) Regulation of Mu element copy number
in maize lines with an active or inactive Mutator transposable
element system. Mol Gen Genet 211(1):27–34
Welsh J, McClelland M (1990) Fingerprinting genomes using PCR
with arbitrary primers. Nucleic Acid Res 18:7213–7218
Williams JGK, Kubelik AR, Livak KJ, Rafalski JA, Tingey SV
(1990) DNA polymorphism amplified by arbitrary primers are
useful as genetic markers. Nucleic Acids Res 18:6531–6535
Williams JGK, Hanafey MK, Rafalski JA, Tingey SV (1993) Genetic
analysis using random amplified polymorphic DNA markers.
Methods Enzym 218:704–740
Wolfe KH, Li WH, Sharp PM (1987) Rates of nucleotide substitution
vary greatly among plant mitochondrial, chloroplast, and nuclear
DNAs. Proc Natl Acad Sci USA 84(24):9054–9058
Genetic diversity and relationships in Solanum subg. Archaesolanum
123
Top Related
Copyright © 2022 FDOKUMEN

