


Bahasa
Halaman
Hukum

BJRS
BRAZILIAN JOURNAL
OF
RADIATION SCIENCES 07-02A (2019) 01-09
ISSN: 2319-0612
Accepted: 2019-01-03
GENERATION OF CR MAMMOGRAPHIC IMAGE FOR
EVALUATION QUALITY PARAMETERS
M. B. Floresa; A. P. Mourãoa,b
a Universidade Federal de Minas Gerais/Departamento de Engenharia Nuclear, CEP 31270-901, Belo Horizonte, MG,
Brazil
b Centro de Educação Tecnológica de Minas Gerais/Centro de Engenharia Biomédica, CEP 30421-169, Belo Horizon-
te, MG, Brazil
ABSTRACT
Cancer is one of the leading causes of mortality in the world. In 2012, about 14 million new cases were registered, of
which 1.6 million are breast cancer, according to the World Health Organization. The National Cancer Institute of
Brazil estimated 57 thousand new cases of breast cancer by 2016. Mammography is the imaging technique most used
worldwide for the early diagnosis of breast cancer. Computed radiography plates (CR) are used for digital radiography,
and are widely used to obtain digital mammograms. The objective of this work is to evaluate the response of CR plates
to the variation of exposure in mammographic equipment and to evaluate the viability of using calcium agglomerates as
microcalcifications through the acquisition and evaluation of technical visual image quality, in order to develop a breast
phantom of low cost and easy production using these structures. For the first goal, X-ray beams were selected to
perform successive exposures of CR plates by varying the exposure time. These exposures were performed to obtain
raw images that were subsequently analyzed using ImageJ software, from which the value of intensity recorded in the
central region of each image was obtained, correlating it with the exposure time. From these data the necessary
correlations were made to determine the exposure time for which the CR plate begins to saturate, observing that the
saturation occurs first the CR plate of mammographic system A. For the second goal, successive exposures of the CR
plate were made using the compressed breast simulator made of acrylic plates and containing microcalcifications of
different sizes to determine the qualitative technical visual image quality of CR plates, observing that only
microcalcifications above 177 μm are visible in the image.
Keywords: Mammography; Computed Radiography; X Radiation.

Flores, Mourão ● Braz. J. Rad. Sci. ● 2019 2
1. INTRODUCTION
Today, breast cancer is one of the most deadly diseases in the world. This fact is related to the
difficulty of obtaining an early diagnosis, since it is often a lesion that is easily confused with the
breast tissue and has a rapid development. In Brazil, according to National Cancer Institute of
Brazil, it is estimated that more than 57 thousand new cases of breast cancer occur annually [1]. For
this reason, several methods were developed for the early detection of breast cancer, such as
mammography, ultrasound, breast computed tomography, magnetic resonance imaging and digital
breast tomosynthesis.
Mammography, which is basically an X-ray image of the breast, is the main tool used in early
detection programs and plays a relevant role in the diagnosis of breast cancer as well as its location
in biopsy and therapy procedures [2].
Currently there are two generic types of detection systems for digital mammography. The first one
incorporates a photostimulable phosphor plate, placed inside a cassette during the -exposure and
designated as CR computed radiography. These systems record the variation of the intensity of the
X-ray beam incident on the surface of the detector, after being attenuated by the medium passing
through [3]. Systems containing other types of detectors, normally integrated into the system rather
than separate cassettes, are referred to as DR digital radiography systems [4, 5].
The operating response of the detectors associated with each system varies according to the
exposure parameters used, affecting the performance of the detector. Automatic exposure control
helps determine the amount of dose deposited on the patient, which may be higher or lower
depending on the thickness of the breast [6]. In addition, the type of information processing stored
in the detectors varies because each manufacturer uses a different image processing algorithm [7].
In a mammographic image, generally, the structures that can warn the appearance of breast cancer
are the tumor masses that have irregular and spiculated margins, grouping of calcifications,
distortions of normal patterns in the tissues and asymmetries between the regions corresponding to
the right breast and left [3].
According to the Brazilian Ministry of Health, approximately half of the cancers discovered through
mammography images are due to the registration of microcalcifications. The registry of

Flores, Mourão ● Braz. J. Rad. Sci. ● 2019 3
microcalcifications is the most common sign of ductal carcinoma in situ, which is a premature
cancer limited to the ducts of the glandular tissues of the breast. Almost 90% of cases of ductal
carcinoma are associated with microcalcifications [8].
Therefore, in addition to investigating the effect of different detectors in the detection of
microcalcification, it is also important to investigate their behavior in relation to exposure
parameters, such as saturation time, and image processing.
The main objective of this work is to determine if calcium agglomerates could be used as
microcalcifications using a basic test simulator objects made with PMMA plates. To achieve this
goal, this work will be divided into two parts; the first part will determine the saturation time of
each CR plate in order to know the dynamic range of each CR plate that will help us select the most
suitable parameters to work with the test object without approaching the saturation zone of the CR
plates. In the second part the preparation of the calcium agglomerates of different sizes and the
assembly of the test object containing these structures will be done to verify if they can be
visualized in the image and to select which are the most appropriate sizes for, in future works,
develop a simulator object of breast with equivalent tissue of low cost and easy production.
2. MATERIALS AND METHODS
For the development of this study, two CR plates were used which were each exposed in a different
mammographic X-ray equipment. The main characteristics of these equipment will be presented
next, denominated of A and B.
2.1. Mammographic Systems
For the development of this study, two CR plates were used which were each exposed in a different
mammographic X-ray equipment. The main characteristics of these equipment will be presented
next, denominated of A and B.

Flores, Mourão ● Braz. J. Rad. Sci. ● 2019 4
Table 1: Characteristics of the mammographic systems A and B used for this study.
Mammographic Systems A B
Mammograph Philips VMI Graph Mammo
AF GE Senographe DMR
Anode/filter combination
available Mo/Mo [9]
Mo/Mo, Mo/Rh and Mo/Al
[10]
CR plate Regius RP6M110 IP Cassette type DM
CR plate size 18 x 24 cm2 18 x 24 cm2
Scanning unit Regius 110 HQ FCR Profect One
Manufacturer of CR plate Konica Minolta Fujifilm
Pixel size 43.75 μm [11] 50.00 μm [12].
Figure 1: Mammographic system A: Mam-
mograph Philips VMI Graph Mammo AF
(a), CR plate Regius RP6M110 (b) and
scanning unit Regius 110 HQ (c).
Figure 2: Mammographic system B: Mam-
mograph GE Senographe DMR (a), CR
plate IP Cassette type DM (b) and scanning
unit FCR Profect One (c).

Flores, Mourão ● Braz. J. Rad. Sci. ● 2019 5
2.2. Determination of the saturation time of CR plates
For the acquisition of the experimental data, parameters were initially selected to carry out the
direct exposure of plates A and B in their respective mammographic units. For this purpose an X-
ray beam was chosen, using anode/filter combination of Mo/Mo, of 30 kV and 70 mA, to perform
successive exposures of the plate by varying in exposure from 35 mAs to 175 mAs, with 35 mAs
steps (0.5 s to 2.5s), keeping constant the source-to-image distance (SID) at 65 cm for the
mammograph Philips VMI Graph Mammo AF and mammograph GE Senographe DMR,
respectively. This procedure was performed with the mammograph placed in manual mode to be
able to manipulate the control parameters.
After performing each of the exposures of the CR plates, it was read in its corresponding digitizing
unit, obtaining 11 images for each CR plate, which were saved in .raw (unprocessed) format. The
characteristics of the images obtained with each mammographic system can be observed in Table 2.
Table 2: Characteristics of the images obtained with each mammographic system
Mammographic Systems
Characteristics of the image A B
Image size (pixels) 4040×5416 3540×4730
Pixel density (resolution) (pixels.mm-1) 22.86 20.00
The images obtained were analyzed using the ImageJ software selecting small ROIs of approxi-
mately 1 mm2 size to obtain the recorded intensity, in gray scale, and to correlate this value with the
exposure time for each CR plate. The selected ROIs were placed in the same position for all the
images, at a fixed distance in relation to the chest wall and centered along it.

Flores, Mourão ● Braz. J. Rad. Sci. ● 2019 6
2.3. Qualitative determination of the technical visual image quality of CR plates
To determine the feasibility of using calcium agglomerates for the development of a breast phantom
and what could be the most suitable sizes, a basic test object, made with six
polymethylmethacrylate (PMMA) plates [13], was developed to try simulate the dimensions and
geometry of the breast phantom that will be developed in future studies. For this purpose, the
preparation of the calcium samples and the quality with which these structures are visualized in the
resulting image for each CR system was evaluated.
The dimension of acrylic plate is presented in Figure 3. The plates that were used to determine the
technical visual image quality of the CR plates are presented in Figure 4.
Figure 3: the dimension of semicircular
acrylic plates of polymethylmethacrylate.
Figure 4: Semicircular plates of acrylic of
polymethylmethacrylate.
In parallel, to simulate mammary calcifications, calcium agglomerates were used which have as
their main component, 95% by weight, calcium carbonate [14].
These agglomerates were separated according to the size of their particles using laboratory sieves
for granulometric analysis, Bertel brand, of different openings from 45 to 300 µm.
By this procedure, six calcium samples of different sizes were obtained, which were classified
within the size range corresponding to each sieve. These separate samples are presented in Figure 5.

Flores, Mourão ● Braz. J. Rad. Sci. ● 2019 7
To validate the particle sizes of each sample, they were analyzed with a Cilas 1090 particle analyzer
used for granulometry.
Figure 5: Samples of calcium agglomerates separated by size.
The six samples were distributed on a PMMA plate, each in a specific region, and with the help of a
microscope, labeled Novel, each sample particle was positioned, one separated from the other, so
that each could be identified individually. To facilitate the identification of the region where the
samples are located, a template with the number of each sample was elaborated. In Figure 6, the
PMMA plate, on which the calcium agglomerates were distributed, is shown next to the template.
Figure 6: PMMA plate with calcium agglomerates.
Flores, Mourão ● Braz. J. Rad. Sci. ● 2019 8
This PMMA plate, along with the other plates, will be used in this study to simulate microcalcifica-
tions within a compressed breast, compressed breast phantom.
Finally, for the acquisition of the images with the breast phantom using each of the mammographic
systems and trying to make the exposure conditions with both mammographs as similar as possible,
their corresponding X-ray equipment were placed in AEC mode, so that the equipment automatical-
ly determines the exposure time with the anode/filter of Mo/Mo, voltage of 28 kV, 100 mAs and
SID of 65 cm for the Mammograph Philips VMI Graph Mammo AF and 69 mAs and SID of 65 cm
for the Mammograph GE Senographe DMR.
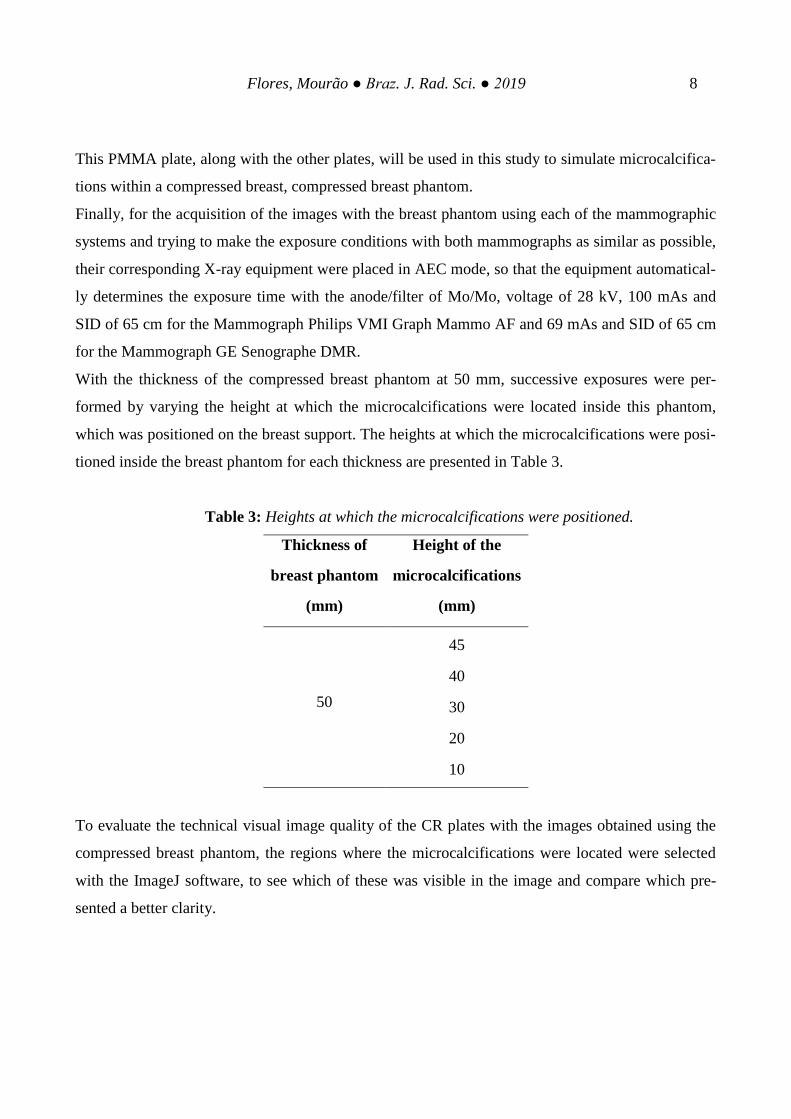
With the thickness of the compressed breast phantom at 50 mm, successive exposures were per-
formed by varying the height at which the microcalcifications were located inside this phantom,
which was positioned on the breast support. The heights at which the microcalcifications were posi-
tioned inside the breast phantom for each thickness are presented in Table 3.
Table 3: Heights at which the microcalcifications were positioned.
Thickness of
breast phantom
(mm)
Height of the
microcalcifications
(mm)
50
45
40
30
20
10
To evaluate the technical visual image quality of the CR plates with the images obtained using the
compressed breast phantom, the regions where the microcalcifications were located were selected
with the ImageJ software, to see which of these was visible in the image and compare which pre-
sented a better clarity.

Flores, Mourão ● Braz. J. Rad. Sci. ● 2019 9
3. RESULTS AND DISCUSSION
Initially, the results of the analysis of the images in the central region of the CR plate are presented
to determine the time of the saturation plates by curve fitting, evaluating the variation of the
recorded intensity, in the gray scale, in relation to the exposure time for each image.
Next, the results of the tests performed using the breast phantom made of PMMA plates are
presented, corresponding to a compressed breast and groups of microcalcifications of different sizes
positioned in a dispersed manner and at different heights within the volume of the breast phantom.
3.1. Determination of the saturation time of CR plates
The correlation of the exposure time with the recorded intensity variation, in grayscale, by means of
curves fitting of the experimental data was determined the time for which the CR plate begins to
saturate when a direct exposure is made. The saturation curves for plates A and B are presented in
Figure 7.
Figure 7: Curves of the logarithmic fitting of the degree of darkening on the gray scale in relation
to the exposure time for both CR plates.
The obtained curves that correlate the variation of the recorded intensity (I) with the exposure time
(t) are defined through equation 1, whose values of the constants are presented in Table 4.

Flores, Mourão ● Braz. J. Rad. Sci. ● 2019 10
I=a-b·ln(t+c) (1)
Table 4: Values of the coefficients of the fitting curves for both CR plates.
CR plate Voltage
(kV) Correlation coefficient a b c
A 30 0.999 3733.70 -453.98 0.25
B 30 0.995 3871.13 -281.50 -0.16
The saturation times obtained for the direct exposure of the CR plates, analyzing the central region
of the image, are presented in Table 5.
Table 5: Estimated saturation time for each CR plate.
CR plate Saturation time (s)
A 1.98±0.01
B 2.36±0.02
With the voltage selected for this study, the maximum intensity value recorded in the digital images
was 4095, which represents the highest value of the scale for both CR plates.
Saturation parameters are studied to avoid overexposure of the image, which could occur in regions
not occupied by the breast, this overexposure will depend both on the exposure time and the quality
of the beam used.
3.2. Qualitative determination of the technical visual image quality of CR plates
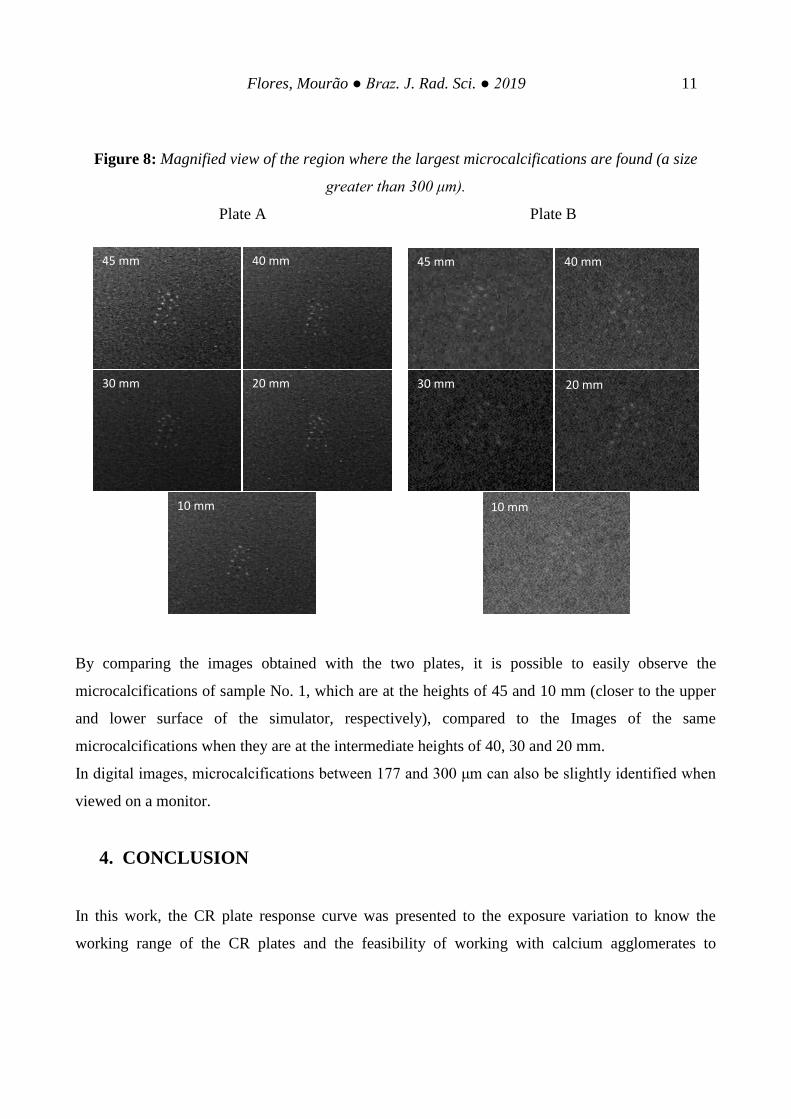
Figure 8 shows the amplified images of the region where the largest microcalcifications (greater
than 300 μm) are found at different heights inside the breast phantom with a thickness of 50 mm for
plates A and B.
Flores, Mourão ● Braz. J. Rad. Sci. ● 2019 11
Figure 8: Magnified view of the region where the largest microcalcifications are found (a size
greater than 300 μm).
Plate A Plate B
By comparing the images obtained with the two plates, it is possible to easily observe the
microcalcifications of sample No. 1, which are at the heights of 45 and 10 mm (closer to the upper
and lower surface of the simulator, respectively), compared to the Images of the same
microcalcifications when they are at the intermediate heights of 40, 30 and 20 mm.
In digital images, microcalcifications between 177 and 300 μm can also be slightly identified when
viewed on a monitor.
4. CONCLUSION
In this work, the CR plate response curve was presented to the exposure variation to know the
working range of the CR plates and the feasibility of working with calcium agglomerates to
45 mm 40 mm
30 mm 20 mm
10 mm
45 mm 40 mm
30 mm 20 mm
10 mm

Flores, Mourão ● Braz. J. Rad. Sci. ● 2019 12
simulate microcalcifications was studied in order to develop, in the future, a simulator object with
equivalent tissue of low cost and easy production, which could be used for quality assurance and
quality control tests in mammography.
The CR digital mammography system is widely used in Brazil and the knowledge of the
characteristics and the response of the CR plates when different exposure parameters are applied are
essential to obtain good quality images in order to reduce the energy deposited in the patient.
By comparing the saturation time for the 30 kV voltage of the plate A with the saturation time
corresponding to the plate B, it can be verified that for this voltage, this last plate takes a longer
time to reach saturation, this may be due to the fact that the quality of the beams is different and
also the exposure conditions are similar but not the same, in addition to the reading function of plate
A is one-face, while the reading function of plate B is double-face.
In this work, tests were performed using calcium agglomerates, to evaluate the possibility of using
these structures for the construction of a compressed breast phantom, which will be developed in
future work. The preparation of the samples to be used as microcalcifications did not present major
complications, which would make the use of these structures viable due to their easy handling. In
the tests performed with the basic simulator object was observed that only the largest size
microcalcifications (greater than 177 μm) are distinguishable in the mammographic image using the
mammographic large focus spot, which would indicate that these sizes would be the most suitable
for the construction of a breast phantom of low cost and easy production.
The technical visual image quality of the CR plate does not always guarantee that in the digitized
image it will be possible to visualize small structures of interest for the diagnosis of the breast,
especially when the size of these structures is comparable to the size of pixel of the CR plate used,
as is the case with the microcalcifications used for this study. Breast tomosynthesis could be
considered as an alternative technique to CR mammography for future studies that could help to
improve the visibility of smaller structures in addition to specifying the position in which they are
located.
Flores, Mourão ● Braz. J. Rad. Sci. ● 2019 13
5. ACKNOWLEDGMENT
The authors are grateful to the Coordenação de Aperfeiçoamento de Pessoal de Nível Superior
(CAPES), Fundação de Amparo à Pesquisa do Estado de Minas Gerais (FAPEMIG) and the
Nacional de Desenvolvimento Científico e Tecnológico (CNPq) for the support.
REFERENCES
[1] MINISTÉRIO DA SAÚDE, Instituto Nacional do Câncer. Rio de Janeiro: MINISTÉRIO DA
SAÚDE. Available at:
<http://www2.inca.gov.br/wps/wcm/connect/tiposdecancer/site/home/mama>. Last accessed:
13 Sep. 2018.
[2] OLIVEIRA, M. A., DANTAS, M. V. A., SANTANA, P. C., SQUAIR, P. L., GOMES, D. S.,
NOGUEIRA, M. S. Assessment of glandular dose and image quality in mammography using
computerized radiography employing a polymethylmetacrilate breast simulator. Radiation
Measurements, v. 46(12), p. 2081-2085, 2011.
[3] DANCE, D. R.; CHRISTOFIDES, S.; MAIDMENT, A. D. A.; MCLEAN, I. D.; NG, K. H. Di-
agnostic radiology physics: A handbook for teachers and students, 3rd ed. Vienna: IAEA,
2014.
[4] MAWDSLEY, G. E., BLOOMQUIST, A. K., YAFFE, M. J. Digital Mammography Quality
Control for the Mammographic Physicist. Toronto: Ontario Breast Screening Program,
2011.
[5] TORRES, R. C. The state of the art in technology for digital mammography. Radiologia, v.
52(7), p. 7-13, 2010.
[6] RAJENDRAN, P. T., KRISHNAPILLAI, V., TAMANANG, S., CHELLIAH, K. K. Compari-
son of image quality criteria between digital storage phosphor plate in mammography and
full-field digital mammography in the detection of breast cancer. The Malaysian journal of
medical sciences: MJMS, v. 19(1), p. 52, 2012.
[7] RIVETTI, S., LANCONELLI, N., BERTOLINI, M., NITROSI, A., BURANI, A., ACCHIAP-
PATI, D. Comparison of different computed radiography systems: physical characterization
and contrast detail analysis. Medical physics, v. 37(2), p. 440-448, 2010.
[8] BURSTEIN, H. J., POLYAK, K., WONG, J. S., LESTER, S. C., KAELIN, C. M. Ductal carci-
noma in situ of the breast. New England Journal of Medicine, v. 350(14), p. 1430-1441,
2004.

Flores, Mourão ● Braz. J. Rad. Sci. ● 2019 14
[9] VMI INDÚSTRIA E COMÉRCIO LTDA. Manual do usuário aparelho de mamografia mod.
Graph Mammo AF Código 0043_01/02. Belo Horizonte, 2002. 39p.
[10] MEDWOW LTD. Su plataforma global de equipamentos médicos. Especificaciones del
fabricante – Senographe DMR, GE Healthcare. 2014. Available at:
<http://es.medwow.com/med/mammography-unit/ge-healthcare/senographe-
dmr/24417.model-spec>. Last accessed: 18 Set. 2018.
[11] KONICA MINOLTA INC. Regius Model 110HQ. USA. Available at:
<http://www.konicaminolta.com/healthcare/products/mammo/model110hq/>. Last accessed:
25 Ago. 2018.
[12] FUJIFILM CORPORATION. FCR Cápsula XLII. 2013. Available at:
<http://www.fujifilm.com/products/medical/products/computed_radiography/capsula_xl2/>.
Last accessed: 03 Out. 2018.
[13] INTERNATIONAL ELECTROTECHNICAL COMMISSION. Medical Diagnostic X-Ray
Equipment-Radiation Conditions for Use in the Determination of Characteristics IEC
61267: 2005. 2nd ed. IEC, 2005.
[14] HINCKE, M. T.; NYS, Y.; GAUTRON, J.; MANN, K.; RODRIGUEZ, A. B. N.; MCKEE, M.
D. The eggshell: structure, composition and mineralization. Frontiers in Bioscience, v. 17, p.
1266-1280, 2012.
Top Related
Copyright © 2022 FDOKUMEN

