


Bahasa
Halaman
Hukum

Gender and LPG use after government intervention in
rural north India
Sangita Vyas* Aashish Gupta� Nazar Khalid�
September 11, 2021
*University of Texas at Austin and r.i.c.e., [email protected]. 2225 Speedway, Austin, TX 78712,512-471-3211.
�University of Pennsylvania and r.i.c.e., [email protected].�University of Pennsylvania and r.i.c.e., [email protected].
This paper benefited from helpful comments received at the Sustainability and Development Conference2019. We thank Shilpa Bagde, Kailash Kumar, Amit Kumar, Laxmi Saini, and Poonam Saini for their helpin conducting the fieldwork. We also thank Diane Coffey, Payal Hathi, Chuan Liao, Megan Reed, KanikaSharma, Dean Spears, and Nikhil Srivastav for useful comments and feedback. This material is based uponwork supported by the National Science Foundation Graduate Research Fellowship under Grant No. DGE-1610403. This research was also supported by grant P2CHD042849, Population Research Center, and bythe grant T32HD007081, Training Program in Population Studies, both awarded to the Population ResearchCenter at The University of Texas at Austin by the Eunice Kennedy Shriver National Institute of ChildHealth and Human Development. Any opinions, findings,and conclusions or recommendations expressed inthis material are those of the author and do not necessarily reflect the official views of the NSF or the NIH.This is a pre-print version of the paper published in World Development. The published version is availablehere
Gender and LPG use after government intervention
in rural north India
Abstract
Exposure to air pollution from cooking with solid fuels has important consequences for
public health. This paper focuses on rural north India, where despite robust economic
growth and government subsidies, the vast majority of households mainly use solid
fuels. We draw on new qualitative and quantitative data collected in the context of
a policy environment that dramatically expanded ownership of liquid petroleum gas
(LPG) to examine why households are slow to adopt clean fuels in rural north India. We
find that patriarchal gender norms and attitudes encourage the use of solid fuels in this
region. North Indian society confers low status to women, promotes women’s seclusion,
and constrains women’s engagement in economic activities outside of the home. These
beliefs encourage women to preserve gas, promote women’s work that facilitates the
use of solid fuels, and hinder communication between the cook and the decision-maker
regarding LPG refills. When rural north Indian households use gas, it is frequently
to facilitate the adherence to norms of seclusion that prevent women from leaving the
home to collect solid fuels. In addition to expanding access and improving economic
conditions, future research and policy interventions should pay careful attention to the
gender norms and attitudes that discourage the use of gas. Addressing these beliefs
and norms is essential to sustained LPG use and health improvements.
Keywords: energy transition, solid fuels, LPG, gender, India
1 Introduction
Solid fuel use for cooking is an important contributor to air pollution and disease in devel-
oping countries (Smith, 2000; Salvi and Barnes, 2009; Anonymized, 2019c). The combustion
of solid fuels also emits carbon and other greenhouse gases that contribute to air pollution
and climate change (Wilkinson et al., 2009). Because of the harmful impacts that solid
fuels have on human health and the environment, the Sustainable Development Goals call
for universal access to clean cooking fuels by 2030. However, despite economic development
and policy interventions, solid fuel use persists in many developing countries in the world
(Masera, Saatkamp and Kammen, 2000; Gould and Urpelainen, 2018; Mani et al., 2020).
Why is the transition to clean cooking fuels so slow? This paper addresses this question in
the context of India. We draw on recent changes in the policy environment that dramatically
expanded access to clean fuels, and extensive field research in rural north India, including
1
qualitative interviews and new quantitative data from the Survey of Rural Sanitation and
Solid Fuel Use (RSFU). The paper examines how gender norms and attitudes related to
women’s status, women’s seclusion, and women’s work explain the persistence of solid fuels.
India is a major contributor to global solid fuel use because of its population size and
because solid fuels are still so commonly used. In fact, even though India’s population
is about one-seventh of the world’s population, the country represents about one-third of
global solid fuel users (World Health Organization, 2016). Most of this occurs in rural areas.
The most recent National Family Health Survey (NFHS) for India, which collected data in
2015 and 2016, estimated that 75% of rural households reported mainly using solid fuels for
cooking.
To accelerate the transition of households from polluting to clean fuels, the Government of
India launched the Pradhan Mantri Ujjwala Yojana (PMUY) in May 2016, a program that
subsidized the set up costs of liquid petroleum gas (LPG) for rural households. Enrolled
households also benefited from existing subsidies on cylinder refills. By the end of the
program, in September 2019, the government claimed that 80 million connections had been
subsidized.
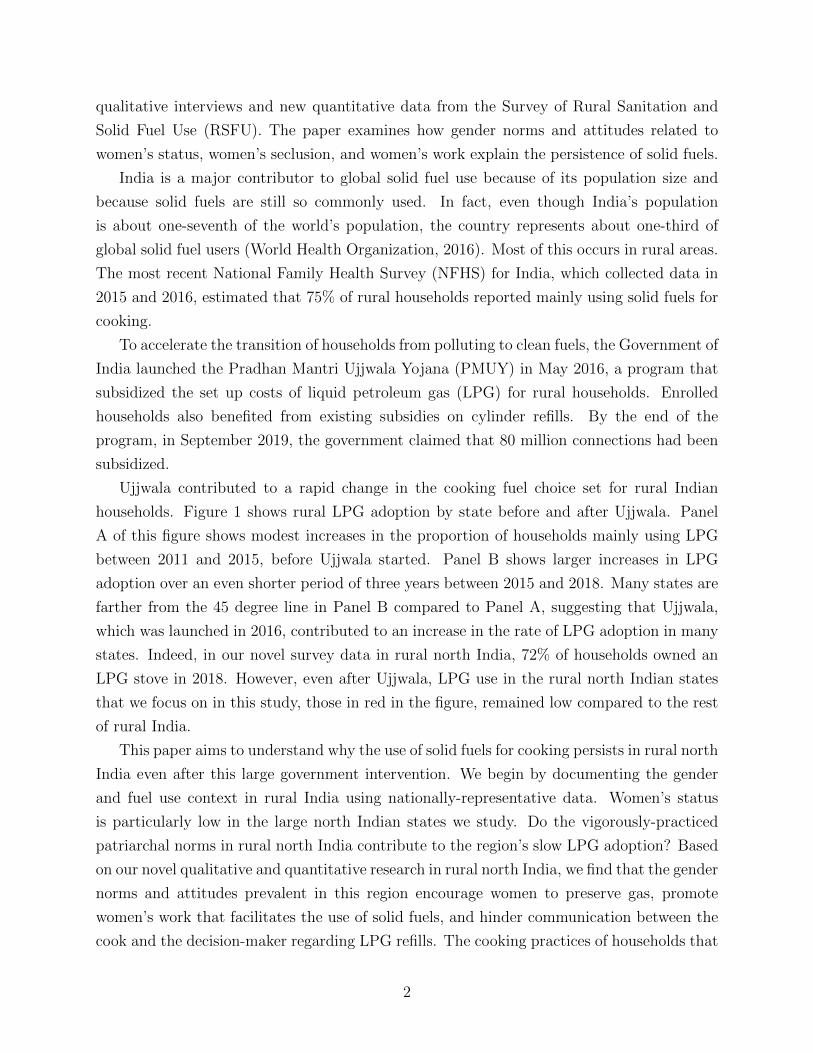
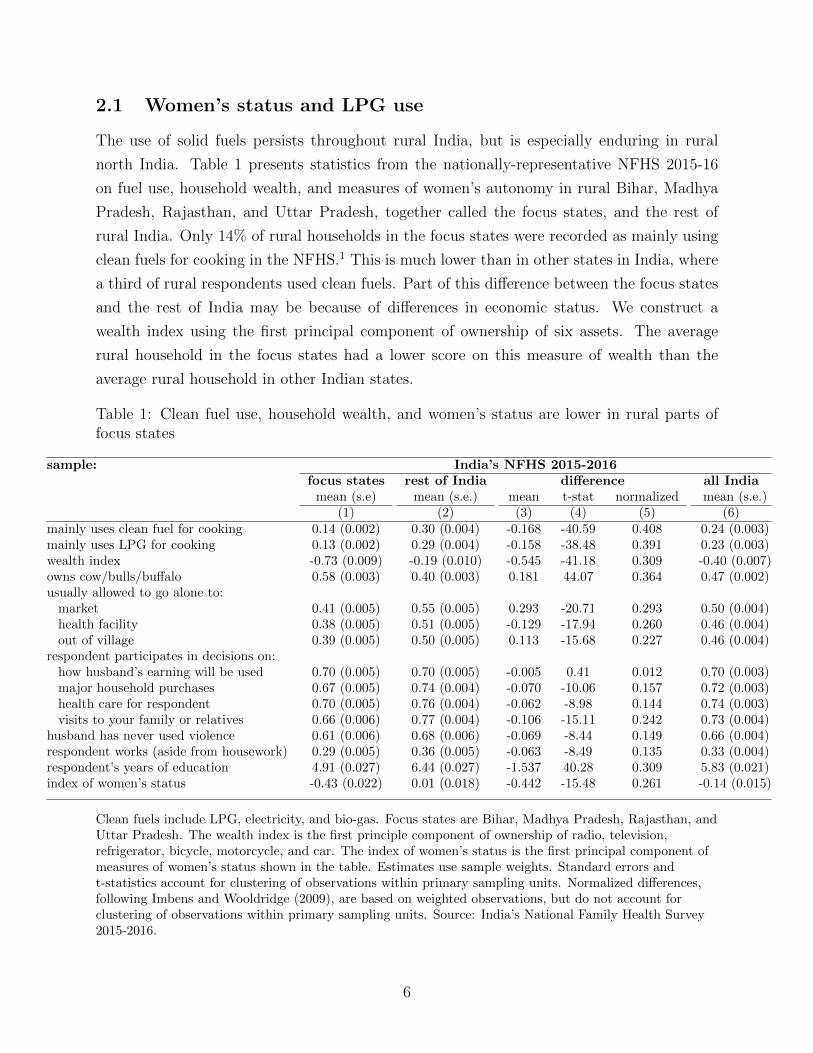
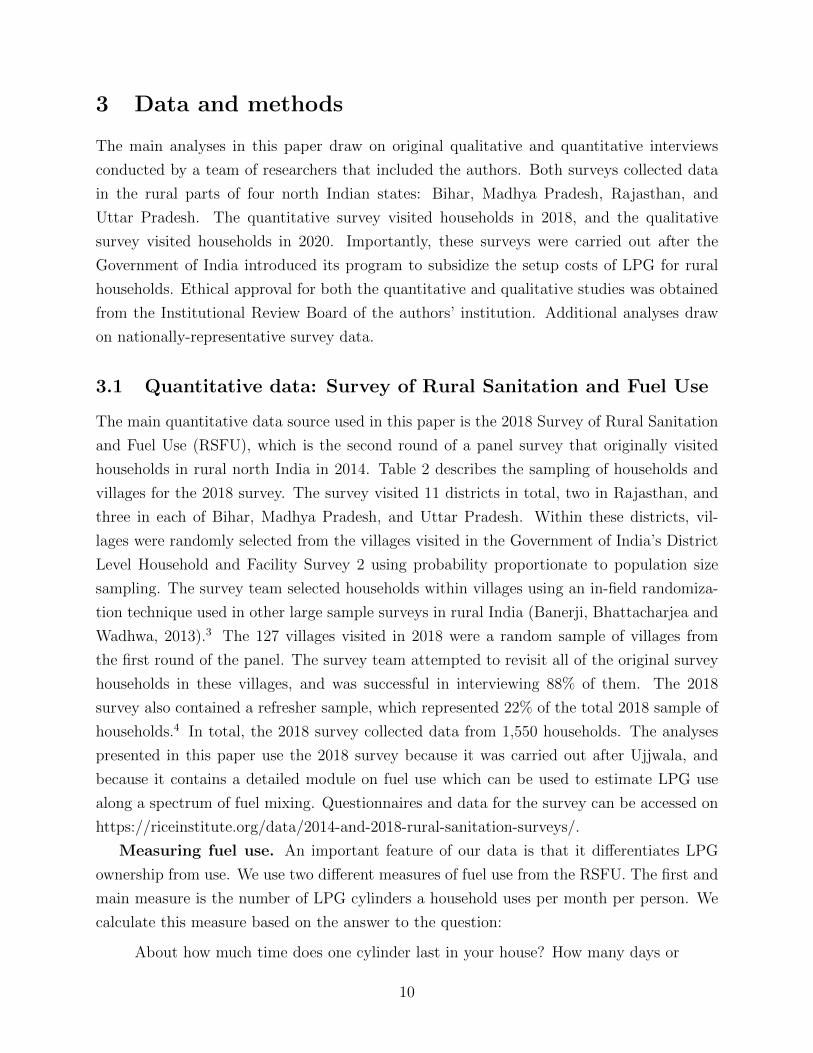
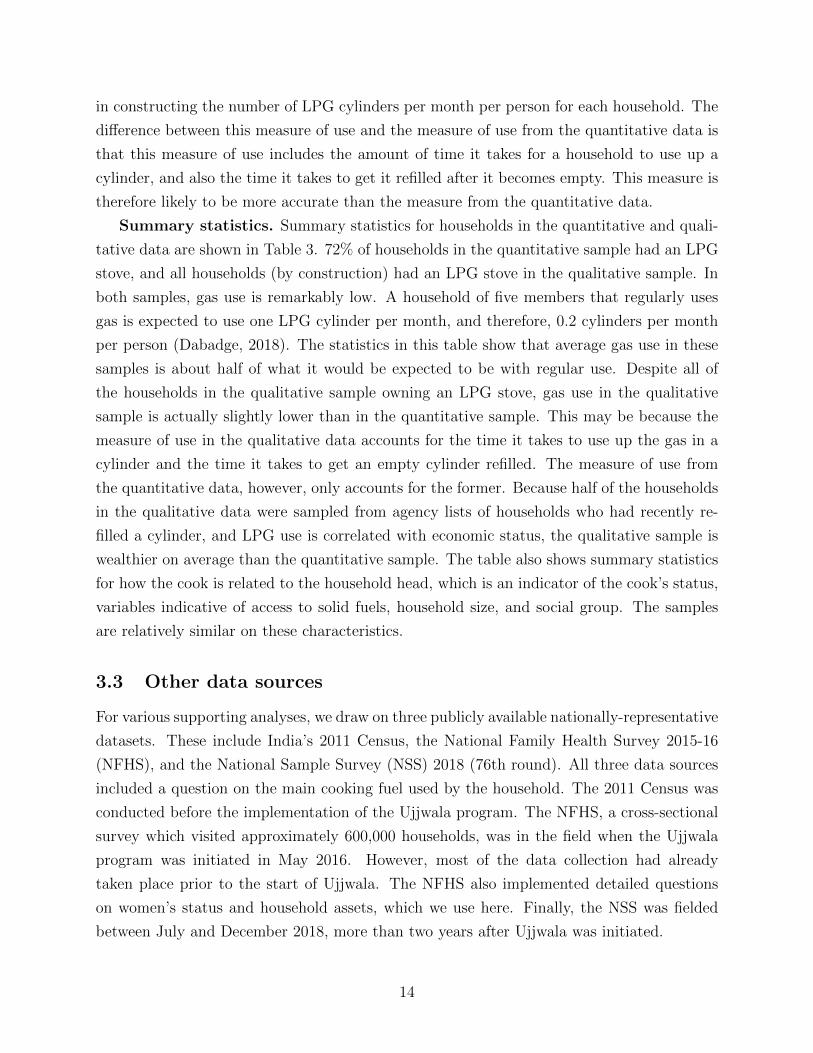
Ujjwala contributed to a rapid change in the cooking fuel choice set for rural Indian
households. Figure 1 shows rural LPG adoption by state before and after Ujjwala. Panel
A of this figure shows modest increases in the proportion of households mainly using LPG
between 2011 and 2015, before Ujjwala started. Panel B shows larger increases in LPG
adoption over an even shorter period of three years between 2015 and 2018. Many states are
farther from the 45 degree line in Panel B compared to Panel A, suggesting that Ujjwala,
which was launched in 2016, contributed to an increase in the rate of LPG adoption in many
states. Indeed, in our novel survey data in rural north India, 72% of households owned an
LPG stove in 2018. However, even after Ujjwala, LPG use in the rural north Indian states
that we focus on in this study, those in red in the figure, remained low compared to the rest
of rural India.
This paper aims to understand why the use of solid fuels for cooking persists in rural north
India even after this large government intervention. We begin by documenting the gender
and fuel use context in rural India using nationally-representative data. Women’s status
is particularly low in the large north Indian states we study. Do the vigorously-practiced
patriarchal norms in rural north India contribute to the region’s slow LPG adoption? Based
on our novel qualitative and quantitative research in rural north India, we find that the gender
norms and attitudes prevalent in this region encourage women to preserve gas, promote
women’s work that facilitates the use of solid fuels, and hinder communication between the
cook and the decision-maker regarding LPG refills. The cooking practices of households that
2
Figure 1: Large increases in rural LPG adoption from 2015 to 2018 relative to the past
AP
Ar.P
AS
CG
GO
GJ HA HPJK
JH
KA
KE
MH
MA
MG
MZ
NG
DL
OD
PJ
SK
TN
TP
UK
WB
TG
BHMP
RJUP
0.2
.4.6
.81
mai
nly
uses
LPG
, 201
5
0 .2 .4 .6 .8 1mainly uses LPG, 2011
a) 2011 to 2015
AP
Ar.PAS
CG
GO
GJHA
HP
JK
JH
KA
KE
MH
MA
MG
MZ
NG
DL
OD
PJ
SK
TN
TP
UK
WB
TG
BH
MP RJUP
0.2
.4.6
.81
mai
nly
uses
LPG
, 201
8
0 .2 .4 .6 .8 1mainly uses LPG, 2015
b) 2015 to 2018
Change in the use of LPG as the main fuel
The size of the markers reflect the size of the rural population in each state based on the 2011 Census.States in red are the focus states (Bihar, Madhya Pradesh, Rajasthan, and Uttar Pradesh). Sources: 2011Census, India’s National Family Health Survey 2015-2016, and the National Sample Survey 2018 (76thround).
do regularly use LPG can also be understood in the context of gender; using gas facilitates
the adherence to norms of seclusion that prevent women from leaving the home to collect
solid fuels. In addition to poverty, these explanations related to gender inequality are key
to understanding why rural north Indian households continue to use solid fuels, even when
Ujjwala dramatically expanded ownership of LPG stoves and access to LPG subsidies.
A growing literature links intra-household gender inequalities to the continued use of solid
fuels. In rural north India, women are primarily responsible for cooking and preparing solid
fuels (Hirway and Jose, 2011; Sharma, 2018; Anonymized, 2019a), but men are often the
financial decision-makers in the household (Palriwala, 1993; Desai et al., 1994). Since men
may not fully appreciate the benefits of cooking on gas, they may not value refills as highly
as women who cook. Indeed, Gould and Urpelainen (2019) find that households in which
women participate in decision-making are more likely to adopt LPG. Research by Choudhuri
and Desai (2020) supports this finding, and adds that women’s access to salaried work is also
associated with the use of clean fuels. Kishore and Spears (2014) use a different measure
for women’s status, the sex of her first child, since son preference conveys higher status to
women whose first child is male. They find that urban households in India with a male first
child are more likely to use clean cooking fuel than similar households with a female first
3
child. Other studies find that women-headed households in South Asia are more likely to
use LPG (Das et al., 2014; Behera et al., 2015; Mottaleb, Ali et al., 2017). This literature
examines discrete measures of women’s status, and quantitatively studies their associations
with the use of clean cooking fuels.
Specific to the Indian policy context, a recent literature documents the continued use of
solid fuels despite LPG ownership among rural Indian households after Ujjwala. Anonymized
(2019a) found that in 2018, among LPG owners in four north Indian states, three-quarters
used solid fuels the day before the survey. In a separate study covering six Indian states,
Jain et al. (2018) document that an increase in LPG ownership between 2015 and 2018 was
accompanied by an increase in fuel stacking, the practice of using multiple cooking fuels. A
study of LPG sales data from one district in Karnataka showed that the rapid growth in
connections as a result of Ujjwala was not matched by an increase in LPG sales (Kar et al.,
2019).
More broadly, the development literature has identified a number of cases in which gender
norms, attitudes, and beliefs shape population health outcomes and constrain public policy
(Kapur, 2020; Dreze and Sen, 2013). In an influential study on routes to low mortality in
developing countries, Caldwell (1986) identified women’s autonomy as a “central” feature
of mortality decline in poorer societies. In India, poor maternal nutrition, an outcome of
young married women’s low status, is an important reason why neonatal mortality is so high
compared to other even less developed countries in the world (Das Gupta, 1995; Coffey and
Spears, 2019). Similarly, the highly imbalanced sex ratio and millions of “missing women”
in India is a result of the widespread preference for sons (Sen, 2003).
Our study contributes to this diverse literature in several ways. First, by integrating
qualitative and quantitative interview data, we present a coherent analysis of the multiple
ways that gender norms and attitudes shape household cooking fuel decisions, and make
a unique contribution to the literature linking gender indicators to fuel use (Das et al.,
2014; Kishore and Spears, 2014; Behera et al., 2015; Mottaleb, Ali et al., 2017; Gould and
Urpelainen, 2019; Choudhuri and Desai, 2020). Our comprehensive treatment of gender
uncovers the mechanisms underlying correlations between gender indicators and fuel use
that have been documented in the prior literature. We find that patriarchal beliefs and
practices in rural north India encourage women to preserve gas, promote women’s work
that facilitates the use of solid fuels, and hinder communication between the cook and the
decision-maker regarding LPG refills.
Second, we advance an explanation for understanding the clean fuel policy challenge
that India now faces. The earlier literature examining the factors contributing to slow
LPG adoption in India was carried out before the Ujjwala Yojana started, when only a
4
minority of rural households had an LPG connection (Rao and Reddy, 2007; Behera et al.,
2015; Cheng and Urpelainen, 2014; Kishore and Spears, 2014; Gould and Urpelainen, 2018,
2019; Choudhuri and Desai, 2020). Now, the majority of rural Indian households have the
infrastructure to cook with LPG. That few consistently use it reveals the importance of
gender norms and attitudes in cooking practices. The more recent literature on cooking
fuel use post-Ujjwala focuses on documenting the continued use of solid fuels among LPG
owners, and does not advance explanations for the causes of slow LPG adoption in India. In
this paper, we propose gender norms and attitudes as an important factor contributing to
these patterns of use.
Finally, our study contributes to the wider literature on the persistence of poor health
in India despite robust economic growth (Dreze and Sen, 2013; Spears, 2018; Coffey and
Spears, 2019). We reinforce the message in the prior literature that gender norms and
inequalities pose important barriers to health improvements (Caldwell, 1986; Das Gupta,
1995; Sen, 2003). We also advance this literature by addressing another mechanism through
which patriarchal norms can influence population health: by promoting cooking fuels that
contribute to household and ambient air pollution.
The paper proceeds as follows. Section 2 provides context by presenting patterns of
women’s status and fuel use in nationally-representative data and reviewing the relevant
literature on gender in the household in rural north India. Section 3 describes the original
quantitative and qualitative data sources and the methods we use to study why rural north
India lags in the adoption of clean fuels. Section 4 presents summary statistics of LPG
ownership and use after Ujjwala in rural north India using our novel survey data. Despite
that the vast majority of households in our data owned an LPG stove, most continued to
use solid fuels on a regular basis. Section 5 presents our main findings. It characterizes the
ways in which gender norms and attitudes discourage the use of gas in rural north India,
and play a role in explaining at least some of the regular use that exists. Finally, Section 6
concludes with a discussion of these findings in the context of research and public policy.
2 Context
This section provides suggestive evidence that in addition to other factors, low women’s
status may play a role in explaining slow LPG adoption in rural north India. We first present
summary statistics on women’s status and clean fuel use in rural north India compared to
the rest of India from nationally-representative data. We then summarize the literature on
gender norms and attitudes that is useful for understanding cooking fuel patterns in rural
north India.
5
2.1 Women’s status and LPG use
The use of solid fuels persists throughout rural India, but is especially enduring in rural
north India. Table 1 presents statistics from the nationally-representative NFHS 2015-16
on fuel use, household wealth, and measures of women’s autonomy in rural Bihar, Madhya
Pradesh, Rajasthan, and Uttar Pradesh, together called the focus states, and the rest of
rural India. Only 14% of rural households in the focus states were recorded as mainly using
clean fuels for cooking in the NFHS.1 This is much lower than in other states in India, where
a third of rural respondents used clean fuels. Part of this difference between the focus states
and the rest of India may be because of differences in economic status. We construct a
wealth index using the first principal component of ownership of six assets. The average
rural household in the focus states had a lower score on this measure of wealth than the
average rural household in other Indian states.
Table 1: Clean fuel use, household wealth, and women’s status are lower in rural parts offocus states
sample: India’s NFHS 2015-2016focus states rest of India difference all India
mean (s.e) mean (s.e.) mean t-stat normalized mean (s.e.)(1) (2) (3) (4) (5) (6)
mainly uses clean fuel for cooking 0.14 (0.002) 0.30 (0.004) -0.168 -40.59 0.408 0.24 (0.003)mainly uses LPG for cooking 0.13 (0.002) 0.29 (0.004) -0.158 -38.48 0.391 0.23 (0.003)wealth index -0.73 (0.009) -0.19 (0.010) -0.545 -41.18 0.309 -0.40 (0.007)owns cow/bulls/buffalo 0.58 (0.003) 0.40 (0.003) 0.181 44.07 0.364 0.47 (0.002)usually allowed to go alone to:
market 0.41 (0.005) 0.55 (0.005) 0.293 -20.71 0.293 0.50 (0.004)health facility 0.38 (0.005) 0.51 (0.005) -0.129 -17.94 0.260 0.46 (0.004)out of village 0.39 (0.005) 0.50 (0.005) 0.113 -15.68 0.227 0.46 (0.004)
respondent participates in decisions on:how husband’s earning will be used 0.70 (0.005) 0.70 (0.005) -0.005 0.41 0.012 0.70 (0.003)major household purchases 0.67 (0.005) 0.74 (0.004) -0.070 -10.06 0.157 0.72 (0.003)health care for respondent 0.70 (0.005) 0.76 (0.004) -0.062 -8.98 0.144 0.74 (0.003)visits to your family or relatives 0.66 (0.006) 0.77 (0.004) -0.106 -15.11 0.242 0.73 (0.004)
husband has never used violence 0.61 (0.006) 0.68 (0.006) -0.069 -8.44 0.149 0.66 (0.004)respondent works (aside from housework) 0.29 (0.005) 0.36 (0.005) -0.063 -8.49 0.135 0.33 (0.004)respondent’s years of education 4.91 (0.027) 6.44 (0.027) -1.537 40.28 0.309 5.83 (0.021)index of women’s status -0.43 (0.022) 0.01 (0.018) -0.442 -15.48 0.261 -0.14 (0.015)
Clean fuels include LPG, electricity, and bio-gas. Focus states are Bihar, Madhya Pradesh, Rajasthan, andUttar Pradesh. The wealth index is the first principle component of ownership of radio, television,refrigerator, bicycle, motorcycle, and car. The index of women’s status is the first principal component ofmeasures of women’s status shown in the table. Estimates use sample weights. Standard errors andt-statistics account for clustering of observations within primary sampling units. Normalized differences,following Imbens and Wooldridge (2009), are based on weighted observations, but do not account forclustering of observations within primary sampling units. Source: India’s National Family Health Survey2015-2016.
6
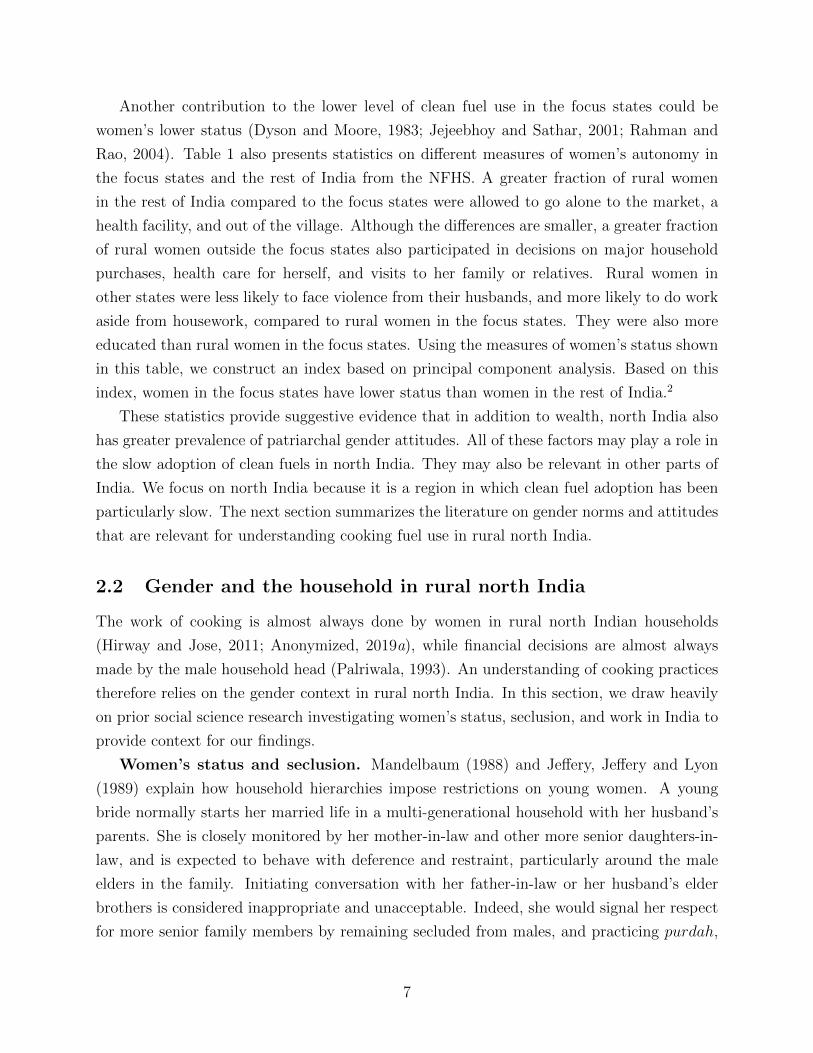
Another contribution to the lower level of clean fuel use in the focus states could be
women’s lower status (Dyson and Moore, 1983; Jejeebhoy and Sathar, 2001; Rahman and
Rao, 2004). Table 1 also presents statistics on different measures of women’s autonomy in
the focus states and the rest of India from the NFHS. A greater fraction of rural women
in the rest of India compared to the focus states were allowed to go alone to the market, a
health facility, and out of the village. Although the differences are smaller, a greater fraction
of rural women outside the focus states also participated in decisions on major household
purchases, health care for herself, and visits to her family or relatives. Rural women in
other states were less likely to face violence from their husbands, and more likely to do work
aside from housework, compared to rural women in the focus states. They were also more
educated than rural women in the focus states. Using the measures of women’s status shown
in this table, we construct an index based on principal component analysis. Based on this
index, women in the focus states have lower status than women in the rest of India.2
These statistics provide suggestive evidence that in addition to wealth, north India also
has greater prevalence of patriarchal gender attitudes. All of these factors may play a role in
the slow adoption of clean fuels in north India. They may also be relevant in other parts of
India. We focus on north India because it is a region in which clean fuel adoption has been
particularly slow. The next section summarizes the literature on gender norms and attitudes
that are relevant for understanding cooking fuel use in rural north India.
2.2 Gender and the household in rural north India
The work of cooking is almost always done by women in rural north Indian households
(Hirway and Jose, 2011; Anonymized, 2019a), while financial decisions are almost always
made by the male household head (Palriwala, 1993). An understanding of cooking practices
therefore relies on the gender context in rural north India. In this section, we draw heavily
on prior social science research investigating women’s status, seclusion, and work in India to
provide context for our findings.
Women’s status and seclusion. Mandelbaum (1988) and Jeffery, Jeffery and Lyon
(1989) explain how household hierarchies impose restrictions on young women. A young
bride normally starts her married life in a multi-generational household with her husband’s
parents. She is closely monitored by her mother-in-law and other more senior daughters-in-
law, and is expected to behave with deference and restraint, particularly around the male
elders in the family. Initiating conversation with her father-in-law or her husband’s elder
brothers is considered inappropriate and unacceptable. Indeed, she would signal her respect
for more senior family members by remaining secluded from males, and practicing purdah,
7
which refers to covering the face or head with a veil. Her movements outside of the home
are also heavily controlled.
As a woman ages and has children, her status in the household improves and she is likely
to reduce some of her veiling, such as in front of her mother-in-law. However, a woman
should never stop sending signals of deference in front of her father-in-law and husband’s
elder brothers. Eventually, a woman and her husband may separate from the joint family,
and her husband will become the household head. In a nuclear household, a woman may
have substantially more voice and autonomy since the elder males, for whom deference
and practices of seclusion are most important, no longer reside in the same household.
Das Gupta (1995) contends that although new daughters-in-law are expected to behave with
great reserve and have very little autonomy, senior women can wield considerable influence
in domestic matters. Indeed, an older woman does not face the same constraints on behavior
as a younger woman because the number of people superior to her in the household hierarchy
is necessarily less.
Women’s work. A consequence of women’s seclusion is that working for pay outside of
the home is highly curtailed. Labor force participation among women in India is remarkably
low, and has been declining over time despite increases in women’s educational attainment,
reductions in fertility, and economic growth (Afridi, Dinkelman and Mahajan, 2016). Srinivas
(1977) and Kapadia (1995) argue that there is a widespread belief, among rich and poor alike,
that women working for wages is a mark of low status, and that women staying at home
is preferred. Indeed, about half of adults in Delhi, Mumbai, Rajasthan, and Uttar Pradesh
disapproved of women working outside of the home in a 2016 survey on social attitudes
(Coffey et al., 2018).
Women in rural north India, however, do a considerable amount of unpaid manual work.
Within the home, they are responsible for cooking, serving food to household members,
collecting and preparing solid fuels, cleaning and grinding grains, fetching water, cleaning
and maintaining the house, washing clothes and dishes, and caring for children and the
elderly, among other responsibilities. Outside of the home, they may collect fodder for cows
and buffaloes that their household owns, manage the animals, and participate in certain
aspects of agriculture on the household farm. In joint households in rural north India,
daughters-in-law of the household head are more likely to do the inside work like cooking
and caring for children, and wives and unmarried daughters of the household head, for whom
seclusion is less important, are more likely to do the outside work like collecting fodder and
caring for animals (Jeffery, Jeffery and Lyon, 1989).
An important domestic responsibility among women, particularly senior women, is main-
taining control of household stocks. In her research in rural Rajasthan, Palriwala (1993)
8
often heard the saying: “a household was made or broken by the skill and thrift of its wom-
enfolk in managing household stocks” (p. 57). She argues that a woman’s personal status
depends on her reputation as a skilled housewife, which requires prioritizing “family good”
(p. 68) over spending resources on herself. An example of the expectation for women to
prioritize others over herself is that women, and especially the cook, will often eat last, after
the men and children.
Animal husbandry is one of the few types of labor that can generate marketable products
that is permissible for women within rural north Indian patriarchal norms. This type of work
is acceptable because it would not require interaction with males outside of the household
or the village. Households that own cows or buffaloes need to feed them, milk them, collect
their dung, make dung cakes, and make milk products. Although the division of animal
husbandry responsibilities among women and men depends on household economic status
and the status and seclusion practices of the women in the household, women’s workload is
substantially heavier in households that own cows and buffaloes compared to those that do
not (Jeffery, Jeffery and Lyon, 1989).
Some rural woman do participate in wage labor outside of the home. These are generally
women from poor households that require additional earnings for survival. A woman who
works outside of the home cannot be as closely monitored as a woman who does not, but
she is still likely to veil in the presence of an elder male from the village. Nevertheless,
Mandelbaum (1988) argues that women who receive wages for their own work are likely to
have more personal independence than do women without such income. Whether or not this
is true, a woman who works outside of the home cannot remain in seclusion, and therefore
certain gender practices like staying within the home would not be expected of her.
Despite rural Indian women having very heavy work burdens, they receive very little
credit from men. Jeffery, Jeffery and Lyon (1989) explain the widely perceived notion among
rural north Indian men that women do no work. They document numerous conversations in
which men express their belief that women spend much of their time relaxing, do nothing
economically important, and simply consume household resources. There is, therefore, little
value placed on women’s labor, despite its importance to a household’s prosperity.
The context that we have outlined here is important background for the novel arguments
that we will make in Section 5. Young women have very low status in rural north Indian
households. They are expected to practice purdah and participate in economic activities that
allow them to maintain seclusion as much as possible. As we will argue in later sections of this
paper, these beliefs encourage women to preserve gas, promote women’s work that facilitates
the use of solid fuels, and hinder communication between the cook and the decision-maker
regarding LPG refills.
9
3 Data and methods
The main analyses in this paper draw on original qualitative and quantitative interviews
conducted by a team of researchers that included the authors. Both surveys collected data
in the rural parts of four north Indian states: Bihar, Madhya Pradesh, Rajasthan, and
Uttar Pradesh. The quantitative survey visited households in 2018, and the qualitative
survey visited households in 2020. Importantly, these surveys were carried out after the
Government of India introduced its program to subsidize the setup costs of LPG for rural
households. Ethical approval for both the quantitative and qualitative studies was obtained
from the Institutional Review Board of the authors’ institution. Additional analyses draw
on nationally-representative survey data.
3.1 Quantitative data: Survey of Rural Sanitation and Fuel Use
The main quantitative data source used in this paper is the 2018 Survey of Rural Sanitation
and Fuel Use (RSFU), which is the second round of a panel survey that originally visited
households in rural north India in 2014. Table 2 describes the sampling of households and
villages for the 2018 survey. The survey visited 11 districts in total, two in Rajasthan, and
three in each of Bihar, Madhya Pradesh, and Uttar Pradesh. Within these districts, vil-
lages were randomly selected from the villages visited in the Government of India’s District
Level Household and Facility Survey 2 using probability proportionate to population size
sampling. The survey team selected households within villages using an in-field randomiza-
tion technique used in other large sample surveys in rural India (Banerji, Bhattacharjea and
Wadhwa, 2013).3 The 127 villages visited in 2018 were a random sample of villages from
the first round of the panel. The survey team attempted to revisit all of the original survey
households in these villages, and was successful in interviewing 88% of them. The 2018
survey also contained a refresher sample, which represented 22% of the total 2018 sample of
households.4 In total, the 2018 survey collected data from 1,550 households. The analyses
presented in this paper use the 2018 survey because it was carried out after Ujjwala, and
because it contains a detailed module on fuel use which can be used to estimate LPG use
along a spectrum of fuel mixing. Questionnaires and data for the survey can be accessed on
https://riceinstitute.org/data/2014-and-2018-rural-sanitation-surveys/.
Measuring fuel use. An important feature of our data is that it differentiates LPG
ownership from use. We use two different measures of fuel use from the RSFU. The first and
main measure is the number of LPG cylinders a household uses per month per person. We
calculate this measure based on the answer to the question:
About how much time does one cylinder last in your house? How many days or
10
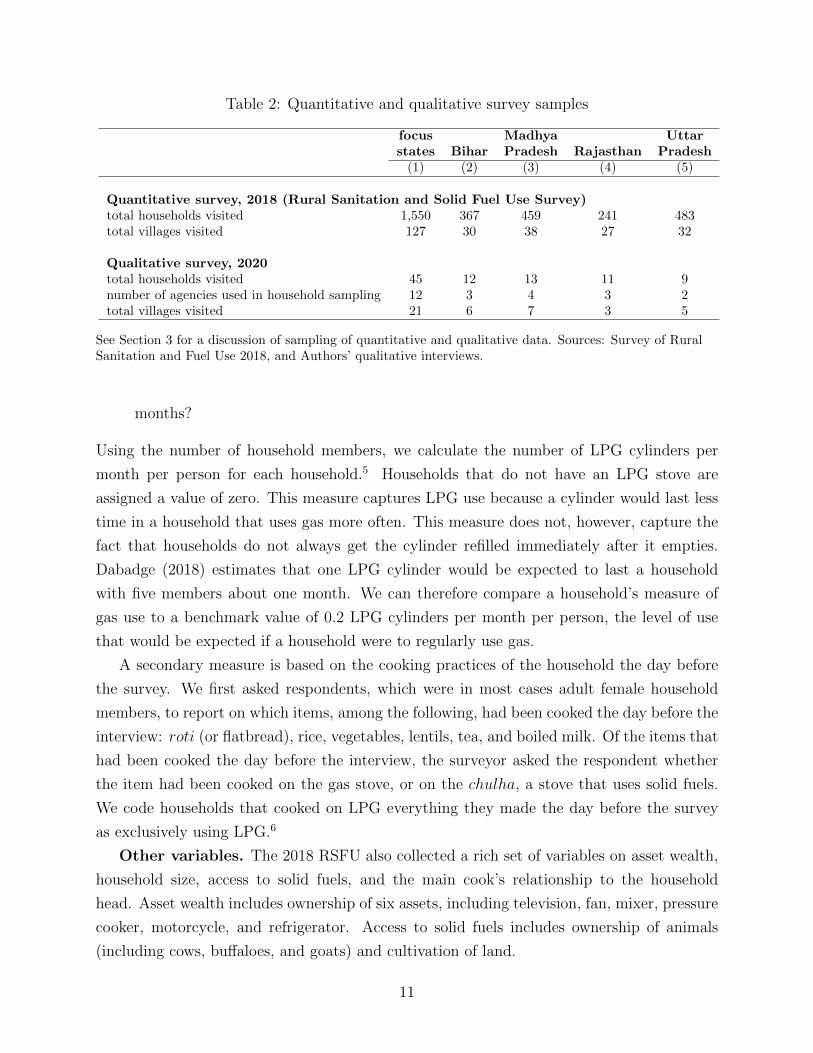
Table 2: Quantitative and qualitative survey samples
focus Madhya Uttarstates Bihar Pradesh Rajasthan Pradesh
(1) (2) (3) (4) (5)
Quantitative survey, 2018 (Rural Sanitation and Solid Fuel Use Survey)total households visited 1,550 367 459 241 483total villages visited 127 30 38 27 32
Qualitative survey, 2020total households visited 45 12 13 11 9number of agencies used in household sampling 12 3 4 3 2total villages visited 21 6 7 3 5
See Section 3 for a discussion of sampling of quantitative and qualitative data. Sources: Survey of RuralSanitation and Fuel Use 2018, and Authors’ qualitative interviews.
months?
Using the number of household members, we calculate the number of LPG cylinders per
month per person for each household.5 Households that do not have an LPG stove are
assigned a value of zero. This measure captures LPG use because a cylinder would last less
time in a household that uses gas more often. This measure does not, however, capture the
fact that households do not always get the cylinder refilled immediately after it empties.
Dabadge (2018) estimates that one LPG cylinder would be expected to last a household
with five members about one month. We can therefore compare a household’s measure of
gas use to a benchmark value of 0.2 LPG cylinders per month per person, the level of use
that would be expected if a household were to regularly use gas.
A secondary measure is based on the cooking practices of the household the day before
the survey. We first asked respondents, which were in most cases adult female household
members, to report on which items, among the following, had been cooked the day before the
interview: roti (or flatbread), rice, vegetables, lentils, tea, and boiled milk. Of the items that
had been cooked the day before the interview, the surveyor asked the respondent whether
the item had been cooked on the gas stove, or on the chulha, a stove that uses solid fuels.
We code households that cooked on LPG everything they made the day before the survey
as exclusively using LPG.6
Other variables. The 2018 RSFU also collected a rich set of variables on asset wealth,
household size, access to solid fuels, and the main cook’s relationship to the household
head. Asset wealth includes ownership of six assets, including television, fan, mixer, pressure
cooker, motorcycle, and refrigerator. Access to solid fuels includes ownership of animals
(including cows, buffaloes, and goats) and cultivation of land.
11
3.2 Qualitative data
Two of the authors carried out qualitative work in the same region visited by the quantitative
survey. Our objectives were to 1) provide context for LPG use in rural north India, 2)
study intra-household decision making regarding gas refills and cooking fuel use, and 3)
investigate links between households and the gas distribution supply chain. Table 2 presents
summary statistics on the number of households interviewed in each state. The qualitative
data consists of 45 semi-structured interviews with households who recently refilled an LPG
cylinder and 13 semi-structured interviews with gas distributors. We also accompanied three
drivers of gas delivery vehicles on their daily rounds to deliver cylinders to customers.
Sampling for qualitative field work. We revisited one RSFU district in each of
the four states. We purposively selected these districts in order to maximize variation in
LPG use and indicators of women’s status from the National Family Health Survey 2015-
2016, and to ensure that each of the four states was represented. Within each district, we
purposively selected at least six gas distributors to ensure that the three main gas companies
(Bharat Gas, Hindustan Petroleum, and Indane) were equally represented and to maximize
geographic coverage of the district. We then split these six distributors into two groups,
stratifying by gas company. We conducted semi-structured interviews with one group of
distributors, and from the other group of distributors, we requested a list of households who
recently refilled an LPG cylinder.
About half of the households we spoke to were sampled from the lists we acquired from
distributors, and half were LPG-owning households living in the same villages, that were
randomly selected using an in-field randomization procedure. Similarly, about half of the
interviews were conducted with households that reported mainly using solid fuels, and half
were with households reporting that they mainly used gas.7 For the in-field randomiza-
tion procedure, we began by walking around the village and creating a map that divided the
village into different sections. Some of these sections were already visited to interview house-
holds from the agency list. We did not revisit these sections when interviewing randomly
selected households. Among the remaining sections, we randomly selected a new section
to visit. In the approximate center of each section, we spun a spinner which indicated the
direction we would proceed. We then randomly drew a number between one and ten which
indicated how many households to pass before stopping at a household and requesting an
interview. After completing an interview in the section, we randomly selected another sec-
tion which had not yet been visited to conduct another interview. If no one was home in
the selected household, if household members refused to participate, if the household did
not own gas, or if we had already interviewed enough households of that household’s type
(mainly uses gas versus mainly uses solid fuels), we knocked on each door to the selected
12
household’s right until we found an appropriate household to interview.
Interviews. Within households, we interviewed the household members that did most
of the cooking. Other household members were often present during the interview, and their
opinions were also sought. The semi-structured interview guide asked questions relating to
the household’s last LPG refill, daily cooking fuel use decisions, and opinions of different
household members regarding gas and solid fuels. This guide was developed based on an
initial analysis of the quantitative data, which highlighted areas we sought to explore further
in qualitative interviews. We asked mainly open-ended questions and encouraged respon-
dents to give in-depth responses. We also asked quantitative-style questions that helped
us understand household structure and socioeconomic status. In order to facilitate analysis
afterwards, we recorded interviews with the respondents’ permission. 44 out of 45 interviews
were recorded. For the one respondent that declined to have the interview recorded, we took
more detailed written notes. We piloted the guide extensively in a non-sample district of
Bihar.
Other household members apart from the main respondent participated in 38 of 45 sur-
veys. Our observations from interviews where other household members participated often
allowed us to observe household dynamics, women’s agency, and interactions among different
household members. We were also able to observe disagreements within household members.
In the field, our identity was that of students and researchers who were trying to understand
village life in general and fuel use in particular. We were seen as outsiders who live in urban
areas and lack exposure to village life. Respondents assumed that we did not know how to
cook on a chulha. Even though our exposure to rural north Indian villages was greater than
what our respondents assumed, we did not correct the impression that they had of us. This
often meant that people took keen interest in explaining many routine aspects of fuel use
to us. We conducted interviews until we had achieved saturation in terms of meanings and
theoretical insights (Hennink, Kaiser and Marconi, 2017), when we were not learning new
themes from additional interviews.
Measuring fuel use. To measure LPG use, we asked households to show us the LPG
booklet given to them by the gas distributor. Whenever a household gets a refill, the dis-
tributor or delivery person (man) writes the date in the household’s booklet. Whenever
possible, we wrote down the past two refills from this booklet. Sometimes, households did
not have their booklet, did not know where it was, or did not want to show it to us. In those
cases, we calculated the length of time between refills based on the respondent’s account
of the past two refills. When households did not remember the approximate dates of the
past two refills, we estimated the length of time between refills based on the household’s
response to the question: “How often do you refill the cylinder?” These questions aided us
13
in constructing the number of LPG cylinders per month per person for each household. The
difference between this measure of use and the measure of use from the quantitative data is
that this measure of use includes the amount of time it takes for a household to use up a
cylinder, and also the time it takes to get it refilled after it becomes empty. This measure is
therefore likely to be more accurate than the measure from the quantitative data.
Summary statistics. Summary statistics for households in the quantitative and quali-
tative data are shown in Table 3. 72% of households in the quantitative sample had an LPG
stove, and all households (by construction) had an LPG stove in the qualitative sample. In
both samples, gas use is remarkably low. A household of five members that regularly uses
gas is expected to use one LPG cylinder per month, and therefore, 0.2 cylinders per month
per person (Dabadge, 2018). The statistics in this table show that average gas use in these
samples is about half of what it would be expected to be with regular use. Despite all of
the households in the qualitative sample owning an LPG stove, gas use in the qualitative
sample is actually slightly lower than in the quantitative sample. This may be because the
measure of use in the qualitative data accounts for the time it takes to use up the gas in a
cylinder and the time it takes to get an empty cylinder refilled. The measure of use from
the quantitative data, however, only accounts for the former. Because half of the households
in the qualitative data were sampled from agency lists of households who had recently re-
filled a cylinder, and LPG use is correlated with economic status, the qualitative sample is
wealthier on average than the quantitative sample. The table also shows summary statistics
for how the cook is related to the household head, which is an indicator of the cook’s status,
variables indicative of access to solid fuels, household size, and social group. The samples
are relatively similar on these characteristics.
3.3 Other data sources
For various supporting analyses, we draw on three publicly available nationally-representative
datasets. These include India’s 2011 Census, the National Family Health Survey 2015-16
(NFHS), and the National Sample Survey (NSS) 2018 (76th round). All three data sources
included a question on the main cooking fuel used by the household. The 2011 Census was
conducted before the implementation of the Ujjwala program. The NFHS, a cross-sectional
survey which visited approximately 600,000 households, was in the field when the Ujjwala
program was initiated in May 2016. However, most of the data collection had already
taken place prior to the start of Ujjwala. The NFHS also implemented detailed questions
on women’s status and household assets, which we use here. Finally, the NSS was fielded
between July and December 2018, more than two years after Ujjwala was initiated.
14
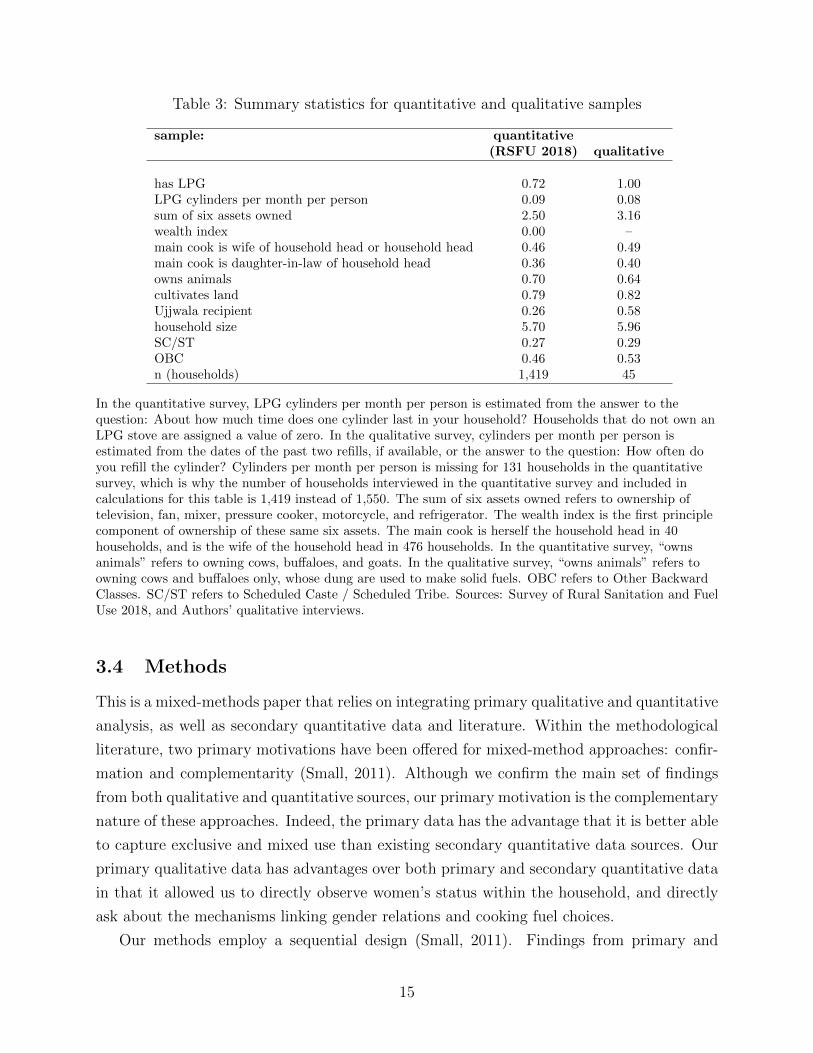
Table 3: Summary statistics for quantitative and qualitative samples
sample: quantitative(RSFU 2018) qualitative
has LPG 0.72 1.00LPG cylinders per month per person 0.09 0.08sum of six assets owned 2.50 3.16wealth index 0.00 –main cook is wife of household head or household head 0.46 0.49main cook is daughter-in-law of household head 0.36 0.40owns animals 0.70 0.64cultivates land 0.79 0.82Ujjwala recipient 0.26 0.58household size 5.70 5.96SC/ST 0.27 0.29OBC 0.46 0.53n (households) 1,419 45
In the quantitative survey, LPG cylinders per month per person is estimated from the answer to thequestion: About how much time does one cylinder last in your household? Households that do not own anLPG stove are assigned a value of zero. In the qualitative survey, cylinders per month per person isestimated from the dates of the past two refills, if available, or the answer to the question: How often doyou refill the cylinder? Cylinders per month per person is missing for 131 households in the quantitativesurvey, which is why the number of households interviewed in the quantitative survey and included incalculations for this table is 1,419 instead of 1,550. The sum of six assets owned refers to ownership oftelevision, fan, mixer, pressure cooker, motorcycle, and refrigerator. The wealth index is the first principlecomponent of ownership of these same six assets. The main cook is herself the household head in 40households, and is the wife of the household head in 476 households. In the quantitative survey, “ownsanimals” refers to owning cows, buffaloes, and goats. In the qualitative survey, “owns animals” refers toowning cows and buffaloes only, whose dung are used to make solid fuels. OBC refers to Other BackwardClasses. SC/ST refers to Scheduled Caste / Scheduled Tribe. Sources: Survey of Rural Sanitation and FuelUse 2018, and Authors’ qualitative interviews.
3.4 Methods
This is a mixed-methods paper that relies on integrating primary qualitative and quantitative
analysis, as well as secondary quantitative data and literature. Within the methodological
literature, two primary motivations have been offered for mixed-method approaches: confir-
mation and complementarity (Small, 2011). Although we confirm the main set of findings
from both qualitative and quantitative sources, our primary motivation is the complementary
nature of these approaches. Indeed, the primary data has the advantage that it is better able
to capture exclusive and mixed use than existing secondary quantitative data sources. Our
primary qualitative data has advantages over both primary and secondary quantitative data
in that it allowed us to directly observe women’s status within the household, and directly
ask about the mechanisms linking gender relations and cooking fuel choices.
Our methods employ a sequential design (Small, 2011). Findings from primary and
15
secondary quantitative surveys linking measures of women’s status and cooking fuel use
informed a further line of questioning regarding household gender roles in the context of
cooking and LPG refills that we investigated further in the qualitative interviews. There is a
time lag between the primary quantitative and qualitative surveys. The Ujjwala program was
ongoing when the quantitative survey was conducted. However, the program had concluded
just prior to the beginning of qualitative data collection. We do not expect that this time
lag complicates the interpretation of our findings. The Ujjwala program was already very
active prior to the quantitative survey. That we observe households after the completion of
the program may even allow us to more comprehensively examine patterns of cooking fuel
use after government intervention.
Quantitative data analysis. The bulk of the quantitative analyses presented in this
paper are based on the RSFU. These analyses use sample weights constructed based on the
2011 Census of India. Households in the sample are re-weighted based on household size,
to be representative of the rural population of households in these four states. Using the
RSFU, we examine LPG ownership and use, the extent to which wealthier households are
more likely to use LPG, the extent to which access to solid fuels influences LPG use, and the
extent to which a cook’s status within the household influences LPG use. We use descriptive
statistics and linear regressions. We cluster our standard errors at the level of the primary
sampling unit (village).
Analysis of qualitative data. After each day of interviewing during the qualitative
work, authors met to discuss the day’s interviews. We tried to reach consensus about how
much a household used gas for cooking and why. We also wrote detailed observations on how
the respondent interacted with us, and with others in her family. Based on the recording and
notes taken on the discussion guides, one of the authors completed a detailed summary for
each interview. These were then read and reviewed by the other authors, and in many cases,
the authors also listened to each other’s recorded interviews. Meeting about, writing, and
reviewing summaries from early interviews allowed us to identify themes, develop hypotheses,
and test those hypotheses in future interviews. Following an iterative process, we changed
the interview guide in small ways over time to accommodate new questions and ideas. We
also kept tabulations related to the themes that arose during the interviews. For example,
some of the tabulations related to primary reasons for using gas, decision-makers for the last
LPG refill, the intra-household status of the main cook, who makes and collects solid fuels,
and whether anyone in the household objected to using gas or getting a refill.
To code information from the interview recordings and our interview notes, we created
a thematic note-taking guide. For each interview, we organized our notes and observations
from the interview recording and summary based on themes. This thematic guide allowed
16
us to observe the themes that were present in multiple interviews. We also recorded any
exact quotes from our interviews in this thematic guide. For the analysis, the authors
went through the recordings, summaries, and thematic guide multiple times. In developing
theoretical insights, we looked for contradictory and conflicting evidence, and analyzed how
it modified our theoretical insights. This helped us make sense of the fuel use we did observe.
4 Continued use of solid fuels among LPG owners in
rural north India
In this section, we present patterns of LPG ownership and use among households in our
qualitative and quantitative samples. The statistics that we present here make clear that
solid fuel use was common after Ujjwala, access to an LPG stove was often not a barrier to
LPG use, and rich and poor households alike continued to use solid fuels. This evidence sup-
ports explanations of cooking fuel patterns that rely on non-economic factors, and provides
summary statistics from our original quantitative data that serve as an important starting
point for understanding the main findings presented in the next section.
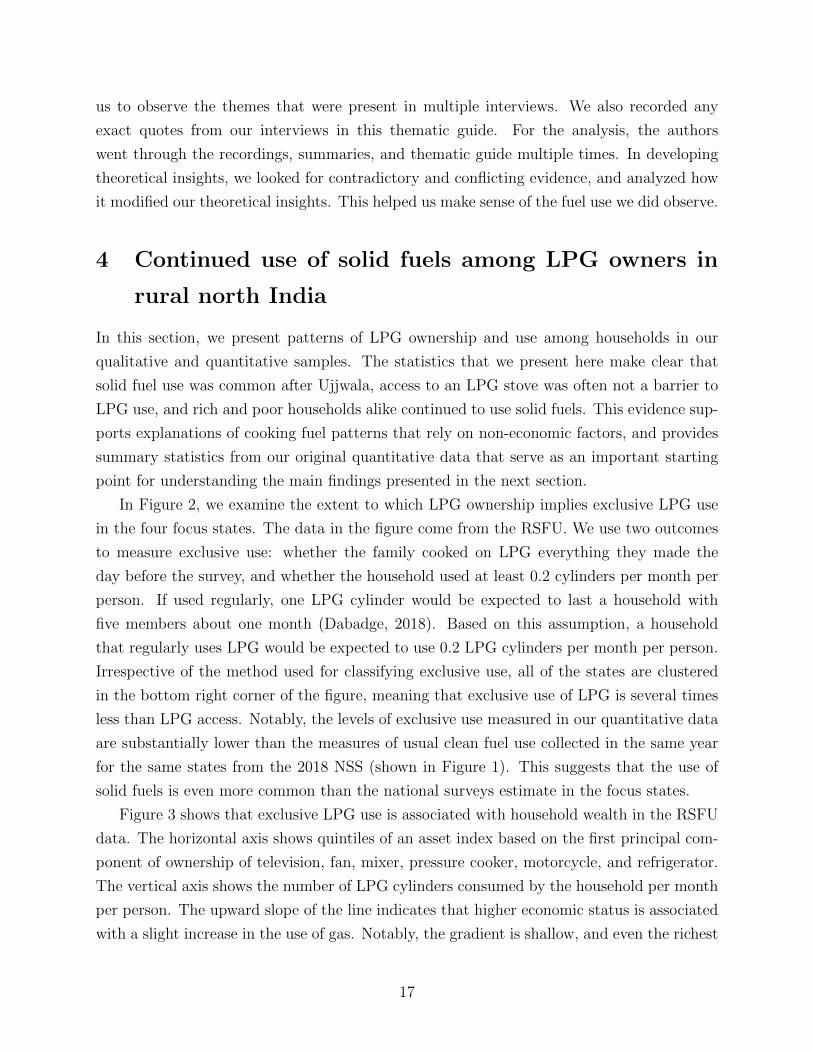
In Figure 2, we examine the extent to which LPG ownership implies exclusive LPG use
in the four focus states. The data in the figure come from the RSFU. We use two outcomes
to measure exclusive use: whether the family cooked on LPG everything they made the
day before the survey, and whether the household used at least 0.2 cylinders per month per
person. If used regularly, one LPG cylinder would be expected to last a household with
five members about one month (Dabadge, 2018). Based on this assumption, a household
that regularly uses LPG would be expected to use 0.2 LPG cylinders per month per person.
Irrespective of the method used for classifying exclusive use, all of the states are clustered
in the bottom right corner of the figure, meaning that exclusive use of LPG is several times
less than LPG access. Notably, the levels of exclusive use measured in our quantitative data
are substantially lower than the measures of usual clean fuel use collected in the same year
for the same states from the 2018 NSS (shown in Figure 1). This suggests that the use of
solid fuels is even more common than the national surveys estimate in the focus states.
Figure 3 shows that exclusive LPG use is associated with household wealth in the RSFU
data. The horizontal axis shows quintiles of an asset index based on the first principal com-
ponent of ownership of television, fan, mixer, pressure cooker, motorcycle, and refrigerator.
The vertical axis shows the number of LPG cylinders consumed by the household per month
per person. The upward slope of the line indicates that higher economic status is associated
with a slight increase in the use of gas. Notably, the gradient is shallow, and even the richest
17
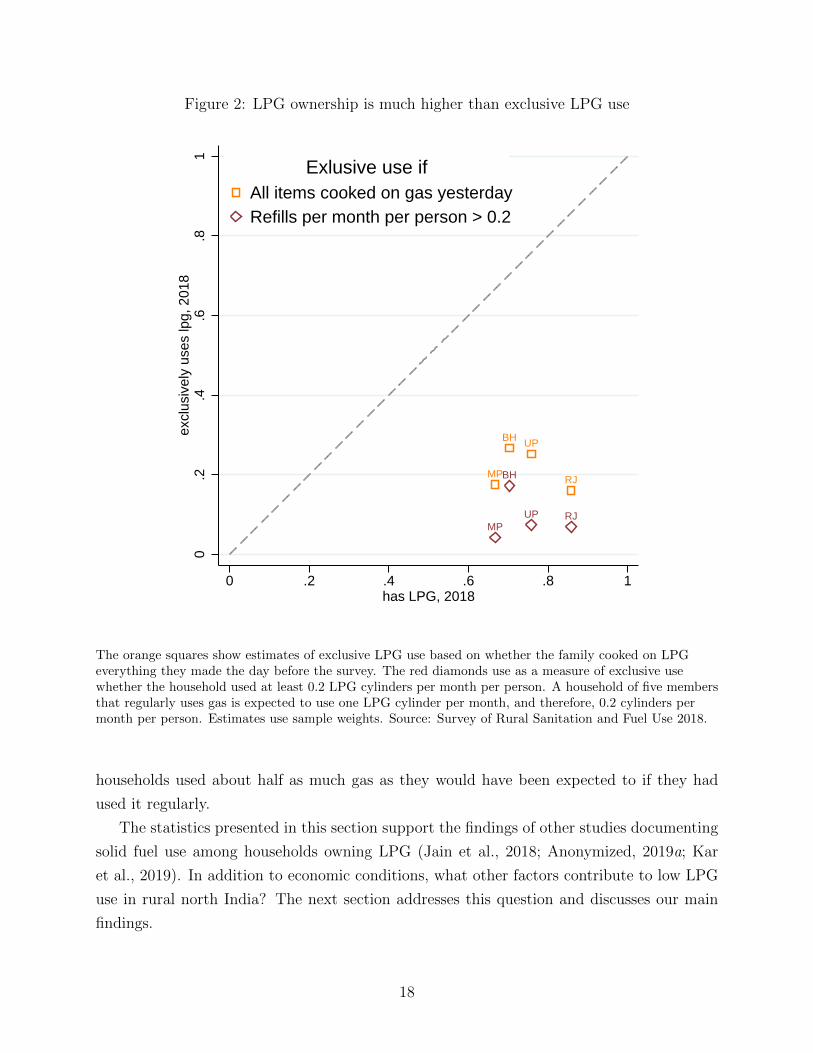
Figure 2: LPG ownership is much higher than exclusive LPG use
BH UP
MP RJBH
UPMP
RJ
0.2
.4.6
.81
excl
usiv
ely
uses
lpg,
201
8
0 .2 .4 .6 .8 1has LPG, 2018
All items cooked on gas yesterdayRefills per month per person > 0.2
Exlusive use if
The orange squares show estimates of exclusive LPG use based on whether the family cooked on LPGeverything they made the day before the survey. The red diamonds use as a measure of exclusive usewhether the household used at least 0.2 LPG cylinders per month per person. A household of five membersthat regularly uses gas is expected to use one LPG cylinder per month, and therefore, 0.2 cylinders permonth per person. Estimates use sample weights. Source: Survey of Rural Sanitation and Fuel Use 2018.
households used about half as much gas as they would have been expected to if they had
used it regularly.
The statistics presented in this section support the findings of other studies documenting
solid fuel use among households owning LPG (Jain et al., 2018; Anonymized, 2019a; Kar
et al., 2019). In addition to economic conditions, what other factors contribute to low LPG
use in rural north India? The next section addresses this question and discusses our main
findings.
18
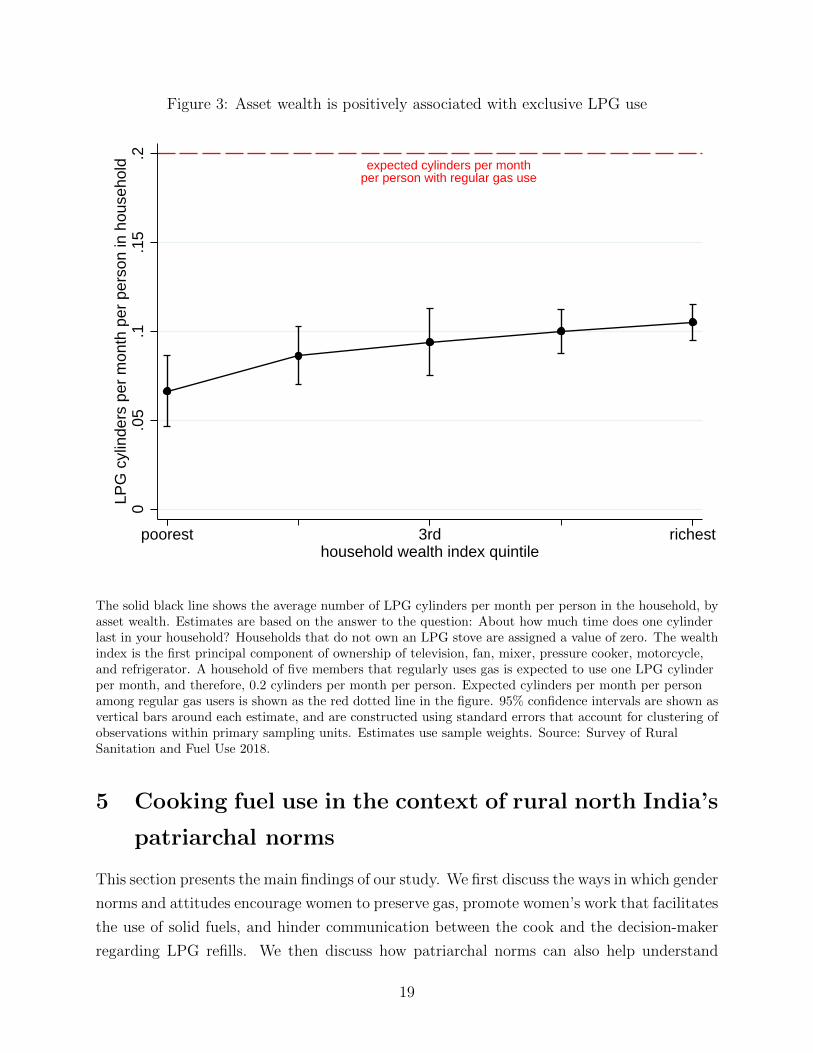
Figure 3: Asset wealth is positively associated with exclusive LPG use
expected cylinders per monthper person with regular gas use
0.0
5.1
.15
.2LP
G c
ylin
ders
per
mon
th p
er p
erso
n in
hou
seho
ld
poorest 3rd richesthousehold wealth index quintile
The solid black line shows the average number of LPG cylinders per month per person in the household, byasset wealth. Estimates are based on the answer to the question: About how much time does one cylinderlast in your household? Households that do not own an LPG stove are assigned a value of zero. The wealthindex is the first principal component of ownership of television, fan, mixer, pressure cooker, motorcycle,and refrigerator. A household of five members that regularly uses gas is expected to use one LPG cylinderper month, and therefore, 0.2 cylinders per month per person. Expected cylinders per month per personamong regular gas users is shown as the red dotted line in the figure. 95% confidence intervals are shown asvertical bars around each estimate, and are constructed using standard errors that account for clustering ofobservations within primary sampling units. Estimates use sample weights. Source: Survey of RuralSanitation and Fuel Use 2018.
5 Cooking fuel use in the context of rural north India’s
patriarchal norms
This section presents the main findings of our study. We first discuss the ways in which gender
norms and attitudes encourage women to preserve gas, promote women’s work that facilitates
the use of solid fuels, and hinder communication between the cook and the decision-maker
regarding LPG refills. We then discuss how patriarchal norms can also help understand
19
the LPG use that exists. When rural north Indian households use gas, it is frequently to
facilitate the adherence to norms of seclusion that prevent women from leaving the home to
collect solid fuels.
5.1 Understanding the persistence of solid fuels
A skillful housewife preserves resources. Palriwala (1993) explains that a skillful house-
wife should preserve household resources and prioritize the good of the family over her own
well-being. In coherence with this expectation, many of our respondents in the qualita-
tive survey expressed the desire to preserve gas so that the household would not have to
spend money to refill the cylinder often. This is despite the fact that 81% of women in the
quantitative survey said that it is easier to cook on gas compared to the chulha.
The trade-off between what is easier for the cook and what is better for the household
was discussed by several members of a Rajasthani joint family in which the two daughters-
in-law of the household head preferred to cook on gas. The family lived in a multi-room
brick house and was relatively well off. The household had two gas connections, one that
it had bought on its own and one that it had gotten through Ujjwala, yet more than three
months had elapsed between the past two cylinder refills. The younger son of the household
head explained why using solid fuels was difficult:
For the chulha, you have to bring wood, and in the morning the wood does not
catch fire quickly. On that [the gas stove] you just have to turn on the regulator
switch and it catches fire. You have to put wood in the chulha and that’s why
it’s troublesome.
The man’s mother interjected here and said, “The chulha causes a lot of problems for young
women.” Nevertheless, as the most senior woman in the household, responsible for delegating
household tasks to her daughters-in-law and controlling the household stocks, she wanted
her daughters-in-law to cook on chulha to save money. She said:
If you use less of it [gas] then it will last longer. If it’s used up quickly then where
will the money come from? Brother, that’s why. If you use it less then you spend
less money.
Many of our respondents, both rich and poor, echoed this sentiment. Spending money
to refill the cylinder was not seen as a priority. Even when women expressed a preference
to use gas more often, they frequently cited expenses related to educating their children,
medicines, and replenishing household food stocks, as taking precedent over refilling the
cylinder. Refilling the cylinder was in most cases not a decision that the cook could take
20
herself; most respondents told us that it was the household head’s decision. Regardless,
women’s stated prioritization of expenses which benefited other household members is in
accordance with Palriwala (1993)’s description of a skillful wife’s duty.
Gas use and women’s “laziness”. In the context of trade-offs between preferences
of the cook versus the well-being of the household as a whole, and general attitudes to-
wards women’s work as described by Jeffery, Jeffery and Lyon (1989), women who are seen
as cooking on gas without good reason are considered lazy. Several men working in a gas
distribution office in Rajasthan explained: “Women are lazy to go get wood, that’s why
they use gas...Older people fight for getting roti made on the chulha. There is a differ-
ence of opinion.” These young men implied that using gas challenged traditional domestic
hierarchies. Considering a daughter-in-law’s status in rural north India, and the behavior
that Mandelbaum (1988) and Jeffery, Jeffery and Lyon (1989) describe would be expected
of her, disobeying one’s elders in this way would be inappropriate and would be deserving
of punishment.
A woman in Madhya Pradesh who lived with her four daughters, used similar language.
Her husband had migrated to a large city five hours away for work, leaving our respondent
and her daughters in the village. Because her husband was away from home so often, and
because she did not live in a joint household with her parents-in-law, our respondent had
substantial decision-making authority within the household. She told us:
We feel lazy. It is a big headache to light the chulha. That’s why we don’t cook
on the chulha. We cook on gas. Now it’s habit [to cook on gas]. If we’re in a
bind [if we’ve run out of gas], then we have to cook on chulha. Ladies these days
have become lazy.
She and her daughters laughed. Based on the past two refills, and the number of regular
members of her household, her use of gas was about half of what would have been expected of
a family that regularly used gas. Even though she had likely used the word “lazy” ironically,
her framing of cooking fuel decisions in those terms suggests that the spectrum on which rural
north Indians evaluate the work of cooking is one of diligence versus laziness.8 Nevertheless,
the association of laziness with using gas coheres with Jeffery, Jeffery and Lyon (1989)’s
description of how women’s work is undervalued and belittled.
Gender, agricultural work, and using the chulha. In rural north India, households
often use dung cakes, wood, and agricultural residue as solid fuels for cooking. Therefore, an-
imal husbandry and farming facilitate the continued use of the chulha because they produce
waste that can be used as solid fuels. In Figure 4, we present evidence from the quantitative
data in support of this argument. The figure shows coefficients from a regression of gas use
21

(measured as cylinders per month per person) on having animals, shown on the left side
of the figure, and on cultivating land, on the right side.9 These regressions also control for
asset wealth.10 The coefficients therefore represent the marginal effect of owning at least one
animal, or of cultivating land, on LPG use, holding wealth constant. The fact that both co-
efficients are negative and statistically different from zero signify that households practicing
animal husbandry and farming were less likely to use gas.
Figure 4: Access to solid fuels is negatively associated with LPG use
-.05
-.04
-.03
-.02
-.01
0
LPG
cyl
inde
rs p
er m
onth
per
per
son
in h
ouse
hold
rela
tive
to n
o re
sour
ce, c
ontr
ollin
g fo
r as
set o
wne
rshi
p
no animals at least one animal does not cultivate land cultivates land
95% C.I.s calculated using standard errors clustered by village
coefficients
The figure shows coefficients from two separate regressions of the number of LPG cylinders per month perperson in the household, on having animals, shown on the left hand side, and on cultivating land, shown onthe right hand side. The regressions also control for asset wealth using an asset index, constructed usingthe first principal component of ownership of television, fan, mixer, pressure cooker, motorcycle, andrefrigerator. Not having the resource is the omitted category in both regressions. Estimates of LPG use arebased on the answer to the question: About how much time does one cylinder last in your household?Households that do not own an LPG stove are assigned a value of zero. Estimates use sample weights. 95percent confidence intervals use errors clustered by village. Source: Survey of Rural Sanitation and FuelUse 2018.
On average, households that own animals and cultivate land are richer than households
22
who do not. That these households are less likely to use LPG despite being richer suggests
that gender is an important part of this story. Animal husbandry is one of the only kinds
of economic activities in which women may acceptably engage. This contributes to the use
of the chulha in two ways. First, it prevents women from becoming involved in other types
of work that may be more profitable, and may increase the opportunity cost of their time.
Second, animal husbandry itself generates solid fuels that can be used in the chulha. In our
qualitative sample, only six of 45 cooks did other types of work for pay, a low proportion
that illustrates the rejection of wage work in this context.11 On average, compared to the
sample as a whole, the women that engaged in wage labor were more likely to be from
poorer households that did not practice agriculture, and they were also slightly more likely
to use gas.12 Compared to north India, patriarchal norms are less stringent in other parts of
rural India, as demonstrated in Table 1. Consistent with the explanation that rigid gender
attitudes promote animal husbandry and encourage the use of solid fuels, compared to rural
north India, a much smaller fraction of households in other parts of rural India own cows
and buffaloes, a larger fraction participate in wage labor, and a larger fraction use gas.13
These facts do not, of course, provide causal evidence, but they are consistent with the idea
that the more patriarchal norms in north India, compared to the rest of India, encourage
agricultural work and the use of solid fuels for cooking.
Much of the work related to preparing solid fuels also falls on women. It is almost
exclusively women who make dung cakes, and both men and women cut and collect wood
(Sharma, 2018; Anonymized, 2019a). In our qualitative work, we found the involvement
of men in the work of cutting and collecting wood to be related to norms of modesty and
seclusion for women. Cutting and collecting wood requires leaving the home, which would not
be permitted of women who observe seclusion. In practice, the women who did participate in
cutting and collecting wood were older, and by virtue of age and seniority in the household,
did not face the same expectations of modesty and seclusion as younger women.
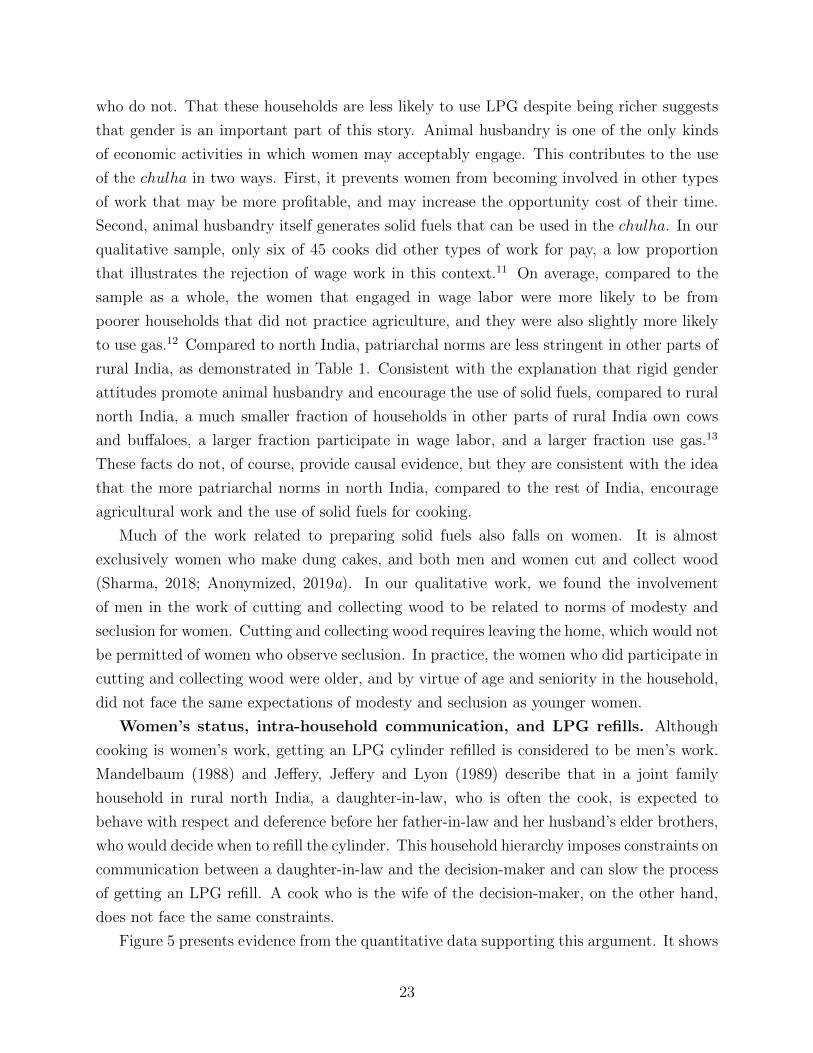
Women’s status, intra-household communication, and LPG refills. Although
cooking is women’s work, getting an LPG cylinder refilled is considered to be men’s work.
Mandelbaum (1988) and Jeffery, Jeffery and Lyon (1989) describe that in a joint family
household in rural north India, a daughter-in-law, who is often the cook, is expected to
behave with respect and deference before her father-in-law and her husband’s elder brothers,
who would decide when to refill the cylinder. This household hierarchy imposes constraints on
communication between a daughter-in-law and the decision-maker and can slow the process
of getting an LPG refill. A cook who is the wife of the decision-maker, on the other hand,
does not face the same constraints.
Figure 5 presents evidence from the quantitative data supporting this argument. It shows
23
Figure 5: The main cook’s intra-household rank is associated with LPG use
-.04
-.02
0.0
2.0
4
LPG
cyl
inde
rs p
er m
onth
per
per
son
in h
ouse
hold
rela
tive
to o
ther
mem
ber,
con
trol
ling
for
asse
t ow
ners
hip
daughter-in-lawof household head
other member wife of household heador household head
95% C.I.s calculated using standard errors clustered by village
coefficients
The figure shows coefficients from a single regression of the number of LPG cylinders per month per personin the household, on the main cook’s relationship to the household head, which is indicative of status withinthe household. The regression also controls for asset wealth using an asset index, constructed using the firstprincipal component of ownership of television, fan, mixer, pressure cooker, motorcycle, and refrigerator.Estimates of LPG use are based on the answer to the question: About how much time does one cylinderlast in your household? Households that do not own an LPG stove are assigned a value of zero. Theestimate on the left represents households in which the main cook is the household head’s daughter-in-law,a position with low status. The estimate on the right represents households in which the main cook isherself the household head (n=40) or the wife of the household head (n=476) and thus has higher status.The estimate in the middle, which is the omitted category in the regression, represents households in whichthe main cook is some other household member. Estimates use sample weights. 95 percent confidenceintervals use errors clustered by village. Source: Survey of Rural Sanitation and Fuel Use.
coefficients from a single regression of gas use (the number of LPG cylinders per month per
person) on the main cook’s relationship to the household head. The estimate on the left
represents households in which the main cook was the household head’s daughter-in-law,
a position of lower status. The estimate on the right represents households in which the
main cook was the wife of the household head or was the household head, positions of
24
relatively higher status. The estimate in the middle, which is also the omitted category in
the regression, represents households in which the main cook had some other relationship to
the household head, for example daughter or mother of the household head. This regression
also controls for asset wealth.14 The coefficients therefore represent the marginal effect of the
cook’s relationship to the household head on LPG use, relative to the omitted relationship
category, holding wealth constant. The results show that households in which the main cook
was the daughter-in-law used statistically significantly less gas compared to cooks who were
related to the household head in other ways, and households in which the main cook was
the wife of the household head, or the household head, used statistically significantly more
gas. Although this figure shows that higher status women used comparatively more gas, it is
important to remember that even in these households, levels of gas use were still much lower,
on average, than what would have been expected if gas were used all the time. Nevertheless,
the presence of a gradient based on the intra-household status of the cook supports the role
of women’s status in cooking fuel practices.
In our qualitative interviews, we asked respondents to describe the last time they refilled
the cylinder. We found that low intra-household status often prevented cooks from commu-
nicating the need for an LPG refill. We spoke to the wife of the second son in a joint family
household with three sons in Bihar. She was the youngest daughter-in-law (the youngest son
was still unmarried), and was the main cook. The last time the gas cylinder became empty,
she had to wait over a month before her in-laws decided to get it refilled. Our respondent
told us, “I want [the cylinder] to be refilled quickly, but the guardian [father-in-law], if he
has money then he will refill it.” We asked her if she had told her father-in-law that she
would like for it to be refilled quickly, and she responded, “I did not tell him to refill the
cylinder quickly. I want it to be refilled quickly, that will be good. I did not tell him to
refill it quickly.” It would have been considered inappropriate for our respondent to try to
advocate for a more rapid refill to her father-in-law.
We heard a similar story from the joint household in Rajasthan mentioned earlier. The
two daughters-in-law also had to wait one month for the cylinder to be refilled. They were
having difficulty lighting the chulha in the morning because it was winter and the wood was
wet from the fog and cold. Even though their father-in-law was the one who made the refill
decision, it was their mother-in-law whom they told about their trouble. The mother-in-
law eventually told her husband to get the refill, but only when she thought it was the right
time.15 These types of intra-household communication barriers are similar to those identified
by Das Gupta (1995) in the context of maternal and child health.
Positive attitudes towards food cooked on chulha. In the quantitative survey, 92%
of women said that food cooked on the chulha is tastier and 86% said it is healthier than
25
food cooked on gas. In the qualitative survey, we found that these beliefs were widespread
among both educated and uneducated respondents, and among those that used gas often
and rarely.
A young woman in Madhya Pradesh who was in her first year of a Master of Science in
Mathematics explained why food cooked on a chulha is healthier:
According to me, the wood, the food cooked on wood is better for health. Like the
protein, the vitamins, the calcium that is there [in the food], it is more digestible
[when cooked] on wood. On gas, the food is different.
Many respondents also told us that eating food cooked on gas causes “gas”. An elderly
woman who lived with her husband in Bihar, and who had to regularly use gas because she
and her husband walked with difficulty, told us:
Eating food cooked on gas makes people obese. Haven’t you seen this in cities?
They are filled with air. People of that side [cities], they become swollen, [but
their] bones lack strength. [If] a thin person pushes the obese person, he will fall
down. The thin person has [more] strength.
Over and over, our respondents shared strong positive attitudes related to taste and health
towards food cooked on a chulha. These positive attitudes towards food cooked on the
chulha contribute to a culture that promotes the use of solid fuels for cooking. Women in
rural north India are cooking in a context which highly favors the chulha.
5.2 Understanding the use of clean fuels
We have shown various ways in which gender attitudes related to women’s status, seclusion,
and work discourage the use of gas in rural north India. It is common for households that
have an LPG stove to use gas some of the time, for instance to make chai so that it can
be served quickly to a guest. We repeatedly heard respondents say they sometimes used
both gas and chulha when they were running late and needed to prepare food quickly.
Respondents also told us that they used gas when it was raining or if the solid fuels were
wet. Although not mentioned by respondents, it may also be the case that it is economical
to cook small things, such as chai, on gas, because some amount of solid fuel would continue
burning as the chulha cools down after the chai has been cooked. For these households,
gas was valuable because it was convenient in these exceptional circumstances. However,
the norm was to use the chulha. Some households, though, regularly used gas, and gender
norms play an important role in explaining these households’ cooking practices as well.
26
In the typical rural north Indian household, agriculture facilitates the production of solid
fuels. Women make dung cakes from the dung of their cows and buffaloes, older women and
men cut and collect wood, and a daughter-in-law cooks. The households that we observed
using gas more often differed in important ways from this description of the typical household.
Some households did not practice animal husbandry, and gender norms relating to seclusion
and purdah made it difficult for women to collect solid fuels. If there were no men or elder
women to collect wood, many of these households resorted to using gas. Another reason to
use gas was age and disability. Elderly men and women whose sons and daughters-in-law
lived separately were likely to use gas because collecting solid fuels and cooking on the chulha
were difficult.
Gender and work in non-agricultural or semi-agricultural households. In Sec-
tion 5.1, we explained that agriculture and gender norms supporting women’s involvement in
animal husbandry promoted the use of solid fuels for cooking. Here, we describe how cook-
ing fuel decisions were made among households that did not farm, or did not own animals.
Because these households did not have animals that produced dung or land that produced
agricultural residue, they had to rely on buying dung cakes, using the dung of their neigh-
bors’ cows, or collecting or buying wood. These resources were not always available. When
they were, norms promoting women’s seclusion sometimes prevented women from going to
get them.
A woman who lived with her two children in Bihar while her husband worked in Delhi
explained that she initially bought a gas connection in 2013 because of the difficulty in
finding solid fuels. Her household cultivated land, but she did not own cows or buffaloes,
and she used gas to cook almost everything when she had gas in her cylinder. She said:
At that time, solid fuels weren’t available anywhere. Other people sell dung
cakes, they make them and sell them. We went to them [to buy dung cakes] and
they said that they are keeping them [the dung cakes] for themselves. After that,
out of necessity, we had to buy it [a cylinder].
Even though this respondent’s household had separated from the joint family, her hus-
band’s brothers and their families lived in the same compound. In this setting, it was im-
portant for her to practice modesty and seclusion, and she did not leave the home to acquire
solid fuels. She would ask her children to buy dung cakes from the market, and her husband
would collect wood when he visited. In fact, when her LPG cylinder recently became empty,
her husband told her on the phone from Delhi to get it refilled quickly. Recounting the
conversation with her husband, she told us: “My husband told me to refill it quickly because
where would I go to get solid fuels?” She decided to wait to get it refilled because she had
27
some wood and dung cakes at home, and she needed to pay some agricultural laborers for
the work they had done on her farm first. A week later, when she had received more money
from her husband, she got the cylinder refilled.
As the prior example demonstrates, cooks who follow norms of seclusion in households
that do not own animals must rely on other members of their family to bring solid fuels. In
joint families, mothers-in-law, fathers-in-law, and husbands of the cook often do this work.
However, if the household has separated from the joint family, the cook may have to rely on
her husband and children, or may have no one to rely on at all. Another respondent from
Bihar had no one to bring solid fuels, and she used gas exclusively. Her husband lived in
the district capital two hours away and her children were too young to collect wood for her.
She was from the Rajput caste and vigorously practiced seclusion. Her niece, who lived next
door, also participated in the interview and contrasted her aunt’s solid fuel situation and
cooking practices to those in her own household. She said:
The main thing is that my uncle [the main respondent’s husband] is not here.
So where will the solid fuels come from? In my house these people are here [the
niece’s brothers] so they bring all that [solid fuels], so gas use is less and chulha
is more. For her [the respondent], gas use is more and chulha less. That is the
thing.
Because of stringent expectations regarding seclusion that prevented her from leaving the
home to collect solid fuels, and the fact that the respondent’s husband had migrated for
work, this respondent used gas.
For women who are constrained by practices of seclusion, buying solid fuels is also an
option. However, this may not be an economically attractive option. The monthly cost of
LPG is similar to what Anonymized (2019a) have found to be the average monthly cost of
solid fuels among households who purchased them.
Age, disability, and the use of solid fuels. Another reason to regularly use gas is
because of disability or age. We spoke to several elderly respondents and couples who lived
on their own. They used gas more often because preparing solid fuels and cooking on the
chulha was difficult. Many, however, preferred food cooked on the chulha. A poor widow
who lived alone in Madhya Pradesh used gas most of the time because her hand hurt and
collecting wood was physically difficult for her. However, she would have preferred to eat
food cooked on the chulha. She said:
The food cooked on the wood chulha, it is flavorful, and the food cooked on
gas is not. There is a big difference with food cooked on gas. The food cooked
on chulha, that we always eat, it is [flavorful]. I’ll tell you how it is in the
28
countryside. We have a jungle here. It has wood, so the food cooked on wood is
made tasty, and the food cooked on [gas] is not as tasty. But now I have to eat
it [food cooked on gas]. Brother, who will bring it [wood]? I’ve been compelled
[to use gas].
Another elderly couple we spoke to in Bihar also used gas because of disability. They
lived in one room on the roof of their son’s plastered brick home, but they cooked separately
from their son’s family. The woman had poor eye sight, and walked with difficulty. Her
husband was also in poor health; he joined us in the middle of the interview and had to lay
down for several minutes after walking up the stairs. Collecting or making solid fuels would
have been very burdensome for this couple. They did pay someone to cut and bring wood
occasionally, but our respondent mostly cooked on gas because it was easier than setting fire
to the wood and using the chulha. This couple also expressed a preference for food cooked
on the chulha, though.
Among the elderly couples that regularly used gas, many stated a preference for eating
food cooked on the chulha. Had these couples been living jointly with their children, they
would have likely urged greater use of the chulha. Considering household hierarchies, a
daughter-in-law would have been unable to go against the wishes of her parents-in-law, and
it is likely that she would have been expected to use solid fuels more regularly than the
elderly couples were able to on their own.
6 Discussion
This paper adds to the literature on the use of clean cooking fuels by studying a unique
policy environment that dramatically expanded LPG access. Using novel quantitative and
qualitative data from rural north India, we shed light on how gender norms and attitudes
related to women’s status, women’s seclusion, and women’s work contribute to the persistence
of solid fuels in rural north India. We document that social forces, and in particular north
India’s patriarchal norms and attitudes, encourage women to preserve gas, promote women’s
work that facilitates the use of solid fuels, and hinder communication between the cook and
the decision-maker regarding LPG refills. This research has important implications for both
policy and research.
Implications for policy. Our findings highlight the importance of focusing on clean fuel
use rather than infrastructure in India. The Ujjwala Yojana has dramatically increased LPG
ownership. This is a notable achievement. Our findings suggest, however, that this program
did not produce a large-scale change in cooking practices in rural north India. Given that
even the wealthiest households in the region use gas about half the time, India’s clean energy
29

policy would likely be more successful if it addressed the underlying social environment in
which cooking fuel decisions take place.
Another important aspect of India’s clean energy policy is that it subsidizes LPG refills.
Theoretically, the subsidy is well-targeted because it incentivizes LPG use. However, the
evidence that so few households in rural north India regularly use gas suggests that the
subsidies are not high enough to generate a meaningful change in behavior. It is unclear
what impact an increase in subsidies would have on LPG use. Our findings suggest that
moderate changes in the subsidy may not have large effects given the little value placed
on women’s labor, and the constraints on women’s engagement in paid work. Patriarchal
norms and attitudes make the opportunity cost of women’s labor very low. Therefore, the
cost of gas might also need to be very low in order to substantially change household cooking
behaviors.
How might policy address the social barriers to LPG use? That gender norms and
attitudes are an important part of cooking fuel decisions is not lost on the Indian government.
Indeed, advertisements for Ujjwala emphasize its benefits for women. It is certainly true
that LPG is beneficial for women, but within the context of north Indian patriarchal norms
and attitudes, these advertisements further reinforce women’s roles as cooks. From the
perspective of a rural north Indian decision-maker who underestimates women’s work, and
neglects women’s well-being, our research suggests that advertisements such as these do not
present a particularly convincing argument to buy LPG. Since men are the decision-makers,
framing LPG use as beneficial for men is a potentially useful avenue to explore. More broadly,
policies and campaigns that challenge gender norms within north Indian households may
improve LPG use.
Implications for research. The findings of this research also push forward the clean
energy research agenda. We identify the underlying mechanisms that drive the cross-sectional
correlations between gender indicators and clean fuel use discussed in the literature (Kishore
and Spears, 2014; Gould and Urpelainen, 2019; Choudhuri and Desai, 2020). Although
researchers have long recognized the importance of gender in research on fuel use (Parikh,
Smith and Laxmi, 1999; Wickramasinghe, 2003), we clarify and discuss in detail all of the
ways in which gender attitudes and norms in north India promote the use of solid fuels, and
explain the little regular gas use that exists.
An open question is the extent to which these issues are salient in other parts of India.
Although available evidence suggests that gender norms in other parts of India are less
constrained (Kapadia, 1995) and the transition to LPG is much quicker (Alexander and
Padmanabhan, 2020), more research on gender relations and solid fuel use in other Indian
states in the context of the Ujjwala program is needed.
30
An important avenue for future research is to explore potential interventions that generate
meaningful changes in cooking practices. Pillarisetti et al. (2019) report on a pilot study
testing various interventions aimed at addressing barriers to LPG use in rural India. There is
great need for more such studies. Further research in this area, such as on the links between
availability of solid fuels because households own animals, gender inequality, and slow clean
fuel adoption, are a priority. In general, research should be attentive to patriarchal norms
and attitudes that encourage solid fuel use in north India.
A final contribution is methodological. Moving forward, research in India should focus on
LPG use, but how should use be measured? In this study, we propose an effective measure
of LPG use: LPG refills per month per person. This measurement can be easily collected in
a household survey that contains a household roster, by either looking at a household’s LPG
booklet to see the dates of the past few refills, or by asking the household to report on when
or how often it has refilled the cylinder. This measure may also be available from adminis-
trative data (Kar et al., 2019), which should ideally be linked to household characteristics
to understand barriers to LPG use (Afridi, Debnath and Somanathan, 2020). Linking this
measure of fuel use to determinants, such as household wealth or gender inequality, would
help clarify the precise contributions of these determinants.
The decline in joint household structures, higher incomes, and the increase in migrant
work among males may over time allow more women in rural north India to transition to
LPG for cooking. In the meantime, however, the use of solid fuels poses a major threat to the
health of rural north Indians, and particularly to the health and human capital accumulation
of children. Accelerating the transition to clean fuels is an important policy priority. Future
research and policy should take seriously the gender norms and attitudes that currently
discourage the use of LPG.
Notes
1Because the Ujjwala Yojana was launched in May 2016, most of the data collection for the NFHS
occurred before the beginning of the program.2Normalized differences and t-statistics on differences in means between “focus states” and “rest of India”
reveal broadly consistent patterns.3Sampling is discussed in detail in Anonymized (2014) and Anonymized (2019b).4See Anonymized (2019b) for a discussion on how the refresher sample was selected.5We count adults and children in the same way, since the comparison measure of 0.2 LPG cylinders per
month per person (described in greater detail later in this paragraph) is for the average Indian household,
which contains five members, including both adults and children.
31
6Households that normally use chulha may sometimes use gas to cook on a particular day because of rain
or for some other reason. And households that normally use gas may sometimes use chulha on a particular
day because they have run out of gas, or are expecting guests. Therefore, the variable we construct is an
imperfect measure of exclusively using gas. Anonymized (2019a) shows the summary statistics from the
individual questions.7Near the beginning of the qualitative interview, we asked households: “In your household, what type
of fuel do you mainly use for cooking food?” The purpose of this question was to ensure that our sample
included households that used LPG to varying degrees. Sometimes this question was answered by household
members who did not cook, and therefore sometimes the answer to this question was not consistent with
answers to a series of other questions around fuel use provided by the cook.8The interested reader might wonder why the respondent initially said that she “cook[s] on gas” when
her answers to questions about refills suggest that she also substantially uses solid fuels. She certainly used
gas more than many of her neighbors, who hardly used it at all. One reason for this could have been because
neither she nor her daughters would collect wood. Using more gas meant that her husband would not have
needed to collect as much wood when he was home. We discuss reasons to use LPG in depth later in this
section.9Owning animals indicates ownership of cows or buffaloes, and also ownership of smaller animals such
as goats. Dung-cakes, however, can only be made from the dung of cows and buffaloes. Unfortunately, the
quantitative survey did not differentiate between different types of animals. We use data from the NFHS to
ensure that the main result of this figure holds. Appendix Figure A1 shows the fraction of rural households
in the NFHS using clean fuels at different levels of asset wealth, for households that own cows and buffaloes
and those that do not, separately. The fact that the line for households that own cows and buffaloes is lower
than the line for households that do not, at every level of asset wealth, supports the findings in the RSFU.10See full regression results in Appendix Table A1.11The type of work included unskilled manual labor, cooking in government schools, sewing, or child-care
work in an anganwadi.12Four of the six cooks who worked for pay mentioned time-saving as an important reason for using gas
instead of the chulha.13Actual figures from India’s NFHS can be seen in Table 1. Appendix Figure A1 shows that controlling for
wealth and ownership of cows and buffaloes, a larger fraction of households in the focus states use solid fuels
compared to the rest of rural India. However, the difference in clean fuel use between rural households in
the focus states and the rest of India is much smaller among households that do not own cows and buffaloes
compared to households that do own cows and buffaloes. These facts are consistent with the more patriarchal
norms of north India both encouraging animal husbandry and encouraging solid fuel use.14See full regression results in Appendix Table A1.15It is likely that the father-in-law would have known of the problems posed by the damp wood, because
breakfast would have taken longer to cook, and there would have been more smoke coming from the chulha.
However, he did not get it refilled until his wife asked him to. Young women’s low status, therefore, may not
only hinder communication between the cook and the decision-maker, it may also prevent the development
of a cooperative relationship with the decision-maker. This would produce the same pattern that we observe
here: greater use of gas among cooks who have a closer relationship with the decision-maker, such as wife
compared to daughter-in-law.
32
References
Afridi, Farzana, Sisir Debnath, and E. Somanathan. 2020. “A Breath of Fresh Air:
Raising Awareness for Clean Fuel Adoption.” working paper.
Afridi, Farzana, Taryn Dinkelman, and Kanika Mahajan. 2016. “Why are fewer mar-
ried women joining the work force in india? a decomposition analysis over two decades.”
Alexander, Sneha, and Vishnu Padmanabhan. 2020. “The PMUY’s cooking gas refill
issue.” LiveMint.
Anonymized, A. 2014.
Anonymized, B. 2019a.
Anonymized, C. 2019b.
Anonymized, D. 2019c.
Banerji, Rukmini, Suman Bhattacharjea, and Wilima Wadhwa. 2013. “The annual
status of education report (ASER).” Research in Comparative and International Educa-
tion, 8(3): 387–396.
Behera, Bhagirath, Aryal Jeetendra, Akhter Ali, et al. 2015. “Household collection
and use of biomass energy sources in South Asia.” Energy, 85: 468–480.
Caldwell, John C. 1986. “Routes to low mortality in poor countries.” Population and
development review, 171–220.
Cheng, Chao-yo, and Johannes Urpelainen. 2014. “Fuel stacking in India: Changes in
the cooking and lighting mix, 1987–2010.” Energy, 76: 306–317.
Choudhuri, Pallavi, and Sonalde Desai. 2020. “Gender inequalities and household fuel
choice in India.” Journal of Cleaner Production, 121487.
Coffey, Diane, and Dean Spears. 2019. “Neonatal death in India: birth order in a context
of maternal undernutrition.”
Coffey, Diane, Payal Hathi, Nidhi Khurana, and Amit Thorat. 2018. “Explicit
Prejudice.” Economic & Political Weekly, 53(1): 47.
Dabadge, Ashwini. 2018. “What has the Pradhan Mantri Ujjwala Yojana achieved so
far?” Economic and Political Weekly.
33
Das Gupta, Monica. 1995. “Life course perspectives on women’s autonomy and health
outcomes.” American Anthropologist, 97(3): 481–491.
Das, Sukanya, Hugo De Groote, Bhagirath Behera, et al. 2014. “Determinants of
household energy use in Bhutan.” Energy, 69: 661–672.
Desai, Sonalde, et al. 1994. “Gender inequalities and demographic behavior.” India, New
York, 16.
Dreze, Jean, and Amartya Sen. 2013. An uncertain glory: India and its contradictions.
Princeton University Press.
Dyson, Tim, and Mick Moore. 1983. “On kinship structure, female autonomy, and
demographic behavior in India.” Population and development review, 35–60.
Gould, Carlos F, and Johannes Urpelainen. 2018. “LPG as a clean cooking fuel:
Adoption, use, and impact in rural India.” Energy Policy, 122: 395–408.
Gould, Carlos F, and Johannes Urpelainen. 2019. “The Gendered Nature of Liquefied
Petroleum Gas Stove Adoption and Use in Rural India.” The Journal of Development
Studies, 1–21.
Hennink, Monique M, Bonnie N Kaiser, and Vincent C Marconi. 2017. “Code
saturation versus meaning saturation: how many interviews are enough?” Qualitative
health research, 27(4): 591–608.
Hirway, Indira, and Sunny Jose. 2011. “Understanding women’s work using time-use
statistics: The case of India.” Feminist Economics, 17(4): 67–92.
Imbens, Guido W, and Jeffrey M Wooldridge. 2009. “Recent developments in the
econometrics of program evaluation.” Journal of economic literature, 47(1): 5–86.
Jain, Abhishek, Saurabh Tripathi, Sunil Mani, Sasmita Patnaik, Tauseef Shahidi,
and Karthik Ganesan. 2018. “Access to clean cooking energy and electricity: Survey of
states 2018.” CEEW Report, Council on Energy, Environment and Water (CEEW), New
Delhi, India.
Jeffery, Patricia, Roger Jeffery, and Andrew Lyon. 1989. “Labour pains and labour
power: Women and childbearing in India.”
34
Jejeebhoy, Shireen J, and Zeba A Sathar. 2001. “Women’s autonomy in India and Pak-
istan: the influence of religion and region.” Population and development review, 27(4): 687–
712.
Kapadia, Karin. 1995. “Siva and Her Sisters: Gender, Caste, and Class in Rural South
India. Boulder.” CO: Westview.
Kapur, Devesh. 2020. “Why Does the Indian State Both Fail and Succeed?” Journal of
Economic Perspectives, 34(1): 31–54.
Kar, Abhishek, Shonali Pachauri, Rob Bailis, and Hisham Zerriffi. 2019. “Using
sales data to assess cooking gas adoption and the impact of India’s Ujjwala programme in
rural Karnataka.” Nature Energy, 4(9): 806–814.
Kishore, Avinash, and Dean Spears. 2014. “Having a son promotes clean cooking fuel
use in urban India: Women’s status and son preference.” Economic Development and
Cultural Change, 62(4): 673–699.
Mandelbaum, David G. 1988. Women’s seclusion and men’s honor: Sex roles in North
India, Bangladesh, and Pakistan. University of Arizona Press.
Mani, Sunil, Abhishek Jain, Saurabh Tripathi, and Carlos F Gould. 2020. “The
drivers of sustained use of liquified petroleum gas in India.” Nature Energy, 5(6): 450–457.
Masera, Omar R, Barbara D Saatkamp, and Daniel M Kammen. 2000. “From linear
fuel switching to multiple cooking strategies: a critique and alternative to the energy ladder
model.” World development, 28(12): 2083–2103.
Mottaleb, Khondoker Abdul, Akhter Ali, et al. 2017. “An exploration into the house-
hold energy choice and expenditure in Bangladesh.” Energy, 135: 767–776.
Palriwala, Rajni. 1993. “Economics and patriliny: Consumption and authority within the
household.” Social scientist, 47–73.
Parikh, Jyoti, Kirk Smith, and Vijay Laxmi. 1999. “Indoor air pollution: a reflection
on gender bias.” Economic and Political Weekly, 539–544.
Pillarisetti, Ajay, Makarand Ghorpade, Sathish Madhav, Arun Dhongade,
Sudipto Roy, Kalpana Balakrishnan, Sambandam Sankar, Rutuja Patil,
David I Levine, Sanjay Juvekar, et al. 2019. “Promoting LPG usage during preg-
nancy: A pilot study in rural Maharashtra, India.” Environment international, 127: 540–
549.
35
Rahman, Lupin, and Vijayendra Rao. 2004. “The determinants of gender equity in
India: examining Dyson and Moore’s thesis with new data.” Population and Development
Review, 30(2): 239–268.
Rao, M Narasimha, and B Sudhakara Reddy. 2007. “Variations in energy use by
Indian households: An analysis of micro level data.” Energy, 32(2): 143–153.
Salvi, Sundeep S, and Peter J Barnes. 2009. “Chronic obstructive pulmonary disease
in non-smokers.” The lancet, 374(9691): 733–743.
Sen, Amartya. 2003. “Missing women—revisited.”
Sharma, Kanika. 2018. “Living with pain: women’s everyday lives and health in rural
Bihar.” The Hindu Centre for Public Policy.
Small, Mario Luis. 2011. “How to conduct a mixed methods study: Recent trends in a
rapidly growing literature.” Annual review of sociology, 37.
Smith, Kirk R. 2000. “National burden of disease in India from indoor air pollution.”
Proceedings of the National Academy of Sciences, 97(24): 13286–13293.
Spears, Dean. 2018. “Exposure to open defecation can account for the Indian enigma of
child height.” Journal of Development Economics.
Srinivas, Mysore Narasimhachar. 1977. “The changing position of Indian women.” Man,
221–238.
Wickramasinghe, Anoja. 2003. “Gender and health issues in the biomass energy cycle:
impediments to sustainable development.” Energy for Sustainable Development, 7(3): 51–
61.
Wilkinson, Paul, Kirk R Smith, Michael Davies, Heather Adair, Ben G
Armstrong, Mark Barrett, Nigel Bruce, Andy Haines, Ian Hamilton, Tadj
Oreszczyn, et al. 2009. “Public health benefits of strategies to reduce greenhouse-gas
emissions: household energy.” The Lancet, 374(9705): 1917–1929.
World Health Organization. 2016. “Burning Opportunity: Clean Household Energy for
Health, Sustainable Development, and Wellbeing of Women and Children.”
36
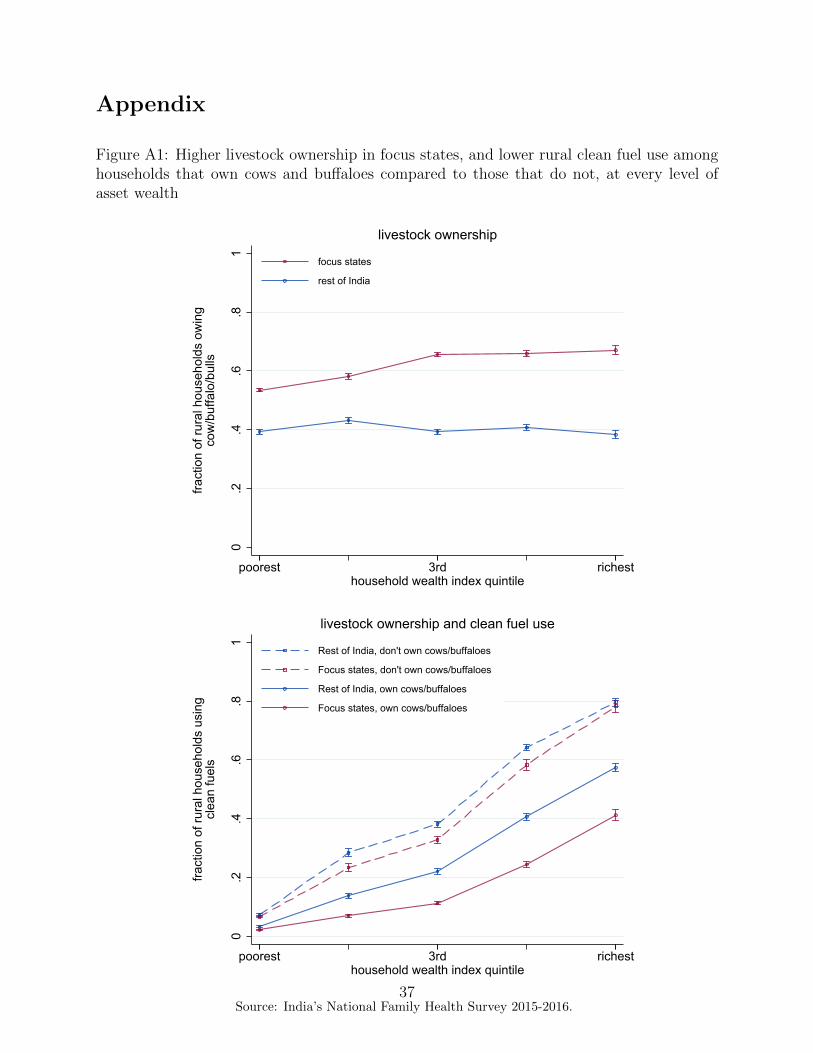
Appendix
Figure A1: Higher livestock ownership in focus states, and lower rural clean fuel use amonghouseholds that own cows and buffaloes compared to those that do not, at every level ofasset wealth
0.2
.4.6
.81
fract
ion
of ru
ral h
ouse
hold
s ow
ing
cow
/buf
falo
/bul
ls
poorest 3rd richesthousehold wealth index quintile
focus states
rest of India
livestock ownership0
.2.4
.6.8
1
fract
ion
of ru
ral h
ouse
hold
s us
ing
clea
n fu
els
poorest 3rd richesthousehold wealth index quintile
Rest of India, don't own cows/buffaloes
Focus states, don't own cows/buffaloes
Rest of India, own cows/buffaloes
Focus states, own cows/buffaloes
livestock ownership and clean fuel use
Source: India’s National Family Health Survey 2015-2016.37
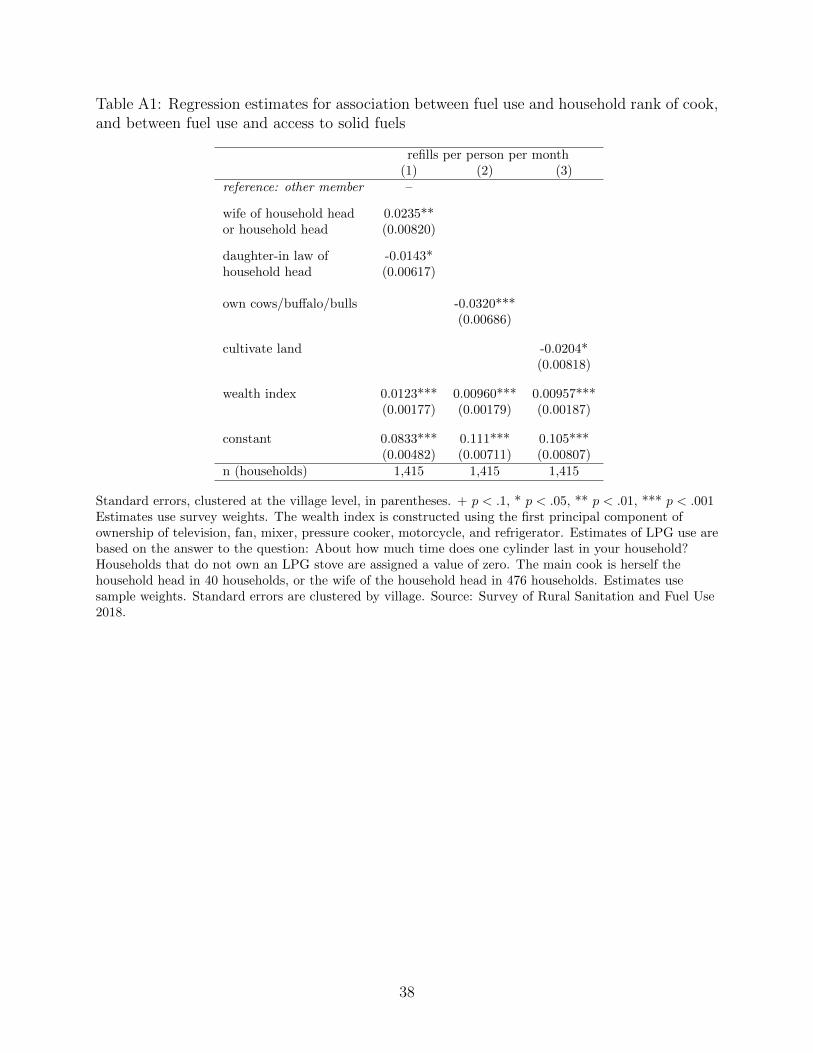
Table A1: Regression estimates for association between fuel use and household rank of cook,and between fuel use and access to solid fuels
refills per person per month(1) (2) (3)
reference: other member –
wife of household head 0.0235**or household head (0.00820)
daughter-in law of -0.0143*household head (0.00617)
own cows/buffalo/bulls -0.0320***(0.00686)
cultivate land -0.0204*(0.00818)
wealth index 0.0123*** 0.00960*** 0.00957***(0.00177) (0.00179) (0.00187)
constant 0.0833*** 0.111*** 0.105***(0.00482) (0.00711) (0.00807)
n (households) 1,415 1,415 1,415
Standard errors, clustered at the village level, in parentheses. + p < .1, * p < .05, ** p < .01, *** p < .001Estimates use survey weights. The wealth index is constructed using the first principal component ofownership of television, fan, mixer, pressure cooker, motorcycle, and refrigerator. Estimates of LPG use arebased on the answer to the question: About how much time does one cylinder last in your household?Households that do not own an LPG stove are assigned a value of zero. The main cook is herself thehousehold head in 40 households, or the wife of the household head in 476 households. Estimates usesample weights. Standard errors are clustered by village. Source: Survey of Rural Sanitation and Fuel Use2018.
38
Top Related
Copyright © 2022 FDOKUMEN

