


Bahasa
Halaman
Hukum


from FACTORIES to FINE ARTThe Origins and Evolution of
East London!s Artists! Agglomeration, 1968–1998
Thesis submitted in partial fulfilment of the requirements of
the University of London for the degree of Doctor of Philosophy.
Charles Nicholas GreenJuly 2001
Body text set in Times 11pt at 17pt spacing.
This thesis was prepared on Apple Macintosh computers using AppleWorks & Adobe Photoshop software

Abstract
This study traces the development of the East End’s artists’ agglomeration from its origins in
1968 until 1998 through a geographical history of the studio blocks in which those artists have
worked. The thesis concentrates on visual artists and the ways in which they have comman-
deered space in which to work. The thesis argues that the agglomeration may be conceptualised
as a complex adaptive system which has evolved in the “edge of chaos” urban environment
which arose in the East End as it made the transition from an industrial to a post-industrial dis-
trict.
The core methodology draws largely on ethnographic techniques. Information was gathered
from fieldwork, which in this project comprised semi-structured tape-recorded interviews and
semi-participant observation in the form of my involvement with a project “ViA” which is de-
veloping an information service for the East End’s artists.
The qualitative approach is Grounded Theory. Interview transcripts were “coded” for themes,
and these themes explored further in subsequent fieldwork, from which further coding was car-
ried out in an iterative process. The themes which emerged were then combined with the archi-
val research and the findings of the social network analysis, forming the foundations of a theo-
retical model.
The quantitative approach is social network analysis at an organisational level, which estab-
lishes that the organisational networks are weak, from which it is inferred, in combination with
the qualitative evidence, that the significant networks are informal, a sort of “grapevine”.
These foundations are developed into a unified theory which draws on existing models concern-
ing the development of such “creative milieux” and then carries these forward using concepts
more commonly found in chaos theory and complexity theory such as inherent unpredictability,
sensitive dependence on initial conditions, adaptive topographies and fitness landscapes, and
emergence. I argue in conclusion that the artists’ agglomeration in the East End is an emergent
phenomenon arising from the actions and interactions of individual artists in search of studio
space. It can thus be conceptualised as a “complex adaptive system”, capable of learning, grow-
ing and spontaneously developing new properties, and finding new directions which cannot be
predicted simply by looking at the system’s constituent parts in isolation.
Introduction 2

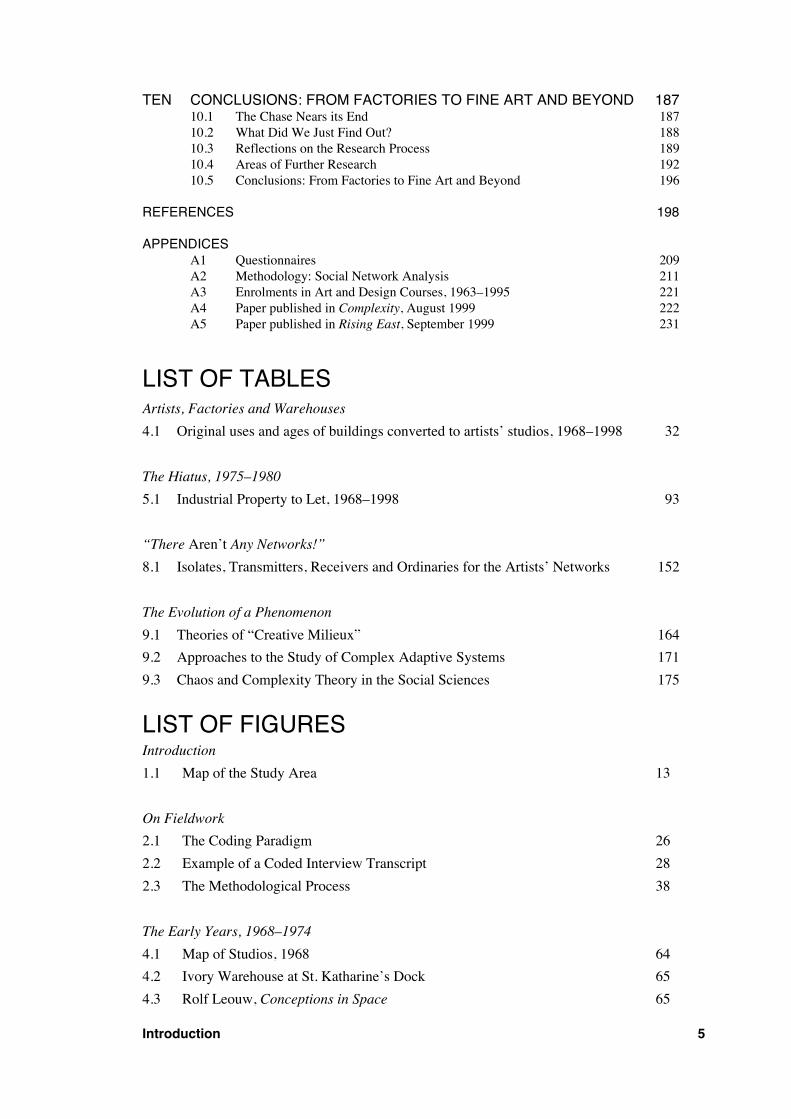
CONTENTS
List of Tables 5
List of Figures 5
Acknowledgements 8
ONE INTRODUCTION 91.1 About this Thesis 9
1.2 Of Meanings and Definitions 12
1.3 The Legend of Ten Thousand Artists 14
1.4 Theory and Methodology—An Overview 17
TWO ON FIELDWORK 212.1 When Methodologies Collide 21
2.2 The Art of Fieldwork 22
2.2.1 The Problems Outlined 22
2.2.2 Objectivity versus Subjectivity: the Question of Bias 22
2.2.3 Grounded Theory—the Analysis of Qualitative Data 24
2.2.4 Grounded Theory—the Coding Paradigm 25
2.2.5 The ViA Project 29
2.2.6 The Art of Fieldwork—Discussion 29
2.3 Population Boundaries and Sampling 30
2.3.1 How the Stats Were Won and Where It Gets Us 30
2.3.2 Artists 31
2.3.3 Art Galleries 33
2.3.4 Local Authorities 33
2.4 The Interviews 34
2.4.1 Initial Enquiries 34
2.4.2 Interview Procedure 34
2.5 Discussion 36
THREE EAST LONDON!S INDUSTRY AND HOUSING, 1945–1975 393.1 Why We Should Know How We Got Here 39
3.2 A Brief History of the East End from 1600–1945 40
3.2.1 Introduction 40
3.2.2 Spitalfields and Whitechapel 40
3.2.3 Mile End and Bethnal Green 42
3.2.4 Shoreditch and Hoxton 43
3.2.5 London’s Docklands—from the 16th century to World War Two 44
3.2.6 Summary: the East End’s Industry until the second World War 45
3.3 “No New Phenomenon”—the dispersal of industry, 1943–1975 46
3.3.1 Introduction 46
3.3.2 Industry in the East End—After the War 47
3.3.3 Summary—Industry in the East End 50
3.4 Housing in the East End, 1945—1975 51
3.4.1 Introduction 51
3.4.2 Outward and Upward—Housing After the War 52
3.4.3 Summary—Housing in the East End, 1945—1975 56
3.5 Discussion 57
FOUR THE EARLY YEARS, 1968–1974 584.1 A Chronological Explanation 58
4.2 New Uses for Old Docks… 59
4.3 …New Life for Old Houses 67
4.4 Discussion 78
Introduction 3

FIVE THE HIATUS, 1975–1980 805.1 Of Politics, Punk (and Painters) 80
5.2 The Hiatus, 1975–1980 81
5.3 Of Painters, Properties and Percentages 91
5.4 Discussion 94
SIX CONSOLIDATION, 1981–1985 956.1 Focus Resumed 95
6.2 Consolidation, 1981–1985 97
6.3 Discussion 102
SEVEN THE RISE OF THE SMALL INDEPENDENTS, 1986–1998 1037.1 The Glory of the Garden 103
7.2 More Studios, and Galleries Too 104
7.3 The Media (Finally) Notices 110
7.4 After the Media 112
7.5 Discussion, 1968–1998 119
7.5.1 Seventy Studios in Five Phases… 119
7.5.2 …and Two Thousand Artists 122
7.5.3 Closing Remarks 123
EIGHT “THERE AREN!T ANY NETWORKS!” 1268.1 About this Chapter 126
8.2 Network Analysis & Network Theory 127
8.3 General Approach and Sample Frame 131
8.3.1 General Approach 131
8.3.1 Sample Frame for Social Networks 131
8.4 A Brief Introduction to Social Network Analysis 133
8.4.1 Basic Terms and Concepts 133
8.4.2 The General Structure of the Network 134
8.5 The Pilot Study 136
8.5.1 Introduction 136
8.5.2 Pilot Study: Protocol and Findings 137
8.5.3 Pilot Study: Discussion 142
8.6 Artistic Networks—In Search of a Structure 143
8.6.1 Introduction 143
8.6.2 Actors which are “significant” in some way 151
8.6.3 Cohesive Subgroups in the Network 155
8.7 Discussion 157
NINE THE EVOLUTION OF A PHENOMENON 1599.1 Introduction 159
9.2 The “Creative Milieu”—a Theoretical Overview 160
9.3 About Complexity Theory 164
9.3.1 Life at the Edge of Chaos 164
9.3.2 A Brief Introduction to Complexity Theory 165
9.3.3 Complexity Theory and the Social Sciences 171
9.4 The Evolution of a Phenomenon 175
9.4.1 Introduction 175
9.4.2 Is there evidence for a Phase Transition? 177
9.4.3 Does the system demonstrate Non-linearity? 177
9.4.4 Does the system show Sensitive Dependence on Initial Conditions? 178
9.4.5 Is the system Adaptive? 179
9.4.6 Is the system Emergent? 179
9.4.7 Holland’s “Seven Basics” 179
9.4.8 Fitness Landscapes 180
9.5 Discussion 183
Introduction 4
TEN CONCLUSIONS: FROM FACTORIES TO FINE ART AND BEYOND 18710.1 The Chase Nears its End 187
10.2 What Did We Just Find Out? 188
10.3 Reflections on the Research Process 189
10.4 Areas of Further Research 192
10.5 Conclusions: From Factories to Fine Art and Beyond 196
REFERENCES 198
APPENDICESA1 Questionnaires 209
A2 Methodology: Social Network Analysis 211
A3 Enrolments in Art and Design Courses, 1963–1995 221
A4 Paper published in Complexity, August 1999 222
A5 Paper published in Rising East, September 1999 231
LIST OF TABLESArtists, Factories and Warehouses
4.1 Original uses and ages of buildings converted to artists’ studios, 1968–1998 32
The Hiatus, 1975–1980
5.1 Industrial Property to Let, 1968–1998 93
“There Aren’t Any Networks!”
8.1 Isolates, Transmitters, Receivers and Ordinaries for the Artists’ Networks 152
The Evolution of a Phenomenon
9.1 Theories of “Creative Milieux” 164
9.2 Approaches to the Study of Complex Adaptive Systems 171
9.3 Chaos and Complexity Theory in the Social Sciences 175
LIST OF FIGURESIntroduction
1.1 Map of the Study Area 13
On Fieldwork
2.1 The Coding Paradigm 26
2.2 Example of a Coded Interview Transcript 28
2.3 The Methodological Process 38
The Early Years, 1968–1974
4.1 Map of Studios, 1968 64
4.2 Ivory Warehouse at St. Katharine’s Dock 65
4.3 Rolf Leouw, Conceptions in Space 65
Introduction 5

4.4 Old Ford Studios, 1983 72
4.5 Orsman Road Studios before conversion, 1983 72
4.6 Studios in the East End, 1968–1974 74
4.7 Map of Studios, 1971 75
4.8 Map of Studios, 1974 75
4.9 New Crane Wharf, circa 1974 76
4.10 New Crane Wharf from the Thames, circa 1974 76
4.11 View across the Thames from New Crane Studios, circa 1974 77
4.12 Interior of New Crane Wharf, circa 1974 77
The Hiatus, 1975–1980
5.1 “Help Yourself to Studio Space” 85
5.2 Studios in the East End, 1975–1981 89
5.3 Map of Studios, 1977 90
5.4 Map of Studios, 1980 90
5.5 Percentage Returns on Industrial Property vs. No. of Artists, 1968–1998 92
Consolidation, 1981–1985
6.1 Studios in the East End, 1982–1987 101
6.2 Map of Studios, 1983 102
6.3 Map of Studios, 1986 102
The Rise of the Small Independents, 1986–1998
7.1 Studios in the East End, 1988–1998 116
7.2 Map of Studios, 1989 117
7.3 Map of Studios, 1992 117
7.4 Map of Studios, 1995 118
7.5 Map of Studios, 1998 118
7.6 Studio “Spin-Offs” 125
“There Aren’t Any Networks!”
8.1 Representation of a Network using Graph and Matrix 134
8.2 Example of a Directed Graph, or Digraph 135
8.3 Network for Pilot Study 139
8.4 Illustrative Social Networks Graph 145
8.5 Social Networks Graph (complete) 146
8.6 Social Networks Graph (working relationships) 147
8.7 Social Networks Graph (funds/supports) 148
8.8 Social Networks Graph (nominated by) 149
Introduction 6

The Evolution of a Phenomenon
9.1 How a Complex Adaptive System works 167
9.2 A General Model of Adaptation 170
9.3 Ruelle’s Limits of Predictability 172
9.4 Cellular Automata and the “Game of Life” 176
9.5 Simulation of Urban Growth in Cardiff 176
9.6 4-dimensional Evolutionary Hypercube 182
9.7 The Four Stages of Evolution 185
Conclusions: from Factories to Fine Art and Beyond
10.1 “Galaxy of Studios” 189
10.2 The Methodological Process Revisited in Light of the Project’s Findings 192
10.3 Areas for Further Research 196
Appendix Two—Social Network Analysis
A2.1 Representation of a Network Using Graph and Matrix 213
A2.2 Example of a Directed Graph or Digraph 214
A2.3 Sub-groups of figure A2.1 216
A2.4 Weakly connected 2-cliques in a Digraph 218
A2.5 Unilaterally connected 2-cliques in a Digraph 219
Introduction 7

AcknowledgementsMy supervisors—Professors Peter Hall and Mike Batty for their patience, support and belief in
this project; UCL and the ESRC for providing some of the money to do this project; UCL
(again) and the various firms which gave me work when I had no other funding; all of the peo-
ple who gave their time to talk to me; Aileen Ryan/ViA for useful connections; my family; the
friends who have propped me up in the difficult times (you know who you are); Euni for laugh-
ter, sunshine and tequila; and finally Room 431—Stephen, James and Susie: the band has long
broken up; the music won’t stop.
Introduction 8

ONE
INTRODUCTION
The original building will stand deep within its own grounds, preferably on a river bank. It
should be large enough for a pilot-group (astronauts of inner space) to situate itself, orgasm
and genius, and their tools and dream-machines and amazing apparatus and appurtenances;
with outhouses for “workshops”; large as could accommodate light industry; the entire site to
allow for spontaneous architecture and eventual town planning.
Alexander Trocchi, Sigma, a Tactical Blueprint, quoted in Hewison, 1986
1.1 About this Thesis
This is not art history. But it is urban history, and it does relate to artists, specifically those for
whom London’s East End has, since the late 1960s, become increasingly important as a place of
work. The root of this new role is the decline of London’s docks and manufacturing industries,
which left a legacy of empty and apparently redundant industrial property, much of it dating
from the late 19th and early 20th centuries. Furniture factories, carpentry workshops, print
workshops, warehouses; all were victims of a decentralisation process which had its origins in
the late 1930s and 1940s, and which by the 1960s and 1970s was unstoppable. Such property
tends to be well-lit and spacious, with high ceilings, and large open floor spaces which readily
lend themselves to sub-division into smaller units. It is also cheap to rent or lease. Ideal, in other
words, for artists’ studios. And artists were happy enough to accept the inconvenience of a
workplace which may be relatively far from public transport, or even local shops and other
amenities: one of the East End’s largest studio blocks, for example sat in not quite total isolation
on the edge of Stratford Marsh.
But the decentralisation which has since proved so beneficial to artists did not extend only
to industry. People also moved out of central London’s worst slums, either to the suburbs, or to
the New Towns. Often they were the victims of war-time bombing, forced to go where the work
and the homes were. Others were only too happy to leave behind the slums of Bethnal Green
and Shoreditch for new houses with gardens, and new jobs, although sometimes, as Young and
Introduction 9

Willmott found in their classic study Family and Kinship in East London, when they got there
they felt disappointed and isolated, no longer part of a community. The houses they had left be-
hind, mostly 19th century terraces, were often derelict, and earmarked for demolition as part of
the LCC’s, and later the GLC’s slum-clearance programme.
These houses were not demolished immediately, often lying empty for months, or some-
times years. In the early 1970s, increasingly large numbers of these houses were let on short
leases to artists as living and working accommodation, often in the face of local hostility from
those who had been evicted. Over time, small communities established themselves in streets of
condemned houses. These were communities not of the local people, but of artists. These small
communities were, and still are, part of a much larger “artists’ community”—I use the phrase
advisedly—in the East End, which forms a loose, ill-defined network across the area. It will be-
come apparent that in fact there is no overarching “artists’ community” in the East End: in truth
it is a loose agglomeration of artists which has built up over the last three decades.
But where artists have colonised old industrial buildings in depressed, but still reasonably
central parts of the city where rents are cheap, developers have, sooner or later, tended to fol-
low. Whether this is coincidental, or a direct causal link is discussed in subsequent chapters.
However the immediate consequence of a developer interest is increased property prices, forc-
ing the artists to leave. Better known instances of this include SoHo in New York; Montpar-
nasse in Paris; St. Katharine’s Dock and Butler’s Wharf in London. In fact, the beginnings of an
artistic community in the early 1970s coincided with the beginnings of a gentrification process
which, in the late 1990s, is considered interesting enough to be worth national coverage by
some of the broadsheet newspapers. Indeed, parts of the East End are now fashionable, and not
only for artistic types. Rising property prices, both in the rejuvenated Docklands and in other
pockets of the East End such as Shoreditch and Hoxton, are fuelling fears of another wave of
decentralisation, but this time of the artists themselves. In response to these trends, an increasing
number of artists’ organisations are attempting to consolidate their positions, often through buy-
ing their studio block from their landlord, and through developing what are at present largely in-
formal social networks at a more formal level, with both corporate and local authority involve-
ment.
In 1998, the two main studio providers in the East End, SPACE and Acme, celebrated
their thirtieth and twenty-fifth anniversaries respectively, and the “arts scene” in the East End
appears to be in the throes of a major transition. This in itself makes the East End artists’ ag-
glomeration an intriguing topic for research, but like any researcher, I must acknowledge a per-
sonal interest too.
In 1995, as a resident of the East End with an interest in art—both looking and making—I
was aware through the media that the East End has many artists: I was also working in an urban
planning department with a research interest in the creative industries and urban regeneration.
This was enough to generate the initial question about artists in the East End, which might be
put very loosely as “How did the East End artists’ agglomeration come to be?” Of course such a
question suggests in the first instance an exploratory approach to the research, relying primarily
Introduction 10

on induction to generate further questions, and indeed the first few months were spent exploring
both the rather sparse literature on such areas and the East End itself. It quickly became appar-
ent that the written history of the East End arts scene as a whole was effectively non-existent.
So from these initial enquiries, a more focused research objective, and a mode of
inquiry—semi-structured interviews and “semi-participant” observation (both covered in chap-
ter two)—were developed and pursued. The research objective is apparently rather simple:
To map and describe the development of visual artists’ studio organisations in the East End
Of course like all “apparently rather simple” objectives, this one serves as a portal to more sub-
tle questions to do with how cities change, urban governance, social dynamics, property markets
and, not surprisingly, art. The connections are not always obvious, but they exist, and informal
social networks turn out to be the critical link. They enabled the exchange of information which
allowed three things: the possibility for early experiments in using redundant buildings for stu-
dios to succeed and gain momentum; the signposting of opportunities for other artists to follow
with similar initiatives; the development of a critical mass of artists sufficiently large for the lo-
cal authorities to sit up and take notice of the fact that they exist, and may have something to of-
fer the East End socially, culturally, educationally and economically.
The picture which emerges therefore owes its existence as much to the needs of global
capital as to the opportunistic creativity of the artists, their networks and the way in which this
phenomenon has evolved. It mirrors, too, changes in the way art, and by extension “culture”, is
perceived at both a social and economic level, revealing a gradual acceptance by local authori-
ties of art and artists as a positive force in the processes of urban regeneration. And lastly, it
proves an interesting example of how what was once simply a largely unknown phenomenon
became, through a rather Latourian process of legitimisation by others, some sort of “scene” in
the hands of the printed media.
But I opened with the statement that this is not art history, even though it deals with that
topic, and before moving on, the reader deserves some idea of what it is they should expect.
This chapter deals with definitions and the problems of how to count the number of artists in the
East End, and then provides a general outline of the theoretical and methodological approaches.
The literature covered in this thesis is diverse: the main topics are grounded theory, social
network analysis, complexity theory and evolutionary theory. In view of the fact that a variety
of theoretical, and indeed methodological approaches are pursued herein, it will make much
more sense to cross each theoretical bridge as we come to it. So the reader looking for a
“literature review” chapter will be disappointed, although relieved perhaps that they do not have
to trawl through several different—and not obviously connected—sets of literature, some of
which are not mentioned again until the latter half of the thesis.
Chapter two, then, describes the core methodological approach, grounded theory, and at
the risk of over-emphasising that methodology, sets out as transparently as possible the way in
which the research was carried out. The underlying ethos here is that a future hypothetical re-
Introduction 11

searcher should be able to replicate this project (time frames notwithstanding) with a reasonable
degree of certainty and accuracy: here they will find the necessary information to do that.
Chapter three furnishes a general socio-geographic-economic [sic] context for the project
through a brief history of the East End, with particular reference to housing and industry which,
between them, have provided the bulk of studio space to artists in the years and decades follow-
ing 1968. Chapters four to seven cover the history of how the East End artists’ agglomeration
came to be. They divide the three decades from 1968 to 1998 into four phases: The Early Years,
1968–1974; a Hiatus, 1975–1980; a period of Consolidation, 1981–1985; and the most recent
phase which has seen The Rise of the Small Independents, 1985–1998. In these four chapters we
listen to the artists as they tell their own stories of how over the last three decades they came to
work in East London, and what it means to them. Although primarily a narrative history, these
chapters also offer a tentative analysis of the underlying mechanisms which characterised and
drove this historical development, and they look forward to the development of the more sub-
stantive theoretical aspects of the project in chapters eight and nine.
Chapter eight breaks with the qualitative approach which has hitherto dominated the the-
sis, and introduces formal social network analysis—the mathematical representation of social
networks. By demonstrating that the “formal” social networks amongst artists’ organisations
and studio blocks are very weak this chapter confirms, as the qualitative evidence previously
presented clearly demonstrates, that it is the “informal” social networks amongst individuals
which are the significant ones, since the system’s behaviour emerges from them. The chapter
also offers a brief survey of some of the ways in which networks have been theorised.
Chapter nine argues that the consequence of this is that the East End artists’ agglomera-
tion can reasonably be conceptualised as an emergent system, and complexity theory and evolu-
tionary theory are combined with extant theories of “creative milieux” to demonstrate how and
why this is the case.
Chapter ten concludes the thesis, summarising the points made in it, reflecting on the re-
search process, suggesting areas for further research, and closing with some anecdotally based
thoughts and observations on the way in which the East End artists’ agglomeration has changed
in the two years since fieldwork was completed, and on what it is likely to do next.
The next two sections of this chapter explore the various definitions of the East End itself,
and the tricky problem of counting the East End’s artists. Section 1.4, the last of this chapter,
outlines the theoretical and methodological approaches to the research.
1.2 Of Meanings and Definitions
Defining the “East End” is not easy. Davies (1990) notes that it has been reckoned to start from
Aldgate Pump; from the junction of Whitechapel Road and Commercial Road; and that it has
been reckoned to comprise the old borough of Stepney. Davies records Geoffrey Fletcher’s ob-
servation that inhabitants of Rotherhithe and Bermondsey south of the river saw themselves as
Introduction 12

East Enders, so these areas should be included; and he records Ashley Smith’s definition of the
East End as being the riverside districts on the north of the Thames (Davies, 1990:6). Davies
himself defines the East End as “the area stretching from Shoreditch and the City in the west to
the River Lea in the east, and from Hackney in the north, to the Thames in the south” (ibid).
Fletcher’s definition, which includes the docklands areas south of the river, is the most ap-
propriate for this project. To an extent, the artists’ East End is defined by the artists
themselves—the edge of the artists’ networks comprising the edge of the East End—but even
then the boundaries are, and must be, blurred. Borough, ward and postcode boundaries could all
be used, and all would be equally arbitrary and, in all probability, inaccurate. The East End’s
boundaries must therefore be considered as “soft” boundaries, and this “East End” includes art-
ists’ studios in the borough of Tower Hamlets, the southern half of the borough of Hackney and
Introduction 13
Dalston
Shoreditch
Bethnal Green
Hackney
Victoria Park
Bow
ClaptonStratford
South Hackney
Wapping
Bermondsey
Rotherhithe
Mile End
Whitechapel
de Beauvoir Town
Isle of Dogs
Poplar
Hoxton
Hackney Downs
London Fields
Greenwich
Shadwell
Limehouse
Figure 1.1 The Study Area
Approx. 1km

the docklands areas of Bermondsey and Greenwich (figure 1.1 below).
Besides the problem of what we mean by the “East End”, we have the more abstract ques-
tion of what we should call this phenomenon: the title plumps for the word “agglomeration”;
this is why.
Various words might be invoked: “community”, “cluster”, “concentration”, “agglomer-
ation”, and other words or phrases which are more specifically geographical, like “neigh-
bourhood” or “quarter”. The word “community” carries considerable intellectual baggage, in-
cluding such unwieldy questions as what we mean by a “community”, and of whether a
“community” is necessarily spatial: besides, the argument which is developed herein is that
there is no “artists’ community” as such. “Neighbourhood” and its synonym “quarter” refer to a
particular locality which can reasonably be defined in terms of the activity going therein. But
the East End has many activities, and to call the East End the “artists’ quarter” or
“neighbourhood” would be no more accurate than calling it the “light-industrial quarter”. That
leaves the other three: although ugly and prosaic, they do at least have the advantage of being
relatively easy to define, referring as they do to specifically spatial attributes. “Cluster” implies
a relatively dense grouping compared with the other two, so that had better be kept for later use.
And of “agglomeration” and “concentration” we can discard the latter by virtue of its implicit
internal uniformity. So we are left with “agglomeration” which although one of the ugliest
words in the English language, is almost ideal for our purposes since it means, according to my
Oxford English Dictionary, to “accumulate in a disorderly way” (Sykes, 1982). That, it turns
out, is precisely what the East End has done with artists, and that is why it is the word chosen
for the title of this thesis. And within this agglomeration, we can talk of smaller, denser clusters
of artists, such as those near Old Street, or Brick Lane.
The Visual Arts—taken here to include painting, drawing, sculpture and installations, both
in and outside a gallery environment—are the primary focus of this study because they com-
prise the oldest and largest artistic presence in the East End. Of course the term “large”, as we
shall see in the next section, turns out to be a matter of interpretation.
1.3 The Legend of Ten Thousand Artists
It is probably best to bring media coverage into this tale sooner rather than later—the media is
also discussed in chapter seven—and there is no better place to start than with how many artists
there are in the East End. The nature of the creative industries generally, and the visual arts in
particular, makes them difficult to quantify, not least because many artists work part time to
make ends meet and are therefore difficult to count. The Independent of 4th December 1990 re-
ported that “London’s East End has the biggest concentration of artists in Europe” (Alberge,
1990), and this assertion continues to crop up in articles nearly a decade later. This may well be
true, but reports in some of the national newspapers (cf Glaister, 1996; Pile, 1996; Walters,
1996) that there are 10,000 artists in the East End of London are much less easy to pin down. A
Introduction 14

brief interview with one of these journalists in 1996, shortly after the appearance of his article,
revealed that he believed this statistic to come from a London Arts Board (1996) report. How-
ever, the journalist could not recollect precisely where in the report it is cited. It will repay us,
then, to have a look at some statistics, and try to separate the rumour from reality.
In fact the London Arts Board’s report was predated by Urban Cultures Ltd’s report
(1994), which offers little in the way of statistics pertaining to visual artists, except to note that
there were 33 “artists organisations” and 105 “artists—commercial and industrial” (Urban Cul-
tures Ltd, 1994:55). The figures from the London Arts Board (1996) are more useful. Their re-
port estimates that there were 23,000 visual artists in the United Kingdom, of whom 6,000 to
8,000 were full time. In London, the LAB put the number of visual artists at 2,500 to 3,000. Art-
ists in “all categories, including graphic and commercial” were reckoned to number 95,640 in
the UK and 26,310 in London (LAB, 1996). In fact, no specific reference is made to the East
End. The phrase “all categories, including graphic and commercial”, needs unpicking too. It is
actually a category referred to in the Arts Council of England’s 1995 report, Employment in the
arts and cultural industries: an analysis of the 1991 census (O’Brien & Feist, 1995). This cate-
gory is defined in the Standard Occupation Classification as SOC 381—artists, commercial art-
ists and graphic designers (ibid:6). This report (p.48) found that there were 25,300 “artists,
commercial artists and graphic designers” in the London Arts Board region—the thirty-two bor-
oughs plus the City—close enough to state with reasonable certainty that in 1991, there were
approximately 26,000 artists, commercial artists and graphic designers in London. What this
statistic does not tell us is how many of those are visual artists, nor does it tell us where in Lon-
don those visual artists are. What the report does tell us (p.50) is that of those “artists, commer-
cial artists and graphic designers”, 47% were employees, 43% were self-employed and the re-
maining 10% were unemployed.
Data for the research presented here was gathered from a variety of sources. The archives
of SPACE Studios (which at the time were about to be catalogued) furnished information about
SPACE’s early studio blocks, as well as lists of participants in Open Studios events (whereby
artists open their studios to the public for a weekend) in the early 1970s. Artists listed as partici-
pants in the biennial Whitechapel Open Studios were also counted. Acme (1995) records num-
bers of artists in Acme studios. Finally, informants were asked during the course of interviewing
how many studios the block had, and whether any are sub-divided, or shared. The reliability of
these sources—and I think they are reasonably reliable—is discussed further in chapter two.
These inquiries established that there were in 1991 approximately 900 artists working in
studio blocks in the East End; roughly a third of London’s visual artists if we accept LAB’s fig-
ures. So we now have the following figures for the number of visual artists in London in 1991:
• Arts Council of England: 25,300 “artists, commercial artists and graphic designers”
(SOC 381) in London;
• of whom 43%, 11,180 were self-employed;
• London Arts Board: 26,310 “artists, commercial artists and graphic designers” in Lon-
Introduction 15

don;
• London Arts Board: 2,500-3,000 full-time visual artists in London;
• Author’s research: 856 studio spaces in the East End (see ch.2, s.2.3.1).
Given that fine artists tend to be self-employed (Honey et al., 1997), it is not unreasonable to
make the tentative suggestion that a large proportion of the Arts Council’s 43% comprises vis-
ual artists. If we argue that say three-quarters of 43% of the 26,000 “artists, commercial artists
and graphic designers” are visual artists, then there were in 1991 approximately 8,400 visual
artists in London. Figures of 100% of 43% and half of 43% would give 11,180 and 5,590 visual
artists respectively. However, if we take the average of the LAB’s figures, 2,750, we find that
this amounts to only 25% of self-employed “artists, commercial artists and graphic designers”
as counted by the Arts Council. The only reliable figure we have for the number of artists in the
East End in 1991 is the author’s own, recording that there were approximately 900 artists in stu-
dio blocks at that time. So where does that leave us?
For a start, these figures put the figure of 10,000 artists in the East End cited above into
some sort of perspective: it appears that there probably were not 10,000 visual artists in the East
End in 1991, at the time of the census, and the growth in the number of studios since then
(discussed below), does not suggest that there were 10,000 in the East End in 1998. Probably
there never have been 10,000 artists in the East End, at least, not visual artists.
There is however a twist. Available statistics cover London as a whole, and simply count-
ing those artists who—apparently—rent out space in studio blocks is not perfectly accurate,
even if it is the best we can do. Studios within blocks may be sub-divided, sub-let or both. Art-
ists may hire out single studios which do not figure in the lists, or they may simply work from
home. These artists are the ones I call “dark matter”, a phrase stolen from astronomy. It refers to
the seventy percent of the mass of the universe of which current theory dictates the existence,
which cannot be seen, and which is subject to constant theoretical scrutiny.
In the same way, while there is broad agreement that these artists exist, they are not read-
ily visible, and estimates of their numbers vary widely from 500 to several thousand. We know
for sure that in 1998 there were some 1400 artists in studio blocks. The question is whether the
“dark matter” comprises a minority or the majority of artists in the East End.
We know already that census data simply puts artists in a Standard Occupation Classifica-
tion SOC 381, artists, commercial artists and graphic designers, which clearly does not give us
an adequately fine-grained breakdown of what does and does not constitute a visual artist. And
of course these data are for 1991, and as we shall see in subsequent chapters, the arts scene in
the East End has changed quite considerably since then.
In other words, all we have to go on are “off-the-cuff” estimates given by interviewees,
based on their own experience and intuition; estimates, furthermore, which vary from a few
hundred (Acme, 1997) to several thousand (Lampert, 1998). And while astronomers have equa-
tions describing the universe from which they can extrapolate the quantity of dark matter in the
universe, we, unfortunately, do not have equations describing the arts scene from which we can
Introduction 16

derive estimates for the quantity of artistic “dark matter”.
The claim in the foyer of the Whitechapel Art Gallery that over 7000 artists live in East
London is thus difficult to pin down, both in terms of numbers and geography. Roughly two
thousand artists submit pieces for the Whitechapel’s biannual “Open Exhibition”, but this is
open to any one who cares to submit their work, be they a full-time professional, or an account-
ant who paints on Sunday afternoons. And the fact that an upper limit of a thousand participat-
ing artists was set for the Whitechapel’s “Open Studios” (whereby local artists open their stu-
dios to the public) makes the point that there is a strong concentration of artists in the East End,
and although this cannot be precisely quantified, we can make some rough calculations which
eloquently pin down the extent of the concentration of London’s artists in the East End.
The East End had in 1991 approximately 900 artists in studio blocks in the East End as it
is defined above. This figure excludes artists working from home, or who have individual stu-
dios. The London Arts Board region has an area of 1578 sq.km. (Llewelyn Davies, 1996), and
the LAB estimates that there were some 2,750 artists in this area, or 1.74 artists per sq.km.. The
East End had 900 artists in an area of approximately 30 sq.km., or 30 artists per sq.km.. In other
words, the concentration of artists in the East End in 1991 was more than fifteen times that of
London as a whole.
Admittedly, the conclusions which can be drawn from the available figures are limited,
but three things seem clear enough. First, there is an unprecedented concentration of artists in
the East End, large enough to draw national media attention. Second, pockets of the East End
have become fashionable, with a consequent increase in interest from property developers, and
rising property prices. Third, the question of how this probably unique phenomenon came to be
needs to be addressed, if we are to learn useful lessons from it. This third question, as we saw
above, is in effect the research question: in the next section we shall take a brief look at how it
was answered.
1.4 Theoretical & Methodological Approach—An Overview
When and how theory makes its real entry into the research process is often masked by the can-
ons of reporting. This is especially so in the constricted format of thesis and dissertation writ-
ing, in which the typically tedious review of the literature in a traditionally perfunctory second
chapter includes an equally tedious recital of “relevant” theory.
(Wolcott, 1995:187)
As we learned in section 1.1 above, this thesis does not have the “literature review” chapter
which is frequently demanded by the (unwritten) orthodoxy. Nonetheless, despite the fact that
the various theoretical and methodological strands are woven into the body of the thesis, ad-
vance warning of what those strands are, where they come in, and how they relate to one an-
Introduction 17

other and indeed to the whole, will help the reader orientate himself for the journey ahead.
This thesis is firmly in the tradition of empirically-grounded research, exemplified most
famously in the work of the Institute of Community Studies (for example Young & Willmott
1957, 1973). It is also a direct descendant of Hall’s (1962) The Industries of London since 1861
and, in a very literal sense, walks much the same ground as did Hall in the late 1950s.
Nonetheless, I did not set out to explore the East End arts phenomenon from a particular
theoretical base, and there is a sense in which this thesis simply tells the tale of a search for
facts, and the subsequent search for a theory which explains them.
First though, we must deal with another question, and it is to do with how our definition
of the “cultural industries” can mediate our theoretical approach. We saw above that disaggre-
gating the visual arts from other forms of artistic practice is no easy task. Visual artists mostly
work in isolation, as this project points out, and as Honey et al. (1997) pointed out in Career
paths of visual artists; this simple fact immediately cuts off certain lines of theoretical enquiry.
Artists are not institutions, even if they work in a studio block—as the majority do—and the stu-
dio blocks are not institutions in any conventional sense either: they do not compete with other
studio blocks for a market, since demand for space outstrips supply; they are not like a company
which is geared to selling products since artists are mostly self-employed and lead often lonely
professional lives; artists do not have to work near an arts shop, and most do not; nor do artists
have to be near their dealer (should they have one). In fact, the kind of overarching “creative
milieu” pinpointed by Anna Lee Saxenian in Silicon Valley (Saxenian, 1994) simply does not
exist in East London, as you will find out in the pages that follow. This fact alone makes it im-
possible to meaningfully theorise in terms of the “new economic geography” of authors such as
Allen Scott or Michael Storper. And as Singh, Tucker and Meinhard (1991:390, emphasis
added) point out, institutional theory is “mainly concerned with how the institutional environ-
ment, comprised of socially created beliefs and cognitions, widely held in society and reinforced
by corporate actors, affects organisations”, so this is not much help either, primarily because the
East End artists agglomeration evolved in an “edge of chaos” environment.
In fact the whole notion of the “cultural industries” is in itself somewhat nebulous; this
study focuses specifically on the visual arts partly for this reason, but also for the reasons set out
in section 1.2 above. Pratt (1997b) has attempted to brings some consistency to the theorisation
of the cultural industries by excluding the visual arts, noting simply that “[c]ultural industries
are broadly defined for the purposes of this paper as music, film, radio and television, publish-
ing and advertising” (Pratt, 1997b:2). These of course are all institutions and perhaps lend
themselves more readily to the type of theoretical analysis pursued by writers on innovative
firms such as Lundvall, Freeman, Gesling, Scott, Storper, Dosi and Pratt himself.
But these writers stress various aspects and facets of the institutional nature of companies,
and comment on how those aspects and facets interact. So Lundvall (1995) highlights the role of
learning and knowledge in economic development, arguing that institutions need to learn if they
are to succeed, a point underpinned by Freeman’s (1995) observation that historically, networks
of scientific and technical institutions in both private and public and sectors have underpinned
Introduction 18

the capacity of an economy to adapt to major changes. Through these networks, argues Free-
man, changes in the institutional framework can be brought about, either through people’s ideas
for improving existing institutions or inventing new ones, or through the failure of existing insti-
tutions to cope with the change and their consequent decline. Gelsing (1995) builds on Mark
Granovetter’s 1973 observation that firms rely on weak ties to gain access to information that
would otherwise be unavailable, a concept encapsulated two decades later in Storper’s slightly
tortuous phrase “untraded interdependencies”. Gelsing also offers an often overlapping two-way
typology of institutional networks: “trade networks”, which are in effect business to customer,
and “knowledge networks” which are geared to the exchange of information rather than goods
(ibid). Dosi argues that innovation is an evolutionary process and Pratt (1997a), extending La-
tour’s (1987) reading of scientific discovery, argues that others have to be convinced of the mer-
its of a new invention for it to become an innovation.
Murdoch (1997) brings us full circle: actor network theory, he observed, argues that
“society” emerges from the networks. In fact, what these commentators all seem to be arguing
—although none makes this particular point—is that the institutional form of an economy is, to
some extent at least, a function of its social networks. To be sure, while such an approach might
prove useful for the “institutionalised cultural industries”, we shall see that it does not in truth
readily lend itself to the conceptualisation of emergent systems such as that with which we are
dealing: this was a case of artists responding to their own immediate needs. It is also worth
making the point that authors such as Freeman, Gelsing, Lundvall, Scott and Storper have
tended to concentrate on high-technology firms, not individual artists.
So while it is true that general concepts such as learning, knowledge and evolution find
their way into this thesis, we should be cautious of assuming the consequence that this literature
is axiomatically relevant to our study. Artists, even if they are a peculiar form of one-person
business, are not companies, and we should not force theories of industrial growth upon them.
The basic “unit of measurement”—with due respect to those about whom I am talking—is the
individual artist.
This thesis, then, is about the commandeering of space by artists. Even so, it would be
perfectly reasonable to conceive of this thesis as the first of a two volume work. The second
would be about the sociology of artists’ networks and the production of the art itself: this possi-
bility is something I shall pursue further in the concluding chapter, under the broad and familiar
heading of “areas of further research”.
Nonetheless, there is a theoretical thread running through this thesis. It was conceived of
as a useful way of conceptualising the East End artists’ phenomenon after the completion of the
fieldwork, and it is only made explicit towards the end of the thesis: however it did inform the
final written version, and runs through the thesis as a sort of loose “sub-plot”. At its heart lies
complexity theory, which argues that certain systems, which comprise individual actors (or
“agents”’ as they are more commonly referred to in complexity theory) called “complex adap-
tive systems”, have emergent properties and evolve as a consequence. I shall argue in chapter
nine that the East End artists’ agglomeration is a complex adaptive system, and draw on estab-
Introduction 19

lished methodological techniques, both qualitative and quantitative, to support this argument.
The core techniques—around which the bulk of this thesis is constructed—have their ba-
sis in grounded theory, which was originally developed in the early 1960s by Glaser and Strauss
(1967), and explored more fully as a distinct approach to qualitative research in Strauss (1987).
The methodological thrust of the grounded theory approach to qualitative data is toward the
development of theory, without any particular commitment to specific kinds of data, lines
of research, or theoretical interests. So, it is not really a specific method or technique.
Rather, it is a style of doing qualitative analysis that includes a number of distinct features,
such as theoretical sampling, and certain methodological guidelines, such as the making of
constant comparisons and the use of a coding paradigm, to ensure conceptual development
and density.
(Strauss, 1987:5)
Grounded theory and the associated fieldwork techniques are explored in more detail in
the next chapter.
The quantitative technique, as noted above, is social network analysis and that is used to
explore the networks amongst artists’ studios and other organisations. As we shall see in chapter
eight, this basically serves to confirm that the organisational networks are weak, and that it is at
the level of the individual that we must seek answers to our questions of how the East End art-
ists’ agglomeration evolved. Actor Network Theory offers a useful linkage with chapter nine
through the notion that society is an emergent phenomenon of the networks which comprise it.
And so we come full circle, back to complexity theory. But before closing this chapter,
and starting on our journey, there is one point that I want to emphasise. It is that of the two ap-
proaches, and I think appropriately for a history, the qualitative techniques are the more impor-
tant: if this thesis has what might be called a “methodological nucleus”, it lies in grounded the-
ory. Through this, we gain the deepest insights into how the East End artists’ agglomeration
came to be; the quantitative techniques then lend formal weight to the qualitative findings, and
allow us to confirm—or otherwise—the validity of some of the hypotheses generated through
the research. So without further ado, we shall turn our attention to those qualitative techniques,
and take a closer look at what Wolcott (1995) called “The Art of Fieldwork”.
Introduction 20

TWO
ON FIELDWORK
…fieldwork can become more artful at the same time [as it becomes more scientific], with the
important reminder that, in its own ways, art is every bit as rigorous and systematic as science.
I do not argue on behalf of a “soft” or “fuzzy” approach to fieldwork, only against a fieldwork
in which there is no allowance for fuzziness or ambiguity. I do argue on behalf of an approach
that keeps humans always visibly present, researcher as well as the researched.
Wolcott, 1995, The Art of Fieldwork, p.15
2.1 When Methodologies Collide
Galaskiewicz (1979:37) notes that there is in social science research considerable leeway al-
lowed in the methodological process, simply so that a methodology appropriate to the research
can be developed. This project draws on four distinct methodological techniques; desktop and
archival research, fieldwork, grounded theory and social network analysis. Sources for archival
materials are listed in the references. Social network analysis, because of its relatively complex
nature, is introduced not in this chapter, but in chapter eight, where it is also applied, and it is
explained in more detail in Appendix Two, Social Network Analysis.
This chapter thus deals primarily with the general methodological approach to the project,
and how the fieldwork was carried out. It is worth reiterating the point made in the first chapter
that one of the aims of this chapter is to render the research process transparent enough for a re-
searcher to replicate the work described herein reasonably closely and confirm (or otherwise)
the findings. Section 2.2 therefore explores theoretical and practical approaches to qualitative
research and fieldwork, concentrating on grounded theory and ethnographic techniques, but also
introducing an autobiographical element. Section 2.3 defines the population boundaries, and
section 2.4 explores the mechanics of the interview process. Section 2.5 summarises the chapter
and explains how the various methodological components are combined in the remainder of the
thesis.
On Fieldwork 1

2.2 The Art of Fieldwork
2.2.1 The Problems Outlined
The title for this section is taken from Wolcott’s (1995) book of the same name, and neatly
sums up the fact that ethnographic studies of social systems can never be exact. As the opening
quote makes clear, Wolcott does not argue that fieldwork is an Art, but rather that it should be
more artful, and that the human element in fieldwork should not be kept hidden in deference to
(rather disingenuous) objectivity.
Wolcott also observes that fieldwork is becoming “more scientific” a view based largely
on the increasing use of computers in social science which, capable of processing large quanti-
ties of data in relatively short periods of time, will tend to trade depth for breadth, and render
fieldwork a data-driven activity (ibid:72). The risk, he argues, is that fieldwork—and by that he
is thinking primarily of “participant observation”—will be replaced by simple “data-gathering”
(ibid). And, as he observes, “fieldwork takes time” (p.77).
It is with these ideas in mind that I have pursued my own studies of the artists’ agglom-
eration in London’s East End. But before exploring the purely practical issues of the project,
there are certain methodological ghosts to be laid to rest. These are the questions of objectivity
versus subjectivity, whether qualitative data, like quantitative data, can be subjected to genu-
inely rigorous interrogation and the results presented accordingly, and whether these apparent
opposites should be set against one another in the first place. This section, and indeed this the-
sis, argue that they absolutely should not be set against one another, but rather that each of the
two pairings is a side of the same coin. We shall deal first with the question of “objectivity ver-
sus subjectivity”.
2.2.2 Objectivity versus Subjectivity: the Question of Bias
It is hard to sustain convincingly the notion, proposed by Lorenz (1950:232, cited in Wolcott
1995:163) that:
It is an inviolable law of inductive science that it has to begin with pure observation, to-
tally devoid of any preconceived theory and even working hypotheses.
Beer (1973:49, cited ibid:164) dismisses this view as the “doctrine of immaculate perception”
noting Karl Popper’s observation that “preconceived theories or working hypotheses must al-
ways be involved in scientific observation to enable the scientist to decide what is to count as a
fact of relevance to his investigation”.
However, Popper’s “preconceived theories” and “working hypotheses” are, at the begin-
ning of this project at least, nothing more than that. That is because this project has its basis in
grounded theory (examined more closely in sections 2.2.3 and 2.2.4). Grounded theory, as we
saw in the previous chapter, has its origins in the 1960s, and is a technique which aims to lend
On Fieldwork 2

rigour and consistency to qualitative, fieldwork-based research. Strauss notes that:
…while much research involves routine operations and can at times be boring, assuredly
also at its most creative, it is exciting, fun, challenging, although sometimes extremely
disturbing and painful. This means that researchers, as workers, can and should care very
deeply about their work—not being simply possessive about its products or jealous of their
research reputations, but find deep and satisfying meaning in their work.
In short, the researcher, if more than merely competent, will be “in the work”
—emotionally as well as intellectually—and often will be profoundly affected by the expe-
riences engendered by the research process itself.
(ibid:9–10)
This of course raises the whole question of whether a researcher who is “profoundly affected by
the experiences engendered by the research process” can ever be objective. And Robinson
(1998:425) points out that such an approach is furthermore open to the criticisms that in relying
on the researcher’s powers of observation, and skills in selection, it is neither replicable nor un-
biased, nor if it concentrates on a small-scale social setting, is it well-suited to developing gen-
eralisations. But he adds that such charges—in essence that the research lacks external
validity—would seem to point to the adoption of a more positivist approach, an approach from
which participant observation aims to move away (ibid:425). Wolcott’s way out of this di-
lemma is to accept the existence of bias as inevitable, and to argue that far from guarding
against bias, we should regard it as something we cannot do without. The important thing is to
be aware of its existence, “not to deny bias or pretend to suppress it, but to recognise and har-
ness it” (Wolcott 1995:164–165). An extreme example of “bad bias” might be when we reach
conclusions about outcomes before carrying out any investigation, or the assumption that a par-
ticular topic should be approached from a specific theoretical angle. But “neutrality” may be no
more helpful in carrying out research, as Jacobs (1977) discovered during fieldwork for a study
of prison life, when in attempting to be neutral, he alienated himself from the white section of
the prison population, who then ceased to be useful informants.
The role of bias then, should be to “stimulate enquiry without interfering in the investiga-
tion” (Wolcott, 1995:164). Conceptually, this means adopting an approach of “disciplined sub-
jectivity” (Erickson, 1984:61). In practice, as Whyte (1984) has demonstrated in his work, the
result will be a “melding of subjective and objective components in the research and a two-way
flow between researcher and researched through which the researcher learns about both the ob-
ject of study and themselves at the same time” (Robinson, 1998:424).
Strauss refers to the data gathered through this process as experiential data:
Experiential data are essential data, as we shall see, because they not only give added theo-
retical sensitivity but provide a wealth of provisional suggestions for making comparisons,
finding variations, and sampling widely on theoretical grounds. All of that helps the re-
On Fieldwork 3

searcher eventually to formulate a conceptually dense and carefully ordered theory. The re-
searcher’s will not be the only possible interpretation of the data (only God’s interpretations
can make the claim of ‘full completeness’), but it will be plausible, useful, and allow its
own further elaboration and verification.
We should add that the mandate to use experiential data gives the researcher a satisfying
sense of freedom, linked with the understanding that this is not a license to run wild but is
held within bounds by controls exerted through a carefully managed triad of data
collection/coding and memoing. This triad serves as a genuinely explicit control over the
researcher’s biases.
(Strauss, 1987:11)
The question of bias, then, cannot be avoided, but it can be addressed, and it is time to do
so in the context of this project.
The choice of subject—artists in the East End—was my own. At a personal level, it was
derived from an interest in the history of the East End, and an interest in art, in terms of both
making and viewing it. As a resident (at the time of writing) of the East End, who holds a genu-
ine affection for the place, and as someone who believes very strongly in the value of art to so-
ciety, I can hardly claim to be a neutral observer, indifferent to his subject except insofar as it
provides data. And in order to get closer to my subject, I became involved with a project run
through Chisenhale Studios to develop a formal web-based information network for artists in
the East End, subsequently christened Vision in Art (ViA). My involvement with this project is
discussed in section 2.2.5 below. For all that, as we saw in chapter one, there are sound research
reasons for carrying out a project of this nature, primarily in terms of getting a better under-
standing of the underlying dynamics and motivations of those involved in such a phenomenon.
The question of bias in this project then, has been addressed from within a framework of
Erickson’s (op cit) “disciplined subjectivity”, primarily by taking what informants say at “face
value” and by the use of extended quotations taken directly from the transcripts of the tape-re-
corded interviews. This way, informants are able to speak for themselves rather than be subject
to the researcher’s paraphrasing what they have said. Such an approach also gives the reader the
opportunity to examine the writer’s interpretation against what the respondents actually said.
The researcher’s task then, in terms of telling a historical story, is to put what the informants
say in a broader historical context, and to make conceptual links which can be developed at a
more theoretical level. This is done through the use of coding, a technique developed in
grounded theory. And it is to the substantive aspects of grounded theory that we now turn.
2.2.3 Grounded Theory—The Analysis of Qualitative Data
Grounded theory, like any other scientific analysis, has its basis in data which first has to be
gathered, then analysed. Grounded theory has three aspects of inquiry: induction, deduction and
verification (Strauss, 1987:11). We shall begin by looking at how each of these three aspects
On Fieldwork 4

has informed this project.
Induction comprises “the actions that lead to discovery of an hypothesis” (ibid). Such ac-
tions could be intuitive “hunches” provoked by previous experience or knowledge (ibid:12).
However, Miles and Huberman (1994:17) argue that if a loose or unstructured research design
is adopted, so that hypotheses are discovered during the course of data gathering, there is a limit
to which induction can be a useful research tool, noting Wolcott’s (1982:157) observation that it
is “impossible to embark upon research without some idea of what one is looking for and fool-
ish not to make that quest explicit”. But in the first instance, induction is the only means of gen-
erating hypotheses.
In this project then, induction was used to generate the initial research objective set out in
chapter one. For the sake of clarity it is repeated here:
To map and describe the development of visual artists’ studio organisations in the East End.
The roles of deduction and verification are rather clearer, based as they are on the widely
accepted view that conclusions are deduced from data. However, as research has continued, so
new theoretical positions have been explored which take the available data and subject it to new
hypotheses, which can then be tested against further data in a process of verification. Chapter
nine, which attempts to develop a theoretical model for the dynamics of the East End artists’
phenomenon, was developed precisely along these iterative lines, whereby chaos/ complexity
theory—originally explored as an interesting and potentially useful avenue—was used to gener-
ate further hypotheses which could then be tested using data both historical and gathered from
the field. But this is of course qualitative data, and to test it effectively, we must analyse it con-
sistently.
2.2.4 Grounded Theory—The Coding Paradigm
Importantly, grounded theory offers a way of analysing qualitative data systematically, consis-
tently and transparently, and so enables the development of theory which can be understood and
interrogated:
Grounded theory is based on a concept-indicator model, which directs the conceptual coding
of a set of empirical indicators. The latter are actual data, such as behavioral actions and
events, observed or described in documents and in the words of interviewees and informants.
These data are indicators of a concept the analyst derives from them, at first provisionally
but later with more certainty
(Strauss, 1987:25).
Strauss (1987:17-19) lists eight points to consider in the process of qualitative analysis:
On Fieldwork 5

• the raising of generative questions which make it possible to consider hypotheses, con-
cepts and so forth;
• the discovery of putative linkages amongst the concepts;
• the verification of theory through the gathering of new data;
• the relevance of coding to the real world of data;
• the integration of theory in terms of linkages, core concepts, categories and so forth;
• the continuous generation of memos to assist in keeping track of evolving ideas and
theories;
• the recognition of the temporal and relational aspects of the coding paradigm triad
which comprises data collection, coding and memoing (discussed below).
• during writing, the need for additional integration.
(Strauss, 1987:17–19)
The basic model for doing this is an iterative process of data collection, coding and memoing
(figure 2.1).
Data collection through interviews is discussed in section 2.4 below, so we shall move
straight to coding. This is an essential procedure, and Strauss (1987:27) suggests the following
coding paradigm, whereby phenomena are referenced as falling under one of four headings.
On Fieldwork 6
Data Collection Coding Memoing
PHASE OF RESEARCH
Figure 2.1Coding Paradigm (Strauss, 1987:19)

They are:
I. Conditions
II. Interaction among actors
III. Strategies and tactics
IV. Consequences
These four categories are used in this project, and through open coding, the data is broken down
into sub-categories more specific to the research questions (see figure 2.2 overleaf for an ex-
ample of a coded interview page). Open coding is the initial coding procedure, when concepts
and dimensions which seem to fit the data are extracted, and used as a “springboard” from
which further, more focused coding can be done (ibid:28, 63). Open coding of the data sug-
gested that the four categories could be be broken down into sub-categories, the generation of
which allowed coding to proceed to selective coding, whereby coding is limited to these sub-
categories. The sub-categories are:
I. Conditions
• the need for workspace
• lack of income
• cheap rents
II. Interaction among actors
• word of mouth/“grapevine”
• independence as organisational units
• Open Studios
III. Strategies
• charitable status
• “just getting on with it”
IV. Consequences
• organic, artist-led growth
As these sub-categories were teased out of the data, so it became apparent that one core cate-
gory was emerging: the organic growth of the networks. This core category enables the laying
of foundations for a general theory of the historical dynamic of the growth of the East End art-
ists’ agglomeration, a theory which is developed more fully in chapter nine.
As coding proceeds theoretical memos are generated. These are notes of linkages and
concepts which may contribute to the development of theory later in the research process; they
are continually refined and updated during the course of the project, through to writing up.
On Fieldwork 7

On Fieldwork 28
Figure 2.2 An example of an interview, written-up and then coded for themes. The section marked !good anecdote" is used later in the dissertation.

In the report itself, these codes and sub-categories emerge first as themes within the historical
narrative, and subsequently as an armature about which a conceptualisation of the problem can
be developed. Thus as the research process moves from concrete to abstract, so too does the re-
port.
2.2.5 The ViA Project
Necessarily autobiographical, this section deals briefly with my involvement in a project to de-
velop a formal network for East End artists which, about a year into its existence, was chris-
tened Vision in Art.
The project itself was the brainchild of the part-time Education Officer at Chisenhale Stu-
dios (five minutes’ walk from my home) called Aileen Ryan. The free local newspaper, East
End Life, published by the London Borough of Tower Hamlets, drops onto my doormat once a
week, and I usually scan it briefly, looking for items of interest. About a year and a half into the
project, once I was comfortable with the topic, research questions and methodology, but before
I had started formal interviews, I decided that as part of the research I should volunteer to help
in a project connected with the East End arts scene, as a means of “getting under the skin” of
my subject. This approach was very much in the spirit of “participant observation” common in
ethnography in the work of social scientists such as William F. Whyte and Michael Agar (to
name just two practitioners), although my involvement has been less “immersive” than theirs.
Ryan had written a short article for East End Life which appeared in Autumn 1997, asking for
help with a project she was trying to get off the ground. I volunteered to help, attending meet-
ings, and helping Ryan develop her ideas, and at the same time gaining insights about who the
“movers and shakers” are, the way in which artists work, rumours which circulated within the
art scene, and other “inside information”. Much of this cannot be used directly since it is “off
the record”, coming under the general heading of “clandestine observation” (Wolcott,
1995:151) but such information is nonetheless useful in that it contributes to the understanding
of the dynamics, and thence in the conceptualisation process.
At the end of 1998 ViA organised a conference titled “Your Forum” which, as the name
suggests, put the idea of an East London web-based arts network to the “artistic community”.
The project was broadly welcomed as a useful initiative which could plug many of the holes left
uncovered by the informal networks which have developed over the years.
2.2.6 The Art of Fieldwork—Discussion
It is clear enough that fieldwork, like any other research, is not simply a matter of pure and ob-
jective observation. Rather, it is a somewhat immersive, iterative process, mediated by the ob-
server’s own preoccupations and interests. Indeed, compared with the strictly followed and re-
corded research protocols found in the natural sciences, fieldwork is a messy process which can
all too easily lack transparency.
On Fieldwork 9
It is this lack of transparency which grounded theory attempts to address, simply by
adopting a defined and systematic approach to data collection and analysis. This is important,
for it means that, timeframes aside, a researcher wishing to verify or challenge the findings of
this research has the information necessary to repeat the “experiment” described herein reasona-
bly accurately. One of the first questions this researcher might ask is who they should talk to.
The next section addresses that question.
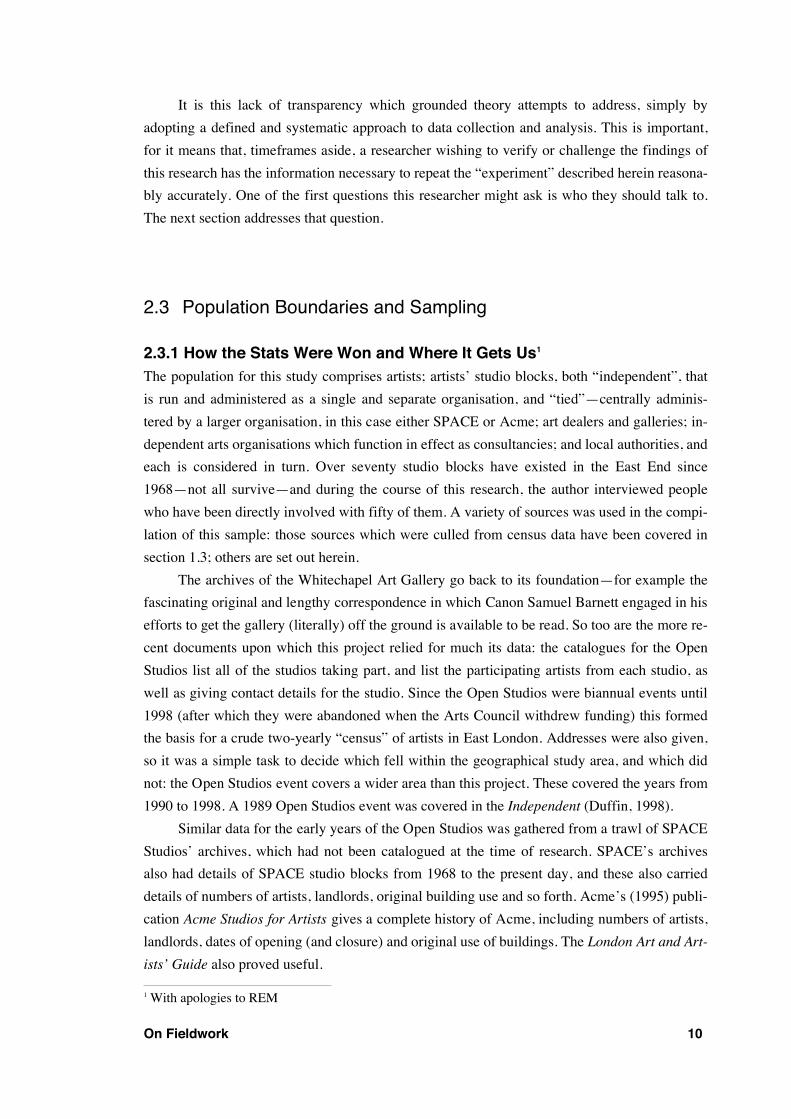
2.3 Population Boundaries and Sampling
2.3.1 How the Stats Were Won and Where It Gets Us1
The population for this study comprises artists; artists’ studio blocks, both “independent”, that
is run and administered as a single and separate organisation, and “tied”—centrally adminis-
tered by a larger organisation, in this case either SPACE or Acme; art dealers and galleries; in-
dependent arts organisations which function in effect as consultancies; and local authorities, and
each is considered in turn. Over seventy studio blocks have existed in the East End since
1968—not all survive—and during the course of this research, the author interviewed people
who have been directly involved with fifty of them. A variety of sources was used in the compi-
lation of this sample: those sources which were culled from census data have been covered in
section 1.3; others are set out herein.
The archives of the Whitechapel Art Gallery go back to its foundation—for example the
fascinating original and lengthy correspondence in which Canon Samuel Barnett engaged in his
efforts to get the gallery (literally) off the ground is available to be read. So too are the more re-
cent documents upon which this project relied for much its data: the catalogues for the Open
Studios list all of the studios taking part, and list the participating artists from each studio, as
well as giving contact details for the studio. Since the Open Studios were biannual events until
1998 (after which they were abandoned when the Arts Council withdrew funding) this formed
the basis for a crude two-yearly “census” of artists in East London. Addresses were also given,
so it was a simple task to decide which fell within the geographical study area, and which did
not: the Open Studios event covers a wider area than this project. These covered the years from
1990 to 1998. A 1989 Open Studios event was covered in the Independent (Duffin, 1998).
Similar data for the early years of the Open Studios was gathered from a trawl of SPACE
Studios’ archives, which had not been catalogued at the time of research. SPACE’s archives
also had details of SPACE studio blocks from 1968 to the present day, and these also carried
details of numbers of artists, landlords, original building use and so forth. Acme’s (1995) publi-
cation Acme Studios for Artists gives a complete history of Acme, including numbers of artists,
landlords, dates of opening (and closure) and original use of buildings. The London Art and Art-
ists’ Guide also proved useful.
1 With apologies to REM
On Fieldwork 10

Non-documentary sources augmented those set out above. Contacts made through my in-
volvement with ViA proved useful, and of course information about the history of studio blocks
was gathered in the interviews. As ever in a project such as this, the final source of information
relied on shoe leather, coffee shops, the occasional pub, and the evidence of one’s own eyes and
ears: my own professional background, the restoration of historic buildings, also proved useful
here, particularly in determining ages and uses of buildings. Although parts of the study area
were already known to me, others were not, and naturally enough I visited all of the studio
blocks, if only to see what they looked like, and their local context.
My belief is that the data set gathered is, on the whole, reliable and if not exhaustive,
then certainly the best we have. Even so, the fluid nature of the artists’ agglomeration means
that no data set can be perfect, and here I want to touch on ways in which this data set might fall
short. First, and most important, is the issue of “dark matter” mentioned in section 1.3: subdi-
vided studios, two or three person studios which keep themselves to themselves, or artists who
work from home for example. Recall that I referred to these artists as “dark matter” because,
like its astronomical namesake, its existence is generally accepted, but cannot be measured: es-
timates, or rather guesses, varied from 300 to 7000. My own view, based on anecdotal evidence
gathered in the course of research, is that for the period covered by the project at least, the lower
figure is more likely than the higher. The second, lesser, issue is that not all artists participate in
Open Studios events, but figures for artists in studios as listed in the Whitechapel Art Gallery
catalogues were generally consistent from one event to the next, and this is of minor importance
compared to the “dark matter”. The data set for studio types and ages is presented in Table 2.1
overleaf.
2.3.2 Artists
Each of the forty “independent” studio blocks is administered by a working artist. If each of the
“independent” studio blocks is interviewed, it follows that not only has each of the blocks been
interviewed in its capacity as an “arts organisation”, but each of the forty artists who serve as
administrators for the studio block has also been interviewed. A similar approach was adopted
by Galaskiewicz (1979) who, in his study of the exchange networks of a medium-sized town in
the United States, chose to interview the highest ranking executive officers of his selected or-
ganisations (Galaskiewicz, 1979:45).
The geographical area is itself finite, and so of course are the numbers of artists’ studios,
arts organisations and other actors within this area. Although there are, as we saw in chapter
one, 1400 artists in the East End at the very minimum, there were, at the end of 1998, roughly
sixty studio blocks, of which approximately twenty are administered by either Acme or SPACE,
leaving some forty “independent” studio blocks. SPACE and Acme are easy enough to pin
down, and, like most of the “independent” studio blocks are artist-led—established and run by
artists for artists.
On Fieldwork 11
Table 2.1 (overleaf) Original uses and ages of buildings converted to artists! studio blocks, 1968 to 1998. Sources: Whitechapel Gallery archives, SPACE archives, Acme, 1995, author!s fieldwork.

On Fieldwork 12
St Katharine!s Dock "68–!71 1826 WarehousesRavenscroft Studios !70–date mid 19th c. Furniture FactoryButlers Wharf Studios !71–!80 19th c. Warehouses45/47 Tabernacle St. !71–!86 ??19th c.Martello Street !71–date Clothing Factory71 Stepney Green !71–date SchoolBarbican Arts Group !72–!88 Light industrialOld St Patrick!s Sch., Buxton St. !72–date mid 19th c. School124-130 Tabernacle St. !73–!79 ??19th c.Acme Short Life Housing !73–!81 late 19th c. HousingBeck Road early !70s on late 19th c. (Short-life) housingNew Crane Wharf !74–!84 19th c. WharvesNew Crane & Metro! Wharves !74–!86 19th c. WharvesBombay Wharf !74–!90 late 19th c. Spice Warehouse
Metropolitan Wharf !79–!89 19th c. Wharves/Warehouses
Chisenhale Studios !80–date late 19th c. Veneer FactoryBelsham Street !81–!93Milbourne Street !81–dateBonner/Robinson Road !81–date mid 19th c. Brush FactoryRichmond House !82–dateOld Ford Studios !83–!85 late 19th c. HousingBrittania Works !83–dateOrsman Road Studios !83–date 1920s Players Cigarette FactoryWinkley St. !84–!93Fawe Street Studios !84–date Early 20th c. Canned Pet Food factoryCable Street Studios !84–date mid 19th c. Sweet Factory
Vyner Street Studios !85–!92Victor House !85–dateCarpenters Road !85–date 1930s Yardley Cosmetics FactoryHanbury Street Studios !85–date 19th c. Weavers! Houses?Delfina Studios !87–date Clothing factoryNew Hoxton Workshops !87–date 19th c. light-industrialPixley Street Studios !88–!97 early 20th c. light industrialMT Studios !88–dateDeborah House !88–dateChilton Street !89–!90 19th c. light industrialMaryland Studios !89–date Clothing factoryB.A.G. Hertford Rd. !89–date ?? Early 1950s Light industrialBalls Pond Studios !89–!98 1989 Purpose-built ceramics studiosRufus Street Studios !89–date ??19th c. warehouses
Cooperage Studios !91–!92Limehouse Arts Foundation !91–dateSouthgate Studios !91–date 1920s/30s light industrialTeesdale Street Studios !91–dateCopperfield Road !92–!94 1920s Warehouse (Regents Canal)Bombay Wharf !92–!96 19th c. Spice WarehouseSpitalfields Studios !92–!98 late 19th/1920s/50s Fruit & Veg marketEastway Baths !92–date ? late 19th c. Public BathsCopperfield Road !92–date 1920s Warehouse (Regents Canal)Red Door Studios !92–date 19th c. police st!n (& sewing machine factory)Columbia Road (Ezra St) !93–!94 19th c. light industrialBrick Lane Studios !93–date 18th/19th/20th c. Truman!s BreweryCommercial Road Studios !94–date 1920s Garment Trade PremisesStandpoint Studios !94–date Early 20th c. PrintworksWestland Place Studios !94–date late 19th c. wharves/warehousesWharf Studios !94–date mid/late 19th c. Print works
Oxford House !95–datePanchayat !95–dateTurquoise Arts Group !95–dateEastway Laundry !96–date ? late 19th c. Public LaundrySara Lane Court !96–dateBirdcage Studios !96–date 19th c. ?? HousingBow Arts Trust !96–date late 19th/early 20th motorcycle workshopsCity Studios !96–date 1920s warehousesFlorence Trust !96–date 1866 ChurchUnderwood Arts !96–date 1920s warehousesArbutus Studios !97–dateBaches Street Studios !97–dateSpitalfields Farm Studios !97–date ? = author!s estimate

2.3.3 Art Galleries
With three exceptions, all of the art galleries based in the East End at the end of 1997 were in-
terviewed. The Whitechapel Art Gallery, one of three publicly funded galleries in the area,
stands out from the others by dint of its size, its age, and the fact that until 1998, when the Lon-
don Arts board withdrew funding, the Whitechapel acted as a focus for the East End artists’ ag-
glomeration through its organisation of the biannual Open Studios.
The director, Catherine Lampert, was interviewed, since as director she is best placed to
offer an accurate overview of the Gallery’s position in the East End. This reflects Galas-
keiwicz’s (1979) approach to interviewing executive officers in corporate organisations.
The three which were not interviewed all declined on the grounds of “lack of time”, and
their histories and the parts they played in the development of the East End arts scene have been
constructed from written material, supplied in some instances by the galleries themselves, and
most often from magazine and newspaper articles. As with all histories which rely on journalis-
tic sources, they should be treated with some circumspection, although where these galleries
have been quoted in articles, and that quote is relevant to the history, it has been reproduced to
lend an element of continuity to the narrative.
2.3.4 Local Authorities
Although establishing which local authorities cover a particular geographical area is not diffi-
cult, finding out who to interview is. One can start by telephoning the “arts department” and
asking to speak to the person in charge, but the nature of a local authority’s involvement in the
arts is such as to require input from several different departments. A public art project involving
a local school may for example involve the local authority’s departments of art, planning and
education. If the project were near a boundary with another borough, then departments from
both local authorities may become involved.
A sampling technique loosely based on snowball sampling (see ch.8, s.8.3.2) was there-
fore adopted, whereby the interviewee in the arts department (the stage one sample) was asked
to name other significant actors. This generated a stage two sample. The stage three sample,
generated in the same way, tended to comprise actors in the samples for stages one and two,
bringing the sampling process full circle. Confirmation of the relevant actors within the local
authorities was quite frequently provided by other interviewees who, unsolicited, offered names
of the people within their local authorities whom they believed to be important actors.
As is noted in section 8.3.2, the snowball technique was eventually abandoned as a rigor-
ous sampling technique, except as a means of tracing potential interviewees.
On Fieldwork 13
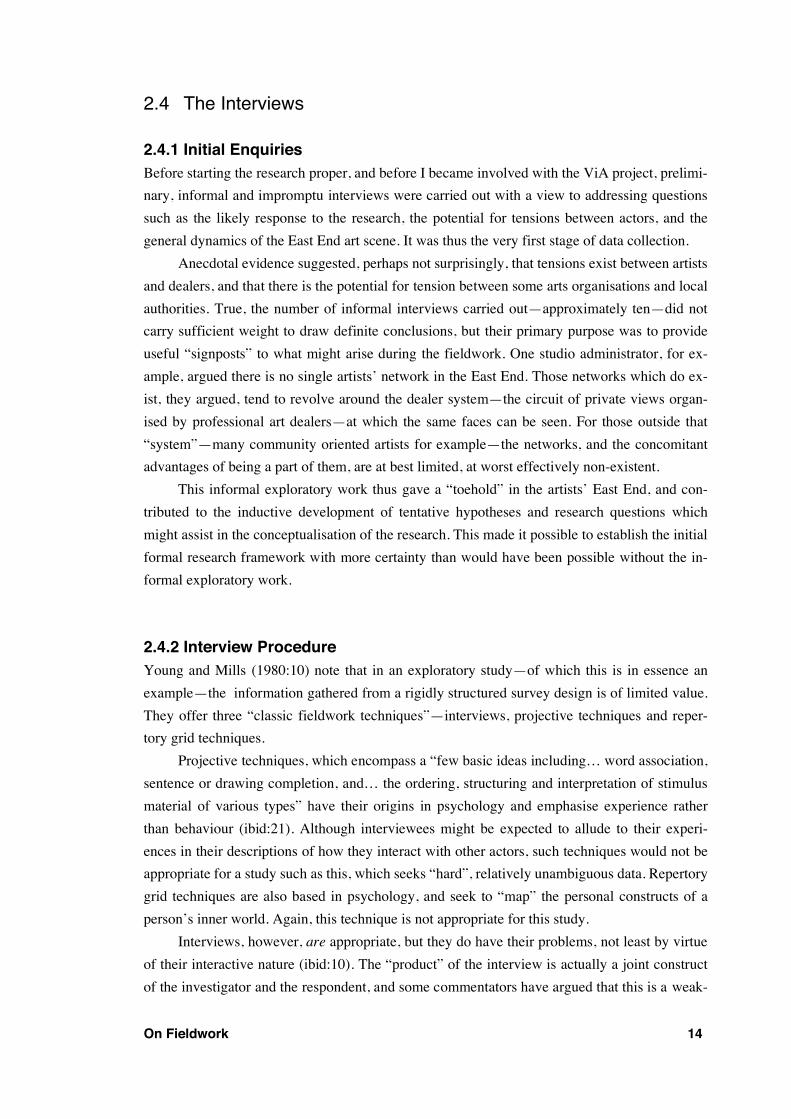
2.4 The Interviews
2.4.1 Initial Enquiries
Before starting the research proper, and before I became involved with the ViA project, prelimi-
nary, informal and impromptu interviews were carried out with a view to addressing questions
such as the likely response to the research, the potential for tensions between actors, and the
general dynamics of the East End art scene. It was thus the very first stage of data collection.
Anecdotal evidence suggested, perhaps not surprisingly, that tensions exist between artists
and dealers, and that there is the potential for tension between some arts organisations and local
authorities. True, the number of informal interviews carried out—approximately ten—did not
carry sufficient weight to draw definite conclusions, but their primary purpose was to provide
useful “signposts” to what might arise during the fieldwork. One studio administrator, for ex-
ample, argued there is no single artists’ network in the East End. Those networks which do ex-
ist, they argued, tend to revolve around the dealer system—the circuit of private views organ-
ised by professional art dealers—at which the same faces can be seen. For those outside that
“system”—many community oriented artists for example—the networks, and the concomitant
advantages of being a part of them, are at best limited, at worst effectively non-existent.
This informal exploratory work thus gave a “toehold” in the artists’ East End, and con-
tributed to the inductive development of tentative hypotheses and research questions which
might assist in the conceptualisation of the research. This made it possible to establish the initial
formal research framework with more certainty than would have been possible without the in-
formal exploratory work.
2.4.2 Interview Procedure
Young and Mills (1980:10) note that in an exploratory study—of which this is in essence an
example—the information gathered from a rigidly structured survey design is of limited value.
They offer three “classic fieldwork techniques”—interviews, projective techniques and reper-
tory grid techniques.
Projective techniques, which encompass a “few basic ideas including… word association,
sentence or drawing completion, and… the ordering, structuring and interpretation of stimulus
material of various types” have their origins in psychology and emphasise experience rather
than behaviour (ibid:21). Although interviewees might be expected to allude to their experi-
ences in their descriptions of how they interact with other actors, such techniques would not be
appropriate for a study such as this, which seeks “hard”, relatively unambiguous data. Repertory
grid techniques are also based in psychology, and seek to “map” the personal constructs of a
person’s inner world. Again, this technique is not appropriate for this study.
Interviews, however, are appropriate, but they do have their problems, not least by virtue
of their interactive nature (ibid:10). The “product” of the interview is actually a joint construct
of the investigator and the respondent, and some commentators have argued that this is a weak-
On Fieldwork 14

ness, since it fails to attain absolute neutrality and objectiveness, even if all the questions are
closed, and variability is minimised (ibid:11). What tends to happen is that the respondent gives
an “interview induced reflection, whereby the interview situation itself invokes responses or
views which were previously unrecognised by the respondent” (ibid). Further, both respondent
and interviewer will carry preconceptions which shape their attitudes towards one another. So:
…the background characteristics of each participant in the interview have additional im-
portance because they provide cues for the other participant. Certain attitudes, motives, and
stereotypes are triggered in the respondent’s mind by his perception that the interviewer
possesses certain background characteristics. The interviewer may be influenced in the same
fashion by his initial perceptions of the respondent. Such reactions may in turn influence
the behaviour of both participants.
(Cannell & Kahn, 1968, quoted in Young & Mills, 1980:11)
However, the interactive nature of the interview can be turned to advantage if the interview be-
comes a genuinely two-way process in which information is shared (ibid:13). In fact, some
commentators argue that the quality of information gained in an interview can be improved if
this approach is adopted (ibid). Thus the impossibility and indeed pointlessness of eliminating
the interpersonal effects in an interview mean that the better strategy is to seek to manipulate
the variables within the interview format to achieve the most satisfactory result (ibid).
The interviews for this project were, unless noted otherwise in the list of informants, tape
recorded at the respondent’s place of work. Prior to the interview, the approach was as follows.
First, the respondent was telephoned and asked if they would like to take part in the project,
which was briefly described to them. The respondent was then sent a copy of the questionnaire,
the project abstract and a covering letter explaining that the interview would be tape-recorded,
that they could if they wished remain anonymous, and roughly how long the interview would
take. This time was usually over-estimated rather than under-estimated so that during the inter-
view, the respondent would not feel rushed. The letter was then followed up with a further tele-
phone call to make an appointment for the interview.
The interview itself was kept as informal and relaxed as possible. The tape-recorder had a
separate desktop microphone about the size of a small paperweight, designed specifically for re-
cording group discussions. This was placed in the centre of the table, and the tape recorder it-
self, although quite small, was placed to one side, along with spare tapes and batteries, out of
the way. Generally, the respondent offered a cup of tea or coffee (always gratefully accepted!),
which helped “break the ice”, and over which I briefly described the project, explained what I
hoped to get out of the interview, and showed some examples of work I had already done on the
project. During the interview, I sat with a pad in my lap, with the questionnaire hand-written on
one page. If the respondent drifted away from the questionnaire, they were allowed the freedom
to do so. When they had finished making their point, the questionnaire sequence was simply re-
sumed. Quite often, such points were “off the record”, and somewhat political, or even personal
On Fieldwork 15

in nature. The insights gained through such comments are only indirectly of use; they serve
more to relax the general tone of the interview, and allow the interviewer to probe more deeply,
and the respondent to speak more frankly.
The questionnaires (see Appendix One) were divided into four parts. The first part ex-
plored the history and philosophy of the particular organisation—how and why it came in to be-
ing, while part two explored the administrative structure of the organisation. The first two sec-
tions were in effect historical research, and therefore discursive in approach. Section three gath-
ered information about each organisation’s linkages with other organisations. They were asked
to give a numerical indicator of the strength of the relationship for the formal social network
analysis (although see chapter eight for a full explanation), and to describe the relationship: why
it is important, or unimportant; the form which the relationship takes—for example a relation-
ship between a local authority and an arts group will be different from that between the arts
group and another arts group; the length of the relationship, how it has changed over time, and
whether it has the potential to develop further. By gathering such information, the expressed nu-
merical values are elucidated, and thereby put into a dynamic and historical context. Equally,
the qualitative findings can be further explored in the light of the quantitative data. The fourth
and final section of the questionnaire gave the respondent the opportunity to add their own com-
ments, observations and prognosis for the East End as an “artistic enclave”. This fourth section
thus enabled the respondent to offer their views on what they perceived to be the important fac-
tors in the “artistic” East End.
2.6 Summary
The methodological approach is presented graphically in figure 2.3 (p.38), and this diagram
serves as a simple map of the territory to be explored. The process presented has been adopted
because it makes possible the integration of the historical facts and the evolutionary dynamic of
its subject. It has three “lines of attack”: two—desktop and archival research, and grounded
theory—have been covered here; the third—social network analysis—is dealt with in chapter
eight (also see Appendix 2). The latter two are pursued through interviews, for at present the
history of the East End arts scene is, with the exception of a few magazine and newspaper arti-
cles, primarily oral; the desktop and archival research has assisted in the tracing of the develop-
ment of artists’ studio blocks, and in setting out the historical contexts within which that devel-
opment took place.
The interviews have thus served to provide data on both the historic development of the
studios, and on the nature of the social networks which exist amongst artists in the East End, al-
though, as chapter eight will show, those networks often prove too fine to be readily visible.
Grounded theory enables the development of both a historical narrative and of theory
through the systematic analysis of qualitative data gathered from the interviews. The data analy-
sis is systematised through a “coding paradigm”, comprising data collection, described above,
On Fieldwork 16

coding the data into categories which can be developed as narrative themes in the writing-up
process, and theoretical memoing, whereby categories emerging in the coding process are con-
ceptualised and combined in an iterative process to generate theory.
Social network analysis takes data gathered in interviews to develop formal models of the
social networks amongst art organisations. This aspect of the project is discussed in detail in
chapter eight.
The theories generated through grounded theory are then combined in chapter nine with
the findings of the social network analysis, extant theories of “creative milieux” and
chaos/complexity theory to develop a theoretical model of the artistic networks in London’s
East End. Before we move to the substantive history though, we shall look briefly at the history
of the East End in the years leading up to the influx of artists.
On Fieldwork 17

On Fieldwork 18
Figure 2.3 The Methodological Process
Interviews
Grounded Theory
Datacollection
Coding
Memoing
Historical Narrative
Social Network Analysis
Theories of !Creative Milieus" Complexity Theory
Theoretical Model
Desktop/Archival Research
Data Collection
Data analysis
Existing The-ory
Outcomes

THREE
EAST LONDON!S INDUSTRY AND
HOUSING,1945–1975
3.1 Why We Should Know How We Got HereThe high geographical concentration of artists in the East End could hardly have happened any-
where else in London. To be sure, the basic circumstances which made it possible have occurred
in other places, both in Europe and beyond, but not at the same scale, and rarely with the same
end result. So the historical and political contexts which made it possible need a closer look, not
least because in understanding how the East End got to be what it is today, we might have a bet-
ter idea of where it may end up tomorrow. In the four chapters which follow this one we shall ex-
plore the way in which the artistic networks germinated and grew, but this growth would not
have been possible without the physical infrastructure and economic circumstances upon which
the artists so heavily relied.
The richness of the East End’s past precludes any but the briefest of forays into the histori-
cal undergrowth in a work such as this, and besides, that history is set down in great detail else-
where. We shall—with the odd exception—steer clear of any theorisation of these changes, for
the point of this chapter is to map the historical terrain in which the artists were able thrive. This
chapter therefore describes the history of the East End, first in terms of its industry and then in
terms of its housing: it concentrates however on the three decades from the end of the second
World War to the mid-1970s, by which time the district’s evolution as an “artists’ quarter” was
well under way.
The East End has had the dubious privilege of being London’s back yard since medieval
times, and despite the fact that the vast majority of its industrial activities have in the last few
decades declined dramatically, its image as an insalubrious, dangerous and poverty stricken place
still casts a gloomy shadow over the area (Cox, 1994:9). So before looking specifically at the in-
dustrial and housing contexts from which the artistic networks came, we shall look briefly at the
history of the East End from the preindustrial era to the second World War. For although much
Industry & Housing in the East End, 1945–1975 1

has been written about the East End and its social and political history (cf. Foster, 1999; Hall,
1998; Cox, 1994; Davies, 1990; Hall, 1988; Palmer, 1989; LDDC, 1986; Fishman & Breach
1979: Sinclair, 1950; to name a few), a short overview will help the reader to understand better
the general context of the project, and the nature of the area with which we are dealing. Be
warned though. Artists get scarcely a mention until the end of the chapter.
3.2 A Brief History of the East End from the 1600 to 1945
3.2.1 Introduction
The East End has, since medieval times, spread eastwards from its origins at Aldgate, the
eastern-most entrance to the City of London. Although by the 17th century it had long been
home to market gardens, bakeries, lime kilns and other industries, only at this time did the East
End begin to coalesce as an urban area, slowly at first, but with increasing rapidity as industriali-
sation took a firmer hold, and the docks pulled the East End towards the River Thames. This sec-
tion looks briefly at the history of both the docks and the various hamlets which became in time
the collection of districts now called the “East End”. As with any history of somewhere polycen-
tric we have a choice of how we construct the narrative. We can either follow a strict chronology
and move from district to district within a particular time period, or we can trace the history of
each district in a single section, jumping back and forth across time as we move from place to
place. I have adopted the latter option, and described the history of each “hamlet” in turn, start-
ing nearest the city, in Spitalfields, and then moving, as East London has itself, east towards Bow
and Mile End, and north towards Bethnal Green and Shoreditch. The docks get a sub-section to
themselves at the end of this section.
3.2.2 Spitalfields and Whitechapel
The East End has attracted successive waves of immigrants since the mid 17th century, when the
Spanish and Portuguese congregation, the first professing Jewish community in modern Britain
was established. 1656, the year in which this took place, is significant, for it marked the end of a
three-and-a half century ban on Jews in Britain, established by their expulsion in 1290 under Ed-
ward II, and overturned by Oliver Cromwell (Davies, 1990:51).
However the first major wave of immigrants to the East End—the Huguenots—came in the
late 17th century, in the wake of the campaign by Louis XIV against non-Catholics; of the
200,000 Huguenots who left France, approximately 60,000 came to England (ibid). Some settled
in Wandsworth and Soho, but the majority adopted Spitalfields as their new home and estab-
lished a flourishing silk-weaving industry which, by 1824, employed 50,000, and which, by the
late 1830s, had also become a sweated industry based on wholesaling (Davies, 1990:34; Weinreb
Industry & Housing in the East End, 1945–1975 2

& Hibbert, 1983:809; Hall, 1962).
There was, it seems, little hostility towards the Huguenots; there was not much of a silk-
weaving industry to be threatened and the English aristocracy were keen to imitate French fash-
ions. Their integration into London life was as a consequence rapid (ibid). There was however
one major handicap which, indirectly, was eventually to prove the undoing of the silk-weaving
industry: the climate. The mulberry tree, whose leaves are used to feed silkworms, did not thrive
in the English climate, making the industry highly dependent on supplies of silk from abroad.
Nonetheless the silk trade remained secure while the 1766 prohibition on imported silks was in
place (ibid). However, the Government’s free-trade policy of 1860 allowed the duty-free import
of silks, and this pushed the industry into decline: already under pressure from mechanical ad-
vances in weaving in the north of England, by 1880, only 3,300 worked in the silk-weaving in-
dustry (ibid).
The changes wrought by international trade did not stop at the silk-weaving industry
though. By the first decade of the 19th century, when the East India and West India Dock Com-
panies collaborated in the construction of Commercial Road as a more direct route to the City
than the Ratcliffe Highway, Whitechapel High Street was already “lined with coaching inns, the
road was full of traffic, carts with garden produce, market women with baskets of fruit, flocks of
sheep, herds of cattle, brewers’ drays, and haywains for the hay market that survived until 1928”
(NELP, 1986:16; Weinreb & Hibbert, 1983:955).
Besides being home to the Huguenot population, Whitechapel, along with St. George-in-
the-East, was where much of London’s German population lived during the 19th century
(Farrell, 1990). Little is known of their history. Originally established in the 17th and 18th centu-
ries, by 1851 there were nearly 10,000 mostly Lutheran Germans in the East End, and by 1891,
this figure had risen to nearly 27,000 (ibid). The reasons for their leaving Germany were mostly
economic; frequent agricultural depressions, and the onset of industrialisation had sub-divided
shareholdings until they became too small to support those depending on them (ibid). Like many
immigrants, they were prepared to take on the dangerous and unpleasant jobs which the natives
would not, and the sugar refineries in Whitechapel provided employment for much of the Ger-
man population. The Irish and the Chinese also formed significant minorities in the East End
during the 19th century; the Irish around Rosemary Lane (now Royal Mint Street) and the Chi-
nese in Limehouse (Davies, 1990:47).
Mayhew painted a grim if colourful picture in the mid-19th century, noting that the lodg-
ings in Whitechapel “are occupied by dredgers, ballast heavers, coal whippers, watermen, lump-
ers and others whose trade is connected with the river as well as the slop-workers and sweaters
working for the Minories. The poverty of these workers compels them to lodge wherever the rent
of the rooms is lowest” (Weinreb & Hibbert, 1983:955). Interestingly, Mayhew also noted a
strong Jewish presence (ibid).
In fact the pogroms of the late 19th century in Poland and Tsarist Russia had compelled
many East European Jews to emigrate; in 1881–82 225,000 Jews fled Russia, and between 1870
Industry & Housing in the East End, 1945–1975 3

and 1914, approximately 120,000 Jews arrived in London, although some were en route to the
United States (Davies, 1990:84). Some had trades, but many others did not. Easy to exploit by
dint of their poor knowledge of the English language and a poverty so extreme that bread and
fish refuse counted as a daily meal, many became absorbed into the local “rag trade” (Hall,
1962:63). By 1888, Whitechapel alone could boast 1,015 tailoring workshops in what was by
now a notorious sweated industry (Cox, 1994:147). Nor did their problems stop at employment
conditions: the clothing industry was effectively cut off from the surrounding English population
at all levels—social, cultural and economic (ibid:64). A prevalent under-current of anti-Semitism
promoted a cool reception, and resulted in the Aliens Act of 1906 although the new Liberal Gov-
ernment did not strictly enforce it (Davies, 1990:84). And even within the Jewish “community”
there existed rifts, for the new wave of Jews—who were Ashkenazi Jews—was also looked
down upon by the established Sephardic Jews from Spain and Portugal (ibid:85).
Most of the new Jewish immigrants settled in just a few streets in Spitalfields and White-
chapel, a concentration which came about through the need to be near a synagogue, public baths
and a kosher butcher (ibid). This strong spatial concentration, and an emphasis on education and
culture, resulted in the rapid development of support networks—the Jewish Working Men’s Club
in 1872; the Jewish Friendly Society Movement in 1885; the Workers’ Friend Club in 1906
(ibid). Whitechapel Library was adopted as a meeting place, and many Yiddish theatres sprang
up, although few now remain (Davies, 1990:86).
After the 1917 Revolution, some Jews returned to Russia, but the East End’s Jewish popu-
lation still numbered over 80,000 between the wars (ibid:108). They were by now becoming in-
creasingly integrated, although anti-Semitic sentiments remained strong, flaring infamously in
the Battle of Cable Street, and during the 1930s they dispersed, first to Clapton and Stoke New-
ington, then to Golders Green and Finchley, and subsequently to Ilford and Newington Park; the
25,000-Jewish community in Stepney in 1950 had, by 1990 fallen to less than 7,000 (ibid). A fi-
nal irony: the Museum of the Jewish East End located itself in Finchley, eight miles north-west
of its subject.
3.2.3 Mile End and Bethnal Green
Although the terraces of Fournier Street and Elder Street reflect the affluence of the more suc-
cessful silk-weavers, Spitalfields had retained its reputation for being a poor area. So too did the
adjoining Mile End New Town, whose industries burgeoned during the 18th and 19th centuries
to include dyeing, warehouses for Truman’s brewery in Brick Lane, metal works, sugar refining,
timber and fish-curing (Weinreb & Hibbert, 1983:516, 808). Mile End New Town’s population
rose from 5000 in 1801 to over 18,000 a century later, while Bow, farther East, grew from a vil-
lage of 2,500 in 1820, to a suburb of 50,000 in 1908 (Weinreb & Hibbert, 1983:517; Davies,
1990:120). Mile End Old Town, farther East, remained relatively undeveloped until the 19th cen-
tury, when its population rose to over 100,000, many of whom worked in the City (Weinreb &
Industry & Housing in the East End, 1945–1975 4

Hibbert, 1983:517). Compared with other East End districts however, Mile End was “quietly re-
spectable”, having little of the poverty endured by its neighbour to the north, Bethnal Green.
Even so, it was in Mile End that the work of the Salvation Army began, and it was here that Ash-
bee founded his Guild and School of Handicraft in 1888 (ibid).
Bethnal Green, by contrast, although a quiet rural area inhabited by the wealthy in the 16th
century had, by the late 17th century, succumbed to the spread of the silk-weaving industry from
Spitalfields to the south-west (ibid:61). It was claimed in 1743, when it became a separate parish
from Stepney, that “the hamlet contains above eighteen hundred houses, and is computed to have
more than fifteen thousand inhabitants… consisting chiefly of weavers, dyers and other depend-
ents… crowded into narrow streets and courts… three or four families in a house” (ibid). It was
estimated that by 1840, there were six times as many looms in Bethnal Green as in Spitalfields
and Mile End New Town (ibid). The subsequent decline in the weaving industry in the mid-19th
century was, to an extent at least, ameliorated by the rise in other home and workshop industries,
but the area remained notorious for its poverty; Charles Booth’s survey of 1889 found that forty-
five percent of the population lived below subsistence level—the highest proportion in London
(ibid). The situation was bad enough for some of the more altruistic Victorians, most famously
Angela Burdett-Coutts, to sit up and take notice; Victoria Park was laid out in the 1840s, Bethnal
Green Toy Museum was opened in 1872.
In 1900, Bethnal Green became a Metropolitan Borough. The slum clearance programmes
of the first half of the twentieth century transformed the urban landscape, and the mean rows of
terraces gave way to new housing estates built by the London County Council and private bodies
such as the East End Dwellings Company. At the same time, the local industrial base began a pe-
riod of steady decline, which by the second World War was, in the view of the 1943 County of
London Plan, unstoppable (Weinreb & Hibbert, 1983:61; Forshaw & Abercrombie, 1943:96).
3.2.4 Shoreditch and Hoxton
Shoreditch, contiguous with the western-most end of Bethnal Green, has its geographical origins
at the junction of Kingsland Road and Old Street, both Roman roads. The site of England’s first
playhouse—it was dismantled in 1598 and moved bodily to Southwark where it was re-erected
as the Globe—Shoreditch, including Hoxton, was estimated by 1750 to have a population of
roughly 10,000. Five decades later this had risen to 35,000, and by 1851, 109,000 (Weinreb &
Hibbert, 1983:785). Hoxton, in reality a part of Shoreditch, originally had a reputation for its
market gardens, but the rapid urbanisation soon extinguished this rural aspect, and by the end of
the nineteenth century, the area had a reputation for both extreme poverty and, bizarrely, its
many flourishing music halls.
The industrial base here, and the livelihood of the local people, was founded chiefly on
manufacturing. From the mid-nineteenth century to the mid-twentieth century, Shoreditch and
Hoxton constituted the primary focus of London’s furniture industry (Hall, 1962:75). Originally
Industry & Housing in the East End, 1945–1975 5

centred around Old Street, it spread north to Hoxton, and eastwards into Bethnal Green, areas,
incidentally, which now have rich concentrations of artists’ studios. Like the clothing industry in
Spitalfields and Whitechapel, the East End furniture industry was a wholesale system reliant
upon cheap sweated labour which was often only partially skilled (ibid:87). And like the clothing
industry, much of the labour was Jewish (ibid). But from 1890, the wholesale system started to
go into decline due to the rise in factory production coupled with improved communications and
the fact that the major market was not the export market, but the London region (ibid:92). Until
1925 cheap land was readily to be had further north-east in the Lea Valley marshes; the furniture
manufacturers, seeking precisely that, began their north-easterly drift well before the second
World War (ibid).
In a curious historical echo, the Bangladeshi community which now occupies Whitechapel
has followed a similar pattern to their Jewish predecessors; the same emphases on religion, hard
work and the family; the sweated rag trade, but in fewer numbers (Weinreb & Hibbert,
1983:956). It is this half of the East End—Spitalfields, Whitechapel, Bethnal Green, Mile End,
Shoreditch, Hackney—which comprises the main study area. But it is the other half which has
the higher public profile: the Docklands.
3.2.5 London!s Docklands—from the 16th century to World War Two
London’s quays and hithes, the progenitors of the docklands, have their origins in the Roman and
Saxon eras (Weinreb & Hibbert, 1983:229), but it was from the beginning of the sixteenth cen-
tury that London began its inexorable journey to prominence as England’s main trading centre.
The journey was steered by the merchant classes, and serviced by those who lived at the river’s
edge east of the Tower, and by the late sixteenth century the quays and hithes garnered sufficient
trade—and smuggling—to warrant royal intervention on the part of Queen Elizabeth who passed
a law compelling all ships to discharge their cargoes under supervision at 17 “legal quays” where
duty was collected (ibid). These quays, situated between London Bridge and the Tower, soon
proved inadequate to the task as trade increased during the 17th century, and extra “Sufferance
Wharves” were added for the unloading of goods carrying low duties (ibid). The riverside areas
east of the Tower were transformed as the demand for shipping turned a relatively quiet rural
area into a dense urban industrial district (LDST, 1973b:4). The riverside hamlets of Limehouse,
Poplar, Ratcliffe, Shadwell and Wapping, originally all within the parish of Stepney, became
parishes in their own rights as they saw their combined population grow twelve-fold, from some-
what under 6000 in the late 1500s to over 70,000 by the dawn of the nineteenth century. South of
the river, Deptford’s population rose from 1000 to roughly 20,000, while by the end of the eight-
eenth century, Rotherhithe had a population of 10,000 (ibid).
But the docklands as we now know them came into being during the late eighteenth and
early nineteenth centuries, growing dramatically and spawning strong working class communi-
ties. By the end of the 18th century, London had grown dramatically—from an estimated popula-
Industry & Housing in the East End, 1945–1975 6

tion of 650,000 in 1750 to nearly a million by the turn of the century (ibid:614). International
trade had grown too; the docking facilities by now needed concerted attention, and in 1796 a par-
liamentary committee debated the problems, and made proposals for the improvement of the sit-
uation. The proposals remained just proposals, and the docks eventually came into being through
the piecemeal efforts of private companies (ibid:230). The first enclosed dock, the West India,
was completed in 1802, followed by the London (1805), the East India (1805), Surrey (1807), St.
Katharine’s (1828), West India South (1829), Royal Victoria (1855), Millwall (1868), Royal Al-
bert (1880), Tilbury (1886) and King George V (1921), the only dock not built by private enter-
prise (ibid). London’s population, like that of the East End, rocketed, from 2.6 million in 1851, to
over 6.5 million in 1901 (ibid:614).
The effect of this rapid development on the riverside was dramatic. The Isle of Dogs,
which at the turn of the nineteenth century had been rural, was, five decades later, a thriving in-
dustrial area, centred on Thomas Cubitt’s new town, and with the river frontage entirely built up.
By the turn of the twentieth century, Silvertown, in the mid-nineteenth century a rural area, had
also succumbed to heavy industrialisation (LDST, 1973b:6). At a social level, the working condi-
tions imposed by the dock companies resulted in slums, abject poverty, disease, crime and, on a
more positive note, a burgeoning sense of common identity.
The urban fabric which developed on the back of this rapid industrialisation was quite un-
like the planned squares and ordered development which were typical in west London at this
time. Buildings were thrown up cheaply and hurriedly in narrow and cramped rows of terraces,
grouped around insanitary courtyards which proved well suited to the spread of disease. The
nineteenth century riverside, like the rest of the East End, was an unhealthy and poverty stricken
place, for all its commercial liveliness (ibid:5).
Despite this seemingly unstoppable growth, the threats from free trade, competition from
the railways, labour disputes, inter-company rivalry, and fierce competition with the Port of Liv-
erpool were never far away, and in 1909 the Port of London Authority was established to halt the
docklands’ relative decline (ibid). The PLA succeeded: by 1939, eighty new acres of dock water
had been created, along with six miles of new quayside and a dredged fifty mile long channel,
1000 feet wide by 30 feet deep at low water, to take large ships. The total tonnage using the Port
rose from less than 40 million in 1909 to over 60 million in 1939 (ibid). In 1909, London han-
dled 28 percent of Britain’s sea borne trade. This figure had risen to 38 percent by the start of the
second World War. But after the War, the PLA turned its attention to Tilbury and the new sys-
tem of containerisation which could reduce turn-around time from a fortnight to 36 hours, using
far fewer people in the process (Pudney, 1975). The decline had begun, and few people could
have predicted just how different a place East London would be in fifty years’ time.
3.2.6 Summary: the East End!s Industry until the second World War
As London has grown, so too has its back yard, the East End. From market gardens and bakeries
Industry & Housing in the East End, 1945–1975 7

in the fifteenth century, to silk-weaving in the eighteenth century, to furniture in the nineteenth
and early twentieth centuries, the history of the East End is inextricably linked with the manufac-
turing industries, the docks which kept them supplied with raw materials, and the people who
worked in them. Indeed the social and economic fabric of East London has been moulded, not to
say scarred largely by the manufacturing industries (Poynter, 1996:288). By 1910, the borough
of West Ham was able to boast in a leaflet that it was the “factory centre of the South of
England”, with over 300 manufacturing firms, dominated by those to do with chemicals, engi-
neering, metalwork, food, drink and tobacco (ibid). And even in 1960, after a long and steady
process of dispersal away from London, East London and South West Essex still had a higher
concentration of manufacturing industries than anywhere else in South East England. In the mid-
1990s, the manufacturing industries continue to play a larger role in East London than in other
parts of London (ibid), although they have, over time, moved away from the centre. Whereas
they used to be in the inner boroughs of what are now Tower Hamlets and Hackney, they are
now in the outer boroughs of Barking and Dagenham, and Newham.
Gavin Poynter notes two phases in the development of East London’s manufacturing in-
dustries (ibid). The first, in the latter half of the 19th century, was concentrated in what this the-
sis refers to as the East End. Industries located there partly through historical precedent, and then
through legislation which pushed them into the suburbs where the by-laws were weak or non-ex-
istent, land was cheap and transport in the form of waterways and railways was good (ibid:289).
Besides shaping the Victorian East End, this first phase placed the area firmly at the forefront of
a “new-unionism” amongst unskilled workers through such incidents as the match girls’ strike of
1888, which resulted in the foundation of the first women workers’ union (ibid:290). The second
phase, which covers the first half of the twentieth century, had its major period in the years be-
tween the two World Wars, and saw the dispersal of industry away from the East End to outer
East London and South West Essex (ibid). It seems reasonable to add to Poynter’s breakdown a
third phase, the latter half of the twentieth century, which has seen a consolidation of the proc-
esses of deindustrialisation, decentralisation and dispersal which started in the second phase and
it is to the beginning of this third phase, during the second World War, that we now turn our at-
tention. For it is in this phase that we can find the early clues which can help us understand why
there are now so many artists in such a small area.
3.3 “No New Phenomenon”
The Dispersal of Industry 1943–1975
London’s industry has been moving outward for many years. It is no new phenomenon.
Forshaw & Abercrombie, 1943 County of London Plan. p.92
Industry & Housing in the East End, 1945–1975 8

3.3.1 Introduction
By the time World War Two began, manufacturing industry was starting to leave the East End,
London’s population had peaked at just over 8.5 million, and the forerunner of the shipping con-
tainer was already in use for the transport of wine, even if its ultimate significance for the future
of the London docks had not yet been realised (Forshaw & Abercrombie, 1943:84; Weinreb &
Hibbert, 1983:614; Pudney, 1975:174). As Forshaw and Abercrombie eloquently noted in the
1943 County of London Plan:
…though there has been a pause in her growth, London has not remained unaltered during
these years of war; she has undergone change of an altogether unprecedented kind. A large
part of her population has been evacuated; some of her industry and business, and a number
of Government departments have temporarily left her, although not enough to affect substan-
tially the daily hum of metropolitan activity; her docks are less active and the roads in certain
parts little used; large areas of building, though small in comparison with London, have been
destroyed by air attack, and still more buildings have been damaged more or less irrevocably.
…There is thus presented to London a unique stimulus to better planning.
(Forshaw & Abercrombie, 1943:1)
3.3.2 Industry in the East End —After the War
This “unique stimulus” presented itself not least to an East End which then, as now, had many
factories: cheap clothing in Shoreditch and Bethnal Green, shoes and boots in Hackney, tobacco
products in Shoreditch and Stepney, heavy engineering in Poplar, biscuits, jams and pickles in
Bermondsey, brewing in Stepney, furniture in Shoreditch, Hackney and Bethnal Green, printing
and paper in Shoreditch, heavy chemicals in Poplar and Bermondsey (ibid:85–86). In 1938, for
the boroughs of Bermondsey, Bethnal Green, Hackney, Poplar, Shoreditch and Stepney, there
were 10,750 “factories engaged in productive industry” employing 215,254 people (ibid:88–89).
With the exception of the industry in Poplar and Bermondsey, both relatively close to the River
Thames, the East End’s industrial base was not in heavy industry, but in light industry. The two
predominant industries in the East End, furniture and clothing, shared certain characteristics.
They were highly organised, they employed mostly local labour in a variety of small workshops
and big factories, and they were geared towards supplying the major West End stores (Hall,
1962; Forshaw & Abercrombie, 1943:86).
The 1943 Plan records the decentralisation of engineering, reflecting a trend which For-
shaw and Abercrombie note had already existed for some years, as engineering expanded in what
were then the peripheral boroughs of the County of London—Islington, St. Pancras, Wand-
sworth, Camberwell and Lewisham. Clothing, by contrast, was expanding as the number of small
clothing manufacturers proliferated, although the larger factories were also showing a tendency
to decentralise. Forshaw and Abercrombie conclude, and five decades’ hindsight tells us that
they were pretty much right, that clothing “must be regarded as one of London’s more static in-
Industry & Housing in the East End, 1945–1975 9

dustries, measured in terms of mobility” (ibid:87). The furniture industries, by contrast showed a
higher rate of decentralisation than any other London industry, a trend which Forshaw and Aber-
crombie saw continuing as hand-made furniture and polishing workshops died out. “Great future
expansion” was predicted for the printing and paper industries, but then so was the decentralisa-
tion process, by then already twenty years old.
As far as Forshaw and Abercrombie were concerned then, a continuing and increasing de-
sire on the part of London’s industry to decentralise was an inevitability about which the Gov-
ernment could do very little. Improvements in transport, the cost of moving back to central Lon-
don for those medium-sized concerns which had already decamped, a tendency to locate on in-
dustrial estates at the urban edge, a trend towards London-based firms having “shadow factories”
elsewhere, an increasing swing towards mechanical efficiency (itself driven by the war effort)
and towards mass-production, increasing demand for consumer goods after the war: all these
things they saw as unstoppable trends (ibid:96).
They were right of course. Forshaw and Abercrombie had pinpointed some of the basic
reasons for deindustrialisation (as opposed to decentralisation) which Fothergill, Monk and Perry
(1987) set out in more detail over four decades later: the fact that factory buildings all too fre-
quently outlive the processes for which they were originally designed; the reality of the tight
constraints placed on firms by the availability of suitable premises; the the failure of supply of
industrial property to adjust effortlessly to demand; the extent of influence of supply on the
“location of manufacturing firms’ activity” (ibid:110). And these lead, in due course, to the now
familiar picture of a factory stock which as a whole was only partly suited to the needs of mod-
ern industry (ibid:37) and much of which was effectively redundant from an industrialist’s point
view.
But Forshaw and Abercrombie also envisaged a continuing decentralisation of London’s
population (Forshaw & Abercrombie, 1943:96). Nonetheless they did not see this as a necessar-
ily bad thing. Rather, they argued that the decentralisation of industry from the dense inner areas
to the outskirts should be positively encouraged in industrially congested areas, where industry
and housing mixed haphazardly, although they also made the point that a policy of decentralisa-
tion should not be pursued for its own sake, or in areas where there was no obvious improvement
to be had (ibid). And despite the predicted loss of many factories and firms, they also envisaged
many small factories and workshops remaining, albeit in reduced numbers as mass-production
techniques took their toll of the smaller concerns (ibid:97).
But if the 1943 Plan envisaged a continuing decentralisation of industry, the same cannot
be said of its predictions for the London Docks. Although even then the future of St. Katharine’s
Dock was under scrutiny, Forshaw and Abercrombie’s view was that the Docks would continue
to function as the nation’s primary port for the foreseeable future, and so would not be “directly
affected by the plan”. They did however offer proposals for the improvement of access to the
docks, as well as speculative suggestions as to how the docks might be rationalised and brought
more up-to-date after the war, improvements designed to tie in with their proposals for opening
Industry & Housing in the East End, 1945–1975 10

up sections of the river front to the public wherever possible (ibid:15).
When Abercrombie and Forshaw were writing though, the future of the docks did in truth
look uncertain. The heavy bombing by the Luftwaffe took its inevitable toll, and left many of the
dockland areas ablaze, and hundreds of civilians dead (Pudney, 1975:167). At the end of the war,
only two-thirds of the PLA’s warehousing remained, along with just half of its storage space
(ibid:170). The mechanisation which had made tentative inroads into goods handling practice be-
fore the war became, along with the decasualisation of labour, a major concern (ibid). These two
issues were at the root of many of the thirty-seven strikes in the decade after the war, as the up-
stream docks, built originally for sailing ships, found themselves unable to compete with the
larger docks farther downstream which quickly the embraced the forklift truck—a few had been
left behind by the Americans at the end of the war—and set about increasing turnover time and
capacity at a stroke (ibid:173). Mechanisation continued with the innovations of containerisation
and the roll-on/roll-off system, whereby a trailer can be pulled onto a ship, transported to its des-
tination, and simply driven away from the ship at the other end (ibid). By the mid-1960s, the
stage was set for the docks to move downstream, from London to Tilbury.
The East End’s industrial base likewise saw a continuing decline in its fortunes, as the
mass production techniques and the move towards a wholesale system foreseen by Forshaw and
Abercrombie combined with ongoing policies of decentralisation. The war had already left its
mark though. Between 1939 and 1948, the borough of Shoreditch saw employment halved from
over 100,000 to just over 50,000, while employment fell in Hackney from 80,000 to 57,000, in
Stepney from 113,000 to under 75,000, and in Poplar from 52,000 to 32,000. The population also
declined sharply as the war took its toll: in Hackney from 205,200 to under 173,000; in Bethnal
Green from over 90,000 to under 61,000; in Shoreditch from over 77,000 to 45,000; in Stepney
from just under 200,000 to less than 100,000; and in Poplar from just over 131,000 to 75,000
(LCC, 1951:62-63).
The docklands also collapsed dramatically, over the quarter century from the mid 1960s.
Their demise at the hands of containerisation was complete and traumatic: in the space of four-
teen years, from 1967, all of London’s docks closed. The Tilbury docks, 26 miles downstream,
were something of an anomaly when they were built in 1886. But their capacity for container-
isation, and the fact that they are nearer the sea, allowed them to benefit from the changes of the
1960s and 70s, and so to become London’s primary dockyard. Employment in the docks fell
from 22,815 in 1967, to 7,120 in 1980, and this was before the Royal Docks closed (Davies,
1990:120). Furthermore, three times as many jobs were lost in dock-related trades (ibid). Lon-
don’s manufacturing industries, like its docks, also experienced devastating changes: employ-
ment in London fell from 4.3 million in 1961 to 3.5 million in 1989. Of the lost jobs, 800,000
were in manufacturing, while unemployment rose tenfold from 40,000 in the mid 1960s to
400,000 in 1985 (Hall, 1998:889).
If the collapse of the Docklands had been dramatic, their physical regeneration, and the ac-
companying political shenanigans have been no less so. By the beginning of the 1970s, there was
Industry & Housing in the East End, 1945–1975 11
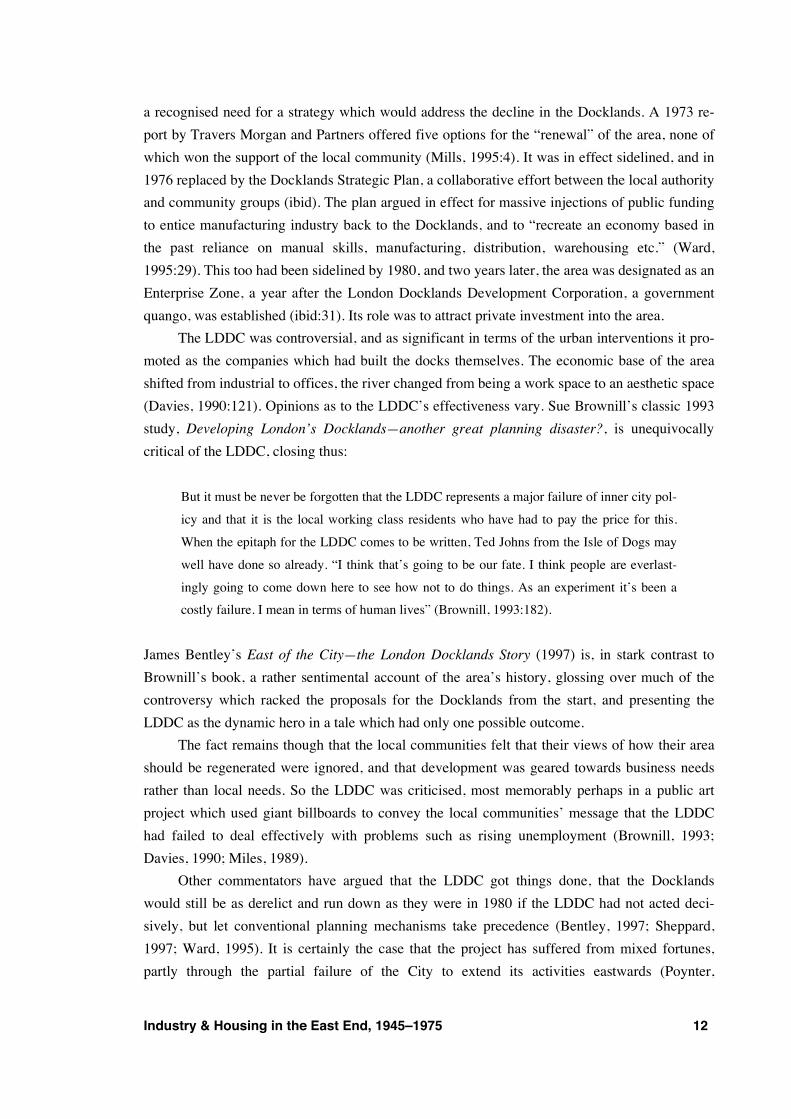
a recognised need for a strategy which would address the decline in the Docklands. A 1973 re-
port by Travers Morgan and Partners offered five options for the “renewal” of the area, none of
which won the support of the local community (Mills, 1995:4). It was in effect sidelined, and in
1976 replaced by the Docklands Strategic Plan, a collaborative effort between the local authority
and community groups (ibid). The plan argued in effect for massive injections of public funding
to entice manufacturing industry back to the Docklands, and to “recreate an economy based in
the past reliance on manual skills, manufacturing, distribution, warehousing etc.” (Ward,
1995:29). This too had been sidelined by 1980, and two years later, the area was designated as an
Enterprise Zone, a year after the London Docklands Development Corporation, a government
quango, was established (ibid:31). Its role was to attract private investment into the area.
The LDDC was controversial, and as significant in terms of the urban interventions it pro-
moted as the companies which had built the docks themselves. The economic base of the area
shifted from industrial to offices, the river changed from being a work space to an aesthetic space
(Davies, 1990:121). Opinions as to the LDDC’s effectiveness vary. Sue Brownill’s classic 1993
study, Developing London’s Docklands—another great planning disaster?, is unequivocally
critical of the LDDC, closing thus:
But it must be never be forgotten that the LDDC represents a major failure of inner city pol-
icy and that it is the local working class residents who have had to pay the price for this.
When the epitaph for the LDDC comes to be written, Ted Johns from the Isle of Dogs may
well have done so already. “I think that’s going to be our fate. I think people are everlast-
ingly going to come down here to see how not to do things. As an experiment it’s been a
costly failure. I mean in terms of human lives” (Brownill, 1993:182).
James Bentley’s East of the City—the London Docklands Story (1997) is, in stark contrast to
Brownill’s book, a rather sentimental account of the area’s history, glossing over much of the
controversy which racked the proposals for the Docklands from the start, and presenting the
LDDC as the dynamic hero in a tale which had only one possible outcome.
The fact remains though that the local communities felt that their views of how their area
should be regenerated were ignored, and that development was geared towards business needs
rather than local needs. So the LDDC was criticised, most memorably perhaps in a public art
project which used giant billboards to convey the local communities’ message that the LDDC
had failed to deal effectively with problems such as rising unemployment (Brownill, 1993;
Davies, 1990; Miles, 1989).
Other commentators have argued that the LDDC got things done, that the Docklands
would still be as derelict and run down as they were in 1980 if the LDDC had not acted deci-
sively, but let conventional planning mechanisms take precedence (Bentley, 1997; Sheppard,
1997; Ward, 1995). It is certainly the case that the project has suffered from mixed fortunes,
partly through the partial failure of the City to extend its activities eastwards (Poynter,
Industry & Housing in the East End, 1945–1975 12

1996:294), and partly, perhaps, because it has simply not had long enough to develop as an urban
area.
3.3.3 Summary—Industry in the East End
Like any city, London has its industrial hinterland. Traditionally, that has been the East End,
both by dint of its proximity to the river Thames, and because the prevailing winds blew the
fumes and odours eastwards, away from London itself. Mostly rural until the nineteenth century,
it exploded into a bustling, dirty, poverty stricken place with the onset of the Industrial Revolu-
tion, and in the process became the industrial hub of the British Empire. It additionally became
the home of some of the country’s most infamous slums. Their story is told in the next section.
For the time being though, it will repay us to stop briefly and recall the ground we have
just covered. The East End has its origins in the collection of hamlets which coalesced during the
nineteenth century to form London’s industrial district. Particular areas within the East End came
over time to specialise in particular industries; clothing and furniture in Shoreditch and Bethnal
Green, shoes and boots in Hackney, heavy engineering and chemicals in Poplar, brewing in Step-
ney and Mile End, foodstuffs in Bermondsey. And, heavy engineering and chemicals excepted,
all of these industries were long-established manufacturing industries, and supplying all of them
with the necessary materials were the docks.
Hall (1962:114–119) concluded that these long-established manufacturing industries had
certain facets which could help to explain their location. Those industries requiring bulky raw
materials, sugar refining, leather tanning or furniture manufacture for example, tended to be rela-
tively near to the docks. London, as the capital city, was a major market, and it made sense to lo-
cate as near to that market as possible. It was also a wealthy market which could afford luxury
goods, simply by virtue of the fact that it was home to many exceptionally rich people and insti-
tutions. The City of London had been a home for speculative capital since the sixteenth century,
and by the beginning of the nineteenth century, the wholesale system was established in trades
such as clothing, footwear and furniture. Until the first World War, London was the financial
capital of the western world, and it remains one of the financial centres of the late twentieth cen-
tury global economy. Such a concentration of wealth makes it an attractive market-place for
those with goods to sell. London’s sheer size makes it a powerful supplier of labour, and the East
End’s history is punctuated with periodic influxes of new skilled and semi-skilled labour which
settled in the first instance in the East End. Finally, Hall found that small manufacturing con-
cerns, needing to keep up with the latest fashions, could best gather their information through the
grapevine—informal networking mechanisms—which enabled them to remain competitive, so
they tended, in true Marshallian style, to agglomerate. And as we shall see in the next chapter,
many of these factors apply also to the East End of the artist. First though, we shall look briefly
at the story of London’s post-war housing predicament.
Industry & Housing in the East End, 1945–1975 13

3.4 Housing in the East End, 1945—1975
3.4.1 Introduction
Continuing resilience in the face of devastating war time bomb attacks has been an enduring part
of the East End legend, and rightly so, but the facts of the devastation speak for themselves. In
the eight months from the “Blitz” of Autumn 1940 to May 1941, 30,000 Londoners lost their
lives and hundreds of thousands more saw their homes damaged or destroyed (Davies,
1990:111). And it was the obvious targets for bombing, the East End’s docks and industry, which
bore the brunt of attacks which inevitably left large tracts of housing damaged or destroyed.
3.4.2 Outward & Upward—Housing After the War
In fact, the war accelerated a process of decentralisation which had been in existence for some
years beforehand, primarily through local authority-led slum clearance programmes and the de-
velopment of the London suburbs by private developers. However the war’s aftermath inevitably
and irrevocably changed both the nature and the extent of the problems brought about by Lon-
don’s continuing expansion. A deliberate policy of balanced decentralisation of both population
and industry from London had been set in motion as a result of the 1940 Barlow Report and the
1943 County of London Plan, and this, combined with the effects of the war, served to galvanise
the authorities into taking action to address the issue (LCC, 1951:111). The East End slum, even
in the 1920s and 30s when conditions had improved dramatically over those of five decades pre-
viously, still most commonly comprised mean rows of over-populated terraced housing, grouped
around dirty and insanitary courtyards. The late 19th and early 20th century tenements built by
bodies such as the Peabody Trust or the East End Dwellings Company which replaced some of
the worst slums, although more solidly built and having better sanitation, were themselves
cramped and gloomy places for which the landlords charged above-average rents (Moye,
1979:22). Lavatories and washing facilities were still frequently communal, and the space pro-
vided was still too little to cater for the typical family—the East End Dwellings Company for ex-
ample averaged 1.6 rooms per dwelling, while the Peabody Trust averaged 2.3 rooms per dwell-
ing (Munby, 1951:81).
The war, then, destroyed many of these areas, and many Londoners simply left the capital
either as evacuees or to help the war effort. But even though many did not return to London once
the war was over, overcrowding remained rife, with an estimated 250,000 families still waiting
to be housed at the end of 1950. Of these, 30% needed to be housed as a matter of urgency (ibid).
Some 11,500 houses were earmarked for slum clearance at this time, displacing an estimated
17,300 families, although the requirements of the rebuilding process meant that a total of 14,000
Industry & Housing in the East End, 1945–1975 14

houses would have to be cleared, displacing some 20,000 families (ibid:112). Overall, it was es-
timated that 113,200 families, or over 0.4 million people, would need to be rehoused in the five
years from 1951 (ibid). The solution proposed by the LCC had two phases—from 1951 to 1956,
when roughly 62,000 dwellings would be built in the Administrative County, and from 1957 to
1971, by the end of which it was envisaged that over 185,000 dwellings would have been built
(LCC, 1951:113–114). These then were the targets which the LCC felt that it could realistically
attain in the given time periods, but even so, there remained an envisaged and unsolved shortfall
of over 0.25 million dwellings, or 0.75 million people, who would have to be accommodated
outside London (Hall, 1963:86).
Within the Administrative County the redevelopment was intended to reflect the commu-
nity structure of London as Forshaw and Abercrombie had described it in the 1943 plan. Indeed,
their proposals for developments, which would respect the old community structure but provide a
decent physical environment were, in some measure at least, carried through. The main focus of
house-building during the 1950s however, remained the rehabilitation of the existing housing
stock, although new housing completions, mostly in the form of prefabricated bungalows, aver-
aged some 25,000 per year (Tennant, 1998:26). Even so, the housing shortage continued rela-
tively unabated—in 1951 there were over 480,000 more households than dwellings, while by
1961, although this figure had fallen, it was only to 300,000 (ibid). In 1955, the Conservative
Government launched a massive slum-clearance programme which would run until the mid-
1970s, while the high-rise tower blocks originally championed by Le Corbusier, and subse-
quently by both the architectural profession, and the Government, who offered a subsidy for a
flat in a tower block three-times that offered for a house, began to proliferate (Hall,
1988:223–224).
The reservoir of sites cleared by wartime bombing had dried up by the mid 1950s, and al-
though slum clearance could continue, it was becoming painfully clear that the capital’s housing
problems were unlikely to go away in a hurry. And it had by now become quite apparent that
Patrick Abercrombie’s 1945 population projections for the County and the London Region as a
whole were appalling underestimates, based as they were on 1930s assumptions that the birth
rate would continue to fall (ibid:91–92). The London County Council was drawn to the con-
clusion that it would have to look beyond its county boundaries to the outer boroughs if it was to
house its population (Tennant, 1998:27).
However, it was also clear that the existing metropolitan structure was inadequate to the
task of making these changes, geographically wide-ranging as they would necessarily be. A
Royal Commission was charged with the task of “considering the case” for reform of London’s
government, and in 1960 presented its conclusion that 33 new boroughs should be formed which
would subsume the outer suburban districts to create a new “Greater London”. The new bor-
oughs, now the principal units of local government, would have considerable autonomy over lo-
cal housing and land use planning. Overseeing the new administrative area would be a Greater
London Council, better reflecting the physical extent of the capital, for which it would produce a
Industry & Housing in the East End, 1945–1975 15

new strategic plan. Both the LCC and the boroughs resisted this plan, and fear was expressed that
the tensions which existed between a new, centrally organised GLC and the vociferously inde-
pendent outer boroughs could polarise London’s Government, leaving it reliant for its power on
the suburbs, but with a political vacuum at the centre. Nonetheless, the Conservative Govern-
ment acted on the recommendations of the Commission and passed the 1963 Local Government
Act which, two years later, brought into being the Greater London Council (ibid).
In 1965, the idea of having a strategic authority functioning at a metropolitan level was
quite novel, and inevitably problematic. Far less stable than the LCC, which saw just two
changes of political control in 76 years—the last three decades were entirely under Labour—the
GLC had changed control twice before it reached its first decade (Young, 1977:12). Any at-
tempts by the new GLC to develop and implement a coherent housing plan—a necessarily long-
term project—were as a consequence foiled by short-term political battles (ibid). So although the
1965 Milner-Holland Report identified the GLC as the appropriate body to assist decaying areas
of London through a process of redistribution of population, both the GLC’s Housing Needs Re-
port of 1970, and the Strategic Housing Plan of 1975 made little headway (ibid). The 1964
South East Study meanwhile, and the 1967 report by the South East Economic Planning Council,
projected massive increases in the region’s population which would require significant increases
in house building both within and outside Greater London (Tennant,1998:29). And of course the
population of London had not declined to the extent predicted by Abercrombie in the 1944
Greater London Plan, although this and the 1943 County of London Plan still informed the basic
principles of post-war planning in the London region (ibid).
The suburbs, which had vehemently, and in the end unsuccessfully fought the imposition
upon them of a metropolitan structure, were now faced with the possibility of an influx of people
displaced from the Administrative County. The nature of the transition from the LCC to the GLC
had served to confuse matters further as the GLC found itself the unwitting inheritor of a broad
swathe of moot issues and temporary powers which served merely to underline the contradiction
between the role which the GLC was intended to serve, and the statutory authority available to
fulfil that role. By 1967, it was already clear that the GLC could either pursue the power it re-
quired, or simply cut its strategic coat to suit its statutory cloth (Young, 1977:11).
Horace Cutler, incumbent from 1967 to 1970, therefore sought to shift the strategic empha-
sis. Instead of new council housing, housing associations—“quasi-public” organisations
(ibid:14)—would be encouraged, and a programme to sell thousands of council houses imple-
mented (ibid). Again though, time was too short to get the policies properly off the ground, for
while getting expanded aid to housing associations was not particularly problematic, more time
than that available was needed for the housing association sector to mature enough to be able to
deal with a programme of that magnitude (ibid). But notwithstanding the split which tore the
London Conservatives apart between 1970 and 1972, the root problem remained the same:the
GLC was now a decade old, but appeared to have failed in its task of solving London’s housing
problem—a problem which refuses to disappear over two decades later. Ken Young, writing in
Industry & Housing in the East End, 1945–1975 16

1977, noted almost despondently that:
…The resource deficiencies of the GLC are not statutory, but arise from a lack of infor-
mation on local housing and land-use situations, combined with a lack of appreciation of lo-
cal political conditions.
…[The] GLC was dependent on the boroughs for much of its data collection and provision,
but lacked the political muscle to demand it. …The years 1965 to 1975 were then for Lon-
don’s metropolitan policy-makers a decade of frustration. The alternatives in London Housing
policy and the recurrent offensives against the suburbs have served to heighten the awareness
of the basic conflicts of interest between the differing social areas of the conurbation, and in-
crease both the sensibilities and the abilities of the defeated suburbs.
…The pace and scale of employment and population loss in the inner city is already shifting
attention from housing conditions to broader based measures to maintain the vitality of the
urban area (Young, 1977:19–24, italics in the original).
And what he was referring to, one suspects, were the decline of the London Docklands, dis-
cussed above, and the concurrent phenomenon of “gentrification”.
Of course it was East London which was the focus for much of the concern about slum
clearance and housing, and it was there too that the process of gentrification first took hold in the
capital. Much of the slum clearance and house-building in the post-war years was the product,
however flawed, of a political will to address a social problem which was itself the product of a
particular juncture in capitalism—the industrial era. Gentrification—a term originally coined by
the sociologist Ruth Glass in 1964—referred to the systematic upgrading of turn-of-the-century
residential property, and the consequent displacement of a relatively poor community by a
wealthier one (Glass, 1964:xviii). We might now include certain obsolete industrial building
types in that general description. It is a product of a particular juncture of capitalism—what has
been called the “post-industrial” era (cf. Castells, 1996; Savitch, 1988; Young & Mills, 1983;
Zukin, 1982).
Indeed it might be argued that gentrification is the link between the artist and the old indus-
trial district, although, particularly if you are an artist, you will more likely be arguing the case
that the artist is the link between the old industrial district and gentrification. And of course art-
ists, gentrification and old industrial districts might simply be three sides of the same triangle.
The point is that they are linked, so we must discuss all of them.
Gentrification is in essence an international phenomenon, common in the western in-
dustrialised world in cities both big and small (Smith, 1986:17). It has tended to be treated as
some new urban frontier, primarily economic in character, and a “process led by pioneers and
homesteaders whose sweat equity, daring and vision are paving the way for those among us who
are more timid”, although as it turns out, it is the “banks, real-estate companies, the state or other
collective actors” who generally get there first (ibid:18–19). It is also just one of several frontiers
Industry & Housing in the East End, 1945–1975 17

in a geographical space which is differentiated across a number of scales—local, city-wide, re-
gional, global—for example (ibid). But, as previous sections in this chapter have made abun-
dantly clear, the restructuring of urban space is hardly a new phenomenon.
Smith argues that there are five main factors involved in the process of gentrification: first,
suburbanisation and the emergence of the “rent gap”; second, the decentralisation of advanced
capitalist economies and the growth of white-collar employment; third, the spatial centralisation
and simultaneous decentralisation of capital; fourth, the falling rate of profit and the cyclical
movement of capital; fifth, demographic changes and changes in the nature of consumption
(ibid).
Of these five aspects, the most important for us, as we shall see in chapter nine where we
develop a theoretical model, is Smith’s notion of the “rent gap”:
[The] outward movement of capital to develop suburban, industrial, residential, commercial
and recreational activity results in reciprocal change in suburban and inner-city ground-rent
levels. Where the price of suburban land rises with the spread of new construction, the rela-
tive price of inner-city land falls. Smaller and smaller quantities of capital are funnelled into
the maintenance and repair of the inner-city building stock. This results in what we have
called a rent gap in the inner-city between the actual ground rent capitalized from the present
(depressed) land use and the potential rent that could be capitalized from the “highest and
best” (or at least a “higher and better” use), given the central location (ibid:23).
Smith continues:
At the most basic level, it is the movement of capital into the construction of new suburban
landscapes and the consequent creation of a rent gap that creates the economic opportunity for
restructuring the central and inner cities (ibid).
Smith also argues that deindustrialisation helps explain the nature of the land-use and building
stock typically associated with gentrification, and where we might expect it to take place (Smith,
1986:25). “The transformation of old industrial areas” he notes, “…did not simply begin with the
conversion of old warehouses into chic loft apartments; much more significant was the early ur-
ban renewal activity which, although certainly a process of slum clearance, was also the clear-
ance of ‘obsolete’ (meaning also devalorized) industrial buildings (factories, warehouses,
wharves etc.) where many of the slum dwellers had once worked” (ibid).
Beauregard acknowledges the general validity of Smith’s thesis, but adds that an
“emphasis… must be placed on contingency and complexity, set within the structural dimensions
of late capitalism” (Beauregard, 1986:35). In fact, Beauregard chooses to describe gentrification
as a “chaotic” concept (ibid:40). It should be noted here that Beauregard uses the terms “chaos”
and “complexity” loosely, as descriptions of the general nature of the process, rather than in the
Industry & Housing in the East End, 1945–1975 18

strict technical sense in which they will be used later in this thesis.
Gentrification, then, does not simply terminate a chain of cause and effect: it is just one of
several possible outcomes, and there are parallels here with the evolution of the East End artists’
agglomeration. First both gentrification and the evolution of the East End artists’ agglomeration
have been reliant on a fluid and unpredictable urban context which has come about through the
collapse of the East End’s industrial base, and the lack of any obvious replacement for it. Sec-
ond, Beauregard’s assertion that contingency plays a part in gentrification is also applicable to
the East End artists’ agglomeration. These observations are discussed further in chapter nine.
3.4.3 Summary—Housing in the East End, 1945–1975
The history of London’s post-war housing has two main threads. In the first instance, there was
the more-or-less systematic policy-led decentralisation of London’s population on the back of
slum-clearance programmes and the need to rebuild a war-torn city. The East End was at the
heart of this programme. Second, there has been the relatively new phenomenon of gentrifica-
tion, which, it is argued, has been the spatial manifestation of processes which include the decen-
tralisation of capital from what have historically been London’s industrial areas. Again, the East
End has been at the very core of this process, most notably in Hackney and Islington in the
1970s, the Docklands in the 1980s, and now Hoxton and Shoreditch in the 1990s.
3.5 Discussion
We have looked in the previous two sections at the aftermath of the second World War, and in
this summary we shall come up to date. It should by now be clear enough that the East End’s his-
tory, while rich and diverse, has rarely been happy. The last three decades have been marked by
unprecedented upheavals at the hands of a rapidly changing global economy which no longer fa-
vours the location of manufacturing industry in western cities. And those industries which re-
main need more up-to-date premises than many, or even most, of those on offer in one of the
world’s oldest industrial districts. For the first time in its urban history, the East End is not an in-
dustrial area. It has changed from being the industrial heart of London, to an area looking for a
new role in a post-industrial world. Its population has fallen dramatically. Tower Hamlets—an
amalgamation of the old Metropolitan Boroughs of Bethnal Green, Poplar and Stepney in
1965—had a population of 570,000 in 1901. By 1931, this had fallen to 489,000, and had halved
to 231,000 by 1951 (Davies, 1990:120). The population has fallen more slowly in the decades
since then, but in 1991 had dwindled to 161,000 (Tower Hamlets, 1996).
Nor is it a geographically coherent area. In terms of its historical development, it never has
been. Those areas which now comprise the East End—Shoreditch, Hackney, Mile End, Bethnal
Green, Whitechapel, Wapping, Poplar, Limehouse, Bow, Millwall—all have their own histories,
both in terms of geographical development and in terms of cultural development. And although
the boroughs of Tower Hamlets and Hackney provide a broad and coherent administrative and
Industry & Housing in the East End, 1945–1975 19

geographical definition of the East End, the area retains its polycentric character and urban struc-
ture. Davies goes so far as to argue that there is a risk of there being two East Ends—the “old”,
comprising Spitalfields, Bethnal Green, Whitechapel, Mile End and Hackney, and the “new”
comprising the reinvigorated Docklands (Davies, 1990:123). Eric Sorensen, then director of the
LDDC, noted in a seminar at University College London that the administrative boundaries of
the LDDC were in fact arbitrary, and that they could usefully have been extended north to in-
clude areas such as Bow, Bethnal Green, and Whitechapel (Sorensen, 1996). Clearly, the separa-
tion of the “Docklands” from the rest of the East End is not always helpful. In terms of urban re-
generation, at least at a physical level, the “old” East End—the geographical focus of this
project—still has some way to go in its adjustment to the new order.
There are, then, certain clues we can take with us into the next chapter. The East End’s pre-
dominant industries—furniture, clothing, printing—were not “heavy” industries. The infra-
structure they have left behind is in the form of relatively well-lit, spacious factories and ware-
houses. The docks left behind a huge legacy of empty warehouses. The Greater London Council
was racked by political in-fighting, and failed to implement anything like a coherent housing pol-
icy. But it did encourage the development of housing associations. Most significantly though, the
East End has been in a state of flux since the second World War. Indeed, few people in 1965
would have predicted the onset of gentrification in the East End. Fewer still would have pre-
dicted that the area would one day become home to the majority of London’s artists.
Industry & Housing in the East End, 1945–1975 20

FOUR
THE EARLY YEARS, 1968–1974
It is probably hard to find industrial milieux that are less planned and regulated than those old, semi-slum-
type districts in the great cities of the world where small industries and crafts have congregated.
Törnqvist, 1983, Creativity and the Renewal of Regional Life
4.1 A Chronological Explanation
Our story really begins here, and in this and the next three chapters, we shall see how the stu-
dios in the East End originated, how their numbers grew, and how they became established
across an ever-growing geographical area. As ever in a history such as this, a certain amount of
jumping about is necessary, either in time or space. Here the treatment is broadly chronological,
and the jumping about is spatial. This enables us to cover more clearly the changes in context
over time, and to trace more cleanly the spin-offs and moves as artists shifted from one place to
another in their pursuit of cheap studio space.
But before moving to the substantive issues, a precautionary note. Much of the material in
these four chapters is derived from interviews with those involved in either establishing or run-
ning studio blocks, galleries or other arts organisations. But in several cases overlaps exist, his-
torical connections occur within the narrative, and certain actors become familiar to us. It is
therefore worth making the point that, as with any oral history which is written down for the
first time, an emphasis falls inevitably upon those with whom the writer has spoken, and who
have been keen to share experiences and views which may fall outside the relatively strict ru-
bric of the questionnaire, but which add immeasurably to the richness and depth of the story.
Wherever this has been the case I have, as far as possible, used extended passages from the in-
terviews, and let those actors tell that story. I have also tried to place their stories within a
broader context of recent cultural and art history.
Section 4.2 sets out the origins of the first artists’ studio organisation in East London, and
in section 4.3 we see how a group of artists from Reading University met their need for both
living and working accommodation. Section 4.4 sums up before looking forward to chapter
The Early Years, 1968–1974 1

five.
4.2 New Uses for Old Docks…
In 1967 a group of graduates from St. Martin’s School of Art moved into the the “Stockwell
Depot”, a disused brewery in Lambeth, to continue their work in a “mutually competitive and
critical” environment: this was, argues Robert Hewison, a direct response to the materialistic
values of Pop Art (Hewison, 1986:237; figure 4.3). But the notion of many artists working to-
gether under one roof, even if in separate studios, was not one that had become common cur-
rency in the late 1960s: London’s artists generally worked from home. But 1968, when Bridget
Riley won the International Prize for painting at that year’s Venice Biennale, was a year of up-
set. Although most famously manifest in May’s student riots in Paris, a more general disillu-
sionment was becoming apparent, as Time magazine’s upbeat 1966 description of “Swinging
London” gave way to Richard Hamilton’s vituperatively pun-titled Swingeing London artworks,
increasingly vociferous condemnation of the Vietnam War, student sit-ins—most notably at
Hornsey College of Art and the London School of Economics—and destructive bickering
within those “underground” groups spearheading the counter-culture which, argued Bernice
Martin, was itself dependent upon the materialist society against which it purported to align it-
self (Hewison, 1986).
The art world in London was likewise becoming more fractious. The early 1960s had seen
a “more exciting” London art world “with Pop Art” (Collings, 1997:35) and a boom in art sales,
but as that decade drew to a close contemporary art dealers were feeling the pinch of a gloomier
economic climate (Hewison, 1986:231). Christopher Finch, writing in Studio International in
March 1968 noted “I do not think I am alone in detecting symptoms of atrophication in the Lon-
don Art Scene”, while the art historian Edward Lucie-Smith reported in Art in Britain 1969–70
that “it is clear that commercial art and galleries are struggling to survive. In 1969, for the first
time, one began to feel their days were numbered” (both quoted in Hewison, 1985:231–232).
As artists became more disenchanted with the gallery system, art itself was beginning to de-
velop a broader base, particularly in terms of community art, which by definition exists outside
the gallery system, and conceptual art which, in theory at least, also exists outside it (ibid).
Along with the near collapse of the commercial galleries, a simultaneous decline in pa-
tronage had left many artists increasingly unsupported: one such was a friend of Riley’s, Peter
Sedgely, who was himself in need of studio space, and whose dealer had recently succumbed to
the general malaise (MacRitchie, 1996). Not surprisingly perhaps, an old idea of
Sedgely’s—the generation of an artists’ community—resurfaced at about this time, and on
Riley’s return from Venice it was discussed at her home in West London (Riley,
1998:interview).
That such an initiative should have come from Riley and Sedgely is not, with hindsight,
such a bolt from the blue. The seminal exhibition The Responsive Eye, held in 1965 at the Mu-
seum of Modern Art in New York City, had made Riley internationally famous in the art world,
while her visually disturbing black and white canvases quickly and controversially became a
model for the latest fabric and fashion designs (Kudielka, 1992). Riley herself was fêted by the
The Early Years, 1968–1974 2

New York art world—the Abstract Expressionist Ad Reinhardt took her under his wing—and
when she visited New York for the exhibition, she took the opportunity to visit other artists, in-
cluding Elsworth Kelly and Agnes Martin, in their studios (Riley, 1998:interview). Sedgely also
visited New York somewhat later, and of particular significance for both of them were the stu-
dios, including those of Kelly and Martin, situated in redundant warehouses at the Battery, on
the lower west side. In fact, Kelly and Martin were two of the last artists to have studios there,
since the whole area was about to be redeveloped as Battery Park City. Both Riley and Sedgely
were inspired by the idea of working in this way, Sedgely long having cherished the idea of cre-
ating an “artists’ community”, a notion which he in turn had borrowed from Vincent van Gogh.
The time was right: the number of artists graduating from art schools had risen steadily in
the light of the 1960 “Coldstream Report”, actually the “First Report of the National Advisory
Council on Art Education 1960”, chaired by Sir William Coldstream, and reporting to the Min-
ister of Education (Coldstream, 1960). This had not only sought to put art education on a firm
footing through the introduction of a National Diploma of Art and Design but had also foreseen
a consequent rise in the number of students pursuing such courses: its final recommendation
was a programme of new building to cope. Prescient indeed, for the number of students enrolled
on “Dip AD” courses rose from just over 1400 in the academic year 1963/64, the year of its in-
troduction, to over 5000 in 1965/66, exceeding 7300 a decade after it was proposed (Statistics
of Education, 1964–19721).
So Riley and Sedgely’s project went ahead. Its start was inauspicious: in “a moment of
enthusiasm” they visited a warehouse in Southwark which had been offered to Sedgely. It
formed part of the Marshalsea Debtors’ Prison, originally closed down in 1842, and sited just
north of St George’s Church, in Borough High Street. Utterly derelict, and with a nervous land-
lord seeking an economic—in other words not affordable—rent, the building was briefly used,
but proved in the end quite unsuitable. No bad thing perhaps, for a better alternative, immedi-
ately east of Tower Bridge, awaited them (Riley, 1998, interview; MacRitchie, 1996:6).
In fact it turned out to be a much better alternative. St. Katharine’s Dock had been closed
by the Port of London Authority in 1967, and the story of how it came to be the East End’s first
artists’ studio block owes a lot both to coincidental social contacts, and persistence on the part
of those who initiated the project. Initially spotted by Sedgely and Riley after an evening out
with some friends, it rapidly became apparent that warehouse buildings such as those at St.
Katharine’s Dock might be just what they were looking for (MacRitchie, 1996:6). An actress
friend of Riley’s, Irene Worth, knew the head of the PLA as a “dining acquaintance”, so Riley
and Worth wrote to him asking for a meeting at which they could discuss the possibility of rent-
ing St. Katharine’s Dock, or at least a part of it, for use as artists’ studios. They discovered that
the Greater London Council had recently acquired St. Katharine’s Dock from the PLA, and al-
though the GLC had put the Dock on the market, and made it the subject of a competition for its
regeneration, they did not expect to sell it for some years. The GLC was also aware that empty,
1 These figures are taken from Statistics of Education for the years 1963 to 1970. They cover full and part
time students taking the National Diploma of Art and Design in England and Wales (cf Appendix 3).
The Early Years, 1968–1974 3

St. Katharine’s Dock would be an easy target for vandalism (Riley,1998:interview). So after a
meeting with Desmond Plummer, the Head of the GLC, attended by Riley, Worth and Professor
Tony West, then in the Faculty of Urban and Regional Studies at Reading University, Riley and
Sedgely were given permission to occupy the Ivory Warehouse on condition that they relin-
quished their Squatters’ Rights and started their own company: they called it Arts Services
Grants Ltd. ASG’s umbrella covered two organisations, both founded by Riley and Sedgely.
SPACE—Space Provision Artistic, Cultural and Educational provided studios, while AIR—Art
Information Register—was a relatively short-lived non-selective registry of artists holding
slides of artists’ work, and brief biographies, set up as a direct response to the decline of the
West End art market described above (MacRitchie, 1996:7). AIR was also the name later given
to ASG’s gallery, again a relatively short-lived initiative. (Riley, 1998:interview; MacRitchie,
1996:6). They took on a three year lease of the Ivory Warehouse (figs. 4.1–4.2) and the Match
Shed, both semi-derelict, with every floor covered in pigeon guano, and without even the most
basic amenities. Even so, offers of help came in fast enough, and a core group of Riley, Sedg-
ely, Peter Townsend, Irene Worth, Tony West and, slightly later, Heather Lee and Richard
Leechman became established at the heart of SPACE (Riley, 1998:interview).
The project garnered a lot of publicity, not all of it friendly. Some art critics fiercely op-
posed the whole idea, Riley recalls, not least because the initiative of SPACE sat in direct oppo-
sition to the traditional notion of the solitary artist toiling heroically away in a freezing garret
(Riley, 1998:interview). Some artists and indeed art schools also criticised the idea, although
their motives seem less clear (ibid). An over-riding fear that the artists would be incapable of
self-organisation ultimately proved ill-founded. Catherine Lampert, currently the Director of the
Whitechapel Art Gallery, had a studio in Ravenscroft Studios in the early 1970s and recalled
that “certainly the attitude in the 70s in the Arts Council was it [was] awful that they lived in
their studios, not only for health and safety, but it suggested that artists weren’t serious”
(Lampert, 1998:interview). MacRitchie (1996:7) reports that Sedgely held the view that the Arts
Council was piqued that AIR in particular was “doing something they should have been doing
themselves”, and that the Council was also unhappy with the non-selective nature of the Regis-
try, the general principle of self-help and the fact that AIR and SPACE were clearly very suc-
cessful. By the time the Registry was closed in 1975, as a direct result of the Arts Council cut-
ting its funding, it had some 600 artists on its books (ibid).
The criticisms and indeed confusion—the Arts Council did in fact contribute to the estab-
lishment of SPACE studios in St. Katharine’s Dock, as did the Gulbenkian Foundation (Archer,
2001:3)—over the Arts Council’s role in all this comes as little surprise in view of its histori-
cally ambivalent attitude to “the arts” in general. The root of this ambivalence lies in the Arts
Council of Great Britain’s Royal Charter, granted in August 1946, which required it both to in-
crease accessibility to the arts, and to improve their execution (Hewison, 1995:43). The problem
was that quality and quantity were constantly playing one against the other, and throughout its
history the Arts Council of Great Britain tended to prefer quality to quantity. Its inability to
solve this dichotomy has been explored in more detail by Hewison (1995). As we shall see in
The Early Years, 1968–1974 4

the next three chapters, this combined with spending cuts in the 1970s and 80s to make it un-
popular with both those in the art world and those in Government: arts projects big and small
closed down—AIR was just one example of this—and there followed its eventual demise and
reconstitution in 1995 as the Arts Council of England, with a more limited remit than its prede-
cessor (ibid).
But clearly, and from the very beginning, as Riley and Sedgely had already demonstrated,
the artists were serious. So while Peter Sedgely worked behind the scenes in an administrative
and management capacity, Bridget Riley visited people, drumming up support (Riley,1998: in-
terview). In the event the Arts Council gave a £3000 grant for lighting and partitions, and Henry
Moore, who had just won an award which required that half the prize be given to a “good
cause”, decided that SPACE fitted the bill, and the studios were consequently equipped with
heaters (Riley, 1998:interview; MacRitchie, 1996:6). Max Rayne also gave money, as did the
bankers Kleinwort Benson, contacted through friends of friends (Riley, 1998:interview).
So in only a short period of time, roughly ninety, mostly self-selected artists had estab-
lished a base there, and the idea of an artists’ “community” became a reality. By Christmas
1968, SPACE was ready for a party to celebrate its success for which Robert and Lisa Sains-
bury provided the food (Riley, 1998:interview). St. Katharine’s Dock was now well and truly
up and running. Early criticism that it was not selective failed to stick, and perhaps it was this
fact—that anyone could have a go—which encouraged others to take similar initiatives.
The atmosphere at St. Katharine’s Dock in those early years of SPACE was, it seems,
close to the open, creative and communitarian spirit for which Sedgely had hoped, as Robin
Klassnik, the founder of Matt’s Gallery, recalls.
Robin Klassnik:
In ’68 I graduated from Leicester College of Art studying painting, came to London. My
friends lived in London. I came to London as a [graduate], and, I don’t know how, but read
somewhere that there were studios going at St. Katharine’s Dock. Went down there, got a
studio immediately, and became one of a hundred artists at St. Katharine’s Dock, and it was
amazing, quite amazing. I was young, I was 21, and there were people there that I’d heard of
such as Bridget Riley, who started it with Peter Sedgely.
…And it was, those two years were far more important to me than the five years at col-
lege. I seemed to learn much more being with other artists.
…It was a little open plan, but it was like a vast community. We installed our own
kitchens and all ate there, and we’d all go out, not all hundred drinking at night, but there’d
be, it was quite, it was 1968, so it was quite communally oriented. And yes, the studios
were much more open, there was far more talk going on between a hundred artists, because
it’s for the first time. So in a way, in some ways it could have been bad, because it was
like an extension of being at college, and a safe kind of world, but I learnt an awful lot, and
had to give up painting immediately once I got there because of the structure of the build-
ing. The way the space was so large… (Matt’s Gallery, 1998:interview)
The Early Years, 1968–1974 5

Although Klassnik “gave up painting” many artists did not. Indeed, SPACE’s original proposal
made reference to the “greater scale on which painter and sculptors are working” (Archer,
2001:3) and, although Riley’s work did not increase in size once she arrived at St. Katharine’s
Dock (SPACE, 1970), it had in the years preceding SPACE: her 1964 painting Shuttle 1 was
just 44 inches square; Late Morning, made in 1967 was 141 inches by 89 inches, nearly three
times the size (Stangos, 1981; Lynton, 1980). The scale on which the Abstract Expressionists
worked—in particular Barnett Newman and Jackson Pollock—had influenced the western art
world: London was not immune.
Indeed, it might be argued that St. Katharine’s Dock unwittingly brought to fruition one
aspect of a cultural revolution envisaged by the writer Alexander Trocchi in the Sigma Portfo-
lio, a collection of essays and papers, which he wrote during 1964 (Hewison, 1986:108). One of
these papers, “Sigma, a Tactical Blueprint”, was reprinted in the Journal of the Architectural
Association, and so reached a far wider audience than those which had merely been circulated
amongst Trocchi’s friends and associates, although not, it seems, Sedgely and Riley. But it is
here that we find Trocchi’s idea for an artistic community set out (quoted ibid:110):
The original building will stand deep within its own grounds, preferably on a river bank. It
should be large enough for a pilot-group (astronauts of inner space) to situate itself, orgasm
and genius, and their tools and dream-machines and amazing apparatus and appurtenances;
with outhouses for “workshops”; large as could accommodate light industry; the entire site
to allow for spontaneous architecture and eventual town planning.
As it turned out, the original assay of this project at a Quaker community during a summer’s
weekend in 1964 turned into a disastrous concoction of drink and bickering which served only
to terrorise their hosts (ibid). But in Trocchi’s “Tactical Blueprint” we can see shadowy predic-
tions of what would succeed a few years later in East London, not so much in the fact that Troc-
chi envisaged a riverside setting for the community nor even for its ambitious goals of
“spontaneous architecture and eventual town planning”, but in the scale and general nature of
the project, summed up in the phrase “light industrial”.
So before moving on, it is worth looking at what it was that made the St. Katharine’s
Dock project possible, and to do that we need first to take a closer look at the circumstances
surrounding St. Katharine’s Dock at the time. We know from the previous chapter that the col-
lapse of the docks was dramatic, and we know that St. Katharine’s were among the first docks
to be closed down. In fact, the speed of the collapse caught the GLC, the local authorities and
the PLA completely by surprise. The PLA sold St. Katharine’s Docks to the GLC for £1.25 mil-
lion, and the Conservatives then in power at County Hall initiated an open competition for their
reuse (Hall, 1998:892). This left a gap. St. Katharine’s Docks closed in 1967, the competition
brief was published in 1969, and until the winning developers, Taylor Woodrow, moved in, the
buildings were destined to stay empty. And by a happy coincidence, two artists were looking
The Early Years, 1968–1974 6

for cheap studio space, and seeing the opportunity presented by St. Katharine’s Docks, grabbed
it.
The Early Years, 1968–1974 9

The Early Years, 1968–1974 1
Figure 4.1 1968, and SPACE opens for business at St. Katharine!s Dock
1968
>100 artists
50-100 artists
20-49 artists
5-19 artists

The Early Years, 1968–1974 2
Figure 4.2 Above: Ivory Warehouse at St. Katharine!s Dock. (Davis, 1990:100)
Figure 4.3 Below: Conceptions in Space! by Roelof Louw. This studio was in Stockwell in south-west London, but illustrates the way in which warehouse spaces could be exploited artistically (Hewison, 1986:175).

The SPACE project, then, seems to have been driven by a combination of necessity and ideol-
ogy, in the form of Sedgely’s need for a studio, and his desire to form some kind of artists’
community; these two factors were of course underpinned by the rise in the number of artists
graduating from college, and by an uncertain property market. Importantly, Sedgely was not
alone, and in Riley found an ideal working partner: while he remained behind the scenes, she
“fronted” the project, visiting people who might be able to help and drumming up support for
their idea. And in their searches for this support, they relied on social networks of which they
were already a part. So their initial contact with the Port of London Authority was through a
friend who knew the head of the PLA as a “dining acquaintance”, while other contacts such as
Professor West lent kudos to their ideas. In the GLC they found a potential landlord with the
flexibility to look favourably upon new and untried initiatives, and the pragmatism to make the
demands necessary to encourage the artists to establish a firm footing for their project. The con-
text then was one of fluidity, both in the property markets and the art world, which allowed
such initiatives to happen. Even so, Riley, Sedgely and the others had to work within existing
structures—setting up their own company for example—which meant that their idea would not
founder on its own instability. Indeed, a robust approach was essential to the survival of what
was a fragile initiative in an unstable context.
But by 1971, the competition to redevelop St Katharine’s Dock was decided, and the de-
velopers were ready to move in. The artists were evicted, and forced to look elsewhere for po-
tential studios. An old school at Stepney Green and a clothing factory in Martello Street in
Hackney were taken over, housing roughly seventy artists. 45 Tabernacle Street was also
pressed into service, providing spaces for a further 21 artists.
Only a short while after SPACE left the riverside, Butlers Wharf, a vast disused ware-
house complex, operated by the Butler’s Wharf Company and used for rubber, spices, wines
and spirits amongst other things (Ellmers & Werner, 1988:96) crept in to the picture. Directly
opposite St Katharine’s Dock on the south bank of the Thames, Butler’s Wharf became estab-
lished as an artistic haven rather different from St Katharine’s Dock. Maurice Agis, later a co-
founder of Chisenhale Studios, was at Butler’s Wharf from 1975 to 1981:
…basically, I think there were about 300 people there at one point… it was a huge area,
lots of artists… but the thing is it was a very mixed bunch of people. I mean there was
Dance X, which is now Chisenhale Dance Studio, there were printers there, there were fur-
niture makers, there were artists of different kinds. It wasn’t all painters like here
[Chisenhale Studios], or sculptors, it was a much more mixed bag. I think the thing that
was impressive, it was kind of much more community-based and it was all very ad hoc and
there was no organisation as such as you understand it. There wasn’t an organised group
that moved in, worked and then moved away.
Rent was cheap… Punk rock, there was a lot of groups getting down there and rehears-
ing stuff. …the activity was very organic, we didn’t have exhibitions so much, …there was
literally no organisation, it was very anarchistic. There were parties, a lot of events. …I
The Early Years, 1968–1974 10

think it was very active, I think it was very conducive to creative activity. (Agis,
1998:interview)
Agis found his studio through word-of-mouth, and rent was paid to the landlord through a third
party, “a rather Colonel Blimp type, who was a benevolent character, but who used to make
sure we all paid our rent on time, and if we didn’t, little letters would come” (ibid). In 1979,
parts of the building were closed down to the artists, and as rumours began to circulate that re-
development was likely, a group of artists collaborated at a more formal level, with support
from lawyers, to fight the evictions which now looked probable. Despite their efforts, which in-
cluded getting the press involved and presenting proposals for turning part of the complex into
managed studios, the artists were evicted in 1981, and Butler’s Wharf was redeveloped in the
1990s, with restaurants, gift shops and apartments.
The origins and organisation of Butler’s Wharf and St. Katharine’s Dock were quite dif-
ferent. Whereas St. Katharine’s Dock was the subject of a formal proposal to the GLC (Riley,
1998:interview), Butler’s Wharf, no longer operated by the Butler’s Wharf Company which had
in 1972 ceased to operate its wharves (Ellmers & Werner, 1988:92), was simply let out to any-
one prepared to pay rent to the landlord (Agis, 1998:interview). SPACE was founded with a
view to forming an “artists’ community”, while Butler’s Wharf became one. Yet despite these
differences, the artists were permitted to remain for only as long as that was the best financial
option for their landlords. It is reasonable to argue that in both cases, the artists were a useful
“holding option”, providing a trickle of income where there would have been none, and procur-
ing rudimentary maintenance for the buildings. The pattern which has emerged since the early
1970s, originally at St Katharine’s Dock, later in that decade at Butler’s Wharf, SoHo in New
York, a story memorably told in Sharon Zukin’s Loft Living (1982) to which we shall return,
and more recently along an axis taking in Brick Lane, Hoxton Square and Old Street suggests
that there are cases where the presence of artists does indeed help breathe life back into such re-
dundant areas (BAAA, 1993:27). But although artists may be early beneficiaries of industrial
decline, should the area they are in become the subject of regeneration, then they are likely to
be priced out of it, even if they are not on short lease anyway. Despite the differences in their
organisational structures, both St Katharine’s Dock and Butler’s Wharf Studios were unable to
resist the pressures of the property market, and both groups of artists were obliged to look else-
where for space. How they did that is a story to which we shall return. First though, we shall ex-
plore an approach to providing studio space rather different from those of St Katharine’s Dock
and Butler’s Wharf: the housing association.
4.3 … New Life for Old Houses
When Jonathan Harvey left Reading University in 1973, he, like many other graduate artists,
decided to come to London, where he met David Panton through a mutual friend (she would
The Early Years, 1968–1974 11

subsequently become Panton’s wife). But while London offered the best career opportunities
for fine art graduates, it did not offer the cheap living and working accommodation which Pan-
ton and Harvey actually needed. They were not alone in this, and knew it: crucially, they de-
cided to do something about it, then did it.
Jonathan Harvey:
…the philosophy was developed from the notion of self-help. The people who were in-
volved in setting up the original project were artists in the main. They’d come to London,
they were faced with the economic problem of trying to find somewhere to work in order to
be able to sustain their practice. We were aware of enormous quantities of empty short-life
GLC housing stock due for development. [There were] two paths in terms of obtaining that
property—either through squatting or legally through forming a housing association.
So the initial philosophy was about wanting to get enough property to deal with the
immediate needs of the seven people that you need to form a housing association.
(Acme, 1997:interview)
David Panton:
There was a degree of desperation there. I mean we did know of the existence of the organi-
sation of SPACE for example.
But that presupposed that you had somewhere to live, and we were in the position of
having zero as far as having living space, working space or indeed money, so we could not
avail ourselves of what cheap studios were already available, so we had to start literally
from scratch.
(Acme, 1997:interview)
The founding members of Acme were thus a “part of the general migration into London” on
which graduate artists would embark to establish themselves (Acme, 1997:interview). As ever,
the “grapevine” proves crucial to our story, and so too does serendipity. Like so many artists
since, Harvey and Panton found out about the East End through pre-existing contacts, friends
from Reading University who had come to London a year or two before Harvey and Panton,
and had “stumbled on East London and found that there was so much property because of po-
tential development schemes, I think organised by the GLC, and had stumbled on the notion...
of forming a housing association” (Acme, 1997:interview). It is perhaps worth laying to rest
here the interesting question of whether Professor Tony West, who was of course instrumental
in supporting SPACE in their early days and was also at Reading University, knew Harvey and
Panton. In fact he did not, and the “Reading Connection” is merely coincidental (Harvey,
1999:personal communication).
However, the criteria for the formation of a housing association demanded more (actually
seven) people. It was only on the arrival of Harvey, Panton and some friends of theirs, all Fine
Arts graduates from Reading University, that the critical mass of seven people existed; they es-
The Early Years, 1968–1974 12

tablished a housing association, and choosing “the most clichéd name we could find” they
named it Acme (Baker, 2000:Acme Interview). The basic aim at inception was little more than
survival and there was no specific intention of providing a service for other artists; but having
been successful in their use of this mechanism, Acme were targeted by the GLC who had be-
come keen to hand more property over to them.
Jonathan Harvey:
The GLC at this time had enormous quantities of empty property and they were using
housing co-ops and associations to take those up. A number of those other groups who
didn’t consist of artists but were dealing with people that had particular housing needs were
actually unable to take a lot of property because it was in too poor a condition. …Because
we were dealing with artists who themselves were very capable physically, practically, of
actually taking a fairly derelict house and making use of it, we were able to attract far more
property than other groups. We’d never say no to a house. We’d take on houses that were in
absolutely appalling condition because there was the energy and the need. Property came
very rapidly. Within a year we were managing something like sixty, eighty houses.
(Acme, 1997:interview)
David Panton:
It’s a classic point about artists very directly being a regenerative force, that the whole no-
tion, the whole activity and practicality of being an artist is quite suited to doing that kind
of, making something out of nothing. It may be extremely unorthodox, sometimes it can
turn out to be perfectly orthodox, but nevertheless, artists, when presented with that situa-
tion, don’t go particularly floppy.
We felt an obligation… the Council were busy throwing properties at us because what
we had done off our own bat actually represented a very good bargain as far as they were
concerned. We were a “best option” in quite a number of circumstances for them to off-load
more property.
What we had done was entirely self-help, and with this particular ingredient we had cre-
ated, if you like, something out of nothing to suit ourselves. We were in a position to be a
conduit, a pipeline to legitimate other people’s access to the same kind of thing. Service
does not arrive at that point. We were not going around doing things for people, we were
allowing artists to do it for themselves.
This I think would be the thrust for most of the formative years. …Our service in a
sense was that we had the appropriate legal entity that allowed people to do this, and ninety-
nine percent of it was actually through self-help.
(Acme, 1997:interview)
The mechanism was relatively simple. The GLC would offer Acme a house with a limited life,
and Acme would rent it from them. The house would come with a grant for its refurbishment,
The Early Years, 1968–1974 13

and the cost of the rent would be passed on to the artists who took the house over.
The result of this was that Acme found themselves with more housing than they needed.
However, they knew of other artists who needed cheap accommodation, and began to shift from
being a self-help group to an organisation which could provide a service for others (Acme,
1997:interview). The enormous quantities of short-life housing(figures 4.4–4.5, p.72) which the
GLC had available, combined with a policy of encouraging housing associations, meant that
Acme’s growth in the early 1970s was rapid. They had registered with the GLC in late 1972,
persuading them to transfer two derelict shops in Bow to Acme on 21 month leases. By Decem-
ber 1974, Acme managed 76 houses, providing living and working accommodation for 90 art-
ists (Acme, 1995:14). Harvey and Panton, the core figures in the group, found their time in-
creasingly taken up by administration, but Acme was by now a going concern. With the help of
funding from the Calouste Gulbenkian Foundation, they became part-time officers (ibid).
Acme, then, was supported by the GLC at a practical level. But it seems that political con-
siderations meant that supporting Acme, and in effect encouraging artists to move in to houses
from which local people had been evicted, was not a policy about which the GLC felt it could
be overt.
Jonathan Harvey:
The GLC didn’t really want to know that it was artists. They were happy that those proper-
ties were being used, were being maintained.
They didn’t want, at a kind of “officer level”, it really to be known about that. That the
major user was artists. That was kind of irrelevant, and it might have made things slightly
difficult.
(Acme, 1997:interview)
David Panton:
Because all this, obviously, was operating under the housing policies of the day, which cer-
tainly weren’t about cultural regeneration or flexibility or other things coming in. It was
pretty dogmatic left-wing housing policies at the time.
(Acme, 1997:interview)
The “dogmatic left-wing housing polices” had arrived on the back of a Labour victory in the
April 1973 GLC election, and the party that came into power was considerably more Left-lean-
ing than its mid-sixties predecessor: the manifesto was bluntly and unequivocally titled The So-
cialist Strategy for London (Young & Kramer, 1978:151). Unsurprisingly, the Conservative
Government’s policy of encouraging the privatisation of the housing sector found little favour
in the new GLC whose policies, anathema to the Conservatives, included the acquisition of pri-
vate housing to be turned to municipal stock: this was a policy still more readily pursued after
the replacement in February 1974 of the Conservative administration with a minority Labour
government (ibid:160).
In the light of such changes and policies, it is not so bewildering that the GLC chose not
The Early Years, 1968–1974 14

The Early Years, 1968–1974 1
Figure 4.4 Above: Old Ford Studios, 1983.
Figure 4.5 Below: Orsman Road Studios before conversion, 1983Photos: Acme, 1995:16

to advertise the fact that short-life housing, rather than being acquired for conversion to munici-
pal stock, was instead was being handed over to Acme, and thence to artists who might not be
seen as the most deserving candidates for accommodation. For the fact remained that the de-
cline in industry and the docks in the East End, which threatened not just jobs but the communi-
ties which had grown up with those livelihoods, meant that artists were unlikely to be made
welcome in their new environment: there existed a genuine risk that they would be perceived as
benefiting unfairly from others’ misfortune.
David Panton:
There were several kinds of hostile environment in East London. There was what you might
regard as the general one, a suspicion of strange people coming in, especially if they were
beginning to inhabit properties that previous occupants had actually been forcibly removed
from, through processes of slum clearances and ending up in tower blocks. But also prevail-
ing, on a cultural level was the whole sort of argument between community art and individ-
ual art, and it got quite Orwellian. … “community art good, individual art bad” was a pretty
pervasive local government attitude towards art. What we were doing, we felt, was desper-
ately trying to support, if you can phrase it like that, individual art activity.
(Acme, 1997:interview)
The “Orwellian” attitude of the local authorities at this time was perhaps to be expected. 1972,
the year of Acme’s inception, also saw the removal of spending limits for local authorities, and
as they grew keener to support the cultural and social heritage of the area, so they took an in-
creasingly pro-active role in promoting the arts for these purposes (Whitechapel, 1995:5). And
in 1974, the Arts Council had formally endorsed the notion of community arts after extensive
lobbying from Free Form Arts Trust, amongst others (Free Form, 1997:interview). For organi-
sations such as Acme, then, the safe option was to keep a low profile. As Jonathan Harvey
points out: “…it’s only at abolition that the GLC felt it could then recognise what had previ-
ously happened, and to lay claim, or to claim credit for the fact that they’d helped so many art-
ists indirectly” (Acme, 1997:interview).
This belated change of heart on the part of the GLC, like the agglomeration of artists in
the East End itself, has its origins in the dynamics of changing from an industrial to a post-in-
dustrial economic base (Hewison, 1995:238). The GLC Labour Group’s winning 1981 mani-
festo carried little mention of the arts. By 1986 however, the decline of the old industrial con-
stituencies and the emergence of new ones meant that the voters who needed wooing now came
from a variety of backgrounds, cultures or even countries: the arts were seen in this context as
the cutting edge of a “radical social and economic agenda” (ibid). Ironically though, Acme had
by this time ceased to take on short-life housing—which enjoyed a dramatic shift in status from
unwanted to desirable, as we shall see in chapter six—choosing instead to concentrate on light
industrial property.
The Early Years, 1968–1974 16

But in the early 1970s the GLC’s housing policy was somewhat shambolic, and furthermore it
was also the subject of tense political wrangling which tended to stifle any initiatives on this
front: it is useful to revisit Ken Young’s observation, cited in the last chapter, that “…the re-
source deficiencies of the GLC are not statutory, but arise from a lack of information on local
housing and land-use situations, combined with a lack of appreciation of local political condi-
tions” (Young, 1977:19, emphasis added). Acme, of course, could only benefit from this.
The contextual picture which emerges then is one of fluidity. Politically, and in terms of
its housing policy, the GLC was turbulent: and importantly, planning and building regulations
were less stringent than they are now. The historic buildings lobby was then in its infancy hav-
ing been galvanised into action by Hermione Hobhouse’s unsuccessful campaign to save the
Euston Arch from demolition. But at this time, semi-derelict 19th century houses in the East
End of London were not high on the agenda.
David Panton:
You could take liberties with property then [the early 1970s] that one wouldn’t dream of do-
ing now. And that was the whole context of dealing with property. Things were pretty
lackadaisical and non-problematic. So the notions of self-help on a fairly primitive do-it-
yourself basis fitted in fairly well. To have that sort of attitude now would get you into big
trouble
(Acme, 1997:interview).
Self-help in one form or other is a recurring theme, and central to the histories of the two other
studio organisations formed in the early 1970s, Barbican Arts Group and New Crane Studios.
The Barbican Arts Group was established in 1972 as an artists’ collective, intended to
provide affordable work space for “painters, sculptors, photographers, printmakers, ceramicists
The Early Years, 1968–1974 17
SPACE
St Katharine!s Dock 100 artists
Columbia Road
45/47 Tabernacle St.
Martello Street
71 Stepney Green
Old St Patrick!s Church, Buxton St.
124-130 Tabernacle St.
New Crane & Metropolitan Wharves
Bombay Wharf
Acme Housing Association
Acme Short Life Housing
Independent Studios
Butlers Wharf Studios
Ravenscroft Street
Barbican Arts Group, Sycamore St.
New Crane Wharf
1968 1969 1970 1971 1972 1973 1974
6 artists
21 artists
37 artists
31 artists
22 artists
22 artists
22 art!s
5 art!s
Figure 4.6 Studios in the East End, 1968–1974.
»»»»»»»»
»
»»»»
7>>90 artists
80 artists
5 artists
15 artists
6 art!s
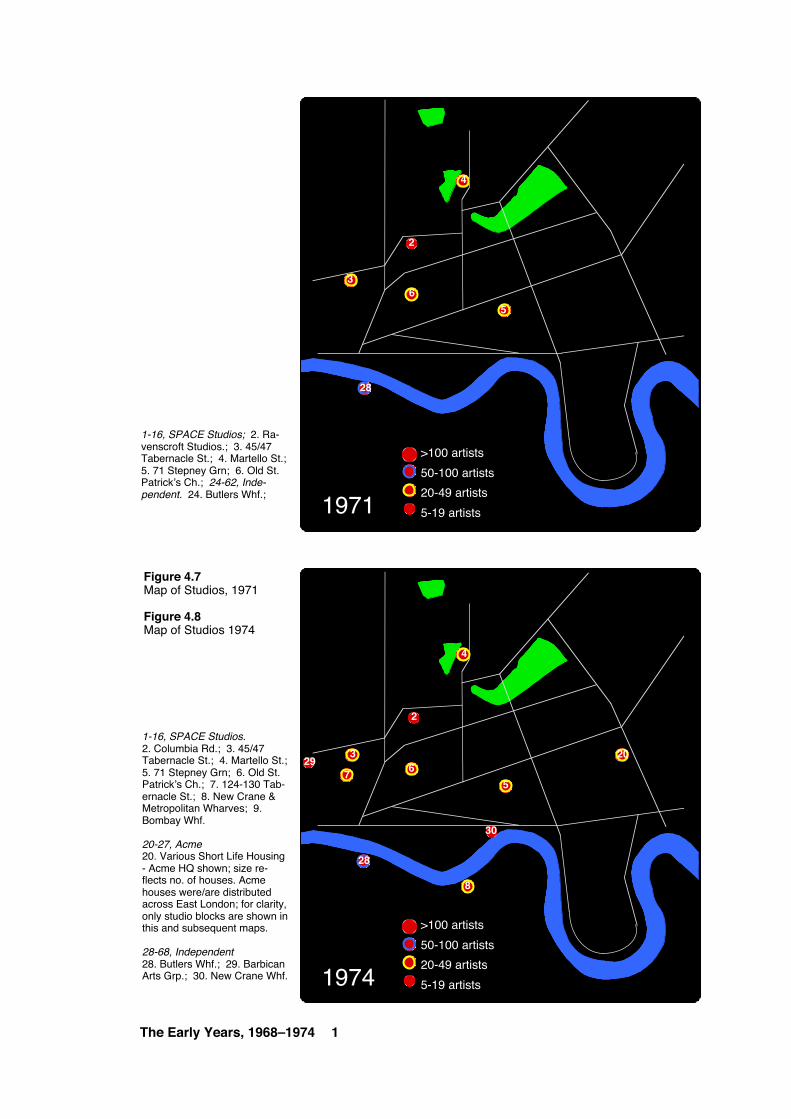
The Early Years, 1968–1974 1
1-16, SPACE Studios; 2. Ra-venscroft Studios.; 3. 45/47 Tabernacle St.; 4. Martello St.; 5. 71 Stepney Grn; 6. Old St. Patrick!s Ch.; 24-62, Inde-pendent. 24. Butlers Whf.;
1-16, SPACE Studios.2. Columbia Rd.; 3. 45/47 Tabernacle St.; 4. Martello St.; 5. 71 Stepney Grn; 6. Old St. Patrick!s Ch.; 7. 124-130 Tab-ernacle St.; 8. New Crane & Metropolitan Wharves; 9. Bombay Whf.
20-27, Acme20. Various Short Life Housing - Acme HQ shown; size re-flects no. of houses. Acme houses were/are distributed across East London; for clarity, only studio blocks are shown in this and subsequent maps.
28-68, Independent28. Butlers Whf.; 29. Barbican Arts Grp.; 30. New Crane Whf.
Figure 4.7Map of Studios, 1971
Figure 4.8Map of Studios 1974
1971
>100 artists
50-100 artists
20-49 artists
5-19 artists
3
6
2
28
4
1974
>100 artists
50-100 artists
20-49 artists
5-19 artists
29
2
76
28
3
4
5
30
8
5
20

The Early Years, 1968–1974 1
Figures 4.9 & 4.10New Crane Wharf, circa 1974. Home to both New Crane Studios (until 1984), and later studios run by SPACE (until 1987), the wharf was one of the earliest studios in Wapping.
Photos: Ken Oliver

The Early Years, 1968–1974 2
Figure 4.12 Interior of New Crane Wharf, circa 1974. The attraction to artists of such expansive work
spaces is readily apparent in this photograph. Photo: Ken Oliver
Figure 4.11 View across the River Thames from New Crane Studio, circa 1975. Property developers
had not yet cottoned on to the desirability of such vistas. Photo: Ken Oliver

founding artist, Ken Oliver, relates:
I left the Royal College in ’74. I did printmaking and wanted to set up a print workshop,
me and a friend, and obviously we were looking for the cheapest and the largest spaces we
could get. We went to SPACE and they said “well we’ve got this block in Wapping that
we’re looking at”. They hadn’t decided whether they were having it or not, so we got in
touch with the landlord at the same time as SPACE did, and took this, got a group of us
together, because it was quite a big space, about 4000 square feet.
[There were] about six of us. We had one end as a painting studio, four, five painting
studios—it was left as sort of open plan—and then the other end was an etching workshop,
where people came in and hired the space on a day rate, which generated income for paying
for the whole floor basically (Fawe Street Studios, 1998:interview).
The similarities with previous initiatives—a group of arts graduates in need of cheap work
space—are familiar enough, but there are two points about the dynamics of the process which
need highlighting. The first is an observation: compared with SPACE, Oliver and his friends
were able to move quickly in their acquisition of New Crane Wharf, not least because they
could operate as a small autonomous unit. The second is the fact that the source of Oliver’s in-
formation about New Crane Wharf was SPACE. In other words the New Crane Wharf group
benefited from knowledge originally acquired by SPACE, and subsequently shared by them to
enable the founding, or finding at least, of the Oliver group’s studio. This is intriguing simply
because it is another example of the way in which the transfer of information contributed to the
survival not only of individual artists and a single group of artists, but also to the growth of the
East End arts community as a whole. If we think of this community as a system—and this is a
point we shall explore in greater detail in chapter nine, and merely touch on here—then we can
argue that the system is learning through information transfer, and becoming stronger as a con-
sequence.
In the event, SPACE did finally establish studios in both New Crane Wharf and the adja-
cent Metropolitan Wharf: both generated spin-offs; Cable Street Studios from Metropolitan
Wharf and Fawe Street Studios from Ken Oliver’s New Crane Studios (figures 4.6–4.12). We
shall come back to these later, but first we shall pause and look back at the terrain we have al-
ready covered.
The Early Years, 1968–1974 21

4.4 Discussion
We do not have to look so very far back to get our initial bearings: partly as a result of the
“Coldstream Report”, partly in response to the fashionable nature of the newer art forms such as
Pop Art, the number of of fine art graduates had increased considerably during the 1960s. Many
came to London and in so doing fuelled a steady and largely unmet demand for studio space:
the majority of artists simply worked from home in the absence of anything better. However the
cultural climate both generally and in the London art world at the end of that decade was not a
comfortable one. Many contemporary art dealers had gone out of business, in turn leaving some
artists without the conventional means of selling work.
The winds of change did not stop dead once through the gates of art and culture. The en-
suing turbulence whipped up both confusion and anger as the beginnings of de-industrialisation
made themselves felt: most important was the general decline in the East End’s economic for-
tunes; the decline of its manufacturing industries, the steady drift downstream to Tilbury of its
dock trade, and the steady reduction in population, all described in chapter three.
Of course, from the point of view of the artist, these are all contingent circumstances, and
it is to contingency that we now turn our attention, that serendipitous combination of factors
without which the artists’ ideas quite possibly would never have got off the ground, and over
which they had absolutely no control. But for the artist in need of a studio, it was precisely this
de-industrialisation which made available precisely the type of property which the artist could
use as a studio.
In the East End of the early 1970s, then, the GLC had an area which was moving irrevo-
cably into catastrophic decline through circumstances quite beyond its control. But this was an
environment in which SPACE and Acme were able to flourish. The GLC, more by luck than
judgment perhaps, offered practical support to both organisations, not least through its willing-
ness to be flexible and open to new ideas and initiatives which might prove beneficial both in
terms of the physical maintenance of their property base, and in terms of contributing to the re-
generation of the area. The foundations had been laid then: a peculiar construct of artists’ needs,
artists’ visions, and tacit help from the GLC and others, all cemented together with a hefty dose
of contingency.
So by 1974 the number of artists working from studio blocks and Acme live/work accom-
modation in the East End totalled over 350, a figure which excludes artists working from home
or individual studios—the “dark matter” referred to in chapter one. These studio blocks were
spread quite widely across the East End, with small but noticeable concentrations near the River
Thames and in Shoreditch. And although this would not have been apparent at the time, the ba-
sic elements for the current concentrations of studios in Stratford, and along an axis stretching
north from Spitalfields to Dalston were now in place. Thus we can see, admittedly with the un-
doubted benefit of hindsight, that a formative geographical pattern had been established, and al-
though it would evolve, its basic form and the underlying structure expressed therein would re-
main unchanged.
Equally (and as we saw in table 2.1) in the first six years of the East End’s putative new
The Early Years, 1968–1974 22

role as London’s artistic crucible, the basic blueprint of property types which could usefully be
converted to studios was roughed out to a reasonable degree of accuracy, and would be subject
to few additions over the following two-and-a-half decades.
But the first half-dozen years are most notable for the rapid growth and diversification of
a new artistic agglomeration in East London. Both SPACE and Acme were completely new ini-
tiatives which were not guaranteed to be successful. That they were is due partly to the drive of
those in charge and their determination to raise support and funding, partly to the massive de-
cline in East London’s fortunes and partly to the fact that the GLC was flexible—or desperate,
or shambolic, or all three—enough to allow such initiatives the leeway they required to move
ahead. The same can be said of the “independent” studios set up elsewhere during this period.
The diversity of approaches—Acme, SPACE, Butlers Wharf, New Crane Wharf and Barbican
Arts Group all worked along different lines—was perhaps no more than one might expect from
groups of people predisposed to be creative, desperate to survive and with no firm precedents to
follow. Here, necessity was indeed the mother of invention.
But this diversity is not just interesting for its own sake. By coming at the problem of
finding working (and frequently living) space from a variety of angles, the different organisa-
tions, although acting solely on their own accounts, collectively established an agglomeration
which was both resilient and flexible. Had one of the organisations failed, the artists therein
could have moved elsewhere, or started up their own studio: in subsequent chapters we shall see
this process in action. And if for the moment we conceptualise the artists’ agglomeration as an
system that evolves organically—a notion that is explored fully in chapter nine—it becomes ap-
parent that such flexibility, resilience and responsiveness, when combined with the fluid context
of the East End at the time, prove ideal for such a system to flourish.
But in the mid-1970s, something strange happened. Even more rapidly than it had started,
the growth in the number of artists’ studios stopped, almost as if those involved in the initial
race for survival had sprinted to safety and now needed to pause to catch their breath. The ques-
tion, of course, is why?
The Early Years, 1968–1974 23

FIVE
THE HIATUS, 1975–1980
Anarchy for the UK
Is coming sometime, maybe.
The Sex Pistols, Anarchy in the UK, 1976
5.1 Of Politics, Punk (and Painters)
1970s London had more on its mind than fine art. Notable for its political turbulence, 1974 saw
two general elections after the Conservative government was brought down by strikes (its La-
bour successor met the same fate in 1979): the first election resulted in a minority Labour gov-
ernment, while in the second Labour scraped a knife-edge majority of four (Hewison,
1995:160). Unemployment topped the million mark in 1975, and that year Britain confirmed its
1973 commitment to join the Common Market in a referendum which nonetheless saw over
thirty percent of the electorate vote against joining (ibid:161). The post-war consensus which
had survived more or less intact until the late 1960s broke down. The consequence was a “crisis
of national identity that was national, regional and social” (ibid): the National Front rose in
prominence, not least in response to Enoch Powell’s infamous “rivers of blood” speech in 1969,
and the nationalist parties in Northern Ireland, Scotland and Wales all established a firmer po-
litical foothold, much to the concern of the Labour government (ibid:163–171).
Combined with the concurrent economic crisis, the arts were not in the most comfortable
of positions. Theatre, and its “community arts” aspect in particular, had been hit by economic
cuts, and despite its formal support for community arts, the Arts Council’s 1975 Annual Report
reflected the economic climate and was called simply The Arts in Hard Times. Furthermore, the
increasing polarisation of the Labour and Conservative parties was reflected in the Arts Coun-
cil, leading the Labour party to acknowledge in its 1977 document The Arts and the People that
the arts and politics were inextricably linked. However, even with a Labour administration, at-
tempts to democratise the Arts Council proved fruitless, and the art establishment’s hegemony
The Hiatus, 1975–1980 1

was left more or less unshaken, and not particularly stirred (ibid).
In the end it was left to the owner of a King’s Road clothes shop, Malcolm McClaren,to
release the safety valve on the undercurrents of seething resentment. His creation of the Sex Pis-
tols in 1975 was the beginning of punk, an aggressive, (self)-destructive backlash against every-
thing that “the Establishment” stood for. It was led by style: spiked hair, bondage gear, crude
piercings. The music was aggressive, the lyrics brutal and often political. As Dick Hebdige ob-
served, punk tangibly, visibly and volubly responded to and dramatised what was by then re-
ferred to as “Britain’s decline” (ibid).
5.2 The Hiatus, 1975–1980
However the visual arts did nothing quite so dramatic, although punk did spawn a new style of
graphic design which drew on the traditions of collage and montage. COUM Transmissions,
based in Martello Street Studios and perhaps the most notorious “arts group”—the two main
protagonists, Genesis P. Orridge and Cosi Fanni Tutti, specialised in more or less sexually ex-
plicit performance art—eventually formed a punk band which they called Throbbing Gristle.
But how did all this affect the agglomeration of artists in the East End?
As we saw in the last chapter, from 1968 to 1974 the number of artists in studio blocks in
the East End rose from zero to more than 360. But from 1975 to 1980, the number of artists in
studio blocks in the East End actually fell slightly to fewer than 340. Interestingly, the annual
return on industrial property in the UK rose rapidly, peaking in 1978 at 32% before falling
again to 20% in 1980 (RICS, 1999:35): this is a point we shall explore in more detail in the next
section.
In fact only one new studio block—in Metropolitan Wharf where SPACE already had
studios—was established between 1975 and 1979, and that was in 1979. The years 1975
through to 1978 saw no new studio blocks at all in the East End, and activity in terms of the ac-
quisition of space for conversion to studios was confined to Acme’s consolidation of their hous-
ing portfolio.
Yields on industrial property aside, are there other factors which may have contributed to
this sudden, and sole instance of numerical stasis? For example, is it at all significant that new
initiatives at this time tended to be in terms of the art itself and how it was presented? To pre-
empt one of the theoretical preoccupations of chapter nine, if we were to assume that there was
some sort of evolutionary dynamic underpinning the in-migration of artists, how did it change,
and why so suddenly?
Interestingly, the artists interviewed who were active at this time are quiet on this point.
But it would be wrong to argue that nothing was happening. In 1975, SPACE organised the first
East London Open Studios event, subsequently taken under the wing of the Whitechapel Gal-
lery, whereby artists opened their studios to members of the public for a weekend, and in effect
turned them into temporary galleries.
The Hiatus, 1975–1980 2

And then in 1979, Robin Klassnik, who as we saw in the previous chapter was one of the
original artists at St. Katharine’s Dock, but had since moved to Martello Street at London Fields
in Hackney, went a step further, turning his own studio into a permanent gallery:
…in 1972 I did a piece called postal sculpture, “yellow postal sculpture”, which was where
I, by chance, would distribute between 4 and 8 thousand brown paper envelopes. In this par-
ticular postal sculpture, which happened mainly in shops, in places such as Hornsey or
Canning Town (this was at the ICA, for better or for worse doing it in an art gallery
context…) and there was this yellow postal sculpture where I distributed these envelopes
and you’re asked to put a yellow object in and return the envelope, self-addressed envelope,
and I would then make the piece of sculpture out of these yellow objects.
And through that things came from all round the world because I would put these on
windscreens in car parks in Piccadilly etc.. And one of these came from Poland, and we got,
I got a handful of yellow cotton on bobbins, and it was from a guy called Jarislaw Ko-
zlowski. And that was in 1972, and he, I discovered, we started writing to each other and I
discovered he was running an unofficial alternative art gallery in Poland and, in ’76 I think,
he invited me to go over and show. It was showing there that gave me the idea or the con-
cept of being able to use my own studio in Martello Street to open up something on the
lines of what he had.
His was truly alternative, and truly unofficial, for it was originally in his house. And
from there [he] moved into the Students’ Union, where for three days each month for six
hours he would have room in a Students’ Union building—four, five hundred square
feet—where he’d put on an exhibition. For three days, two hours. After he’d started off
showing—Richard Long, Laurence Weiner, John Hilliard, Michael Craig-Martin—they
were established names already, and they were prepared for two hours to make a piece of
work for this space. I was invited, and I made my piece, and I was very touched by the way
it was run.
…Anyway, it gave me the idea to open up, and it took me three years, three to four years
before I actually had the courage to say OK, I have this space in Martello Street, it’s a rea-
sonable space, I have lots of ideas, some of which I can’t quite articulate. You spent lots of
time doing nothing, why don’t I just open up a gallery in this space and try it? And I did
that. I opened up once in ’79, and in fact Matt’s Gallery is one of the first I think, obvi-
ously I can’t categorically say it was one of the first, it was definitely the first over the last
thirty years, a space just to open up, I think there were people around just before me, I
think there were people showing in their houses, Jenny Steiner, I think from time to time
used her house as a gallery, but this was within a studio complex (Matt’s Gallery,
1998:interview).
A wry response to the West End practice of naming a gallery for its owner, Matt’s was named
after Klassnik’s Old English Sheepdog, Matt E. Mulsion. With the help of friends, Klassnik
The Hiatus, 1975–1980 3

cleaned up his space, painted the floor grey, and opened his gallery in 1979 with no idea of how
long his nascent enterprise would last. Klassnik was clearly keen to keep the purity which had
so impressed him at Kozlowski’s shows in Poland.
The first show was by the artist David Trystwick, who worked with Synis as well several
times, and we did the first show. The next show, second show by Gerald Fisher and all the
work since day one was made specifically for the space. Whether it be painting, or sound-
works or sculpture.
…This is where, this would be its first outlet, so the works were made with that in mind.
And it went on, I subsidised it by teaching, it was run on a shoestring budget, the artist
him or her self would have to invigilate with me, or without me if I was teaching on that
day.
(Matt’s Gallery, 1998:interview)
Klassnik’s initiative, and the uncompromising lucidity with which he pursued it, were
perhaps symptomatic of a more general level of confidence on the part of artists in their ability
to survive in what was, prima facie, a hostile environment. Clearly artist-led—such an initiative
could hardly be anything else—experimental, small-scale and risky, the very fact of having the
cheap space available in the first place made it possible to take such risks, particularly since
Matt’s was, in its early days, financed by Klassnik himself (Matt’s Gallery, 1998:information
sheet).
Demand for studios remained sufficiently high across London that Acme had to look else-
where for space. In fact, although the bulk of Acme’s property remained in the East End, Acme
moved its headquarters in 1976 to Shelton Street, Covent Garden, and set up the Acme Gallery
in a disused banana warehouse in the nearby fruit and vegetable market, again with the help of
funding from the GLC, the Arts Council and the Gulbenkian Foundation, and in 1977 Acme be-
came a revenue client of the Arts Council (Acme, 1995:15). In a move prefiguring their policies
from the early 1980s onwards, discussed in the next chapter, new Acme studio blocks were es-
tablished in Brixton and Hammersmith in disused industrial property rather than short-life hous-
ing, which by the end of the 1970s was threatening to become increasingly scarce as gentrifica-
tion took hold, as David Panton explains:
The property boom in the late ’70s and early ’80s put paid to the notion of there being free
or cheap property lying around, with nobody interested in it. Everything suddenly became
very valuable. The local authorities and GLC who did stuff let on a short life basis in one
way or another tried to claw it back in order even to redistribute it within that authority or
resell it off.
(Acme, 1997:interview)
SPACE meanwhile concentrated on consolidating its existing assets in the East End, and
The Hiatus, 1975–1980 4

in 1978 moved its HQ from Shaftesbury Avenue, where it had been based since 1975, to Rose-
bery Avenue on the northern fringe of the City, where AIR Gallery was established as a perma-
nent gallery space (SPACE, 1998: anniversary leaflet).
There is a certain irony in all this: for all that the East End arts scene appears to have been
relatively stable—at least insofar as the number of artists working there remained more-or-less
unchanged—as we saw at the beginning of this chapter, the arts world in its broad sense was of
course undergoing its most significant upheaval since the 1960s, and any initiatives in the visual
arts world at this time were less about survival, as they were in the first six years, and more
about presenting work, and enabling others to survive and present their work. So as well as
starting up the Acme and AIR Galleries, Acme and SPACE co-wrote the leaflet Help Yourself
to Studio Space (Acme/SPACE, 1975), which had the specific aim of passing on the knowledge
gained through their own differing experiences (fig. 5.1 overleaf). And in 1977 Acme commis-
sioned and published the first edition of the Artists’ Guide to London, a compendium of art gal-
leries, shops where artists’ materials could be bought, museums, studios and so forth.
The picture which emerges of the years from 1975 to 1980 is one which indicates that the
East End arts scene, in terms of its physical infrastructure at least, was reasonably stable. True,
it was not gaining artists, but neither was it losing them.
The interesting thing here is that again we see a pattern of relatively rapid diversification
of ideas followed by a consolidation of those that work. Those that did not work simply did not
survive: to put an evolutionary “spin” on the topic, they were selected out. Conversely, those
that had no need to change did not do so. So Matt’s Gallery, for example, had become settled in
its function by 1980, and functioned in much the same way a decade later.
Robin Klassnik:
It’s still the same, even while we’re here [Copperfield Road]. Nothing’s changed except we
have much larger premises, some might say that we now have an institution. I don’t think
we have an institution. We have something which is very similar to its original model ex-
cept it has grown up. I think we’ve always acted as an institutional museum. I’ve often said
that I saw myself as a museum from day one, and I don’t think that was arrogant of us. It’s
a museum.
(Matt’s Gallery, 1998:interview)
Matt’s Gallery then, was the first non-commercial art gallery in the East End after the White-
chapel (although people are not prevented from buying work if they wish to do so). But 1979
also saw the foundation of Art for Offices, the first commercial gallery organisation in the East
End, and in the story of its foundation, we also gain some germane insights into the broader ur-
ban context at the time.
Founder and Director Andrew Hutchinson:
I wanted to have my own business and make some money and I thought, rightly or
The Hiatus, 1975–1980 5

The Hiatus, 1975–1980 6
HOW MANY PEOPLE
ARE INVOLVED?who will be the leaseholder?
who will be responsible for
communal bills?
DOES YOUR GROUP
NEED ANY FORMAL
ORGANISATION?
possibilities:
registered name–
registered company–
housing association–charity
IS IT VIABLE?
FIND EMPTY BUILDINGS
houses–shops–churches–
schools–factories–ware-
houses–other
APPROACH THE OWNERSestate agents–local
authorities–church
commission–private–other
MAKE AN OFFER
negotiate on price
WHAT WILL IT COST?consider cost of:
rent–insurance–rates–
condition of building–
conversion costs–
estimated running costs
IS IT REALLY SUITABLE?investigate:length of lease–planning permission–building regulations–availability of essen-tial services
LEGALITIEScheck out the:
terms of tenancy/your
obligations–whether you can
sublet–
methods of payment
WHAT ASSISTANCE IS
AVAILABLE?contact:
local authority–
regional art association–
arts council–space–acme
WHAT ARE YOUR NEEDS?
living accommodation–studios
space–size, access, do you have
any special requirements?–both
Figure 5.1 Explanatory diagram from the joint Acme/SPACE publication Help Yourself to Studio Space—as relevant in 2001 as it was in 1975.
Source: SPACE/Acme, 1975

wrongly, the biggest market, potential market for art was not in the private sector, the pri-
vate collector, but in the commercial sector, and on a little bit of research, one discovered in
1978 that there was no company such as Art for Offices in the UK except for one, and actu-
ally we started at the same time, 1979, so we were one of two to start this ball rolling.
…You went into Chase Manhattan Bank in New York and they had wonderful paint-
ings and an extensive collection and there were hundreds of companies like that in the
States. There were very very few in the UK—Unilever, a few were starting up then, literally
had only started up in the last twenty years, or twenty-five years maximum, so it’s still
quite early days, and that wasn’t the fault of the companies and the clients. I think they
probably wanted to have art and an art collection, but there was no mechanism for doing it,
other than an enthusiast—the MD, Chairman of the board—actually going out on behalf of
the company and visiting lots of different galleries and acquiring art. We came up with the
concept of having a centralised “one-stop” service where we can do everything from sculp-
ture to signed prints to paintings to tapestries to photography to ceramics, where the client
can rent the art as well as buy it, have work specially commissioned—site-specific
stuff—so we collected artists like crazy, and we’re now up to over 800 on our books, be-
cause we need that range of art.
The reason for settling in Wapping was purely an issue of economics, and getting the most floor
space for the least money.
Andrew Hutchinson:
When you start a business and you’ve got no money, you go for the lowest possible over-
heads and we were paying 50p a square foot rental and we took 3000 sq. ft. in Metropolitan
Wharf as our first space; we ended up with 9000 sq.ft. when we left eleven years ago. Our
rental was 1500 quid a year.
…I did [know there were lots of other artists there at the time]. But it was those factors. It
was low rental, it was adequate space. We were advised initially by a few people we
consulted—business men and so on—that no one would come to Wapping, you know no
business man would ever come to Wapping Wall to a gallery. Where the hell was Wap-
ping? You know, people didn’t go east further than St Katharine’s Dock, you know, it was
unknown territory…
Docklands was a desolate, decaying ghastly area, so no one went there, or came out
alive, or so was the conception! People said “you’ve got to be in Dover Street, you’ve got
to be in Piccadilly, you’ve got to be central, a business man is not going to come to
Wapping”. We proved them wrong, absolutely wrong. They came with their chauffeurs and
probably a few security guards [laughs], but er… we even got the Duke of Gloucester down
one time and he came on his motorbike! But it was no problem, it was an adventure and it
was great and it was successful right from the start.
(Art for Offices, 1998:interview)
The Hiatus, 1975–1980 7

For Hutchinson then, and from his business’s point of view, Wapping could hardly have been
better: overlooking the River Thames, with more than 3000 square feet of space; right on the
edge of the City of London, and with the low overheads typically associated with that sort of
property at that time, Art for Offices both tapped into a new market, and by dint of their locatio
were able to survive despite the prevailing scepticism.
But perhaps the project which most effectively sums up the combination of a broadening
of aims and an increasingly pragmatic response to external factors such as the property markets
was that born of the demise of Butlers Wharf Studios in 1979: Chisenhale Studios, Chisenhale
Gallery and Chisenhale Dance Space, which established themselves in a derelict veneer factory
in Chisenhale Road, Bow. A blue plaque on the brickwork tells us that it was where Spitfire
propellers were made during the second World War, and its brick frontage runs along Chisen-
hale Road, overlooking a Victorian school, in an area which otherwise comprises late 19th cen-
tury terraced houses. Along the back of the studio block, and behind the houses on that side of
the road, runs the Grand Union Canal. Initially there was no financial support for the new ven-
ture, and the thirty-five or so artists involved each donated £90 to a central “kitty” to which they
added £10 each week. This sum was augmented by £2000 which had been raised at a farewell
party at Butler’s Wharf (APT, 1990:4). One of those founding artists was Maurice Agis:
I think the fight came when they started closing it [Butler’s Wharf] down in 1979, 1980.
There were tales of planning, tales of building, tales of development. Then we became a bit
more organised because it was all under threat. Then a group of us got together and created
an organisation which then went to see lawyers—Artlaw.
We approached them and they decided to write letters and we got the press involved. We
came up with a constructive plan. We said that one of the buildings should be put at the
disposal of the artists, paying rent, and should be refurbished. This would have been a fan-
tastic idea. This was the dream, and this was the idea. We tried to persuade the organisation,
company to make over one of the buildings on the front, turn it into studios, proper work-
ing studios. We were looking ahead and thought this would be such an investment for
them, and a fine thing to do. I still think it is and I think it would have been absolutely
fantastic to have one of those buildings. Now it’s too late, you know, but at that time, I
think it would have been a… looking at the future kind of project.
When we were told to leave, a group of us got together, we formed this space, deciding
that never again would we subject ourselves to that kind of, like, bum’s rush. That’s how
APT started. By getting together and deciding to formalise ourselves in a charitable set-up,
and get proper leases and all that kind of thing, get lawyers and stuff involved. Sadly that
kind of activity which I find myself involved in, is pretty flat. It’s like a bloody school half
the time, and it’s only practical in the sense that it kind of like protects you, the building
and you as an individual, but it’s not organic, it has no dynamic, it’s just a place you rent,
and we tried indeed to set this off in a more, like, realistic way with having a strong com-
The Hiatus, 1975–1980 8

munity base and having a gallery for the artists. That’s all eroded, that’s all gone by the
board, and it’s just another arm of the Establishment now. And indeed I think all these or-
ganisations are. They’re about as dynamic as a wet paper bag as far as I’m concerned. Be-
cause they just literally come just simply as a practical thing to safeguard their security.
There’s no artistic or social ideology behind it.
(Agis, 1998:interview)
Agis’s view, of course, although regretful of the fact that there is, and has been no “social or ar-
tistic” ideology behind the foundation of many studios, is basically accurate—the point primar-
ily was to enable artists to work, and to exhibit that work. But as Sue Jones, the current director
of Chisenhale Gallery explains, the studios and the gallery have since drifted apart, and the
original ideology has been lost in the process.
The gallery was left as an empty space when the artists moved in to the building—they’d
planned it to be a gallery. It was a much bigger space then as well. And they really started
by having individual exhibitions, and invited other artists and did educational projects. And
then I think it was ’86/’87 that they took on a curator. And then it wasn’t till ’93 that the
gallery actually became a separate company. A company in its own right with its own
board of trustees. And that was a sort of painful transition.
…[because] the artists really had a sort of specific idea about how it would be when
they started it, and the whole building was very much together as a co-op. And the gallery
moving away and becoming its own place with no attachments to the studios any more was
a difficult thing to comprehend.
NG Was the gallery originally ideologically driven as an artist-led space?
SJ That was very much the idea, yes. …I think because when it was run as an artist-run
space. They realised they needed a curator to drive it to make things happen to build up the
energy and the programme. And then of course having curators meant that the curators
wanted to do what they wanted to do, and to have their own programme and not just show
artists in the building, or be managed by a group of artists. They want to have their own
programme with their own integrity. So it moved away.
(Chisenhale Gallery, 1999:interview)
Chisenhale Studios and Gallery was the first of the “independent” studios to be established
within a relatively formal structural framework, and marked the beginning of a new phase in the
growth of the East End’s agglomeration of artists.
But in the turbulent years leading up to the turn of the decade, it was almost as if the art-
ists had the freedom to act, and the necessary spaces in which to do so; they could simply get on
with their work. They did not need to follow the property markets; that was the job of Acme
The Hiatus, 1975–1980 9

and SPACE, who supplied the studio spaces (figures 5.2–5.4).
However, contemporary debates about the role of art, and the questioning of the modern-
ist “art for art’s sake” ethic, did serve to shift the focus on to how the public money used to fi-
nance arts organisations could be better used to benefit that public. The Labour Government’s
1977 report The Arts and the People, which as we saw earlier explicitly acknowledged the po-
litical dimension of artistic practice, crystallised the official view that the arts could and should
bring genuine benefits to local communities (Whitechapel Art Gallery, 1995).
It was at this time then that the Whitechapel Gallery, originally founded in 1896 by Canon
Samuel Barnett, and completed to the designs of C.H.Townsend in 1899 with financial help
from John Passmore Edwards (Weinreb & Hibbert, 1988:956), began its rise to prominence as
something of a focus for might very loosely be called an East End “arts scene”. The Gallery’s
original impetus had been the bringing of art to the East End’s impoverished and beleaguered
communities, but this “community role” had gradually declined in importance during the dec-
ades since its foundation, as its profile as a contemporary gallery of international stature had
risen. Thus the general shift towards community art helped to recover the original impetus, and
in 1977 an Education and Community Officer was appointed, while the following year the exhi-
bition Art for Society aimed to demonstrate to visitors
...that contemporary art might play a larger role in shaping their daily lives. It will also
succeed if it provokes discussion about the role and purpose of art amongst that “small un-
The Hiatus, 1975–1980 10
SPACE
St Katharine's Dock
Columbia Road
45/47 Tabernacle St.
Martello Street
71 Stepney Green
Old St Patrick's Church, Buxton St.
124-130 Tabernacle St.
New Crane & Metropolitan Wharves
Bombay Wharf
Milbourne Street
Belsham Street
Acme Housing Association
Acme Short Life Housing
Bonner/Robinson Road
Independent Studios
Butlers Wharf Studios
Ravenscroft Street
Barbican Arts Group, Sycamore St.
New Crane Wharf
Metropolitan Wharf
Chisenhale Studios
1975 1976 1977 1978 1979 1980 1981
6 artists
21 artists
37 artists
31 artists
22 artists
22 artists
22 artists
5 artists
90 artists
11 art!s
7 art!s
80 artists
5
15 artists
12 artists >>70 artists
14 artists
38 artists
46 art!s
Figure 5.2 Studios in the East End, 1975–1981
»»»»»
»»»»
»»
»»»»
««««««««
«
««««

The Hiatus, 1975–1980 90
1–16, SPACE Studios. 2. Columbia Rd.; 3. 45/47 Tabernacle St.; 4. Martello St.; 5. 71 Stepney Grn; 6. Old St. Patrick!s Ch.; 7. 124-130 Tabernacle St.; 8. New Crane & Metropolitan Wharves; 9. Bombay Whf.; 20-28, Acme. 20. Various Short Life Housing - Acme HQ in Covent gdn, approx 140 houses managed across London; 28-71, Independent. 28. Butlers Whf.; 29. Barbican Arts Grp.; 30. New Crane Whf.
1–16, SPACE Studios. 2. Columbia Rd.; 3. 45/47 Tabernacle St.; 4. Martello St.; 5. 71 Stepney Grn; 6. Old St. Patrick!s Ch.; 8. New Crane & Metropolitan Wharves; 9. Bombay Whf. 20-28, Acme. 20. Various Short Life Housing - HQ in Covent Gdn. approx. 200 houses managed across London; 28-71, Independent. 29. Barbican Arts Grp.; 30. New Crane Whf.; 31. Metropolitan Whf.; 32. Chisenhale Studios
Figure 5.3Map of Studios, 1977
Figure 5.4Map of Studios 1980
1977
>100 artists
5 0 – 1 0 0
artists
20–49 artists
293
7
2
6
28
9
5
308
4
1980
>100 artists
5 0 – 1 0 0
artists
20–49 artists
293
2
6
4
32
5
830
31
9

typical proportion” which comprises the community of artists, critics and followers of con-
temporary art (Art for Society Catalogue, quoted in Whitechapel Art Gallery, 1995.)
The stated aim of addressing the artistic community was important, for although the Gallery had
exhibited the work of local artists in the Open Exhibition since 1932, it had not attempted to
take this concept beyond its own walls (ibid). But as the local artistic population had grown in
the early 1970s, so the Whitechapel developed strategies for taking art to the people, either by
showing slides of the exhibition to local schools, or by including in the exhibition artworks lo-
cated outside the Gallery. The emphasis on combining the practice of art with the study of con-
temporary art meant that by the early 1980s, the work of the Whitechapel differed significantly
from that of the many other galleries pursuing similar ends (ibid). And in carving out this niche
for itself the Whitechapel Gallery, like the other studios and organisations in existence at this
time, was simply attempting to secure its own future.
5.3 Of Painters, Property and Percentages
The last chapter closed with a question about why the number of artists and studios in the East
End stopped rising, and I speculated at the beginning of this chapter that one answer might lie
in the property markets at that time. So before closing this chapter and moving on to the period
from 1981 to 1985, I want to look briefly at what had been happening in the property markets
during those dramatic early years, and beyond. All figures for returns on property are taken
from The UK Property Cycle—a History from 1921 to 1997 (RICS, 1999). The graph in figure
5.5 overleaf shows the growth in the number of artists in studio blocks in the East End from
1968, and the national annual real rates of return on industrial property (source RICS, 1999:35).
The first point to note is that there appears to be a pattern for the years from 1968 to 1998,
which can be described thus:
• IF the increase in real rate of return on industrial property declines relative to the previ-
ous two year point THEN the rate of increase in in-migration of artists increases rela-
tive to the previous two-year point AND
• IF the increase in real rate of return on industrial property increases relative to the pre-
vious two year point THEN the rate of increase in in-migration of artists declines rela-
tive to the previous two-year point.
This pattern holds for all but two measurement periods, 1970 to 1972, and 1978 to 1980, and
for both these “anomalies”, there are, I think, plausible explanations. In the first instance, the
initiatives of SPACE, and then Butler’s Wharf simply absorbed excess demand from artists for
studio space—a process of “taking up the slack”. In the second instance, the sudden drop in the
number of artists can again be traced back to SPACE and Butler’s Wharf, but this time in a re-
The Hiatus, 1975–1980 12

versal of the previous scenario. In 1979, some eighty artists were evicted from Butler’s Wharf,
and SPACE lost twenty-two studios from 124-130 Tabernacle Street. In other words, of the
nearly four-hundred artists in the East End in 1979, a hundred lost their studios—in relative
terms a cataclysmic event—and the figures suggest that of these about half found new spaces,
whilst the others—presumably—dispersed. Whether these artists moved to other parts of Lon-
don, or to single studios in the East End is not known, and this question of “dark
matter”—artists to whom anecdotal evidence refers, but who do not appear in the
statistics—was covered in chapters one and two. In fact, as figure 5.5 shows, this “loss” is ap-
parent simply as a large “dent” in the steady growth in the number of artists in the East End.
However, for the remainder of these two decades, the pattern set out above holds, with the
rate of increase in the number of artists mirroring neatly the fortunes of the industrial property
markets. The question of whether these patterns are evidence of a causal relation is not easy to
answer, but there does seem to be a fairly clear-cut correlation in the evidence.
But once we get to 1988 something odd happens, and the pattern simply collapses for six
years, and in an unexpected way. When rates of return on industrial property increase, so too
does the rate of in-migration of artists. When the rates of return decrease, the rate of in-migra-
tion follows suit.
The answer perhaps is that by now, the collapse of the East End’s industrial base was, to
all intents and purposes, complete: one might expect that to be reflected in rental values for the
The Hiatus, 1975–1980 13
1300
1200
1100
1000
900
800
700
600
500
400
300
200
100
0
-100
68 70 72 74 76 78 80 82 84 86 88 90 92 94 96
Year
Approximate No. of Artists in Studio Blocks
Value for xt+1
=1.092xt
Percentage Return on UK Industrial Property
Figure 5.5 Growth in the number of artists in studio blocks, 1968–1998, compared with percentage re-turns on UK industrial property (source: RICS, 1999) during the same period. This graph excludes artists working from home or in single studios, for whom estimates are based in hearsay and vary from 500 to over 2000. The figures presented in this graph were calculated by the author through archival research, by visits to the studio blocks themselves where they were still functioning as artists! studios, and by in-terviews with those who occupied studio blocks which have since closed. The growth is roughly expo-nential, approximating to x
t+1=1.092x
t where x
t+1 is the number of artists one year after x
t.
1300
1200
1100
1000
900
800
700
600
500
400
300
200
100
0
-10068 70 72 74 76 78 80 82 84 86 88 90 92 94 96
Year
Approx. No. of Artists & Industrial Property % return x 10

area. The problem is finding what those values are. A trawl through the advertisement columns
of the Evening Standard reveals little consistency in the way in which industrial property was
advertised, nor it does tell us a great deal about the state of the property. Typically, an advertise-
ment comprises a postcode and telephone number, a brief description (for example “light indus-
trial” or “factory”), sometimes the floor area, and sometimes the rent; in terms of rent per unit
area per unit time, there is considerable variation (Table 5.1). The only obvious pattern is that in
terms of column inches of advertisement space, the East End tends to predominate, which is
hardly surprising. The point though, is that we should be very cautious of drawing any conclu-
The Hiatus, 1975–1980 14
Date District Postcode Type Area (sqft) Rent Period£pa £/sqftpa1968 E1 Workshop 12 pw 624
Shoreditch High St French-pl factory/warehouse 2000 475pa475 0.2375
W1 light industrial/stock roomsLeytonstone E11 warehouse/dist'n depot 1200 pa 1200
1971 N19 Light Industrial 1500 pa 1500Barking Rd N13 Light Industrial 2K–40K 10/-Hornsey Rd N19 5600 2800 pa 2800 1.4
N1 700 640 pa 640 0.32N1 Printing Works 600 28 pw 1456 0.728N19 Light Industrial 30 pw 1560
Camberwell Factory 3500 2500 pa 2500 1.25SE10 Factory 500 12 pw 624 0.312N19 1400 30 pw 1560 0.78
1974 N1 Workshop 500 25 pw 1300 0.65Aldgate E1 Clothing Factory 1750 750 pa 750 0.375Harrow Rd Warehousing 4250 4750 pa 4750 2.375
1977 ? SE1 Light Industrial 2200 2600 pa 2600 1.3
1980 West Kensington Light Industrial 2520 2000 pa 2000 1Chalk Farm Light Industrial 3000 2750 pa 2750 1.375
1983 Wandsworth 200-500 1.5SE4 Workshops 2.5WC1 £21 per week (floor area not given)
1986 Two columns, predominantly East End
1989 Classified Advertisements for Industrial Property not present.
The classified advertisement industrial property columns of the Evening Standard were scanned for
January 1968 through to January 1998 at three yearly intervals (ie the same years as the maps of
studios), but by the late 1980s there is an almost complete dearth of useful information on this.
Generally, and as can be seen from this table (which lists the most “complete” advertisements) the
available information is thin, and there is very little consistency either in the way it is presented or in
the prices. Furthermore, it is probably reasonable to assume that industrial properties advertised in
the Evening Standard were not derelict, unlike many of the properties taken on by artists: it is worth
remembering that artists tended to take on property which no one else wanted.
When contacted by telephone, the London Boroughs of Tower Hamlets and Hackney were unable
to provide figures for industrial property in their boroughs.
Table 5.1 Industrial Property to Let, 1968–1998

sions from these rental figures: for the time being at least, we must take the artists at their word;
they moved to the East End because of its plentiful supply of cheap space.
Even so, we can say this much. The East End in which we are interested, the artists’ East End,
was no longer a real part of the UK industrial property markets; and the investment figures from
the mid-1980s onward no longer reflect the East End’s fortunes, as they would have done dur-
ing its final years. By 1988, the last of the docks had been closed and derelict for seven years,
the Isle of Dogs was by now a huge building site, and in a very literal way, the “old East
End”—in the Docklands at least—was being erased. Rates of return on industrial property have
little to offer by way of help with our analysis at this point, although we can observe that during
the 1990s they have, compared to retail and office returns, been “less consistent” (ibid:35).
So from 1974 to 1980 we have a pattern consistent with our two IF–THEN hypotheses set
out above, which suggests that, in view of the steady rise in rates of return on industrial prop-
erty during this period, we would expect the rate of in-migration to decrease. And with that in
mind, I shall first close this chapter, and then return to the narrative history in the next.
5.4 Discussion
At first blush it seems ironic indeed that at a time of such political and cultural turbulence, the
agglomeration of artists in East London should experience a pronounced lull in its growth: but,
numerically at least, such was the case in the years between 1975 and 1980.
However, I do not believe that we should be overly surprised by such a lull. For as long as
the artists had space, and could afford the rents, they were relatively secure. What they had to
concentrate on was getting their work to a wider audience, and somehow earning a living out of
that if they possibly could; nonetheless then, as now, the majority of artists had to work part-
time to support their artistic practice. The place from which they generated that art—their
studio—is of secondary importance in that respect, in the same way that an office is selected
primarily to enable the efficient procurement of a job at a reasonable price. So survival re-
mained as a primary motivator in getting cheap studio space for people whose funds were lim-
ited. Indeed, anecdotal evidence from the many artists I have spoken to over the last five years
suggests that in this respect, the standard of living, and the way of life, for the average artist has
changed little in the last three decades.
We know that the demand from artists for studio space existed, and we know that artists
had by now decided to set up galleries. Art itself seemed to be reasonably healthy, albeit insofar
as it was happening, and it had plenty to react to in the outside world. And the number of art
students was increasing steadily too: from just below 11,000 in 1975 to 14,000 in 1978 (see Ap-
pendix Three).
The half-dozen or so years from 1975 to 1981 then, were really a hiatus in the continuing
evolution of the East End artists’ agglomeration. But they were also notable for the attempts to
explore different sets of possibilities for carrying out artistic practice from a base which for the
The Hiatus, 1975–1980 15

time being at least, and despite the agitated circumstances, was, and would continue to be, rea-
sonably stable.
The Hiatus, 1975–1980 16

SIX
CONSOLIDATION, 1981–1985
6.1 Focus Resumed
There is a sense in which this short chapter simultaneously forms a postscript to the last and a
prologue to the next: it describes the end of the hiatus of the previous few years and,
incircumstances—perhaps coincidental—which reflect to a remarkable degree Margaret
Thatcher’s claimed distrust of centralised power structures, it marks a point at which Acme and
SPACE became “the establishment”, and smaller, “independent” studios became the norm for
new studios. The growth of those small independent studios in the late 1980s and early 1990s is
the subject of the next chapter. In this chapter, we see the centre of gravity of London’s contem-
porary art scene shifting decisively to the East End, at a time when Britain’s cultural institutions
were getting a major overhaul from the new Conservative administration.
The turmoil at a social and political level which had wracked most of the 1970s gave way
in the 1980s under Thatcher to a renewed sense of direction, albeit one that many people did not
agree with. The gap left by the decline of the post-war consensus during the 1970s became, by
the end of that decade, a “pathological” national condition according to the ex-Chancellor of the
Exchequer Nigel Lawson (Hewison, 1995:209). Thatcher’s approach, in essence, was not to try
to reinvigorate that consensus, but to accept the economic trends—in particular the decline of
industry—and to set about the business of rebuilding a post-industrial society on the basis of a
new “enterprise culture” (Hall, 1998:888 et seq; Hewison, 1995:209–210).
Simultaneously, a new (specifically Anglocentric) consensus would be built around
“themes of law and order, the traditional family and patriotism” as opposed to the previous
“permissive society” (Hewison, 1995:211). However the economy became “the focus of na-
tional anxiety”, signalling a shift in the status of the individual from citizen to consumer
(ibid:212), a shift which would greatly affect the East End artists’ agglomeration in the 1990s as
Consolidation, 1981–1985 1

the “lifestyle” became a buyable commodity through the goods associated with it.
For Hewison, the new order of this “Thatcherite revolution” was only possible because
the old order had collapsed irrevocably in the 1970s (ibid:219). As David Harvey (1989) has
pointed out, communications technology and ever-decreasing transport costs made the world
smaller and smaller, and enabled a true global economy which transcended national boundaries.
Such large markets need large advertising campaigns, and the advertising agency Saatchi and
Saatchi, founded by two brothers (one of whom, Charles Saatchi, would become Britain’s lead-
ing art collector of the 1990s) in 1970, had by the mid-80s became the world’s largest. A dec-
ade later, however, after a steady decline in the agency’s fortunes, Maurice Saatchi was dis-
missed as Chairman, and the two brothers sold their shares in the company (ibid:220).
Saatchi and Saatchi had been responsible for the Conservative Party’s advertising cam-
paigns, and this elision of the commercial and the political was reflected in the way in which the
new administration dealt with the arts. A constant critic of the Reithian ethic, Thatcher felt that
choice, not quality was the paramount consideration in broadcasting, and she set about ending
the BBC-ITV duopoly, and releasing the BBC of its—in her view—paternalistic high-minded-
ness through the appointment of more commercially orientated chairmen (ibid:232–236).
The Arts Council fared little better: unfocused at the turn of the decade, it was criticised
both for being too progressive, and for ignoring the avant garde. Expectations of the Arts Coun-
cil had been raised while the Conservatives were in Opposition—they had called for the arts
budget to be doubled—but the realities of government hit hard, and within a year of the Conser-
vatives taking office, they had cut the Arts Council’s budget by one million pounds (ibid:246).
Taken by surprise at the severity and suddenness of the cuts, the Arts Council panicked and
withdrew funding without warning from forty-one companies, prompting accusations of arro-
gance (ibid).
Nor was the Arts Council immune to political pressures, and the appointment in 1982 of
William Rees-Mogg as Chairman confirmed the Government’s interventionist approach
(ibid:248). The Arts Council’s approach during the Thatcher years would strictly be one of
“value for money”.
Unlike the BBC and the Arts Council, the Greater London Council was able to both voice
and articulate its opposition to the government’s approach to culture. Although its 1981 election
manifesto barely mentioned the arts, the decline in industry and the associated working-class
vote meant that a new “post-industrial” constituency had to be wooed. Thus it was that “black
British, Asians, middle-class people working in the public sector, and the small but articulate
pressure groups of gays and lesbians” were targeted, through an “alternative form of mobilisa-
tion and communication” which centred around culture (ibid:236).
The GLC thus broadened the definition of the arts “to include photography, video, elec-
tronic music and community radio”, handed out grants and organised festivals. They had dis-
covered something which had perhaps passed Margaret Thatcher by: to quote Tony Banks, the
chairman of the Arts and Recreation Committee, “We could …use the arts as a medium for a
political message” (ibid).
Consolidation, 1981–1985 2

6.2 Consolidation 1981–1985
Political messages were not, however, at the heart of the East End artists’ agglomeration; sur-
vival remained the top priority. Acme returned to the East End in 1981, moving its offices to
Bethnal Green and closing the Acme Gallery and returning it to the GLC for demolition in the
same year, prompting art critic Waldumar Januszczak to comment in The Guardian that “it
wasn’t always easy to understand what the Acme Gallery was trying to say but it was usually
worth trying to find out. The Acme was very much a gallery of the seventies, a gallery devoted
to extremes, a rallying point for the avant garde. And now that the last Acme exhibition has be-
gun, we can confidently say that the seventies are officially over” (quoted in Acme 1995:15).
It was at this point that the centre of gravity of London’s artists became firmly established
in the East End, particularly with the foundation by members of the Butler’s Wharf group of
Chisenhale Studios and Gallery, and Acme’s shift shortly afterwards into light industrial prop-
erty, and their virtual abandonment of short-life housing, along with their departure from Cov-
ent Garden for a new headquarters in Bethnal Green.
Butler’s Wharf, though, was not the only riverside studio block to succumb to the prop-
erty developers; Fawe Street Studios was founded in 1984 by Ken Oliver and others after they
had been evicted from Metropolitan Wharf. Far from being rebels, or from making political
statements, this “first generation” of East End artists simply wanted to settle down and get some
stability into their lives.
Ken Oliver:
This [Metropolitan Wharf] was great and it was cheap, but most areas when artists go in,
they can get a bit trendy so that people think that er, “oh it looks like Soho or Montmartre
in Paris” and they said “we’re going to turn them in to apartments” so we then started look-
ing elsewhere. But we didn’t want to rent. A lot of the artists were getting on a bit to be
honest, and didn’t think, the idea of finding somewhere where you’ve got to put all the
work in and then it gets given back to the landlord again, we didn’t really want to do. So we
drove round and found this block, which was completely derelict…
This was in… ’84. Ten years on from that [the establishment of Metropolitan Wharf
Studios]. We sort of found it. I mean, superb space, you know, big spaces, superb building,
very like Wapping I suppose in a way, similar feel, and we’d got used to that. The bloke
who owned it wanted rid of it. He was an estate agent in South Ken, and he didn’t particu-
larly want to hang on to it, so we got it very cheaply. There was ten of us got together and
tried to scrape a bit of money to buy the block, and before we agreed to buy it, we said we
wanted change of use from industrial to half live half work space, which in ’84 was quite
difficult to get. So we applied for that before we actually agreed to buy it. The guy who was
selling it said “well I’ll give you six months to get, you know rustle the money up and to
get all the planning consents”. He was quite interested in the art in some ways. His son
worked at Sotheby’s, and he was very generous in a way because we wouldn’t have bought
this building if we couldn’t have got change of use. The artists who were buying wanted, as
Consolidation, 1981–1985 3

a co-operative, live-work spaces, so if we hadn’t got that it wouldn’t have been possible.
(Fawe Street Studios, 1998:interview)
Fawe Street Studios was one of the first attempts by artists to turn industrial property into live-
work space; the complex was originally a pet-food factory (Fawe Street Studios, 1998: inter-
view): internally it houses airy studios and flats, has a large central yard and is also home to a
fine art foundry. It still retains an industrial “feel”, which to an extent belies its actual use.
By the mid-1980s, Acme too were beginning to broaden their portfolio. Besides taking on
short-life housing from Hackney as well as Tower Hamlets and the GLC, they had also started
to take on light industrial spaces: forty-six studios were established with Arts Council funding
in a rambling and redundant 19th century brush factory in Bethnal Green between Bonner Road
and Robinson Road in 1981; a 1920s Players cigarette factory became Orsman Road Studios in
1983, housing 28 studios, and in the same year twelve studios were established five minutes’
walk from Bonner Road Studios on Old Ford Road, in late 19th century houses overlooking
Victoria Park and the Grand Union Canal (Acme, 1995:16). The landlords for Bonner Road and
Old Ford Studios were the Crown Estate Commissioners, while Research Engineers Ltd. were
the landlords at Orsman Road (ibid). Meanwhile, what was perhaps the most ambitious
“independent” initiative to date was being instigated roughly a kilometre south of Bethnal
Green, in an area better known for its political and seafaring history.
Cable Street Studios, at the eastern-most end of a street made famous in the 1930s for its
eponymous running battle between Oswald Mosely’s fascists and the police—itself commemo-
rated in the Cable Street Mural—was, like Fawe Street Studios, started in 1984 by artists who
had previously been in Wapping.
The Cable Street Studios complex was impressive: a Victorian sweet factory originally,
with a large and imposing gated entrance, surmounted by a clock tower, leading to a broad
courtyard. The building is in London stock bricks, in what might loosely be termed a “Victorian
municipal style”, reminiscent of the factory in Roald Dahl’s novel Charlie and the Chocolate
Factory. Inside it was subdivided into over 150 studios, reached through long white corridors
with fire doors, and staircases half open to the elements. The studio spaces themselves did not
feel particularly spacious, although they were well-lit and dry. One wing of the complex housed
a small café where artists could meet and talk, but it was quiet and empty when I visited mid-
morning. The main complex also housed two gallery spaces, and leading off the cobbled yard
was a large shed with half its roof missing, full of junk, open to the wind and rain.
Ex-director, Michael Cubey:
Three artists, Mike Deakin, Keith Patrick (who started Contemporary Artists’ Magazine)
and Martin Lilley who had previously been in Met [ie Metropolitan] Wharf, I think, he
came here in 1984 and leased I think it was the second and third floors, might have just
been one floor originally, I’m not sure. There were about 50 studios which were originally
let on an ad hoc basis—artists coming in and saying “oh we’d like”, stretching out their
Consolidation, 1981–1985 4

arms, “this much space”. Martin was a carpenter, he helped do a lot of the conversions.
Speaking to some of the people who remember it, it was always a much more commercial
enterprise than say SPACE.
The landlords were the present landlords, a property company called Liberty Invest-
ments, basically two Indian brothers. They own the freehold. The problems that Keith and
Patrick and Martin ran into, hadn’t accounted for—rates—they hadn’t accounted for the fact
that… that’s all they wanted, to raise the rents. So they had to raise the rent to artists, so
they lost about 50 percent of the artists. The landlords then, they sort of disbanded them-
selves and the landlords kept Mike Deakin on as studio manager. They thought if the stu-
dios were converted they may as well keep them occupied. So he was paid to run the stu-
dios, so in that sense it’s quite different from a lot of artist-run studios.
(Cable Street Studios, 1999:interview)
Cable Street Studios, as we saw above, started with about 50 artists, and by the mid-1990s was
one of the two largest studio blocks in London. It was unusual because its commercial basis
meant that it could not respond as sensitively to the needs of artists as pure “artist-lead” initia-
tives. This is most notable in the early battles which the artists had with the landlords to keep
rents affordable. It seems, though, that the landlords learned the going market levels for studios
quickly enough, since after the shaky start, Cable Street Studios grew to be the largest inde-
pendent studio block in London, and the second largest block of all, housing 150 artists: it
closed late in 2000, and the complex was put on the market for five million pounds (Michael
Cubey, personal communication, March 29th 2001)
The largest though, was established by Acme in 1985 in the old Yardley cosmetics fac-
tory set back from Carpenters Road at the edge of Stratford Marsh, and like Cable Street, it
housed some fifty artists in its early years. The conversion from factory to studios was a major
undertaking, and was funded by the Arts Council and an Industrial Development Grant from the
London Borough of Newham (Acme, 1995:16).
In 1983 Acme established the Showroom which, like Chisenhale Gallery, had its origins
in the needs of artists in adjacent studios who wished to to exhibit their work—this time the
Acme Studios at Bonner Road—and Acme at this time did not have a gallery space. The Show-
room was hired out to artists who wished to create their own exhibitions (Acme, 1995:16). Situ-
ated in the heart of a predominantly residential area, opposite the local primary school, the
Showroom continues, at the time of writing, to hold exhibitions on a regular basis.
SPACE also embarked on a steady process of acquisition. In 1981 Milbourne Street and
Belsham Street Studios, both near London Fields, were added to their portfolio, and followed in
1982 by Richmond House Studios, overlooking London Fields, in 1983 by Brittania Works just
east of Victoria Park near Stratford, and two more studio blocks, Winkley Street in Bethnal
Green and Victor House, again near London Fields, in 1984 and 1985 respectively.
The Whitechapel Gallery closed for refurbishment from 1983 to 1985, taking the oppor-
tunity to review and strengthen its community education programmes (Whitechapel, 1995).
Consolidation, 1981–1985 5

6.3 Discussion
By 1985 the hiatus which had beset the growth in the local artists’ population appeared to be
well and truly over; there were over 500 artists in the East End, with concentrations around
London Fields, the western end of Victoria Park in Bethnal Green, and at the eastern-most tip of
Wapping (figures 6.1–6.3).
1985 was also the year in which the GLC was abolished—it formally ceased to exist in
April 1986—but its arts policies and grants over the previous five years had given a much
needed fillip to many of London’s art institutions. The Royal Festival Hall had embarked on an
enormously successful “open foyer” policy and boosted attendance at concerts as a conse-
quence, and both the National Theatre and the English National Opera had escaped the cuts
which they had feared (Hewison, 1995:239).
This is not the place to launch a discussion of the GLC’s arts legacy to London, but two
things stand out. First, in giving the arts a social context, rather than operating a more individu-
alistic Thatcherite policy, they gave voices to groups which had not previously been listened to
(Hewison, 1995:242). Second, they can be seen with hindsight to have played a central role in
enabling the East End artists’ agglomeration to happen, not least through their tacit encourage-
ment of both Acme and SPACE. But by the time of the GLC’s abolition, the East End artists’
agglomeration was about to enter its fourth phase; that is the subject of the next chapter.
Consolidation, 1981–1985 6

Consolidation, 1981–1985 102
1–16, SPACE Studios. 2. Columbia Rd.; 3. 45/47 Tabernacle St.; 4. Martello St.; 5. 71 Stepney Grn; 6. Old St. Patrick!s Ch.; 8. New Crane & Metropolitan Wharves; 9. Bombay Whf.; 10. Milbourne St.; 11. Belsham St.; 12. Richmond Hse.; 13. Brittania Wks.; 20-28, Acme. 20. Various Short Life Housing - Acme HQ shown; size reflects no. of houses; 21.Bonner/Robinson Rd.; 22. -Orsman Rd.; 23. Old Ford Studios; 28-71, Independent. 29. Barbican Arts Grp.; 30. New Crane Whf.; 31. Metropolitan Whf.; 32. Chisenhale Studios;
1–16, SPACE Studios. 2. Columbia Rd.; 3. 45/47 Tabernacle St.; 4. Martello St.; 5. 71 Stepney Grn; 6. Old St. Patrick!s Ch.; 7. 124-130 Tabernacle St.; 8. New Crane & Metropolitan Wharves; 9. Bombay Whf.; 10. Milbourne St.; 11. Belsham St.; 12. Richmond Hse.; 13. Brittania Wks.; 14. Winkley St.; 15. Victor Hse.; 20-28, Acme. 20. Various Short Life Housing - Acme HQ shown; size reflects no. of houses; 21.Bonner/Robinson Rd.; 22. -Orsman Rd.; 23. Old Ford Studios; 24. Carpenters Rd.; 28-71, Independent. 29. Barbican Arts Grp.; 31. Metropolitan Whf.; 32. Chisenhale Studios; 33. Fawe St.; 34. Cable St.; 35. Vyner St.; 36. Hanbury St.; 37. New Hoxton Workshops
Figure 6.2Map of Studios, 1983
Figure 6.3Map of Studios, 1986
1983
>100 artists
5 0 – 1 0 0
artists
20–49 artists
293
22
2
6
4
12 1110
2332
2120
5
3130
8
9
13
1986
>100 artists
5 0 – 1 0 0
artists
20–49 artists
9
13
20
22
37
329
2
6
36
12 15
410
11
35
1421
32
24
5
33
3431
8

Consolidation, 1981–1985 7
SPACE
Columbia Road (Ravenscroft Studios)
45/47 Tabernacle St.
Martello Street
71 Stepney Green
Old St Patrick!s Ch., Buxton St.
New Crane & Metropolitan Wharves
Bombay Wharf
Milbourne Street
Belsham Street
Richmond House
Brittania Works
Winkley St.
Victor House
Acme Housing Association
Acme Short Life Housing
Bonner/Robinson Road
Orsman Road Studios
Old Ford Studios
Carpenters Road
Independent Studios
Barbican Arts Group, Sycamore St.
New Crane Wharf
Metropolitan Wharf
Chisenhale Studios
Fawe Street Studios
Cable Street Studios
Vyner Street Studios
Hanbury Street Studios
New Hoxton Workshops
Delfina Studios
1982 1983 1984 1985 1986 1987
6 artists
21 artists
37 artists
7 artists
22 artists
22 artists
5 artists
11 artists
7 artists
13 artists25 artists
4 artists
26 artists
approx. 120 artists
46 artists
28 artists
12 artists
50 artists
15 artists
70 artists
14 artists
38 artists
13 artists
50 artists
7 artists
7 artist
3 artists >>15 artists
12 art!s
Figure 6.1 Studios in the East End, 1982–1987
«««««
«««««
««
««««
»»»»»
»»»»»»»»
»»»
»
»
»»»»»»»»

SEVEN
THE RISE OF THE SMALL
INDEPENDENTS, 1986–1998
7.1 The Glory of the Garden1
The abolition of the GLC and the other Metropolitan City Councils in 1986 gave rise to genuine
fears of damage to arts organisations, but these were allayed by the introduction of “challenge
funding”, whereby the local authority would have to match any sum granted by the Arts Coun-
cil. And despite the burgeoning demand for the arts in the 1980s, many arts organisations found
it increasingly hard to make ends meet (Hewison, 1995:247) The Arts Council’s 1984 Annual
Report, The Glory of the Garden (a reference to Rudyard Kipling’s doggerel observation that
gardens need nurturing) set out its intention to encourage the arts in the regions through the
transfer to them of six million pounds, but the outcome was rather different: five million pounds
were cut from regional companies, and its metropolitan responsibilities actually increased, as
did the number of revenue clients (ibid:254–255). In 1983, it had 156 clients, and in 1989, 140;
its intention had been to reduce the number of revenue clients to 94 (ibid:255).
However the idea behind The Glory of the Garden—that the Arts Council needed to de-
volve at least some of its clients to the regions—lived on, and a 1989 review of the relationship
between the Arts Council and the Regional Arts Associations concluded that the Council should
be responsible for “national companies” while the RAAs would be replaced by a reduced num-
ber of Regional Arts Boards with local responsibilities (ibid:261). The new order came into ef-
fect in 1994, by which time the Arts Councils of Scotland and Wales, previously subcommittees
of the Arts Council of Great Britain, were funded directly by the Welsh and Scottish Offices,
and the Arts Council of Great Britain had become the Arts Council of England (ibid, 262–264).
1 The title of the Arts Council’s 1984 Annual Report.
The Rise of the Small Independents, 1985–1998 1

7.2 More Studios, and Galleries Too
However, the shenanigans which rocked the Arts Council did little to stifle the continuing
growth of the East End artists’ agglomeration. The mid-to-late 1980s saw the profile of the East
End sharpen with the establishment of three independent galleries in the more traditional com-
mercial “West End” mould. Interim Art was founded by Maureen Paley in 1984 and is situated,
unusually, in a terraced Victorian house in Hackney (Paley, 1998). It started in Beck Road, a
street which is gradually passing into the realms of legend by dint of the fact that all the houses
in it were at one time administered by Acme, and are now owned by artists (Archer, 2001). The
Lamont Gallery was established by Andrew Lamont in 1986, while Flowers East was set up by
Matthew Flowers in 1988 in London Fields (Glaister, 1996). “We came here for cheap rent and
very big spaces, and we liked the idea of a big community of artists” (Matthew Flowers, quoted
ibid), although, as we shall see in the next section, the extent of that “community” remains
moot.
That a new generation of artists was establishing itself in the East End was most readily
and famously apparent in the 1988 exhibition Freeze, organised by a group of graduates from
Goldsmith’s College—subsequently to be bestowed with the epithet “Young British
Artists”—which included artists such as Tracey Emin, Damien Hirst and Sarah Lucas. Critics
Matthew Collings (1997) and Richard Shone (1997), while acknowledging its importance, ar-
gue that claims for its professionalism, and for the quality of the art itself, were perhaps over-
blown. Nonetheless, “Freeze” did mark the flowering of Goldsmith College’s reinvention of it-
self as an art school in the 1980s under the guidance of tutors such as Michael Craig-Martin and
Jon Thompson (Shone, 1997:18), but other “Young British Artists” of that generation, who
really became known at the Royal Academy’s Sensation exhibition in 1997, did not come from
Goldsmiths College: Jake and Dinos Chapman and Tracy Emin graduated from the Royal Col-
lege of Art; Matthew Dalzeil and Louise Scullion from the Glasgow School of Art; Rachel
Whiteread and Douglas Gordon were at the Slade. Even so, Judith Bumpus pointed out in 1997
that “over three-quarters of those 17 Freeze artists are still stocking the major shows” (Bumpus,
1997).
But Freeze also highlighted the emergence of a new generation of young artists who were
prepared, in the words of Robin Klassnik (1998:interview) to “hunt in packs and show in
packs”, and who possessed a growing awareness of the cultural impact of their work both
within and beyond the art world (Sladen, 1997:39). It seems probable that this increasing confi-
dence should also have impacted upon the East End artists’ agglomeration.
It is certainly the case that from the middle of the 1980s, the number of artists in inde-
pendent studios began to rise steadily and inexorably. For artists leaving college at this time,
SPACE and Acme were traditional organisations who, to an extent at least, represented the
“Establishment”, and from this point onwards, the majority of new studio blocks have had less
than twenty artists, and frequently fewer than ten.
The earliest of these were Vyner Street Studios immediately west of Victoria Park and
Hanbury Street Studios in Spitalfields, each housing seven artists, and New Hoxton Workshops
The Rise of the Small Independents, 1985–1998 2

in Shoreditch which originally had just three. Graham Bignell, the co-founder of New Hoxton
Workshops wanted to find space to pursue craft-based work, and initially set up studios in New
North Road in Shoreditch.
Graham Bignell:
In 1985 I was working for Hackney Council as a paper conservator, which doesn’t fall into
any of the remits of places like SPACE or any of the artists’ studios, so it was much more
craft based. I had a studio in Mare Street originally, and then, I was keen to find a place that
had a possibility of extending the craft side of things as well as having artists’ studios
benches. I’d had problems getting on waiting lists and things like that. With my contacts in
Hackney I was able to find this building in New North Road which was an old funeral direc-
tors. A fairly big building, about 2500 square feet, very run down. The back of the building
had been knocked down. …[we] had an agreement with the Trust that owned the building
which was one of the protected buildings of Hackney, so the people that built the site next
to it destroyed part of it but weren’t allowed to knock the rest of it down, so from there we
signed a 2 year lease, and then we moved in with a few other artists in 1985. No help from
any one.
…All the maintenance was down to us as well. Because it was a peppercorn rent it
was OK, but we were worried about the 2 year aspect. It took us 6 months to do the place
up, but in the end w e were there for 10 years. That studio’s still running, and it’s almost at
the end of its life now—three artists left in there, and looking to sell the building.
(Standpoint Studios, 1998:interview)
The New Hoxton Workshops project was completely craft-led: the finance for the conversion of
the building, the fitting out and the installation of electrical and plumbing services was also car-
ried out by Bignell and his colleagues (Standpoint Studios, 1998:interview). Again, the combi-
nation of a self-help “can-do” mentality and the requisite skills coupled with low, or in this case
minimal, rents gave artists the opportunity to pursue their work: with New Hoxton Workshops,
the low rent was crucial, pushing the project over to the right side of the feasibility threshold.
In fact, the problems of maintenance, and the poor condition of many of the buildings
which eventually became studio blocks, are an increasingly familiar story, but they highlight a
point worth repeating: the buildings which were colonised by artists were those which no one
else would consider occupying; simply, the artists had the need, the knowledge, and crucially,
the will, to make something of these places. Nonetheless the artists still had their creativity, pa-
tience and in some cases even their credulity stretched by the conditions with which they had to
deal, an issue neatly summed up by Adrian Hemming and Adam Gray co-founders and direc-
tors of the now defunct Angel Studios in Islington:
AG The way we did that [Angel Studios], it was very low budget, studios were very
cheap, much too cheap actually. …it was a crummy building. The basement!
The Rise of the Small Independents, 1985–1998 3

AH The basement where the rats used to pop up from the sewers!
AG We didn’t know this. When we turned it into studios, we didn’t know it was going
to flood. All the old sewers, it just became a nightmare. …Somebody would come in in the
morning and find there were about four inches of water and waste and horrible things float-
ing around, so [someone] would get called. We called them though it was the landlord’s re-
sponsibility. Charging God knows what, they’d shove all these rods down, and about two
hours later they’d say, “well we’ve no idea what’s down there”. They never solved the prob-
lem, they just had no idea what all these pipes were doing, and so we couldn’t believe, we
just thought we don’t want to use this space, but all the people in the basement wanted to
stay there, and just accept that this was how it was! That it’d kind of flood every now and
again. They all left the studio at night, and put their work up on trestles. Absolutely bi-
zarre, but the rent was incredibly cheap. There was no natural light, dark and miserable. The
rest of the studios were much better.
But when we started it, rather than build all the walls, we drew chalk lines on the
floor: “That’s your space, you build your own wall”.
AH Which is really not the right way to do it.
AG Not the right way at all. Because people first of all can’t build walls…
AH And nothing conforms to fire regulations. We were quite desperate at Angel, because
I mean it was a nightmare. If a fire had started it would have been horrendous.
The costs of fire-protection are a necessary but heavy burden that for obvious reasons of health
and safety must be met. Kwai Lau of Red Door Studios recalled in 1998 that “a couple of years
ago we had problems with fire regulations, so we had to [spend] about £2500 on putting [in] the
fire alarm. But I think it’s worth it really”. This acceptance of the fact that artists’ studios must
work within such regulatory frameworks is perhaps symptomatic of an increasing drive to con-
solidation amongst East End artists’ studios: Red Door Studios, of whom more later, closed in
2000. With the best will in the world, such initiatives may not last for ever.
But despite the effort and perseverance which had to be put into transforming these often
squalid buildings into workable studios, and locations which were often remote in terms of both
distance from central London and ease of access by public transport, new studio blocks contin-
ued to proliferate as artists continued to move to the East End.
Delfina Studios Trust was founded in 1987 on the top floor of Maryland Works, a 19th
century three-storey brick clothing clothing factory tucked away off the beaten track in Strat-
ford, five minutes walk from Maryland overground railway station: it granted residencies to art-
ists and sculptors.
The Rise of the Small Independents, 1985–1998 4

Artist Lucy Lefeuvre:
Well, originally the deal was that a woman called Delfina Canales who’d set up a founda-
tion which provided free studio space for artists through application. I joined it after it had
been in existence about four years. When I started it was 1990. The space was about eight,
nine studios for painters, and three, four sculptors. And I suppose the general sort of appli-
cation would be from artists in so-called mid-career, ie several years out of art school and
what it provided was a free, or rent-free space. She also acted as a sort of sponsor—would
buy work from us as well. So that was what brought a lot of people to the area, rather than
that they particularly would have chosen it, myself included, and then you find yourself sort
of staying within the area because it’s cheap, basically, and the only place that offers that
sort of studio space.
(Maryland Studios, 1999:interview)
Unusual in that the Trust was the brainchild of the philanthropic and art loving owner of an
(eponymous) Italian clothing company, Delfina Studios subsequently generated “spin-offs” not
only in the form of Maryland Studios but also Stratford Studios and Wharf Studios. The Delfina
Trust itself moved in 1994 to its current premises in Bermondsey, and Maryland Works now
houses only Maryland Studios. Lefeuvre’s story once again makes the point that artists are in
the East End primarily because it is cheap, and because it offers decent studio spaces.
1989 saw the foundation of six new studio blocks including new, larger premises com-
prising twenty-two studios in light industrial property at Hertford Road, near de Beauvoir Town
in Islington for the Barbican Arts Group: they had previously occupied studios at the northern-
most edge of the City in Sycamore Street, near the Barbican from which they originally derived
their name. Pixley Street Studios had seventeen artists in a 19th century warehouse in Bow,
while the cluster of studio blocks and galleries around London Fields was further augmented by
MT Studios housing five artists. What would, five years later be a cluster of studios around
Hoxton was added to by Rufus Street Studios, housing nine artists.
Hemming and Gray of Angel Studios had by this time become embroiled in a traumatic,
costly and ultimately unsuccessful legal battle with their landlords in an effort not to be evicted,
and they decided to cut their already considerable losses and look elsewhere. Even so, the
search for landlord with whom they could do business was not an easy one. Their experience
highlights some of the problems which arise for artists when confronted with a landlord who
wishes to let a property in poor condition, and who tries to insert onerous clauses in the lease to
secure the repair of the building at the tenants’ expense.
Hemming and Gray had had enough of Angel Studios and wanted to get out. Their initial
search brought them to a building in Carysfort Road near Stoke Newington, and they entered
into protracted negotiations with the landlord, who wanted to impose an onerous “full repairing
lease” on them. Such a lease obliges the tenant to make repairs which return the building to an
“as new” standard rather than to an “as found” standard, and as Hemming recalled, such re-
The Rise of the Small Independents, 1985–1998 5

quirements can be catastrophic for the tenant:
Adrian Hemming:
That’s how Globe Studios went, down in, Hoxton way. They got caught a cropper with
that same clause in their lease, and the landlords turned round and told them they more or
less had to replace the façade of the building to their specifications. And legally, yes, that’s
what you had to do.
Eventually, the negotiations at Carysfort Road simply collapsed because of this sticking point,
and Hemming and Gray started to look elsewhere, although the Carysfort Road premises were
subsequently let out to artists, the landlord having “learnt from us that it was a waste of time ar-
guing” (Southgate Studios, 1998: interview).
The remaining artists in Angel Studios “all moved on. Some are still, one of them is
working in Barbican Studios. They just all moved on, found other places to go to, got married,
settled down! Gave up being artists” (Southgate Studios, 1999:interview).
Gray and Hemming, though, did not give up being artists, and although their own at-
tempts to set up a studio block at Carysfort Road fell through, they had at least gone some way
to opening the door for the group of artists who eventually established the studios there. More
importantly, they felt that they had learned enough from their efforts at Angel Studios to run a
studio successfully.
AH We were probably building up to having to rejig the whole place [Angel Studios]
anyway. Here [Southgate Studios], because we’ve taken advice from architects and people,
and we’ve also had the structural engineer in and also the local fire brigade, we know that
we’ve hit the fire regulations OK and we have a fire corridor and all the studios open off the
fire corridor. It’s a bit like Barbican Studios. It’s more or less the same set-up.
…You have a fire corridor. We run the studios, at the moment they’re run as a non-
profit making company limited by guarantee, which we’ve always felt was very important,
but our bank manager thinks we’re mad.
…We’ve never been able to set up as a charity, it’s very difficult, very very difficult.
The old days of anybody just being able to claim themselves as a charity seem to have
gone. We’ve found it very difficult.
…We do [have to pay full business rates]. Even though we’re non-profit making,
the local council is so strapped for cash, we’ve applied several times to the local council,
because they can make exceptions, but they won’t make an exception, so we just pay full
rates now.
(Southgate Studios, 1999:interview)
Although Southgate Studios has a ten year lease, which both Hemming and Gray expected to be
able to renew, they were frustrated by the fact that to be genuinely secure, they would, ideally,
buy the building. The problem was that their landlord was not willing to sell, and this was com-
The Rise of the Small Independents, 1985–1998 6

pounded by their dealings with their bank.
AH About three years ago, before banks changed their lending ideas, our bank manager
was very supportive of us buying the premises, and we probably could have worked some-
thing out with them, but they just won’t sell, which is a shame, because we could have
bought the building, we could have done a lot more.
AG We set the place up because the banks were being very understanding. We had this
business at Angel, which was clearly a viable business.
AH …It’s quite complex, but we are two separate entities. On our side we are landlords,
because we rent space to artists, and then privately we are artists. So our business is a let-
ting business.
AG …Because we’d done that for three and a half years and could show that [we could]
find 60 people on a regular basis to keep the place running healthily, when we came here
and needed capital because we’d basically lost it all in court, we suddenly found ourselves in
a bit of a position with that, the bank was quite understanding, albeit at a, in a self-inter-
ested sort of way, interest being the operative word. It was quite difficult. We lent some of
our own money into the business, struggled to get it all set up…
AH We wouldn’t get the same help now from the bank, that’s for sure, because their
lending policies have just totally changed, which is a great shame.
(Southgate Studios, 1999:interview)
This is a classic illustration of the potentially frustrating financial hurdles which artists can face
when trying to establish a studio block from scratch rather than simply hiring a space in an ex-
isting studio block. Hemming and Gray’s view is that the centralisation of banking has much to
do with this change of affairs, not least because the esoteric and often insecure nature of profes-
sional artistic practice is not catered for by the necessarily impersonal approach which such cen-
tralisation entails: “Central lending and ticks and crosses and you don’t have a bank manager
unless you, or unless your company are personally earning in excess of £500 thousand a year or
something, which we don’t. …And everything now has to go through central lending. And they
don’t have a clue as to what we do, what our business is, what we do or anything” (Adrian
Hemming/Southgate Studios, 1999:interview).
Nonetheless, although most studio blocks were simply established with survival in mind,
there were exceptions. The Florence Trust, founded in 1990, has its own distinct philosophical
basis which owes less to a basic need to survive, and has more in common with Kandinsky’s
(1914) search for the “spiritual” in art.
Rob Macintosh, Director:
The Rise of the Small Independents, 1985–1998 7

The Trust was started over nine years ago in this premises, this building, but it was the idea
of one guy, a guy called Patrick Hamilton who was a self-taught artist and had been living
and working in Florence Italy for a number of years. On his return, he wanted somewhere to
work, and his thoughts originally were somewhere to live and work. [He] had various con-
nections with the churches in the area, …knew the state of the churches in this area in
terms of congregations falling, and knew the history of this church. It was a redundant
church, it had been redundant for fifteen years, was completely boarded up, had no roofs on
the transcept and went on a sort of pilgrimage himself to get occupancy of it. That’s what it
was. It was a redundant church. It’s not a deconsecrated church, the church still owns it. The
Trust has seven years renewable leases with them. So he started it with a conviction and a
belief that artists should be inspired by their surroundings and should have contact with one
another. That creativity was, is in some essence a spiritual thing—this is his beliefs—and
that he could see them coming together and sort of harmonising. Artists coming together,
being spiritual in a spiritual place of great kind of value, great tradition, and architecturally
and all that. He was sort of inspired by it.
So they got the building and it received almost three quarters of a million pounds worth
of grant funded assistance to rebuild it. It had no roof, it had no floor, the basic structure of
it was unstable. And then artists would start to come here for up to two months. Very
short, concentrated periods of time where they would work on their practice and work with
others. It’s changed since then. The principle’s still there. It’s not a kind of continuous stu-
dio group, but there is change and they’re here for a short period of time. The spaces are
subsidised and the artists apply and are, through a vigorous selection process, awarded a
residency at Florence Trust. Whereas before the need was what got you in. You wanted to
be here, you wanted respite from your own studio, you wanted contact with others. The se-
lection has changed in that and the quality of artists has changed.
(Florence Trust, 1999:interview)
In that it has such a strong philosophical basis, the Florence Trust is perhaps unique in the East
End, although the hurdle of having to deal with a building in poor condition is familiar enough.
But whether the studio was set up for reasons of philosophical preference, at Florence Trust,
survival, as at Acme and SPACE, or philanthropy, as at Delfina Studios, the fact was that the
East End had a lot of artists and a lot of studios. And on 4th December 1990, The Independent
lit the (metaphorical) blue touch paper: “London’s East End” it reported, “has the biggest con-
centration of artists in Europe” (Alberge, 1997:27).
7.3 The Media (Finally) Notices
In fact, a year earlier, The Independent had carried a feature on the East End Open Studios
event, and the writer had claimed that the 26 studios which would open their doors to the public
The Rise of the Small Independents, 1985–1998 8

“represent only a small proportion of the thousands of artists who live and work in London’s
East End” (Duffin, 1989). Duffin had also organised the Open Studios event, and as we saw in
chapter one, her claim for the total number of artists in the East End was probably wide of the
mark. Nonetheless, the media myth was up and running, and while we cannot gauge the extent
to which the media—here I refer primarily to printed media—has driven the growth of the East
End artists’ agglomeration, it would seem counter-intuitive to assume that it has not affected it
in some way.
But until the mid-1990s, the media took little notice of the burgeoning population of art-
ists on its doorstep. The first three issues of the Guardian’s quarterly Art for Sale magazine,
published in April, July and November 1992, incidentally the year of a Whitechapel Open Stu-
dios event, make no mention at all of the East End’s population of artists: such mentions of
places as there are centre around the traditional gallery districts of Mayfair (Guardian, 1992a;
Guardian 1992b; Guardian, 1992c).
By 1995, the “biggest concentration” statistic had reached the Financial Times, which re-
ported that in “Hackney, east London, there is the biggest concentration of such [struggling] art-
ists in Europe” (Thorncroft, 1995b), a statement which is plain wrong: the majority of the East
End’s artists (although not craftspeople, perhaps) are in Tower Hamlets, not Hackney. Other ar-
ticles (Packer, 1995; Thorncroft, 1995a) in the Financial Times refer to the East End in passing:
it is simply where an interesting gallery show happens to be. In both cases, the venues are the
same: Flowers East and Paton Gallery, galleries in the West End mould.
The Whitechapel Open Studios did not take place in 1995, but it did in 1996, and it is in
the coverage of it in the Guardian, the Times and the Daily Telegraph (Glaister, 1996; Walters,
1996; Pile, 1996) that we finally see high profile acknowledgement of the phenomenon, pre-
senting the East End artists’ agglomeration as a new Paris Left Bank. Glaister’s article was the
first to be published, occupying most of page three of the Wednesday July 10th edition. The
Times and the Daily Telegraph followed on Saturday 13th July, carrying broadly similar arti-
cles: the Times even included a coloured map of the East End, pointing out where the studios
were.
By September 1997, the Guardian was declaring that Shoreditch was fashionable in its
“Style” section (Pretlove, 1997), and in November of that year, Hugh Pearman argued that
“Remaking the inner cities is easy. Push the button marked Arts, and the money pours in.”
(Pearman, 1997). The example with which Pearman chose to illustrate his article was Hoxton.
Fifteen months later, in 1999 London Fashion Week Time Out magazine carried an article titled
“The hip 100” (Time Out, 1999). The East End, it seemed, had come of age as a fashionable,
trendy place: of the “favourite 100 London faces and places” listed, Hoxton was second behind
the supermodel Kate Moss. The Truman Brewery in Brick Lane came fourth, the Dragon Bar,
near Old Street came eighth, the Hoxton Bar and Kitchen came 12th, while Chapman Fine
ART, a gallery run by the Chapman brothers, and Brick Lane and Spitalfields Market were 18th
and 19th respectively (ibid).
What we see as we go through the 1990s is a gradual shift in media coverage of the East
The Rise of the Small Independents, 1985–1998 9

End as an artists’ quarter: in the first half of the decade, it was simply a place where art could be
seen. By the end of the decade, it had become a trendy, bohemian sort of place if magazines
such as Time Out are to be believed. In fact, the more recent media coverage has centred on the
two places closest to the City, Spitalfields and Shoreditch, and the image presented is of a
newly vibrant, central location. This too, is only partially true. Brick Lane, which along with
Hoxton Square has been an epicentre of the new “artistic” East End, has been a vibrant cosmo-
politan street at least since the early 1980s (when this writer first visited), although Hoxton
Square and parts of Shoreditch have become more gentrified during that period. Significantly,
the “regeneration” of Brick Lane is very much a white western phenomenon: the new shops are
run and populated by young and fashionable westerners, not the local Bangladeshis; curry
houses and cafés face each other across the street without seeming to meet halfway; shops full
of chairs by Charles Eames and other well-known western designers spill their wares onto the
pavement, but there is no cultural reference to the mostly Bangladeshi locality. It is almost as if
Brick Lane only became interesting when the media noticed it, and of course that is not quite
the case, although the more lively aspect of the northern half of Brick Lane has certainly coin-
cided with the heightened media profile of the area.
Within the time frame of this project, however—and this remains a matter of
speculation—it seems likely that the media had little or no influence on the growth of the East
End artists’ agglomeration: by the time they noticed, it was nearly three decades old. Rather, the
media had picked up on a phenomenon that had been “bubbling under” for years, and which the
property markets had already begun to exploit. The number of artists had already stopped rising
exponentially, and was levelling off as studios closed down in the light of rising property prices,
which themselves were no doubt fuelled by media-driven demand. Paradoxically, it may well
be the case that media coverage has hastened the demise of the East End artists agglomeration,
rather than encouraged it, although that same media attention, catalysed by artists, has also
spurred the regeneration of the Brick Lane-Hoxton Square-Old Street axis.
7.4 After the Media2
The heightened media profile of the East End—or parts of it—is perhaps symptomatic of a
more general absorption of contemporary art into the cultural mainstream. But the media cover-
age of the East End artists’ agglomeration reached its apotheosis with the BBC2 documentary
The New East Enders (2001) although it comes as little surprise that this focused on the celebri-
ties: the voracious appetite for fame observed in the younger generation of artists by Andrew
Lambirth in 1997 was clearly being satisfied (Lambirth, 1997).
From the outside, then, the new-found fashionableness of the East End gives the impres-
2 Parts of this section were written in May 2001. In deference to historical continuity it drifts beyond the
project’s “cut-off date” of 1998, and the upshot of this is that in places it risks being less strongly
grounded than previous sections. I have therefore endeavoured to be diligent in differentiating between em-
pirical and anecdotal evidence.
The Rise of the Small Independents, 1985–1998 10

sion of a thriving artistic community: the truth is actually more prosaic. As we saw above, the
media’s interest in the East End artists’ phenomenon increased in the late 1990s, but the reality
is that the East End “arts scene” portrayed by BBC2 is probably not one that many artists would
recognise, driven as it apparently was by the pervasive cult of celebrity3. Equally, most East End
galleries have come into existence since 1998, the end-point of this research, and few of those
galleries were more than eighteen months old at the time of writing. In fact, the movement of
high profile dealers such as Jay Jopling to the East End is atypical (Enid Lawson Gallery,
interview:20014) and a glance through the “Art Dealers” section of the Yellow Pages reveals the
majority of dealers to be based in West London.
Before closing the history of the studios, I want to digress (very) briefly to speculate fur-
ther on the way in which art has been publicly perceived. There is evidence to suggest that atti-
tudes to the visual arts have changed over the last five years or so. According to Richard Ingram
at the Enid Lawson Gallery, there has been a shift in the demography of art buyers from middle-
aged buyers in their 50s and 60s to younger buyers in their late 20s and 30s. Ingrams attributes
this change to the fact that, unlike the antique art market, “the [contemporary] art market has
blossomed in the last ten years” (ibid). Ingrams was also of the view that the “Affordable Art
Market” held annually in Battersea Park has done much to make contemporary art more acces-
sible to the artistic “lay-public”, and so opened up new markets of young, childless professional
couples5 with high disposable incomes (ibid). But this is really an area for further research, and
although the contemporary art market might be thriving, it may well be the case, as we saw in
the previous section, that the East End artists’ agglomeration has already passed its zenith.
One studio which has closed down since the fieldwork for this project was carried out is
Red Door Studios, situated at the north end of Mare Street in Hackney, in what used to be
Hackney Police Station, and housing five artists.
In many respects it was a typical East End studio block. A narrow, slightly shambolic
staircase directly in front of the red front door for which the studios were named. To the left of
the cramped entrance hall, a studio about 12 feet square, with the high windows covered by thin
paper to give an even light. A painting, abstract, was in progress when I visited, lying on the
floor, dominating the space. My informant’s studio was up the stairs, past a small landing with
coffee mugs and kettle on a small table, through a doorway which bisected the landing, and up
to the second floor, then into the studio. Again, the large windows had thin paper across them,
but only the lower half. Through the top half of the window, the steeple of St John’s church
could be glimpsed through the churchyard trees.
The studio had bare floorboards of pine, splattered with paint. The studio was spacious,
maybe 25 feet long and 12 feet wide—it had once been divided into two spaces, but the other
artist left the block. Paintings were stacked up against the walls, and along part of the window
wall was a workbench, crammed with artist’s paraphernalia. I sat on an old low settee placed
3 This is strictly my opinion, but it is a point worth making: it highlights the gap between the celebrity
and non-celebrity artist.4 An informal telephone interview was conducted on May 18th 2001.5 The so called DINKIES: Dual Income No Kids.
The Rise of the Small Independents, 1985–1998 11

beneath a window, next to the workbench. On an old chair opposite, telling me about the the
studios’ history, sat my informant, co-founder and director, Kwai Lau. She had graduated from
the Royal Academy in 1992, was looking for a studio, and had been told of the studios on Mare
Street:
KL I came and had a look at it, and basically it was completely… it was very dark.
There were three people in it, and there were two of them who leased, er the leaseholders as
it were were textile designers, but they didn’t really know what to do with it.
My first impression was, when I had a look around it, they didn’t do very much
work, and there were still three or four spaces left. I was interested so I moved in here,
which is the second floor, the whole building’s three floors, so I got a space here to share
with one other person. Slowly I built up a…[pause] did a lot of the decoration, because they
didn’t do anything.
…Downstairs was a dump basically. They dumped everything and they didn’t bother
to clear it out, and they didn’t bother to look round for artists or whatever, so I came in and
I noticed there were like two or three spaces left, so I told a few of my fellow students. So
now when we were there, ’92, there were three of my fellow students here, including me,
and slowly we got things moving, and it became like a working atmosphere really. When I
came, there was no working atmosphere, it was really dark, the corridor to the rear had no
lighting, it was just really grim, you know. Then we found out that the girls who were in
charge were making money out of us, and they kept saying the reason why they wanted to
make money off us was that it was covering the month when they couldn’t find anyone, but
they could easily find anyone.
…it wasn’t advertised, it was just word of mouth really, from a college friend. So
they got fed up with us, and left. The two textile girls left and one guy left, so I took
charge, and we pay the rent for the whole building—we just split it into five or six.
(Red Door Studios, 1998:interview)
However, despite the nuisance of making the buildings workable, the very nature of these
places, and the freedom which such shabbiness offers to someone wishing to reconfigure a
space unhindered, is something which the artists appeared to appreciate when interviewed. And
it also became apparent during interviews that at least some artists do enjoy being in the East
End. Kwai Lau:
I think… the nicest thing about Hackney—this area, the East End, particularly this area be-
cause I know this area so well—is I can just walk out with my painting clothes and people
don’t care. If you do that in Bond Street or Soho, they think you’re a tramp, or posing or
something, and er… But I also notice there’s a lot of artists walking about, which is really
nice. You’re thinking “ah!” …It’s nice. (Red Door Studios, 1998:interview).
The Rise of the Small Independents, 1985–1998 12

As we saw in the previous section, however, the “East End” about which Kwai Lau was talking
is not that most commonly referred to in the media, and in this respect perhaps the most cele-
brated and best known studios are those which, until 1998, occupied Spitalfields Market, imme-
diately east of the City. Like Covent Garden Market, Spitalfields Market was originally a fruit
and vegetable market, and it was only with the eastward expansion of the City, and the redevel-
opment of Liverpool Street Station and the associated Broadgate development in the late 1980s
that its role as a market was threatened. It ceased to be a fruit and vegetable market in the mid-
1980s, and was the subject of a major redevelopment proposal by architects MacCormac, Jami-
eson and Pritchard in the late 1980s (Architects’ Journal, 1991). The construction on Bishops-
gate of a new office building for LIFFE6 sealed its fate: the Northern half of the market, built in
the 1950s, would be demolished, the southern 19th and early 20th century half would be re-
tained.
Perhaps unsurprisingly, it became something of a cause célèbre. Within easy walking dis-
tance of the Whitechapel Gallery, Liverpool Street Station and Brick Lane—which of course
lies at the heart of the Bangladeshi community—it is ideal for expansion, and in events sharply
sharply resonant of the controversy which buffeted Covent Garden Market in the 1970s, the re-
development of Spitalfields Market attracted media attention in the early 1990s, although that
was to do with architecture and planning rather than art; artists were simply the first beneficiar-
ies of its closure.
Studio manager, Ellie Sice:
ES We started in 1992. We were the brainchild of Martin Burroughs, and he had to raise
the funds to open these studios and eventually there were seventy studios with about a hun-
dred artists, with different media. We had musicians, video makers, voiceover, they’re doing
every kind of the modern kind of art. Sculptors and painters, performance artists, mytho-
logical artists, we had practically every field of art in the studios.
…It was a charitable organisation; we were registered as a charity.
(Spitalfields Art Trust, 1999:interview)
The buildings also housed a new “market ” of craft stalls, second-hand books and records, food
vendors, clothes stalls and restaurants; in the centre there was a small opera space, and the
northern-most end was set aside for sports. The market was and remains home to “The Spitz”
bar and the Commercial Gallery.
Now7 empty of artists, although the craft market remains, Spitalfields Market clearly il-
lustrates the way in which artists can be a convenient “holding option” for property which
would otherwise be redundant, giving the landlord a small income and someone to look after
the building. When set alongside the story of St. Katharine’s Dock and SPACE, the story of
Spitalfields is, in some respects at least, a classic example of history repeating itself, and we
have in a sense come full circle: it is time to sum up.
6 The London International Finance and Futures Exchange7 May 2001
The Rise of the Small Independents, 1985–1998 13

The Rise of the Small Independents, 1985–1998 14
SPACEColumbia Road (Ravenscroft Studios)Martello Street71 Stepney GreenOld St Patrick!s Ch., Buxton St.Bombay Wharf . . . . . . . . . . . . . . . . . . . . . . . . Milbourne StreetBelsham StreetRichmond HouseBrittania WorksWinkley St. . . . . . . . . . . . . . . . .Victor HouseDeborah HouseEastway BathsEastway LaundrySara Lane Court . . . . . . . . . . . . . . . . . . . . . . . . . . . . . . . . . . . . .
Acme Housing AssociationAcme Short Life HousingBonner/Robinson RoadOrsman Road Studios . . . . . . . . .Carpenters RoadBombay WharfCopperfield RoadCommercial Road . . . . . . . . . . . . . . . . . . . . . . . . . . . . . .
Independent StudiosBarbican Arts Group . . . . . . . . . .Metropolitan WharfChisenhale StudiosFawe Street StudiosCable Street StudiosVyner Street Studios . . . . . . . . . .Hanbury Street StudiosNew Hoxton WorkshopsDelfina StudiosChilton StreetPixley Street Studios . . . . . . . . . . . . . . .Maryland StudiosMT StudiosRufus Street StudiosFlorence TrustSouthgate Studios . . . . . . . . . . . . . . . . . . . . .Cooperage StudiosCopperfield Road (not Acme?)Limehouse Arts FoundationRed Door StudiosSpitalfields Studios . . . . . . . . . . . . . . . . . . . . . . . . .Teesdale Street StudiosBalls Pond StudiosBrick Lane StudiosStandpoint StudiosWestland Place Studios . . . . . . . . . . . . . . . . . . . . . . . . . . . .Wharf StudiosColumbia Road (Ezra St)Birdcage StudiosBow Arts Trust (lost/Art 4 Offices)City Studios . . . . . . . . . . . . . . . . . . . . . . . . . . . . . . . . . . . . . . . .Oxford HousePanchayatTurquoise Arts GroupUnderwood ArtsArbutus Studios . . . . . . . . . . . . . . . . . . . . . . . . . . . . . . . . . . . . . . . . . . . Baches Street StudiosSpitalfields Farm Studios113 GroupColosseumFashion St. Studios
!88 !89 !90 !91 !92 !93 !94 !95 !96 !97 !98
Figure 7.1 Studios in the East End, 1988 - 1998
««««««««««««
««««
«««««««««

The Rise of the Small Independents, 1985–1998 1
1-16, SPACE Studios. 2. Ravenscroft Studios; 4. Martello St.; 5. 71 Stepney Grn; 6. Old St. Patrick!s Ch.; 9. Bombay Whf.; 10. Milbourne St.; 11. Belsham St.; 12. Richmond Hse.; 13. Brittania Wks.; 14. Winkley St.; 15. Victor Hse.; 16. Deborah Hse.; 17. Eastway Baths; 20-28, Acme. 20. Various Short Life Housing - Acme HQ shown; size reflects no. of houses; 21.Bonner/Robinson Rd.; 22. Orsman Rd.; 23. Old Ford Studios; 24. Carpenters Rd.; 25. Bombay Whf. (acquired from SPACE, 1992); 26. Copperfield Rd.; 27. Commercial Rd.; 28-71, Independent. 29. Barbican Arts Grp.; 32. Chisenhale Studios; 33. Fawe St.; 34. Cable St.; 35. Vyner St.; 36. Hanbury St.; 37. New Hoxton Workshops; 38. Delfina Studios; 39. Chilton St.; 40. Pixley St.; 41. Maryland Studios; 42. MT Studios; 43. Rufus St.; 44. Florence Trust; 45; Southgate Studios; 46. Cooperage Studios; 47. Copperfield Rd.; 48. Limehouse Arts Foundation; 49. Red Door Studios; 50. Spitalfields Studios; 51. Teesdale St.
Figure 7.2Map of Studios, 1989
Figure 7.3Map of Studios, 1992
1989
>100 artists
50-100 artists
20-49 artists
5-19 artists
29
22
154
21
6
32
13
12
42
10
1611
35
2 14
4337
20
36 5
40
31
9
34
33
24
3841
1992
>100 artists
50-100 artists
20-49 artists
5-19 artists
29
22
3743
2
6
50 3646
154
12
42
10
1611
49
35
5114
21
5
40
3134
204726
25
13
24
3841
17
33
48
32

The Rise of the Small Independents, 1985–1998 2
1-16, SPACE Studios. 2. Ravenscroft Studios; 4. Martello St.; 5. 71 Stepney Grn; 6. Old St. Patrick!s Ch.; 10. Milbourne St.; 12. Richmond Hse.; 13. Brittania Wks.; 15. Victor Hse.; 16. Deborah Hse.; 17. Eastway Baths; 20-28, Acme. 20. Various Short Life Housing - Acme HQ shown; size reflects no. of houses; 21.Bonner/Robinson Rd.; 22. -Orsman Rd.; 24. Carpenters Rd.; 26. Copperfield Rd.; 27. Commercial Rd.; 28-71, Independent. 29. Barbican Arts Grp.; 32. Chisenhale Studios; 33. Fawe St.; 34. Cable St.; 36. Hanbury St.; 37. New Hoxton Workshops; 39. Chilton St.; 40. Pixley St.; 41. Maryland Studios; 42. MT Studios; 43. Rufus St.; 44. Florence Trust; 45; Southgate Studios; 46. Cooperage Studios; 47. Copperfield Rd.; 48. Limehouse Arts Foundation; 49. Red Door Studios; 50. Spitalfields Studios; 51. Teesdale St.; 52. Balls Pond Studios; 53. Brick Lane; 54. Standpoint Studios; 55. Westland Pl.; 56. Wharf Studios; 57. Columbia Rd.; 58. Birdcage Studios; 59. Bow Arts Trust; 60. City Studios; 61. Oxford Hse.; 62. Panchayat; 63. Turquoise Arts Grp.; 64. Underwood Arts; 65. Arbutus Studios; 66. Baches St.
Figure 7.4Map of Studios, 1995
Figure 7.5Map of Studios, 1998
1995
>100 artists
50-100 artists
20-49 artists
5-19 artists
13
24
38
41
17
5
40
3134
204726
154
12
42
10
16
4929
22
374354
56
55 2
6
50 3646
57
53
27
5121
32
48
33
52
25
1998
>100 artists
50-100 artists
20-49 artists
5-19 artists
29
22
374354
56
55
52
6460
66
154
12
42
10
16
49
257
5121
32
13
2441
17
59
5
40
3134
204726
48
33
6
50 364653
27
62
5861
63
65

7.5 Discussion, 1968–1998
7.5.1 Seventy Studios in Five Phases…
The three decades which separate the initiatives at St. Katharine’s Dock and Spitalfields Market
have been the time frame within which the East End of London has made the change from an
industrial to a post-industrial district. There can be little doubt that London’s artists have bene-
fited from those changes, even with the irony that the very fluidity which such changes create
also serves to make the artists’ positions less secure.
We now know the story of the artists’ East End well enough to be able to start asking
questions about how and why certain things happened the way they did, and we can now tease
out the patterns which will help us to develop a theoretical model in the next two chapters. This
section describes the phases through which the East End artists’ agglomeration has passed; the
next explores the economics and sociology of the East End artists’ agglomeration.
The chronology of the East End artists’ agglomeration can be divided into five phases,
marking different aspects of its historical evolution. These phases also reflect the geographical
growth of artists’ studios in the East End. The first three phases are very approximate analogues
of Lundgren’s (1995) genesis, coalescence and dissemination.
The first phase is one of initial concentration near the river in the late 1960s and very
early 1970s. Running from 1968 to 1971, the first phase coincides more-or-less with the life of
the match shed at St. Katharine’s Dock as an artists’ studio block. In effect, it is in this phase
that the East End artists’ agglomeration has its origins, and, to shamelessly deploy a biological
metaphor, it is the equivalent of living creatures climbing out of the primordial slime8. Unable to
do much except survive, these creatures consolidate what they have, developing slowly and
building a firm foundation from which to grow more strongly. The same was true of the artists
who started SPACE. The initial goal, once the idea was launched, was simply one of making it
happen, and ensuring that it would be successful, which of course it was. After the early rapid
growth in the number of artists in St. Katharine’s Docks, numbers stayed more-or-less constant
until 1971, when SPACE had to hand the premises back to the GLC and find alternative accom-
modation. But there were now enough artists, and enough ideas, for the system to diversify, sig-
nalling a shift to the second phase.
The second phase lasted from around 1972 to 1975, and is marked by dispersal, mainly to
Stepney, Shoreditch and Bow, and by a variety of different approaches to running studios.
Much of this explosive diversity can be attributed to two factors. First, the influence of the
property markets on an area in the throes of a shift from an industrial to a post-industrial econ-
omy, and second the nature of the property itself.
The means of acquiring the required property varied depending on the type of property,
and the landlord’s requirements. Thus SPACE were required to relinquish their squatters’ rights
and start a company to gain access to ex-PLA property; Acme set up a housing association to
get access to short-life housing that they could use as living and working accommodation; inde-
8 Pace artists: this is intended as an analogy, not a simile.
The Rise of the Small Independents, 1985–1998 17

pendent studios most often simply leased the building from the landlord, even if they were run
on the basis of varied ideologies, ranging from having a place to work (most common) to
achieving some sort of spiritual state through art (least common).
In settling in Shoreditch and Hoxton, the new studio blocks were locating themselves in
the heart of what was, sixty years ago, the hub of London’s furniture industry. We saw in chap-
ter three that the industry in the East End tended to be light industry, and so the premises them-
selves were of a scale ideally suited to the production of artworks. Had the dominant industries
in the East End been heavy—steel-mills or oil refineries for example—then the East End would
probably not have so many artists working there.
The third phase, from 1975 to 1985 is notable for the fact that its first five years were
characterised by a dramatic slowdown in the number of artists moving in to the East End. The
number of artists stayed more or less static, and we can offer two tentative reasons why this was
the case. First is that the property markets at the time mitigated against the establishment of new
studio blocks in the light industrial property required. Second, the artists themselves, having
“found their feet”, simply got on with their work, and channelled their creative energies into art
rather than survival strategies. Both seem to be reasonably plausible explanations, and it is cer-
tainly the case that some of the art which emerged at this time was quite extreme, most fa-
mously perhaps in the performances and conceptual works of COUM Transmissions who were
based in SPACE studios in Martello Street, the studio block from which Robin Klassnik estab-
lished Matt’s Gallery. And as well as the new galleries such as Matt’s which began to emerge,
SPACE organised the first of the Open Studios events, and the rise of community art enabled
the Whitechapel Gallery to raise its profile in this area of artistic practice.
But by the early 1980s, new studio blocks were being set up, not only by Acme and
SPACE, but also by groups of artists acting independently of these organisations, and the end of
this dearth of new studio blocks was marked by the establishment of Chisenhale Studios. Again,
most of these studio blocks were not near the river, but farther north in Shoreditch, Bow, Strat-
ford, Bethnal Green and Hackney.
The fourth phase simply continued where the third phase had left off. The beginning of
the 1980s had seen the recommencement of the the in-migration of artists, as Acme and SPACE
had continued to expand their portfolios, and new studio blocks were set up, notably Chisenhale
Studios and Cable Street Studios. But from the mid-1980s, most of the new studio blocks were
quite small. Acme and SPACE were by now a part of the “establishment”, and the artists setting
up these new studio blocks wanted to remain independent, and to be somewhere sufficiently
compact that some form of “working atmosphere” could be fostered.
Phase five has not happened yet. Most of the available evidence for this last phase is
based on speculation from interviewees in the light of rising property prices in pockets of the
East End such as Hoxton and Bow, and we shall return to this topic in the conclusions, when we
are better equipped to speculate about future developments. However, we can offer the tentative
hypothesis that it looks likely to take the form of a further dispersal of artists from the “inner”
East End of Tower Hamlets and Hackney, to the outer boroughs of North and East London,
The Rise of the Small Independents, 1985–1998 18
combined with a consolidation of relatively few artists’ studios in the inner East
End—Spitalfields and Shoreditch.
At this point an invidious question arises, and it is one to which the East End’s artists are
particularly sensitive: have artists driven the regeneration of the East End? More specifically,
did artists contribute by their presence and image to the successful regeneration of St.
Katharine’s Dock, Wapping and Butlers Wharf in the late 1960s and 1970s, or even Spitalfields
in the 1990s?
In the case of St. Katharine’s Dock, the artists were permitted to occupy the buildings
while a competition for their refurbishment was decided: St. Katharine’s would have been re-
generated whether the artists were there or not. In Wapping’s case, by the late 1980s the newly
deregulated City was looking to expand anyway, and the LDDC was nearing its first decade of
existence: again, the regeneration would have happened anyway, artists or no. Butler’s Wharf
also fell within the LDDC boundary: again, it would have been regenerated anyway. The story
repeats with Spitalfields Market: the encroachment of the City hastened its demise, and that en-
croachment was in train before artists moved there.
With the exception of the Brick Lane-Hoxton Square-Old Street axis, where artists were
the catalyst for the heightened media profile and subsequent (partial) regeneration of that area,
the evidence is at best circumstantial; the presence of artists in a run down area will not neces-
sarily trigger its regeneration. The four examples given above are all edge of City locations, and
consequently prime candidates for City expansion. De Beauvoir Town was gentrified in the
1970s, despite there never having been an artists’ studio there. The environs of Maryland Stu-
dios remain defiantly down-trodden: the studios have been there for nearly a decade-and-a-half.
To be sure, in all cases artists have been forced to move on and set up shop elsewhere, and they
have the skills and needs to do so successfully. And as we saw in section 7.3, the role of the me-
dia must not be underestimated, for it is they who declare an area or district fashionable, and so
legitimise it as such.
Parallels have been drawn between the gentrification of Manhattan’s Lower East Side—a
tale recounted in Sharon Zukin’s book Loft Living—and the gentrification of the East End, nota-
bly in The Artist in the Changing City (BAAA, 1993). This is misguided, for the simple reason
that London’s geography is not like Manhattan’s. London’s structure might be likened to the so-
lar system—a central core comprising the West End and the City, about which other centres re-
volve: Manhattan is the equivalent of the central core itself. The obsolete factories on the Lower
East Side were in city centre locations, those in the East End either in edge of City locations, or
plain isolated on out-of-the-way industrial estates: in short, the East End is more dispersed and
less central than the Lower East Side. But in both cases artists were some of the early benefici-
aries of industry’s misfortune, and it seems likely that as the East End recovers from its demise
as an industrial district, property prices will rise again, and artists will have to move elsewhere
as rents become prohibitively high.
Indeed we have seen something similar in the Docklands, whose regeneration has meant
that there are now few studio blocks located there, despite the large number of warehouses. In
The Rise of the Small Independents, 1985–1998 19

fact, most of the studios are north of the recently regenerated Docklands in the cheap areas. In-
terestingly, the boundary between studio clusters and the Docklands more-or-less coincides
with the northern boundary of the LDDC’s jurisdiction, and it is reasonable to conclude that the
regeneration of the Docklands has done little to benefit the East End’s artistic agglomeration.
Had that boundary been farther north, the studio clusters would perhaps also be farther north.
7.5.2 …and Two Thousand Artists
Ready access to cheap studio space is one half of the equation: the other half of course, is the
artists themselves. The “Coldstream Report” had precipitated an enormous growth in the num-
ber of artists graduating from the UK’s art schools by the 1970s (see Appendix 3 for figures),
wherein lay a steady stream of demand, from graduates from London’s art schools and beyond.
But it was the case then, and remains so now, that the majority of artists do not make their
living solely from their work as practitioners, and those who have dealers are a minority. A few
teach, most have other part time work which finances their practice. The “average” artist in
2001 probably does not enjoy a greater standard of living than the artist of 1971: if she has a
student loan to pay off, it may even be worse.
The point though, is to make art with which the artist is satisfied: the original aim of
Acme, and one of the principle aims of SPACE, was survival, to enable the artists to continue
making art. In that respect, perhaps, artists are really working for themselves and technically,
that has to be true: the majority are after all self-employed. But although it lies outside the strict
remit of this thesis (which is primarily a history of the studios rather than an analysis of artists’
working and living conditions), the question of who provides the part-time work on which so
many artists depend still deserves an answer. Here we can only hazard the guess, based on anec-
dotal evidence, that it is London’s burgeoning service industries that have unwittingly sup-
ported the growth of the East End artists’ agglomeration, particularly during the 1990s when the
growth in the number of artists in the East End was at its steepest. Such work—in cafés, bars
and restaurants, for example—provides just the flexibility which an artist might be expected to
need.
Impetus for the development of the East End artists’ agglomeration also lay in the chang-
ing relationships between artists, art dealers and galleries, but only to a limited extent. So in the
1960s, the collapse of the contemporary markets precipitated SPACE in a very direct way
(Sedgely’s dealer went out of business), and the move to the East End of galleries such as those
belonging to Angela Flowers or Graham Paton no doubt lent credibility to the East End as an
“artistic quarter”. But the galleries followed the artists, and primarily for reasons of finance in
Paton’s case (Paton, interview:1998). Anecdotal evidence suggests that Charles Saatchi makes
weekly trawls around the East End’s studios, searching for new talent, and such stories, whether
they are strictly true or not, serve to perpetuate the legend.
Overall though, it seems unlikely that patronage was a driver of the growth of the East
End artists’ agglomeration, and the evidence from the interviews does not suggest that this was
The Rise of the Small Independents, 1985–1998 20

the case. More likely, patronage was a “benign circumstance”, not unlike the general context of
fluidity in that respect.
Studios need money too, and if at an individual level the tendency has been for artists to
get relatively little support, that has not been the case with studios. Support here has come most
often in the form of co-operative and sympathetic landlords, be they local authorities or private
landlords. The GLC gave tacit support to both SPACE and Acme, and none of the respondents
reported problems with their landlords 9, although this was probably a reflection of the artists’
tendency to be “good tenants” combined with otherwise unlettable or unsaleable property.
Nonetheless, anecdotal evidence gathered since 1998 suggests that once a studio block becomes
viable in the property market, its role as a studio block will come to an abrupt end.
One respondent (Southgate Studios) said that a major problem was getting banks to un-
derstand the needs of small studio blocks, and suggested furthermore that local authorities could
exercise their discretionary right to waive business rates for studio blocks; however they ac-
cepted that this probably would not happen, given the financial constraints faced by East End
boroughs.
7.5.3 Closing Remarks
A thumbnail sketch of the history of the East End artists’ agglomeration comes out something
like this. An edge of city location—the East End—loses its traditional role as the heart of Lon-
don’s industry at a time when increasing numbers of artists are graduating from art schools and
the contemporary art market is in a state of collapse. Local authorities and other landlords are
prepared to utilise artists as a “holding option” for the large stocks of obsolete property—both
residential and light industrial—they now possess, and the artists, in need of studio and often
living accommodation, bring their creative skills to bear to “create something from nothing”. In
many cases, the artists have known each other since their college days.
For two-and-a-half decades, this scenario plays itself out over and over again, and the
number of artists in the East End rises exponentially, until by the end of the 1990s there are
over two thousand artists in an area of roughly eight square miles, working in often remote,
cold and lonely studios. The East End, or Shoreditch and Hoxton at least, has also become fash-
ionable, and property prices are rising again, pricing artists out of the market.
What is sad is that posterity risks forgetting them. Butler’s Wharf now has one of those
ubiquitous blue plaques, which gives a brief, history of the complex: first it was spice ware-
houses, and then it became restaurants and shops, we are told. The artists and musicians who
were there for a decade are simply not mentioned.
But further speculation on these issues must wait until the concluding chapter, and for the
time being we shall have to be content with the observations set out here. What is clear is that
patterns exist and certain common threads run through the phases and tie them together. All of
the artists who set up studios or galleries were responding to their own immediate needs. Even
9 Evictions notwithstanding, and once terms were agreed.
The Rise of the Small Independents, 1985–1998 21

those such as Peter Sedgely, who co-founded SPACE and envisaged an artists’ community,
were responding to their own immediate context. The prima facie evidence suggests that this
phenomenon was not steered by any one person or organisation. Equally, we have been told by
those involved that information travelled by word of mouth—the ubiquitous “grapevine”: infor-
mal networks in other words. Spin-offs were commonplace (figure 7.6 overleaf).
But questions still arise. How informal were the networks? Can a phenomenon such as
this just “grow” of its own accord. Is there a “hidden order” which we should be seeking?
Clearly, it is time to look at these threads and patterns more systematically.
The Rise of the Small Independents, 1985–1998 22

The Rise of the Small Independents, 1985–1998 125
Matt!s Gallery
SPACE
Acme Free Form Arts Trust
Butlers Wharf
Chisenhale Studios & Gallery
Angel Studios
Southgate Studios
New Hoxton Workshops
Standpoint Studios
Red Door Studios
Cable Street Studios
Cable Street Gallery
Metropolitan Wharf
New Crane Wharf
Fawe Street Studios
Art for Offices
Lamont Gallery
Bow Arts Trust
Barbican Arts Group(Sycamore St.)
Barbican Arts Group(Hertford Rd)
City Studios
Truman!s Brewery Site
Spitalfields Studios
1968
1988
1998
1978
Delfina Studios
Wharf Studios
Maryland Studios
Figure 7.6 Studio "Spin-offs!. This diagram shows which studios and galleries have developed as "spin-offs! from earlier initiatives, either through individuals emerging from the shadow of larger organisation to establish themselves independently (eg Matt!s Gallery and Free Form Arts Trust) or through having to move premises and set up elsewhere (eg Southgate Studios).

EIGHT
“THERE AREN!T ANY NETWORKS!”1
Nature is not an intrinsic harmony of clearly defined units. Nature exists in multiple levels, in-
teracting with fuzziness at their borders. We cannot even formulate an unambiguous definition
of “individual” at the single level of organic bodies—as Armillaria mats and aphid clones dem-
onstrate. Furthermore, in Darwinian terms, legitimate individuals exist and operate at several
levels of a genealogical hierarchy—genes and species, as well as organisms. But what a fasci-
nation when this maelstrom of differing individuals builds its meshwork of interaction to pro-
duce life’s history of Darwinian evolution.
Stephen Jay Gould, “A Humungous Fungus Among Us”, 1996
8.1 About this Chapter
Stephen Jay Gould unwittingly got closer to the truth than the studio manager whose exclama-
tion forms the title of this chapter: but in the sense of there being only weak social networks at a
formal level, our respondent got it about right; in the pages that follow, we shall find out why.
We now have a pretty good idea of the way in which the East End artists’ agglomeration
has evolved over the last thirty years or so, and we saw at the end of the previous chapter that it
is equally apparent that the evolutionary mechanism relied heavily on social networks of one
sort or another to oil its wheels.
In this chapter we shall explore those social networks more systematically: primarily this
will be through the technique of formal social network analysis, but I shall also briefly explore
some of the ways in which organisational networks have been theorised. This is the subject of
section 8.2. Section 8.3 explains how the social network analysis was approached, sets out how
the sample frame was chosen, while section 8.4 introduces the basic terms and concepts of so-
cial network analysis. Section 8.5 describes the pilot study which was carried out in order to as-
sess the methodological approach and the application of social network analysis techniques. In
1 This was one respondents’s slightly outraged response to my question on social network involvement.
“There Aren!t Any Networks!” 1

throwing light upon the artistic networks, the pilot study strongly suggested two things: a less
detailed approach to measuring the precise nature of relationships between individual actors,
and the introduction of a wider range of social network analysis tools with a view to developing
a better understanding of the overall structure of the networks. The way in which this latter path
was pursued, and the findings which it uncovered, are set out in section 8.6. Section 8.7 summa-
rises the chapter, highlighting the main points which we shall take into chapter nine, where a
theoretical model of the East End artists’ agglomeration is developed.
8.2 Network Analysis and Network Theory
This chapter is primarily to do with the mathematical technique of formal social network analy-
sis: it is not an exploration of network theory, but simply the application of a particular meas-
urement technique to a particular problem. Here nonetheless, we shall touch very briefly on the
way in which social networks have been theorised.
Social network analysis—the focus of this chapter—has its origins in the 1930s, with the
development of sociometry—the study of inter-personal relationships in social groups—and the
invention of the sociogram, a graphical depiction of those relationships. Recognition of the use-
fulness of such devices spurred the further development of analytical techniques which became
increasingly mathematical during the 1940s and 1950s. These developments drove and were in
turn driven by theoretical considerations, through which further insights into the dynamics of
social groups were sought. The three mathematical cornerstones of social network analysis are
graph theory, statistical and probability theory and algebraic models, which between them offer
a “precise way to define important social concepts, a theoretical alternative to the assumption of
independent social actors, and a framework for testing theories about structured social relation-
ships” (Wasserman & Faust, 1997:10–17). Crucially, Wasserman and Faust observe in the final
section of their book that
a great deal of work remains [in] integrating network concepts and measures into more gen-
eral social and behavioral science research. Although network is a catchphrase in many dis-
ciplines (from “network” to “network corporations”) the precise (and correct) use of network
measures has not fully diffused to these areas.
(ibid:733)
They attribute this partly to “institutional and intellectual barriers between disciplines” and
partly to a perception that social network analysis is overly technical.(ibid). But their observa-
tion highlights a rift which might be caricatured as the American pragmatist versus the Euro-
pean theorist: not surprisingly, there are overlaps; and of course there are gaps in the one which
the other fills.
The debates are a decade old now, but some of the points raised remain pertinent. In his
“There Aren!t Any Networks!” 2

introduction to the edited volume Networks and Organizations (Norhia and Eccles, 1992), Nor-
hia pointed out that despite having a long history (as we saw above) the notion of the network
had become fashionable in the early 1990s (ibid:3). Networks and Organizations represented
“the state of knowledge about networks as applied to organizations” (ibid:viii), and presented
both theoretical and empirical work: the general proposition of the volume was that “networks
are as much process as structure” (ibid:7). It is perhaps felicitous for this thesis that one chapter,
DiMaggio’s, dealt with the foundation in the late 1920s of the Museum of Modern Art (MoMA)
in New York (DiMaggio, 1992).
DiMaggio’s argument is a simple one: in order to establish MoMA in the face of indiffer-
ence or even hostility to contemporary art, the wealthy female triad behind the idea had to enlist
the support of both wealthy and influential patrons. To do this, they “sought legitimacy in the
academic community and the institutional art-museum community” (ibid:129). DiMaggio’s
“central insight” from this short study—the actual history of MoMA is described with a brevity
that borders on the begrudging—is that “social structures… should be characterized on the basis
of social relations rather than cultural factors” (ibid:120), an insight which intuitively seems
sensible enough, and which is reflected in the approach to social network analysis adopted in
this chapter. However it is worth making the point that the polarisation implicit in DiMaggio’s
assertion is not reflected herein: social relations need placing in context, and cultural factors
therefore need to be taken into account, a view which would doubtless come as little surprise to
the proverbial “man on the Clapham omnibus”. We shall return to this theme shortly.
An example of the European approach (with a strongly Swedish perspective) is the notion
of the “industrial network”, presented as “a new view of reality” by Axelsson and Easton in the
same year (Axelsson & Easton, 1992). Simply, this argued for a network-based approach to un-
derstanding industrial organisations. For Easton (1992:25), this notion was a new paradigm in
the making2, the consequence of which was strong disagreement about what drives the changes
in a network: arguments varied from no mechanism at all to the view that resources and struc-
tures are consumed to arrest the process of entropy; networks do not tend towards an optimum
efficiency configuration; or resource distribution may tend toward some sort of equilibrium
(ibid).
These problems were perhaps compounded by Axelsson’s observation in the same edited
volume that there was confusion over how to define a network: he offered three possibilities:
• a number of loosely connected organisations which are linked by one or a number of
bonds or social relationships;
• the total pattern of relationships within a group of organisations acting in order to
achieve common goals;
• sets of two or more connected exchange relationships.
(Axelsson, 1992:243)
2 Such claims occasion suspicion: time is perhaps a more reliable judge than a particular idea’s originator
of whether it represents a paradigm shift. Compare Norhia and Eccles’s (1992) point that this was a newly
fashionable but old idea.
“There Aren!t Any Networks!” 3

The third definition was preferred by Axelsson and Easton. However, it is also the closest to
that used in formal social network analysis, and it is in examples such as this that the rift posited
above becomes obvious; and it does, as Wasserman and Faust claimed it would, appear to stem
from a simple lack of curiosity. Social network analysis does of course offer an unambiguous
definition of a network (and indeed did at the time) simply because, being a mathematical tool,
it has to. The notion that “complex behaviour can result from the interplay of relatively simply
defined exchange relationships” was not new in 1992: complexity theory, by then a decade old,
argues exactly that, as we shall see in the next chapter. Finally, the confusion over what drives
the changes in a network had also been addressed, but from the European side of the Atlantic,
specifically Paris.
Bruno Latour (1979, 1987) introduced Actor Network Theory (ANT) to explore the way
in which some scientific ideas are accepted, and some are not. Latour (1997) claims that it
“…has very little to do with the study of social networks”, but rather that it “aims at accounting
for the very essence of societies and natures [sic]. …Social networks will of course be included
in the description but they will have no privilege or prominence” (ibid). Ironically perhaps, La-
tour adds that he found few of their (ie social network analysts’) tools “reusable” (ibid), a senti-
ment which this chapter clearly does not share; in fairness, though, the phrase “network analy-
sis” means different things to different people, as we have just seen.
The original concept of ANT was that scientists, in order to get their ideas accepted by the
scientific community and indeed the world, rely upon, interact with and mediate their laboratory
and its equipment, their colleagues, funding bodies, journals, the media at a more general level
and so forth. Latour calls this process a “black box”, meaning that the niceties of doing research
are generally hidden from the public, who are led to believe that “science” is an objective, logi-
cal and linear process, rather than the often politically driven and iterative process that it actu-
ally is (Latour, 1987). Latour argues that all of the things through which this process is medi-
ated form shifting networks of actors and/or “actants”—the inanimate objects which are in-
cluded in the networks and are acted upon.
Indeed, similar ideas can be found elsewhere. Bijker (1997) notes that the uptake of cer-
tain technological innovations—the safety bicycle for example—needed the right socio-eco-
nomic context as well as the necessary technological advances. Becker (1982), Zukin (1982)
and Bourdieu (1993), all argue that (successful) art is as much a product of its context as of the
artist. Thus to make a (successful) painting, an artist needs materials, space in which to work
and at the very least someone in a position of influence to buy the painting, or to champion it
and encourage others to buy it. Bourdieu calls this the “the field of cultural production”—which
resides in a “field of power”—and Becker refers to “art worlds” (Bourdieu, 1993:38; Becker,
1982). Like Latour’s work, these descriptions are attempts to lift the lid on the mysterious
“black box” of production and to look inside: the rather obvious point is that there is more to
science than the scientific genius, more to art than the brilliant and charismatic artist.
These ideas, however, were not new either to art or to science when they were published.
Palaeontologist Stephen Jay Gould, acutely aware of the social context of scientific practice,
“There Aren!t Any Networks!” 4

had pointed out in the mid 1970s that “[p]eople… assume that each [scientific] statement arises
from the ‘data’ actually presented, rather than the social conditions that truly inspired it”
(Gould, 1977:243). The artist John Baldessari had also realised this in terms of art in his 1971
work Art History. Beneath a photograph of the pyramids of Egypt runs the caption:
A young artist had just finished art school. He asked his instructor what he should do next.
“Go to New York,” the instructor replied, “and take slides of your work around to all the
galleries and ask them if they will exhibit your work.” Which the artist did.
He went to gallery after gallery with his slides. Each director picked up his slides one
by one, held each up to the light the better to see it, and squinted his eyes as he looked.
“You’re too provincial an artist,” they all said. “You are not in the mainstream.” “We’re
looking for Art History.”
He tried. He moved to New York. He painted tirelessly, seldom sleeping. He went to
museum and gallery openings, studio parties and artists’ bars. He talked to every person
having anything to do with art; travelled and thought and read constantly about art. He col-
lapsed.
He took his slides around to galleries a second time. “Ah,” the gallery directors said this
time, “finally you are historical.”
Moral: historical mispronounced sounds like hysterical.
(Lynton, 1989:338)
Going still farther back in time, we might refer to the lectures of Hippolyte Taine, who pains-
takingly elaborated the social, racial and cultural characteristics and contexts which under-
pinned the art of ancient Greece, and Italy and the Netherlands in the 16th century (Taine,
1889).
ANT, then, is a way of looking at the world. Social network analysis is a way of measur-
ing it. But Murdoch (1997:745) observed that “nature and society are collective effects, that is
they emerge from the construction and consolidation of networks”. This is interesting, because
here, ANT is hinting more or less explicitly at a dynamic which links social network analysis
and the theoretical focus of the next chapter—complexity theory—and that is the notion of
emergence: the appearance in a system of properties that cannot be predicted simply by looking
at its constituent parts in isolation. We shall explore emergence more closely in chapter nine.
We shall revisit some of the theories outlined above in the closing section: here, though,
social network analysis is used strictly as a methodological tool; as Wasserman and Faust
(1997:11) put it, to “provide formal statements about social properties and processes”. The in-
tention is not to apply theories of networks to the qualitative findings, although that would be
perfectly feasible, and the social network analysis points down a particular theoretical avenue:
that is the subject of the next chapter. But for the time being, we continue with social network
analysis, and here, the theory—or rather working hypothesis—to be tested is that offered up as
“There Aren!t Any Networks!” 5

one of the closing questions of the last chapter: “How informal were the networks?”
8.3 General Approach and Sample Frame
8.3.1 General Approach
Recall from chapter two (section 2.4.1) that preliminary, informal enquiries were carried out
with a view to “getting a feel” for the project and the subject matter. These enquiries were ex-
tended at a more formal level through a pilot study of the envisaged methodology which would
be used in the social network analysis. The procurement of the pilot study is described fully in
section 8.5, but its findings can usefully be summed up here.
It quickly became apparent that formal analysis of the social networks as they were three
decades ago would be problematic and time-consuming at best. So too would be an analysis
which attempted to trace the evolutionary dynamic of the social networks over that time, fasci-
nating though that would be. Lundgren (1995) provides an interesting example of how such a
study might be carried out in his own exploration of the way in which the networks within the
Swedish image processing industry changed and evolved between 1975 and 1989. But what we
can do here is look at a more formal level at the social networks as they now are, and by com-
bining that information with both the historical and current qualitative evidence, attempt to
tease out any patterns and processes which can further our understanding of the underlying dy-
namics. However, as we shall see in the next section, the pilot study highlighted the difficulty of
studying social networks at the level of individual agents. It was therefore decided to examine
the social networks which exist at a more formal, organisational level. In other words, an
“actor” might be a local authority, a studio block, or an independent arts organisation, rather
than an individual artist. Two indicators were developed which would provide information of
sufficient detail to be useful, but not be so narrow as to be unrealistic. They are:
• actors which appear to be significant in some way;
• groups of organisations within the network which appear to be more cohesive relative
to the network as a whole.
The insights into the nature and structure of the networks which the answers to such questions
might offer are in themselves interesting and this chapter deals with the application of formal
social network analysis to the relevant data gathered in the course of fieldwork. But these in-
sights will also prove useful in chapter nine when we try to develop a theoretical model for the
underlying dynamics of the historical development of the East End arts scene.
8.3.2 Sample Frame for Social Networks
If the sample frame from which social network models for artists are constructed is generated
from a simple random sample, then the networks described, if they emerged at all, would tell us
little other than the fact that some artists talk to other artists. And yet the very act of trying to
“There Aren!t Any Networks!” 6

measure social networks among artists carries the assumption that artists talk to one another. To
be sure, we could establish reasons why these particular artists talk and interact with the people
in their network, but there would be little systematic basis for the findings.
For the purposes of mapping the social networks then, a random sample of artists in the
East End would have to be the basis for a “snowball” sample, as described by Goodman (1961).
Here, each of a random sample of actors s is asked to name k other actors. The actors in the first
random sample—stage one—would each be asked to name, for example, the five actors with
whom they “have the closest professional relationships” (stage two). Each of the five actors
named who do not themselves appear in the stage one sample would then be asked to name fur-
ther actors to generate a stage three sample (Goodman, 1961). This process is then repeated for
as many stages as necessary to generate the required social network models.
There are two major problems with this approach of taking a random sample of individual
artists. First, we would merely build up a small picture of the social networks of a small per-
centage of individual artists, without knowing for sure whether they are truly representative of
the situation in the East End. Second, a stage one sample of ten percent of artists would encom-
pass 150 people. Clearly, to develop a model of a social network, we would need at least two
stages, and probably three to generate anything like a representative picture. If each stage one
actor named five other actors for the stage two sample, even if some of those stage two actors
could be discounted by dint of their being in stage one already, we still need to carry out over
four hundred interviews. If we carried the process through to a third stage, then it is not unreal-
istic to estimate a total approaching something like 2000 actors.
A graphic representation of a 2000-actor network would undoubtedly be impressive. It
would also be all but incomprehensible to any but the most patient and determined reader. And
such a large sample size would also overstretch the resources—and patience—of a solitary re-
searcher. Clearly, for all that snowball sampling is a useful technique, particularly for establish-
ing further contacts, we need to find a more focused way of choosing our sample.
Each of the forty “independent” studio blocks is administered by a working artist. If each
of the “independent” studio blocks is interviewed, it follows that not only has each of the blocks
been interviewed in its capacity as an “arts organisation”, but the forty artists who serve as ad-
ministrators for the studio block have also been interviewed. A similar approach was adopted
by Galaskiewicz (1979) who, in his study of the exchange networks of a medium-sized town in
the United States, chose to interview the highest ranking executive officers of his selected or-
ganisations (Galaskiewicz, 1979:45). However, although the highest ranking officer may be
best placed to give an overview of an organisations function and strategy, Galaskiewicz notes
the criticism of Laumann et al. (1978), who point out that a corporate actor is composed of indi-
viduals who have, in effect, their own loyalties and agendas (ibid:46). The difficulty then is in
separating the “corporate agenda” from the “individual agenda”.
It quickly became apparent during this study—and this is a question addressed in further
detail in the pilot study in chapter eight—that the division between corporate and individual net-
works would need to be addressed. The view of those being interviewed was that the significant
“There Aren!t Any Networks!” 7

artistic networks, the ones that they could relate to, were those which function at an individual
level rather than a corporate level. In other words, the studio as such may not be part of a net-
work even if the individuals are a part of a network and it is generally known that they come
from a particular studio.
Even so, for the purposes of this study, the sample frame described above is reasonable:
the “independent” studio blocks are in general sufficiently small for the administrator to know
everyone in them; the administrators are themselves working artists who carry out their admin-
istrative responsibilities in their spare time. What this means is that the interviewee can give in-
formation from the point of view of the organisation, which might for instance be interested in
building up links with say the local authority’s education department, and from the several
points of view of the individual artists within a block. Some individual artists may wish to be
involved in highly collaborative educational projects, while other individuals may prefer to
work in relative isolation, producing work for exhibition and sale. The studio administrator is in
a position to represent both these positions, since in representing a studio block, they are also
representing the artists within it. The problem of separating the “corporate” and “individual”
agendas was thus solved by making specific reference to both in the interview.
The picture which emerged from the interviews suggested that the social networks are
“nested”; networks within networks within networks. As we noted above, formal mapping of
the social networks at an individual level would be problematic, so the formal analysis has been
of the social networks at a corporate, or organisational level. However, before we move to the
analysis itself, we must introduce the methodology which makes such an analysis possible.
8.4 A Brief Introduction to Social Network Analysis3
8.4.1 Basic Terms and Concepts
Social Network Analysis provides a relatively simple way of understanding a range of more or
less complex relationships between people, organisations and so forth, known as actors. Rela-
tionships between pairs of actors can be be clearly defined, and by analysing a series of these
relationships, and then representing them either graphically—when actors are referred to as
nodes—or in the form of a matrix, the mechanics of a network can be understood and explained
(Wasserman & Faust, 1997).
Actors need not be capable of acting on their own volition, in the sense that an actor could
comprise people in a group, companies or nation states (ibid:17). A group of actors is known as
a network and a group of actors of the same type—self-employed artists for example—is known
as a one-mode network (ibid). A two-mode network might be the relationship between artists
and art dealers, while multi-mode networks also exist, although social network methods for
such complicated structures are rare (ibid:35).
3 Also see Appendix Two.
“There Aren!t Any Networks!” 8

Social ties link actors to one another, and these can take on a variety of different guises;
friendship, business relationships, club membership, physical connections such as a road or a
bridge, or kinship for example (ibid:18). A collection of ties, for example friendships, is called a
relation (ibid:20). A relational tie can either be directional or non-directional, and either di-
chotomous or valued (ibid:44). A directional tie exists where an artist sells paintings to a dealer,
and that dealer buys paintings from an artist, while a non-directional exists where an artist
shares a studio with another artist. A dichotomous tie either does or does not exist—for exam-
ple our artist either does or does not sell paintings to a particular dealer. A valued relation some-
how quantifies the relation, either in terms of strength, intensity or frequency of the tie between
the actors (ibid:45). The number of paintings sold to a dealer each year is an example of a val-
ued relation. So too is how much that dealer likes each of their artists’ work.
The basic unit of social network analysis is the dyad—two actors linked by a tie, or ties
(ibid). The triad, consisting of three actors and the associated ties is also used. This is more
complex. For example, actor i is linked to actor j, and actor j is linked to actor k. Actor k is in
turn linked to i via j (ibid:19). A collection of dyads, all interlinked, is known as a sub-group,
and the collection of all actors with ties to be measured is known as the group (ibid:20). The
“social network consists of a finite set of actors and the relation or relations defined on them”
(ibid:20). So without further ado, let us take a look at an example such a network.
8.4.2 The General Structure of the Network
The model in figure 8.1 above is hypothetical, but serves to demonstrate how combinations of
dyads can be be put together to form a network. The graph is a simple graph since it has only
“There Aren!t Any Networks!” 9
n1 Schools
n2 Community Arts Group
n1n3
n2
n4
POTENTIAL COMMUNICATIONS BETWEEN ACTORS
n3 Local Authority
n4 Self-employed artists
n1 n2 n3 n4
n1 - 1 1 0
n2 1 - 1 1
n3 1 1 - 0
n4 0 1 0 -
node
tie or arc
Figure 8.1 Representation of a Network using Graph and Matrix.
dyad (ringed)

one line between each pair of nodes. Each node either is, or is not linked to another, so each re-
lation is dichotomous—the actors either do or do not communicate with each other. Each rela-
tion is also non-directional, since communication is assumed here to be a two-way process.
The shortest path between two nodes is the geodesic and the longest of these is two (ties).
The matrix expresses the same network mathematically rather than graphically. A tie is indi-
cated by a 1, no tie by a 0. The matrix in figure 8.1 is symmetrical, which shows that the link-
ages are non-directional. Each form of representation has advantages and disadvantages. The
graph has the virtues of being relatively easy to read, even if the information it presents is rela-
tively complex. The significant actors can be identified with relative ease, even if the reader has
only minimal, or no knowledge of social network analysis. The graph forms a useful base for at-
tempts at predicting the effects of changes to the network: questions such as “supposing you in-
troduced this actor to that actor?” can be asked simply by drawing a line on the graph, and the
change in the overall balance of the network can immediately be grasped at a qualitative level,
even if further calculation is required to interrogate any quantitative changes. For this reason,
graphs rather than matrices are used to present the findings of the social network analysis in this
chapter.
In this illustrative example, node n2, Community Arts Group, appears to play a pivotal
role in the model. It is the only node connected to all the others, and serves as a
“communications short-cut”. Such a node—a cutpoint—is critical in communications networks.
Without n2, the graph has two separate components between which no communication is possi-
ble. Artists (n4) would be isolated—there would in effect be two networks.
Figure 8.2 above is a directed graph, or digraph. This example shows which actors
“consider themselves a friend of” other actors and has either one or two arcs between each pair
of nodes; the first arc shows whether ni considers nj a friend, while the second shows whether nj
considers ni a friend. Arcs are expressed as arrows which indicate the direction of the relation.
“There Aren!t Any Networks!” 10
n1n6n5n2
n7n4n3
“considers themselves a friend of”
Figure 8.2. Example of a Directed Graph or Digraph
ni nj

Dyads can be either mutual, indicated by a double-headed arrow, asymmetric, indicated by a
single-headed arrow, or null, indicated by no arc. Thus (n1, n2) is asymmetric, (n4, n5) is mutual
and (n2, n3) is null. Note that n2 is also a cutpoint in this graph. A node is said to be either ad-
jacent to a node if it terminates there, or adjacent from another node if it originates at that node.
Thus in figure 8.2 n5 is adjacent to n7 and adjacent from n2.
We can examine the basic structure of the social network for both graphs and digraphs in
a number of ways. We can measure the density ! of the network—the number of linkages pre-
sent compared with the maximum possible—and this will quantify the overall “connectedness”
of the network. Crudely, a low density would indicate that those in the social network have little
contact with others in the network, while a high density would indicate the opposite.
The nodal degree dni in a graph measures the number of linkages any one actor has with
other actors. The linkages can be either valued or unvalued; if they are valued, then a separate
figure is assigned to each node for the total value vni of its linkages.
Nodal degree of directed graphs is measured in terms of nodal indegree dI(ni)which
measures the total number of nodes adjacent to ni and nodal outdegree dO
(ni) which measures
the total number of nodes adjacent from ni. Measures of indegree and outdegree are useful
means of gauging the popularity or significance of actors to other actors in the network. Link-
ages in directed graphs can, like those in undirected graphs, be valued. Note that the values for
indegree and outdegree need not be the same. Thus in the example of figure 8.2, an actor with a
large indegree, say n5 is one who is considered by many others to be a friend, and an actor with
a large outdegree, say n2, is one who considers themselves to have many friends. Note that inde-
gree and outdegree need not coincide. The actor’s view of how many friends they have may
well differ from the others’ views of how many friends that actor has, and here it can readily be
seen that such information is potentially very sensitive.
Wasserman and Faust (1997:128) note that it is possible to derive four distinct types of
node in a directed graph which prove useful in describing the roles of particular nodes in a net-
work:
• Isolate if dO(ni) = dO
(ni) = 0
• Transmitter if dI(ni)= 0 and dO
(ni) > 0
• Receiver if dI(ni) > 0 and dO
(ni) = 0
• Ordinary if dI(ni) > 0 and dO
(ni) > 0
These node types are discussed in more detail in Appendix Two, Social Network Analysis.
8.5 The Pilot Study
8.5.1 Introduction
Recall that informal, preliminary enquiries, described in chapter 2 (section 2.4.1) had suggested
“There Aren!t Any Networks!” 11

that the artistic networks were likely to be complex, and with that thought in mind it was de-
cided to carry out a pilot study of the proposed social analysis techniques. This would focus on
five organisations which those early enquiries and desktop research had suggested were histori-
cally significant actors within the East End arts networks, and which had therefore been inter-
viewed early on in the course of fieldwork. As we have seen, these five actors are in fact a part
of a much larger phenomenon, but in utilising them as the basis for the pilot study useful in-
sights were gained into the structure and dynamics of the artistic networks, and the analytical
techniques could thus be modified accordingly. The pilot study had the primary effect of sug-
gesting a less detailed, but more wide-ranging approach to the social network analysis, better
able to accommodate the dynamic nature of the social networks, and from this two “indicators”
were generated, noted in section 8.2, through which the techniques described in that chapter
were chosen. We shall return to those techniques and indicators in section 8.6.
First, though, we set out the protocol for the pilot study and describe its findings. We then
explore the strengths and weaknesses of the adopted approach and explain how these were ad-
dressed in subsequent research.
8.5.2 Pilot Study: Protocol and Findings
The initial purpose of the pilot study was to test the quantitative data which had already been
gathered during the course of fieldwork, and to confirm or otherwise the suitability for this pro-
ject of both that data and the envisaged social network analysis techniques. Recall that the pos-
sibility of doing effective social network analysis at individual agent level had been discounted
as being impractical. The initial aim had therefore been to collect and analyse data about the
networking activities of “actors”—that is arts organisations, local authorities, studio blocks and
galleries—but at a relatively fine-grained level. Since data for both qualitative and quantitative
analysis was collected in the same interviews, it was necessary to carry out such a pilot at an
early stage in the project. To that end, five of the actors who had been interviewed early on in
the course of fieldwork were utilised. They were:
• SPACE, the first artist-led organisation to provide studio space in warehouses in the
East End;
• Acme, the first artist-led organisation to provide live-work space for artists;
• Chisenhale Studios, one of the first “independent” artists’ studios in the East End;
• Free Form Arts Trust, the first community-oriented arts organisation in the East End;
• London Borough of Tower Hamlets’s Arts and Leisure Officer.
These organisations were chosen for the following reasons:
• The artists’ groups are original “pioneer” East End studios;
• The artists’ groups can provide first hand historical evidence of the origins of the East
“There Aren!t Any Networks!” 12

End in its putative role as a “creative milieu”;
• Tower Hamlets (along with Hackney) has a strong interest in what the borough can gain
from the East End’s artists, and were therefore seen as able to provide a broader over-
view of the significance of this phenomenon;
• Since the groups are all long-established, they were perceived to be useful starting
points from which to generate a snowball sample.
The aim in choosing these informants was therefore two-fold. First it was hoped to establish the
historical origins of East London’s strong geographical concentration of artists. Second, it was
hoped that the informants, being of key significance in the East End, would prove a useful start-
ing point from which to generate a snowball sample, although in the end this sampling option
was not pursued, and the information gathered was used at a more general level.
For the purposes of social network analysis, the five respondents were asked to value
linkages with other actors on a scale of nought to five, which may be formalised as follows:
0 Unaware of existence of that organisation, or, if aware, negligible contact, and no per-
ceived need to initiate a relationship;
1 Aware of existence of organisation, having minimal contact, but no working relationship
as such;
2 Positive working relationship, but intermittent or sporadic contact, probably not long-es-
tablished, but felt to have the potential to develop;
3 As 2 but: contact is regular but infrequent. Relationship has developed from stage 2, and
is perceived as an integral part of the organisation’s longer-term programme of activities;
4 As 3 but: contact is now frequent; the relationship has been relatively long-established;
5 As 4 but: professional relationship sufficiently strong to have a significant social element.
A total of six data sets were collated for the five respondents. The first set of data comprises sta-
tistics for the entire group, while the remaining five sets comprise data for each of the respon-
dents. The five respondents between them named a further six actors, generating a network of
eleven actors. For this pilot study linkages, which are of course valued, were also deemed to be
non-directional since this was judged to be more appropriate to the measurement of professional
relationships (figure 8.3 overleaf).
The first data set thus functioned as a baseline against which statistics for each of the indi-
vidual respondents could be measured. This set also told us something about the pilot network
itself, although even at this early stage in the research, it became apparent that this data needed
to be read with considerable circumspection.
The first point is that the majority of actors within the pilot network were those named by
the respondents, rather than respondents themselves, and the pilot network was therefore the
network as perceived by the five respondents. Thus the other actors in the pilot network are
those who are perceived to be significant from a particular respondent’s point of view. Each of
“There Aren!t Any Networks!” 13

the respondent’s networks are, in effect, combined to provide an overall picture. So the borough
of Hackney for example, which was not interviewed as a part of the pilot study, appears in the
pilot network, but any figures which we attribute to Hackney—nodal degree for
example—cannot be meaningfully interpreted without the introduction of a directional element
into the analysis, and this is a point we shall examine more fully in the next section, which ex-
plores how the findings of the pilot study were addressed.
Equally significant is the fact that this analysis considers links between organisations.
Thus Acme Housing Association appears from the pilot analysis to be relatively small and in-
significant within the pilot network, and in terms of its direct relevance to those other respon-
dents, that may well be true. However, we know that Acme is actually the largest provider of
studio space in London—and also in Britain (Acme, 1995)—and further, and more importantly,
that it also provides a substantial proportion of studio space in the East End. In terms of the East
End arts scene then, Acme is highly significant, and the dichotomy between what the pilot study
tells us, and what the historical facts tell us is addressed later in this chapter.
It is also important to note that the linkages between actors are those which were per-
ceived by the respondents to exist at the time of the interview. Thus what may have been a po-
tentially strong linkage on the day of the interview—because a collaborative proposal for fund-
ing has been entered into, for example—may cease to exist if the source of the funding dries up
unexpectedly, or if the application is unsuccessful. Thus the social networks which exist are
subject to constant change, and an analysis of this type is at best a snapshot of the network at a
given point in time. Again, this is an issue which is addressed in the next section.
“There Aren!t Any Networks!” 14
Value of linkages
5
4
3
2
1
Figure 8.3 Network for Pilot Study
n4
n2
n56
n54bn54a
n53a
n53b
n59
n40
n57
n1
Chisenhale Studios (n4)
Acme (n2)
SPACE (n1)
London Arts Board (n56)
Tower Hamlets Arts n54a
T.H. Education (n54b)
Hackney Planning (n53a)
Hackney Arts (n53b)
Free Form Arts Trust (n59)
Whitechapel Gallery (n40)
NAA (n57)
Pilot Informants in bold
Numbering reflects the system used throughout this chapter

However, the results from the pilot study, although of limited value in terms of formal
analysis of the networks, offered insights into the structure and dynamics of the networks, al-
luded to above, which have proved useful in terms of formulating a revised strategy by which
the social network analysis could be carried out at a less detailed but more realistic level. We
shall therefore turn our attention to the findings of the pilot study before continuing the discus-
sion of its findings and implications.
Baseline statistics of nodal degree and linkage value were used in the pilot study with a
view to gaining an insight into the overall structure of the pilot network. This was a test of how
effectively data gathered in the field could be probed through social network analysis tech-
niques. Participation in events such as the Whitechapel Open Studios, which can also be ex-
plored using social network analysis techniques, was not studied at this stage since accurate
data can be gathered from documentary sources. The basic statistics of the group of eleven ac-
tors, N, are therefore as follows:
Total nodes in network, g(N) = 11
Total linkages in network, L(N) = 15
Total value of all linkages, V(N) = 37
Modal Split for nodal degree dni = 0: modal split = 1
dni = 1: modal split = 3
dni = 2: modal split = 2
dni = 3: modal split = 2
dni = 4: modal split = 0
dni = 5: modal split = 2
dni = 6: modal split = 0
dni = 7: modal split = 1
Mean Nodal Degree d ( N) =2.73
where d =d(n
i)
i=1
g
!g
(8.1)
which may be simplified: d =2L
g
Variance of Mean Nodal Degree, SD2
= 4.62
where SD2=
(dni" d)
2
i=1
g
!g
(8.2)
“There Aren!t Any Networks!” 15

Mean value of all linkages V L = 2.467
where V L =V
L(8.3)
Variance of all values SVL
2 = 22.62
where SVL
2=
(vni ! V L)2
i =1
L
"L
(8.4)
Density of the graph # = 0.336
where the density of a valued graph, # is the average value attached to the lines of the graph.
where # =vk"
g(g !1)(8.5)
and 0 $ # $ 1
The figures from the pilot study, as we noted above provide a rough “base map” of the network
which we can utilise to set out a a more refined strategy for social network analysis.
First, the pilot network has a density # = 0.336 and it is not therefore very dense: there
are considerably fewer and weaker linkages than the maximum possible. Second, the variance
of mean nodal degree, SVL
2= 4.62 is high relative to the mean nodal degree d ( N) =2.73. In other
words, nodal degree is highly dispersed from the mean nodal degree. A glance at the modal split
above tells us that this high variance is not altogether surprising since there is no “typical” num-
ber of linkages for the organisations. The base statistics for each of the respondents are:
Chisenhale Studios: nodal degree, d(n1) = 5; value, v(n1) = 14; mean value, v =2.80
Acme Housing Association: nodal degree, d(n1) = 2; value, v(n1) = 4; mean value, v =2.00
SPACE Studios: nodal degree, d(n1) = 5; value, v(n1) = 14; mean value, v =2.80
L.B. Tower Hamlets: nodal degree, d(n1) = 1; value, v(n1) = 2; mean value, v =2.00
Free Form Arts Trust: nodal degree, d(n1) = 7; value, v(n1) = 14; mean value, v =2.00
The base figures for the five respondents—nodal degree, value and mean value—give useful in-
sights into what might be expected of each of the actors in terms of their networking habits at an
organisational level, and it is constructive to compare the figures from the pilot network with
qualitative evidence from the interviews.
The values for nodal degree and mean value for Chisenhale Studios are greater than those
for the pilot network, which tells us that Chisenhale Studios has more and stronger links than
average with other organisations within the pilot network. This quantitative evidence is re-
“There Aren!t Any Networks!” 16

flected in the fact that Chisenhale Studios has always had a philosophy of pursuing community
and educational projects. Acme, by contrast has values for both nodal degree and mean value
which are below their respective means. This would tend to suggest a below average involve-
ment in the pilot network, and these figures are reflected in Acme’s deliberately “isolationist”
approach to networking. SPACE has high nodal degree and value, which suggests that they
work relatively hard at developing and keeping contacts. However, many of their linkages with
other organisations vary in strength and frequency depending upon whether they were involved
in many, smaller arts projects, rather than being involved in the organisational network de-
scribed here. Tower Hamlets, like Acme, has figures below the respective means, but it is in
fact involved in several smaller, short term projects, rather than being involved in the organisa-
tional pilot network described here. Free Form Arts Trust has a high figure for nodal degree and
value, but mean value is below the network mean. This reflects the fact that Free Form is run in
the same way as a commercial practice, and has a large number of relatively weak linkages with
clients.
8.5.3 Pilot Study: Discussion
What is immediately clear from the pilot study is that the figures, taken in isolation, give us
bare facts and little else. So we can state with reasonable confidence that the pilot network is
not very dense, and the number of linkages which any actor has is likely to differ from the aver-
age of 2.73. Further, there seems to be a reasonably clear correlation between what the qualita-
tive data tells us about an actor’s involvement in the pilot network, and the mathematical data
pertaining to that actor. Clearly then, even at this comparatively simple level, we can gather
useful insights about the nature of the networks in terms of structure and density, and these in-
sights can be given greater depth when combined with qualitative data.
However, the weaknesses in the approach described above must not be overlooked, and
they are not always readily apparent. The first and major problem is that interviewees rapidly
got bored with the line of questioning outlined above, and were often loath to ascribe a numeri-
cal figure to a relationship the outcome of which was unsure, particularly if it was in the early
stages and would therefore score low on the system set out above. This problem was com-
pounded by the fact that in telling the “story” of how their organisation came into being, people
and organisations might be mentioned along the way, and returning to these relationships in the
interview, when they had already been described, could be irritating for the interviewee. This
response from Adrian Hemming of Southgate Studios is typical:
NG How would you see yourselves as fitting in to any professional networks that you
perceive to exist?
AH Well I would say me personally, informally, totally informally. I mean most things
seem to happen by serendipity, it’s just accidental.
“There Aren!t Any Networks!” 17

(Southgate Studios, 1999:interview)
The consequence of this was that the interviewee would try to skip over this section, with a
view to discussing topics which had not already been covered, leaving the interviewer with the
choice of persisting with the social network analysis, and risking irritating the interviewee, or
finding a more workable approach to gathering the data which would not prove antagonistic to
the interviewee. The latter course of action was chosen, on the simple grounds that the re-
searcher should not antagonise informants.
The second problem is that even if informants painstakingly and diligently value the
strength of a relationship on a numerical scale, such an analysis, if it is to reflect accurately the
network which existed at that time, has to be carried out within a very small time frame. The
fieldwork, as we saw in chapter two, was carried out over a period of roughly twenty months,
whereas the “short-timespan” strategy would have to be procured over only a few weeks or a
month, during which all the interviews would have to be carried out. While such a strategy
would be workable in a single organisation, such as a company, arranging thirty interviews with
thirty different arts organisations, all to take place in the space of a month, was not seen as a
feasible approach, particularly as many of the interviews had to fit around artists’ work sched-
ules.
The third problem also pertains to time and detail. Even if the problems set out above
were overcome, the resulting model of the social networks, while very detailed, would be accu-
rate only for that particular point in time. Such a model would also appear to be more accurate
than it really is—the equivalent of measuring the height of a forest to the nearest millimetre.
Thus such an approach is most appropriate for a time-series study, perhaps over many years,
such as Lundgren’s study of the evolution of the networks within the Swedish image processing
industry from the mid-1970s to the late 1980s (Lundgren, 1995). The aim in this project how-
ever was to gather information which could tell us more about how the the East End artists’ ag-
glomeration evolved, rather than trying to establish “who is friends with whom, and how close
are they?” So in order to develop a more resilient model which was less “time-dependent”, it
was decided to abandon the overly detailed approach to the social network analysis of the pilot
study in favour of one which was more exploratory. This would be better able to accommodate
inconsistencies from interview to interview, and allow the interviewee to speak more freely and
naturally about the linkages that they have with other organisations, but retain the usefulness of
the pilot approach in terms of describing the structure of the network. We shall now turn our at-
tention to this approach.
8.6 Artistic Networks—In Search of a Structure
8.6.1 Introduction
“There Aren!t Any Networks!” 18

We noted above two indicators which were developed to circumvent the problems which be-
came apparent in the course of the pilot study, and by which the social networks could therefore
be analysed. They were:
• actors which are significant in some way;
• groups of organisations within the network which appear to be more cohesive relative
to the network as a whole;
In this section we shall apply the techniques of social network analysis set out in chapter five to
each of the indicators in turn.
First though, we shall turn our attention to the graph of the social networks in figures 8.4
to 8.8 (pp.145–149). This shows all of the actors which were still in existence in mid-1998 and
which might be considered a part of the East End agglomeration of artists. The nodes enumer-
ated with white lettering represent the actors interviewed. Also shown are the foundation
dates—the oldest at the centre—for these actors, and the three types of relations which are the
subject of this analysis. All are directional, and they are colour-coded thus:
• The red relations indicate that the two actors have an active working relationship at a
formal organisational level. Thus the borough of Tower Hamlets, for example, is col-
laborating with ViA (described in chapter two). These relations are directional, but al-
ways in both directions. Thus if a collaborates with b then b collaborates with a.
• The blue relations indicate that actor a nominated or referred to actor b when asked
with whom they had a formal linkage. This therefore reflects the nominator’s view of
the nature of their professional relations with other organisations.
• The green relation indicates that actor b is in some way supported by actor a, for exam-
ple through being funded by them, or say by dint of the fact that a is b’s landlord.
Between them, these three sets of relations offer the possibility of quantitative exploration of
the social networks, although as we noted above, a purely quantitative account must be read
with due circumspection, and with qualitative findings in mind. The reader should also keep in
mind the fact that these networks are at one “level”: within them can be found smaller net-
works, which we shall discuss and concptualise as “sub-groups”, and the networks presented
will form part of larger networks. The connections with the larger networks are not explored
here, but in qualitative terms form the social context for the project, which has been explored in
previous chapters. The reader will doubtless have spotted the fact that this notion of embedded-
ness resonates with the theories of Bourdieu, Becker, Bijker and DiMaggio, discussed above;
but it also chimes with the notion of self-similarity across scales, or fractal properties, and this
we shall explore in the next chapter. Let us return to the analysis: in the first instance we shall
“There Aren!t Any Networks!” 19

examine the whole network—that is treat the three different relations as if they are
“There Aren!t Any Networks!” 20
Figures 8.4 to 8.8 (this page and pages 146 to 149 following). Circular digraphs showing respectively, an illustrative digraph, all relations, red relations, green relations and blue relations amongst actors.
The graphics used in these diagrams were derived from graphical representations of the internet in Scientific American, June 1999 (Chakrabarti et al., 1999:51)
1971
1983
1977
1989
1995
1998
“Annular rings” express
date of foundation of or-
ganisations on that ring.
Only organisations still in
existence at end 1998 are
shown.
Relations are as at mid-
n6
n29
n30
n14
n7
n3
n18
n11
n12
n15
n40n41
n42
n43n44
n47
n48
n49
n54
n55
n57
n58
n2
n53
n24
n13
n10
n25
n26n27
n28
n31 n35
n21
n33
n34
n22
n32
n46
n45
n36
n20
n19
n8
n9
n16
n17
n50
n51
n52
n37
n38
n39
n1
n23
n60n56
n59
n4
n5
B A
“nominated by’
Nodes, numbered and colour
coded to indicate different ac-
tor types and actors. The
numbers are colour-coded to
indicate which actors have
been interviewed (white
numbers), and which have not
been interviewed (black
Arcs, colour-coded to
indicate nature of rela-
tionship between
Dated “Annular Rings”, indicating
when organisation in question was
founded. These serve to give struc-
ture to the graph, and make it more
legible.
Node n3 has nodal indegree
= 1 and nodal outdegree =
3. It is therefore an
“ordinary”.
Node n18 has nodal inde-
gree = 0 and nodal outdegree
= 0. It is therefore an
“isolate”.
Node n57 has nodal inde-
gree = 2 and nodal outde-
gree = 0. It is therefore a
“receiver”.
Node n13 has nodal inde-
gree = 0 and nodal outdegree
= 2. It is therefore a
“transmitter”.
Figure 8.4 An Illustrative Digraph

1971
1983
1977
1989
1995
1998
“Annular rings” express
date of foundation of or-
ganisations on that ring.
Only organisations still in
existence at end 1998 are
shown.
Relations are as at mid-
“There Aren!t Any Networks!” 1
Actors which have been interviewed are italicised in the legend, and assigned white numbers in the digraphActors which have been interviewed are italicised in the legend, and assigned white numbers in the digraph
Studio Blocks
SPACE Studios (n1); Acme HQ (n2); Barbican
Arts Group (n3); Chisenhale Studios (n4); Fawe
Street Studios (n5); Cable Street Studios (n6); Hanbury Street Studios (n7); [New Hoxton Work-
shops] (n8); Pixley Street Studios (n9); Maryland
Studios (n10); MT Studios (n11); Rufus Street
Studios (n12); Florence Trust (n13); Southgate
Studios (n14); Cooperage Studios (n15); Copper-
field Road Studios (n16); Limehouse Arts Foun-dation (n17); Red Door Studios (n18); Spitalfields
Studios (n19); Teesdale Street Studios (n20);
Balls Pond Studios (n21); Brick Lane Studios
(n22); Standpoint Studios (n23); Westland Place
(n24); Wharf Studios (n25); Columbia Road Stu-
dios (n26); Birdcage Studios (n27); Bow Arts Trust (n28); City Studios (n29); Oxford House
(n30); Panchayat (n31); Turquoise Arts Group
(n32); Underwood Arts (n33); Arbutus Studios
(n34); Baches Street Studios (n35); Spitalfields
Farm Studios (n36); 113 Group (n37); Colos-
Art Galleries
Whitechapel Art Gallery (1896) (n40); Camera-
work Gallery (n41); Matt's Gallery (n42); Art for
Offices (n43); Chisenhale Gallery (n44); The Showroom Gallery (n45); Interim Art (n46); La-
mont Gallery (n47); Flowers East (n48);
[Commercial Gallery (n49)]; Paton Gallery (n50);
Cable Street Gallery (n51); The Approach Gallery
(n52)
Artists! Representative Organisations
London Arts Board (n56); National Artists Asso-
ciation (n57); ViA (n58)
Local Authorities
LB Hackney (n53); LB Tower Hamlets (n54);
Dalston City Partnership (n55)
Independent Arts Consultancies
Free Form Arts Trust (n59)
Art of Change (n60)
n6
n29
n30
n14
n7
n3
n18
n11
n12
n15
n40n41
n42
n43n44
n47
n48
n49
n54
n55
n57
n58
n2
n53
n24
n13
n10
n25
n26n27
n28
n31 n35
n21
n33
n34
n22
n32
n46
n45
n36
n20
n19
n8
n9
n16
n17
n50
n51
n52
n37
n38
n39
n1
n23
n60n56
n59
n4
n5
A B
“funds/supports”
B A
“nominated by”
A B
“has a working relationship
with”

1971
1983
1977
1989
1995
1998
“Annular rings” express
date of foundation of or-
ganisations on that ring.
Only organisations still in
existence at end 1998 are
shown.
Relations are as at mid-
“There Aren!t Any Networks!” 2
Actors which have been interviewed are italicised in the legend, and assigned white numbers in the digraph
Studio Blocks
SPACE Studios (n1); Acme HQ (n2); Barbican
Arts Group (n3); Chisenhale Studios (n4); Fawe
Street Studios (n5); Cable Street Studios (n6); Hanbury Street Studios (n7); [New Hoxton Work-
shops] (n8); Pixley Street Studios (n9); Maryland
Studios (n10); MT Studios (n11); Rufus Street
Studios (n12); Florence Trust (n13); Southgate
Studios (n14); Cooperage Studios (n15); Copper-
field Road Studios (n16); Limehouse Arts Foun-dation (n17); Red Door Studios (n18); Spitalfields
Studios (n19); Teesdale Street Studios (n20);
Balls Pond Studios (n21); Brick Lane Studios
(n22); Standpoint Studios (n23); Westland Place
(n24); Wharf Studios (n25); Columbia Road Stu-
dios (n26); Birdcage Studios (n27); Bow Arts Trust (n28); City Studios (n29); Oxford House
(n30); Panchayat (n31); Turquoise Arts Group
(n32); Underwood Arts (n33); Arbutus Studios
(n34); Baches Street Studios (n35); Spitalfields
Farm Studios (n36); 113 Group (n37); Colos-
Art Galleries
Whitechapel Art Gallery (1896) (n40); Camera-
work Gallery (n41); Matt's Gallery (n42); Art for
Offices (n43); Chisenhale Gallery (n44); The Showroom Gallery (n45); Interim Art (n46); La-
mont Gallery (n47); Flowers East (n48);
[Commercial Gallery (n49)]; Paton Gallery (n50);
Cable Street Gallery (n51); The Approach Gallery
(n52)
Artists! Representative Organisations
London Arts Board (n56); National Artists Asso-
ciation (n57); ViA (n58)
Local Authorities
LB Hackney (n53); LB Tower Hamlets (n54);
Dalston City Partnership (n55)
Independent Arts Consultancies
Free Form Arts Trust (n59)
Art of Change (n60)
Actors which have been interviewed are italicised in the legend, and assigned white numbers in the digraph
n6
n29
n30
n14
n7
n3
n18
n11
n12
n15
n40n41
n42
n43n44
n47
n48
n49
n54
n55
n57
n58
n2
n53
n24
n13
n10
n25
n26n27
n28
n31 n35
n21
n33
n34
n22
n32
n46
n45
n36
n20
n19
n8
n9
n16
n17
n50
n51
n52
n37
n38
n39
n1
n23
n60n56
n59
n4
n5
A B
“has a working relationship
with”

1971
1983
1977
1989
1995
1998
“Annular rings” express
date of foundation of or-
ganisations on that ring.
Only organisations still in
existence at end 1998 are
shown.
Relations are as at mid-
“There Aren!t Any Networks!” 3
Actors which have been interviewed are italicised in the legend, and assigned white numbers in the digraph
Studio Blocks
SPACE Studios (n1); Acme HQ (n2); Barbican
Arts Group (n3); Chisenhale Studios (n4); Fawe
Street Studios (n5); Cable Street Studios (n6); Hanbury Street Studios (n7); [New Hoxton Work-
shops] (n8); Pixley Street Studios (n9); Maryland
Studios (n10); MT Studios (n11); Rufus Street
Studios (n12); Florence Trust (n13); Southgate
Studios (n14); Cooperage Studios (n15); Copper-
field Road Studios (n16); Limehouse Arts Foun-dation (n17); Red Door Studios (n18); Spitalfields
Studios (n19); Teesdale Street Studios (n20);
Balls Pond Studios (n21); Brick Lane Studios
(n22); Standpoint Studios (n23); Westland Place
(n24); Wharf Studios (n25); Columbia Road Stu-
dios (n26); Birdcage Studios (n27); Bow Arts Trust (n28); City Studios (n29); Oxford House
(n30); Panchayat (n31); Turquoise Arts Group
(n32); Underwood Arts (n33); Arbutus Studios
(n34); Baches Street Studios (n35); Spitalfields
Farm Studios (n36); 113 Group (n37); Colos-
Art Galleries
Whitechapel Art Gallery (1896) (n40); Camera-
work Gallery (n41); Matt's Gallery (n42); Art for
Offices (n43); Chisenhale Gallery (n44); The Showroom Gallery (n45); Interim Art (n46); La-
mont Gallery (n47); Flowers East (n48);
[Commercial Gallery (n49)]; Paton Gallery (n50);
Cable Street Gallery (n51); The Approach Gallery
(n52)
Artists! Representative Organisations
London Arts Board (n56); National Artists Asso-
ciation (n57); ViA (n58)
Local Authorities
LB Hackney (n53); LB Tower Hamlets (n54);
Dalston City Partnership (n55)
Independent Arts Consultancies
Free Form Arts Trust (n59)
Art of Change (n60)
Actors which have been interviewed are italicised in the legend, and assigned white numbers in the digraph
n6
n29
n30
n14
n7
n3
n18
n11
n12
n15
n40n41
n42
n43n44
n47
n48
n49
n54
n55
n57
n58
n2
n53
n24
n13
n10
n25
n26n27
n28
n31 n35
n21
n33
n34
n22
n32
n46
n45
n36
n20
n19
n8
n9
n16
n17
n50
n51
n52
n37
n38
n39
n1
n23
n60n56
n59
n4
n5
A B
“funds/supports”

1971
1983
1977
1989
1995
1998
“Annular rings” express
date of foundation of or-
ganisations on that ring.
Only organisations still in
existence at end 1998 are
shown.
Relations are as at mid-
“There Aren!t Any Networks!” 4
Actors which have been interviewed are italicised in the legend, and assigned white numbers in the digraph
Studio Blocks
SPACE Studios (n1); Acme HQ (n2); Barbican
Arts Group (n3); Chisenhale Studios (n4); Fawe
Street Studios (n5); Cable Street Studios (n6); Hanbury Street Studios (n7); [New Hoxton Work-
shops] (n8); Pixley Street Studios (n9); Maryland
Studios (n10); MT Studios (n11); Rufus Street
Studios (n12); Florence Trust (n13); Southgate
Studios (n14); Cooperage Studios (n15); Copper-
field Road Studios (n16); Limehouse Arts Foun-dation (n17); Red Door Studios (n18); Spitalfields
Studios (n19); Teesdale Street Studios (n20);
Balls Pond Studios (n21); Brick Lane Studios
(n22); Standpoint Studios (n23); Westland Place
(n24); Wharf Studios (n25); Columbia Road Stu-
dios (n26); Birdcage Studios (n27); Bow Arts Trust (n28); City Studios (n29); Oxford House
(n30); Panchayat (n31); Turquoise Arts Group
(n32); Underwood Arts (n33); Arbutus Studios
(n34); Baches Street Studios (n35); Spitalfields
Farm Studios (n36); 113 Group (n37); Colos-
Art Galleries
Whitechapel Art Gallery (1896) (n40); Camera-
work Gallery (n41); Matt's Gallery (n42); Art for
Offices (n43); Chisenhale Gallery (n44); The Showroom Gallery (n45); Interim Art (n46); La-
mont Gallery (n47); Flowers East (n48);
[Commercial Gallery (n49)]; Paton Gallery (n50);
Cable Street Gallery (n51); The Approach Gallery
(n52)
Artists! Representative Organisations
London Arts Board (n56); National Artists Asso-
ciation (n57); ViA (n58)
Local Authorities
LB Hackney (n53); LB Tower Hamlets (n54);
Dalston City Partnership (n55)
Independent Arts Consultancies
Free Form Arts Trust (n59)
Art of Change (n60)
n6
n29
n30
n14
n7
n3
n18
n11
n12
n15
n40n41
n42
n43n44
n47
n48
n49
n54
n55
n57
n58
n2
n53
n24
n13
n10
n25
n26n27
n28
n31 n35
n21
n33
n34
n22
n32
n46
n45
n36
n20
n19
n8
n9
n16
n17
n50
n51
n52
n37
n38
n39
n1
n23
n60n56
n59
n4
n5
B A
“nominated by”

baseline statistics may be summed up as follows.
Total nodes in network, g(N) = 34
Total linkages in network, L(N) = 33
Modal Split for nodal Indegree dI = 0: 13
dI = 1: 13
dI = 2: 5
dI = 3: 2
dI = 4: 1
Modal Split for nodal Outdegree dO = 0: 18
dO = 1: 9
dO = 2: 4
dO = 3: 3
dO = 4: 0
dO = 5: 0
dO = 6: 0
dO = 7: 1
Mean Nodal Indegree d I =0.971
Mean Nodal Outdegree dO = 0.971
where d I =dI(n
i)
i=1
g
!g
and dO =dO
(ni)
i=1
g
!g
which may be simplified: d I = dO =L
g(8.6)
Variance of Mean Nodal Indegree, SDI
2 = 1.210
where SDI
2=
(dI(ni) " d I )
2
i=1
g
!g
(8.7)
Variance of Mean Nodal Outdegree, SDO
2 = 2.090
“There Aren!t Any Networks!” 25

where SDO
2=
(dO
(ni) ! dO)2
i=1
g
"g
(8.8)
Density of the graph # = 0.059
where the density # is the proportion of arcs present in the digraph.
where # =L
g(g !1)(8.9)
where 0 $ # $ 1.
What do these figures tell us? First, with a mean indegree d I = mean outdegree dO = 0.971 and
a density # = 0.059 the network is clearly highly dispersed. The average distance from an actor
i to the actors in its influence range is just 1.908, which suggests that the network is not highly
connected. The variance for mean nodal indegree SDI
2 = 1.210 and the variance of mean nodal
outdegree, SDO
2 = 2.090, and once again, this suggests that the network is fragmented. It is al-
ready apparent that at an organisational level, the artistic network as it existed in mid-1998
comprised actors which had only limited professional relationships with one another, and which
were limited in the number of actors with whom they “networked”. But some actors do emerge
as “significant” in some way, and it those actors to whom we shall now turn our attention.
8.6.2 Actors which are “significant” in some way
The title of this section is deliberately vague. Our search here is for actors which might be
deemed to be “significant” in terms of how connected they are to the rest of the network, but as
we shall see in our trawl through the figures, “significant” can have more than one meaning
when used within the context of formal social network analysis. We shall look at the network as
a whole, rather than in terms of each of the three relations we have measured, since we are try-
ing to establish which actors, if any, are significant for the whole inter-organisational network.
Recall that in a directed network, individual actors can be placed in one of four categories.
They are:
• Isolate if dO(ni) = dO(ni) = 0
• Transmitter if dI(ni)= 0 and dO(ni) > 0
• Receiver if dI(ni) > 0 and dO(ni) = 0
• Ordinary if dI(ni) > 0 and dO(ni) > 0
In table 8.1 below, each of the actors in the network is assigned to a particular category. Note
that ten of the actors (29%) are Isolates—they have no linkages at an organisational level with
“There Aren!t Any Networks!” 26

any other organisations. Fourteen of the actors in the network (41%) are Ordinaries, that is they
have both positive indegree and outdegree. Of the remaining actors, three (9%) are Transmitters
and seven (21%) are Receivers. We can therefore disregard the isolates, since these actors are
effectively outside the organisational network, and seek patterns amongst the remaining actors.
We shall therefore look at the connected network which results when the isolates have
been omitted. The first step is to review the baseline statistics of the graph with the expectation
that the fact that the graph is now connected will be reflected in the new set of figures. Thus the
baseline statistics for the connected graph are as follows (equation reference numbers given in
brackets).
Total nodes in connected network, g(NC) = 24
Total linkages in network, L(NC) = 33
Modal Split for nodal indegree dI = 0: 0
dI = 1: 13
dI = 2: 5
dI = 3: 2
dI = 4: 1
Modal Split for nodal Outdegree dO = 0: 0
dO = 1: 9
dO = 2: 4
dO = 3: 3
dO = 4: 0
dO = 5: 0
dO = 6: 0
dO = 7: 1
Notice that modal split will be unchanged except for the fact that there are now zero nodes for
“There Aren!t Any Networks!” 27
Isolates
Maryland Studios
Red Door Studios
Spitalfields Studios
Balls Pond Studios
Wharf Studios
Bow Arts Trust
Camerawork Gallery
Art for Offices
Lamont Gallery
Commercial Gallery
Transmitters
Florence Trust
Standpoint Studios
London Arts Board
Receivers
New Hoxton Workshops
Whitechapel Art Gallery
Matt!s Gallery
Chisenhale Gallery
Paton Gallery
Dalston City Partnership
Art of Change
Ordinary
SPACE
Acme
Barbican Arts Group
Chisenhale Studios
Fawe Street Studios
Cable Street Studios
Southgate Studios
City Studios
Cable Street Gallery
L.B. Hackney
L.B. Tower Hamlets
National Artists! Ass!n
Vision in Art
Free Form Arts Trust
Table 8.1 Isolates, Transmitters, Receivers and Ordinaries for the Artists! Network

whom nodal degree is zero.
Mean Nodal Indegree d I =1.348
Mean Nodal Outdegree dO = 1.348 (from eq. 8.6)
Variance of Mean Nodal Indegree, SDI
2 = 0.976 (from eq. 8.7)
Variance of Mean Nodal Outdegree, SDO
2 = 2.439 (from eq. 8.8)
Density of the graph ! = 0.120 (from eq.8.9)
Note that although the variance of mean nodal indegree, SDI
2 = 0.976, is less than the mean
nodal degree, the variance of mean nodal outdegree, SDO
2 = 2.439 is considerably higher than
the mean nodal degree. This is partly due to the fact the London Arts Board has a nodal outde-
gree of 7 by virtue of the fact that it is the primary public funding body for East End arts organi-
sations. In the pilot study, we found that the figures generated through social network analysis
had to be interpreted in the light of the qualitative evidence in order to make sense, and as we
proceed with this quantitative analysis, we shall see that this remains the case. In other words,
anomalies will arise in the network analysis which can only be explained by looking at the
broader picture, and through reference to qualitative evidence. The reasons for this will be ex-
plored in the discussion which concludes this chapter, but for the time being, we continue with
social network analysis.
We now turn our attention to the average distance Ri from actor i to those actors which
are reachable from actor i. This relation, which summarises an actor’s “influence range”, may
be expressed
Ri = d(nii =1
g
" , nj )/ Ji (8.10)
where Ji is the “number of actors within the influence range of actor i” (Wasserman & Faust,
1997:200).
The mean value of influence range Ri = 1.908. The actors listed below have an influence
range greater than the mean. Values for actor indegree and outdegree are also noted.
Barbican Arts Group Rn3 = 2.200 dI(n3) = 1 d
O(n3) = 3
Cable Street Studios Rn6 = 2.200 dI(n6) =1 d
O(n6) = 2
Cable Street Gallery Rn51 = 3.000 dI(n51) =1 d
O(n51) =1
L.B. Hackney Rn53 = 2.833 dI(n53) = 2 d
O(n53) = 1
L.B. Tower Hamlets Rn54 = 2.833 dI(n54) =1 d
O(n54) =1
National Artists’ Association Rn57 = 3.167 dI(n57) = 4 d
O(n57) = 1
“There Aren!t Any Networks!” 28
Table 8.1 Isolates, Transmitters, Receivers and Ordinaries for the Artists! Network

Free Form Arts Trust Rn59 = 2.167 dI(n59) = 2 d
O(n59) = 1
We note first that the three of the four actors with the highest nodal degree, SPACE (dn3 = 6),
Vision in Art (dn58 = 6) and the London Arts Board (d
n57 = 7) are absent from this list, and
this is therefore an opportune moment at which to address the question of what we mean by
“significant”.
First it is worth reiterating the point that social network analysis is the primary quantita-
tive tool in our search for an understanding of the dynamics driving the growth, or evolution of
the East End artists’ agglomeration. And in terms of social network analysis, we can argue that
an actor is “significant” for any particular mathematical definition, say nodal degree, or influ-
ence range.
Thus in terms of “influence range” the four most significant actors are the National Art-
ists’ Association, Cable Street Gallery and the boroughs of Hackney and Tower Hamlets. How-
ever in terms of nodal degree, the four “most significant” actors, that is those with the highest
nodal degree, are SPACE, Vision in Art, London Arts Board and National Artists’ Association.
We can extend the latter index by looking at the figures for actor degree centrality. The
degree centrality index CD
for a graph is a measure of the extent to which any particular actor
is more significant in terms of nodal degree than any other. The degree centrality index
CD= 0.0088 . As C
D tends to zero, so the graph becomes more regular, and is dominated less
and less by any one actor. Thus for CD
=0 the graph is completely regular, and no actor is domi-
nant, and if CD
=1, then there is one central actor with whom all other actors interact. The low
figure for our graph therefore serves to confirm the findings in the last section that the graph is
dispersed. And the four actors with the highest degree centrality index are not surprisingly also
those with the highest nodal degree: SPACE, Vision in Art, London Arts Board and National
Artists’ Association.
On the one hand then, we have an index for “influence range” which suggests that the Na-
tional Artists’ Association, Cable Street Gallery and the boroughs of Hackney and Tower Ham-
lets are the four “most significant” actors in the network. On the other hand, in terms of degree
centrality, the four “most significant” actors are SPACE, Vision in Art, London Arts Board and
National Artists’ Association (again). And we can add that the largest single provider of studio
space in the East End, Acme Housing Association, does not figure at all. Clearly, this is a con-
flict in need of a resolution.
The first step in resolving this conflict then, is to point out that historical significance is
not the same as significance in terms of a social network, particularly at an inter-organisational
level. Thus the fact that Acme is not significant in terms of inter-organisational social networks
means only that, and nothing more.
Secondly, we should remind ourselves that although we are exploring the inter-organisa-
tional social networks with a view to seeking clues as to the dynamics driving the growth of the
East End arts scene, the results of our exploration may simply suggest that we should be look-
ing elsewhere. In other words the dynamics of growth are not necessarily to be found in the way
“There Aren!t Any Networks!” 29

in which arts organisations interact with one another.
Thirdly, as we have noted before, the qualitative evidence we have to hand has an impor-
tant role to play in the interpretation of the mathematical findings. And with those thoughts in
mind, we shall return to that interpretation.
In fact, we should not be terribly nonplussed by the findings thus far. Of the seven actors
who appear as “significant” in our indices, there are two local authorities (Hackney and Tower
Hamlets), one major funding body (London Arts Board), the National Artists’ Association, one
organisation established with the specific intention of creating an artists’ network (ViA), Lon-
don’s oldest studio organisation (SPACE) and a relatively new gallery (Cable Street Gallery).
This last is the only real surprise in this group, since historically and artistically it is one of the
less significant or influential galleries in the East End, but closer inspection of the graph reveals
this to be a “statistical blip”, whereby an actor can score highly on this index by being con-
nected to relatively few actors by relatively long paths.
Of the other six, we would expect all except SPACE to pursue formal networking link-
ages as a part of their day to day activities, and indeed this is the case. SPACE also pursue inter-
organisational networking activities as a matter of policy, and it is worth adding that Vision in
Art, established with the intention of setting up a formal artists’ network for the East End, has
working relationships with the two boroughs and SPACE.
It is therefore reasonable to argue that in terms of the East End’s inter-organisational so-
cial networks, the National Artists’ Association, the boroughs of Hackney and Tower Hamlets,
SPACE, Vision in Art, and the London Arts Board are significant relative to the network as a
whole. But, and this is important, the network as a whole is dispersed and regular. If we briefly
adopt the metaphor of a landscape, then we can say that from here it appears to be pretty much
flat, with the occasional small hill. Perhaps it is time to look at it from a different vantage point.
8.6.3 Cohesive Subgroups in the Network
The inter-organisational network, as we have seen in the previous two sections, is regular and
somewhat dispersed. Thus seeking groups of actors which can be described as being in some
way more cohesive than the network as a whole might appear to be rather futile. However, we
have already covered much of the ground necessary for an understanding of this aspect of the
network, and we can pick up where we left off in the last section, with the proviso that we shall
be measuring relations in terms of each of the three different types, that is “is funded or sup-
ported by” (green); “has a working relationship with” (red) and “was nominated by” (blue).
Sub-groups in a graph can provide useful clues in attempts to understand the interactions
between sets of networks. This is particularly the case as the networks become increasingly
complicated. We shall use the concept of n-cliques (explained in Appendix Two) for n=2.
Thus, applying equation A2.1, we have:
d(i, j) ! 2 for all ni,nj "N
s (from eq.A2.1)
“There Aren!t Any Networks!” 30

There are four kinds of n-clique, each increasingly strict in its definition. Thus for n=2:
A weakly-connected 2-clique is a subgraph in which all nodes are weakly 2-connected, and
there are no additional nodes that are also weakly 2-connected to all nodes in the subgraph.
A unilaterally connected 2-clique is a subgraph in which all nodes are unilaterally 2-con-
nected, and there are no additional nodes that are also unilaterally 2-connected to all nodes in
the subgraph.
A strongly-connected 2-clique is a subgraph in which all nodes are strongly 2-connected, and
there are no additional nodes that are also strongly 2-connected to all nodes in the subgraph.
A recursively connected 2-clique is a subgraph in which all nodes are recursively 2-con-
nected, and there are no additional nodes that are also recursively 2-connected to all nodes in
the subgraph.
(Peay (1980:390-391), quoted in Wasserman & Faust, 1997:276)
We shall look at the 2-cliques for each of the three measured relations. Thus from the graph of
the inter-organisational networks for “has a working relationship with”, we can derive just one
weakly connected 2-clique:
• n1, n53, n54, n58.
Note that this 2-clique is also unilaterally, strongly and recursively connected.
For the relation “is funded or supported by” there is one weakly connected 2-clique and no uni-
laterally, strongly or recursively connected 2-cliques:
• n56, n1, n2, n4, n40, n42, n59, n60
Node n56 is the London Arts Board, and funds the remaining nodes in the network. Thus n56 is
a cutpoint, but note also that n56 is maximally central to this graph.
For the relation, “was nominated by”, there are seven weakly connected 2-cliques:
• n1, n3, n14, n53, n57
• n1, n4, n59
“There Aren!t Any Networks!” 31
• n1, n53, n57, n59
• n3, n13, n44
• n3, n14, n29, n44, n57
• n13, n44, n50
• n8, n23, n55
The paucity of 2-cliques which are not weakly connected serves to underpin the tentative con-
clusions we drew in the last section that the inter-organisational networks are not very cohesive.
Again, n58, Vision in Art surfaces as a significant actor, to the extent that it is a cutpoint in the
graph for the relation “has a working relationship with”. And it is worth reiterating the point
that ViA’s “high profile” should come as little surprise given that it is the only organisation
which has as its remit the establishment of a formal East End artists’ network. Even so, at the
time of fieldwork, ViA was not long enough established to garner any nominations in terms of
the blue relation, except from those with whom it already had a working relationship.
Overall therefore, the picture remains the same—a fragmented inter-organisational net-
work, showing few signs of cohesiveness, in which many of the actors are isolated from the
other actors.
8.7 Discussion
The original aim of carrying out social network analysis was to gain insights into the dynamics
of the East End arts scene, and insofar as we are now better informed as to what those dynamics
are, and importantly, what they are not, we have done what we set out to do.
The rub, of course, is that those dynamics are not dependent on inter-organisational net-
works, and we might add that the historical evidence which we have reviewed in the previous
four chapters suggests that they never have been. This means that as we turn our thoughts to the
search for a theoretical model of the East End arts scene we shall have to look elsewhere, and
that is precisely what we shall be doing the next chapter: but prior to that we must tie up the
loose ends in this chapter.
The historical and social contexts have been dealt with in previous chapters, and insofar
as individual artists exploited their pre-existing social networks to gather information, we can
argue that at an individual level at least, an artist’s social network was embedded in larger net-
works. No great surprise perhaps, yet it resonates with both the theories proffered by Taine,
Bourdieu, Becker and DiMaggio at the beginning of this chapter, and with the notion of self-
similarity across scales which can be found in the subject of the next chapter, complexity the-
ory. But what of the networks among studio organisations?
First, the inter-organisational networks are loose and fragmented, or even, as some infor-
mants have argued, effectively non-existent outside of the “gallery circuit”. Second, the one for-
mal networking organisation which exists, ViA, was set up as a response to this lack of formal
“There Aren!t Any Networks!” 32

networks, and is perhaps symbolic of a general “will to consolidation” which currently pervades
much of the East End arts scene, not least because of the threat posed by rising property prices.
This is an issue which will be discussed in chapter ten. Third, if we want to generate a theoreti-
cal model of the underlying historical dynamics of the East End arts scene, we should not look
to the formal inter-organisational networks for answers, because that is not where we shall find
them. And if we cannot find the answers at the level of formal inter-organisational networks, it
would seem that we have just one other place to look: we must shift our gaze back to the shift-
ing sands of the rather more arbitrary informal networks that exist amongst individuals. But
how can we be sure?
In fact the signposts are not all of the “no entry” variety: there is a small, well-hidden
signpost to where we should go next, and it comes, ironically enough, from studies of science
and not art. It is the concept of emergence. Recall from section 8.2 that Actor Network Theory
argues that “society” and “nature” are the products of the network, not the other way around.
The ANT concept of “nature” we shall put to one side, but the concept of “society” emerging
from the network is interesting and useful. In short, it conceptualises a social system as com-
prising individual agents pursuing particular ends, interacting with others to do so, and generat-
ing the emergent property called “society”. In the next chapter I shall argue much the same
point about the artists’ agglomeration in East London. It did not just happen. It evolved.
“There Aren!t Any Networks!” 33

NINE
THE EVOLUTION OF A PHENOME-
NON
In general, one may say that geographic differences are primordial, while social differentia-
tions, including those derived from urban association, are emergent: one is foundation, the
other pinnacle. Merely by examining the geographic base one cannot tell what the social emer-
gent will be; for, precisely because it is an emergent, precisely because it necessarily contains
elements from other geographic regions and other cultures and other layers of historic experi-
ence, it is a new configuration, not given in the geographic complex itself.
Lewis Mumford, 1938, The Culture of Cities
9.1 Introduction
If chapter four was where the story really opened, then this, the penultimate chapter, is where it
begins to draw to a close. We now know the story of how the East End came to have so much
empty industrial space, and we have heard, often from the protagonists themselves, how the
East End has in the last three decades become “home” to more than half of London’s artists. In
the previous chapter, we attempted, unsuccessfully, to find clues amongst the organisational
networks which might prove adequate to the task of contributing to a theoretical model. What
we actually found was that social network analysis supported the qualitative evidence that the
evolution of the East End artists’ agglomeration has very much been a “grass roots” phenome-
non: to draw on an observation of Actor Network Theory, we might argue that the phenomenon
has emerged from the networks.
Throughout the research process, an exploration of potentially useful concepts from the
natural sciences has been pursued, and it was in the course of this pursuit that James Gleick’s
1987 book Chaos was read. The ideas contained therein resonated in a small way with what ap-
peared to be happening in the “East End artists’ agglomeration”, but Mitchell Waldrop’s 1993
book Complexity resonated far more strongly, and the concepts contained in that book fitted the
The Evolution of a Phenomenon 1

findings from this project too well to be ignored, even if initially at an apparently superficial
level.
In this chapter, I hope to show that the fit of these concepts is in fact far from superficial.
Rather, I think complexity theory is a way of conceptualising the evolution of urban systems,
such as the one we are looking at, which is both intuitively appealing and which is a genuine
advance on existing theoretical approaches. And crucially, it is a conceptualisation which is in-
trinsically dynamic: it does not say about a system “this is how it is” but “this is how it changes,
and how it gets to be what it is now”. For all that, no claims are made that it is authoritative, or
even right. It is, however, persuasive.
There are four more sections in this chapter. Section 9.2 examines the few theories of the
“creative milieu”, en route briefly taking in the “innovative milieu”. Section 9.3 introduces
complexity theory, and examines the sparse literature which has attempted to analyse the social
sciences in terms of complexity theory. As we shall see, empirical work which has been carried
out in this context is limited in scope and coverage. In each of these two sections, the different
theoretical approaches are summarised in tabular form. Section 9.4 conceptualises the East End
artists’ agglomeration in terms of complexity theory and argues that it can reasonably be de-
scribed as a “complex adaptive system”. Section 9.5 summarises the chapter, and offers a sim-
ple algorithm for the evolution of the East London artists’ agglomeration by way of a
“concluding hypothesis”, before looking forward to the final chapter of the thesis.
9.2 The “Creative Milieu”: a Theoretical Overview
Our starting point is Sharon Zukin’s classic 1982 study of the gentrification of an ex-industrial
area, Loft Living, in which she analysed the conversion of Manhattan’s light industrial property
first to artists’ studios, then to increasingly expensive dwellings in the 1970s and early 1980s.
Zukin concluded that the gentrification of these areas was a potent combination of the needs of
capital and politics, both of which wanted to reclaim the city centre from light industry.
Artists, she found, “had displaced small manufacturers, distributors, jobbers and whole-
salers” before they in turn had been displaced by wealthier non-artist residents (Zukin, 1982:5).
The important point that we can draw from Zukin’s work, though, is that the decline of manu-
facturing industry was undoubtedly to the benefit of artists, whose status had changed immeas-
urably since the second World War as artists moved in from the margins of society and “art
moved into a central position in the cultural symbolism of an increasingly materialistic world”
(ibid:82). The physical infrastructure required by artists was consequently championed in the
1960s by “an upper-class group of patrons of the arts and patrician politicians, who wanted to
promote artists and protect old buildings, and a middle class group of urban homeowners—in-
cluding artists—who wanted to protect their neighbourhoods” (ibid:112). It was the success of
these two constituencies, argues Zukin, which paved the way for the property developers. As
we have already seen, this is not a model which fits the East End as a whole: the case of Spital-
The Evolution of a Phenomenon 2

fields Market is probably the closest which London has to Manhattan’s SoHo experience de-
scribed in Loft Living.
We can find an alternative starting point in our search for a theory though. It is a phe-
nomenon which was explored by Castells and Hall, who sought to draw general lessons from
the high-technology industrial concentrations typified by Silicon Valley (Castells & Hall,
1994:225), and by Saxenian (1994), who endeavoured to compare the high technology indus-
trial concentrations in Silicon Valley and Boston. Castells and Hall called this the “innovative
milieu, …a place where synergy operates effectively to generate constant innovation, on the ba-
sis of a social organisation specific to the production complex located in that place”. However,
although Castells and Hall were looking at technology-led regeneration, rather than “culture-
led” regeneration, some of their conclusions are of relevance to the East End, not least because
they looked beyond the institutions themselves to the broader context within which they were
operating. First, and importantly, they found no general formula by which successful techno-
poles could be contrived. Second, argued Castells and Hall, social networks are an essential
“element in the generation of technological innovation, and the backbone of social organisation
of any innovative milieu” (ibid:234). Third, “technopoles are not built in a day” (ibid:236).
Note that all three of these observations fit the East End comfortably. The agglomeration was
not contrived, it relied to a considerable extent on informal social contacts, and it evolved over
three decades. But what of those who have looked at creatively innovative milieux, rather than
technologically innovative milieux?
Our first stop is again Peter Hall, clearly intrigued by these sorts of places. In his intro-
duction to Cities in Civilization (1998) he asks why cities have “Golden Ages”, brief epochs,
perhaps lasting a few decades at most, when a city’s cultural and intellectual life blossoms to
give it a world wide influence, and legacies which may last for centuries. Hall’s first finding is a
frustrating one: creativity itself tends to be dealt with “almost exclusively in terms of the indi-
vidual personality” (Hall, 1998:10). Few studies, it seems, probe the social context of creativity.
The three major 20th century attempts to conceptualise society’s condition—Marxist The-
ory, Modernity and Post-Modernity—fail to provide concrete answers. For Marxists, modernity
was merely the “cultural expression of capitalism”, while for Theodor Adorno, it was “a state of
mind, characterised by a restless desire for novelty… [whose] quintessence was the cinema…
[which] made any form of contemplation impossible” (ibid). Post-modernity too proves inade-
quate to the task of setting out precisely why an area should become a creative milieu, not least
because it is “infuriatingly aspatial” (Hall, 1998:14). (section removed in final version)
Hall argues that art and culture “flourish in a special kind of city: one at the economic
forefront, that consequently draws in talents, that is prepared to try new kinds of social relation-
ships and new intellectual concepts”. Creative cities, in Hall’s view, are not comfortable places,
but places of “great social and intellectual turbulence… a place where outsiders can enter and
feel the state of ambiguity: they must neither be excluded from opportunity, neither must they
be so warmly embraced that the creative drive is lost… Conservative, stable societies will not
prove creative; but neither will societies in which all order, all points of reference, have disap-
The Evolution of a Phenomenon 3

peared” (ibid:286). Here perhaps, in Hall’s implicit reference to a certain amount of disorder in
the system, is the first sign that complexity theory might have something to contribute to our
understanding of such phenomena.
But there is another theory, predating Hall’s work, which seems particularly appropriate
to the East End. Gunnar Törnqvist, in his paper Creativity and the Renewal of Regional Life, fo-
cused on whether there might be “certain common denominators discernible among such places
as have witnessed a flurry of creative activity in the past” (Törnqvist, 1983:91).
The problem for Törnqvist is that there are few studies of creative milieux, and those few
that do exist tend to be historical studies; perhaps unsurprising, since it is often posterity which
decides whether or not a particular area was unusually creative at a particular time (ibid:93).
The questions then are the nature of the circumstances which result in a creative milieu, and
whether or not they can be planned (ibid).
Törnqvist found his answers through studies of sites, both planned and unplanned, such as
Silicon Valley and Sophia Antipolis. He also drew on literature from geography, business eco-
nomics and information research, using his findings as the foundations for his hypotheses (ibid).
He found that despite the proliferation of telecommunications, there was still a strong need for
personal interaction and face-to-face meetings, not least because telecommunications tended to
be used for routine information, whereas strategic communications, negotiations, reconnais-
sance and planning demand personal contact (ibid:95). And personal contact, of course, requires
“simultaneity in time and space” (ibid:97).
So Törnqvist suggested that creativity could be seen as a kind of synergy, and argued that
a creative milieu requires four basic preconditions, which he lists hierarchically. The first, and
most basic, is information, “synonymous with elucidation and intelligence, transmitted directly
between people, or by way of different media” (ibid). Second, knowledge, the storage of infor-
mation, either in people or by other means. This is the process by which “new information is
linked with previous experience” (ibid). Third, competence, which supposes the ability to em-
ploy relevant knowledge—which itself “presupposes a link with an environment”—in pursuit of
a particular aim or purpose (ibid). The notion of linkages, as we saw in the last chapter, is an
important one, and it is worth recalling that the significant linkages turned out to be those which
happened at an individual rather than an organisational level. The competence described is then
broken down into sub-categories: “instrument-specific”, “sector-specific” and “region-specific”
(ibid:98). The first implies a link between a person and the tools of their trade, the second an
understanding of a particular line of trade, while the third “implies a connection with the re-
sources of certain localities and regions…” (ibid). Interestingly, Törnqvist finds that “the best
examples are not supplied by mass-producing large-scale industry but by crafts and small indus-
tries, where the professional skills of good craftsmen play an important part” (ibid:99).
Törnqvist adds that “it is likely that the quality—or, rather, the originality—of the competencies
existing in a milieu is more important than the quantity” (ibid:103).
In light of this observation, it comes as little surprise that the fourth, final and most impor-
tant precondition is creativity. Founded on the three previous preconditions, creativity “requires
The Evolution of a Phenomenon 4

a capacity for sifting information and combining knowledge and pieces of information in such a
way that something new is created” (ibid). This, for Törnqvist, is the root of a creative milieu’s
synergy, since although much of the process of creating something new takes place within the
individual, people look to their surroundings to trigger thought and ideas, and to stimulate the
imagination (ibid:100). And surroundings comprise both objects and, importantly, people.
Andersson (1997) notes that “very few systematic studies of macro-social conditions of
creativity do exist”, and although he makes no reference to Törnqvist’s 1983 study, he reports
findings substantially similar to Törnqvist’s in a 1985 study of his own (Andersson, 1985). His
study does not add anything new to Törnqvist’s findings, but does serve to confirm them.
Hippolyte Taine, a lecturer at the École des Beaux Arts in Paris in the 19th century, de-
voted three chapters of his gargantuan Philosophy of Art to the “milieu” (Taine, 1865). Taine,
influenced perhaps by Charles Darwin’s recent notion of Natural Selection (The Origin of Spe-
cies had been published six years earlier) sets out by drawing an analogy with circumstances
necessary for an orange tree to grow: it is not just the seed that is needed, but the right circum-
stances too; good soil, favourable weather conditions and so forth. This is the case for any spe-
cies: certain species will flourish in certain conditions, while others may perish (ibid:82–84).
Taine’s point is that it is the same for people: “in general we may conceive moral tem-
perature as making a selection among different species of talent, allowing this or that species to
develope itself, to the exclusion more or less complete of others” (ibid:86, original emphasis
and spelling). This moral temperature comprises the broad “social and intellectual influences of
a community” (ibid:85).
Strictly, it is not the moral temperature which creates the artists, but certain artists who,
already present, flourish in the moral temperature which allows certain kinds of talent to de-
velop. This is a point which remains implicit in Törnqvist’s theory, and Hall’s “social and intel-
lectual turbulence” is perhaps an integral part of the moral temperature to which Taine refers.
Garnsey (1998) has attempted to combine complexity theory with a systems analysis ap-
proach in an effort to elaborate on the evolutionary dynamics of high-technology industrial mi-
lieux. She argues that such milieux are aperiodic and unpredictable, since being sensitive to ini-
tial conditions, they are prone to both internal and external perturbations. Her point is that this
is not a problem: it is to be expected (Garnsey, 1998:372). Allen has noted that there is a need
to explore spatial systems from an evolutionary standpoint (Allen, 1997), and in earlier work ar-
gues that in the face of atypical disruptions to a social system there exists “an ‘evolutionary
drive’ that selects for populations with the ability to learn, rather than for populations with opti-
mal behaviour” (Allen, 1993:101, emphasis in original).
What, then, can we draw by way of general conclusions from these various theoretical
strands? Overwhelmingly, as we see in table 9.1 overleaf, these theories argue that such places
share certain characteristics. They are disordered, unstable, unpredictable and aperiodic. Heav-
ily reliant on social networks, synergy and personal interaction, they tend to exhibit evolution-
ary behaviour. The ability to learn is essential. Crucially, these theoretical models are relevant
to the East End. The East End satisfies Törnqvist’s four preconditions, and it is somewhat disor-
The Evolution of a Phenomenon 5

dered, as Hall predicts such an area might be. It has demonstrably been able to acquire and use
knowledge. Hippolyte Taine argued over a century-and-a-half ago for the notion of a “moral
temperature” that allows certain artists to blossom, and we can extend this to the more general
notion that particular ideas will flourish in particular circumstances: we have indeed seen that
the East End artists’ agglomeration needed the fluid context of industrial collapse to prosper.
Garnsey argues that such a system is of its nature unpredictable. And chaos and complexity the-
ory deal precisely with such apparently disordered, unpredictable systems.
9.3 About Complexity Theory
9.3.1 Life at the Edge of Chaos
The Evolution of a Phenomenon 6
Table 9.1 THEORIES OF !CREATIVE MILIEUX"
Author/year Topic
Taine/1865 The !Creative Milieu"
Törnqvist/1983 The !Creative Milieu"
Andersson/1985 The !Creative Milieu"
Zukin/1988 Gentrification in New York
Castells & Hall/1994 The !Innovative Milieu"
Saxenian 1994 The !innovative Milieu" at
Silicon Valley & Route 128
Hall/1998 Cities" !Golden Ages"
Garnsey/1998 High-technology milieux
Thesis
A place has a !moral temperature" in which cer-
tain types of art and artist will flourish, and oth-
ers will not.
Creative milieu rely on social networks, and
have four basic preconditions: information,
knowledge, competence, creativity.
Notes that few studies of creative milieux exist.
Confirms Törnqvist"s findings in his own work.
Gentrification in SoHo was a result of a combi-
nation of the needs of capital and politics.
Innovative milieux cannot easily be contrived.
The successful ones, eg Silicon Valley, have
grown organically, and were heavily reliant on
social networks.
Adaptiveness is important to the survival of
!industrial systems". !Spatial clustering alone
does not create mutually beneficial interdepend-
encies".
Creative cities are often turbulent, uncomfort-
able places, in which outsiders are neither ex-
cluded nor warmly embraced.
Combines complexity theory & systems analy-
sis, and argues that HT milieux are unpredict-
able and aperiodic.

This is where we put the artistic networks of the East End, and indeed social science, to one side
and make a foray into the territory of the natural sciences, wherein we shall explore theories
which have developed through the study of physics, hydrodynamics, computing, artificial intel-
ligence and, importantly, evolutionary biology. As we have seen above, current theoretical
models are limited in number and, pace Hall and Törnqvist, do not adequately deal with the in-
ternal dynamics of the processes with which we are dealing. And as we saw in the last chapter,
social network analysis is simply too static to be much use in that respect.
In this section then, I want to introduce Complexity Theory, a theoretical approach which
is hardly mature in the field of natural science, and which has barely reached infancy as far as
the social sciences are concerned.
9.3.2 A Brief Introduction to Complexity Theory
The science of Complexity has emerged in the last ten years from the shadow of the science of
Deterministic Chaos, popularised in Gleick’s (1988) book of the same name. Chaos Theory and
Complexity Theory, however are not the same, but they share some theoretical common
ground. Chaos Theory is perhaps best known through the colourful graphic representations of
complicated mathematical formulae known as fractals, but these are only a small part of the the-
ory. In essence, chaos theory argues that in certain systems which appear to behave in a disor-
dered and random fashion—a turbulent river for example—there exists an underlying order and
stability. It is important to note that such a system, although termed ‘chaotic’, is not truly cha-
otic, but deterministically chaotic—the behaviour will remain within more-or-less fixed
boundaries, even if it is unpredictable within those boundaries. And it is the behaviour within
those boundaries which is of interest (Bird, 1997:144). Thus in the turbulent river, there exist
whirlpools and vortices which appear to remain steady and fixed in an otherwise chaotic envi-
ronment. Weather systems seem to be both ordered but at the same time unpredictable. When a
tap is opened to allow only a gentle flow of water, that flow is smooth and constant. If the tap is
opened further, the flow becomes turbulent. The first is an ordered state, which can be ex-
pressed in relatively simple linear equations which, plotted onto a graph, will produce a straight
line. The second is a chaotic state, and can only be expressed in terms of complicated, non-lin-
ear equations, which, if plotted on a graph, will generate a curve rather than a straight line. Such
chaotic systems are called, strictly, non-linear dynamic systems.
The transition from the ordered state to the chaotic state is relatively sudden, not gradual,
with a clear demarcation between the two states. This change from one state to another is
known as a bifurcation, and may be triggered by a small change in the initial state of the sys-
tem, a condition known as sensitivity to initial conditions, or the “Butterfly Effect”, so-called
because a butterfly flapping its wings on one side of the world may eventually change the
weather systems on the other side.
Thus, for a given system which is self-organised, such as a weather system, there is an
equilibrium position which depends on a variety of parameters. Suppose that one of these is a
The Evolution of a Phenomenon 7

control parameter. A small change in this control parameter may mean that the system is pushed
farther and farther from equilibrium, and so stability decreases until the bifurcation point is
reached. The system then has two “choices” of state, of which either one or both could be stable
(Prigogine & Stengers, 1984:160). If we then push each of these two systems to their respective
bifurcation points, we induce further bifurcations, and we now have four “choices”. If we repeat
this process, we can eventually push the system into the chaotic state (ibid:167).
This boundary is analogous to a phase-transition in physics. Water in its liquid state, for
example, is characterised by the fact that all of its molecules are moving about randomly and
chaotically—as a medium it is unstable. However, when it is frozen, the molecules become sta-
tionary to form a stable medium, ice. The point at which water turns to ice—the point of phase-
transition—combines these two properties of order and chaos. The medium is part solid, part
liquid, not completely stable, not completely chaotic. It is on this boundary between order and
chaos that the sciences of Complexity, which aim to gain an understanding of the underlying
patterns and regularities of a wide variety of real-world phenomena such as economies, the de-
velopment of societies, or genetic behaviour, have concentrated (Holland, 1995:4).
Such phenomena may be grouped under the general heading of complex adaptive systems,
and for Holland, the conferring of a generic term upon such systems suggests that they are gov-
erned by general principles (ibid). Like the chaotic systems we described above, complex adap-
tive systems exhibit nonlinearity and sensitive dependence on initial conditions, and this means
that generating predictive theories for such systems is problematic—we can no longer simply
extrapolate current trends to generate predictions. Holland argues that we should therefore
“make cross-disciplinary comparisons of complex adaptive systems in hopes of extracting com-
mon characteristics” (ibid:6). Holland suggests that there are “seven basics”—“four properties
and three mechanisms which are common to all cas [complex adaptive systems]” (ibid:10). The
four properties are aggregation, whereby a system can be broken down in to different catego-
ries to render it more comprehensible, a process which Byrne (1998) refers to as “nesting”; non-
linearity, described above; flows, which may be flows of goods or knowledge, and may be con-
ceptualised in terms of nodes and linkages, a notion familiar from social network analysis; fi-
nally, diversity, for example diversity of species within an ecosystem, or types of wholesalers
and retailers in an urban economy. The point is that “diversity is neither accidental nor random”
(Holland, 1995:27). Rather, it is dependent upon its context, and that context can be thought of
as a collection of niches, each of which is suited to a particular type of agent. If for any reason
that agent ceases to exist, leaving the niche empty, the system will generate adaptations which
will result in a new agent filling that niche. We can expect a similar response when a new niche
emerges (ibid:28).
The three mechanisms are first tagging, which expedites the formation of aggregates by
enabling agents to select, or ignore, other agents which may prove beneficial to them, thus fa-
cilitating the continuing survival of the system; second internal models, which are generated in-
ternally by complex adaptive systems and enable the anticipation of consequences which may
arise from changes in structure or context (ibid:31–33); third building blocks, which also con-
The Evolution of a Phenomenon 8

tribute to the generation of internal models by offering a limited number of components—the
building blocks—from which a large number of models can be be constructed.
Holland’s “seven basics” will provide us with a useful set of tools when we develop a
theoretical model of the evolution of the East End artists’ agglomeration. Their usefulness in
this project however, pace Holland, is as a purely conceptual tool rather than as “building
blocks” for the computer-based and mathematically oriented models around which his book is
centred. In fact, the last of the “seven basics”—building blocks—might be interpreted as reduc-
tionist, but when we discuss complex adaptive systems we must still look at the individual com-
ponents and the interactions between them, even if we accept that a holistic view is also neces-
sary for a more complete understanding of such systems.
Gell-Mann (1994:19) notes that complex adaptive systems “have a tendency to generate
other such systems. For example, biological evolution may lead to an ‘instinctive’ solution to a
problem faced by an organism, but it may also produce enough intelligence for an organism to
solve a similar problem by learning”. Gell-Mann’s graphical conceptualisation of a complex
adaptive system is reproduced below.
This is useful in helping us to understand and locate Holland’s “seven basics” within the
The Evolution of a Phenomenon 9
Selective effect on viability of schema and on compe-tition among schemata
Previous data,including behaviour and its effects
Consequences(real world)
Description, prediction, behaviour(real world)
Present data
Schema that summarises and is capable of predicting(one of many competing variants)
Unfolding
Identification of regularities and compression
Figure 9.1 How a complex adaptive system works (Gell-Mann, 1994:19)

notion of a complex adaptive system. Holland’s aggregation, tagging, internal models, flows
and building blocks have their analogues in Gell-Mann’s description, prediction, behaviour.
Holland’s nonlinearity is reflected in the notions of present data, unfolding, and in the curved
positive feedback arrow, while diversity is reflected in Gell-Mann’s notion of schema and com-
peting variants.
But if complex adaptive systems have certain general properties, are there places, or con-
texts in which we are more likely to find them? We noted above that the change from a stable
system to a chaotic system is marked by a sudden change of state, a phase transition, and that it
is on this point that those studying complexity have focused.
In fact the notion of complexity in a system occurring at what is analogous to a phase-
transition in matter has been explored by two American scientists working independently of one
another, Stephen Wolfram and Chris Langton. Wolfram and Langton both made extensive use
of computer simulations in their explorations of artificial life to extend this concept. Wolfram’s
findings through his studies of cellular automata—simple forms of artificial life generated
within a computer—led him to argue that there are four “Universality Classes” which can be
applied to complex systems (Waldrop, 1992:225).
I. Doomsday [sic] rules—a very stable system in which everything would die out within one
or two generations;
II. the initial pattern of living and dead cells coalesces into a “set of static blobs and perhaps a
few other blobs that would sit… periodically oscillating… [giving] a general impression of
frozen stagnation and death” (ibid);
III. the cells would flicker and change chaotically, never settling down;
IV. the cells never settled completely, but would grow, split apart and propagate.
Chris Langton, who had reached similar conclusions to Wolfram, argued that Class IV was a
point of phase transition, a state in which the basic parameters governing the evolutionary be-
haviour of the cellular automata could provide “enough stability to store information and
enough fluidity to send signals over arbitrary distances” (ibid:232). Langton called the phase
transition, “complexity” or “the edge of Chaos”. The argument can be summarised thus
(ibid:228):
Wolfram’s Universality Classes:
I > II > ‘IV’ > III
Order > “Complexity” > Chaos
The concepts introduced above will help us in the development of a theoretical model of the
East End artists’ agglomeration, so we shall summarise briefly before moving on. Complex sys-
tems, be they economies, collections of cells working together as an organism, nation states
sharing political alliances, or networks of professionals working towards a common end, all
The Evolution of a Phenomenon 10

share certain characteristics.
They all consist of independent agents interacting with one another in a variety of differ-
ent ways, such that the “very richness of these interactions allows the system as a whole to un-
dergo spontaneous self-organisation” (Waldrop, 1992:11). So “people trying to satisfy their
material needs unconsciously organise themselves into an economy though myriad individual
acts of buying and selling. …flying birds adapt to the actions of their neighbours, unconsciously
organising themselves into a flock” (ibid). The networks consist of “agents” acting in parallel,
but the control of these networks is highly dispersed, and the networks exhibit many levels of
organisation (Holland, 1995:12).
These complex systems, capable of self-organisation themselves, are also adaptive, that is
capable of adjusting to their surroundings to their own benefit, rather than responding passively
with no “thought” for themselves. They can constantly revise and rearrange their building
blocks through experience, and they can anticipate the future (ibid:36). The marketplace, for ex-
ample, “responds to changing tastes and lifestyles” (Waldrop, 1993:145). And these building
blocks—coherent, self reinforcing clusters—can form new building blocks for subsequent evo-
lutionary stages of the system (Holland, 1995:36). They have many niches, which are waiting to
be filled by an “agent”, while new niches open up, creating new opportunities. These complex
systems are thus dynamic, ever-changing, unpredictable, but they appear nonetheless to possess
an underlying sense of order (Gell-Mann, 1994:20).
Kauffman (1995)—like Gell-Mann a member of the Santa Fe Institute—argues that evo-
lution tends to drive successful systems to this boundary between order and chaos, where the
balance between stability and fluidity allows for the development of life.
Kauffman adopts the concept of adaptive topography, originally conceived in the 1930s
by Fisher and developed in Wright’s theory of adaptive topography (Ridley, 1996:215).
Fisher’s model (overleaf) argues that there exists a relation between a character and its fitness,
such that at the peak the organism is the best adapted of any similar forms. Mutations, which
occur randomly, are as likely to go “up” as to go “down” the fitness peak, but as we can see
from the diagram, a large mutation is likely to miss it all together. Thus smaller mutations are
likely to be “selectively advantageous”: most evolutionary change is through small mutations
(ibid).
Wright argued that adaptive topographies would themselves shift as competing species
moved about upon them, changing the fitness topography for those other species as well (ibid).
Kauffman (1995) also argues for the notion of co-evolution within a “fitness landscape”, with
peaks and troughs. Thus species adapt to each other’s adaptations—a frog might develop a
longer tongue to catch flies, while the fly evolves a more efficient escape mechanism to avoid
the frog, which in turn develops a faster tongue (Waldrop, 1993:310). And so the process con-
tinues. As each species evolves, it changes not only its own fitness landscape (climbs toward a
peak), and but also that of other species (which descend into a trough). In Waldrop’s (1993)
book Complexity, Kauffman articulates this idea more clearly in interview with Waldrop than
he does in his own At Home in the Universe (Kauffman, 1995), so we shall break with accepted
The Evolution of a Phenomenon 11

academic practice, and cite Kauffman as cited in Waldrop (1993). Thus:
“If we’re deep in the ordered regime, then everybody is at a peak of fitness and we’re all mu-
tually consistent—but these are lousy peaks...
‘Conversely, if we’re deep in the chaotic regime, then every time I change I screw you
up, and vice versa. We never get to the peaks, because you keep kicking me off and I keep
kicking you off, and it’s like Sisyphus trying to roll the rock uphill. Therefore, my overall
fitness tends to be pretty low, and so does yours”. [Waldrop continues] In organizational
terms, it’s as if the lines of command in a firm are so screwed up that nobody has the
slightest idea what they’re supposed to do—and half the time they are working at cross-pur-
poses anyway. Either way, it obviously pays for individual agents to tighten up their cou-
plings a bit, so that they can begin to adapt to what other agents are doing. The chaotic
system will become a little more stable, says Kauffman, the aggregate fitness will go up,
and once again, the ecosystem as a whole will move a bit closer to the edge of chaos.
Somewhere in between the ordered and chaotic regimes, of course, the aggregate fitness
has to reach a maximum. …It turns out that the maximum fitness is occurring right at the
phase transition. So the crux is, as if by an invisible hand, all the players change their land-
scape, each to its own advantage, and the whole system co-evolves to the edge of chaos.
(Waldrop, 1993:313, passages in quotation marks from Waldrop’s interview with Stuart
The Evolution of a Phenomenon 12
Fitness
Character (x)
Large Mutation
Small Mutation
Figure 9.2 A general model of adaptation. For some trait (x), the fitness of an individual has an optimum at a certain value of x, and declines away from that point, creating a hill of fitness value. A mutation that changes the value of x also changes its bearer!s fitness. (Graph and caption from Ridley, 1996:182)

Kauffman).
Clearly, the species in such an evolutionary mechanism must be robust enough to withstand
changes which may not be for the better, and which come at random. So the genetic structure of
an organism must not be so “compressed”—that is efficiently assembled, with the minimum of
redundant information in the genome—that the slightest change will stop it from functioning
(Kauffman, 1995:151–153). Kauffman adopts the analogy of the computer program, which gets
progressively more fragile and brittle as the code, which of course ultimately comprises 1s and
0s, contains less and less redundant information. Thus if a program needs 1000 digits to work,
but actually contains a million digits, removing one digit may not make much different to its
functioning—the program has a high level of redundancy, but is highly resilient, and therefore
amenable to change. The same program with no redundancy needs all of its digits intact—one
change will bring the program down (ibid). Organisms which have evolved do in fact show
high levels of redundancy within the genome, and Kauffman argues persuasively that systems
which have evolved necessarily contain high levels of redundancy in order to survive.
In jumping across the gap between the natural sciences and the social sciences, we have
acquired a collection of useful tools with which we shall shape our conceptualisation of the evo-
lution of the East End artists’ agglomeration (table 9.2). However, there are bridges between
complexity theory and the social sciences, and it is perhaps time to explore them.
9.3.3 Complexity Theory and the Social Sciences
What then, can the concepts behind chaotic and complex systems tell us about the artistic net-
works in the East End? First of all, it is worth making the point that these concepts are of lim-
ited use at a strictly quantitative level. The social sciences are notoriously intractable in terms of
predictive and mathematical modelling, largely by dint of the fact that they are inherently non-
linear, and therefore intrinsically unpredictable (Kiel & Elliott, 1996:2), and Ruelle argues that
although chaos theory has often been successfully applied, there are also many situations where
it has not (Ruelle, 1997). Admittedly, this is in strictly mathematical terms. Ruelle’s diagram,
reproduced overleaf, “indicates the position of dynamical systems pertaining to various areas of
science with respect to uncertainty in the basic equations and complication of the dynamics.
The Evolution of a Phenomenon 13
Author Approach Focus Relevant Key Concept
Wolfram Taxonomic Cellular Automata Universality Classes
Langton Taxonomic Cellular Automata Classes !Edge of Chaos"
Gell-Mann Dynamic Complex Adaptive Systems Feedback Loop
Arthur Dynamics Economic Systems Increasing Returns
Prigogine & Stengers Self-organised Systems Bifurcation Bifurcation
Bak Dynamic Complex Adaptive Systems Self-organised criticality
Kauffman Dynamic/Modelling Evolutionary Behaviour Fitness Landscapes
Holland Modelling Complex Adaptive Systems Seven !Building Blocks"
Table 9.2 APPROACHES TO THE STUDY OF COMPLEX ADAPTIVE SYSTEMS

Only below the uppermost curved line may we say that we have a satisfactory understanding of
the dynamics, and useful applications of the ideas of chaos” (ibid). What the diagram makes
clear is that the social sciences—and that is where this study lies—are too complicated to be un-
derstood or explained through mathematics alone. Paradoxically perhaps, neoclassical econom-
ics has relied heavily on mathematical modelling, but the acceptance in the early 1980s that
“year after year economic theorists continue to produce scores of mathematical models…
…without being able to advance, in any perceptible way, a systematic understanding of the
structure and the operations of a real economic system” (Leontief, 1982, quoted in Hodgson,
1993:5) combined with increasing interest in non-linear dynamical systems and economics’s
mathematical tradition to make it the first social science to be explored in terms of both evolu-
tionary theory and complexity theory. Hodgson (1993) put evolutionary economics in an his-
torical context, and edited collections such as Nonlinear Dynamics and Evolutionary Econom-
ics (Day & Chen, 1993) attempted to develop the mathematical modelling of such systems.
Social network analysis aside, there is no substantive mathematical modelling in this pro-
ject, but this does not preclude the use of the concepts of chaos and complexity as effective
tools in the understanding of social systems such as the East End artists’ agglomeration, even if
we cannot explain them through formal mathematical language. In fact the title for this section
is stolen from David Byrne’s 1998 book of the same name. Of the few texts—actually
three—which deal directly with the application of chaos and complexity theory to the social sci-
ences (as opposed to economics), Byrne’s is at the time of writing the most complete explora-
tion of the topic, albeit from a strongly epistemological point of view. And although the main
The Evolution of a Phenomenon 14
FinanceEconomicsSocial Sciences
Biology
ClimateChemical kinetics
Astronomy of the Solar System
Hydrodynamic Turbulence
Complication of the System
Uncertainty of Basic Equations
Applied Sciences Meteorology
Figure 9.3 Ruelle!s Limits of Predictability (Ruelle, 1997)

focus of this project is empirical rather than epistemological there are still useful lessons to be
learned here. Byrne is less willing than Ruelle to accept that the inherent unpredictability of so-
cial systems limits the usefulness of complexity theory in the social sciences. Rather, he argues
that there are two approaches, the weak and the strong. The weak approach is primarily
taxonomic—our understanding of social systems is enhanced by knowing that they are chaotic,
but we not necessarily in a position to predict outcomes (Byrne, 1998:41). The strong position,
by contrast, is more optimistic in its outlook. Thus we know that a system will reach a bifur-
cation point, and that there are axiomatically two possible outcomes, one of which is better than
the other. We may, argues Byrne, be able to nudge the system towards the better of the two
(ibid). An example of “exploiting” the chaotic nature of a system was given by Ian Stewart in
New Scientist magazine (Stewart, 1999), and although it is to do with spaceships rather than so-
cial systems, it makes its point well. The story goes like this.
About ten years ago, a group of NASA engineers decided that they wanted to recycle one
of their satellites which was drifting aimlessly in space. Its fuel supply was far too low to propel
it the millions of kilometres into the desired new orbit, which would enable it to gather informa-
tion about a comet which was flying into the inner solar system. However, the NASA engineers
saw that by exploiting the Butterfly Effect they could still use the spacecraft. It was simply a
case of getting the butterfly to make the right flap at the right time, to get the response they de-
sired from the satellite. They chose to exploit the gravitational pull of three objects in space, the
satellite itself, the earth and the moon, to set the spacecraft on a chaotic orbit. Such an orbit is
fundamentally unpredictable, but there are neutral points in the orbit, where no one body has a
greater gravitational influence on the spacecraft than the others. Here, a slight nudge in the form
of a short, carefully calculated blast from the depleted fuel stocks will have a big effect, ena-
bling the space craft to be flown repeatedly past the desired observation point, at which time
data could be collected. Thus was the theory that comets are large dirty snowballs confirmed,
with a satellite that should by rights have been out to pasture.
The point here of course is that we are not helpless in the face of chaotic or complex
adaptive systems, but we do need to treat them differently. Harvey and Reed (1996) are also
concerned with limits of predictability, and they argue that there are different levels of ontologi-
cal complexity in social systems, and that appropriate strategies for modelling particular social
systems must therefore be adopted (Harvey & Reed, 1996:307). Their point is that predictability
is not a property that a system either does or does not have, but is a property which a system
possesses to a limited and effectively finite extent.
Reed and Harvey, who adopt as their theoretical foundation Bhaskar’s notion of scientific
realism, a position endorsed and adopted by Byrne (1998), argue that social systems are a sub-
set of dissipative systems, a concept which has its origins in thermodynamics (Reed & Harvey,
1996:302). Dissipative systems are natural systems characterised by the fact that they exhibit
negative entropy as well as positive entropy. In other words they can dissipate positive entropy
to their environment, and channel their negative entropy into the development over time of an
increasingly complex internal structure (ibid). In short, they can evolve. A “dissipative social
The Evolution of a Phenomenon 15

system” then is:
an inherently historical entity whose evolution is driven as much by internal instability as
by external perturbation. Moreover, the grounding of dissipative social systems in nature
and in the dynamics of deterministic chaos demands a materialist interpretation of dissipa-
tive social systems not unlike that developed by critical Marxism.
Despite their commonalities, however, there are important differences separating dissi-
pative social systems from their physically constituted counterparts. Most of these differ-
ences hinge on the fact that societies and their institutional activities are constructed by the
collective action of human beings, and, thus, are profoundly influenced by the way in which
humans subjectively define themselves and their actions. This fundamental difference has al-
ready been expressed in Bhaskar’s critical naturalist paradigm, for when he describes society
and its functions he underscores the ‘wild card’ nature of human beings and their innovative
abilities. This same exceptionality has long been recognized in dissipative systems theory,
and can be neatly inserted into the paradigm advocated by Prigogine and the Brussels School
(Reed & Harvey, 1996:306).
As we have seen in the previous section, Holland (1995), Kauffman (1995), and Gell-Mann
(1994) would all recognise in a “dissipative social system” what they define as a complex adap-
tive system, and this does of course allow for human agency. This disparity in terminology may
simply be a function of the vagaries of getting a book published, for although Kiel and Elliott’s
collection, in which Reed and Harvey are published, has a publication date of 1996, none of the
sources mentioned above is referred to in it. We shall therefore stay with the more common
term of complex adaptive system in this project, and briefly turn our attention to the ways in
which chaos and complexity theory have been used in social science.
Initial attempts to apply chaos theory to social systems, such as those described in Kiel
and Elliott (1996) were of a taxonomical nature (table 9.3 overleaf). Thus Richards
(1996:89–116) argued that the “aggregation of individual preferences into group choices” is
chaotic, while Brown (1996:119–137) seeks to demonstrate that the political process is itself
nonlinear. Berry and Kim (1996: 215–236) analyse economic “long waves” from the late 18th
to the late 20th centuries, and find that such “long waves” are constrained by limit cycles. Den-
drinos (1996:237–269) argues that cities can be viewed as “spatial chaotic attractors”. In other
words, many social systems can be described as chaotic, although modelling them mathemati-
cally proves quite problematic, as Ruelle, ironically perhaps, predicts it will be.
Attempts to apply complexity theory to social systems are less limited in scope. Thus Al-
isch et al (1997) modelled the dynamics of children’s friendships making extensive use of
mathematical tools. Dissatisfied with existing models, which they saw as too static, they argued
that “the process of friendship can be modelled as a change in commitment and described by a
vector with three components: intensity1 [sic], exclusivity, and intensiveness” (Alisch et al, 1 The word “intensity” may well be a typographic error. Subsequent text refers not to “intensity” but
“intimacy”. The reader is referred to the original text for an in-depth mathematical description.
The Evolution of a Phenomenon 16

1997:174). Horsfall and Maret (1997:182–196) measured the changes in the domestic division
of labour from 1974 to 1978 and argue that “chaos and complexity theories provide a larger and
more fruitful framework for analyzing the domestic division of labor than the current change-
limited methodologies and theories” (ibid:196). Dooley et al (1997:243–268) studied the rates
for adolescent childbearing Texas from 1964 to 1990 and their conclusions regarding chaos the-
ory are equivocal to say the least—their data may be chaotic, the system may be sensitive to ini-
tial conditions, the fractal dimension of the data may change over time (Dooley et al, 1997:265).
Here then, we find no analogues for the evolution of a social system in an urban context, al-
though we do at least find a general acceptance of the assertion that complexity theory is better
able to deal with the dynamics of such systems.
There has been more focused study of the evolution of the urban context itself, that is of
the physical form of the city, and how it changes over time (Batty and Longley,1994). Xie and
Batty (1997) and Batty & Xie (1999; 1996) argue with the use of empirical data that the physi-
cal form of cities, and the way in which that form has evolved, may be described using concepts
of fractal dimension (Batty & Xie, 1996), cellular automata (Xie & Batty, 1997), and most re-
cently self-organised criticality (Batty & Xie, 1999). Examples of both cellular automata and
Batty and Longley’s simulations may be found in the figures overleaf. These models however,
do not address the evolutionary nature of the social systems which exist within that urban form,
and this is clearly a gap in the work that attempts to apply complexity theory to the social sci-
ences. The next section is an attempt to fill that gap.
9.4 The Evolution of a Phenomenon
9.4.1 Introduction
We saw above in arguments from Ruelle (1997) and Reed and Harvey (1996) that social sys-
tems lie somewhat beyond the possibilities of predictive mathematical modelling. Here, I shall
The Evolution of a Phenomenon 17
Table 9.3 CHAOS & COMPLEXITY THEORY IN THE SOCIAL SCIENCES
Author/year Approach Focus
Hodgson/1993 Discursive/historical Evolutionary Theory & Economics
Day & Chen/1994 Mathematical Non-linear dynamics & evolutionary economics
Batty & Longley/1994 Taxonomic Fractal Nature of Cites
Batty & Xie/1996 Taxonomic Fractal Dimension of Cities
Harvey & Reed/1996 Ontological Limits of Predictability
Reed & Harvey/1996 Taxonomic Dissipative Systems
Kiel & Elliott/1996 Taxonomic Chaos in Social Systems
Xie & Batty/1997 Taxonomic Modelling Urban Growth with CA
Ruelle/1997 Taxonomic Limits of Predictability
Eve, Horsfall& Lee/1998 Taxonomic Complexity in Social Systems
Byrne/1998 Epistemological Complexity and Social Sciences
Batty & Xie/1999 Taxonomic Self-organised Criticality and Urban Form

The Evolution of a Phenomenon 18

explore the hypothesis that the basic tenets of complexity theory which we discussed above can
function as powerful tools of conceptualisation which will extend our understanding of the way
in which the East End artists’ agglomeration has evolved over the last three decades. A less re-
fined version of this hypothesis may be found in Green (1999), appended to this thesis.
We know from chapter four that the East End artists’ agglomeration has grown “from the
ground up”, that it has been an artist-led phenomenon driven by individuals responding to their
own personal circumstances, and seeking to fulfil their professional needs within a certain con-
text. In chapter eight we learned that the social networks at an organisational level are rather
less significant than the networks which exist at an individual level, and that it is at this level
that we should look if we wish to get glimpses of the underlying dynamics of this phenomenon.
If we define the East End artists’ agglomeration as a system, then, we can propose five
“indicators” for its being a complex adaptive system. They are phase transition or an “edge of
chaos” urban context, non-linearity, sensitive dependence upon initial conditions, adaptiveness
and emergence. We shall go through these one by one, testing each to establish whether the ob-
servations fit the hypothesis. We shall then examine the evidence in terms of Holland’s “seven
basics”. Next, we develop the theory further through the concept of fitness landscapes, and then
propose a theory comprising a simple set of rules and corresponding set of assumptions, which,
it is argued, will generate the behaviour observed in the system.
9.4.2 Is the there evidence for a Phase Transition?
At the time when artists started to move in to the East End, the area was going through an un-
precedented shift in its economic base. Recall that the process of industrial decentralisation
which had its origins in the 1930s had accelerated dramatically by the 1950s and ’60s. A con-
current decline in the volume of trade handled in the docks began slowly, but from 1967 when
St. Katharine’s Docks closed, accelerated with brutal rapidity. So it was that in barely twenty
years, over two centuries of industrial activity simply ground to a halt as western economies
shifted abruptly from an industrial to a post-industrial base. London’s docks all closed in just
fourteen years, from 1967 to 1981. Employment in London collapsed from 4.3 million in 1961
to 3.5 million in 1989, and of these job losses 800,000 were in manufacturing. Unemployment,
meanwhile soared from 40,000 in the mid 1960s to 400,000 two decades later (Hall, 1998:889).
Violent structural change of this nature would be described in chaos theory as a bifurca-
tion, and as we saw in section 9.3, such bifurcations in a system mark the point of a phase tran-
sition. It is reasonable therefore, to argue that the East End was undergoing the urban equivalent
of a local phase transition, from industrial district to post-industrial district. And, as Kauffman
(1995) notes, this is where we would expect a complex adaptive system to evolve.
9.4.3 Does the system demonstrate Non-linearity?
Non-linearity is evident in two respects. First, the growth in the number of artists has been ex-
The Evolution of a Phenomenon 19

ponential, and this demonstrates the existence of positive feedback in the system. One inter-
viewee remarked of the East End art scene that “it feeds on itself”, and this is most readily ap-
parent in the way in which the awareness that there are many artists in the East End has encour-
aged other other artists to seek local studio space. This point featured strongly in interviews.
This notion of “increasing returns” was noted by Arthur (1990), who argued that certain
technologies, or systems, could become “locked in”, in a self-reinforcing cycle. The artists’ ag-
glomeration in the East End is an example of such behaviour.
The second way in which non-linearity manifests itself lies in the fact that the East End
artists’ agglomeration has no “independent variables”. All variables—that is the artists, local
authorities, galleries and so forth—are interdependent. Thus a fieldworker who is studying the
artists’ social networks may well act as a linkage themselves, simply by drawing one person’s
attention to someone else who shares the same interests: this is a classic example of the act of
measurement changing the thing which is being measured. This is also an example of a small
perturbation having an unpredictable effect on the system as a whole, and this leads us to the
next indicator, sensitive dependence on initial conditions.
9.4.4 Does the system show Sensitive Dependence on Initial Conditions?
The origins of the East End artists’ agglomeration, as we saw in chapter four, are remarkably
mundane, and relied considerably upon contingency. SPACE has its origins in the fact that its
two founder members, already toying with the idea of setting up an “artists’ community”, wan-
dered home past a derelict, empty St. Katharine’s Dock after spending the evening with friends.
The seven graduate artists from Reading University who came to London in need of both
living and working space had to follow a different route. SPACE provided only workspace, so
was not an option. But the GLC’s housing policy at the time was, as we saw in chapter three,
quite shambolic, so the artists were able to set up Acme Housing Association in Bow. The re-
sult was that in only a few years, there were streets of ex-shortlife housing in the East End
populated entirely by artists.
So the two initiatives of SPACE and Acme, both of which were experimental and small
scale to begin with, rapidly grew as the hitherto untapped demand from artists was met. Two-
and-a-half decades later, the East End had become the heart of the British art scene, with more
than half of London’s artists working there, and home to the two largest providers of studio
space in the country. This is an outcome which is out of all proportion to its origins, and in that
respect it is a good example of the Butterfly Effect being played out in an urban context.
Furthermore, as we noted above in section 9.4.3, the system is also subject to constant
perturbations through interactions of individual agents. Some of these perturbations may make
little difference to the overall functioning of the system, while others may irrevocably alter the
system’s trajectory. The fieldworker studying the networks is again an example of this.
The Evolution of a Phenomenon 20

9.4.5 Is the system Adaptive?
We can take the hypothesis further still. Each of these artistic networks can also be conceptual-
ised as a living organism, with “limbs” and “minds”. Each “mind” consists of a small close-knit
network of people who are gathering information from both within and outwith the network,
processing this information and using it to generate ideas, which are then turned into reality via
the “limbs”—artists and schools for example. The limbs might also function as contributors to
the mind, and vice versa. The organism is thus capable of learning, of spontaneous self-organi-
sation, of adapting to its surroundings and of growing, by shedding “dead wood”—those who
lose interest in projects, or who leave the area—and by taking on new people who wish to be-
come involved.
This hypothesis, that the system is adaptive, is also demonstrated in the way that as prop-
erty markets have changed, artists have adapted. So Acme moved from short-life housing to
light industrial property in the late 1970s and early 1980s. And as SPACE and Acme came to be
perceived as part of the establishment by younger artists, new “independent studios” were set
up by new generations of artists, unconsciously using and contributing to the mechanisms de-
scribed above, and colonising other parts of East London which had readily available cheap
property which could be turned into studios.
9.4.6 Is the system Emergent?
If we accept the hypotheses that the artistic networks in the East End can be conceptualised as
having the properties of non-linearity, sensitive dependence upon initial conditions and adap-
tiveness in their dynamics, it would be reasonable to expect the artistic networks to display
emergent properties, and indeed this turns out to be the case. We have seen that they can learn,
grow and adapt. It thus seems reasonable to conclude that the artistic networks in London’s East
End, in terms of our five indicators at least, may reasonably be conceptualised as a complex
adaptive system, evolving to suit its environment.
We shall now turn our attention to the conceptualisation of Holland (1995), and examine
the evidence in the light of these ideas.
9.4.7 Holland!s “Seven Basics”
Recall from section 9.3 that Holland (1994) proposed “seven basics” which form the component
parts of a complex adaptive system: aggregation; nonlinearity; flows; diversity; tagging; inter-
nal models and building blocks. These are more subtle differentiations, and reflect Holland’s
concern with the development of computer-based models of complex adaptive systems. As be-
fore, we shall take each indicator in turn.
Aggregation comprises first the breaking down of the system into different categories,
and second the differentiation between different levels of aggregation. Thus in our system we
have artists, galleries, local authorities and so forth. These are the different agents within the
The Evolution of a Phenomenon 21

system, but they form other “meta-agents”: studio blocks or social sub-networks for example.
The second category of aggregation comprises social networks at different levels, from those
comprising individual agents to those consisting of national bodies. These are
nested—networks within networks within networks—and we recognise here the fractal property
of self-similarity across scales.
Flows may be conceptualised in terms of nodes and linkages, a concept which we recog-
nise from social network analysis. The flows in the East End artists’ agglomeration comprise
two things: knowledge and art.
Diversity describes the variety of different agents in the system, each of which has a
“niche” to which it has adapted. Thus artists—almost literally—fill the niche provided by
empty warehouses and factories, dealers fill the niche provided by the art markets and so forth.
Tagging, in a social system such as the one we are examining, happens automatically.
Thus “artist”, “dealer”, “local authority” are all tags referring to types of agent.
The notion of internal models refers to the system’s capacity to acquire information and
act upon it, and in that respect is a reference to the system’s adaptive nature. As we saw in sec-
tion 9.4.5, the East End artists’ agglomeration has this capacity to adapt, and to anticipate out-
comes.
Building blocks assist in the construction of internal models. Thus the internal model
which comprises a piece of knowledge about the whereabouts of empty studios in the East End
might be constructed of building blocks which include the contact names and addresses for
those studios, the locations of those studios, the approximate rent of those studios, the sources
of information, and the destinations (ie artists) for that information. These building blocks can
be assembled in different ways, to generate a variety of internal models, which may be charac-
terised by having different flows from one another.
Nonlinearity, as we saw in section 9.4.3, is also a characteristic of the artistic networks.
Thus we again see that the East End artists’ agglomeration fits this conceptual framework
quite comfortably, and there is no need either to distort the facts to make them fit the
theory—which would be disingenuous anyway—or to modify the theory to make it fit the facts,
not least because the theory is actually rather general.
But that is its beauty, and it is a point to which we shall return when we come to summa-
rise. Next though, we shall narrow our focus somewhat, and explore the evolutionary nature of
the system in terms of fitness landscapes.
9.4.8 Fitness Landscapes
The concept of the fitness landscape is not especially easy to apply, but it does seem to be a po-
tentially useful concept. First, we look at the example of St. Katharine’s Dock, and see how it
might be applied descriptively to our situation. We then develop a more formal, general model.
In the St. Katharine’s Dock scenario, a hundred or so artists moved in to an area which
was run down, and derelict. The fitness landscape is favourable to the artists, who can climb
The Evolution of a Phenomenon 22

relatively easily to a peak. Up to this point however, the fitness landscape has been relatively
unfavourable to property developers, for whom a derelict area is a difficult marketing proposi-
tion. But the artists have improved the fitness landscape for the property developers, since the
area is now imbued with an artistic focus, and the property developers move in, raising rents
and altering the fitness landscape to such an extent that the artists can no longer survive in the
area. So the artists leave, handing the area entirely over to the property developer. We can ex-
plore this at a more formal level with the help of Stuart Kauffman’s (1995) evolutionary hyper-
cube.
This 4-dimensional hypercube (figure 9.6 overleaf) takes Kauffman’s model of a fitness
landscape and attempts to apply it to the evolutionary “conflict” between property developers,
shown in red, and artists, shown in blue, in East London. Here, the numbers 1 to 16 represent
progressively higher points in the landscape, and the height of a particular point on the fitness
landscape will be dependent on and reflective of a number of factors, for instance distance from
the city centre, proximity to public transport and other facilities and so forth.
Three basic rules apply. First, the system is path dependent. Thus it is possible only to
climb higher, a “ratchet effect” reflecting the fact that newly gentrified areas rarely move
“down-market” once they have moved “up-market”. Second, the first actor to reach a point
takes control of it and can use it to climb to a higher point. Third, those points on the landscape
retained by either property developers or artists are those from which no further progress is pos-
sible. These represent local fitness peaks.
In this model, property developers start lower down the fitness landscape than do artists,
since historically it has been artists who have paved the way for others to follow. In this respect,
the initial fitness landscape, which in reality will probably comprise a cheap and run-down ex-
industrial location with a poor reputation, is better suited to artists than property developers.
Thus property developers start from 1, artists from 5. Each arrow represents a step up the fitness
landscape, and is numbered to denote the number of steps of each actor from their respective
origins. Arrows may therefore be considered to mark the passage and direction of time
Thus artists make rapid progress in their first three generations, but climb through a rela-
tively small part of the landscape to the lowest of the local fitness peaks, 13. Property develop-
ers, by contrast, are better equipped to deal with different aspects of the landscape—changes in
the markets, media coverage making an area fashionable for example—and so are able to climb
the fitness landscape relatively quickly, encroaching frequently on territory first “colonised” by
artists, and winning three out of the four local peaks, 14, 15, 16.
More formally, we can argue that the topography of the fitness landscape is a function of
the local “rent gap”, which was described in chapter three. So the rent gap, g = rmax ! r where
rmax is the rent achievable for the “highest and best use” and r is the rent achievable at that time.
The fitness of an actor in this system is a function of the rent they can afford, and the mar-
ginal utility they get from paying that rent. So actor fitness,w = R•um where R is the rent pay-
able and um is the marginal utility ( a figure between say 0 and 1) on that rent.
We combine these two equations to get the fitness Fl of a particular actor to a specific lo-
The Evolution of a Phenomenon 23

The Evolution of a Phenomenon 24
Figure 9.6 4-dimensional Boolean hypercube representing the interdependent fitness landscapes of
property developers (red) and artists (blue). The numbered spheres, 1–16, represent points on the fit-
ness landscape, 1 lowest, 16 highest. Developers start at the lowest point on the fitness landscape, 1,
while artists start off farther up, at 5. The arrows mark the passage and direction of time, and are num-
bered to denote the number of steps in time each actor is from its point of origin. There are three rules: it
is possible to move only from a lower to a higher numbered sphere; the first actor to reach a point
“claims” it, and can use it to climb to a higher position; points retained by either artists or developers are
those from which no further progress is possible. These retained points number four in our example.
Note that three are red, and one is blue, and property developers retain the three highest fitness peaks.
Thus as the evolutionary dynamic plays itself out, the system settles down to an equilibrium position from
which no further evolution is possible without external influences disturbing the system.
The fitness landscape presented here has four-dimensions—thus each sphere is connected to
four other spheres. A larger fitness landscape may have more dimensions, and would take the form of in-
creasingly complex polyhedra, nested one within the other.
3 4
5
67
8
9
10
11
12
13
14
16
1
1
1
1
2
2 2
2
1
1
1
3
33
3
2
2
2
2
3
3
2
3
3
2
4
4
4
1 2
152
2
2
2

cality, which may be defined as Fl =wg .
An example. An old factory in an undesirable area is available for rent. Suppose that the
rent achievable for its highest and best use is £20 per square foot, and that the actual rent
achievable at present is just £5 per square foot. The rent gap is thus £15. A group of artists seek-
ing studio space can afford £5 per square foot, are pretty desperate for a place to work, and so
do not mind too much if the area is insalubrious. In other words, the marginal utility for artists
is high. We shall assign it the value of 1. Thus the actor fitness of artists, wa is 1*5=5. For prop-
erty developers, the situation is different. Although they can afford the going rent (and more),
they do not want to develop in a run down area with a poor reputation. The marginal utility for
developers is therefore low, say 0.1, and the actor fitness of property developers, wpd is
0.1*5=0.5. From these figures we can derive the topography of the fitness landscape of artists
and developers simply by dividing these figures by the rent gap, g, as in the equation above. If
we were to derive a graph whose x and z axes enclose a map of a particular area, we could cal-
culate local heights and draw a 3-dimensional map of the actual “fitness landscape”.
Although rudimentary, these models serve as a useful “first stab” at developing a formal
conceptualisation of the evolutionary dynamic of the East End artists’ agglomeration. They en-
able us to go beyond general contextual descriptions and, as we shall see in the next section, to
pinpoint the key drivers of the dynamics. But of course the question arises: if the system is one
whose outcomes we cannot predict, even though we have an understanding of the underlying
dynamic driving that unpredictability, then where do we go from here? That is a question which
we shall leave for the next, and final chapter. First though, we must work out where have got to.
9.5 Discussion
The key question here is the extent to which these findings are reflected in the theories set out
above, and it is reasonable to argue that the theories do indeed fit the facts. First, let us return
once again to Törnqvist, and his four preconditions for a creative milieu: information, knowl-
edge, competence and creativity. In the foundation of SPACE, Acme and indeed all the other
studios, all of these qualities are readily apparent. Both Hall and Törnqvist have argued that a
creative milieu is unstable, chaotic even. We know from its history that the East End in the late
1960s and early 1970s was structurally turbulent, and so too was the art world.
Complexity theory offers a more systematic conceptualisation of these dynamics, and we
can show from empirical study that the artistic networks in London’s East End exhibit all the
properties of a complex adaptive system. In itself, that should come as no great surprise. Indeed
it would be somewhat astonishing to find a social system which was not a complex adaptive
system. Given these conceptual tools then, how should we describe the evolution of the East
End artists’ agglomeration?
The artistic networks in the East End appear to comprise an evolving complex adaptive
system which has inhabited localised fitness landscapes for as long as they were favourable,
The Evolution of a Phenomenon 25

seeking out and moving to others when the local fitness landscape becomes unfavourable. In-
deed, some studios are now purchasing rather than renting property, effectively seeking to con-
trol their own fitness landscape with a view to making it less prone to the actions of others, that
is to make it less “rubbery”.
The different artists’ studios and organisations, then, have developed independently, re-
sponding to their own immediate needs, growing in number and coming eventually to be a part
of something bigger, a proto-artistic community. Such a process is inherently messy, or even in-
efficient. But, as Kauffman (1995) has argued, if systems are to evolve, they must have a high
degree of “redundancy” built in, and the East End artists’ agglomeration exhibits such proper-
ties. This was a point recognised by the founders of Acme, Jonathan Harvey and David Panton:
JH The development of artists’ studios has been incredibly ad hoc. It’s not been the result
of any kind of planning by the funding system or indeed as a result of very much money
from the funding system at all. It very much has been artists alone…
NG Would you say that the fact that the network has developed on an ad hoc basis was
one of its strengths?
JH I think it probably is one of its strengths, but there can be an enormous wastage of
resources along the way.
(Acme, 1997:interview)
So we know that although the artists networks arose from fluid circumstances which lay largely
outside the control of the local policy makers, and have grown and evolved to suit the prevail-
ing economic and political conditions of the time, they do nonetheless exhibit certain dynamic
properties which we can describe at relatively formal level. In other words, the networks are not
beyond our comprehension if we bring the right intellectual tools to bear.
Thus while it is true enough that conventional theory can bring us somewhat closer to an
understanding, it is to complexity theory that we must look if we wish to find the key to this
system, and probably others like it. Through this theory, a messy, ad hoc, constantly shifting
system such as the East End artists’ agglomeration can be conceptualised in terms of just five
basic concepts—phase transition or an “edge of chaos” urban context; non-linearity; sensitive
dependence upon initial conditions; adaptiveness and emergence—and the evolutionary dy-
namic of the system is encapsulated therein. However, we can offer the hypothesis that these
concepts are the consequences of three still simpler rules which rest upon six basic assumptions,
set out below.
Basic rules which generate the system’s behaviour:
i. artists will seek out and occupy cheap workspace;
ii. artists will attempt to be near other artists;
The Evolution of a Phenomenon 26

iii. artists will join an existing studio (Probability>0.5);
OR
start up a new studio block (Probability<0.5).
Assumptions upon which the basic rules rest:
i. agents carry information;
ii. new agents join the system;
iii. information is transferred between agents;
iv. agents create knowledge from information;
v. agents leave the system;
vi. agents act on the basis of their knowledge at the time.
It therefore follows that:
• agents can bring information into the system;
• information is disseminated throughout the system;
• knowledge is created within the system;
• the system as a whole can act on the basis of the knowledge it possesses, thus generating
emergent behaviour.
From these basic rules, the typical behaviour of the system is generated, and the resulting evolu-
tionary dynamic is expressed in the simple diagram above (figure 9.7). Note that the process is
linear rather than cyclical—this is a one-way process, as we observed in the discussion of fit-
ness landscapes. If we think about how the concepts of the fitness landscape tie in with these
basic rules, we shall observe that the first of the basic rules states that artists will seek out and
The Evolution of a Phenomenon 27
East End Arts
Lündgren!s (1995)
East London
Stages of Evolution
Explosive Growth
Genesis
Consolidation
Coalescence
Steady Growth
Dissemination
Bifurca-tion
Abrupt Industrial CollapseGentrification
Shoreditch becomes Fashionable
London DocklandsDevelopment Corporation
1968 1978 1988 1998
SignificantInitiatives inEast End art-ists!
Figure 9.7 The Four Stages of Evolution
?
light industrial space used as studios
short-life housing as live/work spaces
independent galleries
independent studios
artistic areas

occupy cheap studio space. Thus as their own studio space becomes unaffordable, they will
move elsewhere, generating the dynamic described graphically in the 4-dimensional hypercube
in figure 9.6, and contributing to the regeneration of areas such as Shoreditch, where we see the
“fight for territory” being played out at the time of writing (November 1999).
The stages of evolution for the East End artists’ agglomeration are compared in figure 9.7
with Lündgren’s stages of evolution for the Swedish image processing industry, and we find in-
teresting parallels. Structurally, the two phenomena—the East End artists’ agglomeration and
Swedish image processing—have followed similar evolutionary paths (note that Lündgren’s
stages do not coincide in time with the East End’s), although Lündgren’s use of the word
“dissemination” is rather confusing—probably he means “diffusion” or “dispersal”.
The stages of evolution are also set against points in the East End’s history, and it can be
seen that as the East End has become more settled, so too has the East End artists’ agglomera-
tion. Here then, we can see that the evolution of the East End artists’ agglomeration has been in-
timately linked with the evolution of the East End itself. In other words, and this is no intellec-
tual bombshell, but a point worth making nonetheless, the East End artists’ agglomeration has
not been independent of its surroundings but, as the basic rules set out above suggest, a result of
agents acting independently in response to their circumstances: and being an emergent phe-
nomenon, the East End artists’ agglomeration as a whole has no “sense of direction”, or “aims”
or “objectives”, even if the individuals comprising it do.
However, the context is changing, and the recent rises in property prices in areas such as
Shoreditch and Bow are once again threatening the stability of the East End artists’ agglomera-
tion, which in turn is pushing the system farther from equilibrium than it has been for the last
decade and a half. The possibility of bifurcation arises, and new and as yet unpredictable trajec-
tories for the continuing growth of the artists’ agglomeration in the East End become possible,
while others become les likely. And so it is that we move from the historical to the speculative;
that must mean it is time to conclude.
The Evolution of a Phenomenon 28

TEN
CONCLUSIONS: FROM FACTORIES
TO FINE ART AND BEYOND
There are places I’ll remember
All my life, though some have changed.
Some for ever, not for better.
Some have gone, and some remain
All these places had their moments
With lovers and friends, I still can recall.
Some are dead and some are living,
In my life, I’ve loved them all.
John Lennon & Paul McCartney, “In My Life”, 1965
10.1 The Chase Nears its End
Several hares have been set running in the course of this dissertation, and it is now time to trap
those we can, and to work out ways of keeping track of those that still elude us. The hares we
can trap number two: the findings in response to the research objective set out in chapter one,
and the broader theoretical context of this project’s findings. These comprise the subject matter
for the next section.
The hares which remain elusive are more numerous, and inevitably, we have spotted oth-
ers in our travels which we must now flush out, even if we cannot trap them. They are the prob-
lems of predicting future outcomes for a system which I have argued is unpredictable, and
broader questions which arise from the way in which the research objective was pursued. These
are discussed in sections 10.3 and 10.4. The last section of this chapter simply asks “what next
for East London’s artists?”
Conclusions: From Factories to Fine Art and Beyond 1

10.2 What Did We Just Find Out?
The research objective—“To map and describe the development of visual artists’ studio organi-
sations in the East End”—was simple enough, and what actually happened is not so very diffi-
cult to understand either. We saw in chapter three that the decentralisation of industry, which
had its origins before the second Word War, was encouraged in Abercrombie and Forshaw’s
1943 County of London Plan: and during the 1960s and ’70s it came to be driven by the dein-
dustrialisation of western cities at the hands of an increasingly global economy driven by foot-
loose capital, leaving swathes of empty light-industrial property in the East End. Unable to let
such property to commercial tenants, landlords found that artists were willing to rent such prop-
erty. Furthermore, the GLC’s housing policies were shambolic, and the GLC itself was happy
enough to offload short-life housing to artists who could make something of it.
In chapters four to seven, we learned that the “Coldstream Report” had by the late 1960s
contributed to burgeoning numbers of graduating artists, who were subject to an increasingly
insecure existence in a turbulent art world, needed cheap workspace, and in a classic case of
supply meeting demand, found it in the old furniture factories, warehouses and other light-in-
dustrial properties which were to be found either by the River Thames, or in Shoreditch, Hack-
ney, Whitechapel, Bethnal Green and Bow. The Arts Council, forever in the public eye negoti-
ating the delicate line between politics and art, nevertheless contributed financially to organisa-
tions such as SPACE and Acme. So too did others: the Gulbenkian Foundation, for example,
and not least the property owners who let out their buildings at cheap rents. Again, supply met
demand.
The whole context for these changes and initiatives was one of fluidity. Faced with struc-
tural changes with which they were simply unfamiliar—the sudden transition from an industrial
to a substantially post-industrial district—local authorities did not stifle the artists’ initiatives.
They did, after all, offer the possibility that that transition might be rendered less painful, if only
by virtue of the fact that buildings continued to be occupied, and their localities thus rendered
less desolate.
The studios also clustered: in old industrial buildings around London Fields, west of Hox-
ton Square, at Spitalfields; in Acme houses along the new M11 route and in Beck Road. Per-
haps not surprisingly, it was these clusters that the media latched on to, and the two nearest the
City, at Spitalfields and Hoxton, became fashionable in the late 1990s. London Fields is better
known for the fact that Graham Paton and Angela Flowers have galleries there: a destination for
the cognoscenti. But many studios remain in defiantly unfashionable places: Maryland; Dal-
ston; the edge of Bow: off the Tube Map, conceptually inaccessible. If these places become
gentrified, it will not be because of the studios. We can conceive of these clusters as “hotspots”,
and this “Galaxy of East End studios” is illustrated in figure 10.1 overleaf by way of a closing
map.
The problems faced by artists need revisiting too, for although they undoubtedly bene-
fited from the industrial malaise in the East End, they had to work hard to realise those benefits.
The buildings were often derelict, and in the case of the short-life housing favoured by Acme in
Conclusions: From Factories to Fine Art and Beyond 2

their early days, earmarked for demolition as part of slum-clearance programmes. Thus consid-
erable time and effort had to be invested in the conversion of these properties to studios.
Conclusions: From Factories to Fine Art and Beyond 3

Conclusions: From Factories to Fine Art and Beyond 189
Dalston
Bethnal Green
Hackney
Victoria Park
Bow
Clapton
South Hackney
Wapping
Bermondsey
Rotherhithe
Mile End
de Beauvoir Town
Isle of Dogs
Poplar
Hoxton
Hackney Downs
Greenwich
Shadwell
Limehouse
Figure 10.1 Indicative Map showing studio “hotspots” in the East End, 1998.(brighter spots are larger and denser clusters)
Approx. 1km
Whitechapel
London
Stratford
Shoreditch
1/2. The Whitechapel-Spitalfields-Shoreditch axis.Spitalfields was the subject of gentrification in the 1980s, and in the 1990s media attention focused on its burgeoning arts scene, contributing further to its success.
3. London FieldsAngela Flowers established an East End branch of her (West End) gallery in 1988, near to Martello Street Studios, es-tablishing this as an East End destination for those interested in contemporary art. Studios have clustered here since the early 1980s.
4. Copperfield RoadLocation of Acme Headquarters, Matt!s Gallery and Copperfield Road Studios. As with London Fields, the presence of a respected gallery makes this a destination.
5. Stratford/MarylandA dispersed group of relatively large studios, including the largest Acme studio block, Carpenter!s Road (now closed).
6. Wapping WallThe only remaining studios in Wapping, which has now been gentrified.
7. Isolated and small clustersThese illustrate the dispersed nature of the East End artists! agglomeration.
8. Bethnal Green/BowBonner Road Studios and the Showroom, both run by Acme. Chisenhale Studios and Gallery, the first “independent” East End studios. Chisenhale Gallery maintains a reputation at the cutting edge.
3
6
2
4
5
71
7
8

Nor were the studios necessarily secure: once use as artists’ studios ceased to be the most
profitable option, the artists would have to move on as the landlords realised the full market
value of their assets; we can see this in the slow but sure process of decentralisation of artists’
studios, as the East End gradually recovers from the loss of its industrial role, and starts carving
out new niches for itself. In short, the East End’s industrial loss was the practising artists’ gain:
but only in the right circumstances.
“The right circumstances” for artists were, fundamentally, circumstances of fluidity: the
mechanism by which those circumstances were exploited was the social network. But as we
saw in chapter eight, the networks among organisations are loose and fragmented: some infor-
mants argued that outside of the “gallery circuit” they do not exist in any meaningful sense.
However the evidence from the interviews demonstrated time and again that the networks
which proved to be significant were those which existed at an informal level, those which are
often colloquially referred to as the “grapevine”. Through these networks, the information was
exchanged and the knowledge created which enabled the East End artists’ agglomeration to
evolve.
The growth of the East End artists’ agglomeration has thus been organic, driven by indi-
vidual artists responding to individual needs, but in the process generating a social system. This
is the concept of “emergence”, the notion that a social system will generate properties which
could not be predicted by looking at the individual agents in isolation. And in chapter nine, I
used ideas from complexity theory, the natural sciences, and evolutionary biology to argue the
case that the dynamics within the local artists’ population are those of a self-organising evolu-
tionary system. The local artists’ population was not contrived by a higher authority. The con-
text of course is a shared one, and the similar responses to it have meant that the local artists’
population appears to function, and can reasonably be conceptualised as functioning, as a single
system, adapting to its surroundings, learning and growing. In terms of complexity theory, this
is known as a complex adaptive system.
In short, we can describe the East End artists’ agglomeration as a complex system which
has evolved in the “edge of chaos” environment which comprised an area of London where the
global shift from an industrial to a post-industrial society played itself out at a local level.
10.3 Reflections on the Research Process
Before considering areas of further research (in the next section) I want to discuss briefly some
of the problems which I came up against while pursuing this research, and which anyone want-
ing to probe certain themes farther than I have here might wish to avoid.
To start with, there are the basic practical problems: the studio on whose answerphone
several messages have been left, but which still does not call back, and which eventually has to
be written off as a potential informant. The same is true of would-be interviewees who say yes,
they would love to be interviewed, and please call back later to arrange a time when they are
Conclusions: From Factories to Fine Art and Beyond 5

less busy. Of course, the interview never takes place. Most frustrating of all were the gallery
owners (or their assistants), who would decline to be interviewed due to “lack of time”, al-
though they crop up frequently enough giving quotes to journalists in a process which Bruno
Latour would no doubt recognise: prising the “black box” open is not always easy.
The almost complete lack of literature on the East End artists’ agglomeration might be
seen as either a problem, or a merciful blessing: a problem if one feels trepidation at the thought
of navigating uncharted waters; a relief if one craves the new horizons that such a prospect
promises. Fundamentally, it means that intellectual risks can be taken, new theories constructed
from bits of old ones; the intellectual equivalent of the inventor creating new machines from old
in the garden shed. True, the inventor’s contraption may seem a bit like one of Heath Robin-
son’s, and perhaps similar observations might be made about some of the ideas which have
been presented herein.
Combining ethnography, narrative history, social network analysis, theories of creative
milieux and complexity theory may seem like just such a “Heath Robinson” approach, and per-
haps an unnecessary one when there are theoretical approaches such as that proffered by the
“new economic geography” or the “new institutionalism” which appear, on the face of it, to fit
the facts adequately. The problem is that once the veneer of superficiality has been scraped
away, they do not fit at all: their institutional emphasis makes them quite unsuitable for a social
system whose main agents are individual artists, as we saw in chapter one. And this where the
problem of a lack of relevant literature falls into sharp relief: large chunks of infuriatingly ir-
relevant literature have to be ploughed through to get at the truth; they must be read, or at least
skimmed, digested, discussed, and ultimately dismissed, but included nonetheless to satisfy the
inquiring mind which is drawn to the perfectly reasonable, but wrong, conclusion that a superfi-
cial appeal is a genuine connection.
So in the end, we must plump for the “Heath Robinson” theory: inelegant it may be, but it
possesses the undoubted virtue that it works. The question becomes one of improvement, not
invention. In this thesis, I think, the whole is clearly the sum of its parts (figure 10.2 overleaf).
A few of the connections could usefully be refined: the nature of the informal networks which
have been deduced, but not analysed, needs a closer look. And while the concept of emergence
can link social network analysis to complexity theory via actor network theory, by far the better
approach would be to cut out the “middle man” and generate high quality data sets for the social
networks which would enable the construction of a decent time series: then, the question of
whether the social system does genuinely emerge from the networks could finally be answered.
This, though, takes us into the realms of further research, and that means it is time to move to
the next section.
Conclusions: From Factories to Fine Art and Beyond 6

Interviews
Individual Artists Chasing Cheap Studio Space!Struggle for Survival"
Grounded Theory
Historical Narrative
Network Analysis
Network TheorySociety as !Emergent
Phenomenon"Field of Cultural
Production
Theoretical Model
EEAA as CAS
Evolutionary Trajectory of EEAA
Algorithm
Desktop/Archival Research
Collapse of Art Market in 1960sPost-War Collapse of Industry
LCC/GLC Housing PolicyRevival of Art Market in 1990s
Datacollection
Coding
Memoing
Complexity Theory
Phase TransitionNon-linearity
Sensitive DependenceAdaptivenessEmergence
Theories of !Creative Milieus"
!Moral Temperature"Intellectual Turbulence
Data Collection
Data analysis
Existing Theory
Outcomes
Figure 10.2 The Methodological Process Revisited in Light of the Project"s Findings

10.4 Areas of Further Research
This thesis started with the assertion that it is not art history, and to the extent that the East End
artists’ agglomeration has been treated as “just another urban social system” that assertion re-
mains true. Nonetheless, questions about the art history of the East End will no doubt have
arisen in the reader’s mind, and will almost certainly—and deliberately—not have been an-
swered.
In particular, I have been careful to steer clear of making any judgements on the quality of
art being produced, for example, and the type of art produced has not been explored in depth.
All the artists interviewed for this project are painters, and a trek around the East End for an
Open Studios event reveals the majority of the work to be painting, and generally not on an
enormous scale; probably this is for the simple reason that big paintings are expensive to pro-
duce, and a more difficult domestic proposition, so harder to sell. Art projects such as the shop
on Bethnal Green Road run by Tracey Emin and Sarah Lucas are the exception, not the rule.
The art produced in the East End, then, is a topic that merits further exploration.
Figures for the art market itself are extremely difficult to pin down. Although the Enid
Lawson Gallery observed that the contemporary art market has flourished in the latter half of
the 1990s, the global nature of the contemporary art market makes the disaggregation of figures
for London a near impossible task. Informal interviews1 with Sotheby’s, Phillips and Bonham’s
drew similar responses: following sale prices for similar pieces by named artists over time is the
best way of tracing the ups and downs of the market. Equally, turnover is not necessarily an in-
dicator (Sotheby’s, 2001:interview; Phillips, 2001:interview; Bonham’s, 2001:interview). Is the
sale of one piece for £100,000 by an established “star” the equivalent of the sale of one hundred
pieces by unknown artists for the £100,000 in terms of market size? A report for the British Art
Market Federation explores the implications of VAT harmonisation in the EU (Market Tracking
International, 1997), but Phillips’s Head of Impressionism and Modern Art, James Ulph, knew
of no reports which cover London’s contemporary art market (Phillips, interview:2001). Indeed,
Ulph suggested that such a report would have to be specially commissioned (ibid).
The socio-economic context in which that art was produced is also one for the art histori-
ans with a sociological bent: we have seen that the number of artists has increased, and in this
project have accepted that as a simple contextual fact. Originally artists’ numbers rose because
of the “Coldstream Report”, which encouraged greater participation in further and higher arts
education, but are graduates in fine art more likely to continue as artists than they were, say,
twenty-five years ago? Did the notions of the 1980s “designer lifestyle”, or the 1990s
“creative/café lifestyle” make a career in art more attractive? Michael Craig-Martin, an artist
and teacher at Goldsmiths’ College, surmised in a 1996 newspaper article about the East End
artists agglomeration that the death of the “job for life” and the concomitant decline in job secu-
rity encouraged an “if I’m going to be insecure anyway, I might as well be insecure doing
something I enjoy” attitude (Glaister, 1996). Again, this is something which has been skirted
around in this project, but which might repay a closer look.
1 Informal interviews were carried out by telephone on May 25th 2001.
Conclusions: From Factories to Fine Art and Beyond 8

In a somewhat pointed aside, Kate Malone of Balls Pond Studios, now closed but which
was a ceramicists’ studios, observed that crafts people tend to be supportive of one another, and
that ceramicists tend to be female. Was there a connection? she wondered (Balls Pond Studios,
1999: interview). Answering such a question would doubtless shed considerable light on the so-
ciology of craft production.
The role of policy, too, has had short shrift in this thesis: the argument which has run
through it is that policy’s role in the evolution of the East End artists’ agglomeration has been
that of a largely passive enabler, not stifling initiatives, and contributing in a small way to their
nurturing: as we have seen, the East End’s artists’ agglomeration was a product of circum-
stance, not policy. Furthermore, its evolutionary trajectory is inherently unpredictable.
Nonetheless, the fact that the role of policy is limited does not make it redundant. In chap-
ter nine, we learned how NASA scientists exploited the chaotic orbit of a spaceship whose fuel
supply had run low, and by “nudging” the spaceship at carefully chosen moments with what
fuel remained, they were able to maintain it in a stable orbit. Equally, policy’s role with a sys-
tem such as the East End artists’ agglomeration must be one of careful nurture through rela-
tively low-key, but well-considered interventions, and at opportune moments2
. Understanding how such a policy approach actually works however, will need detailed study
of the way in which policy is generated and implemented; it will also require close observation
over time of the way in which particular outcomes evolve (or not).
The role of independent arts patrons, such as the Gulbenkian Foundation, will also repay a
closer look. Indeed, Paul DiMaggio found in the late 1980s that independent arts foundations
had received scant attention from researchers in the Unites States (DiMaggio, 1986): the reader
will be aware that this thesis does little to remedy that situation on this side of the Atlantic.
And so we arrive at an anomaly. This project has attempted to model at a relatively sys-
tematic, albeit qualitative level the evolutionary dynamic of a social system. But the point of
modelling systems is not only to understand, it is to understand well enough to be able to pre-
dict. That way lies the hope that the mistakes of yesterday will not be repeated tomorrow. But
when we are looking at cities, which are, after all, multi-agent systems comprised of the most
complex natural organism there is, asking for predictive models is a tall order: to all practical
intents and purposes, it is technically impossible. True, economists have attempted to predict
the behaviour of financial markets on the basis of rational human beings making rational deci-
sions, but not with great success: indeed, the field of evolutionary economics was a direct re-
sponse to this failure.
The big question, it seems to me, is developing a predictive model which can accurately
mimic the contingent elements of human existence, and which can accurately simulate the
emergent properties which social systems invariably exhibit. Paradoxically, we can predict that
social systems will behave unpredictably, but separating internal factors—John Lennon meeting
Paul McCartney and getting on with him well enough to start a band called the Beatles—from 2 See Landry, 2000 and Landry and Bianchini, 1995 for examples of policy being applied creatively to
nurture projects which less imaginative people would have dismissed, or not conceived of.
Conclusions: From Factories to Fine Art and Beyond 9

Conclusions: From Factories to Fine Art and Beyond 10
Evolutionary Models of other phenomena
Complex Adaptive Systems
Art in Education
Economic Benefits to Local Businesses
Social Benefits of Art Education Projects
Educational Benefits of Art Education pro-jects
Computer Simulations and Agent-based models(at local andpan-metropolitan scales)
Predictive Models?
Manufacturing Industry
Heavy Industry
Gentrification
Edge of CBD regeneration
Social Systems
Benefits derived from local artists population
Edge of CBD regeneration
Inner Cityregeneration
Figure 10.3 Areas for Further Research
Extended Narratives
Social Benefits of Art Education Projects
Gentrification
Social Systems
Policy Implications
Urban Histories
Artists in Society

external factors—in the Beatles’ case the rise of skiffle and previously untapped demand for the
kind of music the Beatles played—is no easy task.
In chapter nine, we drew on complexity theory to propose a simple formal model for de-
riving fitness landscapes in terms of the rent gap, and computer-based geographical information
systems (GIS) would certainly have much to contribute to such a modelling process. But this is
only a part of the jigsaw. The nature of the jigsaw is such that we must, in the end, turn to com-
puters if we wish to generate models of urban social systems which are sufficiently complex to
be realistic. Agent-based simulations such as that developed by John Casti and his colleagues
(Casti, 1999) are one way forward, but even then, modelling the evolution of a fluid social sys-
tem within the general context of a turbulent urban context will probably continue to rely heav-
ily on qualitative insights for understanding. The algorithm proposed at the end of chapter nine
could certainly form the basis for such an agent-based model, and developing such a model is
one “area of further research” which the author is keen to pursue.
There is one other “area of further research” that I want to suggest, and I think from the
East End’s point of view, it is perhaps the most important: it is the way in which the local art-
ists’ population has benefited the area. Such projects would concern themselves more with the
educational, social and perhaps environmental benefits—such as those described by Suzi Gablik
(1992) in The Re-enchantment of Art—than the economic benefits. I have argued elsewhere that
artists need to use the possibility of the increased social and cultural capital which they can of-
fer as levers to ensure their own survival (cited in Raimes and Ryan, 2000): given the impover-
ished state of most artists, then, the most useful research will probably not concentrate on the
economic benefits which artists bring to an area, since in many cases these will be minimal.
The social and educational benefits of art education have been documented by psycholo-
gists such as Gardner (1990), were recognised by Samuel Barnett in the 19th century, and have
been perpetuated in the work of the Whitechapel Gallery, which was of course founded by Bar-
nett. So in the end, and we need more research to find this out, the expansion of such pro-
grammes, and the benefits they can bring to people, may well prove to be the most significant
legacy of Bridget Riley’s and Peter Sedgely’s walk home past St. Katharine’s Docks over thirty
years ago.
Conclusions: From Factories to Fine Art and Beyond 11

10.5 Conclusions: From Factories to Fine Art and Beyond
Interviewer Do you think there’s an artists’ community in the East End?
Artist There are plenty of artists, but I don’t think there’s a community. I think the
communities are just within studio groups. Even big groups like say Carpenters Road;
they’re not communities. Carpenters Road doesn’t seem to me to act as a community.
There are 60 separate artists who have an Open Studio now and again. Well, I think in a
way that describes how the artists community of the East End works. We’re separate units.
Together we form an enormous body. But I’m not too sure there’s a community because,
where does this community meet and interact, whatever? Once again I don’t think it’s done
on a group basis, it’s individuals interacting with each other that form a network which
makes that community.
Magnus Irvin, City Studios, 1998
Things may be about to change. In chapter two we noted the establishment of ViA (with which
the author was actively involved), an organisation dedicated to the establishment of a formal
artists’ network in the East End, and at the end of chapter seven we noted that the East End arts
scene appears to be on the threshold of a new phase, as areas such as Spitalfields and Shoreditch
become more fashionable and consequently more expensive. In chapter eight we saw how the
strongest sub-network involved ViA, the two local authorities of Tower Hamlets and Hackney
and the National Artists’ Association.
Perhaps such a move is to be expected. As we saw in chapters four to seven, the artists’
networks, such as they are, have evolved at an informal level over the last three decades, but as
the context becomes less fluid, and as property prices rise, studio blocks are now seeking a
more secure existence which will leave them less prone to the vagaries of the property markets
(Wilson, 2001). The growth of the ViA initiative over the last eighteen months or so, and the
active support offered by the local authorities. suggests two things: first, security for artists is an
increasingly pressing issue; second, local authorities are now prepared to support the East End
arts scene actively, rather than tacitly as they have in the past. In March 2001, the Museum of
London’s exhibition Creative Quarters explored the art world in London from the seventeenth
to the twenty-first centuries: the East End featured prominently (cf Wedd et al, 2001)
Attempting to predict the outcomes of these changes is fraught, but worth a try. Probably
we will see an East End arts scene with two components. In the centre, around the newly fash-
ionable and gentrified areas of Shoreditch and Spitalfields, we shall see a high profile,
consumer-oriented “artists’ quarter” with a few studios owned by successful artists, and with
other studios being occupied by better paid “creative professionals” such as graphic designers,
crafts people and so forth. This central area, not dissimilar to what currently exists in these ar-
eas, will have cafés, boutiques, shops, and restaurants, and will be small, but have a high media
profile. Surrounding this will be an artists’ “hinterland”, similar to the majority of the existing
Conclusions: From Factories to Fine Art and Beyond 12

artists’ East End, but more widely dispersed, and with more studios situated farther from the
centre. The central “core” will be more secure and more consumer-oriented, but less dynamic,
while the surrounding belt of artists to the north-east, east and south-east will rely more and
more on electronic mail and the internet for communication, and for gathering and disseminat-
ing information. This process will be slow at first, but will gather speed and momentum as these
means of communication become more widely accepted and more readily available via libraries
and indeed through resources and organisations such as the National Artists’ Association and
ViA. The artists themselves will no doubt adapt to their new circumstances, creating something
out of nothing: they have after all successfully done so for the last three decades. I see no reason
for that to change.
Conclusions: From Factories to Fine Art and Beyond 13

REFERENCESReferences are divided into two sections; first, bibliographic references; second, references to personal
interviews.
Bibliographic References
Acme, 1995, ACME Studios for Artists, London, Acme Housing Association Ltd..
Acme, 1998, “The History of Artists in the East End”—Reseach Project Development Brief (unpublished).
Agar, M., 1980, The Professional Stranger, New York, London, Academic Press.
Alberge, D., 1990, “At the Sharp East End—London’s East End has the biggest concentration of artists in Europe”, p.27 in The Independent, December 4th 1990, London, Independent.
Alisch, L.-M., Azizighabari and Bergfeldt, M., 1997, “Dynamics of Children’s Friendships” 1997 in Eve, R.A., Horsfall, S., & Lee, M.E. (eds), 1997, Chaos, Complexity and Sociology—Myths, Models and
Theories, London, Sage Publications Ltd.
Allen, P., 1993, “Evolution: Persistent Ignorance from Continual Learning” in Day, R. & Chen, P., 1993, Nonlinear Dynamics and Evolutionary Economics, Oxford, Oxford University Press.
Andersson Å.E. & Sahlin, N.E., (eds), 1997, The Complexity of Creativity, Dordrecht, Boston, London, Kluwer Academic Publishers.
Andersson, Å.E., 1985, Kreativitet: StorStadens Framtid, [Creativity: Cities of the Future] Stockholm, Prisma (written in Swedish, not read by the author. Author’s translation of title).
APT, 1990, Ten: Chisenhale Studios Tenth Anniversary Catalogue, London, Arts Place Trust/Chisenhale Studios.
Archer, M., 2001, Artists in East London (1969–2000), London, Acme Studios.
Architects’ Journal, 1991, “Capital Ideas”, special edition, 11th and 18th December 2001, London.
Arthur, B.W., 1990, “Positive Feedbacks in the Economy” in Scientific American, February 1990, pp.92-99, New York, Scientific American Inc..
Axelsson, B. & Easton, G. (eds.), 1992, Industrial Networks—A New View of Reality, London and New York, Routledge.
Baker, A., 2000, Other Educated Persons—Art and Artists in the East End, multimedia web-based project, http://vads.ahds.ac.uk/vads_catalogue/oep/index.htm
Ball, R. & Pratt, A.C.(eds), 1994, Industrial Property: Policy and economic development, London, Routledge.
Batty, M., & Longley, P., 1994, Fractal Cities, London, Academic Press
Batty, M. & Xie, Y., 1996, “Preliminary evidence for a theory of a fractal city” in Environment and
Planning A, vol.28, pp.1745–1762, London, Pion.
Batty, M. & Xie, Y., 1999, “Self-organized Criticality and Urban Development”, in Discrete Dynamics
in Nature and Society, (author’s proof copy), Amsterdam, OPA (Overseas Publishers Association).
Beauregard, R., 1986, “The chaos and complexity of gentrification”, in Smith, N. & Williams, P. (eds), 1986a, Gentrification of the City, London, Unwin Hyman Ltd..
Bentley, J., 1997, East of the City—the London Docklands Story, London, Pavilion Books Ltd.
References 1

Berry, B.J.L. & Kim, H., 1996, “Long Waves 1790–1990: Intermittency, Chaos and Control” in Kiel,
L.D. & Elliott, E.W. (eds), 1996, Chaos theory in the social sciences: foundations and applications,
Michigan, University of Michigan Press.
Bijker, W., 1997, Of Bicycles, Bakelites and Bulbs—Toward a Theory of Sociotechnical Change,
Cambridge, Massachusets, The MIT Press.
Bird, R.J., 1997, “Chaos and Social Reality: an emergent perspective” in Eve, R.A., Horsfall, S., & Lee,
M.E. (eds), 1997, Chaos, Complexity and Sociology—Myths, Models and Theories, London, Sage
Publications Ltd.
Brown, T., 1996, “Nonlinear Politics” in Kiel, L.D. & Elliott, E.W. (eds), 1996, Chaos theory in the
social sciences: foundations and applications, Michigan, University of Michigan Press.
Brownill, S., 1990, Developing London’s Docklands—another great planning disaster?, London, Paul
Chapman Publishing Ltd..
Bumpus, J., 1997, “The First Question is ‘Why?’” pp. 46–47 in Royal Academy Magazine, No.56,
Autumn 1997,London, Royal Academy.
Butler, T., 1996, “People Like Us” in Butler, T., & Rustin, M. (eds) 1996, Rising in the East—the
regeneration of East London, London, Lawrence & Wishart.
Butler, T., & Rustin, M. (eds) 1996, Rising in the East—the regeneration of East London, London,
Lawrence & Wishart.
Byrne, D., 1998, Complexity Theory and the Social Sciences, London, Routledge.
Castells, M., 1996, The Rise of the Network Society, Oxford, Blackwell.
Castells, M. & Hall, P., 1994, Technopoles of the World, London, Routledge.
Casti, J., 1999, “Firm Forecast” in New Scientist, 24th April 1999, pp.42–46, London, Reed Business
Information.
Chakrabarti, S., Dom, B., Kumar, S.R., Raghavan, P., Rajagopolan, S., Tomkins, A., Kleinberg, J.M.,
& Gibson, D., 1998, “Hypersearching the Web” in Scientific American, June 1999, pp.44–52, New
York, Scientific American Inc..
Coldstream, W., (chairman) 1960, Final Report of the National Advisory Council on Art Education
1960, London, HMSO.
Cox, J., 1994, London’s East End—life and traditions, London Weidenfeld & Nicolson.
Davies, A., 1990, The East End Nobody Knows, London, Macmillan.
Day, R. & Chen, P. (eds) 1993, Nonlinear Dynamics and Evolutionary Economics, Oxford, Oxford
University Press.
Dendrinos, D.S., 1996, “Cities as Spatial Chaotic Attractors” in Kiel, L.D. & Elliott, E.W. (eds), 1996,
Chaos theory in the social sciences: foundations and applications, Michigan, University of Michigan
Press.
DiMaggio, P.J., 1986, “Support for the Arts from Independent Foundations” in DiMaggio, P.J. (ed),
1986, Nonprofit Enterprise in the Arts—Studies in Mission and Constraint, New York & Oxford, Oxford
University Press.
DiMaggio, P.J., 1992, “Nadel’s Paradox Revisited: Relational and Cultural Aspects of Organizational
Structure” in Norhia, N. & Eccles, R.G. (eds), 1992, Networks and Organizations: structure, form and
action, Boston Massachusets, Harvard Business School Press.
Docklands Forum, 1995, Docklands Forum 20th Anniversary Publication, London, Docklands Forum.
Dooley, K., Hamilton, P., Cherri, M., West, B., and Fisher, P., 1997, “Chaotic Behaviour in Society:
References 2

Adolescent Childbearing in Texas, 1964–1990” in Eve, R.A., Horsfall, S., & Lee, M.E. (eds), 1997, Chaos, Complexity and Sociology—Myths, Models and Theories, London, Sage Publications Ltd.
Duffin, D., 1989, “Open Studios in the East End”, p.28 in The Independent, London.
Education Statistics for the United Kingdom, 1982, Volume 3, London, HMSO.
Education Statistics for the United Kingdom, 1983, Volume 3, London, HMSO.
Education Statistics for the United Kingdom, 1984, Volume 3, London, HMSO.
Education Statistics for the United Kingdom, 1985, Volume 3, London, HMSO.
Education Statistics for the United Kingdom, 1986, Volume 3, London, HMSO.
Education Statistics for the United Kingdom, 1987, Volume 3, London, HMSO.
Education Statistics for the United Kingdom, 1988, Volume 3, London, HMSO.
Education Statistics for the United Kingdom, 1989, Volume 3, London, HMSO.
Education Statistics for the United Kingdom, 1990, Volume 3, London, HMSO.
Education Statistics for the United Kingdom, 1991, Volume 3, London, HMSO.
Education Statistics for the United Kingdom, 1992, Volume 3, London, HMSO.
Education Statistics for the United Kingdom, 1993, Volume 3, London, HMSO.
Education Statistics for the United Kingdom, 1994, Volume 3, London, HMSO.
Education Statistics for the United Kingdom, 1995, Volume 3, London, HMSO.
Eve, R.A., Horsfall, S., & Lee, M.E. (eds), 1997, Chaos, Complexity and Sociology—Myths, Models
and Theories, London, Sage Publications Ltd.
Fainstein, S., Gordon, I., & Harloe, M., 1992, Divided Cities, Oxford, Blackwell.
Fainstein, S. & Harloe, M., 1992, “London and New York in the contemporary world” in Fainstein, S., Gordon, I., & Harloe, M., 1992, Divided Cities, Oxford, Blackwell.
Farrell, J., 1990, “The German Community in 19th Century East London” in The East London Record No.13, 1990, pp.2–8, Journal of the East London History Society.
Forshaw, J.H., & Abercrombie, P., 1943, County of London Plan, London, Macmillan & Co. (out of print).
Freeman, C., 1995, “Formal Scientific and Technical Institutions in the National System of Innovation”, in Lundvall, B.-Å., (ed), 1995, National Systems of Innovation—Towards a Theory of Innovation and
Interactive Learning, London and New York, Pinter.
Gablik, S., 1992, The Re-enchantment of Art, London, Thames and Hudson.
Galaskeiwicz, J., 1979, Exchange Networks and Community Politics, London, Sage Publications.
Gardner, H., 1990, Art education and human development, Santa Monica, California, J. Paul Getty Trust.
Gell-Mann, M., 1994, The Quark and the Jaguar: adventures in the simple and the complex, London, Little, Brown and Company.
Gelsing, L., 1995, “Innovation and the development of industrial networks” in Lundvall, B.-Å., (ed.), 1995, National Systems of Innovation—Towards a Theory of Innovation and Interactive Learning, London and New York, Pinter.
Glaister, D., 1996, “Artists create Left bank in the East of London”, Article in The Guardian, July 10th 1996, London, The Guardian.
References 3

Glaser, B. & Strauss, A.L., 1967, The Discovery of Grounded Theory, Chicago, Aldine Publishing Co.
Glass, R., 1964, London: Aspects of Change, London, Centre for Urban Studies/MacGibbon and Kee.
Gleick, J., 1988, Chaos—making a new science, London, Penguin.
Goodman, L.A., 1961, “Snowball Sampling” in Annals of Mathematical Statistics 32, pp.148-170.
Gould, S.J., 1977, “Racist Arguments and IQ” in Ever Since Darwin, London, Penguin Books.
Gould, S.J., 1996, “A Humongous Fungus Among Us” in Dinosaur in a Haystack, London, Jonathan
Cape.
Green, N., 1998, Art, Culture and Complexity in London's East End, Paper presented at City & Culture
’98 Conference, Stockholm.
Green, N., 1999, “Art and Complexity in London’s East End”, in Complexity vol.4, no.6, July/August
1999, pp.14–21, New York, John Wiley/Santa Fe Institute.
Guardian, 1992a, Art for Sale, April 1992, London, The Guardian.
Guardian, 1992b, Art for Sale, July 1992, London, The Guardian.
Guardian, 1992c, Art for Sale, November 1992, London, The Guardian.
Hackney, London Borough of, 1995, Public Art Strategy, Executive Strategy, London, London Borough
of Hackney.
Hall, P. G., 1962, The Industries of London since 1861, London, Hutchinson and Co..
Hall, P., 1963, London 2000, London, Faber and Faber.
Hall, P., 1988, Cities of Tomorrow, Oxford, Blackwell.
Hall, P., 1998, Cities in Civilization—Culture, Innovation & Urban Order, London, Wiedenfeld &
Nicolson.
Harvey, D.L. & Reed, M., 1996, “Social Science as the Study of Complex Systems” in Kiel, L.D. &
Elliott, E.W. (eds), 1996, Chaos theory in the social sciences: foundations/applications, Michigan,
University of Michigan Press.
Hewison, R., 1986, Too Much: art and society in the sixties: 1960–1975, London, Methuen London
Ltd..
Hewison, R., 1995, Culture and Consensus—England, art and politics since 1940, London, Methuen.
Holland, J.H., 1995, Hidden Order: how adaptation builds complexity, Reading Massachusetts, Helix
Books.
Honey, S., Heron, P. & Jackson, C., 1997, Career Paths of Visual Artists, London, Arts Council of
England.
Horsfall, S. and Maret, E., 1997 “Short-Term Changes in the Domestic Division of Labor: Intimations
of Complexity” in Eve, R.A., Horsfall, S., & Lee, M.E. (eds), 1997, Chaos, Complexity and Sociology—Myths, Models and Theories, London, Sage Publications Ltd.
Jacobs, J., 1977, Stateville: The Penitentiary in Mass Society, Chicago, University of Chicago Press.
Kandinsky, W., 1914, Über das Geistige in der Kunst, published in a new English edition as Concerning the Spiritual in Art, 1977, New York, Dover Publications, Inc..
Kauffman, S., 1995, At Home in the Universe: the search for the laws of complexity, London, Penguin
Books.
Kiel, L.D. & Elliott, E.W. (eds), 1996, Chaos theory in the social sciences: foundations and applications,
Michigan, University of Michigan Press.
References 4

Kudielka, R., 1992, Bridget Riley, Paintings 1982–1992, Nürnberg, Verlag für Kunst Nürnberg & London, South Bank Centre.
Lambirth, R., 1997, “Eat Up” pp. 48–49 in Royal Academy Magazine, No.56, Autumn 1997,London, Royal Academy.
Landry, C., 2000, The Creative City, London, Earthscan Publications.
Landry, C. & Bianchini, F., 1995, The Creative City, London, Demos/Comedia.
Latour, B., 1987, Science in Action: how to follow scientists and engineers through society, Milton Keynes, Open University Press.
Latour, B., 1997, in Finn Olsen “Om aktor-netvaerksteroi. Nogle fa afklaringer og mere end nogle fa forvikinger”, Philsophia, (Danish philosophy journal), vol. 25, n°3 et 4, pp. 47-64. [translation at http://www.keele.ac.uk]
Latour, B. & Woolgar, S., 1986, Laboratory Life: the construction of scientific facts, Princeton, Princeton University Press.
Lennon, J. & McCartney, P., 1965, “In My Life”, from Rubber Soul, side 2, track 4, London, Parlophone Records.
Lewin, R. & Regine, B., 1998, “Mastering the Game”, New Scientist, 26th September 1998, pp.39–42, London, Reed Business Information.
London Arts Board, 1996, The Arts and Cultural Industries in the London Economy, London, London Arts Board.
London County Council, 1951, Administrative County of London Development Plan 1951, Analysis, London, LCC (out of print).
Lorenz, K.B., 1950, The Comparative Method in Studying Innate Behaviour Patterns, Symposia for the Society of Experimental Biology 4:221–268.
Lundgren, A., 1995, Technological innovation and network evolution, London & New York, Routledge.
Lundvall, B.-Å., (ed.), 1995, National Systems of Innovation—Towards a Theory of Innovation and
Interactive Learning, London and New York, Pinter.
Lynton, N., 1989, The Story of Modern Art, (2nd edition), Oxford, Phaidon.
MacRitchie, L., 1996, “AIR and SPACE” in Art Monthly, London.
Market Tracking International, 1997, The British Art Market 1997—A Study of the Value of the Art and
Antique Market in Britain and the Implications of EU Harmonisation of Import VAT and Artist Resale
Rights, London, British Art Market Federation.
Miles, M., 1989, Art for Public Places, Winchester, UK, Winchester Press.
Mills, M., 1995, “Docklands Forum—the first 20 years” in Docklands Forum, 1995.
Moye, A., 1979, The LCC’s Reconstruction of Stepney and Poplar 1945-1965, Planning Studies No. 5, Polytechnic of Central London, School of Environment Planning Unit, London, PCL.
Mumford, L., 1938, The Culture of Cities, New York, Secker & Warburg.
Munby, D.L., 1951, Industry and Planning in Stepney, London, Oxford University Press.
Murdoch, J., 1997, “Inhuman/nonhuman/human: actor-network theory and the prospects for a nondualistic and symmetrical perspective on nature and society” in Environment and Planning D, vol. 15, pp.731–756, London, Pion Ltd..
Norhia, N. & Eccles, R.G. (eds), 1992, Networks and Organizations: structure, form and action, Boston Massachusets, Harvard Business School Press.
References 5

O’Brien, J. & Feist, A., 1995, Employment in the arts and cultural industries: an analysis of the 1991
census, London, Arts Council of England.
Packer, W., “Artists experience their 24 hours of fame”, in the Financial Times, July 18th 1995, London,
Financial Times.
Paley, M., 1998, Information sheet for Interim Art Gallery, London, Interim Art Gallery.
Pearman, H., 1997, “Revival tactics”, in The Sunday Times (Architecture section), 16th November 1997,
London, Times Newspapers.
Pile, S., 1996, “Left Bank, East End”, article in The Daily Telegraph, 20th July 1996, London, The
Daily Telegraph.
Powell, W. & DiMaggio, P.J., (eds), 1991, The New Institutionalism in Organisational Analysis,
Chicago and London, The University of Chicago Press.
Poynter, G., 1996, “Manufacturing in East London” in Butler, T., & Rustin, M. (eds), 1996, Rising in
the East—the regeneration of East London, London, Lawrence & Wishart.
Pratt, A.C., 1997a, “The Emerging Shape and Form of Innovation Networks” in Simmie, J. (ed), 1997,
Innovation, Networks and Learning Regions?, London, Jessica Kingsley Publishers Ltd..
Pratt, A.C., 1997b, The Cultural Industries Sector: its definition and character from secondary sources on
employment and trade, Britain 1984–91, July 1997, Research Papers in Environmental and Spatial
Analysis No.41, Department of Geography and Environment, London School of Economics.
Pretlove, J., 1997, “East side story” in the Guardian (Style section), September 3rd 1997, London, the
Guardian.
Prigogine, I. & Stengers, I., 1984, Order out of Chaos: man’s New Dialogue with Nature, London,
Heinemann.
Pudney, J., 1975, London’s Docklands, London, Thames & Hudson.
Raimes A. & Ryan, A., 2000, Regeneration and the Premises Crises (finding the space for art), report of
“Your Forum” conference, 19th July 2000, London, Vision in Art.
Reed, M & Harvey, D.L., 1996, ‘“Social science as the study of complex systems” in Kiel, L.D. &
Elliott, E.W. (eds), 1996, Chaos theory in the social sciences: foundations and applications, Michigan,
University of Michigan Press.
Richards, D., 1996, “From Individuals to Groups: The Aggregation of Votes and Chaotic Dynamics” in
Kiel, L.D. & Elliott, E.W. (eds), 1996, Chaos theory in the social sciences: foundations and applications,
Michigan, University of Michigan Press.
RICS, 1999, The UK Property Cycle—a History from 1921 to 1997, London, Royal Institution of
Chartered Surveyors.
Ridley, M., 1996, Evolution, (2nd ed.), Oxford, Blackwell.
Robinson, G.M., 1998, Methods and Techniques in Human Geography, Chichester, John Wiley & Sons.
Ruelle, D., 1997, “Chaos, Predictability and Idealization in Physics”, in Complexity, vol.3, no.1,
September/October 1997, pp.26–28, New York, John Wiley and Co..
Santa Fe Institute, 1997, Santa Fe Institute's Internet Site, http://www.santafe.edu.
Saxenian, A., 1994, Regional Advantage, Cambridge Mass., Harvard Press
Savitch, H., 1988, Post-Industrial Cities: Politics and Planning in New York, Paris and London,
Princeton University Press, Chichester.
Schmandt, H.J., & Bloomberg, W., (eds), 1969, The Quality of Urban Life, Vol 3 Urban Affairs Annual
Review, Beverly Hills CA, Sage Publications Inc.
References 6

Sex Pistols, 1976, Anarchy in the UK, London, EMI Records.
Sheppard, H., 1997, “London Docklands—we’re talking about my regeneration” in Planning, June 13th
1997, London, Planning Publications Ltd.
Shone, R., 1997, Sensation: Young British Artists from the Saatchi Collection, London, Royal
Academy/Thames and Hudson.
Simmie, J. (ed.), 1997, Innovation, Networks and Learning Regions?, London, Jessica Kingsley
Publishers Ltd..
Singh, J.V., Tucker, D.J., & Meinhard, A.G., 1991, “Institutional Change and Ecological Dynamics” in
Powell, W. & DiMaggio, P.J., (eds), 1991, The New Institutionalism in Organisational Analysis,
Chicago and London, The University of Chicago Press.
Sladen, M., 1997, “Brit Pack” pp. 39–45 in Royal Academy Magazine, No.56, Autumn 1997,London,
Royal Academy.
Smith, N., 1986, “Gentrification, the frontier, and the restructuring of urban space” pp.15–34 in Smith &
Williams (eds), 1986a, Gentrification of the City,. London, Unwin Hyman Ltd..
Smith, N. & Williams, P. (ed.), 1986a, Gentrification of the City, London, Unwin Hyman Ltd..
Smith, N. & Williams, P. (eds), 1986b, “Alternatives to orthodoxy: invitation to a debate” in Smith, N.
& Williams, P. (eds.), 1986a, Gentrification of the City, London, Unwin Hyman Ltd..
Sorensen, E., 1996, “The LDDC at 15 Years Old”, seminar given at University College London, 26th
November 1996 (unpublished).
SPACE, 1970, Film in which the founding artists of SPACE are shown working, and talk about St.
Katharine’s Dock, London, SPACE. (shown at the “Creative Quarters” exhibition, Museum of London,
London, March 2001).
SPACE, 1975, “Directory of Artists, Space Open Studios, London, 1975”, London, SPACE.
SPACE/Acme, 1975, “Help Yourself to Studio Space”, London, SPACE/Acme.
Stangos, N. (ed.), 1981, Concepts of Modern Art, (revised edition), London, Thames & Hudson.
Stewart, I., 1998, “Pulling Power”, in New Scientist, 28th November 1998, No. 2162, pp.38–41,
London, Reed Business Information.
Strauss, A.L., 1987, Qualitative Analysis for Social Scientists, Cambridge, Cambridge University Press.
Sykes, J.B. (ed.), 1982, The Concise Oxford Dictionary of Current English (7th edition), Oxford,
Clarendon Press.
Statistics of Educatation, 1964, Volume 3, London, HMSO.
Statistics of Educatation, 1965, Volume 3, London, HMSO.
Statistics of Educatation, 1966, Volume 3, London, HMSO.
Statistics of Educatation, 1967, Volume 3, London, HMSO.
Statistics of Educatation, 1968, Volume 3, London, HMSO.
Statistics of Educatation, 1969, Volume 3, London, HMSO.
Statistics of Educatation, 1970, Volume 3, London, HMSO.
Statistics of Educatation, 1971, Volume 3, London, HMSO.
Statistics of Educatation, 1972, Volume 3, London, HMSO.
Statistics of Educatation, 1973, Volume 3, London, HMSO.
References 7

Statistics of Educatation, 1974, Volume 3, London, HMSO.
Statistics of Educatation, 1975, Volume 3, London, HMSO.
Statistics of Educatation, 1976, Volume 3, London, HMSO.
Statistics of Educatation, 1977, Volume 3, London, HMSO.
Statistics of Educatation, 1978, Volume 3, London, HMSO.
Taine, H., 1889, Lectures in Art, 2nd series, (translator not stated), New York, Henry Holt and Co..
Taine, H., 1865, Philosophie de l’Art, (revised by HT, translated from the French by JD), London, H.
Baillière.
Tennant, N., 1998, London’s Future Housing Provision: meeting the capital’s housing requirements up
to 2016, Unpublished MPhil thesis, London, University College London.
Thorncroft, A., 1995a, “Now for something completely different—please”, in the Financial Times, April
7th 1995, London, Financial Times.
Thorncroft, A., 1995b, “How to Spend It”, in the Financial Times, September 9th 1995, London,
Financial Times.
Törnqvist, G., 1983, “Creativity and the Renewal of Regional Life”, in Buttimer, A. (ed), Creativity and
Context: A Seminar Report (Lund S tudies in Geography, Series B. Human Geography, No. 50), 91–112.
Lund: Gleerup.
Tower Hamlets, 1996, Tower Hamlets Art Directory 1996, London Borough of Tower Hamlets
Urban Cultures Ltd, 1994, Prospects and Planning Requirements of the Creative Industries in London,
London, London Planning Advisory Committee.
Waddell, H., 1989, London Art and Artists Guide, (5th edition), London, A & C Black.
Waddell, H., 1993, London Art and Artists Guide, (6th edition), London, London Art and Artists Guide.
Waldrop, M., 1992, Complexity—the emerging science at the edge of order and chaos, London, Penguin.
Walters, G., 1996, “State of the Art”, article in The Times magazine, 20th July 1996, London, The
Times.
Ward, R., 1995, “Docklands Redevelopment—Dream or Disaster?”, in Docklands Forum, 1995,
Docklands Forum 20th Anniversary Publication, London, Docklands Forum.
Wasserman, S. & Faust, K., 1997, Social Network Analysis—methods and applications, Cambridge,
Cambridge University Press.
Wedd, K. with Peltz, L, & Ross, C., 2001, Creative Quarters—The Art World in London from 1700 to
2000, Museum of london exhibition catalogue, London, Museum of London.
Weinreb, B. & Hibbert, C., (eds.) 1983, The London Encyclopaedia, London, Macmillan.
Whitechapel Art Gallery, 1990, Open Studios Catalogue, London, Whitechapel Art Gallery.
Whitechapel Art Gallery, 1992, Open Studios Catalogue, London, Whitechapel Art Gallery.
Whitechapel Art Gallery, 1994, Open Studios Catalogue, London, Whitechapel Art Gallery.
Whitechapel Art Gallery, 1996, Open Studios Catalogue, London, Whitechapel Art Gallery.
Whitechapel Art Gallery, 1998, Open Studios Catalogue, London, Whitechapel Art Gallery.
White chapel Art Gallery, 1995, I Can Do That!, London, Whitechapel Art Gallery
Whyte, W.F., 1984, Learning from the field: a guide from experience, London, SAGE PublicationsLtd.
References 8

Williams, P. & Smith, N., 1986, “From ‘renaissance’ to restructuring: the dynamics of contemporary
urban redevelopment” in Smith, N. & Williams, P. (eds), 1986a, Gentrification of the City, London,
Unwin Hyman Ltd..
Wilson, A., 2001, “Wanted: Studio Space”, pp.8–12 in Art Monthly, May 2001, No.246, London,
Brittania Art Publications Ltd..
Wolcott, H.F., 1982, “Differing styles of on-site research, or, ‘If it isn’t ethnography, what is it?’”, in
The Review Journal of Philosophy and Social Science, 7(1&2), 154–159.
Wolcott, H.F., 1995, The Art of Fieldwork, London, SAGE Publications.
Xie, Y. & Batty, M., 1997, “Automata-Based Exploration of Emergent Urban Form” in Geographical
Systems, Vol.4, pp.83–102, Amsterdam, OPA (Overseas Publishers Association).
Young, K., 1977, Implementing an Urban Strategy: the case of public housing in metropolitan London,
Canterbury, Urban and Regional Studies Unit, University of Kent.
Young, K. & Kramer, J., 1978, Strategy and Conflict in Metropolitan Housing—Suburbia versus the
Greater London Council 1965–75, London, Heinemann.
Young, K., & Mills, L., 1980, Public Policy Research: a review of qualitative methods, University of
Bristol, School for Advanced Urban Studies.
Young, M and Willmott, P., 1962, Family and Kinship in East London, (revised edition), London,
Penguin.
Zukin, S., 1982, Loft Living: culture and capital in urban change, New York, John Hopkins University
Press.
References 9

References to Interviews (all interviews were face-to-face and tape recorded unless otherwise stated).
Studios
Acme Housing Association, November 1997
Jonathan Harvey, David Panton (Founders, Directors)
Balls Pond Studios, March 1999 (not taped)
Kate Malone (Founder/Director)
Barbican Arts Group, March, 1998
Mark Wainwright (Studio Manager)
Bow Arts Trust, April 1998
Marcel Baettig (Director), Ruth Catlow (Education Officer)
Cable Street Studios, March 1999
Michael Cubey (Director)
Chisenhale Studios, December 1997
Helen Ridge (Studio Manager)
Maurice Agis, August 1998
Co-Founder, Butlers Wharf Studios & Chisenhale Studios
City Studios, November 1998
Magnus Irvin (Founder/Director)
Fawe Street Studios, February 1998
Ken Oliver (Co-founder)
Florence Trust, February 1999
Rob Macintosh (Studio Manager)
Maryland Studios, March 1999
Lucy Lefeuvre (Artist)
Red Door Studios, July 1998
Kwai Lau (Co-founder/Administrator)
Southgate Studio, February 1999
Adrian Hemming/Adam Gray (Co-founders/directors)
SPACE Studios, December 1997
Martin Frost (ex-Director), Fiona Furness (Studio Manager)
SPACE Studios, 1999 (informal interview, not taped)
Charlotte Robinson, (Director)
Bridget Riley, March 1998 (interview not taped, transcript checked by Bridget Riley)
Co-Founder, SPACE Studios
Standpoint Studios, March 1998
Graham Bignell (Founder, Director)
Wharf Studios, March 1999
Rob Olin/Cecilia Vargas (Co-founders)
Local Authorities
L. B. of Tower Hamlets, November 1997
Brian Oakaby (Arts Officer)
Galleries
Art for Offices, July 1998
Andrew Hutchinson (Founder/Director)
Cable Street Gallery, March 1999
Michael Cubey (Founder/Director)
Camerawork Gallery, March 1999
Joe Harper (Director)
Chisenhale Gallery, February 1999
Sue Jones (Gallery Manager)
Enid Lawson Gallery, May 2001 (informal tlelphone interview)
Richard Ingrams
Lamont Gallery, July 1998
Katherine Shearn (Gallery Manager)
References 10

Matt's Gallery, August 1998
Robin Klassnik (Founder/Director)
Graham Paton Gallery, July 1998 (telephone interview)
Graham Paton (Director)
Whitechapel Art Gallery, August 1998
Catherine Lampert (Director)
Independent Arts Organisations
Free Form Arts Trust, December 1997
Martin Goodrich (Founder/Director)
National Artists’ Association, February 1999
Ann Jones
Vision in Art (various, 1997–2000: involved with organisation, so continuous contact)
Aileen Ryan (Founder/Director)
Auction Houses
Bonham’s, May 2001 (informal telephone interview)
Emily Gray, Administrator of Modern Pictures
Phillips, May 2001 (informal telephone interview)
James Ulph, Head of Impressionism and Modern Art
Sotheby’s, May 2001 (informal telephone interview)
Lisa Furnell, Office Manager, Contemporary Art Department
References 11

APPENDIX ONE
QUESTIONNAIRES
Questionnaire for Studio Organisations
1. History and Philosophy of the Organisation. Can you tell me about the history of
the organisation, and the underlying philosophies which inform its aims and objectives?
2. Structure and Administration of the Organisation. Can you tell me about the
structure and administration of your organisation?
Number of studios; number of artists; tenure times; rental values; management of the
organisation; does the organisation have charitable status; if so, on what basis?
3. Linkages with other organisations. For each organisation with which you have
linkages, please enumerate the the strength of the linkage according to the following scale,
and then describe the nature of that organisation?
0 Unaware of existence of that organisation, or, if aware, negligible contact, and no
perceived need to initiate a relationship;
1 Aware of existence of organisation, minimal contact, but no working relationship as
such;
2 Positive working relationship, but intermittent or sporadic contact, probably not long-
established, but felt to have the potential to develop;
3 As 2 but: contact is regular but infrequent. Relationship has developed from stage 2,
and is perceived as an integral part of the organisation's longer-term programme of
activities;
4 As 3 but: contact is now frequent; the relationship has been relatively long-established;
5 As 4 but: the professional relationship is of sufficient strength to have a significant
social element.
Other organisations includes studio blocks/groups; local authorities; schools; funding
bodies; artists' associations.
4. General. What is your prognosis for the arts scene in the East End over the next five
to ten years?
Is there anything you would like to add?
Appendix One – Questionnaires 1

Questionnaire for Art Galleries/Dealers
Name
Do you wish to remain anonymous? Y/N
For how long have you been established at this address?
Where (if anywhere) were you based before?
Why did you open up in this area?
Do you live in the East End? If so, where?
What, if anything, makes the East End special for you?
Why do you think so many artists live in the East End?
Do the artists you represent live and work locally?
When did you start to deal in art?
Did you start with contemporary art?
As far as sales go, do you find buyers are from the local area, or elsewhere?
Do serious collectors visit the East End?
What range do your prices cover?
Do you frame and mount pictures and photographs, posters etc.?
Do you know of places e.g. pub,s cafes, where artists or dealers meet one another? Where?
How often do you go there? (days per week).
Roughly how many artists do you know? 0-5; 5-10; 10-20; >20.
Roughly how many dealers do you know? 0-5; 5-10; 10-20; >20.
Are you involved in any schemes with schools, community projects etc.?
Could you tell me about them?
What do gain from involvement in such schemes?
For how long have you been involved in such schemes?
Do you think there has been any benefit to the local community derived from the East
End's artistic community?
What do you think locals think of the artists and galleries?
Do you think that artists and art dealers are welcomed by the local community?
Do you think that the local authority has a role to play in the visual arts?
Y: Can you describe that role?
No: Why not?
Is there anything you would like to add?
Appendix One – Questionnaires 2

APPENDIX TWOSocial Network Analysis
A2.1 Introduction
Social network analysis has its origins in the 1930s, with the development of sociometry—the
study of inter-personal relationships in social groups—and the invention of the sociogram—a
graphical depiction of those relationships. Recognition of the usefulness of such devices spurred
the further development of analytical techniques which became increasingly mathematical dur-
ing the 1940s and 1950s. These developments drove and were in turn driven by theoretical con-
siderations, through which further insights into the dynamics of social groups were sought. The
three mathematical cornerstones of social network theory are graph theory, statistical and prob-
ability theory and algebraic models, which between them offer a “precise way to define impor-
tant social concepts, a theoretical alternative to the assumption of independent social actors, and
a framework for testing theories about structured social relationships” (Wasserman & Faust,
1997:10–17). This appendix describes social network analysis through the use of illustrative ex-
amples drawn from the East End such as the networks amongst artists. These examples will,
through their familiarity, be easier to understand when discussed in terms of reality rather than
illustrative examples. This appendix describes just the basic concepts. Technical terms are itali-
cised when first used, but not subsequently.
A2.2 Basic Terms and Concepts
Social Network Analysis provides a relatively simple way of understanding a range of more or
less complex relationships between people, organisations and so forth, known as actors. Rela-
tionships between pairs of actors can be be clearly defined, and by analysing a series of these
relationships, and then representing them either graphically—when actors are referred to as
nodes—or in the form of a matrix, the mechanics of a network can be understood and explained
(Wasserman & Faust, 1997).
Actors need not be capable of acting on their own volition, in the sense that an actor could
comprise people in a group, companies or nation states (ibid:17). A group of actors is known as
a network and a group of actors of the same type—self-employed artists for example—is known
as a one-mode network (ibid). A two-mode network might be the relationship between artists
and art dealers, while multi-mode networks also exist, although social network methods for
such complicated structures are rare (ibid:35).
Social ties link actors to one another, and these can take on a variety of different guises;
friendship, business relationships, club membership, physical connections such as a road or a
bridge, or kinship for example (ibid:18). A collection of ties, for example friendships, is called a
relation (ibid:20). A relational tie can either be directional or non-directional, and either di-
chotomous or valued (ibid:44). A directional tie exists where an artist sells paintings to a dealer,
and that dealer buys paintings from an artist, while a non-directional exists where an artist
Appendix Two—Social Network Analysis 1

shares a studio with another artist. A dichotomous tie either does, or does not exist—for exam-
ple our artist either does or does not sell paintings to a particular dealer. A valued relation some-
how quantifies the relation, either in terms of strength, intensity or frequency of the tie between
the actors (ibid:45). The number of paintings sold to a dealer each year is an example of a val-
ued relation. So too is how much that dealer likes each of their artists’ work.
The basic unit of social network analysis is the dyad—two actors linked by a tie, or ties
(ibid). The triad, consisting of three actors and the associated ties is also used. This is more
complex. For example, actor i is linked to actor j, and actor j is linked to actor k. Actor k is in
turn linked to i via j (ibid:19). A collection of dyads, all interlinked, is known as a sub-group,
and the collection of all actors with ties to be measured is known as the group (ibid:20). The
“social network consists of a finite set of actors and the relation or relations defined on them”
(ibid:20).
A2.3 The General Structure of the Network
The model in figure A2.1 below is hypothetical, but serves to demonstrate how combinations of
dyads can be be put together to form a network. The graph is a simple graph since it has only
one line between each pair of nodes. Each node either is, or is not linked to another, so each re-
lation is dichotomous—the actors either do, or do not communicate with each other. Each rela-
tion is also non-directional, since communication is assumed here to be a two-way process.
The shortest path between two nodes is the geodesic and the longest of these is two (ties).
The matrix expresses the same network mathematically rather than graphically. A tie is indi-
cated by a 1, no tie by a 0. The matrix in figure A2.1 is symmetrical, which shows that the link-
ages are non-directional. Each form of representation has advantages and disadvantages. The
graph has the virtues of being relatively easy to read, even if the information it presents is rela-
Appendix Two—Social Network Analysis 2
n1 Schools
n2 Community Arts Group
n1n3
n2
n4
POTENTIAL COMMUNICATIONS BETWEEN ACTORS
n3 Local Authority
n4 Self-employed artists
n1 n2 n3 n4
n1 - 1 1 0
n2 1 - 1 1
n3 1 1 - 0
n4 0 1 0 -
node
tie or arc
Figure A2.1 Representation of a Network using Graph and Matrix.
dyad (ringed)

tively complex. The significant actors can be identified with relative ease, even if the reader has
only minimal, or no knowledge of social network analysis. The graph forms a useful base for at-
tempts at predicting the effects of changes to the network—questions such as “supposing you
introduced this actor to that actor?” can be asked simply by drawing a line on the graph, and the
change in the overall balance of the network can immediately be grasped at a qualitative level,
even if further calculation is required to interrogate any quantitative changes. For this reason,
graphs rather than matrices are used to present the findings of the social network analysis in the
next chapter.
In this illustrative example, node n2, Community Arts Group, appears to play a pivotal
role in the model. It is the only node connected to all the others, and serves as a
“communications short-cut”. Such a node—a cutpoint—is critical in communications networks.
Without n2, the graph has two separate components between which no communication is possi-
ble. Artists (n4) would be isolated—there would in effect be two networks.
Figure A2.2 below is a directed graph, or digraph. This example shows which actors
“consider themselves a friend of” other actors and has either one or two arcs between each pair
of nodes; the first arc shows whether nx considers ny a friend, while the second shows whether ny
considers nx a friend. Arcs are expressed as arrows which indicate the direction of the relation.
Dyads can be either mutual, indicated by a double-headed arrow, asymmetric, indicated by a
single-headed arrow, or null, indicated by no arc. Thus (n1, n2) is asymmetric, (n4, n5) is mutual
and (n2, n3) is null. Note that n2 is also a cutpoint in this graph. A node is said to be either ad-
jacent to a node if it terminates there, or adjacent from another node if it originates at that node.
Thus in figure A2.2 n5 is adjacent to n7 and adjacent from n2.
We can examine the basic structure of the social network for both graphs and digraphs in
a number of ways. We can measure the density ! of the network—the number of linkages pre-
sent compared with the maximum possible—and this will quantify the overall “connectedness”
of the network. Crudely, a low density would indicate that those in the social network have little
contact with others in the network, while a high density would indicate the opposite.
Appendix Two—Social Network Analysis 3
n1n6n5n2
n7n4n3
ni nj “considers themselves a friend of”
Figure A2.2. Example of a Directed Graph or Digraph

The nodal degree dni in a graph measures the number of linkages any one actor has with
other actors. The linkages can be either valued or unvalued: if they are valued, then a separate
figure is assigned to each node for the total value vni of its linkages.
Nodal degree of directed graphs is measured in terms of nodal indegree dI(ni)which
measures the total number of nodes adjacent to ni and nodal outdegree dO
(ni) which measures
the total number of nodes adjacent from ni. Measures of indegree and outdegree are useful
means of gauging the popularity or significance of actors to other actors in the network. Link-
ages in directed graphs can, like those in undirected graphs, be valued. Note that the values for
indegree and outdegree need not be the same. Thus in the example of figure A2.2, an actor with
a large indegree, say n5 is one who is considered by many others to be a friend, and an actor
with a large outdegree, say n2, is one who considers themselves to have many friends. Note that
indegree and outdegree need not coincide. The actor’s view of how many friends they have may
well differ from the others’ views of how many friends that actor has, and here it can readily be
seen that such information is potentially very sensitive.
Wasserman and Faust (1997:128) note that it is possible to derive four distinct types of
node in a directed graph which prove useful in describing the roles of particular nodes in a net-
work:
• Isolate if dO(ni) = dO
(ni) = 0
• Transmitter if dI(ni)= 0 and dO
(ni) > 0
• Receiver if dI(ni) > 0 and dO
(ni) = 0
• Ordinary if dI(ni) > 0 and dO
(ni) > 0
A2.4 Cohesive Sub-groups within a Network
The graph in figure A2.1 can be broken down to form sub-groups, as shown in A2.3 overleaf,
so the effects of removing n1 schools and n3 local authorities from the graph can be seen. In this
illustrative case, the removal of n1 schools from the network makes little difference to the struc-
ture of the remainder of the network, nor does the removal of n3 the local authority. However, as
we saw above, the removal of n2 community arts groups would make a difference since it this
this node which links self-employed artists to schools and the local authority. In this way, we
can begin to see the relative importance of different actors. This notion of centrality is discussed
further in section A2.5, but in this section we explore ways in which we can define sub-groups
within the network.
As the networks under examination become more complex, the sub-graphs within a graph
become important tools for understanding how particular sets of actors interact. Next, we shall
look at cohesive sub-groups within a network comprising directional relations.
One approach is to measure only those ties which are reciprocated. In effect this makes
the sociomatrix symmetrical (ibid:275). But as we shall see in the next chapter, this results in a
sparse graph which does not yield either a full or true picture, so we shall turn to methods which
Appendix Two—Social Network Analysis 4

extend the notion of cohesive sub-groups to cover directed graphs.
Peay (1980:390–391, quoted ibid) offers four increasingly strict definitions of ways in
which two nodes i, j can be connected, such that any pair of nodes which is n-connected is sepa-
rated by n arcs. Thus two nodes connected in terms of a stricter definition will also be con-
nected in terms of the weaker definitions. So two nodes are:
Weakly n-connected if they are joined by a semipath of length n or less;
Unilaterally n-connected if they are joined by a path of length n or less from i to j, or a path
of length n or less from j to i;
Strongly n-connected if there is a path of length n or less from i to j, and a path of length n
from j to i; the path from i to j may be contain different nodes and arcs than the path from j
to i;
Recursively n-connected if they are strongly n-connected, and the path from i to j uses the
same nodes and arcs as the path from j to i.
(ibid)
These four types of connectivity can form the basis for four types of cohesive subgroup within a
directed network. These cohesive subgroups are called n-cliques—“a maximal subgraph in
which the largest geodesic distance between any two nodes is no greater than n”. Formally, an
n-clique is a subgraph with node set Ns, such that
d(i, j) ! n for all n
i,nj"N
s (A2.1)
and there are no additional nodes that are also distance n or less from all nodes in the subgraph
(ibid:258). The four types of n-clique which, like the four definitions of connectivity for di-
Appendix Two—Social Network Analysis 5
n3
n2
n4
n1
n2
n4
Figure A2.3. Sub-groups of fig. A2.1.

rected graphs, become increasingly strict, can be described thus:
A weakly-connected n-clique is a subgraph in which all nodes are weakly n-connected, and
there are no additional nodes that are also weakly n-connected to all nodes in the subgraph.
A unilaterally connected n-clique is a subgraph in which all nodes are unilaterally n-con-
nected, and there are no additional nodes that are also unilaterally n-connected to all nodes in
the subgraph.
A strongly-connected n-clique is a subgraph in which all nodes are strongly n-connected, and
there are no additional nodes that are also strongly n-connected to all nodes in the subgraph.
A recursively connected n-clique is a subgraph in which all nodes are recursively n-con-
nected, and there are no additional nodes that are also recursively n-connected to all nodes in
the subgraph.
(ibid:276)
We can use the example of the directed graph in figure A2.2 to illustrate the different types of
cohesive subgroup in directed graphs. We shall generate lists of 2-cliques—cliques in which the
maximum number of arcs between any pair of nodes is two—for each of the four categories.
There are two weakly connected 2-cliques (n1, n2, n3) and (n2, n4, n5, n6, n7) and five uni-
laterally connected 2-cliques (n1, n2, n3), (n1, n2, n5), (n2, n4, n5), (n2, n5, n6) and(n4, n5, n6), but no
strongly or recursively connected 2-cliques, illustrated in figures A2.4 and .A2.5 overleaf. This
indicates that the network is not very cohesive.
A2.5 Centrality and Prestige within a Network
The identification of actors which are in some way “important” or “significant” is a key use of
social network analysis (Wasserman & Faust, 1997:169). In this section we shall explore the
ways in which actors’ centrality and prestige within a directed network can be measured. Was-
serman and Faust (1997:202) recommend that just two centrality indices are used when study-
ing directed networks, those for degree and closeness. Each will be looked at in turn.
Actor-level indices for centrality established for degree are measured in terms of choices
made, that is the outdegree of each actor. The degrees in a graph can be summarised in this gen-
eral formula:
CD =[CD(n*) ! CD(ni)]i=1
g
"(g !1)(g ! 2)[ ]
(A2.2)
where CD
is the degree centrality index for the graph, CD
(n*) is the maximum value of the par-
Appendix Two—Social Network Analysis 6

ticular actor degree centrality index and CD(n
i) is the actor-level degree centrality index.
Equation A2.2 generates a figure between 0 and 1. The minimum value of 0 indicates
that the graph is regular, that is all degrees are equal. In other words there is no actor which is
more significant in terms of nodal degree than any other (ibid:180). The maximum value of 1
indicates that “one actor chooses all other g-1 actors, and the other actors interact only with this
one, central actor” (ibid). This index therefore also gauges the dispersal of the indices, making
the comparison between each actor index and the maximum value (ibid).
This can be augmented by calculating the variance of the degrees SD
2 of the actor de-
gree indices. This group-level index of centrality reflects the view that “centralization is synon-
ymous with the dispersion or heterogeneity of an actor index” and “attains its minimum value
of 0 when all degrees are equal or when the graph is regular” (ibid:180–181).
SD
2= (CD(ni ) !C D)
2
i=1
g
"#
$ % &
' ( / g
(A2.3)
Appendix Two—Social Network Analysis 7
n1n6n5n2
n7n4n3
ni nj
‘considers themselves a friend of’
Figure A2.5 Unilaterally connected 2-cliques in a Digraph
Cliques indicated by arrow
colour. Arrows are dou-
bled up for clarity in
some cases.
Figure A2.4. Weakly connected 2-cliques in a Digraph
n7n4n3
ni nj ‘considers themselves a friend of’ Cliques indicated by
arrow colour.
n1n2
n5 n6

The mean degree C D = DCi=1
g
! (ni) / g (A2.4)
This can be divided by g-1 which serves two functions. First, this standardises the mean degree.
Second, the average degree divided by (g-1) is precisely equivalent to the density of the graph
", where the average degree equals
DCi =1
g
! in( ) g(g #1) = " (A2.5)
The density, which varies between 0 for an empty graph and 1 for a complete graph, can be
used to measure the cohesion, or “close knittedness” of a graph (ibid). However, such measures
can be misleading, since, if actor degree remains constant, network density decreases as the size
of the graph increases (ibid:182). In this project, we shall be dealing with just one network and
one graph, so this is not a problem with which we shall need to deal.
The measurement of centrality on closeness examines how close a particular actor is to
the other actors in the network. In both nondirectional and directional graphs, actor centrality
can also be calculated in terms of the average closeness of one actor to all the other actors in the
network. Simply, this can be expressed as the inverse of the mean distance to all other actors in
the network (ibid:185, 200):
C'C (ni ) =g#1
d(ni ,nj)j =1
g
![ ]
= (g #1)CC
(ni) (A2.6)
A directed graph must be strongly connected for this index to work. If the digraph is not
strongly connected, then some {d(ni,nj)} will be infinity, rendering equation A2.6 undefined
(ibid:200).
This problem is alleviated in this project thus. Actors which are isolates are not figured
into the graph which means that it is connected. This still leaves the problem of dealing with a
graph which is not strongly connected. Here, each of the arcs between any pair of actors is as-
signed a value, 1 if the relation is recursive, 0.5 if the relation is unilateral. This means that
equation A2.6 can be applied without any of its terms being undefined. However, the price for
developing a workable closeness index for each actor is that the direction of the relation is ig-
nored. This problem is, to an extent at least, diminished by the fact that we have figures for in-
degree and outdegree for each actor, and can therefore compare these figures with the relevant
closeness indices.
Appendix Two—Social Network Analysis 8

A2.6 Glossary of Basic Terms
Basic Terms
Actors People, organisations, events etc which have relationships with one another.
Tie Link between actors
Network A group of actors.
Mode Type of actors in network. A one-mode network has one type of actor, a two-mode
network two types of actor etc.
Relation A collection of ties. These can be directional ( a likes b) or non-directional (a and
b are siblings). They can also be dichotomous (the tie either does or does not
exist), or valued (a likes b much or not much).
Dyad Two actors linked by a tie.
Triad Three actors linked by a tie.
Graph Theory
Node Representation of an actor in a graph.
Arc Representation of a tie in a graph.
Graph Graphic representation of a social network.
Geodesic The shortest path between two nodes, measured by number of ties.
Digraph (Or directed graph). Graph in which relationships are directional. Dyads can be
mutual (a tie in both directions), asymmetric (a tie in one direction) or null (no
ties).
Cutpoint A node which, if removed, would split a single graph into two separate graphs.
Notation
g(N) Total number of nodes in a network.
L(N) Total number of linkages in a network.
nid Nodal degree. The number of linkages any one actor has with other actors.
niv In a valued graph, the total value of the linkages pertaining to a particular node.
Id (ni) Indegree. The number of linkages adjacent to (terminating at) node i
Od (ni) Outdegree. The number of linkages adjacent from (originating from) node i.
! Density of a network. The number of linkages present divided by the maximum
number of linkages.
DC Mean actor degree centrality index.
D2S Variance of actor degree centrality indices.
cC ( in ) Actor-level closeness centrality index.
Appendix Two—Social Network Analysis 9

DC ( in ) Actor-level degree centrality index.
CC' ( in ) Inverse of mean distance to all other actors in the network.
DC Degree centrality index of a graph. A measure of the extent to which any actor is
more significant in terms of nodal degree than any other actor.
iR Average distance from actor i to actors reachable from actor i. An actor’s
“influence range”.
iJ Number of actors within the influence range of actor i.
Appendix Two—Social Network Analysis 10

Appendix Three – Enrolments in Arts Courses, 1963–19951
Date2 Dip. A.D3 4 Fine Art Graphic Design 3 D ArtNov. 1963, part 2, p.18 1405 680 365 180Nov. 1964, part 2, p.58 3182 1518 743 476Nov. 1965, part 2, p.64 5036 2302 1207 768Nov. 1966, part 3, p.23 5912 2559 1402 1012Nov. 1967, part 3, p.25 6205 2686 1424 1132Nov. 1968, part 3, p.29 6616 2890 1497 1234Nov. 1969, part 3, p.31 6932 2941 1624 1343Nov. 1970, part 3, p.35 7320 3201 1677 1367Nov. 1971, part 3, p.73 7104 3029 1671 1327Nov. 1972, part 3, p.78 7640 3375 1770 1421Nov. 1973, part 3, p.46 8218 3657 1888 1461
Art and Design5 Nov. 1974, part 3, p.49 10800Nov. 1975, part 3, p.29 11974Nov. 1976, part 3, p.31 12944Nov.1978, part 3, p.336 14024
Music, Drama, Art and Design7
1979/80, part 3, p.29 8 266001981/82, part 3. p.29 414001982/83, part 3, p.35 409001983/84, part 3, p.33 435001984/85, part 3, p.33 460001985/86, part 3, p.33 344009 1986/87, part 3, p.34 485001987/88, part 3, p.34 50300
Creative Arts10 1988/89, part 3, p.32 468001989/90, part 3, p.32 502001990/91, part 3, p.58 548001991/92, part 3, p.58 646001992/93, part 3, p.50 546001993/94, part 3, p.62 748001994/95, part 3, p.65 90600
1 See note in box.2 For the years 1963 to 1978, references are to Statistics of Education (usually published the following
year). For the years 1979 to 1994, references are to Education Statistics for the United Kingdom typically published in the year or two following the measurement year).
3 This covers the years 1963 to 1973, and students enrolled for full time and part time Diplomas in Art and Design in England and Wales. The first three years are the first years of the new Diploma and Art and Design proposed by the “Coldstream Report” – the rapid growth in numbers indicates increasing numbers as successive years of the course are filled.
4 The Diploma in Art had Design was broken down for statististical purposes into “Fine Art”, “Graphic Design”, “Three Dimensional Art” and “Textiles and Fashion”. The first three are the most relevant to this thesis. The reader requiring figures for “Textiles and Fashion” can derive these by adding the figures for the first three specialisations,and subtracting the sum from the total.
5 After 1973, the published figures refer to “Category 10, Art and Design”, which covers Dip AD or degree equivalent in both the new polytechnics and the universities. These are not disaggregated
6 Figures for 1977 could not be found, and appear to have been omitted.7 From 1979, category 10 covers “Music, drama, art and design”. Published figures within the category
are not disaggregated.8 Figures for 1979/80 to 1988/89 cover home and overseas students.9 Figure double-checked for accuracy.1 0 Subject Category number changed to “Category 14, Creative Arts”. From the academic year 1992/93,
this category described simply as “Creative Arts”. The published figures are not disaggregated.
Appendix Three – Enrolments in Arts Courses, 1963–1995 1
Note
As these tables show, statistics for the numbers of people studying fine art over the last three or so decades are inconsistent, becoming increasingly aggregated over time.
Figures are presented for the number of students enrolled on the course listed at the beginning of a particular academic year (ie October to September).
Statistics for the country as a whole have been garnered in preference to those from just the London colleges. Art colleges have never been the sole preserve of London, even if London is the strongest magnet for their progeny.
What these figures show above all else is that the arts as a subject became increasingly popular during the latter half of the 20th century: why that is the case is not for this thesis. Perhaps it is tied in with the culture of celebrity which has waxed since the 1960s, and which is itself based primarily in the arts?
Top Related
Copyright © 2022 FDOKUMEN

