


Bahasa
Halaman
Hukum

Financial Stability Review 20216 Dec 2021
Macroprudential Surveillance DepartmentEconomic Policy Group

Key Messages

Slide 3
Key messages: External backdrop
Global financial conditions remain
accommodative at this juncture, even as
market expectations of tighter monetary
policy have increased against a pick-up in
cost and price pressures
The global financial system has stayed
resilient over the past year despite the
undulating course of the COVID-19
pandemic
However, medium-term vulnerabilities have grown
High corporate
indebtednessIncreased sovereign debt Stretched asset valuations
Slide 4
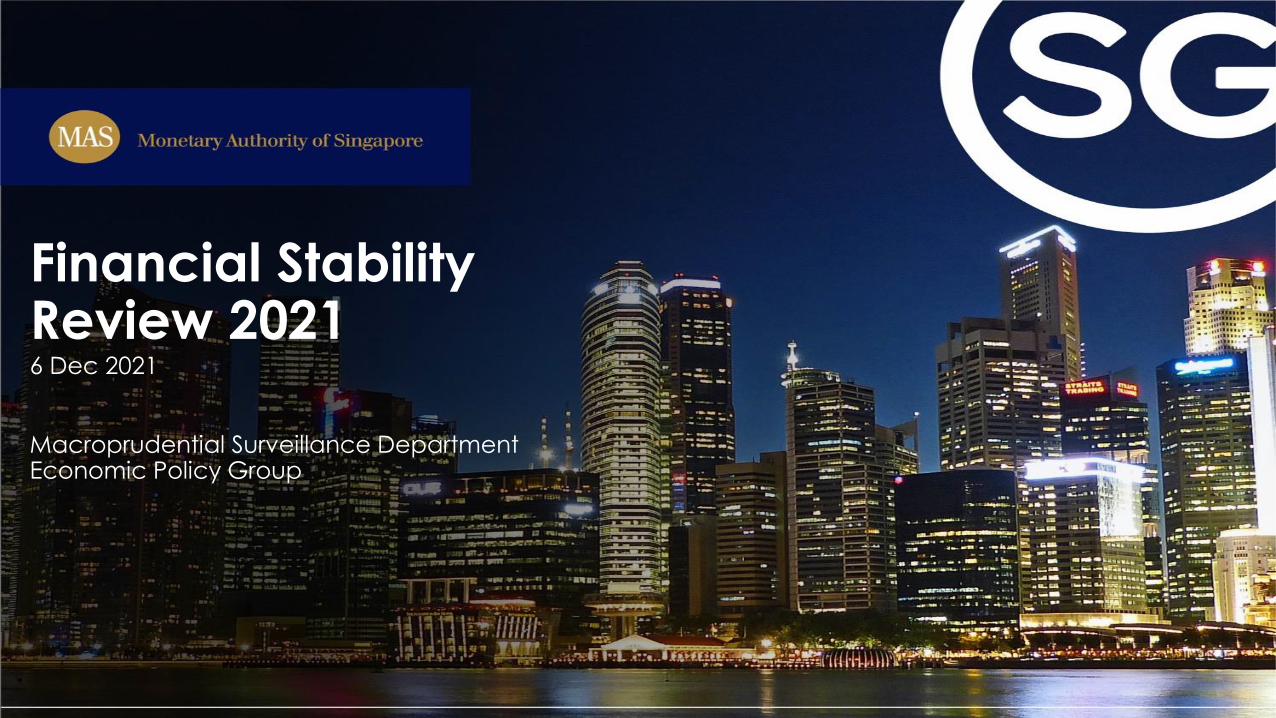
Key messages: Singapore corporates, households and financial sector
• Sectoral disparities in performance will persist
• Firms should strengthen buffers against potential further shocks
• Households should exercise prudence in taking on large, new loan commitments
• Highly leveraged households should build up financial buffers to cushion against stresses
• Banks should maintain prudent levels of provisions and strong liquidity profiles
Continued vigilance and prudence are warranted, in view of considerable downside
uncertainty from the pandemic and rising interest rates in the coming years
In Singapore, indicators of vulnerability for the corporate, household and financial sectors
have generally improved through the COVID-19 pandemic
Stress tests confirm that corporates, households and financial institutions would be well-
placed to withstand further adverse shocks
Global Financial and Economic Environment
Slide 6
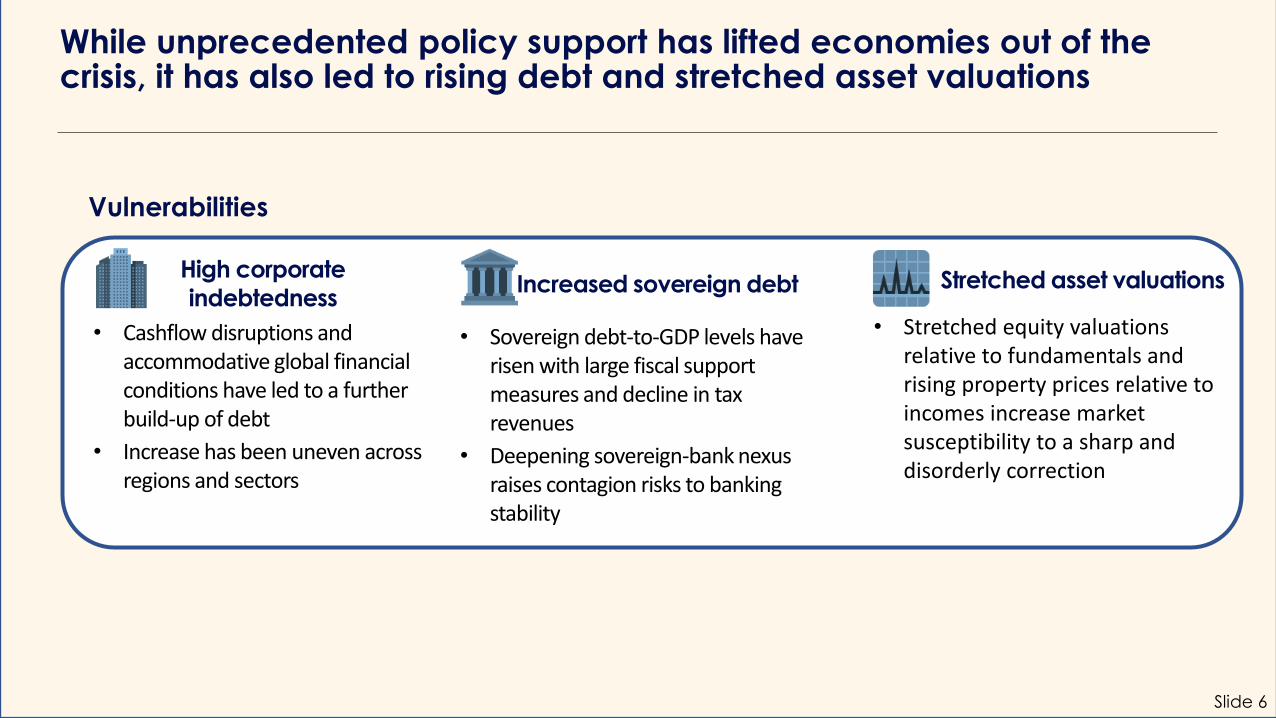
While unprecedented policy support has lifted economies out of the crisis, it has also led to rising debt and stretched asset valuations
High corporate
indebtedness
• Cashflow disruptions and accommodative global financial conditions have led to a further build-up of debt
• Increase has been uneven across regions and sectors
Increased sovereign debt
• Sovereign debt-to-GDP levels have risen with large fiscal support measures and decline in tax revenues
• Deepening sovereign-bank nexus raises contagion risks to banking stability
Stretched asset valuations
• Stretched equity valuations relative to fundamentals and rising property prices relative to incomes increase market susceptibility to a sharp and disorderly correction
Vulnerabilities
Slide 7
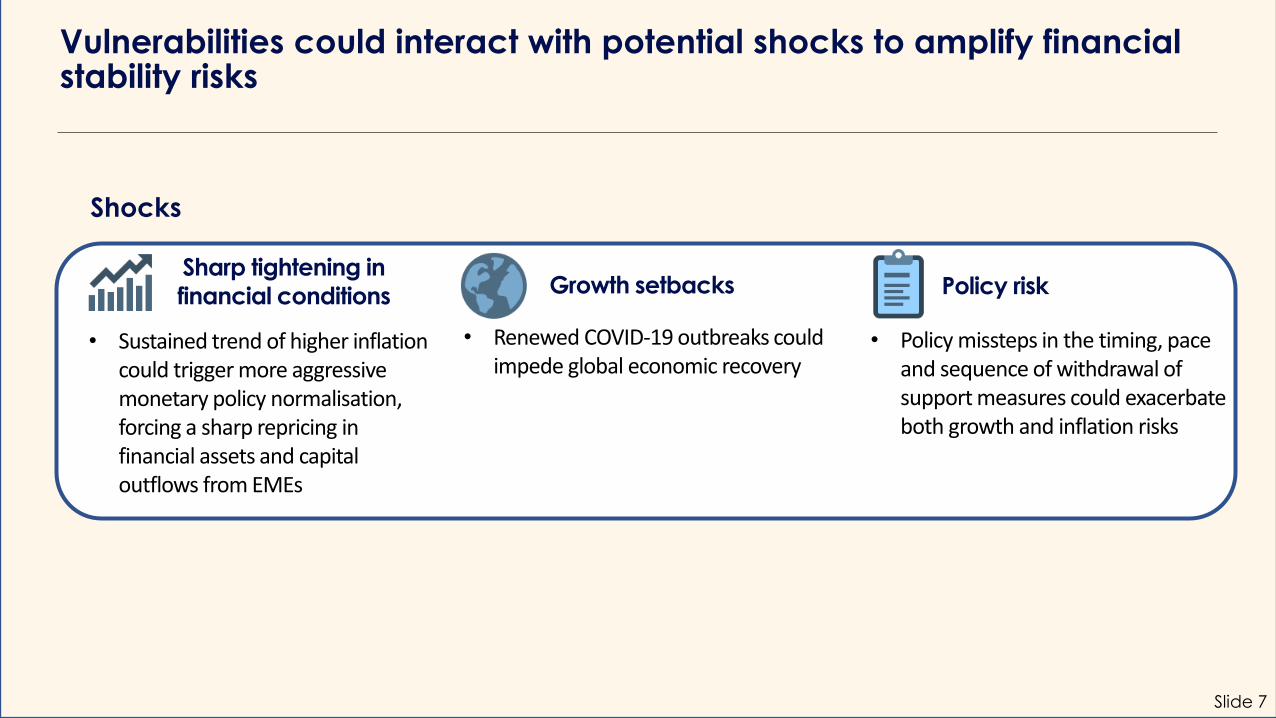
Vulnerabilities could interact with potential shocks to amplify financial stability risks
Sharp tightening in
financial conditions
• Sustained trend of higher inflation could trigger more aggressive monetary policy normalisation, forcing a sharp repricing in financial assets and capital outflows from EMEs
Growth setbacks
• Renewed COVID-19 outbreaks could impede global economic recovery
Policy risk
• Policy missteps in the timing, pace and sequence of withdrawal of support measures could exacerbate both growth and inflation risks
Shocks

Corporates, Households, and Property in Singapore
Slide 9
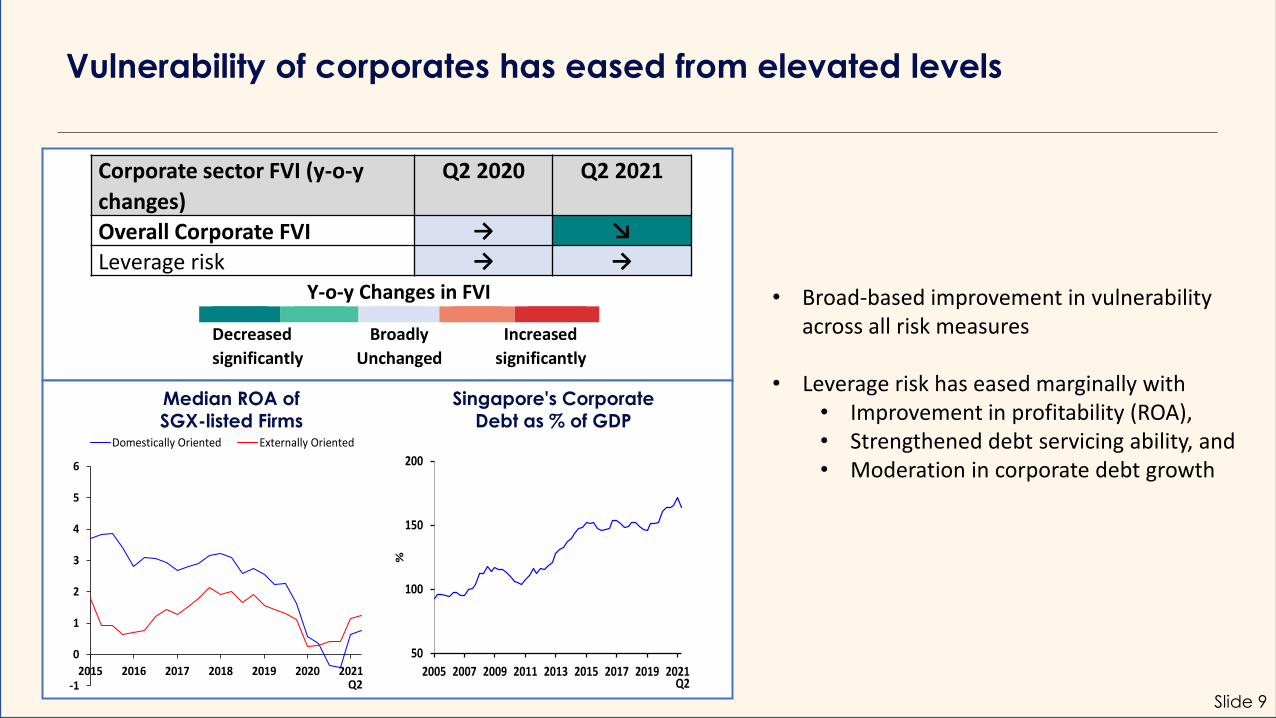
Vulnerability of corporates has eased from elevated levels
• Broad-based improvement in vulnerability across all risk measures
• Leverage risk has eased marginally with • Improvement in profitability (ROA), • Strengthened debt servicing ability, and • Moderation in corporate debt growth
Singapore's Corporate Debt as % of GDP
Median ROA of SGX-listed Firms
Y-o-y Changes in FVI
Decreased
significantly Broadly
Unchanged Increased
significantly
Corporate sector FVI (y-o-y
changes)
Q2 2020 Q2 2021
Overall Corporate FVI → ↘
Leverage risk → →
50
100
150
200
2005 2007 2009 2011 2013 2015 2017 2019 2021
%
Q2-1
0
1
2
3
4
5
6
2015 2016 2017 2018 2019 2020 2021
Domestically Oriented Externally Oriented
Q2
Slide 10
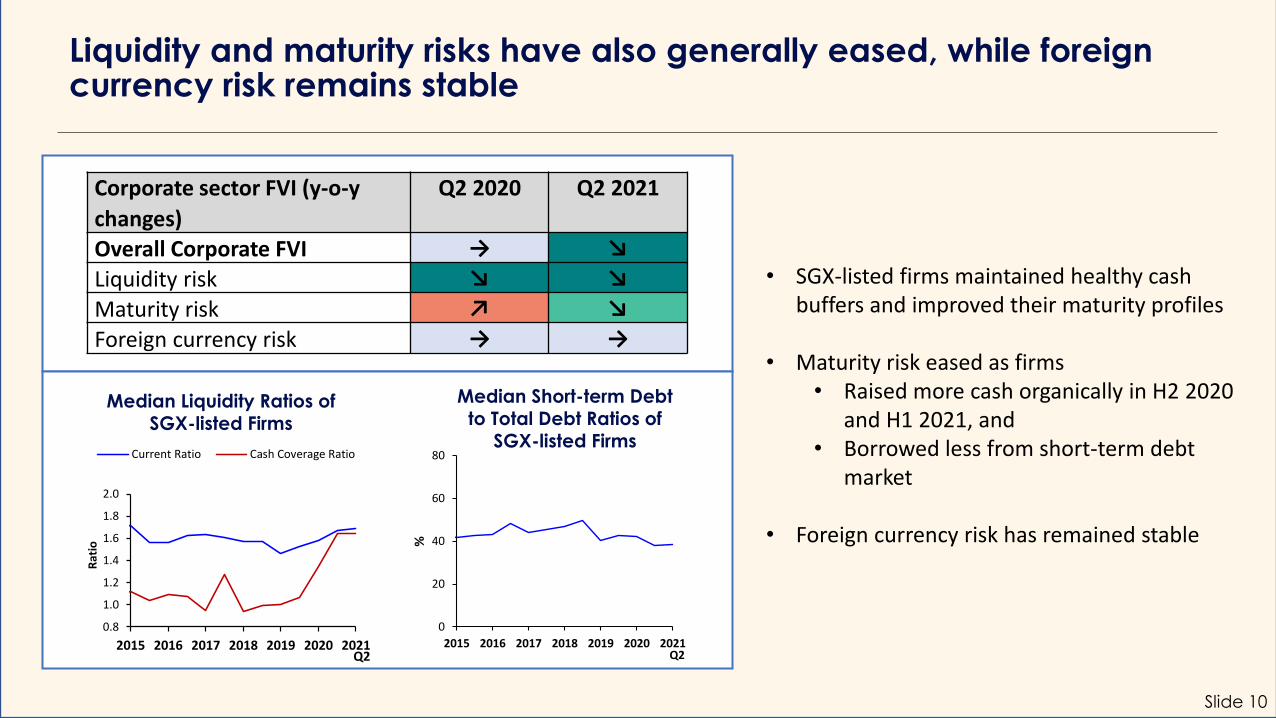
Liquidity and maturity risks have also generally eased, while foreign currency risk remains stable
• SGX-listed firms maintained healthy cash buffers and improved their maturity profiles
• Maturity risk eased as firms• Raised more cash organically in H2 2020
and H1 2021, and• Borrowed less from short-term debt
market
• Foreign currency risk has remained stable
Median Liquidity Ratios of SGX-listed Firms
Median Short-term Debt to Total Debt Ratios of
SGX-listed Firms
Corporate sector FVI (y-o-y
changes)
Q2 2020 Q2 2021
Overall Corporate FVI → ↘
Liquidity risk ↘ ↘
Maturity risk ↗ ↘
Foreign currency risk → →
0.8
1.0
1.2
1.4
1.6
1.8
2.0
2015 2016 2017 2018 2019 2020 2021
Rat
io
Current Ratio Cash Coverage Ratio
Q2
0
20
40
60
80
2015 2016 2017 2018 2019 2020 2021
%
Q2

Slide 11
Singapore’s corporate sector remains resilient to shocks, but sectoral variations in corporate performance persist
• MAS’ stress test suggests that most SGX-listed corporates would be resilient to interest rate and earnings shocks
• Despite the improved outlook, projected growth outcomes across sectors are expected to remain uneven
Share of Firms and Share of Corporate Debt Held by Firms with ICR below two
0
10
20
30
40
50
60
Before Stress After Stress After Stress(Incl Net CashReserves and
Hedging)
Shar
e o
f fi
rms
wit
h E
BIT
DA
/
Inte
rest
exp
ense
<2
(%)
Debt-at-Risk Firms-at-Risk
Slide 12
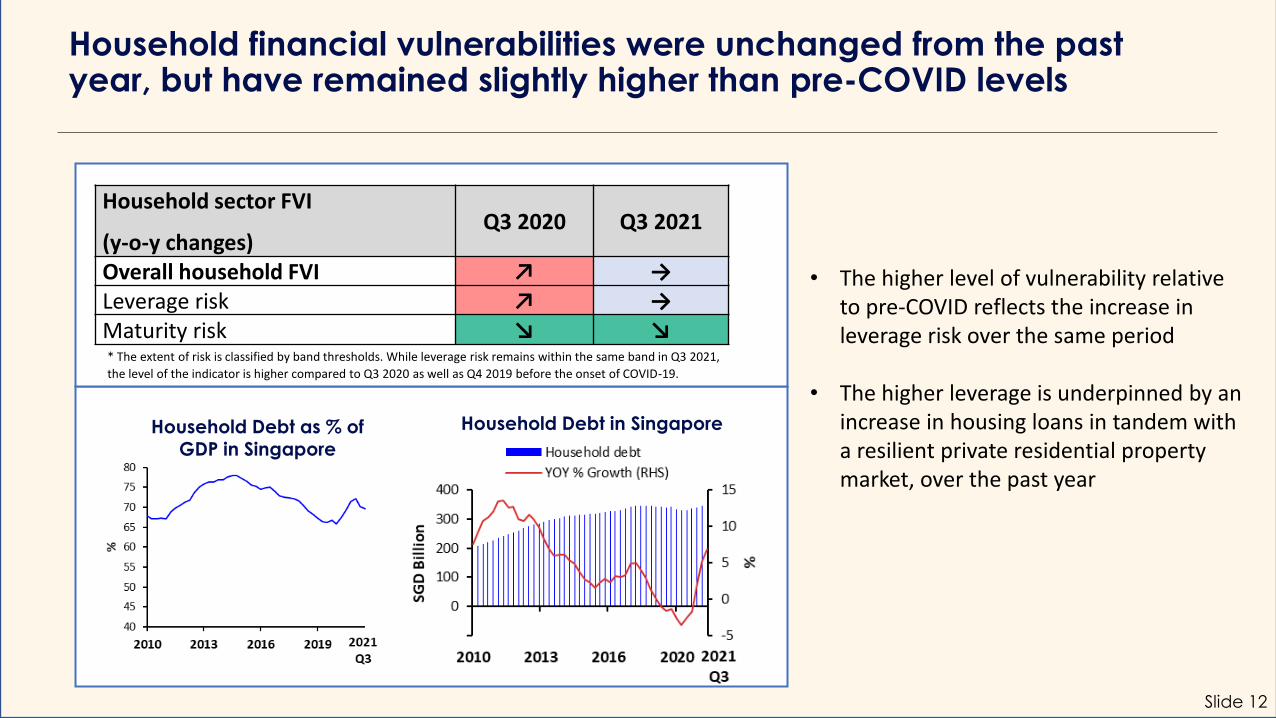
Household financial vulnerabilities were unchanged from the past year, but have remained slightly higher than pre-COVID levels
Household sector FVI
(y-o-y changes)Q3 2020 Q3 2021
Overall household FVI ↗ →Leverage risk ↗ →Maturity risk ↘ ↘
Household Debt in SingaporeHousehold Debt as % of GDP in Singapore
* The extent of risk is classified by band thresholds. While leverage risk remains within the same band in Q3 2021,
the level of the indicator is higher compared to Q3 2020 as well as Q4 2019 before the onset of COVID-19.
• The higher level of vulnerability relative to pre-COVID reflects the increase in leverage risk over the same period
• The higher leverage is underpinned by an increase in housing loans in tandem with a resilient private residential property market, over the past year
Slide 13
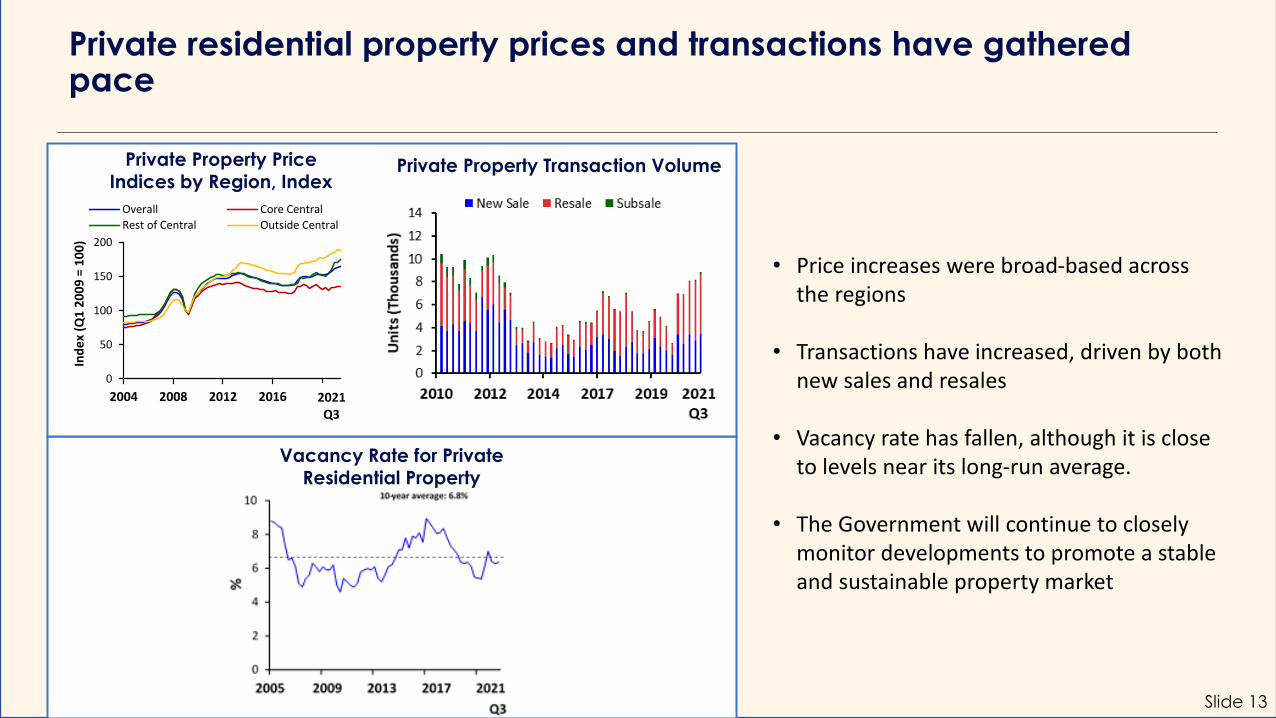
Private residential property prices and transactions have gathered pace
• Price increases were broad-based across the regions
• Transactions have increased, driven by both new sales and resales
• Vacancy rate has fallen, although it is close to levels near its long-run average.
• The Government will continue to closely monitor developments to promote a stable and sustainable property market
Private Property Price Indices by Region, Index
Vacancy Rate for Private Residential Property
Private Property Transaction Volume
0
50
100
150
200
2004 2008 2012 2016 2020
Ind
ex
(Q1
20
09
= 1
00
)
Overall Core Central
Rest of Central Outside Central
2021Q3
Slide 14
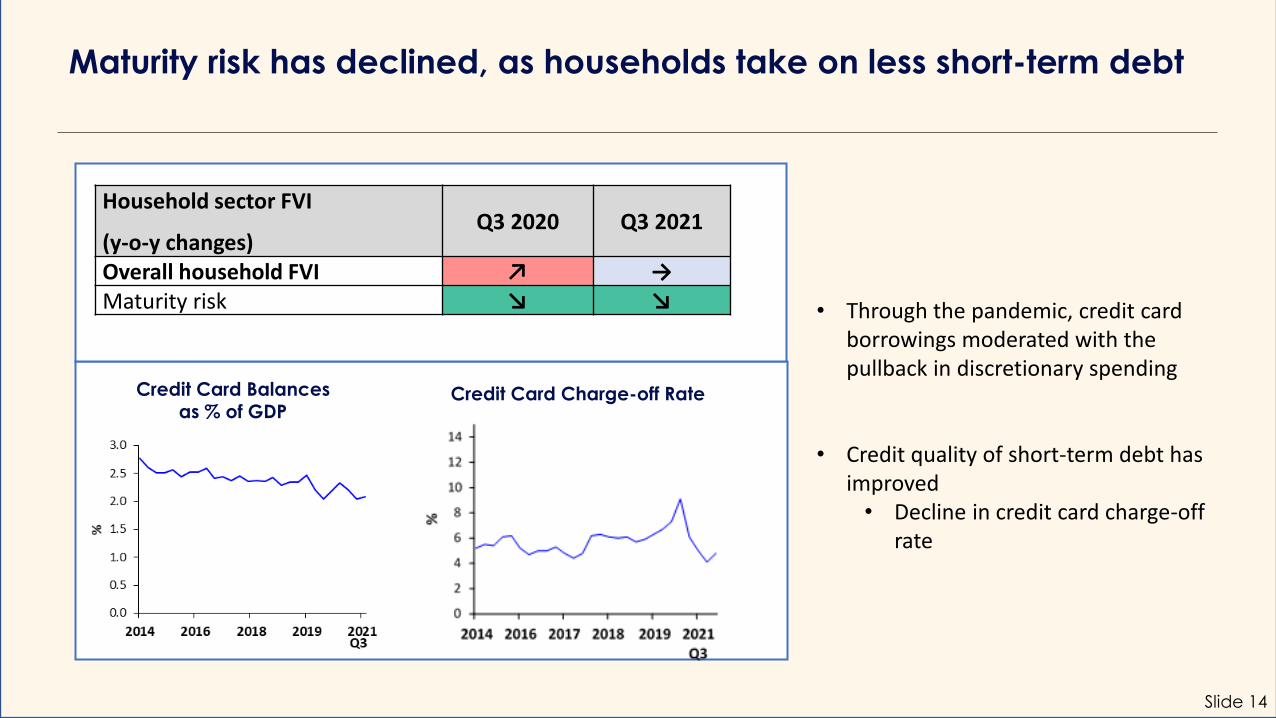
Maturity risk has declined, as households take on less short-term debt
Household sector FVI
(y-o-y changes)Q3 2020 Q3 2021
Overall household FVI ↗ →Maturity risk ↘ ↘
Credit Card Balances as % of GDP
Credit Card Charge-off Rate
• Through the pandemic, credit card borrowings moderated with the pullback in discretionary spending
• Credit quality of short-term debt has improved• Decline in credit card charge-off
rate
Slide 15
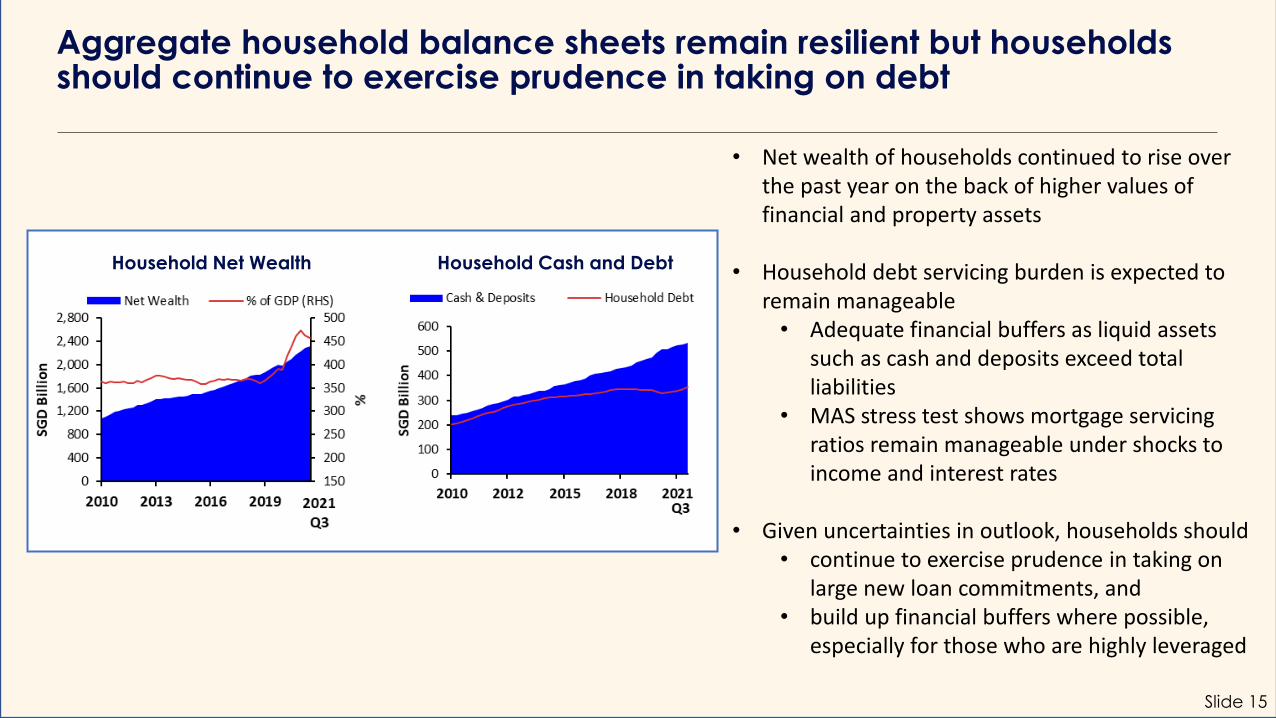
• Net wealth of households continued to rise over the past year on the back of higher values of financial and property assets
• Household debt servicing burden is expected to remain manageable • Adequate financial buffers as liquid assets
such as cash and deposits exceed total liabilities
• MAS stress test shows mortgage servicing ratios remain manageable under shocks to income and interest rates
• Given uncertainties in outlook, households should • continue to exercise prudence in taking on
large new loan commitments, and• build up financial buffers where possible,
especially for those who are highly leveraged
Aggregate household balance sheets remain resilient but households should continue to exercise prudence in taking on debt
Household Net Wealth Household Cash and Debt
Singapore Financial Sector

Slide 17
Overall banking FVI has improved, with an easing of liquidity vulnerabilities
• Domestic systemically important banks (D-SIBs) have continued to maintain healthy liquidity buffers
• Both SGD and foreign currency loan-to-deposit (LTD) ratios are below 100%
Banking sector FVI (y-o-y
changes)Q3 2020 Q3 2021
Overall banking FVI → ↘Liquidity risk → ↘Maturity risk → →
Banking System’s Non-bank LTD Ratios
Local Banking Groups’ All-Currency LCR
(Q3 2021)
0
40
80
120
160
UOB OCBC DBS
%
MAS All-Currency LCR Minimum Requirement(as of Jan 2019)
0
20
40
60
80
100
120
2019 2020 2021
%
Overall Non-bank LTD Ratio
SGD Non-bank LTD Ratio
Foreign Currency Non-bank LTD Ratio
Oct
Slide 18
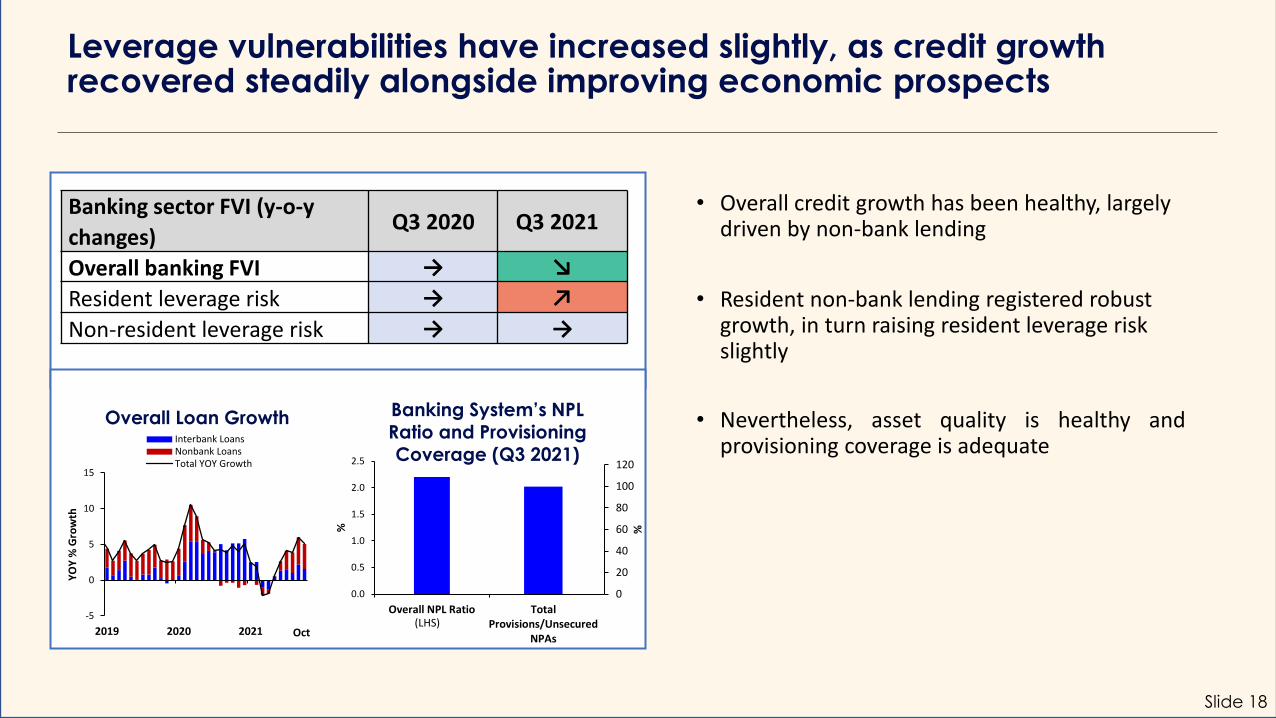
Leverage vulnerabilities have increased slightly, as credit growth recovered steadily alongside improving economic prospects
• Overall credit growth has been healthy, largely driven by non-bank lending
• Resident non-bank lending registered robust growth, in turn raising resident leverage risk slightly
• Nevertheless, asset quality is healthy andprovisioning coverage is adequate
Banking sector FVI (y-o-y
changes)Q3 2020 Q3 2021
Overall banking FVI → ↘
Resident leverage risk → ↗
Non-resident leverage risk → →
Overall Loan Growth Banking System’s NPL Ratio and Provisioning Coverage (Q3 2021)
0.0
0.5
1.0
1.5
2.0
2.5
Overall NPL Ratio
%
0
20
40
60
80
100
120
TotalProvisions/Unsecured
NPAs%
(LHS)Oct
-5
0
5
10
15
2019 2020 2021
YO
Y %
Gro
wth
Interbank LoansNonbank LoansTotal YOY Growth
Slide 19
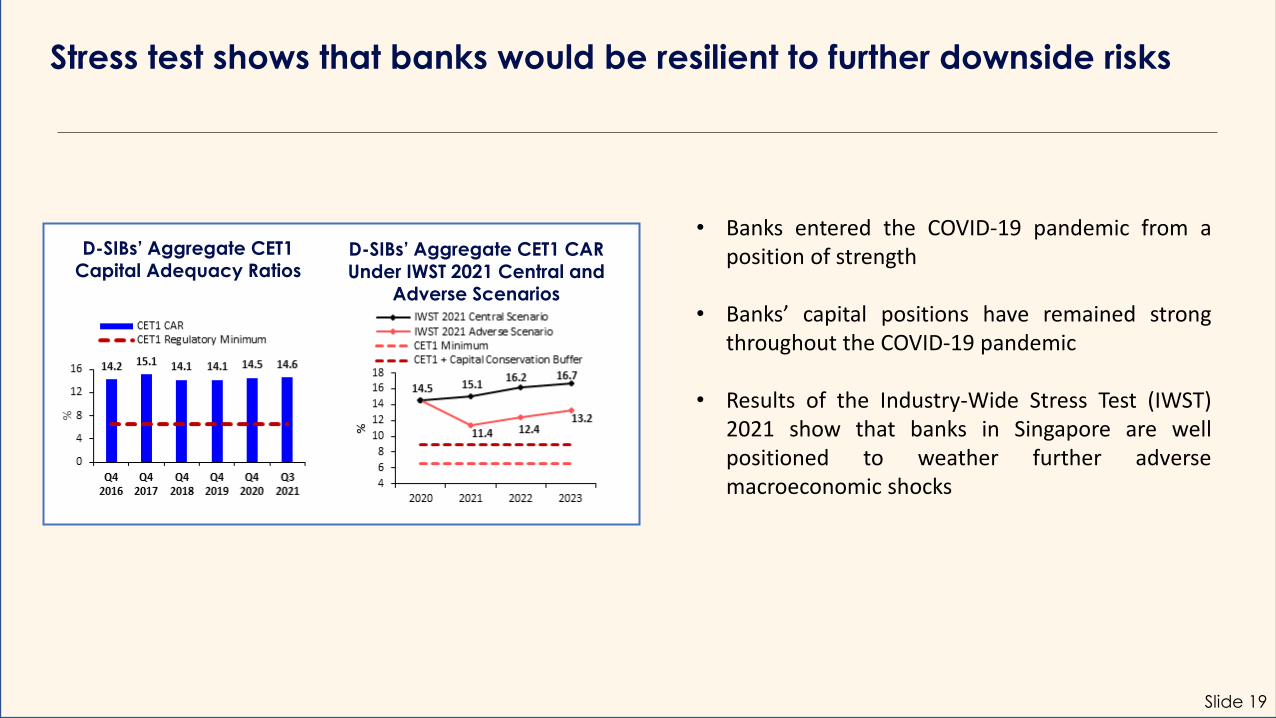
Stress test shows that banks would be resilient to further downside risks
• Banks entered the COVID-19 pandemic from aposition of strength
• Banks’ capital positions have remained strongthroughout the COVID-19 pandemic
• Results of the Industry-Wide Stress Test (IWST)2021 show that banks in Singapore are wellpositioned to weather further adversemacroeconomic shocks
D-SIBs’ Aggregate CET1 Capital Adequacy Ratios
D-SIBs’ Aggregate CET1 CAR
Under IWST 2021 Central and Adverse Scenarios
Slide 20
The non-bank FI sector has weathered the stresses from the pandemic well
• Investment funds have been able to meet redemptions in an orderly manner• Funds have faced more instances of significant redemptions compared to the prior year. These redemptions
were largely driven by investors’ asset reallocation actions.
• Insurers have remained well-capitalised and would be resilient to downside risks• Stress test shows that insurers would be able to continue meeting regulatory capital requirements even when
subject to a range of macro-financial stresses.
• Central counterparties (CCPs) would remain resilient against severe shocks• Stress tests show that CCPs’ financial resources would be sufficient to cover clearing member defaults under
stress, with limited contagion risks.

Special Features

Slide 22
Special Feature 2:Climate transition risk exposure of Singapore’s banking and insurance sector
Background
• There is growing awareness of the risk that climate change poses to the financial system
• Many central banks and regulators are seeking to better understand the risk and assess its implications for financial stability
• Feature focuses on transition risk, which is motivated by the significant adjustments that may be imminent amid the shift to a low-carbon economy in Singapore and globally
• Using regulatory data*, MAS estimated the financial system’s exposure to transition risk by applying Battiston’sconcept of Climate Policy Relevant Sectors (CPRS)
• CPRS is also commonly used by other institutions (e.g. IMF and ECB) to analyse climate transition risks
*MAS Notice 610 for banks and MAS Notice 122 for insurers
Slide 23
Special Feature 2:Climate transition risk exposure of Singapore’s banking and insurance sector
Key findings
• The banking sector’s loan exposures to CPRS (excluding residential mortgages) have remained stable at 29–31% of total loan portfolio over 2015-2020
• The loan exposures were mainly to CPRS with lower emissions, suggesting less susceptibility to potential impairments from changes in climate policy
• Over the same period, the insurance sector’s investment exposure to CPRS has remained stable at 32–33% of total investment portfolio
Sum up
• This initial attempt at assessing financial sector risk associated with climate transition will help to inform further work in climate change’s impact on the financial system
• MAS will continue to work closely in partnership with the industry, academia and other regulators to strengthen our understanding of the financial stability impact of climate change
Slide 24
Special Feature 4:An empirical analysis of the determinants of domestic interest rates and net interest margin (NIM)
Background
• Understanding the drivers of domestic interest rates and NIM provides insights on the financial system’s resilience against shocks
• In particular, we analysed the sensitivity of domestic interest rates to interbank funding rates in Singapore, proxied by Singapore Interbank Offered Rate (SIBOR).
• The structural shifts in the banking landscape over the past two decades have affected the sensitivity
Slide 25
Special Feature 4:An empirical analysis of the determinants of domestic interest rates and net interest margin
Key findings
• Structural drivers such as competition in the banking sector, in addition to conjunctural factors, are key determinants of domestic interest rates
• A low interest rate environment warrants need for increased surveillance
• First, a rising interest rate environment is positive for banks’ NIM and hence their overall profitability, as banks re-price their loans (as proxied by mortgage rates) higher to a larger extent compared to deposits
• Second, banks with low NIM are more susceptible to larger declines in NIM when SIBOR declines.
• This would happen if the competition-induced decline in lending rates outpaces the softening in deposit rates, especially as low deposit rates limit room for downward adjustment
• Further, there is asymmetric impact of interest rate changes across different borrower profiles (e.g. HDB vs private residential properties; foreign vs local banks)
Slide 26
Other Special Features
Special Feature 1: Integrated macro policy framework: An assessment of the ongoing research
• Integrated macro policy frameworks (IMPFs), involving the joint deployment of monetary, exchange rate,macroprudential and capital flows management policies, have surfaced prominently in recent years
• Optimal policy mix may not be a single solution but dynamically depends on country characteristics, nature of
capital flows and types of shocks
Special Feature 3: Enhancing Corporate Surveillance with Probability of Default (PD) Model
• The pandemic has underscored the importance of timely surveillance of non-financial corporates to assess their
vulnerabilities and inform the design of appropriate policy responses
• This Feature presents how EPG-MSD could enhance its surveillance framework of identifying vulnerable firms by
complementing it with NUS Credit Research Initiative (NUS-CRI)’s PD model, which produces PD term structures of
firms on a daily basis

Thank you
Top Related
Copyright © 2022 FDOKUMEN

