


![05-03ChapGere[1] | Bending | Beam (Structure) - xdocs.net](https://static.fdokumen.com/doc/165x107/6323c1d9be5419ea700ebf89/05-03chapgere1-bending-beam-structure-xdocsnet.jpg)


Bahasa
Halaman
Hukum

PAPER www.rsc.org/faraday_d | Faraday DiscussionsD
ownl
oade
d by
Law
renc
e B
erke
ley
Nat
iona
l Lab
orat
ory
on 2
9 M
arch
201
1Pu
blis
hed
on 0
8 Se
ptem
ber
2010
on
http
://pu
bs.r
sc.o
rg |
doi:1
0.10
39/C
0043
67M
View Online
Fe–H/D stretching and bending modes in nuclearresonant vibrational, Raman and infraredspectroscopies: Comparisons of densityfunctional theory and experiment
Vladimir Pelmenschikov,a Yisong Guo,†b Hongxin Wang,bd
Stephen P. Cramerbd and David A. Case*c
Received 16th March 2010, Accepted 15th April 2010
DOI: 10.1039/c004367m
Infrared, Raman, and nuclear resonant vibrational (NRVS) spectroscopies have
been used to address the Fe–H bonding in trans-HFe(CO) iron hydride
compound, HFe(CO)(dppe)2, dppe ¼ 1,2-bis(diphenylphosphino)ethane. H and
D isotopomers of the compound, with selective substitution at the metal-
coordinated hydrogen, have been considered in order to address the Fe–H/D
stretching and bending modes. Experimental results are compared to the normal
mode analysis by density functional theory (DFT). The results are that (i) the IR
spectrum does not clearly show Fe–H stretching or bending modes; (ii) Fe–H
stretching modes are clear but weak in the Raman spectrum, and Fe–H bending
modes are weak; (iii) NRVS 57Fe spectroscopy resolves Fe–H bending clearly, but
Fe–H or Fe–D stretching is above its experimentally resolved frequency range.
DFT calculations (with no scaling of frequencies) show intensities and peak
locations that allow unambiguous correlations between observed and calculated
features, with frequency errors generally less than 15 cm�1. Prospects for using
these techniques to unravel vibrational modes of protein active sites are
discussed.
1 Introduction
Molecular hydrogen plays an important role in the metabolism of numerous aerobicand anaerobic microorganisms. The evolution or consumption of H2 in nature isperformed by a family of enzymes, known as hydrogenases, by catalyzing H2/H+
interconversion reactions.1 These enzymes are more efficient catalysts than plat-inum, which is used in industry to catalyze hydrogenation. The study of the structureand catalytic mechanisms of hydrogenases is not only due to curiosity, but may alsoprove crucial for finding new H2-activating catalysts with low cost, high efficiencyand stability to help utilize H2 as a clean renewable energy currency, known asthe ‘‘hydrogen economy.’’
aInstitut f€ur Anorganische Chemie, Universit€at W€urzburg, Am Hubland, 97074 W€urzburg,GermanybDepartment of Applied Science, University of California, Davis, CA, 95616, USAcBioMaPS Institute and Dept. of Chemistry and Chemical Biology, Rutgers University,Piscataway, NJ, 08854, USAdPhysical Biosciences Division, Lawrence Berkeley National Laboratory, Berkeley, CA, 94720,USA
† Current address: Dept. of Chemistry, Carnegie Mellon University, Pittsburgh, PA 15213,USA
This journal is ª The Royal Society of Chemistry 2011 Faraday Discuss., 2011, 148, 409–420 | 409
Dow
nloa
ded
by L
awre
nce
Ber
kele
y N
atio
nal L
abor
ator
y on
29
Mar
ch 2
011
Publ
ishe
d on
08
Sept
embe
r 20
10 o
n ht
tp://
pubs
.rsc
.org
| do
i:10.
1039
/C00
4367
MView Online
There are three known types of hydrogenase: [NiFe]-hydrogenase (in bacteria andarchaea), [FeFe]-hydrogenase (in bacteria and eukaryotes),1,2 and Hmdhydrogenase – formally named H2-forming methylenetetrahydromethanopterin(methylene-H4MPT) dehydrogenase.3 Recently, Shima et al. reported the crystalstructure of Hmd hydrogenase.4 Although, the three hydrogenases are not phyloge-netically related, a common feature of the active sites is that they all contain a low-spin, nonredox-active iron ligated by at least one CO.3 The function of the low-spiniron is thought to polarize H2 so that it can be subject to electrophilic attack by theredox-active transition metals (Ni in [NiFe]-hydrogenase, and a second Fe in [FeFe]-hydrogenase) or the carbocation (C14 of methenyl-H4MPT+ in Hmd hydrogenase).The presence of CO ligand(s) is thought to tune the electrophilicity of the low-spiniron in trans-position to the potential H2-binding site for optimal heterolyticcleavage.5 In addition, all three hydrogenases can be inhibited by extrinsic CO.
Another important metal ligand of the active centers of all three types of hydrog-enases in the key catalytic states is hydride (H�). The previous ENDOR6,7 and HYS-CORE7,8 studies on [NiFe]-hydrogenase showed that a bridging H� was identifiedbetween Fe and Ni centers in the activated enzyme upon long term incubationwith H2.9 In [FeFe]-hydrogenase, the identification of H� ligand is less successful.A terminal H� on the distal Fe of the 2Fe subunit of the H-cluster of the enzymeand a bridging hydride between the two Fe of the 2Fe subunit have been proposed.9
In Hmd hydrognease, a terminal H� ligand on the iron center has been proposedbased on DFT calculations.10
In the past several decades, numerous structural and functional model compoundsof the active sites of these three types of hydrogenase have been synthesized andcharacterized by various spectroscopic methods.11 These model compounds andthe chemistry associated with them played an important role in helping us under-stand the catalytic mechanisms in the enzyme systems.
In an earlier study we reported the detailed spectroscopic characterization ofa model compound, Fe(S2C2H4)(CO)2(PMe3)2 using nuclear resonance vibrationalspectroscopy (NRVS), IR and Resonance Raman as well as density functionalquantum calculations.12 This compound contains a cis-(CO)2 moiety and sulfurligands similar to the iron center structure in Hmd hydrogenase. The results fromthis model compound study have then been used to interpret the NRVS spectra ob-tained from Hmd hydrogenase. The study showed that the combination of severalvibrational spectroscopic techniques together with DFT calculations is a powerfultool to illustrate the bonding interactions between iron and surrounding ligands inmodel compounds, and further facilitate the identification of iron ligands in proteinmolecules.
In this paper, we use several vibrational spectroscopic techniques together withDFT calculations to study an iron carbonyl hydrido compound – [HFe(CO)(dp-pe)2](BF4) (1, Fig. 1). Our focus is to identify Fe–H vibrational interactions in thiscompound. The same compound with a different anion has been reported earlierby Landau et al.13 The compound has an FeCO moiety with a H� ligand trans toCO. This is a good structural model compound mimicking the possible terminalH� binding to the Fe sites of [FeFe]-hydrogenase and Hmd hydrogenase. We usedNRVS, IR and Raman spectroscopy in connection with DFT calculations to iden-tify the Fe–H stretching mode and H–Fe–CO bending modes on 1 and its deuteratedversion, 1-D. The implication of the results of this work to hydrogenase enzymestudies will be discussed.
2 Results
2.1 NRVS, IR and Raman spectra
Fig. 2 shows the NRVS, FT-IR and FT-Raman spectra of [(H,D)FeCO(dppe)2]BF4.As expected, there is clear evidence of common frequencies in the three spectra, but
410 | Faraday Discuss., 2011, 148, 409–420 This journal is ª The Royal Society of Chemistry 2011
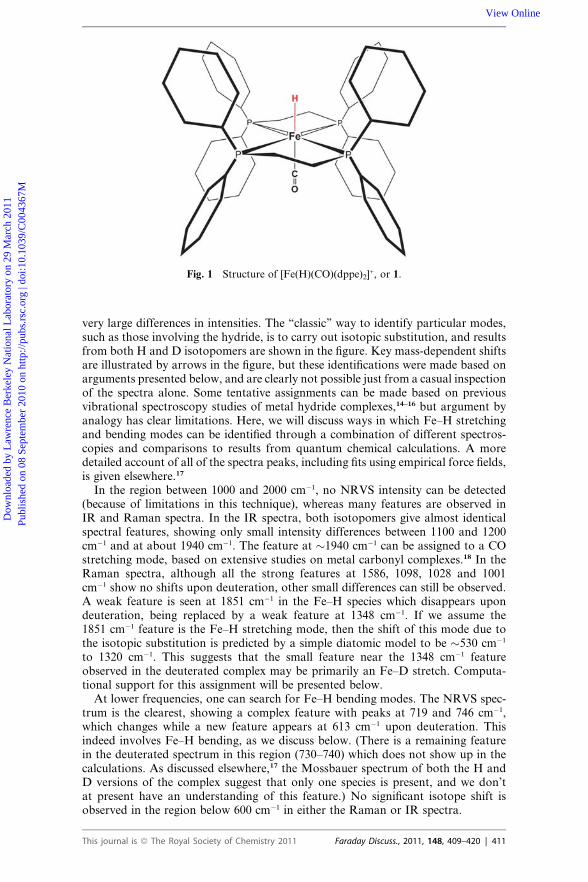
Fig. 1 Structure of [Fe(H)(CO)(dppe)2]+, or 1.
Dow
nloa
ded
by L
awre
nce
Ber
kele
y N
atio
nal L
abor
ator
y on
29
Mar
ch 2
011
Publ
ishe
d on
08
Sept
embe
r 20
10 o
n ht
tp://
pubs
.rsc
.org
| do
i:10.
1039
/C00
4367
MView Online
very large differences in intensities. The ‘‘classic’’ way to identify particular modes,such as those involving the hydride, is to carry out isotopic substitution, and resultsfrom both H and D isotopomers are shown in the figure. Key mass-dependent shiftsare illustrated by arrows in the figure, but these identifications were made based onarguments presented below, and are clearly not possible just from a casual inspectionof the spectra alone. Some tentative assignments can be made based on previousvibrational spectroscopy studies of metal hydride complexes,14–16 but argument byanalogy has clear limitations. Here, we will discuss ways in which Fe–H stretchingand bending modes can be identified through a combination of different spectros-copies and comparisons to results from quantum chemical calculations. A moredetailed account of all of the spectra peaks, including fits using empirical force fields,is given elsewhere.17
In the region between 1000 and 2000 cm�1, no NRVS intensity can be detected(because of limitations in this technique), whereas many features are observed inIR and Raman spectra. In the IR spectra, both isotopomers give almost identicalspectral features, showing only small intensity differences between 1100 and 1200cm�1 and at about 1940 cm�1. The feature at �1940 cm�1 can be assigned to a COstretching mode, based on extensive studies on metal carbonyl complexes.18 In theRaman spectra, although all the strong features at 1586, 1098, 1028 and 1001cm�1 show no shifts upon deuteration, other small differences can still be observed.A weak feature is seen at 1851 cm�1 in the Fe–H species which disappears upondeuteration, being replaced by a weak feature at 1348 cm�1. If we assume the1851 cm�1 feature is the Fe–H stretching mode, then the shift of this mode due tothe isotopic substitution is predicted by a simple diatomic model to be �530 cm�1
to 1320 cm�1. This suggests that the small feature near the 1348 cm�1 featureobserved in the deuterated complex may be primarily an Fe–D stretch. Computa-tional support for this assignment will be presented below.
At lower frequencies, one can search for Fe–H bending modes. The NRVS spec-trum is the clearest, showing a complex feature with peaks at 719 and 746 cm�1,which changes while a new feature appears at 613 cm�1 upon deuteration. Thisindeed involves Fe–H bending, as we discuss below. (There is a remaining featurein the deuterated spectrum in this region (730–740) which does not show up in thecalculations. As discussed elsewhere,17 the Mossbauer spectrum of both the H andD versions of the complex suggest that only one species is present, and we don’tat present have an understanding of this feature.) No significant isotope shift isobserved in the region below 600 cm�1 in either the Raman or IR spectra.
This journal is ª The Royal Society of Chemistry 2011 Faraday Discuss., 2011, 148, 409–420 | 411
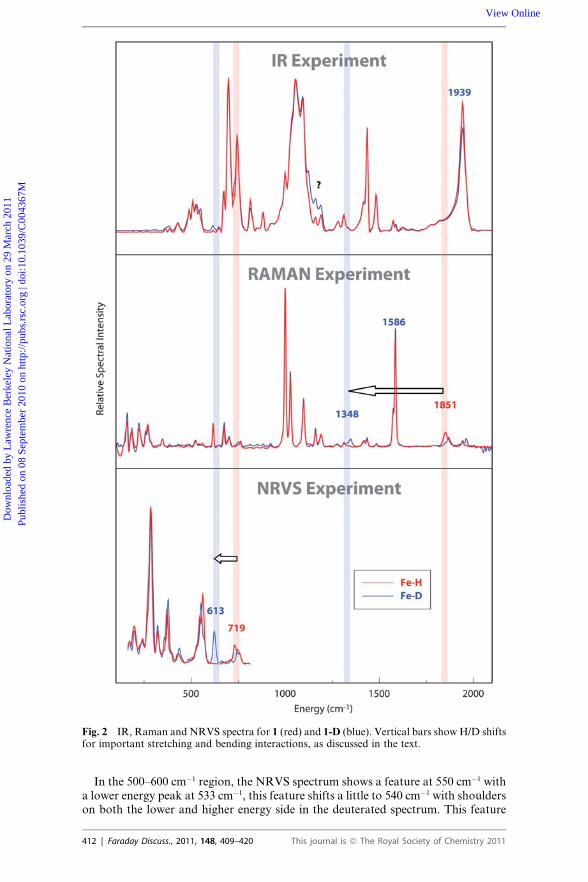
Fig. 2 IR, Raman and NRVS spectra for 1 (red) and 1-D (blue). Vertical bars show H/D shiftsfor important stretching and bending interactions, as discussed in the text.
Dow
nloa
ded
by L
awre
nce
Ber
kele
y N
atio
nal L
abor
ator
y on
29
Mar
ch 2
011
Publ
ishe
d on
08
Sept
embe
r 20
10 o
n ht
tp://
pubs
.rsc
.org
| do
i:10.
1039
/C00
4367
MView Online
In the 500–600 cm�1 region, the NRVS spectrum shows a feature at 550 cm�1 witha lower energy peak at 533 cm�1, this feature shifts a little to 540 cm�1 with shoulderson both the lower and higher energy side in the deuterated spectrum. This feature
412 | Faraday Discuss., 2011, 148, 409–420 This journal is ª The Royal Society of Chemistry 2011
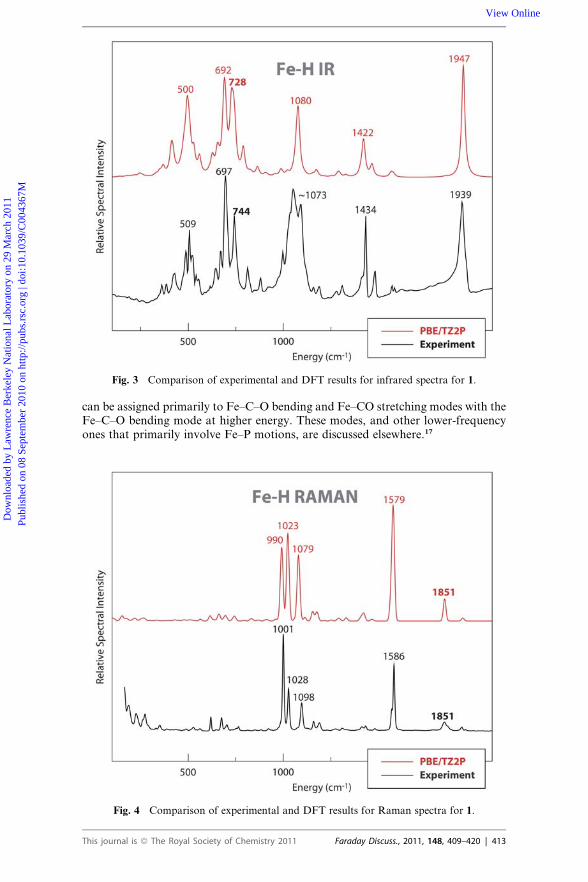
Fig. 3 Comparison of experimental and DFT results for infrared spectra for 1.
Dow
nloa
ded
by L
awre
nce
Ber
kele
y N
atio
nal L
abor
ator
y on
29
Mar
ch 2
011
Publ
ishe
d on
08
Sept
embe
r 20
10 o
n ht
tp://
pubs
.rsc
.org
| do
i:10.
1039
/C00
4367
MView Online
can be assigned primarily to Fe–C–O bending and Fe–CO stretching modes with theFe–C–O bending mode at higher energy. These modes, and other lower-frequencyones that primarily involve Fe–P motions, are discussed elsewhere.17
Fig. 4 Comparison of experimental and DFT results for Raman spectra for 1.
This journal is ª The Royal Society of Chemistry 2011 Faraday Discuss., 2011, 148, 409–420 | 413
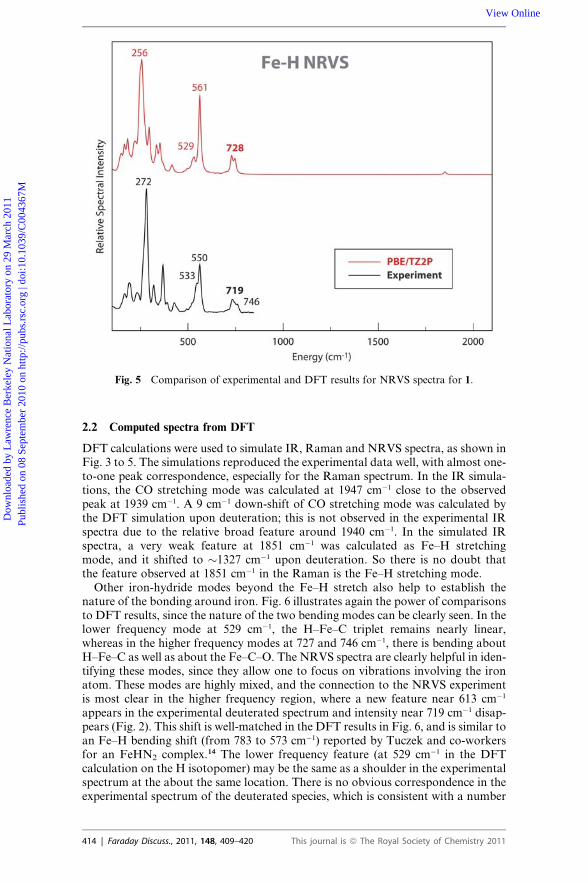
Fig. 5 Comparison of experimental and DFT results for NRVS spectra for 1.
Dow
nloa
ded
by L
awre
nce
Ber
kele
y N
atio
nal L
abor
ator
y on
29
Mar
ch 2
011
Publ
ishe
d on
08
Sept
embe
r 20
10 o
n ht
tp://
pubs
.rsc
.org
| do
i:10.
1039
/C00
4367
MView Online
2.2 Computed spectra from DFT
DFT calculations were used to simulate IR, Raman and NRVS spectra, as shown inFig. 3 to 5. The simulations reproduced the experimental data well, with almost one-to-one peak correspondence, especially for the Raman spectrum. In the IR simula-tions, the CO stretching mode was calculated at 1947 cm�1 close to the observedpeak at 1939 cm�1. A 9 cm�1 down-shift of CO stretching mode was calculated bythe DFT simulation upon deuteration; this is not observed in the experimental IRspectra due to the relative broad feature around 1940 cm�1. In the simulated IRspectra, a very weak feature at 1851 cm�1 was calculated as Fe–H stretchingmode, and it shifted to �1327 cm�1 upon deuteration. So there is no doubt thatthe feature observed at 1851 cm�1 in the Raman is the Fe–H stretching mode.
Other iron-hydride modes beyond the Fe–H stretch also help to establish thenature of the bonding around iron. Fig. 6 illustrates again the power of comparisonsto DFT results, since the nature of the two bending modes can be clearly seen. In thelower frequency mode at 529 cm�1, the H–Fe–C triplet remains nearly linear,whereas in the higher frequency modes at 727 and 746 cm�1, there is bending aboutH–Fe–C as well as about the Fe–C–O. The NRVS spectra are clearly helpful in iden-tifying these modes, since they allow one to focus on vibrations involving the ironatom. These modes are highly mixed, and the connection to the NRVS experimentis most clear in the higher frequency region, where a new feature near 613 cm�1
appears in the experimental deuterated spectrum and intensity near 719 cm�1 disap-pears (Fig. 2). This shift is well-matched in the DFT results in Fig. 6, and is similar toan Fe–H bending shift (from 783 to 573 cm�1) reported by Tuczek and co-workersfor an FeHN2 complex.14 The lower frequency feature (at 529 cm�1 in the DFTcalculation on the H isotopomer) may be the same as a shoulder in the experimentalspectrum at the about the same location. There is no obvious correspondence in theexperimental spectrum of the deuterated species, which is consistent with a number
414 | Faraday Discuss., 2011, 148, 409–420 This journal is ª The Royal Society of Chemistry 2011
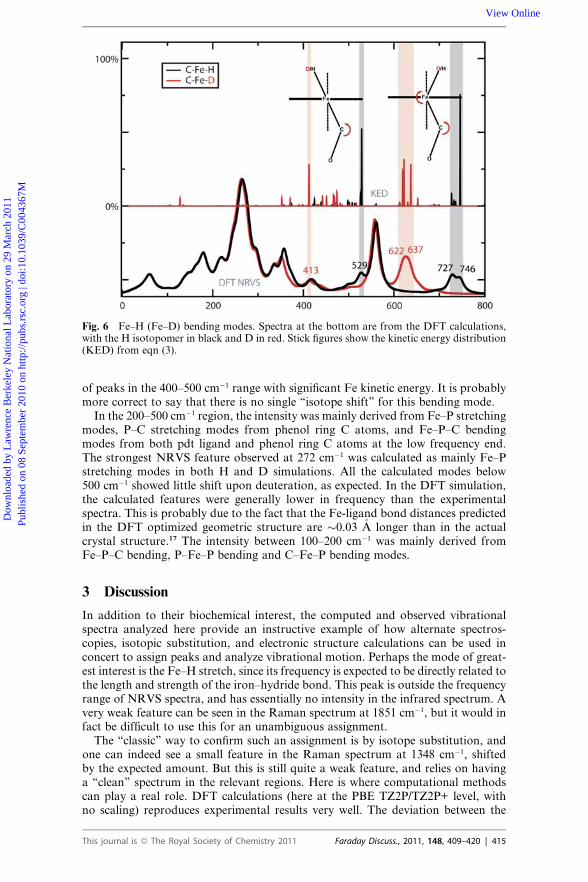
Fig. 6 Fe–H (Fe–D) bending modes. Spectra at the bottom are from the DFT calculations,with the H isotopomer in black and D in red. Stick figures show the kinetic energy distribution(KED) from eqn (3).
Dow
nloa
ded
by L
awre
nce
Ber
kele
y N
atio
nal L
abor
ator
y on
29
Mar
ch 2
011
Publ
ishe
d on
08
Sept
embe
r 20
10 o
n ht
tp://
pubs
.rsc
.org
| do
i:10.
1039
/C00
4367
MView Online
of peaks in the 400–500 cm�1 range with significant Fe kinetic energy. It is probablymore correct to say that there is no single ‘‘isotope shift’’ for this bending mode.
In the 200–500 cm�1 region, the intensity was mainly derived from Fe–P stretchingmodes, P–C stretching modes from phenol ring C atoms, and Fe–P–C bendingmodes from both pdt ligand and phenol ring C atoms at the low frequency end.The strongest NRVS feature observed at 272 cm�1 was calculated as mainly Fe–Pstretching modes in both H and D simulations. All the calculated modes below500 cm�1 showed little shift upon deuteration, as expected. In the DFT simulation,the calculated features were generally lower in frequency than the experimentalspectra. This is probably due to the fact that the Fe-ligand bond distances predictedin the DFT optimized geometric structure are �0.03 �A longer than in the actualcrystal structure.17 The intensity between 100–200 cm�1 was mainly derived fromFe–P–C bending, P–Fe–P bending and C–Fe–P bending modes.
3 Discussion
In addition to their biochemical interest, the computed and observed vibrationalspectra analyzed here provide an instructive example of how alternate spectros-copies, isotopic substitution, and electronic structure calculations can be used inconcert to assign peaks and analyze vibrational motion. Perhaps the mode of great-est interest is the Fe–H stretch, since its frequency is expected to be directly related tothe length and strength of the iron–hydride bond. This peak is outside the frequencyrange of NRVS spectra, and has essentially no intensity in the infrared spectrum. Avery weak feature can be seen in the Raman spectrum at 1851 cm�1, but it would infact be difficult to use this for an unambiguous assignment.
The ‘‘classic’’ way to confirm such an assignment is by isotope substitution, andone can indeed see a small feature in the Raman spectrum at 1348 cm�1, shiftedby the expected amount. But this is still quite a weak feature, and relies on havinga ‘‘clean’’ spectrum in the relevant regions. Here is where computational methodscan play a real role. DFT calculations (here at the PBE TZ2P/TZ2P+ level, withno scaling) reproduces experimental results very well. The deviation between the
This journal is ª The Royal Society of Chemistry 2011 Faraday Discuss., 2011, 148, 409–420 | 415
Dow
nloa
ded
by L
awre
nce
Ber
kele
y N
atio
nal L
abor
ator
y on
29
Mar
ch 2
011
Publ
ishe
d on
08
Sept
embe
r 20
10 o
n ht
tp://
pubs
.rsc
.org
| do
i:10.
1039
/C00
4367
MView Online
experiment and DFT does not exceed �15 cm�1 and commonly much less. Since thenature of the modes is clear in the calculation, and since it is easy to use frequenciesand intensities to correlate observed and calculated peaks, the identification of theFe–H stretch is now completely straightforward. The calculations don’t include an-harmonic corrections, and have the usual limitations arising from the use of approx-imate functionals and limited one-particle basis sets; hence numerical agreement ofany particular peak with the observed one may involve some cancellation of errors.But as long as the correlation of observed and calculated peaks is as clear as what isseen here, the benefits of a straightforward DFT calculation, with a large but acces-sible basis set, seem clear.
The analysis of hydride modes in iron-hydride complexes similar to this one hasa long history.14,19–22 In similar compounds, the Fe–H stretching frequency rangesfrom 1800 to 2000 cm�1, and Fe–H distances from 1.4 to 1.6 �A. These high frequen-cies place the stretching modes outside the range of NRVS spectroscopy, but theresults presented here show that bending modes can be intensified and assigned(both by isotopic substitution and by computation), in accord with earlier NRVSstudies on high-spin iron complexes.15 A key question regards the ability to identifysuch modes in the much more crowded, and possibly heterogeneous environmentfound in metalloproteins. Our previous report on a non-hydride state of Hmdhydrogenase and its comparison to a model compound12 is encouraging in thisrespect, as are comparisons of proteins and model complexes in nitrogenase23 andferredoxins.24,25
The successful identification of Fe–H vibrations in [HFe(CO)(dppe)2](BF4) usingthe combination of three different vibrational spectroscopic techniques togetherwith DFT calculations should enable us to ask the question whether we can identifyFe–H binding in hydrogenase enzymes using the same methodology. Hmd hydrog-enase should be the best system to study in the next step due to its relatively simplemononuclear Fe center. Recently, a DFT study on Hmd hydrogenase10 proposedthat the Fe center has a strong Fe–Hd�/Hd+–O dihydrogen bond in the restingstate of the enzyme with the presence of H2. Upon arrival of the enzyme substrate –Methenyl-H4MPT+ – this dihydrogen bond breaks and a hydride bond to the ironcenter is formed. Then the hydride is transferred to the substrate and the next H2
cleavage initiates. By combining NRVS and DFT calculations, the identificationof this proposed hydride through vibrational information, especially Fe–H bendingvibrations, in the Fe center of Hmd hydrogenase should be feasible.
4 Methods
4.1 Synthesis of [HFeCO(dppe)2]BF4
The synthesis of 57Fe-1 starts with the synthesis of 57Fe(Cl)2(dppe)2. A slurry of57FeCl2 (0.050 g, 0.39 mmol) in benzene (10 mL) was treated with dppe (0.34 g,0.85 mmol), and the reaction mixture was heated to reflux for 3 h. The tan ferrouschloride dissolved to give a colorless solution, which precipitated a white microcrys-talline solid. The reaction mixture was transferred via cannula to an air-free frit, andthe solid was washed with hexane (3� 4 mL). The white solid was dissolved from thefrit with thf, and solvent was removed under vacuum. Next, the synthesis of57FeHCl(dppe)2 was carried out. To a mixture of diphosphine (0.3311 g, 0.8308mmol) and 57FeCl2 (0.0526 g, 0.411 mmol) in 25 ml of ethanol was slowly added,at 50 �C in a countercurrent of argon and under vigorous stirring, a solution ofsodium borohydride (0.0181 g, 0.432 mmol) in 20 ml of ethanol. The stirring wascontinued until the precipitate became red (about 90 min), and then the productwas filtered, washed with water and with ethanol at 40 �C, dried in vacuo and recrys-tallized from benzene by adding ethanol. The deuteride was prepared in the samemanner from NaBD4. Then, A CO-saturated slurry of 57FeHCl(dppe)2 (0.1331 g,0.1493 mmol) in acetone (20 mL) was treated with NaBF4 (0.0685 g, 0.624 mmol)
416 | Faraday Discuss., 2011, 148, 409–420 This journal is ª The Royal Society of Chemistry 2011
Dow
nloa
ded
by L
awre
nce
Ber
kele
y N
atio
nal L
abor
ator
y on
29
Mar
ch 2
011
Publ
ishe
d on
08
Sept
embe
r 20
10 o
n ht
tp://
pubs
.rsc
.org
| do
i:10.
1039
/C00
4367
MView Online
to make 57Fe-1.13 The reaction mixture was stirred until no more red-violet startingmaterial was visible. The resulting yellow solution was filtered away from the insol-uble NaCl, and the filtrate was dried under vacuum. The product was purified byreprecipitation by slow addition of Et2O to a CH2Cl2 solution of the salt. SolutionIR in CH2Cl2: 1950 (s) cm�1 ([HFeCO(dppe)2]BF4), 1946 (s) cm�1 ([DFeCO(dp-pe)2]BF4).
4.2 Nuclear resonant vibrational spectroscopy
NRVS is rapidly becoming a popular technique for probing the dynamics of Fe inmetalloproteins.26,27 This measurement involves scanning an extremely monochro-matic X-ray beam through a nuclear resonance. Apart from the zero phononrecoil-free M€ossbauer resonance, there are transitions that correspond to nuclearexcitation plus creation (Stokes) or annihilation (anti-Stokes) of phonons. TheNRVS intensity for a given normal mode is proportional to the motion of the reso-nant nucleus j (in this case 57Fe) along the direction of the incident X-ray beam.27,28
For a randomly oriented sample, a NRVS transition for normal mode a contributesa fraction fa to the normalized excitation probability that is directly proportional tothe Fe mode composition factor eja
2 and inversely proportional to �na:28,29
fa ¼1
3
�nR
�na
e2jað�na þ 1Þ f (1)
In the above equation, �na is the difference between the photon energy and therecoil-free nuclear resonance energy in wave numbers, �nR is the recoil energy (�16cm�1), �na ¼ [exp(hc�na/kBT) � 1]�1 is the thermal occupation factor for a mode offrequency �na at temperature T,28 and the recoil-free fraction f depends on hx2
Fei,the mean square fluctuation of the Fe nucleus along the beam direction. It is alsouseful to define an 57Fe-centered partial vibrational density of states (PVDOS), usinga lineshape function:28,29
DFeð�nÞ ¼X
a
e2Fea Lð�n� �naÞ (2)
The 57Fe PVDOS can be extracted from the raw NRVS using the PHOENIX soft-ware package,30 and the Fe mode composition factor e2
ja for a given eigenvector canbe calculated from a normal mode analysis via:28,31
e2Fea ¼ mFeq
2Fea=
"Xi
miq2ia
#(3)
where mi and q2ia are the mass of atom i and its mean square motion respectively.
57Fe NRVS spectra were recorded using published procedures32 on multiple occa-sions at beamline 3-ID at the Advanced Photon Source (APS)33 and at beamline9-XU at SPring-8, Japan.34 The APS provided �2.5 � 109 photons/s in 1 meV band-width at 14.4125 keV in a 1 mm (vertical)� 3 mm (horizontal) spot. The APS mono-chromators consisted of a water-cooled diamond (1,1,1) double crystalmonochromator with 1.1 eV bandpass, followed by separate Si(4,0,0) andSi(10,6,4) channel-cut crystals in a symmetric geometry. The flux at SPring-8 was�3.2 � 109 in a 1.1 meV bandwidth; the monochromators there consisted of a liquidN2-cooled Si(1,1,1) double crystal monochromator, and asymmetrically cut Si(5,1,1)and Si(9,7,5) crystals. During NRVS measurements, samples were maintained at lowtemperatures using liquid He cryostats. Temperatures for individual spectra werecalculated using the ratio of anti-Stokes to Stokes intensity according to S(�E) ¼S(E) exp(�E/kT). Spectra were recorded between �30 meV and 90 meV in 0.25meV steps. Delayed nuclear fluorescence and Fe K fluorescence (from internal
This journal is ª The Royal Society of Chemistry 2011 Faraday Discuss., 2011, 148, 409–420 | 417
Dow
nloa
ded
by L
awre
nce
Ber
kele
y N
atio
nal L
abor
ator
y on
29
Mar
ch 2
011
Publ
ishe
d on
08
Sept
embe
r 20
10 o
n ht
tp://
pubs
.rsc
.org
| do
i:10.
1039
/C00
4367
MView Online
conversion) were recorded with a single avalanche 1 cm2 square photodiode (APD)at the APS and with an APD array at SPring-8.35 Each scan required about 1 h, andall scans were added and normalized to the intensity of the incident beam.
4.3 FT-IR spectroscopy
Far and mid-infrared absorption spectra (100 to 2000 cm�1) were recorded at roomtemperature using a Br€uker IFS 66 v/S FTIR spectrometer at 4 cm�1 resolution. Themeasurements were made using different medium materials, windows, beam splittersand infrared detectors. All the measurements were made using a broadband mid-infrared source inside the FTIR spectrometer. The sample chamber was continu-ously pumped to <1 torr during the measurement to minimize the absorption ofmoisture vapor.
For the region of 100–500 cm�1, the sample was prepared as Nujol mulls andmounted in between two polyethylene windows. A 6 micrometre thick mylar beams-plitter (100–550 cm�1) was selected in the FTIR spectrometer and a liquid He cooledSi bolometer was used to collect the infrared signal transmitted through the sample.For the region of 400–700 cm�1, a KBr mixture with the sample was pressed andmounted in between polyethylene windows to prevent air from contacting thesample during measurement. A KBr beamsplitter and a liquid He cooled Si bolom-eter were used to collect the data. The region above 700 cm�1 was measured withKBr press/ZnSe windows/KBr beam splitter/region extended MCT detector (600–2000 cm�1). All the samples were prepared inside a nitrogen glovebox.
4.4 FT-Raman spectroscopy
FT-Raman spectra were recorded in Frei’s Research Lab in LBNL, with a Brukermodel FRA-106 spectrometer equipped with a Nd:YAG laser source and witha liquid N2 cooled Ge detector (Canberra). The Nd:YAG laser emits at 1.064 mm(9394.3 cm�1), and has a maximum power of 525 mW. In our particular experiment,a reduced laser power of 50 mW is used to reduced the possibility of the samplesfrom fluorescence and from radiation damage. No sample radiation damage wasobserved. The resolution was set to 4 cm�1 in agreement with the FTIR measurementon the same samples. The accumulation time was about 6 h for each sample. The FT-Raman samples were loaded into 100 mm in length 4 mm in diameter quartz tubesinside a nitrogen glovebox (O2 <1 ppm) and were wax sealed. Such sealed tubes werethen inserted into a special aluminium sample holder inside the FT-Raman’s samplecompartment.
4.5 DFT calculations
The PBE functional36 as implemented in the ADF 2007.01 software, has been pres-ently used for all the calculations. Our tests show that PBE performs very similarlyto PW9137,38 which we used previously to simulate NRVS spectra.12 A TZ2P non-relativistic valence triple zeta basis set with two polarization functions was usedfor all the atoms. An extra d Slater type orbital has been used to describe the ironcenter, meaning TZ2P+ basis set for Fe. The (unpublished) X-ray structure of[HFe(CO)(dppe)2](C2H4)2, which is very similar to the corresponding cyanidecomplex,39 was used as a starting point for modeling. Together with the hydrogenatoms added, the size of the system is 108 atoms. The metal center is low spinFe(II), and the total charge of the iron hydride complex is +1. The DFT optimizedstructure of the complex was further used for the analytic Hessian calculation andgeneration of the IR and Raman intensities as implemented in ADF. NRVS inten-sities were calculated using an in-house ‘‘Q-SPECTOR’’ program that analyzes theCartesian normal mode displacements computed by ADF and other quantum chem-istry programs. To mimic the experimental resolution, the DFT spectra wereprepared using a convolution of the ‘stick’ intensities with 7 cm�1 broadening.
418 | Faraday Discuss., 2011, 148, 409–420 This journal is ª The Royal Society of Chemistry 2011
Dow
nloa
ded
by L
awre
nce
Ber
kele
y N
atio
nal L
abor
ator
y on
29
Mar
ch 2
011
Publ
ishe
d on
08
Sept
embe
r 20
10 o
n ht
tp://
pubs
.rsc
.org
| do
i:10.
1039
/C00
4367
MView Online
Lorentz line shape was chosen to simulate the IR and NRVS results, and Gaussianline shape was chosen for the Raman spectroscopy.
Acknowledgements
This work was supported by NIH grants GM39914, GM61153, GM-65440 and EB-001962 and by DOE OBER and NSF CHE-0745353. V. P. is grateful for a researchfellowship provided by the Alexander von Humboldt Foundation. The FTIRspectra were done in ALS beamline 1.4 with the assistance of Dr Hao Zhao andDr Michael Martin. The FT-Raman were performed in Frei’s Lab in LBNL, withthe assistance of Dr Walter Weare, and Dr Heinz Frei. We thank Dr Curtis Whaleyand Dr Thomas Rauchfuss for providing samples and for providing informationabout the crystal structure of 1.
References
1 P. M. Vignais, B. Billoud and J. Meyer, FEMS Microbiol. Rev., 2001, 25, 455–501.2 P. E. M. Siegbahn, J. W. Tye and M. B. Hall, Chem. Rev., 2007, 107, 4414–4435.3 S. Shima and S. K. Thauer, Chem. Rec., 2007, 7, 37–46.4 S. Shima, O. Pilak, S. Vogt, M. Schlick, M. S. Stagni, W. Meyer-Klaucke, E. Warkentin,
R. K. Thauer and U. Ermler, Science, 2008, 321, 572–575.5 S. Vogt, E. J. Lyon, S. Shima and R. K. Thauer, The exchange activities of [Fe] hydrogenase
(iron-sulfur-cluster free, J. Biol. Inorg. Chem., 2008, 13, 97–106.6 J. P. Whitehead, R. J. Gurbiel, C. Bagyinka, B. M. Hoffman and M. J. Maroney, J. Am.
Chem. Soc., 1993, 115, 5629.7 M. Brecht, M. vanGastel, T. Buhrke, B. Friedrich and W. Lubitz, J. Am. Chem. Soc., 2003,
125, 13075–13083.8 S. Foerster, M. va Gastel, M. Brecht and W. Lubitz, J. Biol. Inorg. Chem., 2005, 10, 51.9 W. Lubitz, E. Reijerse and M. van Gastel, Chem. Rev., 2007, 107, 4331–4365.
10 X. Yang and M. B. Hall, J. Am. Chem. Soc., 2009, 131, 10901–10908.11 C. Tard and C. J. Pickett, Chem. Rev., 2009, 109, 2245.12 Y. Guo, H. Wang, Y. Xiao, S. Vogt, R. K. Thauer, S. Shima, P. I. Volkers, T. B. Rauchfuss,
V. Pelmenschikov, D. A. Case, E. E. Alp, W. Sturhahn, Y. Yoda and S. P. Cramer, Inorg.Chem., 2008, 47, 3969–3977.
13 S. E. Landau, R. H. Morris and A. J. Lough, Inorg. Chem., 1999, 38, 6060–6068.14 O. Franke, B. E. Wiesler, N. Lehnert and F. Tuczek, Z. Anorg. Allg. Chem., 2002, 628,
2395–2402.15 U. Bergmann, W. Sturhahn, J. Linn, Donald, J. Jenney, Francis, M. W. W. Adams,
K. Rupnik, B. J. Hales, E. E. Alp, A. Mayse and S. P. Cramer, J. Am. Chem. Soc., 2003,125, 4016–4017.
16 G. J. Kubas, Chem. Rev., 2007, 107, 4152–4205.17 Y. Guo. 2008 Ph.D. thesis, University of California, Davis.18 K. Nakamoto. 1997 Infrared and Raman Spectra of Inorganic and Coordination Compounds,
5th ed. (Wiley-Interscience, New York).19 J.-J. Brunet, R. Chauvin, J. Chiffre, S. Huguet and P. Leglaye, J. Organomet. Chem., 1998,
566, 117–123.20 E. Rocchini, P. Rigo, A. Mezzetti, T. Stephan, R. H. Morris, A. J. Lough, C. E. Forde,
T. P. Fongc and S. D. Drouinc, J. Chem. Soc., Dalton Trans., 2000, 3591–3602.21 O. Franke, B. E. Wieslerb, N. Lehnerta, G. Petersa, P. Burgerc and F. Tuczeka, Z. Anorg.
Allg. Chem., 2006, 632, 1247–1256.22 M. P. Robalo, A. P. S. Teixeira, M. H. Garcia, M. F M. da Piedade, M. T. Duarte,
A. R. Dias, J. Campo, W. Wenseleers and E. Goovaerts, Eur. J. Inorg. Chem., 2006,2175–2185.
23 Y. Xiao, K. Fisher, M. C. Smith, W. E. Newton, D. A. Case, S. J. George, H. Wang,W. Sturhahn, E. E. Alp, J. Zhao, Y. Yoda and S. P. Cramer, J. Am. Chem. Soc., 2006,128, 7608–7612.
24 Y. Xiao, M. Koutmos, D. A. Case, D. Coucouvanis, Wang and H. S. P. Cramer, DaltonTrans., 2006, 2192–2201.
25 D. Mitra, V. Pelmenschikov, A. Guo, D. A. Case, H. Wang, F. Jenney, M. W. W. Adamsand S. P. Cramer, Submitted for publication., 2010.
26 E. Alp, W. Sturhahn, T. S. Toellner, J. Zhao, M. Hu and D. E. Brown, Hyperfine Interact.,2002, 144–145, 3–20.
This journal is ª The Royal Society of Chemistry 2011 Faraday Discuss., 2011, 148, 409–420 | 419
Dow
nloa
ded
by L
awre
nce
Ber
kele
y N
atio
nal L
abor
ator
y on
29
Mar
ch 2
011
Publ
ishe
d on
08
Sept
embe
r 20
10 o
n ht
tp://
pubs
.rsc
.org
| do
i:10.
1039
/C00
4367
MView Online
27 W. Sturhahn, J. Phys.: Condens. Matter, 2004, 16, S497–S530.28 B. M. Leu, M. Z. Zgiersi, G. R. Wyllie, W. R. Scheidt, W. Sturhahn, E. E. Alp,
S. M. Durbin and J. T. Sage, J. Am. Chem. Soc., 2004, 126, 4211–4227.29 J. T. Sage, C. Paxson, G. R. A. Wylie, W. Sturhahn, S. M. Durbin, P. M. Champion,
E. E. Alp and W. R. Scheidt, J. Phys.: Condens. Matter, 2001, 13, 7707–7722.30 W. Sturhahn, Hyperfine Interact., 2000, 125, 149–172.31 A. I. Chumakov, R. R€uffer, O. Leupold and I. Sergueev, Struct. Chem., 2003, 14, 109–119.32 W. Sturhahn, J. Phys.: Condens. Matter, 2004, 16, S497–S530.33 T. Toellner, Hyperfine Interact., 2000, 125, 3–28.34 Y. Yoda, M. Yabashi, K. Izumi, X. W. Zhang, S. Kishimoto, S. Kitao, M. Seto, T. Mitsui,
T. Harami, Y. Imai and S. Kikuta, Nucl. Instrum. Methods Phys. Res., Sect. A, 2001, 467–468, 715–718.
35 S. Kishimoto, Y. Yoda, M. Seto, S. Kitao, Y. Kobayashi, R. Haruki and T. Harami, Nucl.Instrum. Methods Phys. Res., Sect. A, 2003, 513, 193–196.
36 J. P. Perdew, K. Burke and M. Ernzerhof, Phys. Rev. Lett., 1996, 77, 3865–3868.37 J. P. Perdew, J. A. Chevary, S. H. Vosko, K. A. Jackson, M. R. Pedersen, D. J. Singh and
C. Fiolhais, Phys. Rev. B: Condens. Matter, 1992, 46, 6671–6687.38 K. Burke, J. P. Perdew and Y. Wang. 1997 in Electronic Density Functional Theory: Recent
Progress and New Directions, ed. J. F. Dobson, G. Vignale and M. P. Das. (Plenum, NewYork), pp. 81–100.
39 S. S. P. R. Almeida, M. Fatima, C. G. da Silva, L. B. Jerzykeiwicz, P. Sobota andA. J. L. Pombeiro, Inorg. Chim. Acta, 2003, 356, 259–266.
420 | Faraday Discuss., 2011, 148, 409–420 This journal is ª The Royal Society of Chemistry 2011
Top Related
Copyright © 2022 FDOKUMEN

