


Bahasa
Halaman
Hukum


BioMed CentralBMC Bioinformatics
ss
Open AcceResearchFast splice site detection using information content and feature reductionAKMA Baten*1, SK Halgamuge1 and BCH Chang2Address: 1Biomechanical Engineering Research Group, Department of Mechanical Engineering, Melbourne School of Engineering, The University of Melbourne, Victoria 3010, Australia and 2Institute of Plant and Microbial Biology, Academia Sinica, Taiwan
Email: AKMA Baten* - [email protected]; SK Halgamuge - [email protected]; BCH Chang - [email protected]
* Corresponding author
AbstractBackground: Accurate identification of splice sites in DNA sequences plays a key role in theprediction of gene structure in eukaryotes. Already many computational methods have beenproposed for the detection of splice sites and some of them showed high prediction accuracy.However, most of these methods are limited in terms of their long computation time when appliedto whole genome sequence data.
Results: In this paper we propose a hybrid algorithm which combines several effective andinformative input features with the state of the art support vector machine (SVM). To obtain theinput features we employ information content method based on Shannon's information theory,Shapiro's score scheme, and Markovian probabilities. We also use a feature elimination scheme toreduce the less informative features from the input data.
Conclusion: In this study we propose a new feature based splice site detection method that showsimproved acceptor and donor splice site detection in DNA sequences when the performance iscompared with various state of the art and well known methods.
BackgroundOver the past decades, the scientific community has expe-rienced a major growth in numbers of sequence data.With the emergence of novel and efficient sequencingtechnology, DNA sequencing is now much faster.Sequencing of several genomes including the humangenome have been completed successfully. This massiveamount of sequence data demands sophisticated tools forthe analysis of data.
Identifying genes accurately is one of the most importantand challenging tasks in bioinformatics and it requires theprediction of the complete gene structure. Identificationof splice sites is the core component of eukaryotic genefinding algorithms. Their success depends on the preciseidentification of the exon-intron structure and the splicesites. Most of the eukaryotic protein coding genes are char-acterized by exons and introns. Exons are the protein cod-ing portion of a gene and they are segmented withintervening sequences of introns. The border between an
from Asia Pacific Bioinformatics Network (APBioNet) Seventh International Conference on Bioinformatics (InCoB2008)Taipei, Taiwan. 20–23 October 2008
Published: 12 December 2008
BMC Bioinformatics 2008, 9(Suppl 12):S8 doi:10.1186/1471-2105-9-S12-S8
<supplement> <title> <p>Seventh International Conference on Bioinformatics (InCoB2008)</p> </title> <editor>Shoba Ranganathan, Wen-Lian Hsu, Ueng-Cheng Yang and Tin Wee Tan</editor> <note>Proceedings</note> </supplement>
This article is available from: http://www.biomedcentral.com/1471-2105/9/S12/S8
© 2008 Baten et al; licensee BioMed Central Ltd. This is an open access article distributed under the terms of the Creative Commons Attribution License (http://creativecommons.org/licenses/by/2.0), which permits unrestricted use, distribution, and reproduction in any medium, provided the original work is properly cited.
Page 1 of 12(page number not for citation purposes)

BMC Bioinformatics 2008, 9(Suppl 12):S8 http://www.biomedcentral.com/1471-2105/9/S12/S8
exon and an intron is known as the splice site. The splicesite upstream of an intron is called the donor splice site(in the direction 5' to 3') and one that is downstream ofan intron is the acceptor splice site (in the direction 3' to5'). The consensus sequence refers to the nucleotides,which are conserved or most frequently observed in a par-ticular position. The acceptor and donor splice sites withconsensus AG (corresponding to the end of an intron)and GT (corresponding to the beginning of an intron)dinucleotides respectively are known as canonical splicesites. Approximately 99% of the splice sites are canonical[1]. As AG and GT represent possible acceptor and donorsplice sites, every AG and GT in a DNA sequence is a can-didate acceptor or donor splice site and they need to beclassified as either a real (true) splice site or a pseudo(false) splice site.
Over the years many computational methods have beenproposed for the identification of splice sites. Most ofthose methods are designed to identify the apparent con-sensus AG and GT in the splicing junction. These methodscan be largely classified into probabilistic methods [2-8],neural network and support vector machine methods [9-19], and methods based on discriminant analysis [20,21].Neural networks and support vector machines (SVM)learn the complex features of neighbourhoods surround-ing the consensus AG/GT dinucleotides by a complexnon-linear transformation. Probabilistic models estimateposition specific probabilities of splice sites by computinglikelihoods of candidate signal sequences. The discrimi-nant analysis uses several statistical measures to evaluatethe presence of specific nucleotides, recognizing the splicesites without explicitly determining the probability distri-butions [18].
In DNA sequences, true consensus AG/GT dinucleotidesare outnumbered by many false AG/GTs. However, nucle-otides surrounding true AG/GTs show a certain nucleotidedependency and sequential relationship compared tothose surrounding false AG/GTs. There are several meth-ods which are particularly designed to capture this rela-tionship and to identify true splice sites among numerousfalse ones. Weight matrix methods (WMM) and methodsbased on Markov models are popular methods of this cat-egory. WMM was successfully adopted in methods likeNetPlantGene [22] and NNSplice [10]. Salzberg et al. andZhang et al. [2,6], used a linear first order Markov model(MM1) also known as the weight array method (WAM)and they have achieved a good splice site prediction accu-racy. MM1 only utilizes first order sequential relationship.It is desirable to use a higher order Markov model to cap-ture the higher order and extended sequential relation-ship. However, the computational complexity increasespolynomialy with the increase of the order of the Markovmodel, and also higher order Markov models require a
large number of training samples. The maximal depend-ence decomposition (MDD) algorithm was proposed byBurge et al. [23] to overcome these limitations. MDD is adecision tree process and models the dependencybetween adjacent nucleotides. To take the advantages ofboth MDD and Markov models, Pertea et al. [4] proposedthe GeneSplicer method which combines MDD and sec-ond order Markov models (MM2). GeneSplicer showedan improved splice site detection performance. Morerecently, Rajapakse et al. [17] proposed a complex splicesite detection method by combining mostly second orderMarkov models with backpropagation neural networks(BPNN). This method showed an improved performanceover GeneSplicer, however, BPNN is already computa-tionally expensive and this method requires a largersequence window. In contrast, a machine learning tech-nique such as SVM has the advantage of inferring an opti-mal classifier from the training data. SVM has been usedto classify splice site data with limited success [9,12,14-16].
Most of the existing splice site detection methods focusedon the improvement of classification performance. How-ever other studies suggest that, considering the increasinggrowth of sequence data, the focus of new methodsshould be towards developing faster methods [24-27]. Inour previous work we showed an improved splice sitedetection performance by using several preprocessingmethods including WMM0/MM0, WMM1, MM1 withSVM [18]. However, the training time and the number ofinput features to SVM is a major concern. SVM performsbetter when it is trained with the most important andmeaningful features. So, the reduction of less importantfeatures may improve both the classification performanceand training time of SVM. In this paper, we propose a fea-ture selection strategy which reduces the less importantfeatures from the input data. We also combine the wellstudied information content method based on Shannon'sinformation theory [28-30] and the Shapiro's scoremethod [31] to extract meaningful information fromsequence that can potentially identify splice sites. Ourmethod showed an improved splice site detection per-formance when compared to the existing methods interms of classification accuracy and training time.
ResultsClassification performance comparisonOur hybrid algorithm combines several effective andinformative input features with the state of the art supportvector machine (SVM). To obtain the input features weemploy information content method based on Shannon'sinformation theory, Shapiro's score scheme, and Marko-vian probabilities. We also use the F-score feature elimina-tion scheme to reduce the less informative features fromthe input data. We use the publicly available NN269 [10]
Page 2 of 12(page number not for citation purposes)

BMC Bioinformatics 2008, 9(Suppl 12):S8 http://www.biomedcentral.com/1471-2105/9/S12/S8
splice site dataset to evaluate the performance of ourmethod. The MM1 parameters are calculated from thedataset and F-score method (refer to the method section)is applied to reduce the number of MM1 parameters,which is referred as Reduced MM1 SVM method. We alsocalculate the information content and Shapiro's scorefrom the dataset and use the proposed the IC Shapiro SVMmethod, which is a linear combination of informationcontent and Shapiro's score. We compare the performanceof our methods with MM1 SVM method as proposed [18].To evaluate the classification performance we use severalperformance evaluation methods such as the sensitivity,specificity, receiver operating characteristics curve (ROC),and the area under ROC (AUC) as described in themethod section.
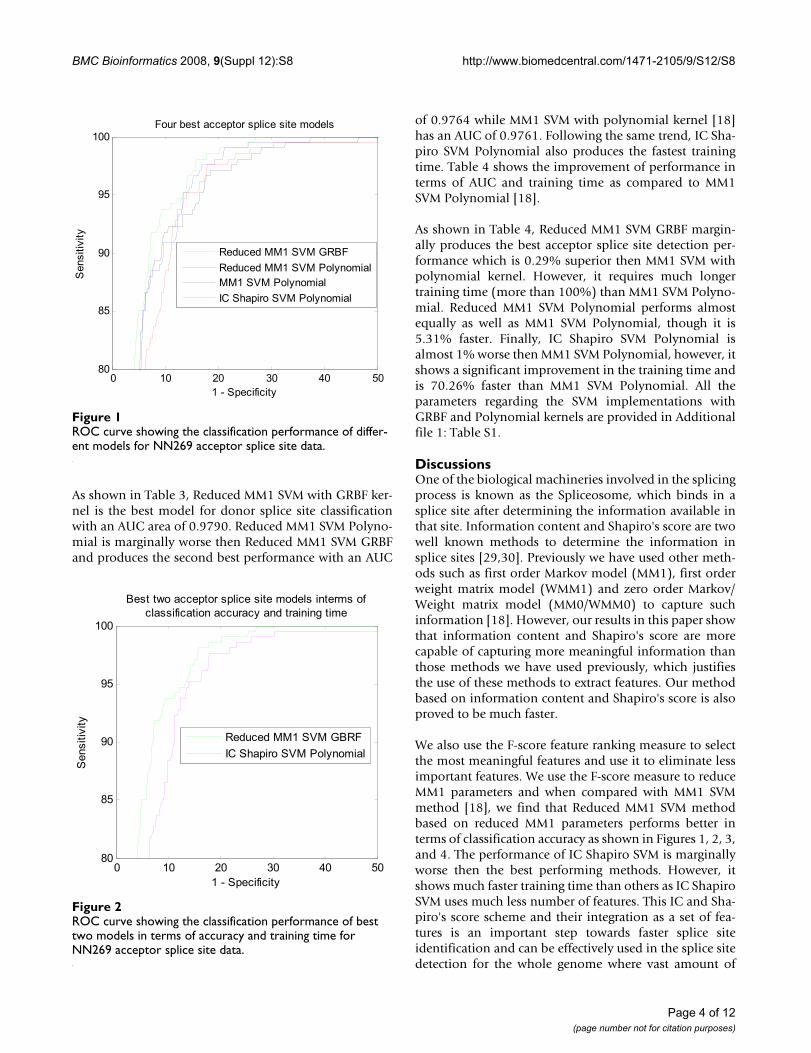
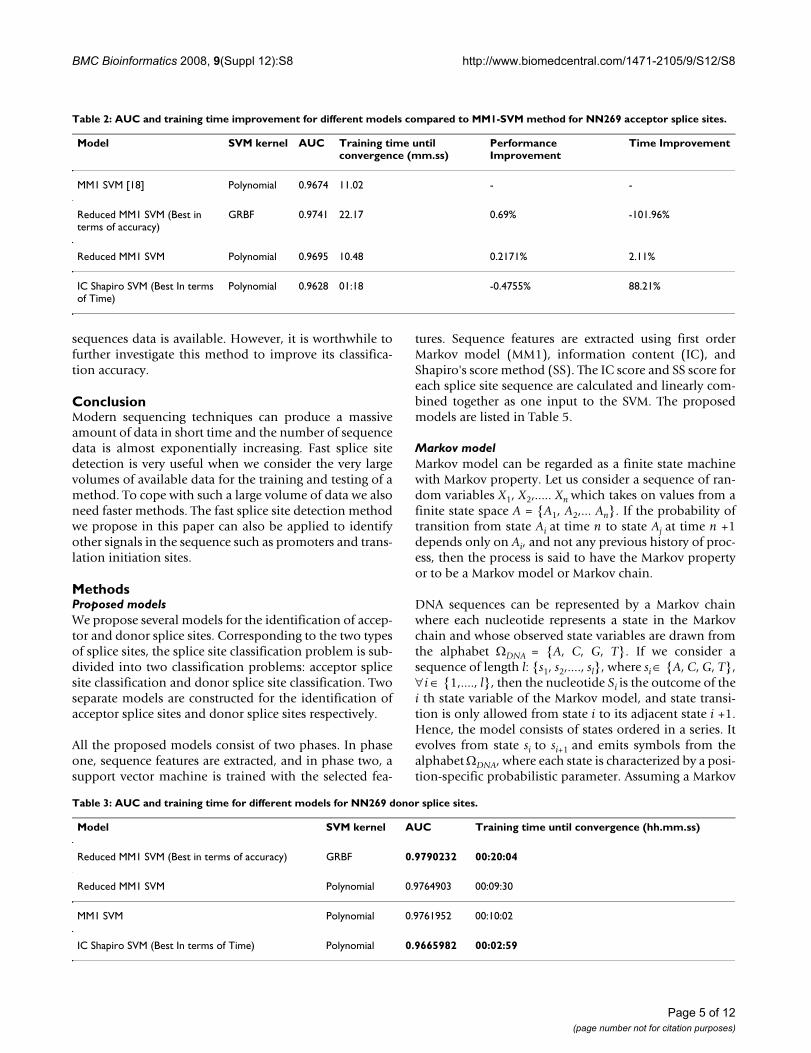
Figure 1 shows the classification performance of differentmodels for NN269 acceptor splice site data. The perform-ance of the proposed Reduced MM1 SVM and IC ShapiroSVM is compared with the original MM1 SVM model [18].As shown in Figure 1, the Reduced MM1 SVM model withGRBF kernel produces the best classification performancefor acceptor splice sites. Reduced MM1 SVM with polyno-mial kernel produces the second best performance. MM1SVM with polynomial kernel method [18], produces thethird best performance while the performance of IC Sha-piro SVM with polynomial kernel is not as good as others.Even though, Reduced MM1 SVM with GRBF kernelshows the best classification performance, from the ROCcurve we can see all the models perform very closely andhence, to get a better measure of the classification per-formance we calculated the AUC covered by each modelfrom the ROC. Computational speed is another impor-tant issue for the algorithms applied in this problem. Inthis regard, we also calculate the training time required foreach classification models. For all our simulations weused an Intel P4 3.2 GHz system with 1 GB RAM. Both theAUC and training time for each of the models are shownin Table 1. Figure 2 shows the best two models for accep-tor splice site identification in terms of best accuracy(Reduced MM1 SVM with GRBF kernel) and best trainingtime (IC Shapiro SVM with polynomial kernel).
As shown in Table 1, Reduced MM1 SVM with GRBF ker-nel produces the best performance with an AUC area of0.9741. Reduced MM1 SVM with polynomial kernel pro-duces the second best performance with an AUC of0.9695 while MM1 SVM with polynomial kernel [18] hasan AUC of 0.9674. Though IC Shapiro SVM with polyno-mial kernel has an AUC of 0.9628, which is marginallyworse than the best performing model, it produces thefastest training time. Table 2 shows the improvement ofperformance in terms of AUC and training time as com-pared to MM1 SVM Polynomial [18].
As shown in Table 2, the best acceptor splice site detectionperformance is produced by Reduced MM1 SVM withGRBF kernel which is 0.69% superior then MM1 SVMwith polynomial kernel. However, Reduced MM1 SVMGRBF requires much longer training time (more than100%) than MM1 SVM Polynomial. Reduced MM1 SVMPolynomial improves the performance by 0.21% and italso 2.11% faster than MM1 SVM Polynomial. Finally, ICShapiro SVM Polynomial is just 0.47% worse then MM1SVM Polynomial, however, it shows a significantimprovement in the training time and is 88.21% fasterthan MM1 SVM Polynomial.
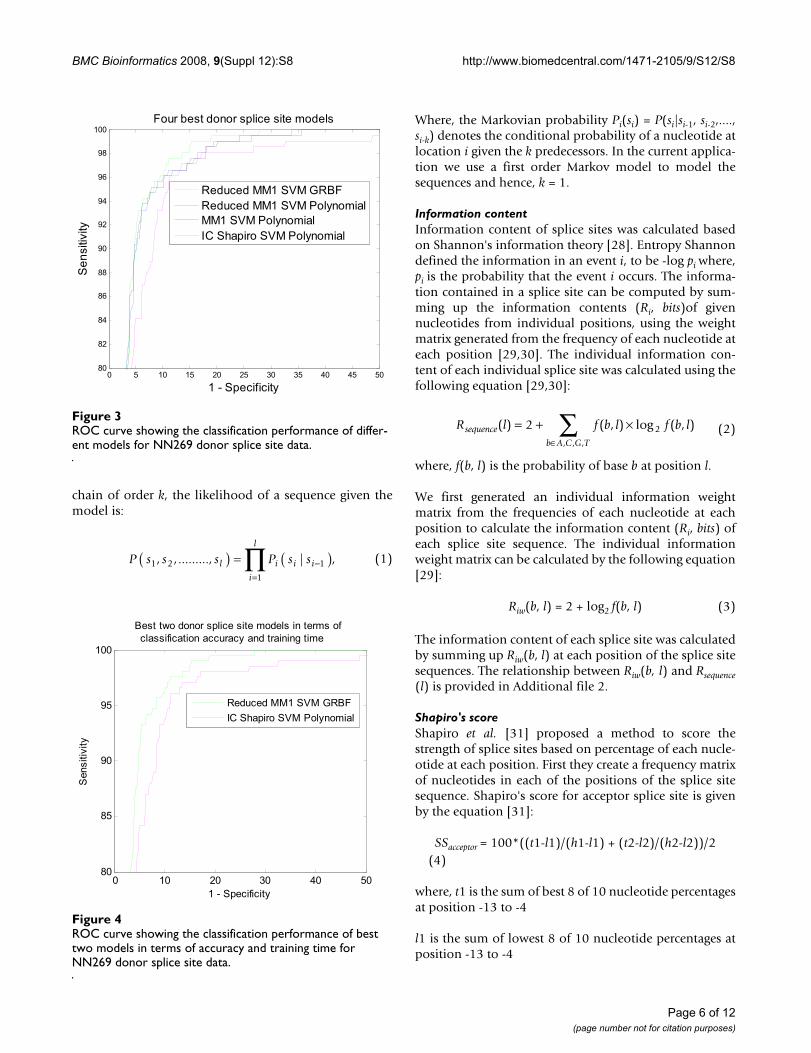
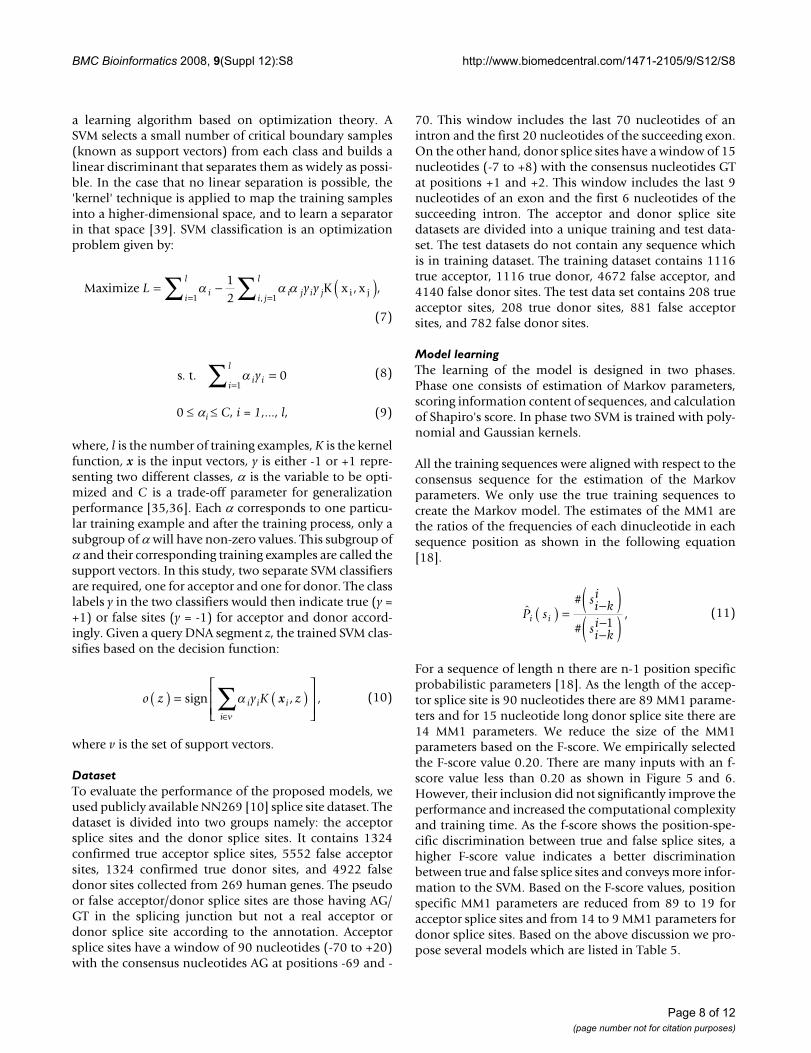
Figure 3 shows the classification performance of differentmodels in terms of NN269 donor splice site dataset. Theperformance of all the models developed in this paper iscompared with MM1 SVM Polynomial model [18]. Asshown in Figure 3, the Reduced MM1 SVM model withGRBF kernel produces the best classification performancefor donor splice sites. Reduced MM1 SVM with polyno-mial kernel produces the second best performance. Per-formance of all the models is very close except IC ShapiroSVM with polynomial kernel. The performance of themodels shows the similar trend as that of acceptor splicesite classification. We also calculate AUC and the trainingtime required for each of the models which are shown inTable 3. Figure 4 shows the two best methods in terms ofclassification accuracy (Reduced MM1 SVM GRBF) andtraining time (IC Shapiro SVM Polynomial).
Table 1: AUC and training time for different models for NN269 acceptor splice sites.
Model SVM kernel AUC Training time until convergence (hh.mm.ss)
Reduced MM1 SVM (Best in terms of accuracy) GRBF 0.9741389 00.22.17
Reduced MM1 SVM Polynomial 0.9695822 00.10.48
MM1 SVM [18] Polynomial 0.9674048 00.11.02
IC Shapiro SVM (Best In terms of Time) Polynomial 0.96287 00:01:18
Page 3 of 12(page number not for citation purposes)
BMC Bioinformatics 2008, 9(Suppl 12):S8 http://www.biomedcentral.com/1471-2105/9/S12/S8
As shown in Table 3, Reduced MM1 SVM with GRBF ker-nel is the best model for donor splice site classificationwith an AUC area of 0.9790. Reduced MM1 SVM Polyno-mial is marginally worse then Reduced MM1 SVM GRBFand produces the second best performance with an AUC
of 0.9764 while MM1 SVM with polynomial kernel [18]has an AUC of 0.9761. Following the same trend, IC Sha-piro SVM Polynomial also produces the fastest trainingtime. Table 4 shows the improvement of performance interms of AUC and training time as compared to MM1SVM Polynomial [18].
As shown in Table 4, Reduced MM1 SVM GRBF margin-ally produces the best acceptor splice site detection per-formance which is 0.29% superior then MM1 SVM withpolynomial kernel. However, it requires much longertraining time (more than 100%) than MM1 SVM Polyno-mial. Reduced MM1 SVM Polynomial performs almostequally as well as MM1 SVM Polynomial, though it is5.31% faster. Finally, IC Shapiro SVM Polynomial isalmost 1% worse then MM1 SVM Polynomial, however, itshows a significant improvement in the training time andis 70.26% faster than MM1 SVM Polynomial. All theparameters regarding the SVM implementations withGRBF and Polynomial kernels are provided in Additionalfile 1: Table S1.
DiscussionsOne of the biological machineries involved in the splicingprocess is known as the Spliceosome, which binds in asplice site after determining the information available inthat site. Information content and Shapiro's score are twowell known methods to determine the information insplice sites [29,30]. Previously we have used other meth-ods such as first order Markov model (MM1), first orderweight matrix model (WMM1) and zero order Markov/Weight matrix model (MM0/WMM0) to capture suchinformation [18]. However, our results in this paper showthat information content and Shapiro's score are morecapable of capturing more meaningful information thanthose methods we have used previously, which justifiesthe use of these methods to extract features. Our methodbased on information content and Shapiro's score is alsoproved to be much faster.
We also use the F-score feature ranking measure to selectthe most meaningful features and use it to eliminate lessimportant features. We use the F-score measure to reduceMM1 parameters and when compared with MM1 SVMmethod [18], we find that Reduced MM1 SVM methodbased on reduced MM1 parameters performs better interms of classification accuracy as shown in Figures 1, 2, 3,and 4. The performance of IC Shapiro SVM is marginallyworse then the best performing methods. However, itshows much faster training time than others as IC ShapiroSVM uses much less number of features. This IC and Sha-piro's score scheme and their integration as a set of fea-tures is an important step towards faster splice siteidentification and can be effectively used in the splice sitedetection for the whole genome where vast amount of
ROC curve showing the classification performance of differ-ent models for NN269 acceptor splice site dataFigure 1ROC curve showing the classification performance of differ-ent models for NN269 acceptor splice site data.
0 10 20 30 40 5080
85
90
95
100
1 - Specificity
Sen
sitiv
ity
Four best acceptor splice site models
Reduced MM1 SVM GRBFReduced MM1 SVM PolynomialMM1 SVM PolynomialIC Shapiro SVM Polynomial
ROC curve showing the classification performance of best two models in terms of accuracy and training time for NN269 acceptor splice site dataFigure 2ROC curve showing the classification performance of best two models in terms of accuracy and training time for NN269 acceptor splice site data.
0 10 20 30 40 5080
85
90
95
100
1 - Specificity
Sen
sitiv
ity
Best two acceptor splice site models interms ofclassification accuracy and training time
Reduced MM1 SVM GBRFIC Shapiro SVM Polynomial
Page 4 of 12(page number not for citation purposes)
BMC Bioinformatics 2008, 9(Suppl 12):S8 http://www.biomedcentral.com/1471-2105/9/S12/S8
sequences data is available. However, it is worthwhile tofurther investigate this method to improve its classifica-tion accuracy.
ConclusionModern sequencing techniques can produce a massiveamount of data in short time and the number of sequencedata is almost exponentially increasing. Fast splice sitedetection is very useful when we consider the very largevolumes of available data for the training and testing of amethod. To cope with such a large volume of data we alsoneed faster methods. The fast splice site detection methodwe propose in this paper can also be applied to identifyother signals in the sequence such as promoters and trans-lation initiation sites.
MethodsProposed modelsWe propose several models for the identification of accep-tor and donor splice sites. Corresponding to the two typesof splice sites, the splice site classification problem is sub-divided into two classification problems: acceptor splicesite classification and donor splice site classification. Twoseparate models are constructed for the identification ofacceptor splice sites and donor splice sites respectively.
All the proposed models consist of two phases. In phaseone, sequence features are extracted, and in phase two, asupport vector machine is trained with the selected fea-
tures. Sequence features are extracted using first orderMarkov model (MM1), information content (IC), andShapiro's score method (SS). The IC score and SS score foreach splice site sequence are calculated and linearly com-bined together as one input to the SVM. The proposedmodels are listed in Table 5.
Markov modelMarkov model can be regarded as a finite state machinewith Markov property. Let us consider a sequence of ran-dom variables X1, X2,..... Xn which takes on values from afinite state space A = {A1, A2,... An}. If the probability oftransition from state Ai at time n to state Aj at time n +1depends only on Ai, and not any previous history of proc-ess, then the process is said to have the Markov propertyor to be a Markov model or Markov chain.
DNA sequences can be represented by a Markov chainwhere each nucleotide represents a state in the Markovchain and whose observed state variables are drawn fromthe alphabet ΩDNA = {A, C, G, T}. If we consider asequence of length l: {s1, s2,...., sl}, where si ∈ {A, C, G, T},∀i ∈ {1,...., l}, then the nucleotide Si is the outcome of thei th state variable of the Markov model, and state transi-tion is only allowed from state i to its adjacent state i +1.Hence, the model consists of states ordered in a series. Itevolves from state si to si+1 and emits symbols from thealphabet ΩDNA, where each state is characterized by a posi-tion-specific probabilistic parameter. Assuming a Markov
Table 2: AUC and training time improvement for different models compared to MM1-SVM method for NN269 acceptor splice sites.
Model SVM kernel AUC Training time until convergence (mm.ss)
Performance Improvement
Time Improvement
MM1 SVM [18] Polynomial 0.9674 11.02 - -
Reduced MM1 SVM (Best in terms of accuracy)
GRBF 0.9741 22.17 0.69% -101.96%
Reduced MM1 SVM Polynomial 0.9695 10.48 0.2171% 2.11%
IC Shapiro SVM (Best In terms of Time)
Polynomial 0.9628 01:18 -0.4755% 88.21%
Table 3: AUC and training time for different models for NN269 donor splice sites.
Model SVM kernel AUC Training time until convergence (hh.mm.ss)
Reduced MM1 SVM (Best in terms of accuracy) GRBF 0.9790232 00:20:04
Reduced MM1 SVM Polynomial 0.9764903 00:09:30
MM1 SVM Polynomial 0.9761952 00:10:02
IC Shapiro SVM (Best In terms of Time) Polynomial 0.9665982 00:02:59
Page 5 of 12(page number not for citation purposes)
BMC Bioinformatics 2008, 9(Suppl 12):S8 http://www.biomedcentral.com/1471-2105/9/S12/S8
chain of order k, the likelihood of a sequence given themodel is:
Where, the Markovian probability Pi(si) = P(si|si-1, si-2,....,si-k) denotes the conditional probability of a nucleotide atlocation i given the k predecessors. In the current applica-tion we use a first order Markov model to model thesequences and hence, k = 1.
Information contentInformation content of splice sites was calculated basedon Shannon's information theory [28]. Entropy Shannondefined the information in an event i, to be -log pi where,pi is the probability that the event i occurs. The informa-tion contained in a splice site can be computed by sum-ming up the information contents (Ri, bits)of givennucleotides from individual positions, using the weightmatrix generated from the frequency of each nucleotide ateach position [29,30]. The individual information con-tent of each individual splice site was calculated using thefollowing equation [29,30]:
where, f(b, l) is the probability of base b at position l.
We first generated an individual information weightmatrix from the frequencies of each nucleotide at eachposition to calculate the information content (Ri, bits) ofeach splice site sequence. The individual informationweight matrix can be calculated by the following equation[29]:
Riw(b, l) = 2 + log2 f(b, l) (3)
The information content of each splice site was calculatedby summing up Riw(b, l) at each position of the splice sitesequences. The relationship between Riw(b, l) and Rsequence(l) is provided in Additional file 2.
Shapiro's scoreShapiro et al. [31] proposed a method to score thestrength of splice sites based on percentage of each nucle-otide at each position. First they create a frequency matrixof nucleotides in each of the positions of the splice sitesequence. Shapiro's score for acceptor splice site is givenby the equation [31]:
SSacceptor = 100*((t1-l1)/(h1-l1) + (t2-l2)/(h2-l2))/2(4)
where, t1 is the sum of best 8 of 10 nucleotide percentagesat position -13 to -4
l1 is the sum of lowest 8 of 10 nucleotide percentages atposition -13 to -4
P s s s P s sl i i i
i
l
1 2 1
1
, ,........., | ,( ) = ( )−=
∏ (1)
R l f b l f b lsequence
b A C G T
( ) ( , ) log ( , ), , ,
= + ×∈∑2 2 (2)
ROC curve showing the classification performance of differ-ent models for NN269 donor splice site dataFigure 3ROC curve showing the classification performance of differ-ent models for NN269 donor splice site data.
0 5 10 15 20 25 30 35 40 45 5080
82
84
86
88
90
92
94
96
98
100
1 - Specificity
Sen
sitiv
ity
Four best donor splice site models
Reduced MM1 SVM GRBFReduced MM1 SVM PolynomialMM1 SVM PolynomialIC Shapiro SVM Polynomial
ROC curve showing the classification performance of best two models in terms of accuracy and training time for NN269 donor splice site dataFigure 4ROC curve showing the classification performance of best two models in terms of accuracy and training time for NN269 donor splice site data.
0 10 20 30 40 5080
85
90
95
100
1 - Specificity
Sen
sitiv
ity
Best two donor splice site models in terms ofclassification accuracy and training time
Reduced MM1 SVM GRBFIC Shapiro SVM Polynomial
Page 6 of 12(page number not for citation purposes)

BMC Bioinformatics 2008, 9(Suppl 12):S8 http://www.biomedcentral.com/1471-2105/9/S12/S8
h1 is the sum of highest 8 of 10 percentages at position -13 to -4
t2 is the sum of best nucleotide percentages at position -3to + 1
l2 is the sum of lowest nucleotide percentages at position-3 to + 1
h2 is the sum of highest nucleotide percentages at position-3 to +1
Similarly, Shapiro's score for donor splice site is given bythe equation [31]:
SSdonor = 100*(t - min)/(max - min) (5)
where, t is the sum of percentages at position -3 to + 7
min is the sum of lowest percentages at position -3 to + 7
max is the sum of highest percentages at position -3 to + 7
Sequence feature elimination based on F-scoreSequence feature elimination is an important steptowards the classification task. Classifiers like neural net-works, SVM's etc. perform better when they are trainedwith meaningful input data. Redundant data often causesmisclassification and hence, the reduction of classifica-tion performance. So it is desirable to eliminate the less
important features from the input data and to select thosefeatures that can potentially discriminate between trueand false class. According to Dror et al. [32], there arethree potential benefits of feature selection: improving theperformance of the classifier, producing a cost-effectiveclassifier, and providing a better understanding of theproblem.
In this work, we select most informative acceptor anddonor splice site features, and we used the F-score featureselection criteria also employed by Golub et al. [33] andDror et al [32]. For each feature xj, j = 1, 2,...., N, we calcu-
late the mean (for positive/true class) and (for
negative/false class), standard deviation (for positive/
true class) and (for negative/false class). The F-score
F(xj) is calculated by:
Support vector machineThe SVM is a statistical machine learning algorithm ini-tially proposed by Vapnik [34-37] and applied to a widerange of pattern recognition problems[9,12,15,35,37,38]. It uses a hypothetical space of linearfunctions in a high dimensional feature space trained with
μ j+ μ j
−
σ j+
σ j−
F xj j
j jj( ) =
+ − −
+ − −
μ μ
σ σ(6)
Table 4: AUC and training time improvement for different models compared to MM1-SVM method for NN269 donor splice sites.
Model SVM kernel AUC Training time until convergence (mm.ss)
Performance Improvement
Time Improvement
MM1 SVM Polynomial 0.9761 10:02 - -
Reduced MM1 SVM (Best in terms of accuracy)
GRBF 0.9790 20:04 0.297% -100%
Reduced MM1 SVM Polynomial 0.9764 09:30 0.0102% 5.31%
IC Shapiro SVM (Best In terms of Time)
Polynomial 0.9665 02:59 -0.9835% 70.26%
Table 5: Proposed models and their description.
Model Description
Reduced MM1 SVM Polynomial Only reduced MM1 parameters and SVM with polynomial kernel
Reduced MM1 SVM GRBF Only reduced MM1 parameters and SVM with GRBF kernel
IC Shapiro SVM Polynomial Information content, Shapiro's score and SVM with polynomial kernel
Page 7 of 12(page number not for citation purposes)
BMC Bioinformatics 2008, 9(Suppl 12):S8 http://www.biomedcentral.com/1471-2105/9/S12/S8
a learning algorithm based on optimization theory. ASVM selects a small number of critical boundary samples(known as support vectors) from each class and builds alinear discriminant that separates them as widely as possi-ble. In the case that no linear separation is possible, the'kernel' technique is applied to map the training samplesinto a higher-dimensional space, and to learn a separatorin that space [39]. SVM classification is an optimizationproblem given by:
0 ≤ αi ≤ C, i = 1,..., l, (9)
where, l is the number of training examples, K is the kernelfunction, x is the input vectors, y is either -1 or +1 repre-senting two different classes, α is the variable to be opti-mized and C is a trade-off parameter for generalizationperformance [35,36]. Each α corresponds to one particu-lar training example and after the training process, only asubgroup of α will have non-zero values. This subgroup ofα and their corresponding training examples are called thesupport vectors. In this study, two separate SVM classifiersare required, one for acceptor and one for donor. The classlabels y in the two classifiers would then indicate true (y =+1) or false sites (y = -1) for acceptor and donor accord-ingly. Given a query DNA segment z, the trained SVM clas-sifies based on the decision function:
where v is the set of support vectors.
DatasetTo evaluate the performance of the proposed models, weused publicly available NN269 [10] splice site dataset. Thedataset is divided into two groups namely: the acceptorsplice sites and the donor splice sites. It contains 1324confirmed true acceptor splice sites, 5552 false acceptorsites, 1324 confirmed true donor sites, and 4922 falsedonor sites collected from 269 human genes. The pseudoor false acceptor/donor splice sites are those having AG/GT in the splicing junction but not a real acceptor ordonor splice site according to the annotation. Acceptorsplice sites have a window of 90 nucleotides (-70 to +20)with the consensus nucleotides AG at positions -69 and -
70. This window includes the last 70 nucleotides of anintron and the first 20 nucleotides of the succeeding exon.On the other hand, donor splice sites have a window of 15nucleotides (-7 to +8) with the consensus nucleotides GTat positions +1 and +2. This window includes the last 9nucleotides of an exon and the first 6 nucleotides of thesucceeding intron. The acceptor and donor splice sitedatasets are divided into a unique training and test data-set. The test datasets do not contain any sequence whichis in training dataset. The training dataset contains 1116true acceptor, 1116 true donor, 4672 false acceptor, and4140 false donor sites. The test data set contains 208 trueacceptor sites, 208 true donor sites, 881 false acceptorsites, and 782 false donor sites.
Model learningThe learning of the model is designed in two phases.Phase one consists of estimation of Markov parameters,scoring information content of sequences, and calculationof Shapiro's score. In phase two SVM is trained with poly-nomial and Gaussian kernels.
All the training sequences were aligned with respect to theconsensus sequence for the estimation of the Markovparameters. We only use the true training sequences tocreate the Markov model. The estimates of the MM1 arethe ratios of the frequencies of each dinucleotide in eachsequence position as shown in the following equation[18].
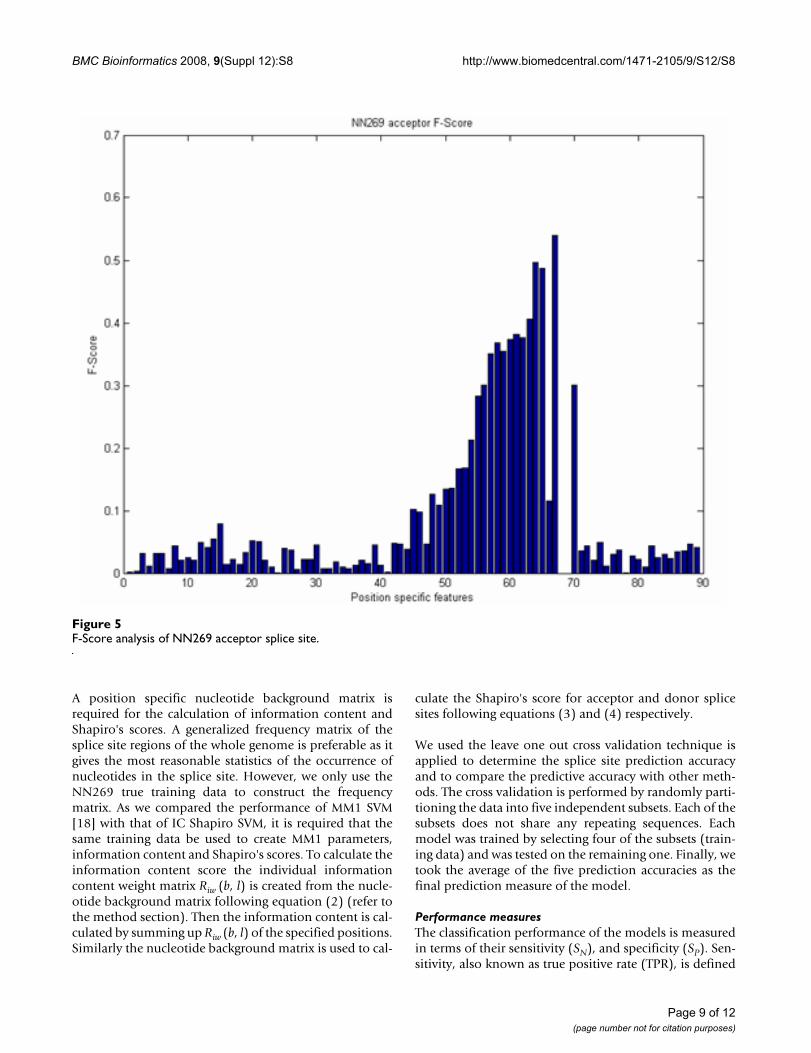
For a sequence of length n there are n-1 position specificprobabilistic parameters [18]. As the length of the accep-tor splice site is 90 nucleotides there are 89 MM1 parame-ters and for 15 nucleotide long donor splice site there are14 MM1 parameters. We reduce the size of the MM1parameters based on the F-score. We empirically selectedthe F-score value 0.20. There are many inputs with an f-score value less than 0.20 as shown in Figure 5 and 6.However, their inclusion did not significantly improve theperformance and increased the computational complexityand training time. As the f-score shows the position-spe-cific discrimination between true and false splice sites, ahigher F-score value indicates a better discriminationbetween true and false splice sites and conveys more infor-mation to the SVM. Based on the F-score values, positionspecific MM1 parameters are reduced from 89 to 19 foracceptor splice sites and from 14 to 9 MM1 parameters fordonor splice sites. Based on the above discussion we pro-pose several models which are listed in Table 5.
Maximize K x xi jL y yi i j i ji j
l
i
l= − ( )
== ∑∑ α α α12 11
, ,,
(7)
s t. . α i ii
ly =
=∑ 01
(8)
o z y K zi i i
i
( ) = ( )⎡
⎣⎢⎢
⎤
⎦⎥⎥∈
∑sign αν
x , , (10)
ˆ#
#,P s
si ki
si kii i( ) = −( )−−( )1
(11)
Page 8 of 12(page number not for citation purposes)
BMC Bioinformatics 2008, 9(Suppl 12):S8 http://www.biomedcentral.com/1471-2105/9/S12/S8
A position specific nucleotide background matrix isrequired for the calculation of information content andShapiro's scores. A generalized frequency matrix of thesplice site regions of the whole genome is preferable as itgives the most reasonable statistics of the occurrence ofnucleotides in the splice site. However, we only use theNN269 true training data to construct the frequencymatrix. As we compared the performance of MM1 SVM[18] with that of IC Shapiro SVM, it is required that thesame training data be used to create MM1 parameters,information content and Shapiro's scores. To calculate theinformation content score the individual informationcontent weight matrix Riw (b, l) is created from the nucle-otide background matrix following equation (2) (refer tothe method section). Then the information content is cal-culated by summing up Riw (b, l) of the specified positions.Similarly the nucleotide background matrix is used to cal-
culate the Shapiro's score for acceptor and donor splicesites following equations (3) and (4) respectively.
We used the leave one out cross validation technique isapplied to determine the splice site prediction accuracyand to compare the predictive accuracy with other meth-ods. The cross validation is performed by randomly parti-tioning the data into five independent subsets. Each of thesubsets does not share any repeating sequences. Eachmodel was trained by selecting four of the subsets (train-ing data) and was tested on the remaining one. Finally, wetook the average of the five prediction accuracies as thefinal prediction measure of the model.
Performance measuresThe classification performance of the models is measuredin terms of their sensitivity (SN), and specificity (SP). Sen-sitivity, also known as true positive rate (TPR), is defined
F-Score analysis of NN269 acceptor splice siteFigure 5F-Score analysis of NN269 acceptor splice site.
Page 9 of 12(page number not for citation purposes)

BMC Bioinformatics 2008, 9(Suppl 12):S8 http://www.biomedcentral.com/1471-2105/9/S12/S8
as the percentage of correct prediction of true sites whilespecificity is the correct prediction of false sites as definedbelow:
Where, TP, TN, FP, and FN stand for true positive rate, truenegative rate, false positive rate, and false negative rate.They are defined in Table 6[40].
Also receiver operator curve (ROC) is drawn using the sen-sitivity and specificity values. ROC analysis is an effectiveand widely used method for assessing the classificationperformance [40]. When a ROC is created from the sensi-tivity (the y axis) and specificity (the x axis) of a model,the closer a curve follows the left-hand border and then
the top of the border of the ROC plot, the more accuratethe model is (refer to Figure 3, 4, 5 and 6). We also calcu-late the area under ROC curve (AUC), as classification per-formance of some of the models are very close and maynot clearly distinguish performance of two models whenwe view them in the ROC curve. However, AUC accuratelymeasure the total ROC area covered by a model.
Sensitivity STP
TP FNSpecificity S
TNTN FPN P( ) =
+( ) =
+
F-Score analysis of NN269 donor splice siteFigure 6F-Score analysis of NN269 donor splice site.
Table 6: Definition of TP, TN, FP and FN
Predicted positive Predicted negative
Real positive true positives, TP false negatives, FN
Real negative true negatives, TN false positives, FP
Page 10 of 12(page number not for citation purposes)
BMC Bioinformatics 2008, 9(Suppl 12):S8 http://www.biomedcentral.com/1471-2105/9/S12/S8
Competing interestsThe authors declare that they have no competing interests.
Authors' contributionsAKMAB provided the conception and design of this study,the implementation of the method and its analysis. BCand SKH contributed to the design of the study and theinterpretation of the results. All authors contributed to thewriting and critically revising the manuscript.
Additional material
AcknowledgementsWe gratefully acknowledge the helpful discussions and comments provided by Dr. Arthur Hsu.
This article has been published as part of BMC Bioinformatics Volume 9 Sup-plement 12, 2008: Asia Pacific Bioinformatics Network (APBioNet) Seventh International Conference on Bioinformatics (InCoB2008). The full contents of the supplement are available online at http://www.biomedcentral.com/1471-2105/9?issue=S12.
References1. Burset M, Seledtsov A, Solovyeva VV: Analysis of canonical and
non-canonical splice sites in mammalian genomes. NucleicAcids Research 2000, 28(21):4364-4375.
2. Salzberg S: A method for identifying splice sites and transla-tion start site in eucaryotic mRNA. Computer Applications in theBiosciences 1997, 13(4):384-390.
3. Chen T-M, Chung-Chin Lu, Wen-Hsiung Li: Prediction of splicesites with dependency graphs and their expanded bayesiannetworks. Bioinformatics 2005, 21(4):471-482.
4. Pertea M, Xiao Ying L, Salzberg SL: GeneSplicer: a new computa-tional method for splice site detection. Nucleic Acids Research2001, 29(5):1185-1190.
5. Marashi SA, Changiz Eslahchi, Pezeshk H, Sadeghi M: Impact ofRNA structure on the prediction of donor and acceptorsplice sites. BMC Bioinformatics 2006, 7:297.
6. Zhang M, Marr T: A weight array method for splicing signalanalysis. Comput Appl Biosci 1993, 9:499-509.
7. Castelo R, Guigo R: Splice site identification by idlBNs. Bioinfor-matics 2004, 20(1):69-76.
8. Cai D, Delcher A, Kao B, Kasif S: Modeling splice sites with Bayesnetworks. Bioinformatics 2000, 16(2):152-158.
9. Ratsch G, Sonnenburg S, Schafer C: Learning Interpretable SVMsfor Biological Sequence Classification. BMC Bioinformatics 2006,7(suppl 1):S9.
10. Reese MG, Eeckman F, Kupl D, Haussler D: Improved splice sitedetection in Genie. Journal of Computational Biology 1997,4(3):311-324.
11. Brunak S, Engelbrecht J, Knudsen S: Prediction of mRNA donorand acceptor sites from the DNA sequence. Journal of MolecularBiology 1991, 220:49-65.
12. Sun YF, Fan XD, Li YD: Identifying splicing sites in eukaryoticRNA: Support vector machine approach. Computers in biologyand medicine 2003, 33:17-29.
13. Reese MG: Application of a time-delay neural network to pro-moter annotation in the Drosophila melanogaster. Computerchem 2001, 26(1):51-56.
14. Zhang XH-F, Katherine AH, Ilana H, Christina SL, Lawrence AC:Sequence information for the splicing of human pre-mRNAidentified by support vector machine classification. GenomeResearch 2003, 13:2637-2650.
15. Sonnenburg S: New methods for detecting splice junction sitesin DNA sequence. In Master's Thesis Humbold University, Germany;2002.
16. Degroeve S, Saeys Y, Baets BD, Rouze P, Peer YVD: SpliceMachine:predicting splice sites from high-dimensional local contextrepresentations. Bioinformatics 2005, 21(8):1332-1338.
17. Rajapakse JCaHLS: Markov encoding for detecting signals ingenomic sequences. IEEE/ACM Transactions on Computational Biol-ogy and Bioinformatics 2005, 2(2):131-142.
18. Baten AKMA, Chang BCH, Halgamuge SK, Li J: Splice site identifi-cation using probabilistic parameters and SVM classification.BMC Bioinformatics 2006, 7(Suppl 5):.
19. Sonnenburg S, Schweikert G, Philips P, Behr J, Rätsch G: Accuratesplice site prediction using support vector machines. BMCBioinformatics 2007, 8(10):.
20. Chuang JSaRD: Splice site prediction using a sparse network ofwinnows. In Technical Report University of Illinois, Urbana-Champaign;2001.
21. Zhang L: aLL: Splice site prediction with quadratic discrimi-nant analysis using diversity measure. Nucleic Acids Research2003, 31(21):6214-6220.
22. Hebsgaard SM, korning PG, Tolstrup N, Engelbrecht J, Rouze P, Bru-nak S: Splice site prediction in Arabidopsis Thaliana pre-mRNA by combining local and global sequence information.Nucleic Acids Research 1996, 24:3439-3452.
23. Burge C: Modeling dependencies in pre-mRNA splicing sig-nals. In Computational methods in Molecular Biology Volume chapter 8.Elsevier press; 1998:129-163.
24. Saeys Y, Degroeve S, Aeyels D, Peer Y Van de, Rouze P: Fast featureselection using a simple estimation of distribution algorithm:a case study on splice site prediction. In Bioinformatics Volume19. Oxford Univ Press; 2003:179-188.
25. Waddell P, Kishino H, Ota R: Very fast algorithms for evaluatingthe stability of ML and Bayesian phylogenetic trees fromsequence data. Genome Informatics 2002, 13:82-92.
26. Buckingham S: Bioinformatics: Programmed for success.Nature 2003, 425(6954):209-215.
27. Washietl S, Hofacker I, Stadler P: From The Cover: Fast and reli-able prediction of noncoding RNAs. Proceedings of the NationalAcademy of Sciences 2005, 102(7):2454.
28. Shannon CE: A mathematical theory of communication. BellSystem Tech J 1948, 27:379-423. 623–656.
29. Schneider TD: Information content of individual geneticsequences. Journal of Theoretical Biology 1997, 189:427-441.
30. Itoh H, Washio T, Masaru Tomita: Computational comparativeanalyses of alternative splicing regulation using full-lengthcDNA of various eukaryotes. RNA 2004, 10:1005-1018.
31. Shapiro MB, Senapathy P: RNA splice junctions of differentclasses of eukaryotes: Sequence statistics and functionalimplications in gene expression. Nucleic Acids Research 1987,15:7155-7174.
32. Dror G, Sorek R, Shamir R: Accurate identification of alterna-tively spliced exons using support vector machine. Bioinfor-matics 2004, 21(7):897-901.
33. Golub T, Slomin D, Tamayo P, Huard C, Gaasenbeek M, Mesirov J,Coller H, Loh M, Downing J, Caliguiri M, Bloomfield C, Lander E:Molecular classification of cancer: class discovery and classprediction by gene expression monitoring. Science 1999,286:531-537.
Additional file 1AUC and SVM parameters for different models for NN269 acceptor and donor splice sites.Click here for file[http://www.biomedcentral.com/content/supplementary/1471-2105-9-S12-S8-S1.pdf]
Additional file 2Relationship between Riw (b, l) and Rsequence (l).Click here for file[http://www.biomedcentral.com/content/supplementary/1471-2105-9-S12-S8-S2.pdf]
Page 11 of 12(page number not for citation purposes)

BMC Bioinformatics 2008, 9(Suppl 12):S8 http://www.biomedcentral.com/1471-2105/9/S12/S8
Publish with BioMed Central and every scientist can read your work free of charge
"BioMed Central will be the most significant development for disseminating the results of biomedical research in our lifetime."
Sir Paul Nurse, Cancer Research UK
Your research papers will be:
available free of charge to the entire biomedical community
peer reviewed and published immediately upon acceptance
cited in PubMed and archived on PubMed Central
yours — you keep the copyright
Submit your manuscript here:http://www.biomedcentral.com/info/publishing_adv.asp
BioMedcentral
34. Cortes C, Vapnik V: Support vector network, Machine Learn-ing. Machine Learning 1995, 20:273-293.
35. Vapnik v: The nature of statistical learning theory. Springer,New York; 1995.
36. Cristianini N, Shawe-Taylor J: An introduction to support vectormachine and kernel based learning methods. Cambridge Univer-sity press, Cambridge; 2000.
37. Drucker H, Wu D, Vapnik V: Support vector machines for spamcategorization. IEEE transaction on Neural Networks 1995,10:1054-1084.
38. Burge C: A tutorial on support vector machines for patternrecognition. Data Mining and Knowledge Discovery 1998, 2:121-167.
39. Liu H, Wong L: Data mining tools for biological sequences.Journal of bioinformatics and computational biology 2003, 1:139-160.
40. Yeo G, Burge CB: Maximum Entropy Modeling of ShortSequence Motifs with Applications to RNA Splicing Signals.Journal of Computational Biology 2004, 11(2–3):377-394.
Page 12 of 12(page number not for citation purposes)
Copyright © 2022 FDOKUMEN

