


Bahasa
Halaman
Hukum

Excess 210Pb inventories and fluxes along the continental slope
and basins of the Gulf of Papua
Zahid Muhammad,1 Samuel J. Bentley,2 Lawrence A. Febo,3 Andre W. Droxler,4
Gerald R. Dickens,4 Larry C. Peterson,5 and Bradley N. Opdyke6
Received 31 August 2006; revised 8 November 2007; accepted 20 December 2007; published 19 March 2008.
[1] Sediment samples were collected from continental slopes and marginal basins in theGulf of Papua and analyzed for excess 210Pb to elucidate transport processes of fine-grained particles to this region. Estimated excess 210Pb fluxes of 1.0–12.8 dpm cm�2 a�1
were derived from measured seabed inventories. Highest sediment accumulation rates(0.28–0.35 cm a�1) were measured along the northeastern shelf edge, and they decrease inseaward directions and along isobaths to the southwest. The excess 210Pb flux could resultfrom either focused deposition of high-210Pb activity sediments from the continental shelfand upper slope or scavenging of 210Pb brought landward from deep-sea waters. Thissediment flux is concentrated in the northeastern Gulf of Papua, where the shelf is narrowand calcium carbonate contents are lowest. Analysis of sedimentary fabric and 210Pbdistributions in cores suggests sediment delivery to the slope occurs on a 100-yeartimescale as both diffuse hemipelagic deposition as well as turbidity flows. The flux ofsediment in turbidity flows is not well constrained but may be producing additional deep-sea accumulation in the Moresby Trough, as well as export from the study area.
Citation: Muhammad, Z., S. J. Bentley, L. A. Febo, A. W. Droxler, G. R. Dickens, L. C. Peterson, and B. N. Opdyke (2008), Excess210Pb inventories and fluxes along the continental slope and basins of the Gulf of Papua, J. Geophys. Res., 113, F01S17,
doi:10.1029/2006JF000676.
1. Introduction
[2] The MARGINS Source-to-Sink (S2S) initiative aimsto develop a quantitative understanding of sediment trans-port and accumulation across and along continental margins[NSF MARGINS Science Plans, 2004]. The uplands ofsouthern Papua New Guinea (PNG) and the adjacent Gulfof Papua (GOP) (Figure 1) were chosen because of largeproduction of siliciclastic and carbonate sediments, clearlydefined sediment sources and sinks, variable sedimentfluxes over a range of timescales, and a relatively pristineenvironment [NSF MARGINS Science Plans, 2004].[3] A series of rivers deliver some 200 to 365 � 106 t a�1
of siliciclastic material (e.g., quartz, feldspars, clays) to theinner shelf of the northern GOP annually [Harris et al.,1993; Milliman, 1995; Milliman et al., 1999]. This massivesediment discharge is largely due to voluminous rainfall
(4–10 m a�1 in many places) on young and very steep(erodible) mountains where landslides frequently occur[Pickup, 1984; Harris et al., 1993]. Of the total massdischarged, some 100 � 106 t a�1 accumulate on the innerto middle shelf in an extensive prograding delta systemcomposed of clinoforms [Harris et al., 1993; Walsh et al.,2004]. Another 10–15 � 106 t a�1 may collect in mangrovecovered coastal regions [Wolanski et al., 1998; Walsh andNittrouer, 2004]. Assuming that these estimates are correct,huge amounts of siliciclastic sediment (>100 � 106 t a�1)escape the GOP shelf, at least on the 100-year timescale.However,Walsh and Nittrouer [2003] indicate that very littlefluvially derived sediment (<15 � 106 t a�1) accumulatesbeyond the shelf break.[4] Sedimentary facies across the northern GOP shelf can
be generally divided into a silt/sand-rich region of clinoformtopsets on the inner shelf, a fine-grained region of clinoformforesets on the middle shelf, and a region of relict lithogenicand carbonate sands on the outer shelf [Harris et al., 1993;Brunskill et al., 1995; Walsh and Nittrouer, 2003]. Thisdistribution suggests that very little sediment presentlycrosses the shelf directly south of the major river inputs.However, some sediment from fluvial sources eitherbypasses the clinoform or is resuspended from the clino-form to be transported clockwise around the GOP shelf[Harris et al., 1993; Wolanski et al., 1995; Walsh et al.,2004; Ogston et al., 2008]. A portion of this suspended-sediment flux crosses the outer shelf in the northeasternGOP, where the shelf narrows dramatically (Figure 1).Walsh and Nittrouer [2003] suggest that nepheloid layers,
JOURNAL OF GEOPHYSICAL RESEARCH, VOL. 113, F01S17, doi:10.1029/2006JF000676, 2008ClickHere
for
FullArticle
1Department of Oceanography and Coastal Sciences, Louisiana StateUniversity, Baton Rouge, Louisiana, USA.
2Earth Sciences Department, Memorial University of Newfoundland,St. John’s, Newfoundland and Labrador, Canada.
3Department of Geology and Geophysics, Louisiana State University,Baton Rouge, Louisiana, USA.
4Department of Earth Science, Rice University, Houston, Texas, USA.5Rosenstiel School of Marine and Atmospheric Science, University of
Miami, Miami, Florida, USA.6Department of Earth and Marine Science, Australian National
University, Canberra, ACT, Australia.
Copyright 2008 by the American Geophysical Union.0148-0227/08/2006JF000676$09.00
F01S17 1 of 14
created by northeastward along-shelf advection, transportthe sediment. In any case, thick prograding sedimentpackages extend to the shelf edge in this area [Wolanskiand Alongi, 1995, Slingerland et al., 2008a], likelysupplying siliciclastic sediment to adjacent deep-waterenvironments.[5] Slope and basin settings in the GOP (Figure 1) can be
divided into three large physiographic regions: PandoraTrough, Ashmore Trough and, Moresby Trough [Winterer,1970; Francis et al., 2008]. Pandora Trough is a SW-NEtrending basin confined by Portlock Reef, Boot Reef, andAshmore Reef to the west, Eastern Plateau to the southeast,and the shelf edge to the north and east. The southwesternend is a �1700 m deep semienclosed basin without a clearmodern outlet, whereas the northeastern end is connected toMoresby Trough at �2000 m water depth. Ashmore Troughis a SSW-NNE trending feature rimmed by active carbonatereef systems on two sides and a water depth of less than1000 m. The third deep region, Moresby Trough, is a NW-SEtrending basin confined by the narrow shelf of the PapuanPeninsula to the northeast, and Eastern Plateau and Eastern
Fields Reef to the southwest. It is connected to the Coral SeaBasin via Moresby Canyon in the southeast.[6] The three deepwater structural basins collectively
constitute a major depocenter for sediment escaping theGOP shelf (Figure 1). Sedimentation in Ashmore Trough ispresently dominated by neritic carbonate input from sur-rounding reefs [Francis et al., 2008]. Pandora and Moresbytroughs, however, receive enough terrigenous material sothat siliciclastic contents of surface samples can exceed 80%[Febo et al., 2006]. This material presumably escapes fromthe shelf to the slope, principally in the northeast GOPwhere the sediment packages cross the shelf edge.[7] Lead 210 (210Pb) is a naturally occurring radionuclide
in marine sediments, and has been widely used to studysediment dispersal and accumulation on century timescales[e.g., Goldberg and Koide, 1962; Nittrouer et al., 1979].Particles, organic or inorganic, scavenge 210Pb from thewater column and deposit 210Pb in excess of that producedwithin sediments by the decay of its parent isotope, 226Ra(half-life of 1602 years). As sediments are buried, 210Pbdecays with a half-life of 22 years [Appleby and Oldfield,
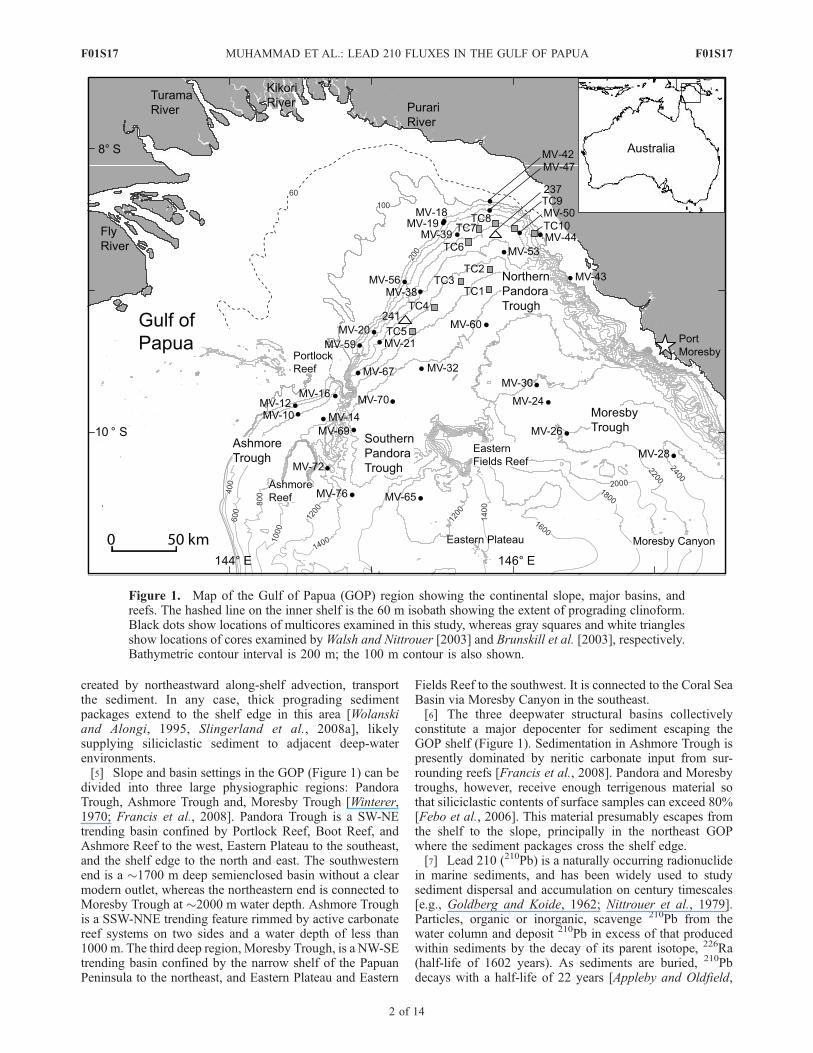
Figure 1. Map of the Gulf of Papua (GOP) region showing the continental slope, major basins, andreefs. The hashed line on the inner shelf is the 60 m isobath showing the extent of prograding clinoform.Black dots show locations of multicores examined in this study, whereas gray squares and white trianglesshow locations of cores examined byWalsh and Nittrouer [2003] and Brunskill et al. [2003], respectively.Bathymetric contour interval is 200 m; the 100 m contour is also shown.
F01S17 MUHAMMAD ET AL.: LEAD 210 FLUXES IN THE GULF OF PAPUA
2 of 14
F01S17
1992]. Bioturbation can significantly affect 210Pb distribu-tions in sediment [Benninger et al., 1979; Thomson et al.,1988]. However, measurement of 210Pb activities at selectedintervals can yield an activity-versus-depth relationship thatcan be used to estimate an apparent sediment accumulationrate [e.g., Koide et al., 1972; Nittrouer et al., 1984].[8] Two studies have examined 210Pb in sediment from
the outermost shelf, slope and basin regions in the GOP.Walsh and Nittrouer [2003] studied 10 box cores (Figure 1)in the northeast GOP, and determined apparent accumula-tion rates of �0.2 cm a�1 (0.08 g cm�2 a�1). Brunskill et al.[2003] examined Kasten cores from the base of the slopewhere mass accumulation rates were between 0.05 and0.07 g cm�2 a�1. Core locations used for the above citedstudies were selected without the aid of detailed geoacousticseabed surveys.[9] Recent studies in the GOP have highlighted the
importance of designing seabed sampling based on multi-beam and subbottom surveys so that depositional processescan be associated with known seabed geomorphology[Slingerland et al., 2008a]. Building on previous studies,we undertook a more extensive coring program in conjunc-tion with detailed seabed mapping [Daniell, 2008; Franciset al., 2008]. These studies allow us to identify and mapmajor pathways (gullies, canyons and channels) for sedi-ment transport from shelf and bank top to deep water (bygravity flows and/or sediment plumes), and constrain 210Pbinventories, 210Pb depositional fluxes, and rates of sedimentaccumulation associated with the depositional environ-ments. These observations are then used to examine possi-ble sediment-transport pathways and processes in the GOP.
2. Materials and Methods
2.1. Field Sampling
[10] Thirty multicores were collected from shelf edges andslope basins of the northern GOP during the PANASH cruiseof the R/V Melville during March–April 2004 (Figure 1).Core sites were selected based on seabed morphology andsedimentary facies determined from geoacoustic seabedmapping on the same cruise. Positioning was accomplishedby Differential Global Positioning System and the ship’sdynamic positioning system. The use of a multicorer allowedrecovery of undisrupted sediment samples extending fromthe surface of the seabed. The presence of clearly defined,oxidized core tops and in situ arborescent foraminifera andophiuroids in some cores suggests that our multicores indeedrecovered relatively undisturbed sediment samples.[11] Immediately after recovery, one sediment-filled core
tube from each multicorer deployment was extruded at 1 cmintervals for the top 6 cm, and at 2 cm intervals from 6 cmto the base. These samples were sealed in plastic bags andrefrigerated until analysis in an onshore laboratory. Oneadditional sediment-filled tube from each multicore deploy-ment was prepared for X-radiography. These were slicedinto 2 cm thick axial slabs, and imaged onboard using aThales Flashscan 35 digital X-ray detector panel, illuminatedwith a Medison Acoma PX15HF X-ray generator. Imageswere archived as 14 bit gray scale images with 127 mm pixelresolution.
2.2. Laboratory Measurements and Theory
[12] Samples for radionuclide measurements were driedfor 24 hours at 60�C, ground with a porcelain mortar andpestle, and sealed with glue in 50 � 9 mm petri dishes.Weighed masses were then counted for 24 hours on Can-berra low-background planar gamma detectors; correctionfor self-absorption of 210Pb was done using the method ofCutshall et al. [1983]. Total 210Pb was determined bymeasurement of the 46.5 keV 210Pb gamma peak. Supported210Pb from the decay of 226Ra within the seabed wasdetermined by measurement of the granddaughters of226Ra, 214Pb (at 295 and 352 keV) and 214Bi (at 609 keV).Excess (unsupported) 210Pb was determined by subtractingtotal 210Pb activity from supported 210Pb activity for eachinterval. All values of excess 210Pb were decay corrected tothe date of collection. Activities are reported in decays perminute (dpm) (with 1 dpm = 1/60 Becquerels). Activityerrors are derived from detector control software, andrepresent goodness of fit of a Gaussian curve to theobserved spectral peak near 46.5 keV. Minimum detectableactivity for excess 210Pb is 1 dpm g�1, which is approxi-mately three times the counting error for supported activity.[13] Apparent sediment accumulation rates (SARs) can be
derived from 210Pb observations using a one-dimensional,two-layer, steady state model in which mixing of sedimentsoccurs only in the upper layer [Goldberg and Koide, 1962;Nittrouer et al., 1979]. Such modeling assumes constantdepositional rates for sediment and unsupported 210Pb. Italso assumes that the thickness of the mixed layer remainsconstant with time. The general equation for this steadystate model is
dA=dt ¼ Db @2A=@z2� �
� S @A=@zð Þ � lA ð1Þ
where A is activity of radionuclide (dpm g�1), Db is particlemixing coefficient (cm2 a�1), l is decay constant forradionuclide (a�1), S is apparent sediment accumulation rate(SAR) in centimeter per year (cm a�1), and z is depth insediment column (cm).[14] Once sediments are deposited, they may undergo
biological mixing by benthic organisms. If biological mixingcan be ignored, then Db = 0 in equation (1). The solution ofequation (1) is then given by [Krishnaswami et al., 1980]
Az ¼ A0e�lz=Sð Þ ð2Þ
where A0 is excess 210Pb activity extrapolated to thesediment surface, and Az is activity at depth z. Apparentaccumulation rates (i.e., values of SAR that assumenegligible effects of biological mixing) are then calculatedusing least squares regressions of the 210Pb profiles andapplication of equation (2). In addition to SAR, wecalculated sediment mass accumulation rate (MAR) accord-ing to MAR = (1 � F)rs SAR, where F is the averageporosity for the core, and rs is the density of sedimentgrains assumed to be 2.65 g cm�3.[15] Under steady state conditions of sediment accumu-
lation and bioturbation, the distribution of excess 210Pbactivity in a core commonly delineates two distinct zones[e.g., Nittrouer et al., 1979; Kuehl et al., 1986]: a surfacelayer of uniform and high 210Pb activity, where bioturbation
F01S17 MUHAMMAD ET AL.: LEAD 210 FLUXES IN THE GULF OF PAPUA
3 of 14
F01S17
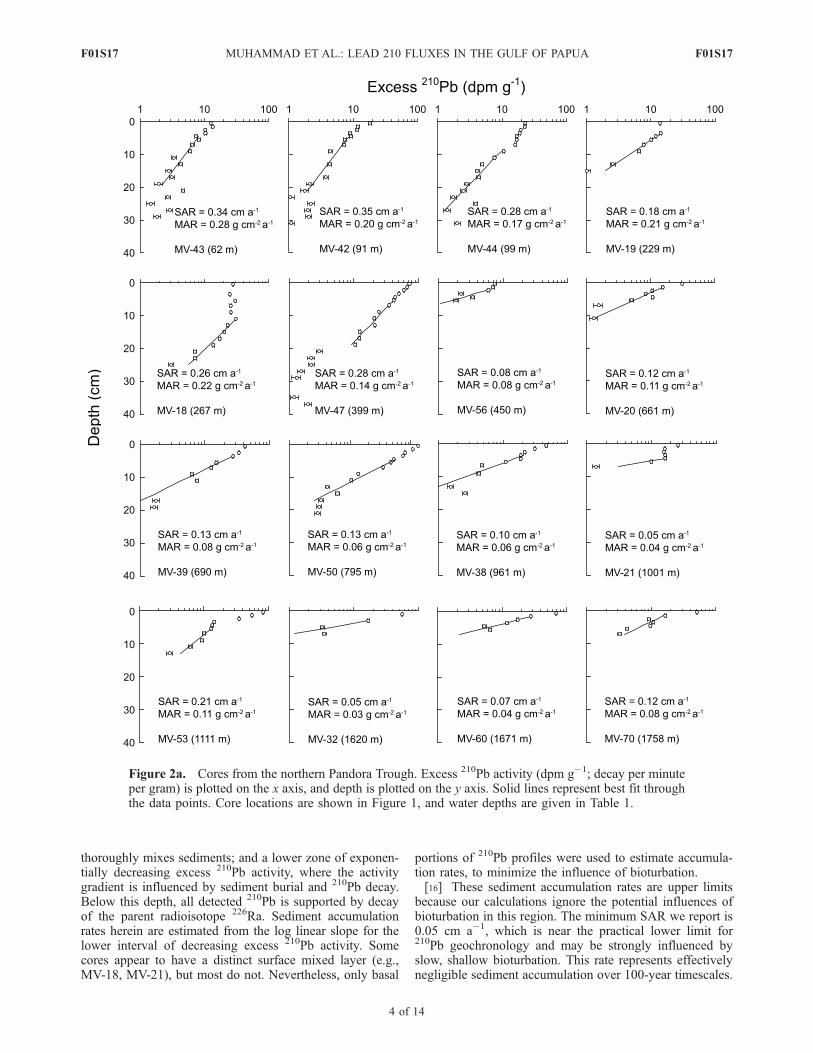
thoroughly mixes sediments; and a lower zone of exponen-tially decreasing excess 210Pb activity, where the activitygradient is influenced by sediment burial and 210Pb decay.Below this depth, all detected 210Pb is supported by decayof the parent radioisotope 226Ra. Sediment accumulationrates herein are estimated from the log linear slope for thelower interval of decreasing excess 210Pb activity. Somecores appear to have a distinct surface mixed layer (e.g.,MV-18, MV-21), but most do not. Nevertheless, only basal
portions of 210Pb profiles were used to estimate accumula-tion rates, to minimize the influence of bioturbation.[16] These sediment accumulation rates are upper limits
because our calculations ignore the potential influences ofbioturbation in this region. The minimum SAR we report is0.05 cm a�1, which is near the practical lower limit for210Pb geochronology and may be strongly influenced byslow, shallow bioturbation. This rate represents effectivelynegligible sediment accumulation over 100-year timescales.
Figure 2a. Cores from the northern Pandora Trough. Excess 210Pb activity (dpm g�1; decay per minuteper gram) is plotted on the x axis, and depth is plotted on the y axis. Solid lines represent best fit throughthe data points. Core locations are shown in Figure 1, and water depths are given in Table 1.
F01S17 MUHAMMAD ET AL.: LEAD 210 FLUXES IN THE GULF OF PAPUA
4 of 14
F01S17
However, the same rate extended over millennial timescalesrepresents a significant sediment flux.[17] Other radioisotopes, including 137Cs and 234Th, have
been used to constrain 210Pb-derived SARs. However, 137Cswas not detectable above our detection limit of 0.05 dpm g�1
for this radioisotope. The cruise duration and shipping timesfor samples precluded measurement of excess 234Th, due toits short half-life (24 d).[18] The effects of bioturbation undoubtedly introduce
significant uncertainty into some of our SAR and MARestimates. However, the use of 210Pb inventories to con-strain depositional fluxes is less influenced by the effects ofbioturbation. The seabed inventory of excess 210Pb iscalculated as the product of depth-integrated radionuclideactivity and sediment dry bulk density. This seabed inventoryis supplied by 210Pb flux from the atmosphere and 210Pbproduction in the water column. Sediment inventories ofexcess 210Pb (dpm cm�2) at the seabed can be calculated by
I ¼ SrsDz 1� 8ið ÞAi ð3Þ
where I is inventory, rs is mineral density, Dz is thickness(cm) of the sampled interval i (1 or 2 cm), 8 is porosity
(measured by water loss at 60�C), and A is the excess 210Pbactivity (dpm g�1) of the sampled interval. Sediment 210Pbinventories reported here are minimum values because notall cores penetrated to depths below the zone of excess210Pb. However, additional contributions from deeper,unsampled intervals should be minimal, because excess210Pb activities at core bases were generally more than 1order of magnitude lower than at the surface. Errors forradionuclide concentrations are propagated accordingly toobtain error for inventory values.[19] From this measured inventory of 210Pb, we can
estimate the annual flux of excess 210Pb required to supportthe observed inventory at steady state. We refer to this as thecore-calculated flux (F), determined by:
F ¼ l I ð4Þ
where F is the annual flux (dpm cm�2 a�1) and l is theradioactive decay constant for 210Pb (0.031 a�1).
3. Results
[20] Core profiles of excess 210Pb activity for the studyarea are shown in Figure 2, and measured excess 210Pb
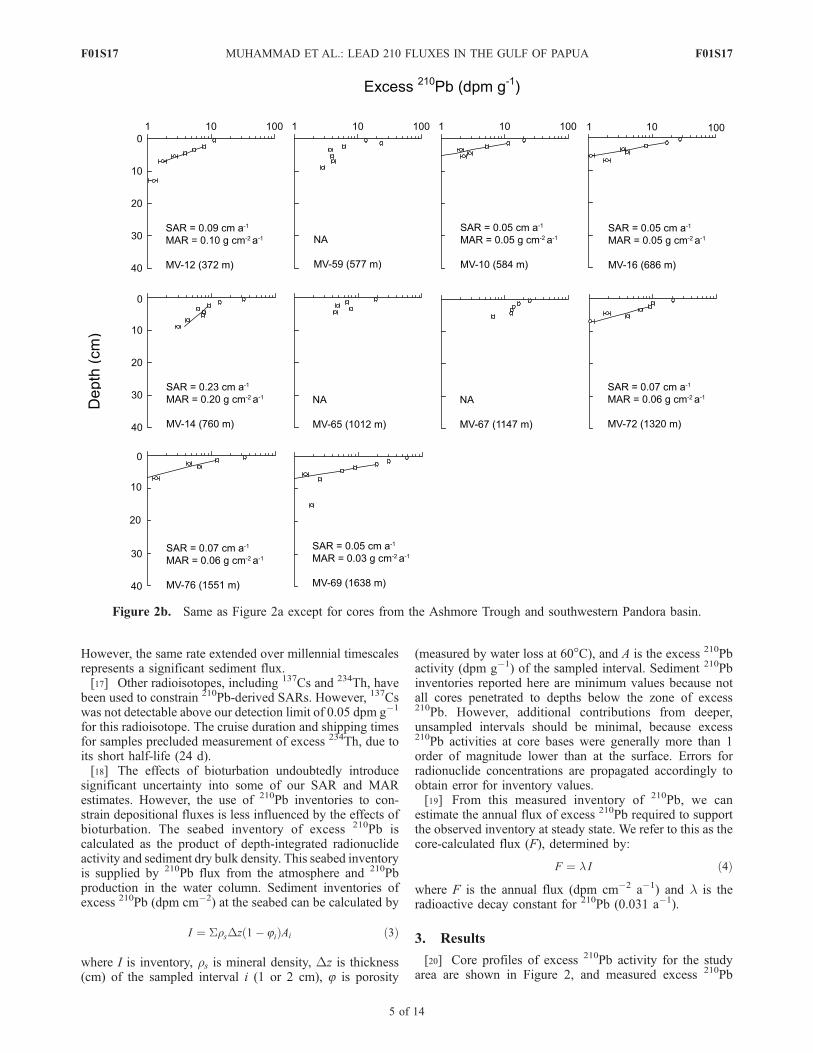
Figure 2b. Same as Figure 2a except for cores from the Ashmore Trough and southwestern Pandora basin.
F01S17 MUHAMMAD ET AL.: LEAD 210 FLUXES IN THE GULF OF PAPUA
5 of 14
F01S17
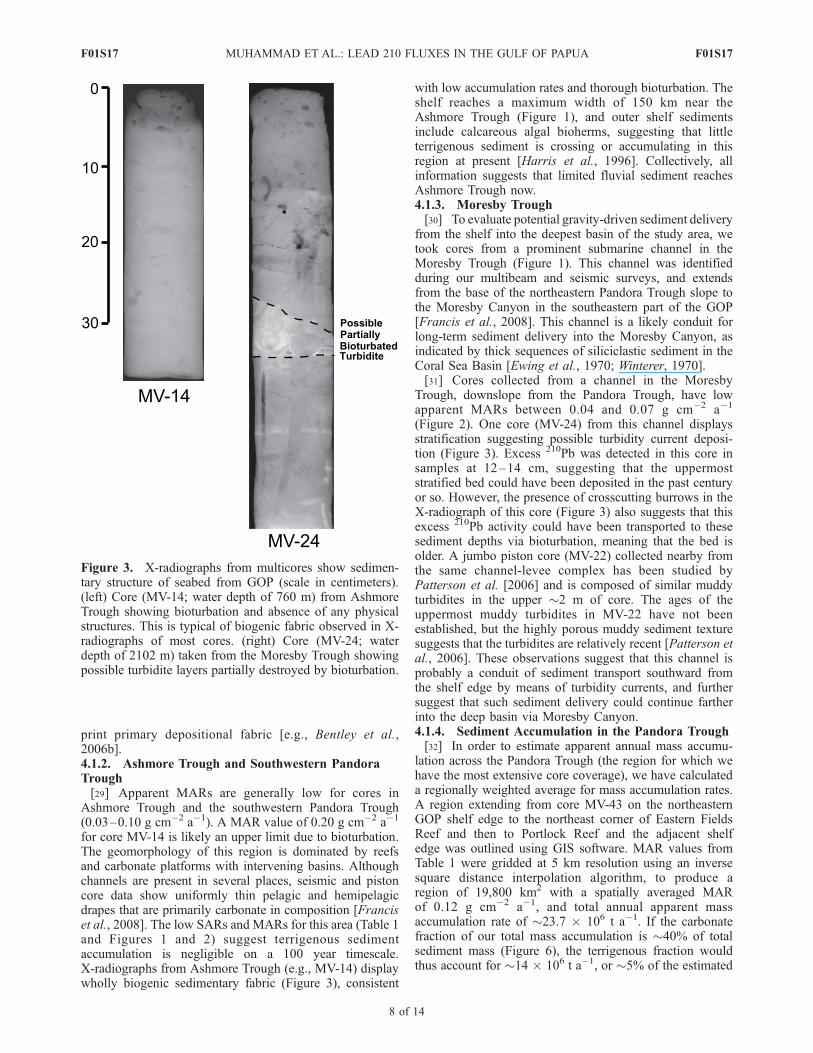
seabed inventories are given in Table 1. X-radiographs formost multicores display a pervasively bioturbated sedimen-tary fabric. A typical example is core MV-14, located in thenorthern Ashmore Trough at a water depth of 760 m.Mottling without primary stratification characterizes sedi-ment throughout the entire core (Figure 3). A prominentexception to this pattern is core MV-24, taken from a well-developed channel in Moresby Trough at a water depth of2102 m. This core displays stratification at three depths(Figure 3), consistent with turbidity-current deposition[Bentley et al., 2006a].[21] Across the entire study area, 210Pb sediment accu-
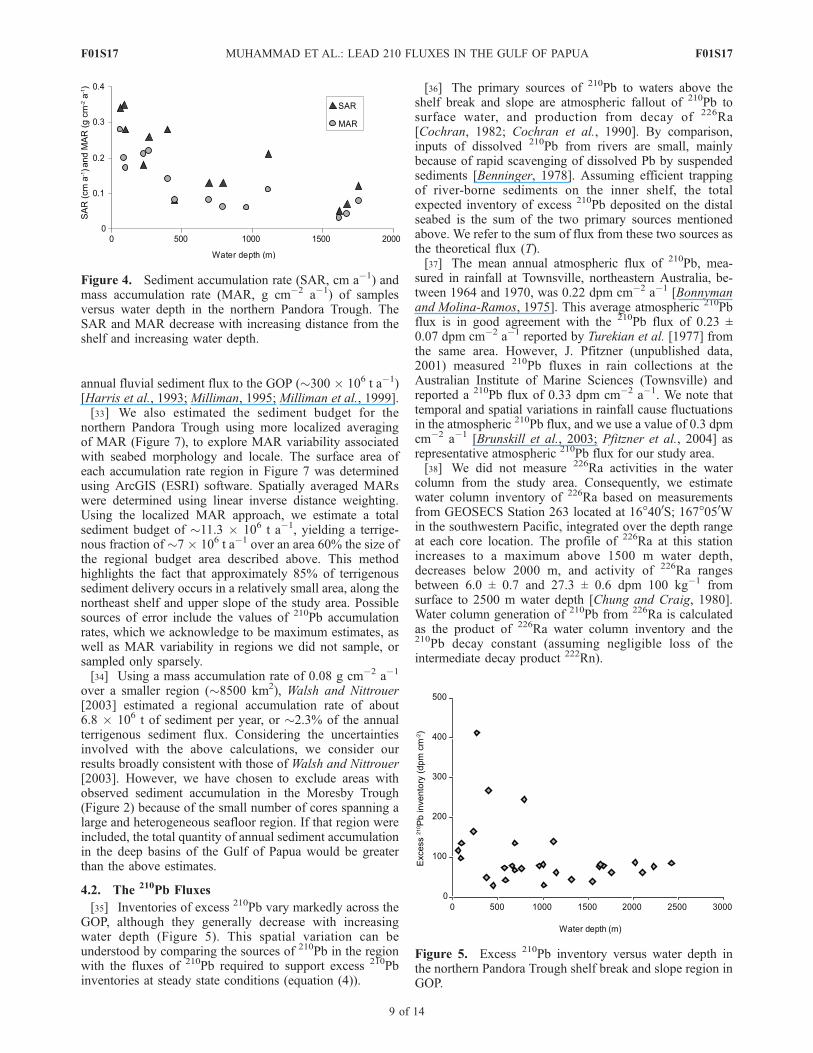
mulation rates are generally highest near the shelf edge inthe northern Pandora Trough (Figure 2), and decrease withincreasing water depth (Figure 4), toward the southwest(i.e., toward Ashmore Trough) (Figure 2). In the PandoraTrough, SAR and MAR drop from 0.35 and 0.20 g cm�2
a�1 for core MV-42 at the shelf edge (water depth of 91 m),to 0.21 and 0.11 g cm�2 a�1 for core MV-53 on the middleslope (water depth of 1111 m) (Figure 2). These valuescompare favorably with those determined by Walsh andNittrouer [2003] (�2 mm a�1, 0.1 g cm�2 a�1; Table 1). Asimilar pattern is evident for upper slope cores MV-18 andMV-19, and middle slope core MV-38 (Figure 2 andTable 1). All three cores are located along one channelsystem, with MAR decreasing from �0.22 g cm�2 a�1 at230–270 m water depth to 0.06 g cm�2 a–1 at 961 m waterdepth.[22] Significant variability exists across depositional facies
at comparable depths, however. Pandora Trough core MV-56(water depth of 450 m; Figure 2) was collected on theupper slope within a channel (based on multibeam data)(Figure 2). The seabed at this core location consists ofcoarse carbonate sands (>250 mm), and the SAR for thiscore is less than 0.1 cm a�1 (Table 1). Core MV-47,collected from soft mud deposits at a comparable waterdepth (399 m) farther to the northeast, yields a similar SARof 0.28 cm a�1. In the southwestern Pandora Trough atwater depths exceeding 1600 m, accumulation rates mea-sured for two cores, MV-60 and MV-70, are 0.07 cm a�1
(0.04 g cm�2 a�1) and 0.12 cm a�1 (0.08 g cm�2 a�1),respectively (Figure 2).
[23] In the Ashmore Trough and southwestern PandoraTrough, upper limits of accumulation rates measured arebetween 0.05 and 0.23 cm a�1. 210Pb profiles show simpledistributions where excess 210Pb activities decrease withdepth. Core MV-59 (water depth of 577 m; Figure 1) wastaken on the upper slope within a channel (based on multi-beam data). The seabed at this core location consists ofcoarse carbonate sands (>250 mm) and the penetration depthwas only �10 cm.[24] In the Moresby Trough, cores taken from water
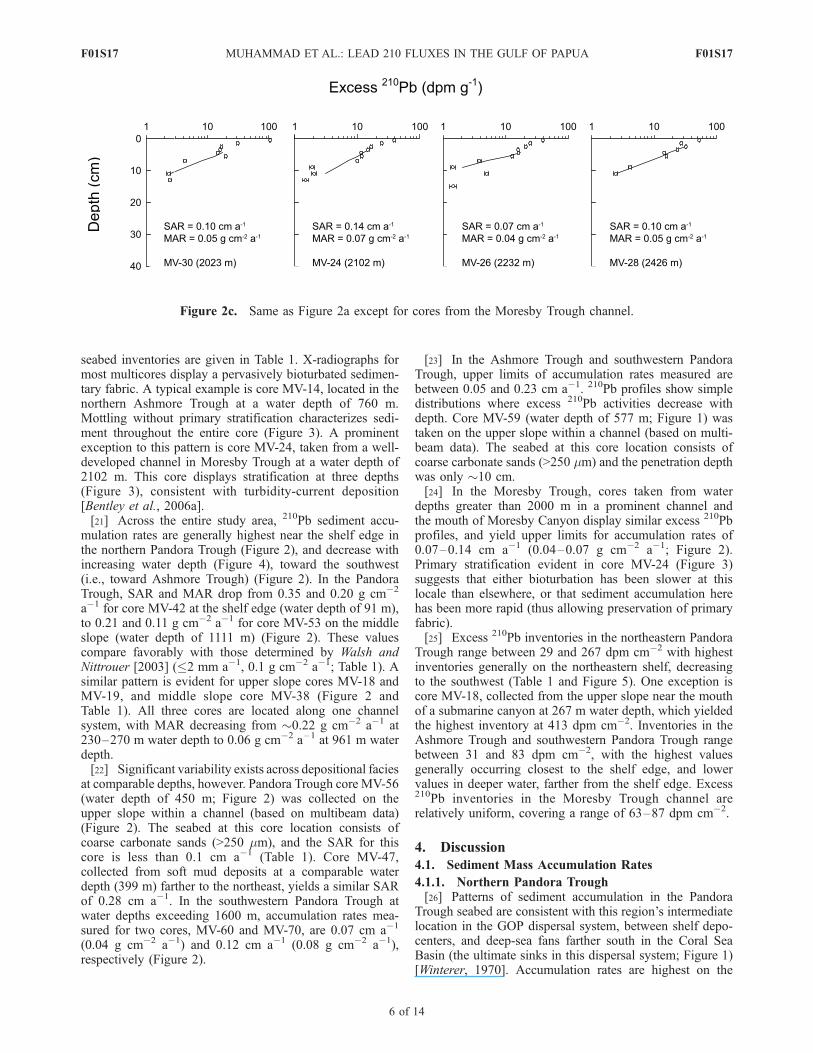
depths greater than 2000 m in a prominent channel andthe mouth of Moresby Canyon display similar excess 210Pbprofiles, and yield upper limits for accumulation rates of0.07–0.14 cm a�1 (0.04–0.07 g cm�2 a�1; Figure 2).Primary stratification evident in core MV-24 (Figure 3)suggests that either bioturbation has been slower at thislocale than elsewhere, or that sediment accumulation herehas been more rapid (thus allowing preservation of primaryfabric).[25] Excess 210Pb inventories in the northeastern Pandora
Trough range between 29 and 267 dpm cm�2 with highestinventories generally on the northeastern shelf, decreasingto the southwest (Table 1 and Figure 5). One exception iscore MV-18, collected from the upper slope near the mouthof a submarine canyon at 267 m water depth, which yieldedthe highest inventory at 413 dpm cm�2. Inventories in theAshmore Trough and southwestern Pandora Trough rangebetween 31 and 83 dpm cm�2, with the highest valuesgenerally occurring closest to the shelf edge, and lowervalues in deeper water, farther from the shelf edge. Excess210Pb inventories in the Moresby Trough channel arerelatively uniform, covering a range of 63–87 dpm cm�2.
4. Discussion
4.1. Sediment Mass Accumulation Rates
4.1.1. Northern Pandora Trough[26] Patterns of sediment accumulation in the Pandora
Trough seabed are consistent with this region’s intermediatelocation in the GOP dispersal system, between shelf depo-centers, and deep-sea fans farther south in the Coral SeaBasin (the ultimate sinks in this dispersal system; Figure 1)[Winterer, 1970]. Accumulation rates are highest on the
Figure 2c. Same as Figure 2a except for cores from the Moresby Trough channel.
F01S17 MUHAMMAD ET AL.: LEAD 210 FLUXES IN THE GULF OF PAPUA
6 of 14
F01S17
outer shelf and upper slope region of the northeasternPandora Trough (Figure 2), and decrease beyond the upperslope toward deeper water (Figure 4). Cores taken from theshelf break (MV-42, MV-43, and MV-44) exhibit measuredSAR values at least twice as large as SAR on the middleslope (MV-38, MV-39, MV-50, and MV-53). This decreasein accumulation rate from the shelf break to the middleslope could be in part due to a decrease in particle flux withincreasing distance from the river source. However, SARand MAR appear to decrease along isobaths to the south-
west, closer to the Fly River, suggesting that the northeastshelf edge is a location of sediment focusing.[27] Cores MV-60 (SAR = 0.07 cm a�1) and MV-32
(SAR = 0.05 cm a�1) located on the lower open slopesuggest that accumulation of terrigenous sediment is negli-gible on a 100 year timescale.[28] All cores collected from the Pandora Trough display
wholly biogenic sedimentary fabric and lack any physicalstratification, suggesting that sediment accumulation occursslowly and steadily, allowing bioturbation to readily over-
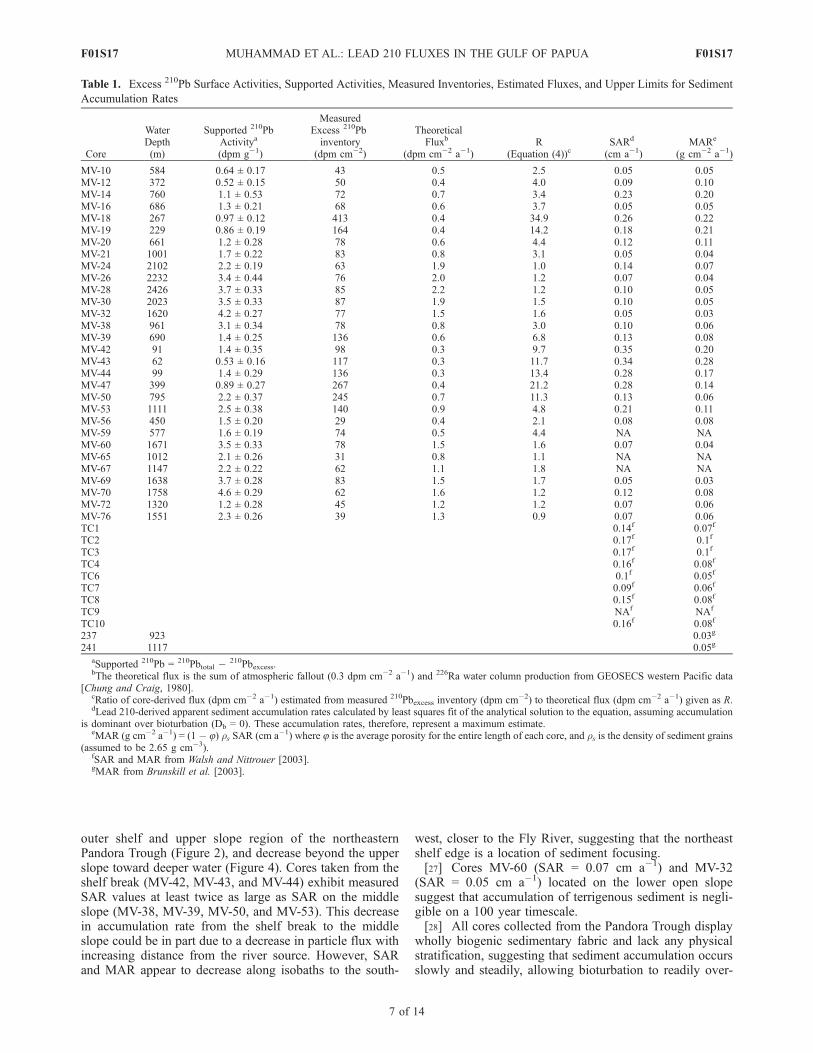
Table 1. Excess 210Pb Surface Activities, Supported Activities, Measured Inventories, Estimated Fluxes, and Upper Limits for Sediment
Accumulation Rates
Core
WaterDepth(m)
Supported 210PbActivitya
(dpm g�1)
MeasuredExcess 210Pbinventory
(dpm cm�2)
TheoreticalFluxb
(dpm cm�2 a�1)R
(Equation (4))cSARd
(cm a�1)MARe
(g cm�2 a�1)
MV-10 584 0.64 ± 0.17 43 0.5 2.5 0.05 0.05MV-12 372 0.52 ± 0.15 50 0.4 4.0 0.09 0.10MV-14 760 1.1 ± 0.53 72 0.7 3.4 0.23 0.20MV-16 686 1.3 ± 0.21 68 0.6 3.7 0.05 0.05MV-18 267 0.97 ± 0.12 413 0.4 34.9 0.26 0.22MV-19 229 0.86 ± 0.19 164 0.4 14.2 0.18 0.21MV-20 661 1.2 ± 0.28 78 0.6 4.4 0.12 0.11MV-21 1001 1.7 ± 0.22 83 0.8 3.1 0.05 0.04MV-24 2102 2.2 ± 0.19 63 1.9 1.0 0.14 0.07MV-26 2232 3.4 ± 0.44 76 2.0 1.2 0.07 0.04MV-28 2426 3.7 ± 0.33 85 2.2 1.2 0.10 0.05MV-30 2023 3.5 ± 0.33 87 1.9 1.5 0.10 0.05MV-32 1620 4.2 ± 0.27 77 1.5 1.6 0.05 0.03MV-38 961 3.1 ± 0.34 78 0.8 3.0 0.10 0.06MV-39 690 1.4 ± 0.25 136 0.6 6.8 0.13 0.08MV-42 91 1.4 ± 0.35 98 0.3 9.7 0.35 0.20MV-43 62 0.53 ± 0.16 117 0.3 11.7 0.34 0.28MV-44 99 1.4 ± 0.29 136 0.3 13.4 0.28 0.17MV-47 399 0.89 ± 0.27 267 0.4 21.2 0.28 0.14MV-50 795 2.2 ± 0.37 245 0.7 11.3 0.13 0.06MV-53 1111 2.5 ± 0.38 140 0.9 4.8 0.21 0.11MV-56 450 1.5 ± 0.20 29 0.4 2.1 0.08 0.08MV-59 577 1.6 ± 0.19 74 0.5 4.4 NA NAMV-60 1671 3.5 ± 0.33 78 1.5 1.6 0.07 0.04MV-65 1012 2.1 ± 0.26 31 0.8 1.1 NA NAMV-67 1147 2.2 ± 0.22 62 1.1 1.8 NA NAMV-69 1638 3.7 ± 0.28 83 1.5 1.7 0.05 0.03MV-70 1758 4.6 ± 0.29 62 1.6 1.2 0.12 0.08MV-72 1320 1.2 ± 0.28 45 1.2 1.2 0.07 0.06MV-76 1551 2.3 ± 0.26 39 1.3 0.9 0.07 0.06TC1 0.14f 0.07f
TC2 0.17f 0.1f
TC3 0.17f 0.1f
TC4 0.16f 0.08f
TC6 0.1f 0.05f
TC7 0.09f 0.06f
TC8 0.15f 0.08f
TC9 NAf NAf
TC10 0.16f 0.08f
237 923 0.03g
241 1117 0.05g
aSupported 210Pb = 210Pbtotal � 210Pbexcess.bThe theoretical flux is the sum of atmospheric fallout (0.3 dpm cm�2 a�1) and 226Ra water column production from GEOSECS western Pacific data
[Chung and Craig, 1980].cRatio of core-derived flux (dpm cm�2 a�1) estimated from measured 210Pbexcess inventory (dpm cm�2) to theoretical flux (dpm cm�2 a�1) given as R.dLead 210-derived apparent sediment accumulation rates calculated by least squares fit of the analytical solution to the equation, assuming accumulation
is dominant over bioturbation (Db = 0). These accumulation rates, therefore, represent a maximum estimate.eMAR (g cm�2 a�1) = (1 � 8) rs SAR (cm a�1) where 8 is the average porosity for the entire length of each core, and rs is the density of sediment grains
(assumed to be 2.65 g cm�3).fSAR and MAR from Walsh and Nittrouer [2003].gMAR from Brunskill et al. [2003].
F01S17 MUHAMMAD ET AL.: LEAD 210 FLUXES IN THE GULF OF PAPUA
7 of 14
F01S17
print primary depositional fabric [e.g., Bentley et al.,2006b].4.1.2. Ashmore Trough and Southwestern PandoraTrough[29] Apparent MARs are generally low for cores in
Ashmore Trough and the southwestern Pandora Trough(0.03–0.10 g cm�2 a�1). A MAR value of 0.20 g cm�2 a�1
for core MV-14 is likely an upper limit due to bioturbation.The geomorphology of this region is dominated by reefsand carbonate platforms with intervening basins. Althoughchannels are present in several places, seismic and pistoncore data show uniformly thin pelagic and hemipelagicdrapes that are primarily carbonate in composition [Franciset al., 2008]. The low SARs and MARs for this area (Table 1and Figures 1 and 2) suggest terrigenous sedimentaccumulation is negligible on a 100 year timescale.X-radiographs from Ashmore Trough (e.g., MV-14) displaywholly biogenic sedimentary fabric (Figure 3), consistent
with low accumulation rates and thorough bioturbation. Theshelf reaches a maximum width of 150 km near theAshmore Trough (Figure 1), and outer shelf sedimentsinclude calcareous algal bioherms, suggesting that littleterrigenous sediment is crossing or accumulating in thisregion at present [Harris et al., 1996]. Collectively, allinformation suggests that limited fluvial sediment reachesAshmore Trough now.4.1.3. Moresby Trough[30] To evaluate potential gravity-driven sediment delivery
from the shelf into the deepest basin of the study area, wetook cores from a prominent submarine channel in theMoresby Trough (Figure 1). This channel was identifiedduring our multibeam and seismic surveys, and extendsfrom the base of the northeastern Pandora Trough slope tothe Moresby Canyon in the southeastern part of the GOP[Francis et al., 2008]. This channel is a likely conduit forlong-term sediment delivery into the Moresby Canyon, asindicated by thick sequences of siliciclastic sediment in theCoral Sea Basin [Ewing et al., 1970; Winterer, 1970].[31] Cores collected from a channel in the Moresby
Trough, downslope from the Pandora Trough, have lowapparent MARs between 0.04 and 0.07 g cm�2 a�1
(Figure 2). One core (MV-24) from this channel displaysstratification suggesting possible turbidity current deposi-tion (Figure 3). Excess 210Pb was detected in this core insamples at 12–14 cm, suggesting that the uppermoststratified bed could have been deposited in the past centuryor so. However, the presence of crosscutting burrows in theX-radiograph of this core (Figure 3) also suggests that thisexcess 210Pb activity could have been transported to thesesediment depths via bioturbation, meaning that the bed isolder. A jumbo piston core (MV-22) collected nearby fromthe same channel-levee complex has been studied byPatterson et al. [2006] and is composed of similar muddyturbidites in the upper �2 m of core. The ages of theuppermost muddy turbidites in MV-22 have not beenestablished, but the highly porous muddy sediment texturesuggests that the turbidites are relatively recent [Patterson etal., 2006]. These observations suggest that this channel isprobably a conduit of sediment transport southward fromthe shelf edge by means of turbidity currents, and furthersuggest that such sediment delivery could continue fartherinto the deep basin via Moresby Canyon.4.1.4. Sediment Accumulation in the Pandora Trough[32] In order to estimate apparent annual mass accumu-
lation across the Pandora Trough (the region for which wehave the most extensive core coverage), we have calculateda regionally weighted average for mass accumulation rates.A region extending from core MV-43 on the northeasternGOP shelf edge to the northeast corner of Eastern FieldsReef and then to Portlock Reef and the adjacent shelfedge was outlined using GIS software. MAR values fromTable 1 were gridded at 5 km resolution using an inversesquare distance interpolation algorithm, to produce aregion of 19,800 km2 with a spatially averaged MARof 0.12 g cm�2 a�1, and total annual apparent massaccumulation rate of �23.7 � 106 t a�1. If the carbonatefraction of our total mass accumulation is �40% of totalsediment mass (Figure 6), the terrigenous fraction wouldthus account for �14 � 106 t a�1, or �5% of the estimated
Figure 3. X-radiographs from multicores show sedimen-tary structure of seabed from GOP (scale in centimeters).(left) Core (MV-14; water depth of 760 m) from AshmoreTrough showing bioturbation and absence of any physicalstructures. This is typical of biogenic fabric observed in X-radiographs of most cores. (right) Core (MV-24; waterdepth of 2102 m) taken from the Moresby Trough showingpossible turbidite layers partially destroyed by bioturbation.
F01S17 MUHAMMAD ET AL.: LEAD 210 FLUXES IN THE GULF OF PAPUA
8 of 14
F01S17
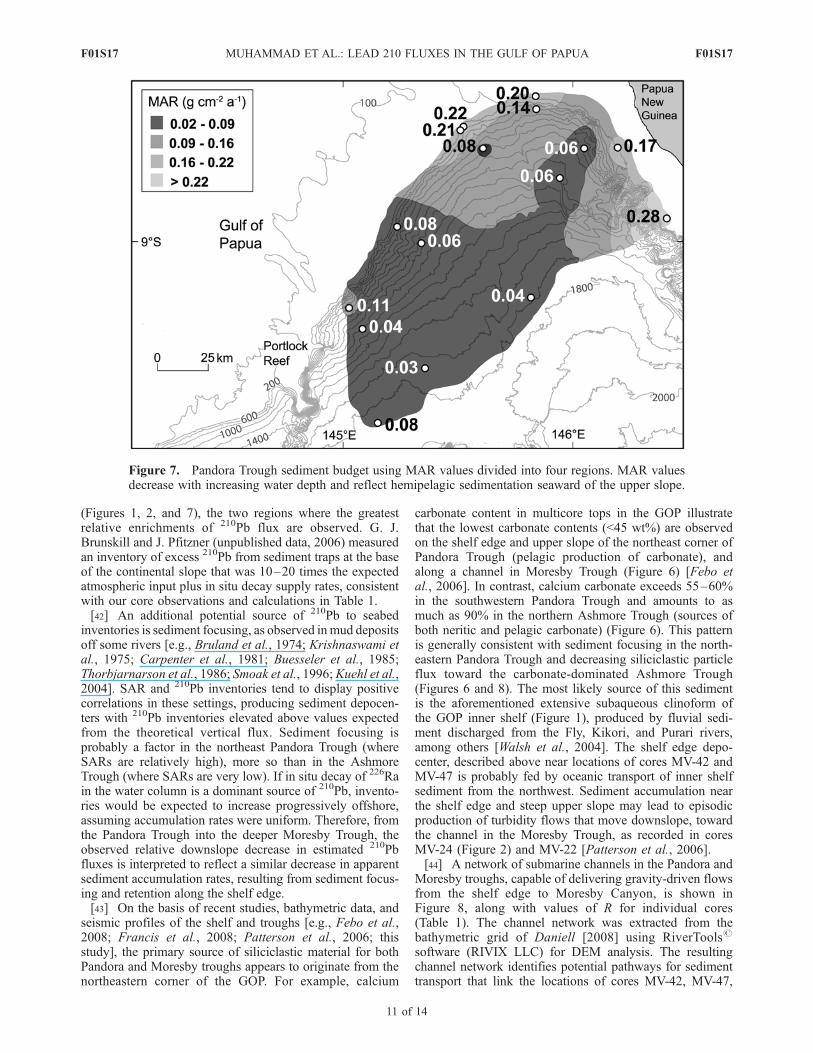
annual fluvial sediment flux to the GOP (�300 � 106 t a�1)[Harris et al., 1993; Milliman, 1995; Milliman et al., 1999].[33] We also estimated the sediment budget for the
northern Pandora Trough using more localized averagingof MAR (Figure 7), to explore MAR variability associatedwith seabed morphology and locale. The surface area ofeach accumulation rate region in Figure 7 was determinedusing ArcGIS (ESRI) software. Spatially averaged MARswere determined using linear inverse distance weighting.Using the localized MAR approach, we estimate a totalsediment budget of �11.3 � 106 t a�1, yielding a terrige-nous fraction of �7 � 106 t a�1 over an area 60% the size ofthe regional budget area described above. This methodhighlights the fact that approximately 85% of terrigenoussediment delivery occurs in a relatively small area, along thenortheast shelf and upper slope of the study area. Possiblesources of error include the values of 210Pb accumulationrates, which we acknowledge to be maximum estimates, aswell as MAR variability in regions we did not sample, orsampled only sparsely.[34] Using a mass accumulation rate of 0.08 g cm�2 a�1
over a smaller region (�8500 km2), Walsh and Nittrouer[2003] estimated a regional accumulation rate of about6.8 � 106 t of sediment per year, or �2.3% of the annualterrigenous sediment flux. Considering the uncertaintiesinvolved with the above calculations, we consider ourresults broadly consistent with those of Walsh and Nittrouer[2003]. However, we have chosen to exclude areas withobserved sediment accumulation in the Moresby Trough(Figure 2) because of the small number of cores spanning alarge and heterogeneous seafloor region. If that region wereincluded, the total quantity of annual sediment accumulationin the deep basins of the Gulf of Papua would be greaterthan the above estimates.
4.2. The 210Pb Fluxes
[35] Inventories of excess 210Pb vary markedly across theGOP, although they generally decrease with increasingwater depth (Figure 5). This spatial variation can beunderstood by comparing the sources of 210Pb in the regionwith the fluxes of 210Pb required to support excess 210Pbinventories at steady state conditions (equation (4)).
[36] The primary sources of 210Pb to waters above theshelf break and slope are atmospheric fallout of 210Pb tosurface water, and production from decay of 226Ra[Cochran, 1982; Cochran et al., 1990]. By comparison,inputs of dissolved 210Pb from rivers are small, mainlybecause of rapid scavenging of dissolved Pb by suspendedsediments [Benninger, 1978]. Assuming efficient trappingof river-borne sediments on the inner shelf, the totalexpected inventory of excess 210Pb deposited on the distalseabed is the sum of the two primary sources mentionedabove. We refer to the sum of flux from these two sources asthe theoretical flux (T).[37] The mean annual atmospheric flux of 210Pb, mea-
sured in rainfall at Townsville, northeastern Australia, be-tween 1964 and 1970, was 0.22 dpm cm�2 a�1 [Bonnymanand Molina-Ramos, 1975]. This average atmospheric 210Pbflux is in good agreement with the 210Pb flux of 0.23 ±0.07 dpm cm�2 a�1 reported by Turekian et al. [1977] fromthe same area. However, J. Pfitzner (unpublished data,2001) measured 210Pb fluxes in rain collections at theAustralian Institute of Marine Sciences (Townsville) andreported a 210Pb flux of 0.33 dpm cm�2 a�1. We note thattemporal and spatial variations in rainfall cause fluctuationsin the atmospheric 210Pb flux, and we use a value of 0.3 dpmcm�2 a�1 [Brunskill et al., 2003; Pfitzner et al., 2004] asrepresentative atmospheric 210Pb flux for our study area.[38] We did not measure 226Ra activities in the water
column from the study area. Consequently, we estimatewater column inventory of 226Ra based on measurementsfrom GEOSECS Station 263 located at 16�400S; 167�050Win the southwestern Pacific, integrated over the depth rangeat each core location. The profile of 226Ra at this stationincreases to a maximum above 1500 m water depth,decreases below 2000 m, and activity of 226Ra rangesbetween 6.0 ± 0.7 and 27.3 ± 0.6 dpm 100 kg�1 fromsurface to 2500 m water depth [Chung and Craig, 1980].Water column generation of 210Pb from 226Ra is calculatedas the product of 226Ra water column inventory and the210Pb decay constant (assuming negligible loss of theintermediate decay product 222Rn).
Figure 4. Sediment accumulation rate (SAR, cm a�1) andmass accumulation rate (MAR, g cm�2 a�1) of samplesversus water depth in the northern Pandora Trough. TheSAR and MAR decrease with increasing distance from theshelf and increasing water depth.
Figure 5. Excess 210Pb inventory versus water depth inthe northern Pandora Trough shelf break and slope region inGOP.
F01S17 MUHAMMAD ET AL.: LEAD 210 FLUXES IN THE GULF OF PAPUA
9 of 14
F01S17
[39] For the present discussion, we will define the ratiobetween the core-calculated flux (F) (equation (4)) andtheoretical flux (T) as R = F/T. If R = 1, then observedinventories are consistent with vertical scavenging of 210Pbfrom the water column inventory, whereas values of R > 1suggest focusing or lateral import of 210Pb to the area.Similarly, a value of R < 1 indicates lateral export of 210Pbfrom that area [e.g., Buesseler et al., 1985; also seeBaskaran and Santschi, 2002].[40] The highest values of R occur along the upper slope
and shelf edge of the northeastern Pandora Trough, whereR 10 for six cores in water depths of 90–1100 m, and R > 5for three additional cores in the area (Figure 2 and Table 1). Inthe Ashmore Trough, intermediate values of 2 � R � 5suggest modest enrichment of 210Pb flux with respect tovertical scavenging of in situ production. These cores (MV-10, MV-12, MV-14, and MV-16) were collected seaward ofescarpments of Portlock, Boot, and Ashmore reefs. Coresfrom the Moresby Trough, southwestern Pandora Trough,and the Eastern Plateau display the lowest values of R (0.9�R � 2), suggesting that in these areas, approximate equilib-rium exists between in situ water column production, andseabed inventories. These cores are from the deepest basins,
and are the most remote from the shelf edge and escarpments,in our study (Table 1 and Figure 1).[41] One potential source of additional 210Pb is the
northern extension of the Coral Sea Current [Wolanski etal., 1995], which could provide 210Pb through the process of‘‘boundary scavenging’’ [Anderson et al., 1994; Moore etal., 1996; Baskaran and Santschi, 2002]. This tropicaloceanic water mass is likely to be very low in suspendedparticulates that could scavenge dissolved 210Pb for exportto the seabed. Because GOP is a semienclosed basin,circulation is strongly influenced by the bathymetry andthe coastal geometry, with substantial transport acrossdepth contours [Wolanski et al., 1995; Ogston et al.,2008; Slingerland et al., 2008b]. More abundant biogenicand lithogenic particles found closer to the GOP shelf couldthus scavenge this dissolved 210Pb advected from offshorewaters, and then the particles could settle to the seabed.Boundary scavenging of 210Pb from such horizontallyadvected water masses might be further enhanced byalong-slope barriers to flow, such as the escarpments sur-rounding Ashmore Trough (Figure 2), and, in the north-eastern Pandora Trough, the sharp bend in the shelf edgeand pronounced steepening of the slope to the southeast
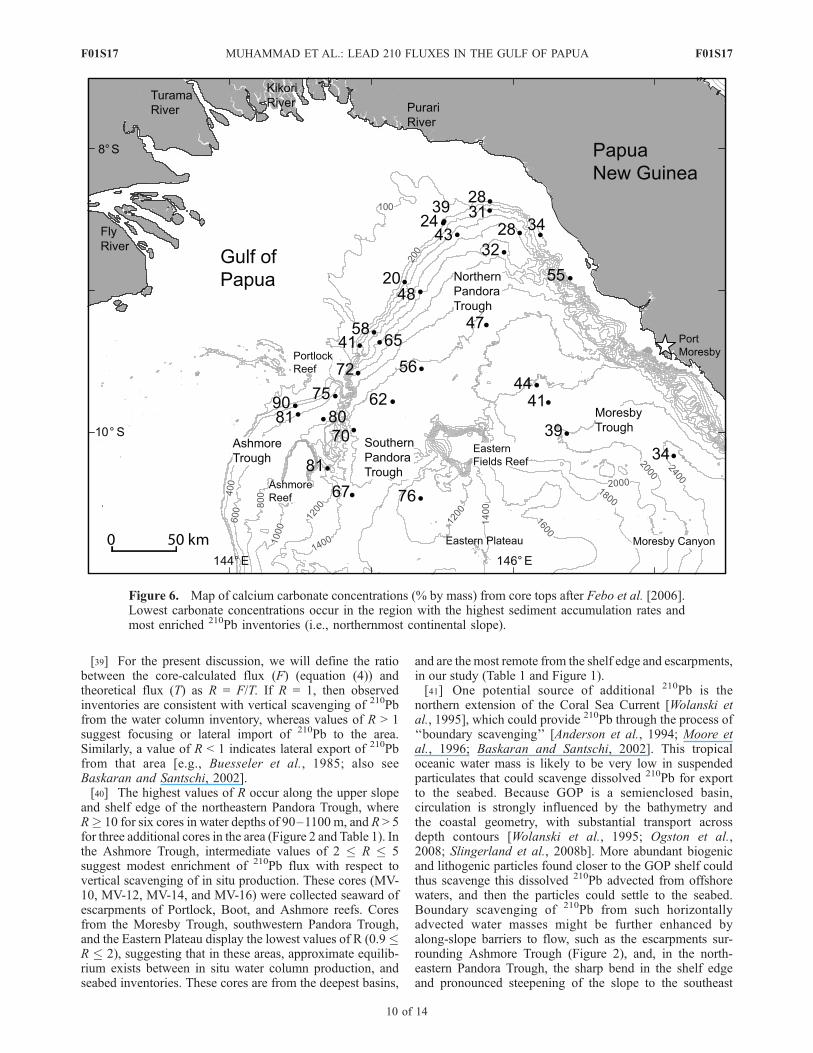
Figure 6. Map of calcium carbonate concentrations (% by mass) from core tops after Febo et al. [2006].Lowest carbonate concentrations occur in the region with the highest sediment accumulation rates andmost enriched 210Pb inventories (i.e., northernmost continental slope).
F01S17 MUHAMMAD ET AL.: LEAD 210 FLUXES IN THE GULF OF PAPUA
10 of 14
F01S17
(Figures 1, 2, and 7), the two regions where the greatestrelative enrichments of 210Pb flux are observed. G. J.Brunskill and J. Pfitzner (unpublished data, 2006) measuredan inventory of excess 210Pb from sediment traps at the baseof the continental slope that was 10–20 times the expectedatmospheric input plus in situ decay supply rates, consistentwith our core observations and calculations in Table 1.[42] An additional potential source of 210Pb to seabed
inventories is sediment focusing, as observed inmud depositsoff some rivers [e.g., Bruland et al., 1974; Krishnaswami etal., 1975; Carpenter et al., 1981; Buesseler et al., 1985;Thorbjarnarson et al., 1986; Smoak et al., 1996; Kuehl et al.,2004]. SAR and 210Pb inventories tend to display positivecorrelations in these settings, producing sediment depocen-ters with 210Pb inventories elevated above values expectedfrom the theoretical vertical flux. Sediment focusing isprobably a factor in the northeast Pandora Trough (whereSARs are relatively high), more so than in the AshmoreTrough (where SARs are very low). If in situ decay of 226Rain the water column is a dominant source of 210Pb, invento-ries would be expected to increase progressively offshore,assuming accumulation rates were uniform. Therefore, fromthe Pandora Trough into the deeper Moresby Trough, theobserved relative downslope decrease in estimated 210Pbfluxes is interpreted to reflect a similar decrease in apparentsediment accumulation rates, resulting from sediment focus-ing and retention along the shelf edge.[43] On the basis of recent studies, bathymetric data, and
seismic profiles of the shelf and troughs [e.g., Febo et al.,2008; Francis et al., 2008; Patterson et al., 2006; thisstudy], the primary source of siliciclastic material for bothPandora and Moresby troughs appears to originate from thenortheastern corner of the GOP. For example, calcium
carbonate content in multicore tops in the GOP illustratethat the lowest carbonate contents (<45 wt%) are observedon the shelf edge and upper slope of the northeast corner ofPandora Trough (pelagic production of carbonate), andalong a channel in Moresby Trough (Figure 6) [Febo etal., 2006]. In contrast, calcium carbonate exceeds 55–60%in the southwestern Pandora Trough and amounts to asmuch as 90% in the northern Ashmore Trough (sources ofboth neritic and pelagic carbonate) (Figure 6). This patternis generally consistent with sediment focusing in the north-eastern Pandora Trough and decreasing siliciclastic particleflux toward the carbonate-dominated Ashmore Trough(Figures 6 and 8). The most likely source of this sedimentis the aforementioned extensive subaqueous clinoform ofthe GOP inner shelf (Figure 1), produced by fluvial sedi-ment discharged from the Fly, Kikori, and Purari rivers,among others [Walsh et al., 2004]. The shelf edge depo-center, described above near locations of cores MV-42 andMV-47 is probably fed by oceanic transport of inner shelfsediment from the northwest. Sediment accumulation nearthe shelf edge and steep upper slope may lead to episodicproduction of turbidity flows that move downslope, towardthe channel in the Moresby Trough, as recorded in coresMV-24 (Figure 2) and MV-22 [Patterson et al., 2006].[44] A network of submarine channels in the Pandora and
Moresby troughs, capable of delivering gravity-driven flowsfrom the shelf edge to Moresby Canyon, is shown inFigure 8, along with values of R for individual cores(Table 1). The channel network was extracted from thebathymetric grid of Daniell [2008] using RiverTools#
software (RIVIX LLC) for DEM analysis. The resultingchannel network identifies potential pathways for sedimenttransport that link the locations of cores MV-42, MV-47,
Figure 7. Pandora Trough sediment budget using MAR values divided into four regions. MAR valuesdecrease with increasing water depth and reflect hemipelagic sedimentation seaward of the upper slope.
F01S17 MUHAMMAD ET AL.: LEAD 210 FLUXES IN THE GULF OF PAPUA
11 of 14
F01S17
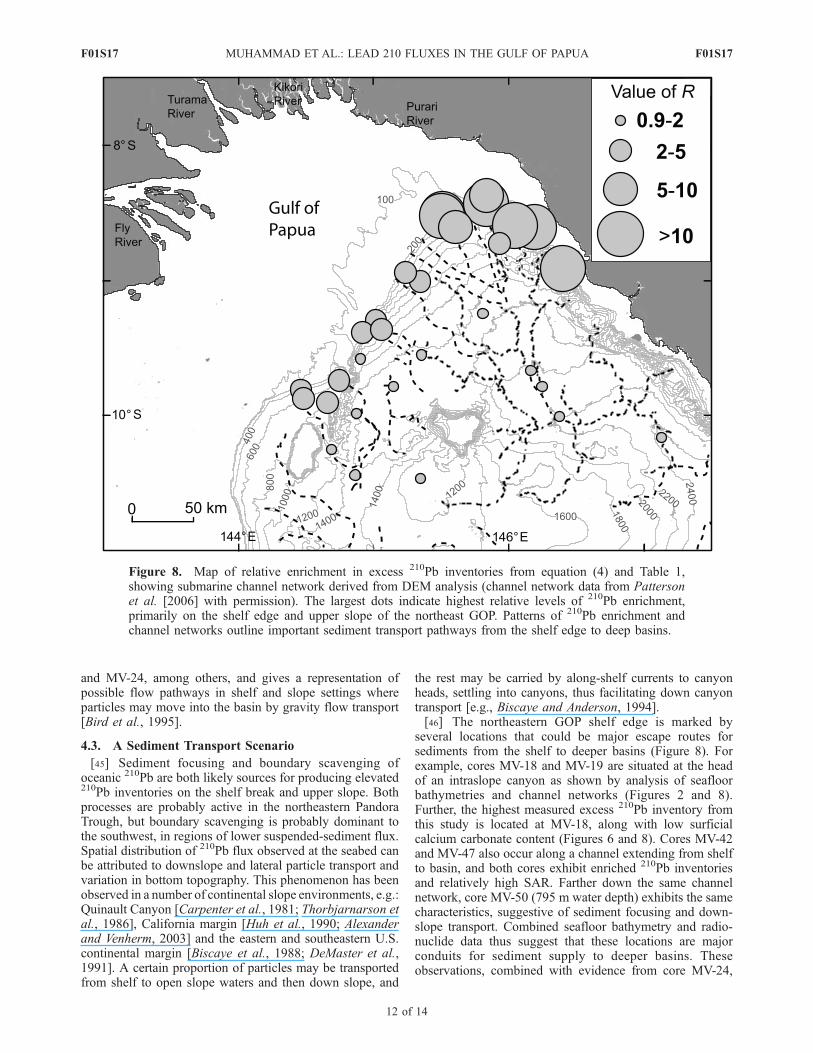
and MV-24, among others, and gives a representation ofpossible flow pathways in shelf and slope settings whereparticles may move into the basin by gravity flow transport[Bird et al., 1995].
4.3. A Sediment Transport Scenario
[45] Sediment focusing and boundary scavenging ofoceanic 210Pb are both likely sources for producing elevated210Pb inventories on the shelf break and upper slope. Bothprocesses are probably active in the northeastern PandoraTrough, but boundary scavenging is probably dominant tothe southwest, in regions of lower suspended-sediment flux.Spatial distribution of 210Pb flux observed at the seabed canbe attributed to downslope and lateral particle transport andvariation in bottom topography. This phenomenon has beenobserved in a number of continental slope environments, e.g.:Quinault Canyon [Carpenter et al., 1981; Thorbjarnarson etal., 1986], California margin [Huh et al., 1990; Alexanderand Venherm, 2003] and the eastern and southeastern U.S.continental margin [Biscaye et al., 1988; DeMaster et al.,1991]. A certain proportion of particles may be transportedfrom shelf to open slope waters and then down slope, and
the rest may be carried by along-shelf currents to canyonheads, settling into canyons, thus facilitating down canyontransport [e.g., Biscaye and Anderson, 1994].[46] The northeastern GOP shelf edge is marked by
several locations that could be major escape routes forsediments from the shelf to deeper basins (Figure 8). Forexample, cores MV-18 and MV-19 are situated at the headof an intraslope canyon as shown by analysis of seafloorbathymetries and channel networks (Figures 2 and 8).Further, the highest measured excess 210Pb inventory fromthis study is located at MV-18, along with low surficialcalcium carbonate content (Figures 6 and 8). Cores MV-42and MV-47 also occur along a channel extending from shelfto basin, and both cores exhibit enriched 210Pb inventoriesand relatively high SAR. Farther down the same channelnetwork, core MV-50 (795 m water depth) exhibits the samecharacteristics, suggestive of sediment focusing and down-slope transport. Combined seafloor bathymetry and radio-nuclide data thus suggest that these locations are majorconduits for sediment supply to deeper basins. Theseobservations, combined with evidence from core MV-24,
Figure 8. Map of relative enrichment in excess 210Pb inventories from equation (4) and Table 1,showing submarine channel network derived from DEM analysis (channel network data from Pattersonet al. [2006] with permission). The largest dots indicate highest relative levels of 210Pb enrichment,primarily on the shelf edge and upper slope of the northeast GOP. Patterns of 210Pb enrichment andchannel networks outline important sediment transport pathways from the shelf edge to deep basins.
F01S17 MUHAMMAD ET AL.: LEAD 210 FLUXES IN THE GULF OF PAPUA
12 of 14
F01S17
further suggest that sediment transport occurs in bothnepheloid layers and turbidity flows.
5. Conclusions
[47] Examination of 210Pb activities on the continentalmargin and basin of the GOP has given some insight intothe behavior of 210Pb and the processes that control sedimenttransfer on the continental margin. Patterns of sedimentaccumulation (0.05–0.35 cm a�1; 0.05–0.28 g cm�2 a�1)and inventory-derived 210Pb fluxes (1–12.8 dpm cm�2 a�1)display regional variations, decreasing seaward, and alongisobaths away from the northeastern shelf edge. The amountof terrigenous sediment load being discharged annuallyfrom the shelf and accumulating in Pandora Trough isapproximately 7–14 � 106 t, generally consistent withprevious findings. However, the existence of possible tur-bidity current transport and deposition have been docu-mented in a deep basin, Moresby Trough, suggesting thatadditional downslope export and sediment accumulationmay be occurring in deeper parts of the Coral Sea. Highexcess 210Pb fluxes estimated from seabed inventories at theshelf break and upper slope are consistent with the com-bined effects of sediment focusing and boundary scaveng-ing of oceanic water masses. Sediments may be transportedfrom inner shelf depocenters by oceanic processes, focusedin depocenters near the northeastern GOP shelf edge, anddistributed downslope through a combination of nepheloidlayer flow and possible turbidity currents.
[48] Acknowledgments. We thank the crew and scientists aboard theR/V Melville during the PANASH cruise for their assistance in collectingsamples and data. We also thank other members of the MARGINS Source-to-Sink research group for useful discussions and constructive commentsover the past 2 years. Thoughtful comments from C. A. Nittrouer and twoanonymous reviewers have improved this paper. This MARGINS Source-to-Sink research was funded by National Science Foundation grant OCE0305373 to S. J. Bentley.
ReferencesAlexander, C. R., and C. Venherm (2003), Modern sedimentary processesin the Santa Monica, California continental margin: sediment accumula-tion, mixing and budget, Mar. Environ. Res., 56, 177–204.
Anderson, R. F., M. Q. Fleischer, P. E. Biscaye, N. Kumar, B. Dittrich,P. Kubik, and M. Suter (1994), Anomalous boundary scavenging inthe Middle Atlantic Bight: evidence from 230Th, 231Pa, 10Be and210Pb, Deep Sea Res., Part II, 41, 537–561.
Appleby, P. G., and F. Oldfield (1992), Application of lead-210 to sedi-mentation studies, in Uranium-Series Disequilibria: Applications toEarth, Marine, and Environmental Sciences, edited by M. Ivanovichand R. S. Harmon, pp. 731–778, Clarendon, Oxford, U.K.
Baskaran, M., and P. H. Santschi (2002), Particulate and dissolved 210Pbactivities in the shelf and slope regions of the Gulf of Mexico waters,Cont. Shelf Res., 22, 1493–1510.
Benninger, L. K. (1978), 210Pb balance in Long Island Sound, Geochim.Cosmochim. Acta, 42, 1165–1174.
Benninger, L. K., R. C. Aller, J. K. Cochran, and K. K. Turekian (1979),Effects of biological sediment mixing on the 210Pb chronology and tracemetal distribution in a Long Island sound sediment core, Earth Planet.Sci. Lett., 43, 241–259.
Bentley, S. J., Z. Muhammad, L. J. Patterson, A. W. Droxler, G. R. Dickens,L. C. Peterson, and B. N. Opdyke (2006a), Modern and Pleistoceneturbidite sedimentation in the Gulf of Papua S2S study area: Implicationsfor modulation of sediment sources by oceanic and climatic processes,paper presented at 2006 Annual Convention, Am. Assoc. of Pet. Geol.,Houston, Tex., 9–12 April.
Bentley, S. J., A. Sheremet, and J. M. Jaeger (2006b), Bioturbation, eventsedimentation, and preserved sedimentary fabric: Field and model com-parisons in three contrasting marine settings, Cont. Shelf Res., 26, 2108–2124.
Bird, M. I., G. J. Brunskill, and A. R. Chivas (1995), Carbon isotopecomposition of sediments from the Gulf of Papua, Geo Mar. Lett., 15,153–159.
Biscaye, P. E., and R. F. Anderson (1994), Fluxes of particulate matter onthe slope of the southern Middle Atlantic Bight: SEEP-II, Deep Sea Res.,Part II, 41, 459–509.
Biscaye, P. E., R. F. Anderson, and B. L. Deck (1988), Fluxes of particlesand constituents to the eastern United States continental slope and rise:SEEP-I, Cont. Shelf Res., 8, 855–904.
Bonnyman, J., and J. Molina-Ramos (1975), Concentrations of lead-210 inrainwater in Australia during the years 1964–1970, Commonwealth X-rayand Radium Lab., Dep. of Health, Melbourne, Australia.
Bruland, K. W., M. Koide, and E. D. Goldberg (1974), The comparativemarine geochemistries of lead-210 and radium-226, J. Geophys. Res., 79,3083–3086.
Brunskill, G. J., K. J. Woolfe, and I. Zagorskis (1995), Distribution ofriverine sediment chemistry on the shelf, slope, and rise of the Gulf ofPapua, Geo Mar. Lett., 15, 160–165.
Brunskill, G. J., I. Zagorskis, and J. Pfitzner (2003), Geochemical massbalance for lithium, boron, and strontium in the Gulf of Papua, PapuaNew Guinea (Project TROPICS), Geochim. Cosmochim. Acta, 67,3365–3383.
Buesseler, K. O., H. D. Livingston, and E. R. Sholkovitz (1985), 239,240Puand excess 210Pb inventories along the shelf and slope of the northeastU.S.A., Earth Planet. Sci. Lett., 76, 10–22.
Carpenter, R., J. T. Bennett, and M. L. Peterson (1981), 210Pb activities inand fluxes to sediments of the Washington continental slope and shelf,Geochim. Cosmochim. Acta, 45, 1172–1981.
Chung, Y., and H. Craig (1980), 226Ra in the Pacific Ocean, Earth Planet.Sci. Lett., 49, 267–292.
Cochran, J. K. (1982), The oceanic chemistry of the U-and Th-seriesnuclides, in Uranium Series Disequilibrium: Applications toEnvironmental Problems, edited by M. Ivanovich and R. S. Harmon,pp. 384–430, Clarendon, Oxford, U.K.
Cochran, J. K., T. McKibbin-Vaughan, M. M. Dornblaser, D. Hirschberg,H. D. Livingston, and K. O. Buesseler (1990), 210Pb scavenging in theNorth Atlantic and North Pacific oceans, Earth Planet. Sci. Lett., 97,332–352.
Cutshall, N. H., I. L. Larsen, and C. R. Olsen (1983), Direct analysis ofPb-210 in sediment samples: Self-absorption corrections, Nucl. Instrum.Methods Phys. Res., 206, 309–312.
Daniell, J. J. (2008), Development of a bathymetric grid for the Gulf ofPapua and adjacent areas: A note describing its development, J. Geophys.Res., 113, F01S15, doi:10.1029/2006JF000673.
DeMaster, D. J., D. C. Brewster, B. A. McKee, and C. A. Nittrouer (1991),Rates of particle scavenging, sediment reworking, and longitudinal rippleformation at the HEBBLE site based on measurements of 234Th and210Pb, Mar. Geol., 99, 423–444.
Ewing, J. I., R. E. Houtz, and W. J. Ludwig (1970), Sediment distribution inthe Coral Sea, J. Geophys. Res., 75, 1963–1972.
Febo, L. A., S. J. Bentley, G. R. Dickens, A. W. Droxler, L. C. Peterson,and B. N. Opdyke (2006), Recent to late Pleistocene sedimentary organicmatter in the Gulf of Papua, poster presented at 2006 Annual Convention,Am. Assoc. of Pet. Geol., Houston, Tex., 9–12 April.
Febo, L. A., S. J. Bentley, J. H. Wrenn, A. W. Droxler, G. R. Dickens, L. C.Peterson, and B. Opdyke (2008), Late Pleistocene and Holocene sedi-mentation, organic carbon delivery, and paleoclimatic inferences on thecontinental slope of the northern Pandora Trough, Gulf of Papua,J. Geophys. Res., doi:10.1029/2006JF000677, in press.
Francis, J. M., J. Daniell, A. W. Droxler, G. R. Dickens, S. J. Bentley, L. C.Peterson, B. N. Opdyke, and L. Beaufort (2008), Deep-water geomor-phology of the mixed siliciclastic-carbonate system, Gulf of Papua,J. Geophys. Res., doi:10.1029/2007JF000851, in press.
Goldberg, E. D., and M. Koide (1962), Geochronological studies of deepsea sediments by the ionium/thorium method, Geochim. Cosmochim.Acta, 26, 417–450.
Harris, P. T., E. K. Baker, A. R. Cole, and S. A. Short (1993), Preliminarystudy of sedimentation in the tidally dominated Fly River Delta, Gulf ofPapua, Cont. Shelf Res., 13, 441–472.
Harris, P. T., C. B. Pattiaratchi, J. B. Keene, R. W. Dalrymple, J. V. Gardner,E. K. Baker, A. R. Cole, D. Mitchell, P. Gibbs, and W. W. Schroeder(1996), Late Quaternary deltaic and carbonate sedimentation in the Gulfof Papua foreland basin: Response to sea-level change, J. Sediment. Res.,66, 801–819.
Huh, C. A., L. F. Small, S. Niemnil, B. P. Finney, B. M. Hickey, N. B.Kachel, D. S. Gorsline, and P. M. Williams (1990), Sedimentation dy-namics in the Santa Monica-San Pedro basin off Los Angeles: Radio-chemical, sediment trap and transmissometer studies, Cont. Shelf Res.,10, 137–164.
F01S17 MUHAMMAD ET AL.: LEAD 210 FLUXES IN THE GULF OF PAPUA
13 of 14
F01S17
Koide, M., A. Soutar, and E. D. Goldberg (1972), Marine geochronologywith 210Pb, Earth Planet. Sci. Lett., 14, 442–446.
Krishnaswami, S., B. L. K. Somayajulu, and Y. Chung (1975), 210Pb/226Radisequilibrium in the Santa Barbara Basin, Earth Planet. Sci. Lett., 27,388–392.
Krishnaswami, S., L. K. Benninger, R. C. Aller, and K. L. Vondamm(1980), Atmospherically-derived radionuclides as tracers of sedimentmixing and accumulation in near-shore marine and lake sediments: Evi-dence from Be-7, Pb-210, and Pu-239, Pu-240, Earth Planet. Sci. Lett.,47, 307–318.
Kuehl, S. A., D. J. DeMaster, and C. A. Nittrouer (1986), Nature of sedi-ment accumulation on the Amazon continental shelf, Cont. Shelf Res., 6,209–225.
Kuehl, S. A., G. J. Brunskill, K. Burns, D. C. Fugate, and T. Kniskern(2004), Nature of sediment dispersal off the Sepik River, Papua NewGuinea: Preliminary sediment budget and implications for margin pro-cesses, Cont. Shelf Res., 24, 2417–2429.
Milliman, J. D. (1995), Sediment discharge to the ocean from small moun-tainous rivers: the New Guinea example, Geo Mar. Lett., 15, 127–133.
Milliman, J. D., K. L. Farnsworth, and C. S. Albertin (1999), Flux and fateof fluvial sediments leaving large islands in the East Indies, J. Sea Res.,41, 97–107.
Moore, W. S., D. J. DeMaster, J. M. Smoak, B. A. McKee, and P. W.Swarzenski (1996), Radionuclide tracers of sediment-water interactionson the Amazon shelf, Cont. Shelf Res., 16, 645–665.
Nittrouer, C. A., R. W. Sternberg, R. Carpenter, and J. T. Bennett (1979),Use of Pb-210 geochronology as a sedimentological tool: Application tothe Washington continental-shelf, Mar. Geol., 31, 297–316.
Nittrouer, C. A., D. J. DeMaster, B. A. McKee, N. H. Cutshall, and I. L.Larsen (1984), The effect of sediment mixing on Pb-210 accumulationrates for the Washington continental shelf, Mar. Geol., 54, 201–221.
NSF MARGINS Office (2004), NSF MARGINS Program science plans,170 pp., Lamont-Doherty Earth Obs., Columbia Univ., Palisades, N. Y.
Ogston, A. S., R. W. Sternberg, C. A. Nittrouer, D. P. Martin, M. A. Goni,and J. S. Crockett (2008), Sediment delivery from the Fly River tidallydominated delta to the nearshore marine environment and the impact ofEl Nino, J. Geophys. Res., 113, F01S11, doi:10.1029/2006JF000669.
Patterson, L. J., S. J. Bentley, D. H. Henry, G. R. Dickens, A. W. Droxler,L. C. Peterson, and B. N. Opdyke (2006), Petrological and geochemicalinvestigations of deep sea turbidite sands in the Pandora and Moresbytroughs, source to sink Papua New Guinea focus area, poster presented at2006 Annual Convention, Am. Assoc. of Pet. Geol., Houston, Tex., 9–12April.
Pfitzner, J., G. Brunskill, and I. Zagorskis (2004), 137Cs and excess 210Pbdeposition patterns in estuarine and marine sediment in the central regionof the Great Barrier Reef Lagoon, north-eastern Australia, J. Environ.Radioact., 76, 81–102.
Pickup, G. (1984), Geomorphology of tropical rivers: I. Landforms, hydrol-ogy, and sedimentation in the Fly and lower Purari, Papua New Guinea,Catena Suppl., 5, 18–41.
Slingerland, R. L., N. W. Driscoll, J. D. Milliman, S. R. Miller, and E. A.Johnstone (2008a), Anatomy and growth of a Holocene clinothem in theGulf of Papua, J. Geophys. Res., doi:10.1029/2006JF000628, in press.
Slingerland, R., R. Selover, A. Ogston, T. R. Keen, N. W. Driscoll, and J. D.Milliman (2008b), Building the Holocene clinothem in the Gulf of Papua:An ocean circulation study, J. Geophys. Res., doi:10.1029/2006JF000680, in press.
Smoak, J. M., D. J. DeMaster, S. A. Kuehl, R. H. Pope, and B. A. McKee(1996), The behavior of particle-reactive tracers in a high turbidity en-vironment: 234Th and 210Pb on the Amazon continental shelf, Geochim.Cosmochim. Acta, 60, 2123–2137.
Thomson, J., S. Colley, and P. P. E. Weaver (1988), Bioturbation into arecently emplaced deep-sea turbidite surface as revealed by 210Pbexcess,230Thexcess and planktonic foraminifera distribution, Earth Planet. Sci.Lett., 90, 157–173.
Thorbjarnarson, K. W., C. A. Nittrouer, and D. J. DeMaster (1986), Accu-mulation of modern sediment in Quinault submarine canyon, Mar. Geol.,71, 107–124.
Turekian, K. K., Y. Nozaki, and L. K. Benninger (1977), Geochemistry ofatmospheric radon and radon products, Annu. Rev. Earth Planet. Sci., 5,227–255.
Walsh, J. P., and C. A. Nittrouer (2003), Contrasting styles of off-shelfsediment accumulation in New Guinea, Mar. Geol., 196, 105–125.
Walsh, J. P., and C. A. Nittrouer (2004), Mangrove-bank sedimentation in amesotidal environment with large sediment supply, Gulf of Papua, Mar.Geol., 208, 225–248.
Walsh, J. P., C. A. Nittrouer, C. M. Palinkas, A. S. Ogston, R. W. Sternberg,and G. J. Brunskill (2004), Clinoform mechanics in the Gulf of Papua,New Guinea, Cont. Shelf Res., 24, 2487–2510.
Winterer, E. L. (1970), Submarine valley systems around Coral-Sea basin(Australia), Mar. Geol., 8, 229–244.
Wolanski, E., and D. M. Alongi (1995), A hypothesis for the formation of amud bank in the Gulf of Papua, Geo Mar. Lett., 15, 166–171.
Wolanski, E., A. Norro, and B. King (1995), Water circulation in the Gulfof Papua, Cont. Shelf Res., 15, 185–212.
Wolanski, E., R. J. Gibbs, S. Spagnol, B. King, and G. Brunskill (1998),Inorganic sediment budget in the mangrove-fringed Fly River Delta,Papua New Guinea, Mangroves Salt Marshes, 2, 85–98.
�����������������������S. J. Bentley, Earth Sciences Department, 6010 Alexander Murray
Building, Memorial University of Newfoundland, St. John’s, NL, CanadaA1B 3X5.G. R. Dickens and A. W. Droxler, Department of Earth Science, Rice
University, MS 126, P.O. Box 1892, Houston, TX 77251-1892, USA.L. A. Febo, Department of Geology and Geophysics, E235 Howe-Russell
Building, Louisiana State University, Baton Rouge, LA 70803, USA.Z. Muhammad, Coastal Studies Institute, Howe-Russell Geoscience
Complex, Room 331, Louisiana State University, Baton Rouge, LA 70803,USA. ([email protected])B. N. Opdyke, Department of Earth and Marine Science, Building 47,
Australian National University, Canberra, ACT 0200, Australia.L. C. Peterson, Rosenstiel School of Marine and Atmospheric Science,
4600 Rickenbacker Causeway, University of Miami, Miami, FL 33149-1098, USA.
F01S17 MUHAMMAD ET AL.: LEAD 210 FLUXES IN THE GULF OF PAPUA
14 of 14
F01S17
Top Related
Copyright © 2022 FDOKUMEN

