


Bahasa
Halaman
Hukum


Studies in Engineering and Technology
Vol. 1, No. 1; February 2014
ISSN 2330-2038 E-ISSN 2330-2046
Published by Redfame Publishing
URL: http://set.redfame.com
22
Examples of Mental Mistakes Made by Systems Engineers While Creating Tradeoff Studies
James Bohlman1 & A. Terry Bahill
1
1Systems and Industrial Engineering, University of Arizona, USA
Correspondence: Terry Bahill, Systems and Industrial Engineering, University of Arizona, 1622 W. Montenegro, Tucson
AZ 85704-1822, USA. E-mail: [email protected]
Received: October 21, 2013 Accepted: November 4, 2013 Available online: November 21, 2013
doi:10.11114/set.v1i1.239 URL: http://dx.doi.org/10.11114/set.v1i1.239
Abstract
Problem statement: Humans often make poor decisions. To help them make better decisions, engineers are taught to
create tradeoff studies. However, these engineers are usually unaware of mental mistakes that they make while creating
their tradeoff studies. We need to increase awareness of a dozen specific mental mistakes that engineers commonly
make while creating tradeoff studies.
Aims of the research: To prove that engineers actually do make mental mistakes while creating tradeoff studies. To
identify which mental mistakes can be detected in tradeoff study documentation.
Methodology: Over the past two decades, teams of students and practicing engineers in Bahill’s Systems Engineering
courses wrote the system design documents for an assigned system. On average, each of these document sets took 100
man-hours to create and comprised 75 pages. We used 110 of these projects, two dozen government contractor tradeoff
studies and three publicly accessible tradeoff studies. We scoured these document sets looking for examples of 28
specific mental mistakes that might affect a tradeoff study. We found instances of a dozen of these mental mistakes.
Results: Often evidence of some of these mistakes cannot be found in the final documentation. To find evidence for
such mistakes, the experimenters would have had to be a part of the data collection and decision making process. That
is why, in this paper, we present only 12 of the original 28 mental mistakes. We found hundreds of examples of such
mistakes. We provide suggestions to help people avoid making these mental mistakes while doing tradeoff studies.
Conclusions: This paper shows evidence of a dozen common mental mistakes that are continually being repeated by
engineers while creating tradeoff studies. When engineers are taught about these mistakes, they can minimize their
occurrence in the future.
Keywords: validation, decision making, mistakes, design documentation
1. Introduction
Humans often make poor decisions. To help them be better decision-makers, engineering professors teach their students
to create tradeoff studies. Tradeoff studies are broadly recognized as the method for simultaneously considering
multiple alternatives with many criteria, and as such are recommended and mandated in the Capability Maturity Model
Integration (CMMI®) (CMMI, 2010; Chrissis, Konrad and Shrum, 2003) Decision Analysis and Resolution (DAR)
process. The decision-making fields of Judgment and Decision Making, Cognitive Science and Experimental
Economics have built up a large body of research on human biases and errors in considering numerical and
criteria-based choices. Relationships between experiments in these fields and the elements of tradeoff studies show that
tradeoff studies are susceptible to human mental mistakes. Smith, Son, Piattelli-Palmarini and Bahill (2007) postulated
28 specific mental mistakes that could affect the ten specific components of a tradeoff study.
However, Smith et al. (2007) did not have examples from the system engineering literature. So we sought to validate
their model by finding and documenting specific instances of these mental mistakes in tradeoff studies. This present
paper validates the proposals of the Smith, et al. (2007). It presents real-world examples of a dozen of these mistakes. It
would have been a daunting challenge to find examples of such mistakes in the open systems engineering literature,
because the literature just does not publish mistakes.

Studies in Engineering and Technology Vol. 1, No. 1; 2014
23
1.1 What Are Tradeoff Studies?
Tradeoff studies are broadly recognized and mandated as the method for simultaneously considering multiple
alternatives with many criteria (Daniels, Werner & Bahill, 2001; Smith et al., 2007). Tradeoff studies provide an ideal,
rational method for choosing among alternatives. Tradeoff studies involve a mathematical consideration of many
evaluation criteria for many alternatives simultaneously, in parallel.
Tradeoff studies are performed at the beginning of a project to help state the problem, select the desired system
architecture and make major purchases. However, throughout a project tradeoffs are continually being made: creating
team communication methods, selecting tools and vendors, selecting components, choosing implementation techniques,
designing test programs, and maintaining schedule. Many of these tradeoffs should be formally documented.
The components of a tradeoff study are the (1) problem statement, (2) evaluation criteria, (3) weights of importance, (4)
alternate solutions, (5) evaluation data, (6) scoring functions, (7) normalized scores, (8) combining functions, (9)
preferred alternatives and (10) sensitivity analysis.
The following is a cartoon of a simple tradeoff study. The analyst is designing a system to help a baseball umpire to call
balls and strikes. He is trying to select the preferred alternative. His two alternatives are a complex instrument named
the Umpire’s Assistant and a Seeing Eye dog. His evaluation criteria are Accuracy of the Call and Silence of
Communication between the alternative systems and the umpire. (We do not want it to intrude on the classic game.) The
very bottom row shows that the Umpire’s Assistant was the recommended alternative.
Table 1. A Generic Tradeoff Study
Criteria
Weights of
Importance of the
Criteria
Alternative-1 Scores Alternative-2 Scores
Criterion-1 wt1 s11 s12
Criterion-2 wt2 s21 s22
Alternative
Rating 1 1 11 2 21sum wt s wt s
2 1 12 2 22sum wt s wt s
Table 2. Tradeoff Study Numerical Example
Alternatives
Evaluation Criteria Weights of
Importance
Umpire’s
Assistant
Seeing
Eye Dog
Accuracy of the Call 0.75 0.67 0.33
Silence of Communication 0.25 0.83 0.17
Sum of weight times score 0.71
The winner 0.29
The numerical values go from 0 to 1, with 1 being the best.
2. Research Methodology
Over the last quarter of a century, Bahill has sought out and collected examples of tradeoff studies. He collected 110
university projects, two dozen government contractor tradeoff studies (these reports are proprietary and cannot be
published) and three publicly accessible tradeoff studies such as the San Diego Airport site selection study.
Then the authors read these reports looking for evidence of the 28 specific mental mistakes postulated by Smith et al
(2007). Bohlman read all 8000 pages of the university projects and filled a database with over 800 examples of such
mistakes. These examples were put into categories according to the 28 specific mental mistakes that we were looking
for. After several iterations, we decided that our examples fit into only 12 of these categories. Bahill then rated each
example for the perceived heuristic value, meaning the goodness of illustrating each type of mental mistake. The
examples with the least perceived value were set aside. The remaining examples were compared with the original
documents checking for context and accuracy. They were then re-rated based on the perceived heuristic value, uniform
coverage of the dozen mental mistakes and reducing the number of different projects that would have to be explained.
We created the 20 development cases that are in this paper, and another 50 cases that were used for testing. Finally,

Studies in Engineering and Technology Vol. 1, No. 1; 2014
24
Bahill read the government contractor tradeoff studies and the three identified publicly accessible tradeoff studies and
similarly created case studies.
Often evidence of some of these mental mistakes cannot be found in the final documentation. To find evidence for such
mistakes, the experimenters would have to have been a part of the data collection and decision making process. That is
why, in this paper, we present only 12 of the original 28 mental mistakes. This paper presents examples of the following
mental mistakes.
1. Using Dependent Criteria
2. Not Stating the Problem in Terms of Stakeholder Needs
3. Vague Problem Statement
4. Substituting a Related Attribute
5. Sensitivity Analysis Mistakes
6. Forer Effect
7. Weight of Importance Mistakes
8. Anchoring and the Status Quo
9. Treating Gains and Losses Equally
10. Not Using Scoring Functions
11. Implying False Precision
12. Obviating Expert Opinion
This paper is organized as follows: for each of the above (1) the section heading announces the type of mental mistake,
(2) Smith et al’s (2007) explanation of the mistake is given, (3) Smith et al’s (2007) recommendations for avoiding that
mistake are stated, (4) the problem that the teams were modeling is explained (if it is the first time the problem has been
presented), (5) an excerpt of this type of mistake is presented in the Garamond font, (6) it is explained why the
particular example contains a mental mistake in the Times New Roman font, (7) a suggested rewrite is given in the
Arial font. The mistake excerpts have not been edited: they are direct quotes: however, they might have been
reformatted. The sections from Smith, et al. (2007) have been edited.
In the decision making literature there are hundreds of names for such mistakes, names such as attribute substitution,
dominated criteria, cognitive illusions, emotions, fallacies, simplifying heuristics, fear of regret, paradoxes, herding,
group think, psychological traps (Marquard & Robinson, 2008) and cognitive biases (Sage, 1981: Smith,
Piattelli-Palmarini & Bahill, 2008; Smith & Bahill, 2010). However, in this paper we will simply call them mental
mistakes.
The purpose of this paper is to explain and give examples of certain types of mental mistakes that humans often make
while doing tradeoff studies. Many of these mistakes are subtle and it is hard to avoid making them. However, it is
hoped that systems analysts who read this paper will be able to recognize these mistakes in tradeoff studies created by
others and to avoid these mistakes in their own tradeoff studies.
3. Examples of Mental Mistakes in Tradeoff Studies
This section shows examples of a dozen types of common mental mistakes that were made while doing tradeoff studies.
We believe these mistakes are continually being repeated by systems engineers worldwide. We hope that reading this
paper will help systems engineers to avoid such mental mistakes in the future.
3.1 Using Dependent Criteria
Evaluation criteria should be independent. In a tradeoff study, alternatives should be evaluated based on independent
evaluation criteria. However, analysts often choose dependent criteria. When scoring these criteria for the different
alternatives, having multiple dependent criteria can magnify or diminish the final scores of the alternatives, thus
recommending the wrong alternative. Here are some simple examples of evaluation criteria. For evaluating humans,
Height and Weight are not independent: Sex (male versus female) and Intelligence Quotient are independent. In
selecting a car, the following criteria are dependent: Maximum Horse Power, Peak Torque, Top Speed, Time for the
Standing Quarter Mile, Engine Size (in liters), Number of Cylinders and Time to Accelerate 0 to 60 mph (Smith et al.,
2007).
Recommendation: Dependent criteria should be grouped together as subcriteria. The seven subcriteria for the car given
in the previous paragraph could all be grouped into the criteria Power.

Studies in Engineering and Technology Vol. 1, No. 1; 2014
25
For each year, the class project was designed to be unprecedented, with no possible optimal solution, realistic, solved
by teams of three or four engineers who would have to analyze, synthesize and evaluate alternative designs. The
following example does not depend on the particular project: it could have occurred in any project.
Team Excerpt
The maximum current drawn by the system shall not exceed 15 amperes.
The system shall operate on 120 volt, 60 hertz electricity.
The system shall not consume more than 1.8 kilowatts.
Why is this a mental mistake?
If you know the voltage and the current, then you know the power; Power = Voltage x Current.
Suggested rewrite
The system shall operate on 120 volt, 60 hertz AC electricity.
The system shall draw a maximum of 15 amperes.
3.2 Not Stating the Problem in Terms of Stakeholder Needs
Committing to a class of preconceived solutions (instead of stating the true stakeholder needs) causes a lack of
flexibility. Identifying the true stakeholder needs can be difficult because stakeholders often refer to both problem
domains and solution domains – whichever comes most naturally. In systems engineering, the initial problem statement
must be written before looking for solutions (Wymore, 1993; Smith et al., 2007).
Recommendation: Communicate with and question the stakeholders in order to determine their values and needs. State
the problem in terms of customer requirements (Bahill & Dean, 1999, 2009; Hooks & Farry, 2001; Daniels & Bahill,
2004; Hull, Jackson & Dick, 2005). Later, after a better understanding of evaluation criteria and weights of importance
has been gained, one must find alternative solutions that provide a good match to the requirements.
The project for 2006 was the SpinCoach™. When a spinning object (like a baseball) is put in a moving fluid (like air),
it will experience a force that pushes it sideways (Bahill, Baldwin, & Venkateswaran, 2005; Baldwin, Bahill & Nathan,
2007; Bahill & Baldwin, 2008; Bahill, Baldwin & Ramberg, 2009.) Some highly successful baseball players have said
and written that they see this spin of the ball and use it to track the ball with saccadic and smooth pursuit eye
movements (Bahill & Stark, 1975; Bahill & Stark, 1977; Bahill & LaRitz, 1984). But at present, there is no system that
can teach high school and college baseball and softball players to predict this spin-induced deflection of the pitch.
Therefore, this project was to design and document the design of a system that would help train baseball and softball
players to pick up the spin on the ball and predict the spin's effect on the ball's deflection. The system would be capable
of displaying images of spinning balls, allowing the subject to predict the spin induced deflection and providing
feedback to facilitate learning. The key architectural decision in this project is whether to design the first version for
baseball or softball.
Team Excerpt
The batter believes he can predict the trajectory until the ball and bat connect and therefore swing accordingly.
Because of the deflection in the last milliseconds of the balls flight however, the batter is not able to adjust his swing
in time to compensate and therefore the likelihood for there to be a strike called is increased because of the batter
swing. In essence the pitcher is trying to fake out the batter and get him to swing at the ball or not swing at the ball
based on a seemingly predictable trajectory. It appears to the batters, however that the ball seems to change direction
in the last moments of its trajectory and is cause for batters to swing without connecting with the ball.
Why is this a mental mistake?
This problem statement does not mention the batter’s needs. It is certainly stating correct things about
what the batter and the pitcher are doing. But it fails to describe the batter’s needs in terms of the
system being designed. If they were designing a different system, then the excerpt might be useful.
But they were supposed to be designing a system to help the batter learn the spin-induced deflection
of the ball.
Suggested rewrite
Baseball and softball players need to learn how to recognize the spin of a pitched ball
and use that information to predict the spin-induced deflection of the ball.
Second Team Excerpt
A video game trainer could also be used, in which a batter tries to gauge the spin on a video ball and predict where it
would end up. This option could be implemented with a CD-ROM. The CD would go through the process of how to
see the spin based on video taken from a laboratory. Dr. Terry Bahill, a professor in the Systems and Industrial
Engineering (SIE) department at the University of Arizona, has set up a laboratory with equipment to simulate

Studies in Engineering and Technology Vol. 1, No. 1; 2014
26
pitches with different types of spins. This laboratory would be a valuable resource in designing experiments to train a
player to pick up the spin on a ball.
Why is this a mental mistake?
This problem statement does not mention the batter’s needs.
Suggested rewrite
The top-level system function is to teach batters to recognize the spin of a pitched
ball and then use this information to predict the spin-induced movement of the ball.
3.3 Vague Problem Statement
If a problem statement is vague, proposed solutions could vary greatly, and derive support for very different reasons
and in different ways. If a problem statement is poorly written or ambiguous, dissimilar alternative solutions could
remain in the solution pool, obfuscating their rational consideration, especially if the rationale for the different
psychologically attractive values of the alternative solutions are not well understood (Keeney, 1992). Failing to mention
customer needs makes the problem statement seem vague (Smith et al., 2007).
Recommendation: Stating the problem is the most important and possibly the most difficult aspect of a tradeoff study.
The problem should be stated in terms of the stakeholder’s needs. But be sure to state the problem so that it is
independent of preconceived solutions. State the problem so that it can be satisfied by a large number of alternative
solutions.
The project for 2007 was the PopupCoach™. Even professional baseball players occasionally find it difficult to
gracefully approach seemingly routine pop-ups. McBeath, Nathan, Bahill & Baldwin (2008) describe a set of towering
pop-ups with trajectories that exhibit cusps and loops near the apex. For a normal fly ball, the horizontal velocity is
continuously decreasing due to drag caused by air resistance. But for pop-ups, the Magnus force (the force due to the
ball spinning in a moving airflow) is larger than the drag force: therefore, the horizontal velocity decreases in the
beginning, like a normal fly ball, but after the apex, the Magnus force accelerates the horizontal motion (Bahill &
Baldwin, 2007). We refer to this class of pop-ups as paradoxical because they appear to misinform the typically robust
optical control strategies used by fielders and lead to systematic vacillation in running paths, especially when a
trajectory terminates near the fielder. In short, some of the dancing around when infielders pursue pop-ups can be
explained as a combination of bizarre trajectories and misguidance by the normally reliable optical control strategy,
rather than apparent fielder error. Former major league infielders confirm that our model agrees with their experiences.
But at present, there is no methodological system that can teach high school and college baseball and softball players
(more specifically catchers and infielders) to track pop-ups. Batting practice and ball games offer few opportunities for
a player to learn this skill. Our customer needs a system that will provide frequent convenient opportunities to learn to
field pop-ups. The goal of this project is to design and document the design of such a system.
Team Excerpt for the PopupCoach
The occurrence of pop-ups in major league games is an average of five times per game. This frequency provides
reason for effective practice to be devoted to train players in order to hone their ability to catch these routine
pop-ups.
Why is this a mental mistake?
This problem statement is vague.
Suggested rewrite
For baseball and softball fielders who need to catch pop-ups, the PopupCoach is a
training system that teaches fielders to track and catch pop-ups: unlike present
coaches and books, the PopupCoach explains the trajectory, offers convenient
practice opportunities and complements players’ improvement.
Team Excerpt for the SpinCoach
The differences in (baseball) spin result in visually detectable differences in the appearance of the spinning ball as it
approaches the batter. Currently, players practice the assessment of spin and trajectory prediction during actual game
play and team practice sessions. This process requires coordination between multiple players, and the use of a pitcher
capable of delivering a repeatable baseball pitch to the batter.
Why is this a mental mistake?
This problem statement is vague.
Suggested rewrite
For the baseball batter who needs to predict the trajectory of the pitch, the
SpinCoach is a training system that helps him to recognize the spin on the pitch and
predict the ball’s spin-induced movement; unlike present coaches and books, the
SpinCoach shows the batter how each pitch spins and helps him to recognize this
spin.

Studies in Engineering and Technology Vol. 1, No. 1; 2014
27
3.4 Substituting a Related Attribute
Attribute substitution occurs when a subject is assessing an attribute and substitutes a related attribute that comes
more readily to mind. In effect, people who are confronted with a difficult question sometimes answer an easier one
instead (Kahneman, 2003). In a similar vein, when confronted with a choice among alternatives that should properly be
decided by a full tradeoff study, there is a strong tendency to substitute a seemingly equivalent yet much simpler
decision question in place of the tradeoff study process (Smith et al., 2007).
Recommendation: Sponsors of tradeoff studies should realize that a premature reduction of a tradeoff study process to
a simpler decision question is a common heuristic that prevents consideration of the original multi-objective decision.
Team Excerpt for the SpinCoach
Use Case 2.
Name: Learn Spin-induced Deflections
Iteration: 2.3
Derived from: Concept of operations
Brief description: Player uses the SpinCoach and learns to predict the spin-induced deflection of a ball.
Added value: Player will be better able to predict the trajectory of the ball and consequently should have a higher
batting average.
Second Team Excerpt for the SpinCoach
5.2.1.2 Effectiveness
The measurement of effectiveness determines the percent increase on the user’s batting average over time.
The purpose of the SpinCoach is to teach batters to predict the spin-induced deflection of the baseball, but as a
measure of success, these teams proposed to record the player’s batting average.
Why is this a mental mistake?
What we really want to know is “Does training with the SpinCoach teach batters to predict the
spin-induced deflection of the baseball?” But this is too hard to measure; therefore, our engineers
substituted the player’s batting average as a measure of success.
Suggested rewrite
We want to teach baseball batters to predict the spin-induced deflection of the
baseball. Therefore, we want to know how well they predict the spin-induced
deflection, but that is hard to measure, therefore we substitute the player’s batting
average as a measure of success.
In this particular design what we really want to know is “Does training with the SpinCoach teach batters to predict the
spin-induced deflection of the baseball?” But this is too hard to measure; therefore, we substitute the player’s batting
average as a measure of success. But we do tell our readers that we are doing this.
After he received the Nobel Prize for developing Prospect Theory (RSAS, 2002; Kahneman, 2002), Kahneman spent
most of his time trying to unify mental mistakes. He suggested that many or most could be explained by attribute
substitution. This is a very difficult mistake to avoid. People do it all the time. The point of this section is that analysts
should understand what attribute substitution is and avoid making it as a mistake. However, if the analyst really wants
to use a substitute attribute, then he or she should go ahead and use it. But be sure to tell that reader that he or she is
using attribute substitution.
Team Excerpt for the PopupCoach
The ability of a defending baseball team to catch pop-up balls can provide a key advantage needed to win a baseball
game. That pop-ups occurs in major league games an average of five times underscores the need for players to
improve their ability to catch them. Pop-ups are difficult to catch because their trajectories are irregular and it is not
readily predictable where players should stand and catch them. There is no existing training system to improve
players’ catching percentage.
Second Team Excerpt for the PopupCoach
Thus, the need for a system to teach fielders about and offer practice scenarios involving trajectory and spin is
necessary if it can help increase fielding percentages and improve the win percentages for players and teams.
Why is this a mental mistake?
What we really want to know is “Does training with the PopupCoach teach fielders to use the optimal
running path and running speed while fielding fly balls. But this is too hard to measure; therefore, our
engineers substituted the player’s catching percentage and fielding percentages.
Suggested rewrite for the PopupCoach

Studies in Engineering and Technology Vol. 1, No. 1; 2014
28
For each pop-up, we will compute the player’s optimal running path and then
compare it to the player’s actual running path. We will also compute the optimal
running speed at the time of the catch and compare this to the player’s actual running
speed. These two metrics will be combined to indicate how well the fielder tracked
the pop-up.
Attribute substitution is a tricky mistake, because everyone does it. In this design what we really want to know is “Does
training with the PopupCoach teach fielders to use the Optical Acceleration Cancellation algorithm (McBeath, Nathan,
Bahill, & Baldwin, 2008) to catch Pop-ups?” But we cannot use as a metric the probability of catching a pop-up,
because 9 of our 12 alternative designs do not use real pop-ups. For these 9 designs we think it would be too expensive
(if not impossible) to gather enough data for every player to make valid inferences. Furthermore we have no method of
measuring the spin of pop-us. Therefore, we think variability in the speed and spin rate of real pop-ups would obscure
any evidence that the fielder used the Optical Acceleration Cancellation algorithm to catch pop-ups. Because we could
not measure the desired attribute, we substituted a simpler attribute, the running speed and path. Attribute substitution is
not always a mistake: often it is deliberate and stated.
3.5 Sensitivity Analysis Mistakes
Most people are not well trained in the machinery and methods of sensitivity analysis. They often fail to compute
second- and higher-order partial derivatives. When estimating partial derivatives, they often use too large a step size.
When estimating partial derivatives of functions of two parameters, they often use the wrong formula; they use a
formula with two instead of four numerator terms. Smith, Szidarovszky, Karnavas and Bahill (2008) has shown that
interactions among parameters in tradeoff studies can be important, step sizes for the approximation of effects should be
small, and second-order derivatives should be calculated accurately. It is expected that only the best-trained personnel
will know of such results, illustrating the gap between truth and training (Smith et al., 2007).
Recommendation: Investments in sensitivity analysis training must be made. Perhaps enabling software can substitute
for much sensitivity analysis knowledge. (Hsu, Bahill & Stark, (1976); Karnavas, Sanchez & Bahill, (1993); Smith,
Szidarovszky, Karnavas & Bahill, (2008) describe the development and use of sensitivity analyses.
First Team Excerpt
Since the training methods are independent of any resources and a tradeoff analysis was not required, no sensitivity
analysis will be done for it.
Second Team Excerpt
The I/O performance weights more than the utilization of resources in the trade-off analysis. TW1P0 and TW2P0
values will be switched to determine the sensitivity of the design concepts to weighting and the results are shown
below:
Third Team Excerpt
The current trade study has an emphasis placed on the performance requirements of the SlugMaster to determine
the sensitivity of results to the weighting of the requirements, a plot was constructed as a function of the two
weights: I/O Performance and utilization of resources.
Why is this a mental mistake?
These Teams considered at most one parameter, the relative tradeoff weight between performance and
cost.
Suggested rewrite, derived from Smith, Szidarovszky, Karnavas & Bahill, (2008).
Concept
Weights are Weights are
0.70/0.30 0.30/0.70
Score Score
1 0.3811 0.7347
2 0.5172 0.3665
3 0.5191 0.3061
4 0.568 0.3416
5 0.563 0.3249
6 0.6275 0.3362
7 0.5739 0.3132

Studies in Engineering and Technology Vol. 1, No. 1; 2014
29
Table 1. A Generic Tradeoff Study
Criteria Weights of
Importance Alternative 1 Alternative 2
Criterion-1 Wt1 S11 S12
Criterion-2 Wt2 S21 S22
Alternative
Rating
1
1 11
2 21
Sum
Wt S
Wt S
2
1 12
2 22
Sum
Wt S
Wt S
Table 2 gives numerical values for one particular tradeoff study, The Umpire’s
Assistant (http://www.sie.arizona.edu/sysengr/sie577/UmpiresAssistant.doc).
Table 2. Tradeoff Study Numerical Example
Alternatives
Criteria Weights of
Importance
Umpire’s
Assistant
Seeing
Eye
Dog
Accuracy
of the call 0.75 0.67 0.33
Silence of
Signaling 0.25 0.83 0.17
Sum of
weight
times
score
0.71
The
winner
0.29
Definition of the semirelative sensitivity function:
0
NOP
F FS
%
These are the semirelative sensitivity functions for Tables 1 and 2.
1
1
1
2
1
11
1
21
1
12
1
22
11 12 1
21 22 2
1 11
2 21
1 12
2 22
0.26
0.16
0.50
0.21
-0.25
-0.04
PI
Wt
PI
Wt
PI
S
PI
S
PI
S
PI
S
S S S Wt
S S S Wt
S Wt S
S Wt S
S Wt S
S Wt S
%
%
%
%
%
%
These functions show that the most important parameter is the score for alternative-1
on criteria-1. Sensitivity analyses need mathematical detail. Failure to do the
mathematics right produces erroneous results. Smith, Szidarovszky, Karnavas and
Bahill, (2008) present the correct mathematical equations.
For more comments about sensitivity analyses, see these online documents:
http://www.sie.arizona.edu/sysengr/sie554/SpinCoach/JA2/index.html
http://www.sie.arizona.edu/sysengr/sie554/PopUpCoach/index.html

Studies in Engineering and Technology Vol. 1, No. 1; 2014
30
3.6 Forer Effect
According to the Forer Effect, previously existing criteria will be adopted if (1) the analyst believes that the criteria
apply to the present problem, (2) the criteria are well presented and (3) the analyst believes in the authority of the
previous criteria writer. For example, the analyst might fail to question or re-write criteria from a legacy tradeoff study
that originated from a perceived authority and is now seemingly adaptable to the tradeoff at hand. This is called the
Forer effect. Forer (1949) gave a personality test to his students. He then asked them to evaluate his personality analyses
of them, supposedly based on their test's results. Students rated their analyses on a scale of 0 (very poor) to 5 (excellent)
as to how well it applied to them. The average score was 4.26. Actually, Forer had given the same analysis to all the
students. He had assembled this analysis of a generally likeable person from horoscopes. Variables that contribute to
this fallacy in judgment are that the subject believes the analysis only applies to them, the subject believes in the
authority of the evaluator, and the analysis contains mainly positive traits (Smith et al., 2007).
Recommendation: Spend time considering and formulating criteria from scratch, before consulting and possibly
reusing previously written criteria.
The textbook for the course (Chapman, Bahill & Wymore, 1992) had a primitive sensitivity analysis that only
considered one parameter, the tradeoff weight between cost and performance. In Section 5.5.4 it states, “The system is
sensitive to tradeoff weightings. For example changing the weights of the Trade-Off Requirement can easily sway the
answer. The current trade-off puts heavy emphasis on the I/O performance of the system (0.90) and not on the
utilization of resources (0.10). Changing the degree of emphasis can change the results…” In the course, we had a
lecture and a homework that described how to take partial derivatives and form the semirelative sensitivity functions for
each parameter in the tradeoff study (Smith, Szidarovszky, Karnavas & Bahill, 2008). However, the students repeatedly
copied the method of conducting a sensitivity analysis from a legacy tradeoff study published in the course textbook.
Despite warnings about the inadequacy of that sensitivity analysis, the students conducted their analyses in that very
same way. This was an example of the Forer effect (Forer, 1949) Students failed to question a sensitivity analysis that
was presented by a perceived authority and was seemingly adaptable to their own tradeoff study.
Team Excerpt
Figure 1. Team summary of a sensitivity analysis. It shows how the overall tradeoff scores vary for a dozen
alternatives as the cost becomes less important and the performance becomes more important.
cost performance 1wt wt
Why is this a mental mistake?

Studies in Engineering and Technology Vol. 1, No. 1; 2014
31
The only parameter being varied here is the relative weight of performance versus cost. In this figure,
the team just put their new data into a figure from their textbook (Chapman, Bahill & Wymore, 1992).
They ignored all sensitivity analyses that we developed later. Students failed to question a sensitivity
analysis that was presented by a perceived authority and was seemingly adaptable to their own
tradeoff study.
3.7 Weight of Importance Mistakes
When a group of people is asked to assign a weight of importance for an evaluation criterion, each person might
produce a different value. Different weights arise not only from different preferences, but also from irrational severity
amplifiers (Bahill & Karnavas, 2000; Bahill & Smith, 2009). These include the factors of lack of control, lack of choice,
lack of trust, lack of warning, lack of understanding, manmade, newness, dreadfulness, personalization, recallability and
immediacy. Excessive disparities occur when a person assesses a weight of importance after framing the problem
differently. An evaluation may depend on how the criterion affects that person, how well that person understands the
alternative technologies, the dreadfulness of the results, etc. As a result, each person might assign a different weight of
importance to any criterion. The decision analyst should assign weights to the criteria so that the more important ones
will have more effect on the outcome. Weights are often given as numbers between 0 and 10, but are usually
normalized so that in each category they sum to 1.0. These methods can be used by individuals or teams. If pair-wise
comparisons of preferences between the criteria can be elicited from experts, then the weights of importance can be
determined through the Analytic Hierarchy Process (AHP). However, performing pair-wise comparisons can lead to
intransitive preferences: Therefore, the AHP computes an inconsistency index to warn if the domain expert is giving
intransitive responses (Smith et al., 2007).
Recommendation: Interpersonal variability can be reduced with education, peer review of the assigned weights, and
group discussions. But be aware that people are like lemmings: if you reveal how other people are voting, then they are
likely to respond with the most popular answers. It is also important to keep a broad view of the whole organization, so
that criteria in one area are considered in light of all other areas. A sensitivity analysis can show how important each
weight is. For unimportant weights, move on. For important weights, spend more time and money trying to get
consensus: this might include showing the recommended alternatives for several different sets of weights.
The project for 2005 was the Umpire’s Assistant. For the baseball umpire who needs to call balls and strikes, the
Umpire’s Assistant is an intelligent decision aiding system that helps him or her to call balls and strikes accurately,
consistently and in real-time. Unlike unassisted human umpires, the Umpire’s Assistant uses the same strike-zone
standards for all leagues, parks, umpires, batters and pitchers.
Table 3. Umpire’s Assistant Team Excerpt
Utilization of Resources Figures
of Merit Requirements
Weight
Value
Normalized
weight
1. Available Money 2 0.02326
2. Available Time 2 0.02326
2.1 System design &
prototyping by 12/31/05
2 0.02326
2.2 System verification testing
by 2/06
2 0.02326
3. Technological Restrictions 10 0.11628
3.1 to not significantly alter
the dynamics of baseball
9 0.10465
3.2 to comply with local,
regional, state, federal laws
10 0.11628
3.3 to comply with FCC rules 10 0.11628
4. Adaptability 8 0.09302
4.1 to comply with Standards
& Specifications of MLB
8 0.09302
4.2 to comply with Standards
& Specifications of NCAA
8 0.09302
Why is this a mental mistake?
The normalized weights add up to 0.826. They should add up to 1.0 in each category and each
subcategory.
Table 4. Suggested rewrite for the Umpire’s Assistant

Studies in Engineering and Technology Vol. 1, No. 1; 2014
32
Utilization of Resources Evaluation Criteria
We
ights
of
Import
ance
Crite
ria
Norm
aliz
ed
We
ights
Subcrite
ria
Norm
aliz
ed
We
ights
1. Available Money 2 0.09
2. Available Time 2 0.09
2.1 System design & prototyping by
12/31/05
2 0.5
2.2 System verification testing by 2/14/06 2 0.5
3. Technological Restrictions 10 0.45
3.1 to not significantly alter baseball
dynamics
9 0.31
3.2 to comply with local, state & federal laws 10 0.35
3.3 to comply with FCC rules 10 0.35
4. Adaptability 8 0.36
4.1 to comply with MLB rules 8 0.5
4.2 to comply with NCAA rules 8 0.5
Of course, there would be a paragraph explaining each of these short evaluation
criteria tags. The abbreviations would be explained in these paragraphs.
3.8 Anchoring and the Status Quo
The order in which the alternatives are listed has a big effect on the values that humans give for the evaluation data
(Piattelli-Palmarini, 1994; Tversky & Shafir, 1992). Therefore, tradeoff study matrix should be filled out row by row
and the status quo should be the alternative in the first column. This will make the evaluation data for the status quo the
anchors for estimating the evaluation data for the other alternatives. This is good because the anchoring alternative is
known, is consistent, and you have control over it (Smith et al., 2007).
Note: The status quo will probably have low evaluation data values (inputs for scoring functions) for performance, cost,
schedule and risk. If the status quo had high performance values, then you probably would not be trying to replace it.
The status quo already exists, so (1) it will not be expensive, which gives it a low (good) value for cost, (2) it should not
have schedule problems, which gives it a low (good) value for schedule and (3) it should also be low risk.
Recommendation: Put the status quo alternative in the first column. In the first iteration, evaluate the scores left to
right and in the next iteration evaluate them right to left. The more alternatives that exist and the more complicated the
decision, the more the status quo will be favored. Do not needlessly increase the number of alternatives in a tradeoff
study. More alternatives increase the difficulty of the decision. However, in the very beginning of a project it is good to
have many alternatives in order to better understand the problem and the requirements. View the problem from different
perspectives. Use different starting points. When estimating values for parameters of scoring functions, think about the
whole range of expected values for the parameters.
Table 5. Team Excerpt for ranking process alternatives
Criterion 1 2 3 4 5 6 7 Max
Score
Metric
Value 1.8 0.7 2.3 1.5 0.7 1 2 100
Raw Wtd Raw Wtd Raw Wtd Raw Wtd Raw Wtd Raw Wtd Raw Wtd Solution
Alternative Scr Scr Scr Scr Scr Scr Scr Scr Scr Scr Scr Scr Scr Scr Score
Solution 1 2 7.2 10 6.3 9 14 3 9 3 2.1 8 2 2 4 41.8
Solution 2 9 3.6 7 7 9 21 9 4.5 2 1.4 2 8 10 20 76.6
Solution 3 3 16 2 4.9 4 9.2 8 14 3 2.1 8 9 1 2 67.3
Solution 4 9 5.4 10 1.4 5 12 9 12 9 6.3 9 8 10 20 76.6
Solution 5 3 16 3 7 5 12 8 14 8 5.6 7 9 2 4 67.3
Solution 6 9 16 3 2.1 5 12 9 11 9 6.3 5 7 10 20 76.6
Solution 7 3 5.4 8 5.6 9 21 7 11 3 2.1 5 5 9 18 67.3
Studies in Engineering and Technology Vol. 1, No. 1; 2014
33
Do
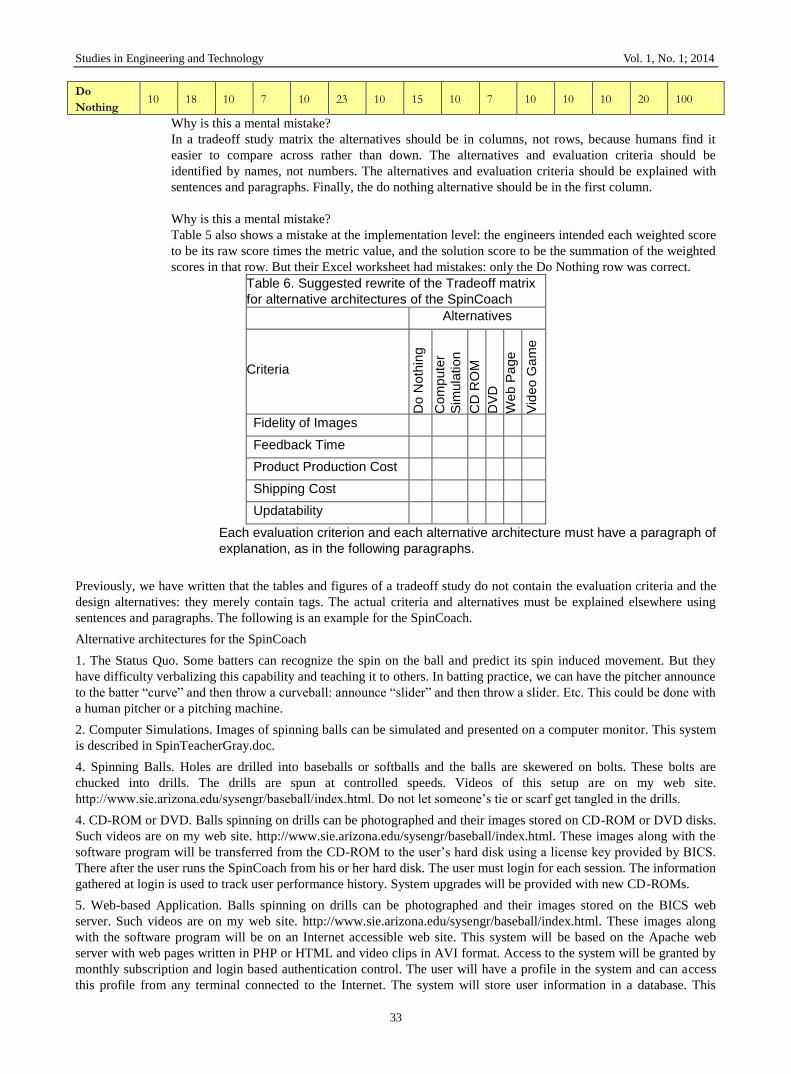
Nothing 10 18 10 7 10 23 10 15 10 7 10 10 10 20 100
Why is this a mental mistake?
In a tradeoff study matrix the alternatives should be in columns, not rows, because humans find it
easier to compare across rather than down. The alternatives and evaluation criteria should be
identified by names, not numbers. The alternatives and evaluation criteria should be explained with
sentences and paragraphs. Finally, the do nothing alternative should be in the first column.
Why is this a mental mistake?
Table 5 also shows a mistake at the implementation level: the engineers intended each weighted score
to be its raw score times the metric value, and the solution score to be the summation of the weighted
scores in that row. But their Excel worksheet had mistakes: only the Do Nothing row was correct.
Table 6. Suggested rewrite of the Tradeoff matrix
for alternative architectures of the SpinCoach
Alternatives
Criteria
Do N
oth
ing
Com
pute
r
Sim
ula
tion
CD
RO
M
DV
D
Web
Pa
ge
Vid
eo G
am
e
Fidelity of Images
Feedback Time
Product Production Cost
Shipping Cost
Updatability
Each evaluation criterion and each alternative architecture must have a paragraph of
explanation, as in the following paragraphs.
Previously, we have written that the tables and figures of a tradeoff study do not contain the evaluation criteria and the
design alternatives: they merely contain tags. The actual criteria and alternatives must be explained elsewhere using
sentences and paragraphs. The following is an example for the SpinCoach.
Alternative architectures for the SpinCoach
1. The Status Quo. Some batters can recognize the spin on the ball and predict its spin induced movement. But they
have difficulty verbalizing this capability and teaching it to others. In batting practice, we can have the pitcher announce
to the batter “curve” and then throw a curveball: announce “slider” and then throw a slider. Etc. This could be done with
a human pitcher or a pitching machine.
2. Computer Simulations. Images of spinning balls can be simulated and presented on a computer monitor. This system
is described in SpinTeacherGray.doc.
4. Spinning Balls. Holes are drilled into baseballs or softballs and the balls are skewered on bolts. These bolts are
chucked into drills. The drills are spun at controlled speeds. Videos of this setup are on my web site.
http://www.sie.arizona.edu/sysengr/baseball/index.html. Do not let someone’s tie or scarf get tangled in the drills.
4. CD-ROM or DVD. Balls spinning on drills can be photographed and their images stored on CD-ROM or DVD disks.
Such videos are on my web site. http://www.sie.arizona.edu/sysengr/baseball/index.html. These images along with the
software program will be transferred from the CD-ROM to the user’s hard disk using a license key provided by BICS.
There after the user runs the SpinCoach from his or her hard disk. The user must login for each session. The information
gathered at login is used to track user performance history. System upgrades will be provided with new CD-ROMs.
5. Web-based Application. Balls spinning on drills can be photographed and their images stored on the BICS web
server. Such videos are on my web site. http://www.sie.arizona.edu/sysengr/baseball/index.html. These images along
with the software program will be on an Internet accessible web site. This system will be based on the Apache web
server with web pages written in PHP or HTML and video clips in AVI format. Access to the system will be granted by
monthly subscription and login based authentication control. The user will have a profile in the system and can access
this profile from any terminal connected to the Internet. The system will store user information in a database. This

Studies in Engineering and Technology Vol. 1, No. 1; 2014
34
information is used to track user performance history. System upgrades can be made on the web site at any time and
will be transparent to the user.
6. Make it into a video game and sell it to Nintendo, Sony or Microsoft.
Evaluation criteria for the SpinCoach
Fidelity of Images. How realistic are the images? Are they two or three-dimensional? What is the resolution? What is
the color depth? What is the update rate? Will the presentation vary depending on the processor speed or the
communications bandwidth? For example, would the system degrade with a dialup telephone connection to the
Internet? This criterion traces to the Operational Concept Description (OCD). Importance weight is 6.
Feedback Promptness. The system shall provide positive or negative feedback to the player after each prediction. The
system shall provide this feedback to the player within 500 milliseconds of the player's response. This will be a Boolean
(yes or no) function. This traces to customer requirement 10. Importance weight is 10.
Product Production Cost is a measure of how much it will cost in U. S. dollars for BICS to produce one unit of the
product. A monotonic decreasing scoring function shall be used (L=0, B=10, S=-0.1, U=500). Input range is 0 to 500
dollars, baseline is 10 dollars and slope is -0.1. This traces to customer requirement 1. Importance weight is 6.
Figure 2. A scoring function for the Product Production Cost evaluation criteria
The Shipping Cost evaluation criterion is composed of Shipping Weight, Shipping Expenses, Shipping Effort and
Billing Cost per unit. A scoring function is not necessary if the subcriteria have scoring functions and normalized
weights. Our target value is ten dollars. This traces to customer requirement 1. Importance weight is 5.
Updatability. This criterion evaluates how easy and convenient updates are expected to be. The system shall be
continually improved and updated throughout the system life cycle. Corrective maintenance such as bug fixes should be
performed within weeks. Adaptive maintenance, which includes revisions necessary to allow the system to run on new
or improved hardware and software, should be accomplished in a monthly time frame. Performance and functional
updates will be performed yearly. This should trace to the business plan. Importance weight is 5.
3.9 Treating Gains and Losses Equally
People do not treat gains and losses equally. Kahneman earned the Nobel Prize for explaining the fact that people
prefer to avoid losses rather than to acquire gains. Prospect Theory (Kahneman & Tversky, 1979) suggests that
psychologically losses are twice as powerful as gains. Would you rather get a 5% discount, or avoid a 5% penalty?
Most people would rather avoid the penalty. In a tradeoff study, you will get a different result if the scoring function
expresses losses rather than gains (Abdellaaoui, 2000) (Smith et al., 2007).
Recommendation: Human unequal treatment of gains and losses suggests that scoring functions in a tradeoff study
should uniformly express either gains or losses. Principles of linguistic comprehensibility suggest that criteria should be
worded in a positive manner, so that more is better. For example, use Uptime rather than Downtime, Mean Time
Between Failures rather than Failure Rate, and Probability of Success rather than Probability of Failure. Finally, when
using scoring functions, make sure that more output is better.
Team Excerpt
2.2 Number of Complaints
2.3 Number of Problems with the System
3.1 Number of Accidents per visit.
2.5.3. Number of Curses per day
5.2.6. Injury -- Is it possible for the design to inflict bodily injury on the batter? This rated by the players on a scale of
1 – 10 (1 being no bodily harm, 10 being serious injury requiring hospitalization).
Why is this a mental mistake?
These criteria are phrased negatively.
Suggested rewrite
Studies in Engineering and Technology Vol. 1, No. 1; 2014
35
2.2 Customer Approval Rating (%)
2.3 Mean Time to Failure (MTTF)
3.1 Number of accident-free visits
2.5.3 Time without cursing
5.2.6. Safety – Mean time between injuries.
Second Team Excerpt
3.5.2.6 Availability of system
This figure of merit measures the availability of the system, in terms of the number of hours per year for which the
system is unavailable during working hours due to failure or unscheduled maintenance.
3.5.2.7 Safety of system
This figure of merit measures the safety of the system in terms of injuries caused by the system.
Why is this a mental mistake?
Evaluation criteria should be phrased so that more is better. Availability of System and Safety of
System contradict themselves. The titles are phrased positively, but the descriptions contain the
negative words unavailable and injuries.
Suggested rewrite
3.5.2.6 System Availability
This criterion is the percent of time that the system is available during working hours,
average per week.
3.5.2.7 System Safety
The units for this criterion are the number of days that the system has operated
without an injury.
3.10 Not Using Scoring Functions
Evaluation data are transformed into normalized scores by scoring functions (utility curves) or qualitative scales (fuzzy
sets). The shape of scoring functions should ideally be determined objectively, but often, subjective expert opinion is
involved in their preparation. Creating scoring function packages takes time and effort (Bahill, 2008). A scoring
function package should be created by a team of analysts, and be reevaluated with the stakeholders with each use. Most
tradeoff studies that we have observed in industry did not use scoring functions. In some cases, scoring functions were
explained in the company process, but they were not convenient, hence they were not used (Smith et al., 2007).
Recommendation: Wymorian standard scoring functions (or similar scoring functions, fuzzy sets or utility functions)
should be used in tradeoff studies. Easy-to-use scoring functions should be referenced in company processes.
Team excerpt:
Many teams just did not use scoring functions.
Evaluation data are transformed into normalized scores by scoring functions (Wymore, 1993, pp. 385-398; Daniels,
Werner & Bahill, 2001). The shape of scoring functions should ideally be determined objectively, but often, subjective
expert opinion is involved in their preparation. Scoring functions are also called utility functions, utility curves, value
functions, normalization functions and mappings. Evaluation criteria should always have scoring functions so that the
preferred alternatives do not depend on the units used. For example, see what would happen if you were to add values
for something that cost about one hundred dollars and lasted about a millisecond.
Alt-1 cost a hundred dollars and lasts one millisecond, Sum = 100.001.
Alt-2 only cost ninety-nine dollars but it lasts two millisecond, Sum = 99.002.
The duration does not have any effect on the decision. A simple program that creates scoring functions is available free
at http://www.sie.arizona.edu/sysengr/slides. It is called the Wymorian Scoring Function tool. An example of a scoring
function was given in Figure 2 for the Product Production Cost.
Scoring functions must state the units for the input: for example, actual dollar values will be used as input to a cost
scoring function. Without scoring functions, the preferred alternative would depend on the units used, for example,
whether the costs were given in U. S. Dollars or British pounds. With scoring functions, this will not happen.
3.11 Implying False Precision
The most common mistake that we have seen in tradeoff studies is implying false precision. For example, a tradeoff
analyst might ask a subject matter expert to estimate values for two criteria. The expert might say something like, “The
first criterion is about 2 and the second is around 3.” The analyst puts these numbers into a calculator and computes the
ratio as 0.666666667. This is nonsense, but nine digits might be used throughout the tradeoff study. The Forer Effect
might explain this. The analyst believes that the calculator is an impeccable authority in calculating numbers. Therefore,
what the calculator says must be true (Smith et al., 2007).

Studies in Engineering and Technology Vol. 1, No. 1; 2014
36
Recommendation: Use significant figures methodology. Furthermore, in numerical tables, print only a sufficient
number of digits after the decimal place as is necessary to show a difference between the preferred alternatives.
Team Excerpt
5.3.1.1 Trade-off scores
Concept 1: Customer chooses the bat 0.6 * 0.22500 + 0.4 * 0.41435 = 0.30074
Concept 2: Store owner chooses the bat 0.6 * 0.25125 + 0.4 * 0.41435 = 0.31649
Concept 3: BatChooser chooses the bat 0.6 * 0.67500 + 0.4 * 0.96840 = 0.79236
Concept 4: BatSelect Chooses with the help of the BatChooser 0.6 * 0.84280 + 0.4 * 0.96840 = 0.89304
Presenting five digits after the decimal point obfuscates the equations and does not help to
differentiate between the alternatives.
Suggested rewrite
5.3.1.1 Trade-off scores
Concept 1: Customer chooses the bat 0.6 * 0.23 + 0.4 * 0.41 = 0.30
Concept 2: Storeowner chooses the bat 0.6 * 0.25 + 0.4 * 0.41 = 0.32
Concept 3: BatChooser chooses the bat 0.6 * 0.68 + 0.4 * 0.97 = 0.79
Concept 4: BatSelect chooses the bat with the help of the BatChooser
0.6 * 0.84 + 0.4 * 0.97 = 0.89
Table 7. Second Team Excerpt for Bat
Chooser
Concept Weighted
Score Ranking
Concept 1 Score 0.4414 7
Concept 2 Score 0.5420 4
Concept 3 Score 0.2196 8
Concept 4 Score 0.6728 2
Concept 5 Score 0.6558 3
Concept 6 Score 0.4652 6
Concept 7 Score 0.6802 1
Concept 8 Score 0.4860 5
Table 8. Suggested rewrite for the Bat Chooser
Alternative Weighted
Score Ranking
Concept 1 0.44 7
Concept 2 0.54 4
Concept 3 0.21 8
Concept 4 0.67 2
Concept 5 0.65 3
Concept 6 0.46 6
Concept 7 0.68 1
Concept 8 0.48 5
Table 9. Team Excerpt for the SpinCoach
Performance
Requirements Value
Normalized
weight

Studies in Engineering and Technology Vol. 1, No. 1; 2014
37
1. Accuracy 8 0.235294
1.1 Spin Rate 10 0.384615
1.2 Launch Angle 8 0.307692
1.3 Launch Speed 8 0.307692
2. Consistency 7 0.205882
3. Ease of Use 6 0.176471
3.1 Portability 6 0.260870
3.2 Location 7 0.304348
3.3 # of Operators 10 0.434783
4. Opportunity 8 0.235294
5. Feedback 5 0.147059
Why is this a mental mistake?
The original Value data have one significant digit. Therefore, the normalized weights certainly should
not have six digits after the decimal point.
Table 10. Suggested rewrite for the SpinCoach
Evaluation Criteria
We
ights
of
Import
ance
Crite
ria
Norm
aliz
ed
We
ights
*
Subcrite
ria
Norm
aliz
ed
We
ights
*
1. Accuracy 8 0.24
1.1 Spin Rate 10 0.38
1.2 Launch Angle 8 0.31
1.3 Launch Speed 8 0.31
2. Consistency 7 0.21
3. Ease of Use 6 0.18
3.1 Portability 6 0.26
3.2 Location 7 0.30
3.3 Number of
Operators
10 0.43
4. Opportunities per Hour 8 0.24
5. Feedback Response Time 5 0.15
*Significant figures methodology suggests that the
normalized weights should only have one significant
digit. But here we have used two to make the
calculations obvious.
Table 10 has also put the criteria and subcriteria weights in separate columns. All of
the subcriteria weights for a particular criteria sum to 1.0. All of the criteria weights
sum to 1.0.
On the other hand, Table 5 shows an example not of false precision, but of inconsistent precision. In some columns,
Excel is set to display integers while in others it is set to one decimal place.
When determining how many digits should be printed consider (1) how many digits are necessary to differentiate
between the preferred alternatives, (2) the sensitivity of the final recommendations to the parameters, the most sensitive
parameters should be given extra resources and therefore perhaps more significant digits (Karnavas, Sanchez & Bahill,
1993; Smith, Szidarovszky, Karnavas & Bahill, 2008) and (3) no parameters need to be more exact than the least
accurate parameter (presuming of course that the tradeoff matrix is as described in this paper and it does not have a
multi-step process for estimating any parameters).
As an example, when humans state preferences between risky prospects, their judgments are not linear in probability.
Humans overweight small probabilities and underweight high probabilities. This has been modeled with several
different equations (Abdellaoui, 2000; Bleichrodt & Pinto, 2000).

Studies in Engineering and Technology Vol. 1, No. 1; 2014
38
1( )
(1 )
pw p
p p
( )(1 )
pw p
p p
and
( ) exp( ( ln ) )w p p .
In these equations w is the probability weighting function, p is the probability of a particular prospect, , , and are parameters fit to experimental data of individual humans. Now the question becomes, Should a tradeoff analyst use
equations like these when eliciting information for a tradeoff study? The answer depends on the accuracy of the other
parameters. In all of the design documents that we examined, the weights of importance had only one significant digit.
Therefore correcting for each human’s incorrect estimation and use of probabilities is not warranted. In a tradeoff study,
the number of significant figures should be determined for each parameter. Then resources should not be committed to
increasing the number of significant figures for any except the most important and the least precise parameters.
3.12 Obviating Expert Opinion
An analyst could hold a circular belief that expert opinion or review is not necessary, because no evidence for the need
of expert opinion is present. This is especially true if no expert has ever been asked to comment on the tradeoff study
(Smith et al., 2007).
Recommendation: Experts should be sought, formally or informally, to evaluate the results of tradeoff studies.
The most common mistake that we have found in design projects over the last 35 years is failing to talk with
stakeholders and failing to consult experts and experienced advisors. The university and local industry is full of experts
in the fields of every project that we have done. In this time, very few teams have sought advice from domain experts.
Why do people fail to seek out the advice of experts and experienced advisors? The students rated the following
possible reasons. In each category, the reasons are arranged from the most frequent to the least.
It was common for our teams to not seek outside advice or guidance in the course of performing their tradeoff studies. If
they had sought this guidance, expert review or opinion, they might have avoided the errors we detected in their tradeoff
studies. This would most likely be the case if the guidance concerned the tradeoff study itself (not just the technical
matters) and elicited high-quality examination of all tradeoff study components.
Table 11. Possible reasons for failing to talk with stakeholders, experts and advisors.
Timidity
Perhaps they do not want to inconvenience the wise men or waste their time. However, people are not reluctant
to seek the advice of physicians, tax accountants and lawyers. To overcome timidity, before you talk to an
expert, you should formulate your questions and explain your problem in a way that the expert can quickly
understand. Tailoring a message and formulating the right questions is hard and must be done iteratively.
Before you leave your meeting, you should state what you think the expert said, to make sure that you
understood and to prevent having to go back later for clarification.
Perhaps they are shy or intimidated by experts.
Perhaps they fear that the incompleteness of their project will be interpreted as incompetence.
Perhaps they think that a face-to-face meeting would display their naïveté. This is not a problem with e-mails,
because most people do not expect e-mails to be thoughtful, coherent and grammatically correct: most
students do not edit their e-mails or use a spelling and grammar checker on them.
Perhaps they think that seeking advice reveals their ignorance, and that ignorance is shameful.
Perhaps they think that consulting experts shows weakness, whereas going it alone shows strength.
Perhaps they feel that, because they do not have a charge number, they cannot ask experts in their company for
advice.
Perceived Value

Studies in Engineering and Technology Vol. 1, No. 1; 2014
39
Perhaps they do not realize the usefulness of face-to-face meetings with experts.
Perhaps it is a matter of return on investment. Consulting experts takes time and effort. Perhaps these teams
thought the improvement in their tradeoff studies would not be worth the effort of consulting experts.
Perhaps the smart people thought, “We can get an A without wasting our time talking to our advisor.”
Perhaps the new technology generation thinks that they can just Google the web and get all the information that
experts might provide.
Perhaps they noticed that other courses at the university do not provide world-class experts to meet with them, so
it must not be important.
Perhaps they do not see a direct correlation between their grade and meetings with their advisor.
Perhaps they do not perceive added value.
Time (obviously time and perceived value will be traded off)
Perhaps they thought that they were too busy; meeting with their advisor would take time and effort; it would be
hard to schedule meetings with their advisor. Maybe they were just lazy.
Communication
Perhaps they have had no experience initiating a meaningful conversation with a stranger and are therefore
reluctant to do so.
Most of our students communicate with cell phones, twitter, the internet or e-mail. So they are multitaskers,
jumping from task to task. Therefore, they are good at multitasking, but their attention spans are perhaps
short. So they do not know how to talk face-to-face with an expert.
Other
Perhaps they have been taught that engineers work alone: after all, cooperating on exams is frowned upon.
However, in the modern industrial environment, engineering is done by teams and when success is
important consultants are also hired.
Perhaps they are reluctant to change or they don’t want to do it someone else’s way. If you ask for advice, then
you should use the advice you are given.
Foreign students said, “It’s embarrassing to show weakness in the English language” and “Our culture teaches us
to not approach an advisor or mentor.”
Similarly, the medical profession does not practice extensive consultation with experts. In one study of over 300 breast
cancer surgeons (Katz et al., 2010), only one-fourth typically consulted medical oncologists, radiation oncologists or
plastic surgeons prior to surgery. About two-thirds of the surgeons reported that almost none of their patients
participated in patient decision-support activities, such as attending a practice-based presentation, viewing web-based
materials or participating in peer-support programs.
“He who trusts in himself is a fool, but he who walks in wisdom is kept safe” (Proverbs 28; 26)
4. Statistical Summary of Mental Mistakes
We examined 110 project reports composed of over 8000 pages of text that had been submitted over the last two
decades and we compiled the following statistics.
Type of Mental Mistake Number of
mistakes found
Using Dependent Criteria 75
Not Stating the Problem in Terms of
Stakeholder Needs 62
Vague Problem Statement 65
Substituting a Related Attribute 24
Sensitivity Analysis Mistakes 91
Forer Effect 61
Studies in Engineering and Technology Vol. 1, No. 1; 2014
40
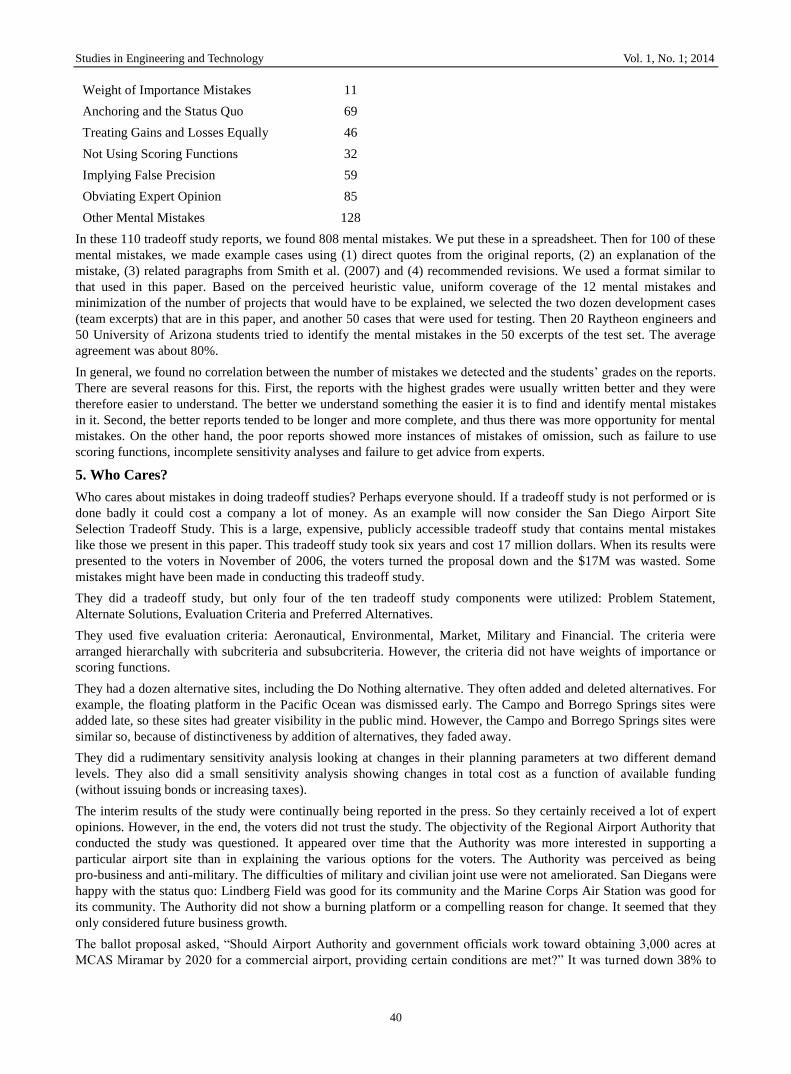
Weight of Importance Mistakes 11
Anchoring and the Status Quo 69
Treating Gains and Losses Equally 46
Not Using Scoring Functions 32
Implying False Precision 59
Obviating Expert Opinion 85
Other Mental Mistakes 128
In these 110 tradeoff study reports, we found 808 mental mistakes. We put these in a spreadsheet. Then for 100 of these
mental mistakes, we made example cases using (1) direct quotes from the original reports, (2) an explanation of the
mistake, (3) related paragraphs from Smith et al. (2007) and (4) recommended revisions. We used a format similar to
that used in this paper. Based on the perceived heuristic value, uniform coverage of the 12 mental mistakes and
minimization of the number of projects that would have to be explained, we selected the two dozen development cases
(team excerpts) that are in this paper, and another 50 cases that were used for testing. Then 20 Raytheon engineers and
50 University of Arizona students tried to identify the mental mistakes in the 50 excerpts of the test set. The average
agreement was about 80%.
In general, we found no correlation between the number of mistakes we detected and the students’ grades on the reports.
There are several reasons for this. First, the reports with the highest grades were usually written better and they were
therefore easier to understand. The better we understand something the easier it is to find and identify mental mistakes
in it. Second, the better reports tended to be longer and more complete, and thus there was more opportunity for mental
mistakes. On the other hand, the poor reports showed more instances of mistakes of omission, such as failure to use
scoring functions, incomplete sensitivity analyses and failure to get advice from experts.
5. Who Cares?
Who cares about mistakes in doing tradeoff studies? Perhaps everyone should. If a tradeoff study is not performed or is
done badly it could cost a company a lot of money. As an example will now consider the San Diego Airport Site
Selection Tradeoff Study. This is a large, expensive, publicly accessible tradeoff study that contains mental mistakes
like those we present in this paper. This tradeoff study took six years and cost 17 million dollars. When its results were
presented to the voters in November of 2006, the voters turned the proposal down and the $17M was wasted. Some
mistakes might have been made in conducting this tradeoff study.
They did a tradeoff study, but only four of the ten tradeoff study components were utilized: Problem Statement,
Alternate Solutions, Evaluation Criteria and Preferred Alternatives.
They used five evaluation criteria: Aeronautical, Environmental, Market, Military and Financial. The criteria were
arranged hierarchally with subcriteria and subsubcriteria. However, the criteria did not have weights of importance or
scoring functions.
They had a dozen alternative sites, including the Do Nothing alternative. They often added and deleted alternatives. For
example, the floating platform in the Pacific Ocean was dismissed early. The Campo and Borrego Springs sites were
added late, so these sites had greater visibility in the public mind. However, the Campo and Borrego Springs sites were
similar so, because of distinctiveness by addition of alternatives, they faded away.
They did a rudimentary sensitivity analysis looking at changes in their planning parameters at two different demand
levels. They also did a small sensitivity analysis showing changes in total cost as a function of available funding
(without issuing bonds or increasing taxes).
The interim results of the study were continually being reported in the press. So they certainly received a lot of expert
opinions. However, in the end, the voters did not trust the study. The objectivity of the Regional Airport Authority that
conducted the study was questioned. It appeared over time that the Authority was more interested in supporting a
particular airport site than in explaining the various options for the voters. The Authority was perceived as being
pro-business and anti-military. The difficulties of military and civilian joint use were not ameliorated. San Diegans were
happy with the status quo: Lindberg Field was good for its community and the Marine Corps Air Station was good for
its community. The Authority did not show a burning platform or a compelling reason for change. It seemed that they
only considered future business growth.
The ballot proposal asked, “Should Airport Authority and government officials work toward obtaining 3,000 acres at
MCAS Miramar by 2020 for a commercial airport, providing certain conditions are met?” It was turned down 38% to

Studies in Engineering and Technology Vol. 1, No. 1; 2014
41
62%. We are not saying that if they had done a more thorough tradeoff study, then the ballot proposal would have
passed. We are only saying that they could have done a better tradeoff study.
6. Summary
Good industry practices for improving the probability of success of tradeoff studies include having teams evaluate the
data, evaluating the data in many iterations and expert review of the results and recommendations. It is important that
the review teams have a substantial number of reviewers that are external to the project and that the reviewers consider
design decisions as well as simple checking to ensure that tasks were done. Reviews are often hampered by failure to
allow external reviewers access to proprietary or classified data. To improve your tradeoff study process you should
inform your decision makers about how mental mistakes affect tradeoff studies (forewarned is forearmed), encourage a
long-term institutional decision horizon, use a team approach with frequent iterations and institute both expert and
public reviews. Finally try to reduce mental mistakes by using the recommendations of this paper.
The literature on Decision Making, Cognitive Science and Experimental Economics contains hundreds of experiments
showing persistent human mistakes of judgment. Smith et al. (2007) postulated 28 specific types of mental mistakes that
could affect the ten specific components of a tradeoff study. This paper has shown examples in a dozen categories of
mental mistakes that systems engineers have actually made while creating tradeoff studies. The research found over
eight hundred examples of such mistakes: these examples prove that systems engineers really do make such mistakes.
References
Abdellaaoui, M. (2000). Parameter-free elicitation of utility and probability weighting functions, Management Science,
46(11), 1497-1512. http://dx.doi.org/10.1287/mnsc.46.11.1497.12080
Bahill, A. T. (2008). Decision Making and Tradeoff Studies,
http://www.sie.arizona.edu/sysengr/slides/decisionMaking.ppt, last accessed March 2010.
Bahill, A. T., & Baldwin, D. G., (2007). Describing baseball pitch movement with right-hand rules, Computers in
Biology and Medicine, 37, 1001-1008. http://dx.doi.org/10.1016/j.compbiomed.2006.06.007
Bahill, A. T., & Baldwin, D. G. (2008). Mechanics of baseball pitching and batting, Chapter 16 Applied Biomedical
Engineering Mechanics, Dhanjoo Ghista, CRC Press and Taylor & Francis Asia Pacific, pp. 445-488.
Bahill, A. T., Baldwin, D. G., & Ramberg, J. S. (2009). Effects of altitude and atmospheric conditions on the flight of a
baseball, International Journal of Sports Science and Engineering, 3(2), 109-128. ISSN 1750-9823 (print).
http://www.worldacademicunion.com/journal/SSCI/online.htm
Bahill, A. T., Baldwin, D. G., & Venkateswaran, J. (2005). Predicting a baseball's path, American Scientist, 93(3),
218-225.
Bahill, A. T., & Dean, F. F. (1999, 2009). Discovering system requirements, Chapter 4 in Handbook of Systems
Engineering and Management, A.P. Sage & W.B. Rouse (Eds), John Wiley & Sons, first edition 175-220, 1999,
second edition, 205-266.
Bahill, A. T., & Karnavas, W. J. (2000). Risk analysis of a pinewood derby: A case study, Systems Engineering, 3(3),
143-155. http://dx.doi.org/10.1002/1520-6858(200033)3:3<143::AID-SYS3>3.0.CO;2-0
Bahill, A. T., & LaRitz, T. (1984). Why can't batters keep their eyes on the ball, American Scientist, 72, 249-253.
Bahill, A. T., & Smith, E. (2009). An industry standard risk analysis technique, Engineering Management Journal,
21(4), 16-29.
Bahill, A. T., & Stark, L. (1975). Neurological control of horizontal and vertical components of oblique saccadic eye
movements, Mathematical Biosciences, 27, 287-298. http://dx.doi.org/10.1016/0025-5564(75)90107-8
Bahill, A. T., & Stark, L. (1977). Oblique saccadic eye movements: Independence of horizontal and vertical channels,
Archives of Ophthalmology, 95, 1258-1261. http://dx.doi.org/10.1001/archopht.1977.04450070156016
Baldwin, D. G., Bahill, A. T., & Nathan, A. (2007). Nickel and dime pitches, Baseball Research Journal, 35, 25-29.
Bleichrodt, H., & Pinto, J. L. (2000). A parameter-free elicitation of the probability weighting function in medical
decision analysis, Management Science, 46(11), 1485-1496. http://dx.doi.org/10.1287/mnsc.46.11.1485.12086
Chapman, W. L., Bahill, A. T., & Wymore, A. W. (1992). Engineering modeling and design, CRC Press Inc., Boca
Raton, FL.
Chrissis, M. B., Konrad, M., & Shrum, S. (2003). CMMI: Guidelines for Process Integration and Product Improvement,
Pearson Education Inc., Boston.

Studies in Engineering and Technology Vol. 1, No. 1; 2014
42
CMMI for Development, ver. 1.3, (2010). Software Engineering Institute, Pittsburgh, PA,
http://cmmiinstitute.com/resource/cmmi-for-development-version-1-3-microsoft-word/
Retrieved November 2013
Daniels, J. P., & Bahill, A. T. (2004). Hybrid process combines traditional requirements and use cases, Systems
Engineering, 7(4), 303-319. http://dx.doi.org/10.1002/sys.20013
Daniels, J., Werner, P., & Bahill, A. T. (2001). Quantitative methods for tradeoff analyses, Systems Engineering, 4(3)
190-212. http://dx.doi.org/10.1002/sys.1016
Forer, B. R. (1949). The fallacy of personal validation: A classroom demonstration of gullibility, Journal of Abnormal
Psychology, 44, 118-121. http://dx.doi.org/10.1037/h0059240
Hanselmann, M., & Tanner, C. (2008). Taboos and conflicts in decision making: sacred values, decision difficulty, and
emotions, Judgment and Decision Making, 3(1), 51-63.
Hooks, F., & Farry, K. A. (2001). Customer-centered products: Creating successful products through smart
requirements management, AMACOM, New York.
Hsu, F. K., Bahill, A. T., & Stark, L. (1976). Parametric sensitivity of a homeomorphic model for saccadic and
vergence eye movements, Computer Programs in Biomedicine, 6, 108-116.
http://dx.doi.org/10.1016/0010-468X(76)90032-5
Hull, E., Jackson, K., & Dick, J. (2005). Requirements engineering, Springer, London.
INCOSE Systems Engineering Handbook v3.2.2, (2011). Retrieved November 2013
http://www.incose.org/ProductsPubs/incosestore.aspx
Kahneman, D. (2002). Maps of bounded rationality: a perspective on intuitive judgment and choice, Nobel Prize
Lecture, December 8, 2002, this site also has a video of the speech,
http://nobelprize.org/nobel_prizes/economics/laureates/2002/kahneman-lecture.html
Kahneman, D. (2003). A perspective on judgment and choice: Mapping bounded rationality, American Psychologist,
58(9), 697-720. http://dx.doi.org/10.1037/0003-066X.58.9.697
Kahneman, D., & Tversky, A. (1979).Prospect theory: An analysis of decision under risk, Econometrica, 46(2),
171-185.
Karnavas, W. J., Sanchez, P. J., & Bahill, A. T., (1993). Sensitivity analyses of continuous and discrete systems in the
time and frequency domains, IEEE Transactions on Systems, Man and Cybernetics, SMC-23, 488-501.
http://dx.doi.org/10.1109/21.229461
Katz, S. J., Hawley, S. T., Morrow, M., Griggs, J. J., Jagsi, R.., Hamilton, A. S., Graff, J. J., Friese, C. R., & Hofer, T. P.
(2010). Coordinating cancer care: patient and practice management processes among surgeons who treat breast
cancer, Medical Care, 48(1), 45-51. http://dx.doi.org/10.1097/MLR.0b013e3181bd49ca
Keeney, R. L. (1992). Value-focused thinking: A path to creative decision making, Harvard University Press,
Cambridge, MA.
Marquard, L., & Robinson, S. M. (2008). Reducing perceptual and cognitive challenges in making decisions with
models, in Decision Modeling and Behavior in Complex and Uncertain Environments, Eds. T. Kugler, J. C. Smith,
T. Connolly & Y. J. Son., Springer, Science+Business Media, NY, NY, pp. 33-55.
McBeath, M. K., Nathan, A. M., Bahill, A. T., & Baldwin, D. G. (2008). Paradoxical pop-ups: Why are they hard to
catch? American Journal of Physics, 76(8), 723-729. http://dx.doi.org/10.1119/1.2937899
Piattelli-Palmarini, M. (1994). Inevitable illusions: How mistakes of reason rule our minds, John Wiley & Sons, New
York.
RSAS, Press release: Nobel Prize in Economics 2002, Retrieved September 2008 from The Royal Swedish Academy of
Sciences: http://nobelprize.org/nobel_prizes/economics/laureates/2002/press.html.
San Diego Airport Site Selection,
http://www.san.org/documents/sdcraa/archives/Airport%20Site%20Selection%20Program/Technical%20Analysis/
Financial%20Comparative%20Analysis%20Presentation.pdf Accessed November 2013.
Sage, A. P. (1981). Behavioral and organizational considerations in the design of information systems and processes for
planning and decision support, IEEE Transactions on Systems, Man and Cybernetics, SMC-11(9) 640-680.
http://dx.doi.org/10.1109/TSMC.1981.4308761

Studies in Engineering and Technology Vol. 1, No. 1; 2014
43
Smith, E. D., Piattelli-Palmarini, M., & Bahill, A. T., (2008). Cognitive biases affect the acceptance of tradeoff studies,
in Decision Modeling and Behavior in Complex and Uncertain Environments, Eds. T. Kugler, J. C. Smith, T.
Connolly & Y. J. Son., Springer, Science+Business Media, NY, NY, pp. 227-249.
Smith, E. D., Son, Y. J., Piattelli-Palmarini, M., & Bahill, A. T., (2007). Ameliorating the effects of cognitive biases on
tradeoff studies, Systems Engineering, 10(3), 222-240. http://dx.doi.org/10.1002/sys.20072
Smith, E. D., Szidarovszky, F., Karnavas , W. J., & Bahill, A. T. (2008). Sensitivity analysis, a powerful system
validation technique, The Open Cybernetics and Systemics Journal, 2, 39-56.
http://dx.doi.org/10.2174/1874110X00802010039.
Tversky, A., & Shafir, E. (1992). The disjunction effect in choice under uncertainty, Psychological Science, 3(5),
305-309. http://dx.doi.org/10.1111/j.1467-9280.1992.tb00678.x
Wymore, A. W. (1993). Model-based systems engineering, CRC Press Inc., Boca Raton, FL.
Zhu, A., Aurum, I., Gorton. & Jeffery, R. (2005). Tradeoff and sensitivity analysis in software architecture evaluation
using analytic hierarchy process, Software Quality Journal, 13(4), 357-375.
http://dx.doi.org/10.1007/s11219-005-4251-0
Biographical Sketches
James Bohlman works for Intex, a small startup making HF IR emitters for gas detection technology. He is working to
specify and obtain equipment for testing and burn-in. He joined STRC a small startup in May 2008 as the senior
engineer and has been involved almost from the beginning in the construction of the lab space. STRC is a research
group dedicated to the purification of metallurgical-grade silicon into solar-cell useable silicon by metallurgical
refination and hydrometallurgy. He attended University of Wisconsin at Madison where receiving a BS in Metallurgical
and Mining Engineering. He worked at Texas Instruments in Dallas Texas in the pilot line wafer fab metallization area
running sputter deposition PVD equipment. He then worked in a production wafer fab called DMOS IV processing 6"
silicon wafers into one megabit DRAM memory circuits later working on application specific integrated circuits (ASICs)
as the memory business went to Japan. James also worked at Analog Devices in Norwood, Massachusetts as a process
engineer in metallization and implant primarily on high-end bipolar circuits customizable with a trimable SiCr (Silicon
Chrome) resistor. Then at Burr Brown Corp., (which subsequently became Texas Instruments in 2000) he was a CVD
and PECVD process engineer producing high-performance bipolar A-to-D circuits. He also worked on implementation
of a special resistor process to make the parts more reliable, reducing quality issues and customer concerns. He has an
MBA from the University of Phoenix and a Masters of Engineering in Systems Engineering from the University of
Arizona; two degrees which complement each other in their approach to projects, systems and business.
Terry Bahill is an Emeritus Professor of Systems Engineering and of Biomedical Engineering at the University of
Arizona in Tucson. He received his Ph.D. in electrical engineering and computer science from the University of
California, Berkeley, in 1975. Bahill has worked with dozens of high-tech companies presenting seminars on Systems
Engineering, working on system development teams and helping them to describe their Systems Engineering processes.
He holds a U.S. patent for the Bat Chooser, a system that computes the Ideal Bat Weight for individual baseball and
softball batters. He was elected to the Omega Alpha Association: the Systems Engineering Honor Society. He received
the Sandia National Laboratories Gold President's Quality Award. He is a Fellow of the Institute of Electrical and
Electronics Engineers (IEEE), of Raytheon Missile Systems, of the International Council on Systems Engineering
(INCOSE) and of the American Association for the Advancement of Science (AAAS). He is the Founding Chair
Emeritus of the INCOSE Fellows Selection Committee. His picture is in the Baseball Hall of Fame's exhibition
"Baseball as America." You can view this picture at http://www.sie.arizona.edu/sysengr/.
This work is licensed under a Creative Commons Attribution 3.0 License.
Top Related
Copyright © 2022 FDOKUMEN

