


Bahasa
Halaman
Hukum


ORIGINAL ARTICLE
Evaluation of the shear capacity of precast-prestressedhollow core slabs: numerical and experimental comparisons
E. Brunesi • D. Bolognini • R. Nascimbene
Received: 5 February 2013 / Accepted: 7 January 2014 / Published online: 28 January 2014
� RILEM 2014
Abstract Since eighties, 400 and 500 mm thick
precast-prestressed concrete hollow core slabs, char-
acterized by increasingly optimized cross-sections
with non-circular voids, became very common. How-
ever, deeper slabs with long spans, which have to resist
high line loads acting close to the supports, are
subjected to initial web shear cracking and may fail at
loads less than those predicted by traditional codes
prescriptions. The shear strength capacity of these
members without transverse reinforcement is evalu-
ated through a campaign of detailed nonlinear finite
element analyses, matching experimental test data
collected from past programs. Constitutive models,
based on nonlinear fracture mechanisms, are consid-
ered to numerically reproduce the experimental
response of single span, simply supported, isolated
hollow core units, highlighting web-shear failure
mechanism, due to short development length and lack
of transverse reinforcement. The adopted diffuse
smeared fixed cracking constitutive model allows a
reliable prediction of shear stress distributions and
crack patterns for these members in their inelastic
branch. The presence of a variable inclined strut is
clearly evident. Peak shear stress is localized at the
bottom side of the cross-section, rather than at the
level of the centroid. The experienced brittle web-
shear failure mechanism is governed by hollow core
shapes with circular or non-circular voids, as evi-
denced by the evolution of the principal tensile strain
distributions. Typically, less inclined, more rounded,
diagonal crack, controlled by the smooth web width
variation along depth, is opposed to a fairly constant
variation of the fracture angle inclination, governed by
the abrupt and irregular web width drop.
Keywords Hollow core slab � Shear strength �Prestressed concrete � Precast members � Non-
circular voids
Abbreviations
a Shear span
a1 Distance between two line loads
a1 Ratio of distance from end of member
to transfer length
Alow Area of lower strands
Aup Area of upper strands (if present)
bw Sum of web widths
D Cross-section depth, assumed as HS
Di/Di,max Normalized depth
E. Brunesi (&)
ROSE Programme, UME School, IUSS Pavia, Pavia, Italy
e-mail: [email protected]
URL: http://www.umeschool.it
D. Bolognini � R. Nascimbene
European Centre for Training and Research in Earthquake
Engineering (EUCENTRE), Pavia, Italy
e-mail: [email protected]
URL: http://www.eucentre.it
R. Nascimbene
e-mail: [email protected]
URL: http://www.eucentre.it
Materials and Structures (2015) 48:1503–1521
DOI 10.1617/s11527-014-0250-6

Dlow Diameter of lower strands
Dup Diameter of upper strands (if present)
Dz Mid-span vertical displacement
dp,low Average distance from lower strand to
the soffit
dC50 Standard deviation of fC50,mean
E1 Principal tensile strain
E3 Principal compressive strain
Fz Shear force at the support
fc Concrete compressive strength
fC50,mean Mean concrete compressive strength
by cylinder tests on 50 mm cores
drilled from the tested specimens
fctd Design tensile strength of concrete per
EC2
ft Concrete tensile strength
/ Diameter of strand
H Nominal slab depth
HH Average depth of hollow core
HS Average depth of slab cross-section
I Moment of inertia of the section about
the centroidal axis
LF Normalized load level
Ls Distance between slab end and centre
of support
Lt Transfer length of prestressing force in
strands, assumed as 55/ (slow release)
Nlow Number of lower strands
Nup Number of upper strands (if present)
Ri Ratio between experimentally observed
and predicted shear strength capacity
S First area moment of the section about
the centroidal axis
Slow Largest slippage of lower strands
Sup Largest slippage of upper strands (if
present)
rcp Fully effective concrete compressive
stress at the centroid due to prestressing
rp Prestress in the strands within the
transfer region
rp0 Fully effective prestress in the strands
outside the transfer region
rp0,low Initial fully effective prestress in lower
strands outside the transfer region
rp0,up Initial fully effective prestress in upper
strands (if present) outside the transfer
region
tb Length of bearing
tlow Average concrete thickness below the
hollow core
syz Shear stress
Vobs Experimentally observed shear strength
capacity
Vpre Predicted shear strength capacity
x Coordinate along the longitudinal axis
of the member
x/D Ratio between longitudinal distance
from the support and cross-section depth
1 Hollow core features and criticalities
The use of precast concrete in flooring system is a
widespread practice in many countries. Precast-pre-
stressed hollow core (PPHC) units are commonly
spread products of precast industry, finding wide
applications in building construction, particularly as
floor and roof components. Short construction times,
high level of quality and consistent reduction of self-
weight are achievable, allowing manufacturers to
cover spans up to 20 m. The upper surface of the
hollow core slabs is usually levelled with a cast-in situ
concrete topping. Normally, for long spans, advantage
is not taken of this topping layer as a composite
construction because of the uncertainty concerning the
bond strength between the precast and cast-in situ
concrete. Proper shear strength at the interface is
required for the composite action; the horizontal and
vertical shear strength of the joint between adjacent
hollow core units has to be high enough to transmit the
forces due to horizontal diaphragm action and load-
sharing of concentrated loads.
Through the years, 200 and 265 mm thick units,
characterized by cross-sections with circular voids, were
replaced by deeper units (320, 370, 400 and 500 mm),
presenting cross sections with non-circular voids. Stan-
dardized cross-section shapes, usually characterized by
relevant void ratios, mostly depending on the thickness
of the slab itself, were increasingly optimized. However,
experimental research works available in literature [9,
13] evidenced that PPHC slabs, with deeper cross
sections, could be subjected to initial web shear cracking
at the end regions, resulting into critical brittle failure
mechanisms. Comparisons with traditional codes pre-
scriptions, American Concrete Institute (ACI) [1] and
Eurocode (EC2) [5], highlighted that these members
1504 Materials and Structures (2015) 48:1503–1521

without transverse reinforcement, generally not feasi-
ble, can fail, due to web-shear cracking in the ‘‘dis-
turbed’’ end regions, at loads less than those predicted by
conventional design methods.
Although PPHC slabs have been widely adopted,
some aspects of the commonly-used design approaches
against shear are still a cause of concern; short bearings
and not fully developed prestressing force influence
their response. Furthermore, their common production
system (i.e. extrusion) may result in features not
properly in agreement with those of the standard
concrete strength monitoring procedures. PPHC have
undergone extensive experimental tests [2, 8, 12, 21] to
verify their compliance with the provisions of tradi-
tional Codes and Standards and classify the possible
failure modes. Walraven and Mercx [21] also noticed
that the observed shear resistance was lower than the
predicted one when the voids were non-circular.
Furthermore, Yang [23] observed that the maximum
tensile stress is not located at the level of the centroid,
as expected by EC2, which, additionally, ignores the
shear stresses due to the prestress force. Recently,
Hawkins and Ghosh [9] have also shown that PPHC
slabs deeper than 320 mm can fail in shear at loads less
than those predicted by ACI recommendations. Addi-
tional explanations for the observed mismatch have to
be researched in the different contributions to shear
transfer mechanism with respect to traditional normal-
strength concretes [7]. Shear failure surfaces in high-
strength concrete members are smoother than in
normal-strength concrete ones, showing cracks that
can be propagated through coarse aggregate
particles rather than around them, as shown by Cladera
and Marı [6].
0 100 200 300 400 500 600 700 8000
0.5
1
1.5
2
2.5
Vpre
[kN]
Ri =
Vob
s / V
pre [−
]
200265320370400500V
obs = V
pre
0 100 200 300 400 500 600 700 8000
0.5
1
1.5
2
2.5
Vpre
[kN]
Ri =
Vob
s / V
pre [−
]
200265320370400500V
obs = V
pre
0 100 200 300 400 500 600 700 8000
0.5
1
1.5
2
2.5
Vpre
[kN]
Ri =
Vob
s / V
pre [−
]
200265320370400500V
obs = V
pre
0 100 200 300 400 500 600 700 8000
0.5
1
1.5
2
2.5
Vpre
[kN]
Ri =
Vob
s / V
pre [−
]
200265320370400500V
obs = V
pre
a b
c d
Fig. 1 a–d Ri versus Vpre for each considered depth, according to EC2, Yang’s approach, ACI and CSA, respectively
Materials and Structures (2015) 48:1503–1521 1505
1.1 Experimental test database and accuracy
of current design methods
Past experimental data, collected by Pajari [13], have
been re-examined to obtain an experimental database
of single span, simply supported, isolated PPHC units,
loaded with transverse and uniformly distributed line
loads, highlighting web-shear failure mechanism, due
to short development length and lack of shear rein-
forcement. The 49 specimens were characterized by
six nominal slab depths, five hollow core shapes with
circular and non-circular voids, different void ratios,
several prestressing steel strands arrangements and
levels of initial prestress. The imposed vertical loads
acted at x/D [ 2.4. No cast-in situ filling concrete was
provided in the voids at the end regions. Idealized
pinned ends were mechanically materialized by rollers
and wedges, properly tightened to prevent torque.
To quantify their effectiveness, three commonly-
known Codes prescriptions, EC2, ACI and Canadian
Standards Association (CSA) [3], as well as a research
approach [23] against web-shear failure mechanism,
were adopted to predict Pajari experimental database.
In particular, Eq. 6.4 of EC2, reported below,
Eqs. 11–12 of ACI and Eqs. 11-6, 11-10, 11-11 and
11-13 of CSA were used.
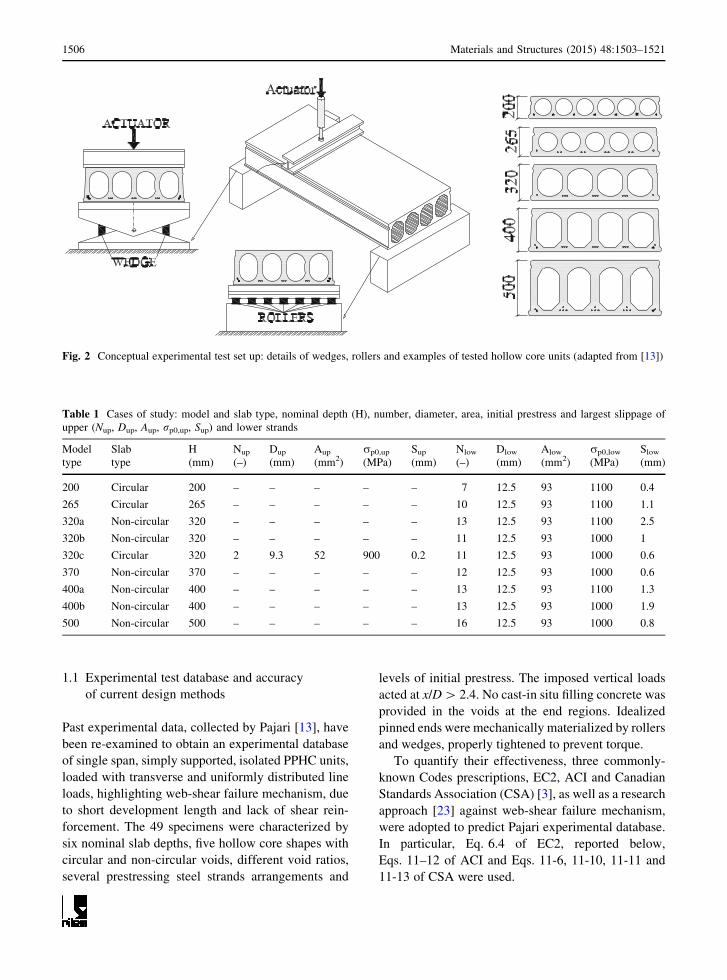
Fig. 2 Conceptual experimental test set up: details of wedges, rollers and examples of tested hollow core units (adapted from [13])
Table 1 Cases of study: model and slab type, nominal depth (H), number, diameter, area, initial prestress and largest slippage of
upper (Nup, Dup, Aup, rp0,up, Sup) and lower strands
Model
type
Slab
type
H
(mm)
Nup
(–)
Dup
(mm)
Aup
(mm2)
rp0,up
(MPa)
Sup
(mm)
Nlow
(–)
Dlow
(mm)
Alow
(mm2)
rp0,low
(MPa)
Slow
(mm)
200 Circular 200 – – – – – 7 12.5 93 1100 0.4
265 Circular 265 – – – – – 10 12.5 93 1100 1.1
320a Non-circular 320 – – – – – 13 12.5 93 1100 2.5
320b Non-circular 320 – – – – – 11 12.5 93 1000 1
320c Circular 320 2 9.3 52 900 0.2 11 12.5 93 1000 0.6
370 Non-circular 370 – – – – – 12 12.5 93 1000 0.6
400a Non-circular 400 – – – – – 13 12.5 93 1100 1.3
400b Non-circular 400 – – – – – 13 12.5 93 1000 1.9
500 Non-circular 500 – – – – – 16 12.5 93 1000 0.8
1506 Materials and Structures (2015) 48:1503–1521

Vpre;EC2 ¼Ibw
S
ffiffiffiffiffiffiffiffiffiffiffiffiffiffiffiffiffiffiffiffiffiffiffiffiffiffiffiffiffiffiffiffiffi
fctdð Þ2þ a1rcpfctd
q
ð1Þ
As evidenced in Fig. 1, analytical approaches
roughly lead to unconservative (EC2 and Yang), or
over-conservative predictions (ACI and CSA), accord-
ing to different nominal depths and geometry types,
not directly accounting for the influence of local
hollow core shape. Therefore, the inaccuracy of
current codes is reaffirmed, evidencing a particularly
critical scenario, if they are adopted outside of their
‘‘implicit field of applicability’’.
2 Nonlinear monotonic solid FE analyses
The critical scenario depicted by analytical predictions
suggests the need of a detailed campaign of numerical
analyses, as in past research works to assess the
performance of RC [10] and steel structures [11, 15,
22], addressed to investigate the effects of the hollow
core shape on the shear response of such members. To
properly reproduce the experimental test set up,
conceptually schematized in Fig. 2, refined nonlinear
3D FE models, based on nonlinear fracture mecha-
nisms, were developed and monotonically loaded till
the brittle web-shear failure mechanism is reached.
Nine specimens, whose main features are presented
in Tables 1 and 2, have been considered. In particular,
for 320 mm deep slabs, three specimens have been
selected: two characterized by non-circular and one by
circular voids, to quantify the hollow core shape
influence on the shear strength capacity for members
with similar depths. Similarly, two 400 mm deep units
have been analysed, since they evidence non-circular
hollow core shapes with various levels of irregularity.
2.1 Proposed numerical approach
To predict brittle web-shear failure mechanism, the
total strain crack model, developed along the lines of
the modified compression field theory (MCFT), orig-
inally proposed by Vecchio and Collins [19] and then
extended to the three-dimensional case by Selby and
Vecchio [16], was adopted. The classical Von Mises
yielding criterion with strain hardening was used for
Table 2 Cases of study. length, span, mass, bearing (tb), shear
span (a) and distance between two line loads (a1), average
depth of section (HS), sum of individual web widths (bw),
average depth of hollow core (HH), average concrete thickness
below hollow core (tlow), average distance from lower strand to
the soffit (dp,low), mean core strength (fC50,mean) and relative
standard deviation (dC50)
Model
type
Length
(mm)
Span
(mm)
Mass
(kg)
tb(mm)
a(/a1)
(mm)
HS
(mm)
bw
(mm)
HH
(mm)
tlow
(mm)
dp,low
(mm)
fC50,mean
(MPa)
dC50
(MPa)
200 6,643 6,603 2000 40 917 200 239 153 19 39 54.8 3.8
265 5,253 5,213 2240 40 724 260 228 175 42 36 71.3 4.2
320a 7,198 7,118 3810 80 1,160 315 309 222 38 43 61.8 2.4
320b 7,995 5,800 3880 80 760 321 289 216 36 38 64.3 2.6
320c 5,985 5,945 3100 40 826 310 263 213 40 51 46.8 2.0
370 7,002 6,942 4060 60 960/300 359 272 237 54 40 72.2 2.1
400a 7,626 7,546 4510 80 1,048 402 286 299 49 38 71.5 4.0
400b 8,390 7,150 4580 100 1,150 390 293 310 38 41 67.3 1.7
500 8,492 8,412 6000 80 1,475/300 503 324 398 40 47 76.4 2.6
−6 −5 −4 −3 −2 −1 0 1
x 10−3
−80
−70
−60
−50
−40
−30
−20
−10
0
10
Strain ε [−]
Str
ess
σ [M
Pa]
200265320a320b320c370400a400b500
Fig. 3 Calibration of the solid FE models: uniaxial tensile and
compressive constitutive laws
Materials and Structures (2015) 48:1503–1521 1507

prestressed steel strands, represented as embedded
elements. Two types of prestress distribution, linear,
according to codes provisions (ACI and CSA) and
parabolic, according to Yang [23], were considered to
evaluate their influence on the shear strength. In
particular, Eq. 2, proven by full-scale tests [17],
expresses the parabolic curve selected.
rp¼0 0�xþ Ls� 5/
1� Ltþ5/�x�Ls
Lt
� �2� �
rp0 5/� xþ Ls�5/þ Lt
rp0 xþ Ls� 5/þ Lt
8
>
<
>
:
ð2ÞTherefore, no interface elements were introduced to
represent strands-concrete interaction, since implicitly
captured by an equivalent prestress distribution.
According to Pajari [13], two loss of prestress ratios,
5 and 15 %, were adopted, due to the little level of
knowledge about concrete mix and storing conditions,
also providing an upper and lower threshold and
showing that the shear capacity of PPHC units is not
sensitive to small variations in the losses. Similar
range is observed by direct computations, as con-
firmed by Palmer and Schultz [14] for analogous
Fig. 4 Specimen 320b:
example of detailed solid
FE models developed
Table 3 Total number of bricks and DoF for each specimen
Model type #Bricks #DoF
m1 m2 Strip m1 m2 Strip
200 124,960 88,770 13,640 257,187 181,566 28,927
265 73,920 52,800 9,600 153,800 110,120 20,871
320a 190,060 129,688 30,160 365,533 250,027 59,259
320b 155,100 109,604 25,016 303,727 215,155 50,337
320c 187,872 131,016 29,468 350,891 245,321 56,436
370 253,640 173,072 40,832 461,977 316,015 76,107
400a 247,680 165,120 37,920 467,279 312,299 72,903
400b 224,112 151,984 34,220 427,631 290,711 66,699
500 350,976 230,328 52,416 636,664 418,864 96,714
Table 4 Combinations of prestress distributions and losses of
prestress
Combination
ID
Prestress
distribution
Loss of
prestress (%)
m2p1 Parabolic 5
m2p2 Parabolic 15
m2p3 Linear 5
m2p4 Linear 15
1508 Materials and Structures (2015) 48:1503–1521
PPHC slabs, even though more conservative levels
(20–25 %) may be assumed in the design process of
such members to safely represent the long-term
effects. The diffuse smeared fixed cracking constitu-
tive law assumed for concrete exploits an exponential
softening decay curve and Thorenfeldt et al. [18]
model for uniaxial tensile and compressive behavior,
respectively. Figure 3 presents the calibration of the
adopted uniaxial tensile and compressive constitutive
laws, for each selected specimen, according to CEB-
FIP Model Code [4].
Confinement effect was neglected, while full shear
retention and lateral crack effect [20] were potentially
accounted, as well as inward slippage of the strands.
Newton–Raphson iteration scheme was adopted with
an energy-normalized convergence criterion. Six-
node brick elements were used and mesh sensitivity
was investigated by doubling the extruding offset. For
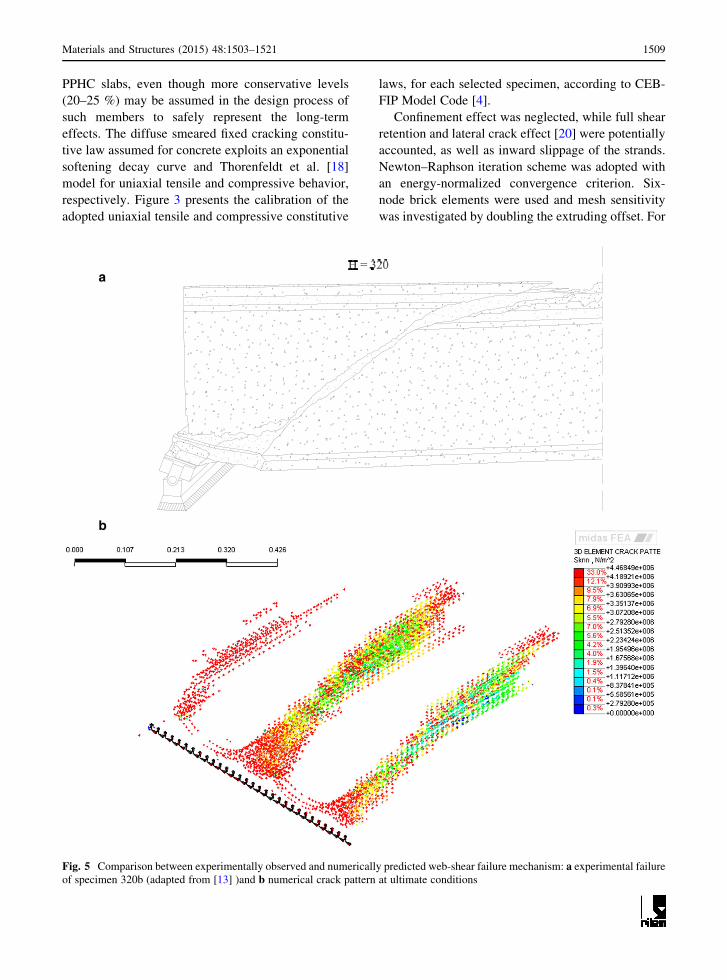
a
b
Fig. 5 Comparison between experimentally observed and numerically predicted web-shear failure mechanism: a experimental failure
of specimen 320b (adapted from [13] )and b numerical crack pattern at ultimate conditions
Materials and Structures (2015) 48:1503–1521 1509

each specimen, an equivalent strip of the PPHC unit
was modelled to evaluate the effectiveness of this
assumption. An example of the FE mesh is depicted in
Fig. 4, while Table 3 summarizes the total number of
brick elements and degrees of freedom employed for
each specimen. Finally, considering the four combi-
nations of prestress distributions and losses, detailed in
Table 4, a total of 54 models were created.
2.2 Results and discussion
In this section, FE results are synthesized to outline the
influence of the hollow core shape on the web-shear
failure mechanism and, hence, on the shear strength of
such members. First, the proposed numerical approach
is validated by focusing on a single PPHC unit, taken
as reference. Therefore, the accuracy of the FE
predictions obtained for the nine specimens analysed
is quantified in comparison with experimental data.
Finally, the observed trends are justified by consider-
ing the evolution of local quantities, such as principal
tensile strain and shear stress, in order to depict
behavioral changes as consequence of geometrical
variations in the cross-section shape of such slabs.
2.2.1 Model validation: specimen 320b
The adopted modeling approach evidences a consis-
tent match with experimental test results; Fig. 5
presents a comparison between the experimentally
observed and numerically predicted web-shear failure
mechanism, for a 320 mm deep PPHC unit, charac-
terized by non-circular voids (specimen 320b). Prin-
cipal tensile and compressive strains, crack pattern and
shear stress distribution at failure are in close agree-
ment with the collapse mechanism evidenced by the
experimental damage pattern at the end of the test. A
smooth, inclined crack, whose width reduces as the
imposed displacement monotonically increases,
emerges from both principal tensile strains and
numerical crack pattern. Simultaneously, an inclined
compressive diagonal strut arises according to the
principal tensile strain distribution, resulting in the
undergone failure mode, also confirmed by a cut-off in
the shear stress flow.
According to mesh sensitivity analysis, strip
modeling assumptions and the considered combina-
tions of prestress distributions and losses, six capacity
curves (i.e. shear force at the support, Fz, vs. mid-span
vertical displacement, Dz) are graphed in Fig. 6.
Independency with respect to adopted mesh refine-
ments is achieved through a proper calibration of the
crack bandwidth in each discretization zone, since the
observed response is essentially governed by tensile
behavior. The choice of parabolic or linear prestress
distribution in strands leads to negligibly small global
differences in terms of shear resistance (\0.1 %),
while larger influence is expected to occur if local
parameters, as stresses and strains distributions, are
considered. More appreciable difference is due to the
loss of prestress ratio. The adoption of 15 % loss
implies a reduced shear strength capacity, of about
5 %, if compared to 5 % loss; furthermore, the
capacity curves obtained for 15 % evidences a
smoother nonlinear response for lower levels of shear
force at the support, being also characterized by a
reduced ultimate mid-span vertical displacement
capacity of about 5 %. In this case, the strip modeling
assumption, referred as ‘‘HypS’’, cannot be accounted
either for design purposes, as the convergence of the
analysis failed when the capacity curve came into its
nonlinear branch, resulting in an over-conservative
estimation of the shear strength capacity. The intrinsic
lack of ductility reserves is confirmed by an evidently
low displacement ductility capacity, up to 1.3,
achieved for a maximum mid-span vertical drift of
*0.2 %.
The evolution of the shear stress distributions in the
end region of the specimen is presented in Fig. 7.
Specimen 320b, whose non-circular hollow core shape
−6 −4 −2 0 2 4 60
50
100
150
200
250
Vertical Displacement Dz [mm]
She
ar F
orce
Fz
[kN
]
320bm1p1320bm2p1320bm2p2320bm2p3320bm2p4HypS320bm2p1
Fig. 6 Specimen 320b: capacity curves, according to mesh
sensitivity, strip modeling assumption and the four combina-
tions of prestress distributions and losses
1510 Materials and Structures (2015) 48:1503–1521

presents an evidently abrupt and irregular web width
drop along the depth (Fig. 4), highlights the presence
of a strongly-disturbed zone. High shear stress
concentrations are observed in the first LFs, since
the section shown in Fig. 7a is taken in correspon-
dence of a strand, longitudinally, and, transversally at
x/D = 0.4, where the prestressing force develops at a
high force variation per length. This concentration is
mostly due to the prestressing force and is mitigated as
x/D increases (see Fig. 7b). As LF increases, the shear
stress develops in the linear branch of the capacity
curve, evidencing a second discontinuity below the
mid-depth, where the web width drop is localized. For
further LF increments, the shear stress peaks at the
strand level slightly increase, while a much more
evident increment is detected in the upper discontinu-
ity. At LF roughly equal to 50 %, the peak shear stress
overall the depth rises up from the strand to the web
width drop level. This concentration remains pro-
nounced up to LF = 85 %, when the first cracking
appears. For further LF increments, the ratio between
the current and previous peaks increases at a lower
rate, in accordance with the reduced slope of the
capacity curve into its nonlinear branch and the related
shear stress redistribution. Finally, at LF = 100 %,
the peak is further uplifted, in accordance with the
shear stress cut-off experienced. This behavior reveals
the complex interaction between cross-section geo-
metric features, in terms of hollow core shape, and the
transfer mechanism of the prestressing force. The two
−7 −6 −5 −4 −3 −2 −1 0 1 2 30
50
100
150
200
250
300
350
Shear Stress τYZ
[MPa]
Dep
th [m
m]
LF=19%LF=37%LF=48%LF=59%LF=70%LF=78%LF=85%LF=93%LF=96%LF=100%
−7 −6 −5 −4 −3 −2 −1 0 1 2 30
50
100
150
200
250
300
350
Shear Stress τYZ
[MPa]
Dep
th [m
m]
LF=19%LF=37%LF=48%LF=59%LF=70%LF=78%LF=85%LF=93%LF=96%LF=100%
−7 −6 −5 −4 −3 −2 −1 0 1 2 30
50
100
150
200
250
300
350
Shear Stress τYZ
[MPa]
Dep
th [m
m]
320bm2p1320bm2p2320bm2p3320bm2p4
a b
c
Fig. 7 Evolution of the shear stress distributions at a x/D = 0.4 and b x/D = 0.7; c comparison between the four combinations of
prestress distributions and losses (x/D = 0.4)
Materials and Structures (2015) 48:1503–1521 1511

discontinuities of the indented, fairly parabolic shear
stress distributions are particularly visible for sections
close to the support (x/D \ 0.56). Their evolution,
according to the experienced web-shear failure mech-
anism, results into an inclined crack. Their peak is
forced to rise up, increasing both longitudinal distance
from the support and imposed vertical displacement,
according to hollow core shape and inherent web
width drop. In fact, sections particularly close to the
support (x/D \ 0.56), are characterized by a localiza-
tion of the shear stress peak evidently below with
respect to the centroidal axis, about 25 %, while for
sections, placed at 0.56 \ x/D \ 1.68, this mismatch
tends to reduce, reaching a difference of *12 %.
Furthermore, at x/D = 2, the maximum shear stress is
localized at the level of the centroid of the PPHC unit.
If shear stresses at ultimate conditions are consid-
ered (see Fig. 7c), the comparison between the two
prestress distributions, for the same prestress loss,
leads to negligibly small differences in terms of peak
shear stress experienced overall the whole unit (2 %),
while the comparison between the two loss of prestress
ratios, for the same prestress distribution, evidences
slightly more appreciable mismatch (6 %).
2.2.2 Accuracy of FE predictions
Figure 8a presents the capacity curves determined for
the nine specimens, assuming 5 % loss of prestress;
shear force at support versus mid-span vertical drift
rather than displacement curves are shown to compare
units with different lengths. The effectiveness of the FE
models developed, accounting both for geometrical and
material nonlinearities, is reaffirmed. An accurate
agreement with experimentally observed shear strength
capacities is achieved, since 0.96\ Ri \ 1.05, with a
mean value of 0.998, characterized by a reduced
standard deviation of 2.8 %, as shown in Tables 5 and
6 and graphed in Fig. 8b. Herein, a comparison with
analytical predictions (EC2, Yang, ACI and CSA) is
presented as well. As a general tendency, slightly
unconservative predictions are observed for PPHC units
with circular voids and small nominal depths (200 and
265 mm), while, as the slab depth increases ([300 mm),
the accuracy of the FE results tends to increase. The level
of non-conservatism (EC2 and Yang) or over-conser-
vatism (ACI and CSA) disappears and an evidently
lower standard deviation demonstrates the robustness of
the proposed modeling approach.
Similar trends are obtained for 15 % loss of
prestress; in fact, the adoption of 15 % loss confirms
the previously mentioned reduction of shear resis-
tance, approximately ranging from 4 to 10 %, accord-
ing to specimen type. The capacity curves, obtained
for 15 % loss, are again characterized by a smoother
nonlinear branch for lower levels of shear force and, in
some cases, lower ultimate displacement capacity, of
about 10–13 %, is even noticed. However, a weak
sensitivity of the failure mode with respect to the
prestress losses emerges, as, for all the specimens, the
web-shear failure mechanism is experienced at a
distance from support, which varies between one and
two cross-section depths, where the prestressing force
is not yet fully developed.
For mid-span vertical drifts, ranging from 0.1 to
0.4 %, the considered capacity curves reach their
−0.5 0 0.5 1 1.50
50
100
150
200
250
300
350
400
450
500
Vertical Drift [%]
She
ar F
orce
Fz [k
N]
200m2p1265m2p1320am2p1320bm2p1320cm2p1370m2p1400am2p1400bm2p1500m2p1
0 100 200 300 400 500 600 700 8000
0.2
0.4
0.6
0.8
1
1.2
1.4
1.6
1.8
2
Vpre
[kN]
Ri =
Vob
s / V
pre [−
]
EC2YangACICSAFEMV
obs = V
pre
a
b
Fig. 8 Shear capacities of the nine specimens selected: a shear
force at the support versus mid-span vertical drift curves and
b experimentally observed versus numerically (FEM) and
analytically predicted shear strength
1512 Materials and Structures (2015) 48:1503–1521

nonlinear branches, with different slope and post-
yielding stiffness. Evidently low displacement ductil-
ity levels, approximately ranging from 1.3 to 2.3,
according to different hollow core shapes and cross-
section features, are observed. Each specimen col-
lapses by brittle web-shear mode, thus confirming the
intrinsic lack of ductility reserve for this type of
member. According to FE results, PPHC units with
circular voids typically exhibits a relatively more
ductile response, reaching a displacement ductility of
about 2, while a less uniform trend is detected in
deeper cross-sections characterized by non-circular
voids. In fact, displacement ductilities up to *2 are
determined for slabs presenting a relevant web width
and concrete thickness above and below the hollow
core itself (specimens 500 and 370) or an almost
regular web width variation along the hollow core
depth (specimen 400a). By contrast, specimens char-
acterized by an abrupt and irregular web width drop
(specimen 400b) or reduced web width, if compared to
concrete thickness above and below the hollow core
(specimens 320a and 320b), ensure evidently lower
displacement ductility of about 1.3. Therefore, the
non-circularity of the voids, the inherent web width
variation along depth and concrete thickness above
and below the hollow core are observed to govern the
displacement ductility capacity of PPHC units, and,
hence, the fragility of the collapse mechanism
experienced.
2.2.3 Influence of hollow core shape: 400b
versus 400a and 320c versus 320b
This trend is corroborated by the evolution of principal
tensile and compressive strain distributions, presented
in Figs. 9 and 10, for specimen 400b. The principal
tensile strain directly governs the failure mode and the
presence of a variable inclined strut and tie, whose
width and inclination angle evolves during the mono-
tonic analysis, is clearly evident. As shown in Fig. 9,
tie width reduces as the imposed vertical displacement
increases, reproducing the actual shear stress flow,
characterized by peaks placed in correspondence of
the bottom side of the cross-section, rather than at the
Table 5 Comparison between experimental, analytical and FEM results
Model type Loss of prestress = 5 %
EC2 Yang ACI CSA FEM
Vobs Vpre Ri Vpre Ri Vpre Ri Vpre Ri Vpre Ri
(kN) (kN) (–) (kN) (–) (kN) (–) (kN) (–) (kN) (–)
200 90.2 145.7 0.619 128.0 0.704 98.5 0.916 114.8 0.786 94.3 0.956
265 219.4 223.8 0.980 223.7 0.981 155.8 1.408 158.1 1.388 223.2 0.983
320a 297.1 378.7 0.785 322.9 0.920 266.8 1.114 240.4 1.236 290.8 1.022
320b 232.5 359.7 0.646 317.2 0.733 253.1 0.919 236.5 0.983 221.4 1.050
320c 253.9 246.6 1.030 239.7 1.059 174.8 1.453 166.0 1.530 252.8 1.004
370 306.2 396.2 0.773 373.8 0.819 277.7 1.103 255.4 1.199 315.4 0.971
400a 291.3 475.4 0.613 444.0 0.656 363.3 0.802 309.0 0.943 293.9 0.991
400b 444.0 500.9 0.886 405.7 1.094 348.8 1.273 278.9 1.592 443.3 1.002
500 471.2 702.5 0.671 565.7 0.833 550.7 0.856 415.6 1.134 469.8 1.003
Vobs, Vpre and relative Ri for each specimen, according to EC2, ACI, CSA provisions, Yang’s approach and FEM
Table 6 Mean and standard deviation of Ri, according to EC2, Yang, ACI, CSA and FEM approaches
Model type Loss of prestress = 5 %
EC2 Yang ACI CSA FEM
Mean SD Mean SD Mean SD Mean SD Mean SD
All 0.778 15.7 % 0.867 15.7 % 1.094 24.1 % 1.199 27.1 % 0.998 2.8 %
Materials and Structures (2015) 48:1503–1521 1513

Fig. 9 Evolution of the principal tensile strains E1 for monotonically increased vertical displacement steps imposed (specimen 400b)
1514 Materials and Structures (2015) 48:1503–1521

level of the centroid. A brittle web-shear failure
mechanism results from an inclined diagonal crack,
which, for this specimen, with a sharp web width
variation along the depth, almost linearly propagates
from the support to zones upper than the centroidal
axis at a distance of about two cross-section depths.
Accordingly, a diagonal strut, whose width increases
as the imposed vertical displacement increases, con-
nects the transverse line load and the support, as
depicted in Fig. 10. This failure mode results into an
incipient change in the shear stress distribution,
localized at a distance roughly equal to the hollow
core depth, where the maximum tensile strain overall
the whole member is undergone.
In addition, the evolution of the principal tensile
strain distributions and inherent damage pattern
experienced by non-circular PPHC units with different
regularity of web width variation along depth is
compared, by taking specimens 400a and 400b as
reference. Specimen 400a, more regular than 400b,
presents very highly concentrated tensile strains in
correspondence of the minimum of the web width, as
shown in Fig. 11. For this type of cross-section
configuration, an inclined crack appears at the support
and, almost linearly, extends to approximately twice
the depth of the considered PPHC slab, since its
propagation along the longitudinal axis finds no
significantly abrupt web width variation. Conversely,
in specimen 400b, the principal tensile strain was
shown to be more evidently lumped at the level of the
sharp and irregular web width drop. As the distance
from the support increases, the experienced peak rises
up from the bottom of the cross-section, evidently
below with respect to the centroid, for sections close to
the support, to zones upper than the centroidal axis, for
sections at two depths. The evolution of the fracture
angle significantly differs from that shown by speci-
men 400a. Even though the inclination of both remains
fairly constant, at increased distances from the
support, specimen 400b highlights a more prominent
brittle web-shear failure mechanism, if compared to
400a, since the shear fracture more suddenly appears
and more rapidly evolves, as confirmed by their
capacity curves (Fig. 8a). As a result, it occurs a less
inclined and slightly more rounded fracture, whose
propagation along the longitudinal axis of the member
and evolution, according to the imposed monotonic
loading history, is controlled by a more abrupt and
irregular change in the hollow core shape.
To further validate this trend, a comparison
between the evolution of the principal tensile strain
distributions, according to the monotonically increased
vertical displacements imposed, is presented in
Fig. 12, for units with circular (specimen 320c) and
non-circular (specimen 320b) hollow core shapes.
Specimen 320b evidences a failure mode in consistent
agreement with that previously discussed for specimen
400b, being the two PPHC units characterized by
similar cross-section geometric features, particularly
in terms of non-circularity of the voids. High principal
tensile strains concentrations are again depicted in the
inner constant part of the web width, causing a fairly
linear crack, which expands from the lower part of the
hollow core, in the proximity of the support, to upper
ones, in sections at about two slab depths. The fracture
angle observed visibly differs from those experienced
by PPHC units with circular voids, e.g. specimen
320c. According to its capacity curve, a more rapid
and brittle failure mechanism takes place in specimen
320b, highlighting a more inclined, almost linear,
fracture angle, whose spread follows the sharp and
prominent web width drop. On the contrary, in
specimen 320c, principal tensile strain peaks are
forced to occur in accordance with the gradual and
regular web width variation along the depth. In fact,
their evolution, according to the inherent crack pattern
at ultimate conditions, reveals a more manifest
variation of the fracture angle at further distances
from the support, resulting in a clearly more rounded
and less inclined diagonal crack, which links the
support and the centroidal axis at a distance of about
two hollow core depths.
Therefore, in Fig. 13, the shear stress distribu-
tions at ultimate conditions, obtained by assuming
parabolic prestress distribution along strands, com-
bined with 5 % loss of prestress, are compared, for
each specimen, at commonly selected distance from
the support. The nine PPHC slabs analysed experi-
ence their peaks overall the whole unit at different
sections, anyway all included within 0 \ x/D \ 0.5.
The fairly parabolic shear stress distributions col-
lected reaffirm the behavior previously discussed, in
terms of fracture angle inclination. Cross-sectional
geometric features, interacting with the transfer
mechanism of the prestressing force, govern their
evolution and shape, confirming that the web-shear
failure mode of such PPHC units depends on the
irregularity of the voids. Slabs characterized by
Materials and Structures (2015) 48:1503–1521 1515

Fig. 10 Subsequent evolution of the principal compressive strains E3 for monotonically increased vertical displacement steps
(specimen 400b)
1516 Materials and Structures (2015) 48:1503–1521

Fig. 11 Different evolution of E1 in specimen 400a, still characterized by non-circular voids, but with increased regularity in terms of
web width variation along depth
Materials and Structures (2015) 48:1503–1521 1517

Fig. 12 Comparison
between the evolution of E1
for different hollow core
shapes, characterized by
a circular (specimen 320c)
and b non-circular voids
(specimen 320b)
1518 Materials and Structures (2015) 48:1503–1521

circular voids show a nearly parabolic slope, with
peaks closer to the level of the centroid, while more
prominent and irregular distributions are observed
for sections presenting non-circular voids, in accor-
dance with a different web width variation along
depth. Furthermore, discontinuities at the pre-
stressed strands level are particularly evident for
deeper cross-sections (specimens 400a, 400b and
500) which locally evidence strongly-disturbed and
indented slopes characterized by maxima localized
clearly below the centroidal axis of the member. For
further longitudinal distances from the support, the
local disturbance is visibly mitigated, resulting in
peaks close to the level of the centroid.
3 Conclusions
A modeling approach, based on nonlinear fracture
mechanisms, was proposed to predict the shear
response of PPHC slabs. Numerical observations were
discussed to investigate the failure mode of the units
analysed and to depict behavioral changes as conse-
quence of geometrical variations in their cross-section
shape. The following observations and conclusions
were drawn from the numerical study:
• In contrast of the mismatch shown by conventional
codes, a satisfying fit with experimental results
was achieved in terms of shear capacity, faithfully
reflecting the behavior of such high-strength
−8 −6 −4 −2 0 20
0.1
0.2
0.3
0.4
0.5
0.6
0.7
0.8
0.9
1
Shear Stress τYZ
[MPa]
Nor
mal
ized
Dep
th D
i / D
i,max
[−]
200m2p1265m2p1320am2p1320bm2p1320cm2p1370m2p1400am2p1400bm2p1500m2p1
−8 −6 −4 −2 0 20
0.1
0.2
0.3
0.4
0.5
0.6
0.7
0.8
0.9
1
Shear Stress τYZ
[MPa]
Nor
mal
ized
Dep
th D
i / D
i,max
[−]
200m2p1265m2p1320am2p1320bm2p1320cm2p1370m2p1400am2p1400bm2p1500m2p1
−8 −6 −4 −2 0 20
0.1
0.2
0.3
0.4
0.5
0.6
0.7
0.8
0.9
1
Shear Stress τYZ
[MPa]
Nor
mal
ized
Dep
th D
i / D
i,max
[−]
200m2p1265m2p1320am2p1320bm2p1320cm2p1370m2p1400am2p1400bm2p1500m2p1
−8 −6 −4 −2 0 20
0.1
0.2
0.3
0.4
0.5
0.6
0.7
0.8
0.9
1
Shear Stress τYZ
[MPa]
Nor
mal
ized
Dep
th D
i / D
i,max
[−]
200m2p1265m2p1320am2p1320bm2p1320cm2p1370m2p1400am2p1400bm2p1500m2p1
a b
c d
Fig. 13 Shear stress distributions at ultimate conditions versus normalized slab depth for increased distance from the support,
assuming parabolic prestress distribution and 5 % loss of prestress
Materials and Structures (2015) 48:1503–1521 1519

concrete members (0.96 \ Ri \ 1.05, with mean
of 0.998 and standard deviation of 2.8 %).
• The complex contribution due to the transfer
mechanism of prestressing force, which interacts
with the hollow core features, was highlighted by
the detailed FE analyses performed in a nonlinear
fashion. Furthermore, the influence of prestress
distributions and losses was quantified.
• Intrinsic lack of ductility reserves was confirmed for
these units without transverse reinforcement and a
trend was established, according to the regularity of
the voids. Displacement ductility of about 2 was
observed for specimens with circular voids, while
levels slightly larger than unity were determined in
deep cross-sections with pronounced flat webs that
create discontinuities in the shear stress path.
• The brittle web-shear failure mechanism experi-
enced was proven to be controlled by hollow core
shapes and related non-circularity of the voids,
inherent web width variation along depth and
concrete chords above and below the void, as
confirmed by the evolution of the principal tensile
and compressive strains, developing a variable
inclined strut and tie mechanism.
• The presence of a less inclined, more rounded,
diagonal crack, controlled by the smooth web width
variation along depth, is generally opposed to a fairly
constant variation of the fracture angle inclination,
governed by the abrupt and irregular web width drop.
• Shear stress distributions confirmed the key role
played by cross-section features. Deeper specimens,
whose cross-sections are characterized by non-
circular hollow core shapes, reveal more prominent,
irregular and indented shear stress distributions,
whose peak is localized evidently below the centroid,
at the level of the sharp change in their web width.
• The numerical outcome of this research may be
directly applicable to develop alternative design
methods against web-shear failure of PPHC units,
saving the inaccuracy of previous proposals,
especially the various codes, by explicitly account-
ing for the influence of the hollow core shape.
References
1. ACI Committee (2005) Building code requirements for
structural concrete (ACI 318–05) and commentary (ACI
318R–05). American Concrete Institute, Farmington Hills
2. Becker RJ, Buettner DR (1985) Shear tests of extruded
hollow core slabs. PCI J 30(2):40–54
3. Canadian Standards Association (2001). CSA standard
A23.3-04 design of concrete structures
4. CEB-FIP (1990) CEB-FIP Model Code. Comite Euro-
International du Beton, 1993
5. Commission for the European Communities (2005) Euro-
code 2: design of concrete structures—Part 1: general rules
and rules for buildings, EN 1992-1-1
6. Cladera A, Marı AR (2005) Experimental study on high-
strength concrete beams failing in shear. Eng Struct 27(10):
1519–1527
7. Duthinh D (1999) Sensitivity of shear strength of reinforced
concrete and prestressed concrete beams to shear friction
and concrete softening according to modified compression
field theory. ACI Struct J 96(4):495–508
8. Girhammar UA (1992) Design principles for simply sup-
ported prestressed hollow core slabs. Struct Eng Rev,
Oxford, England, 4(4): 301–316
9. Hawkins NM, Ghosh SK (2006) Shear strength of hollow
core slabs. PCI J 51(1):110–115
10. Mpampatsikos V, Nascimbene R, Petrini L (2008) A critical
review of the RC frame existing building assessment pro-
cedure according to EUROCODE 8 and Italian seismic
code. J Earthq Eng 12(S1):52–82
11. Nascimbene R, Rassati GA, Wijesundara KK (2011)
Numerical simulation of gusset-plate connections with
rectangular hollow section shape brace under quasi-static
cyclic loading. J Constr Steel Res 70:177–189
12. Pajari M (1989) Design of prestressed hollow core slabs.
Research Report 657, VTT Building and Transport, Finland
13. Pajari M (2005) Resistance of prestressed hollow core slabs
against web shear failure. Research Notes 1292, VTT
Building and Transport, Finland
14. Palmer KD, Schultz AE (2011) Experimental investigation
of the web-shear strength of deep hollow-core units. PCI J
56(4):83–104
15. Santagati S, Bolognini D, Nascimbene R (2012) Strain life
analysis at low cycle fatigue on concentrically braced steel
structures with RHS shape braces. J Earthq Eng 16(S1):
107–137
16. Selby RG, Vecchio FJ (1993) Three-dimensional constitu-
tive relations for reinforced concrete, Technical Report
93–02, University of Toronto, Department Civil Engineer-
ing Toronto, Canada
17. Shahawy MA, Issa M, Batchelor BD (1992) Strand transfer
lengths in full scale AASHTO prestressed concrete girders.
PCI J 37(3):84–96
18. Thorenfeldt E, Tomaszewicz A, Jensen JJ (1987) Mechan-
ical properties of high-strength concrete and applications in
design. In: Proceedings symposium utilization of high-
strength concrete, Trondheim, Norway, Tapir
19. Vecchio FJ, Collins MP (1986) The modified compression
field theory for reinforced concrete elements subjected to
shear. ACI Struct J 83(22):219–231
20. Vecchio FJ, Collins MP (1993) Compression response of
cracked reinforced concrete. J Struct Eng ASCE 119(12):
3590–3610
21. Walraven JC, Mercx WPM (1983) The bearing capacity of
prestressed hollow core slabs. Heron, 28(3), p. 46
1520 Materials and Structures (2015) 48:1503–1521

22. Wijesundara KK, Bolognini D, Nascimbene R, Calvi GM
(2009) Review of design parameters of concentrically
braced frames with RHS shape braces. J Earthq Eng 13(S1):
109–131
23. Yang L (1994) Design of prestressed hollow core slabs with
reference to web shear failure. J Struct Eng ASCE 120(9):
2675–2696
Materials and Structures (2015) 48:1503–1521 1521
Top Related
Copyright © 2022 FDOKUMEN

