


Bahasa
Halaman
Hukum


1908 IEEE TRANSACTIONS ON GEOSCIENCE AND REMOTE SENSING, VOL. 44, NO. 7, JULY 2006
Evaluation of Remote Sensing Based TerrestrialProductivity From MODIS Using Regional
Tower Eddy Flux Network ObservationsFaith Ann Heinsch, Maosheng Zhao, Steven W. Running, John S. Kimball, Ramakrishna R. Nemani,
Kenneth J. Davis, Paul V. Bolstad, Bruce D. Cook, Ankur R. Desai, Daniel M. Ricciuto, Beverly E. Law,Walter C. Oechel, Hyojung Kwon, Hongyan Luo, Steven C. Wofsy, Allison L. Dunn, J. William Munger,
Dennis D. Baldocchi, Liukang Xu, David Y. Hollinger, Andrew D. Richardson, Paul C. Stoy, Mario B. S. Siqueira,Russell K. Monson, Sean P. Burns, and Lawrence B. Flanagan
Abstract—The Moderate Resolution Spectroradiometer(MODIS) sensor has provided near real-time estimates of grossprimary production (GPP) since March 2000. We compare fouryears (2000 to 2003) of satellite-based calculations of GPP withtower eddy CO2 flux-based estimates across diverse land covertypes and climate regimes. We examine the potential error contri-butions from meteorology, leaf area index (LAI)/fPAR, and landcover. The error between annual GPP computed from NASA’sData Assimilation Office’s (DAO) and tower-based meteorology is28%, indicating that NASA’s DAO global meteorology plays an im-portant role in the accuracy of the GPP algorithm. Approximately62% of MOD15-based estimates of LAI were within the estimatesbased on field optical measurements, although remaining values
Manuscript received October 1, 2004; revised April 25, 2005. This workwas supported in part by the U.S. National Aeronautics and Space Administra-tion (NASA) Earth Science Enterprise under MODIS Contract NAS5-31368.Eddy covariance flux tower sites are part of both the AmeriFlux and Fluxnetnetworks and are funded through a number of agencies, including the Depart-ment of Energy (DOE), the National Institute for Global Environmental Change(NIGEC), and NASA.
F. A. Heinsch, M. Zhao, S. W. Running, and J. S. Kimball are withThe University of Montana, Missoula, MT 59812 USA (e-mail: [email protected]).
R. R. Nemani was with The University of Montana, Missoula, MT 59812USA. He is now with NASA’s Ames Research Center, Moffett Field, CA 94035USA.
K. J. Davis, A. R. Desai, and D. M. Ricciuto are with The Pennsylvania StateUniversity, State College, PA 16804 USA.
P. V. Bolstad and B. D. Cook are with the University of Minnesota, St. Paul,MN 55108 USA.
B. E. Law is with Oregon State University, Corvallis, OR 97331 USA.W. C. Oechel and H. Luo are with San Diego State University, San Diego,
CA 92182 USA.H. Kwon was with San Diego State University, San Diego, CA 92182 USA.
She is now with The University of Wyoming, Laramie, WY 82071 USA.S. C. Wofsy, A. L. Dunn, and J. W. Munger are with Harvard University,
Cambridge, MA 02138 USA.D. D. Baldocchi is with the University of California at Berkeley, Berkeley,
CA 94720 USA.L. Xu was with the University of California at Berkeley, Berkeley, CA 94720
USA. He is now with LI-COR Biosciences, Lincoln, NE 68504 USA.D. Y. Hollinger is with the USDA Forest Service Northeast Research Station,
Durham, NH 03824 USA.A. D. Richardson is with the University of New Hampshire, Durham, NH
03824.P. C. Stoy and M. B. S. Siqueira are with Duke University, Durham, NC 27708
USA.R. K. Monson and S. P. Burns are with the University of Colorado, Boulder,
CO 80309 USA.L. B. Flanagan is with the University of Lethbridge, Lethbridge, AB T1K
3M4 Canada.Digital Object Identifier 10.1109/TGRS.2005.853936
overestimated site values. Land cover presented the fewest errors,with most errors within the forest classes, reducing potentialerror. Tower-based and MODIS estimates of annual GPP comparefavorably for most biomes, although MODIS GPP overestimatestower-based calculations by 20%–30%. Seasonally, summerestimates of MODIS GPP are closest to tower data, and springestimates are the worst, most likely the result of the relativelyrapid onset of leaf-out. The results of this study indicate, however,that the current MODIS GPP algorithm shows reasonable spatialpatterns and temporal variability across a diverse range of biomesand climate regimes. So, while continued efforts are needed toisolate particular problems in specific biomes, we are optimisticabout the general quality of these data, and continuation of theMOD17 GPP product will likely provide a key component ofglobal terrestrial ecosystem analysis, providing continuous weeklymeasurements of global vegetation production.
Index Terms—AmeriFlux, CO2 eddy covariance flux [netecosystem exchange (NEE)], gross primary production (GPP),Moderate Resolution Imaging Spectroradiometer (MODIS),remote sensing, Terra.
I. INTRODUCTION
GLOBAL climate change is a topic of vital importance tometeorological and ecological science communities and
policy makers. According to the IPCC [1], atmospheric carbondioxide concentration has risen by 31% since 1750, largely dueto human activities such as fossil fuel burning and deforestation.Additionally, it is impossible to account for associated climatechange, such as increases in air temperature without consideringthe effects of human activity on the carbon cycle [2]. However,atmospheric CO concentrations have not risen as high as ex-pected once all of the known sources and sinks are taken intoaccount [3]. It is hypothesized that much of this “missing” COis being sequestered by terrestrial vegetation, and that the terres-trial biosphere, particularly mid-latitude forests, can sequestersignificant amounts of carbon [3]–[5]. While the magnitude ofthe net terrestrial carbon uptake is uncertain and varies inter-annually by a factor or two or more, the process of carbon se-questration correlates with global-scale climate variations [1],[5]–[7]. A scientific understanding of these processes in the con-text of the entire Earth system is important for the develop-ment of a sustainable life support system, and change in terres-trial biological activity is likely one of the “most fundamental
0196-2892/$20.00 © 2006 IEEE
HEINSCH et al.: TERRESTRIAL PRODUCTIVITY FROM MODIS 1909
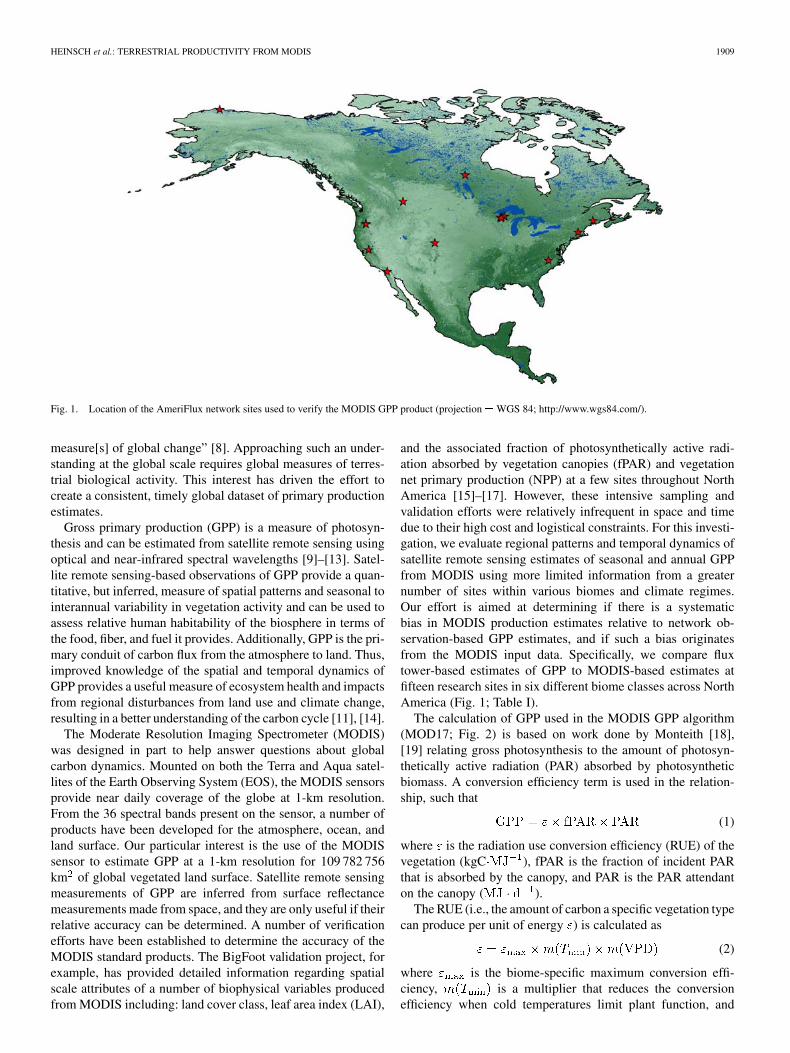
Fig. 1. Location of the AmeriFlux network sites used to verify the MODIS GPP product (projection =WGS 84; http://www.wgs84.com/).
measure[s] of global change” [8]. Approaching such an under-standing at the global scale requires global measures of terres-trial biological activity. This interest has driven the effort tocreate a consistent, timely global dataset of primary productionestimates.
Gross primary production (GPP) is a measure of photosyn-thesis and can be estimated from satellite remote sensing usingoptical and near-infrared spectral wavelengths [9]–[13]. Satel-lite remote sensing-based observations of GPP provide a quan-titative, but inferred, measure of spatial patterns and seasonal tointerannual variability in vegetation activity and can be used toassess relative human habitability of the biosphere in terms ofthe food, fiber, and fuel it provides. Additionally, GPP is the pri-mary conduit of carbon flux from the atmosphere to land. Thus,improved knowledge of the spatial and temporal dynamics ofGPP provides a useful measure of ecosystem health and impactsfrom regional disturbances from land use and climate change,resulting in a better understanding of the carbon cycle [11], [14].
The Moderate Resolution Imaging Spectrometer (MODIS)was designed in part to help answer questions about globalcarbon dynamics. Mounted on both the Terra and Aqua satel-lites of the Earth Observing System (EOS), the MODIS sensorsprovide near daily coverage of the globe at 1-km resolution.From the 36 spectral bands present on the sensor, a number ofproducts have been developed for the atmosphere, ocean, andland surface. Our particular interest is the use of the MODISsensor to estimate GPP at a 1-km resolution for 109 782 756km of global vegetated land surface. Satellite remote sensingmeasurements of GPP are inferred from surface reflectancemeasurements made from space, and they are only useful if theirrelative accuracy can be determined. A number of verificationefforts have been established to determine the accuracy of theMODIS standard products. The BigFoot validation project, forexample, has provided detailed information regarding spatialscale attributes of a number of biophysical variables producedfrom MODIS including: land cover class, leaf area index (LAI),
and the associated fraction of photosynthetically active radi-ation absorbed by vegetation canopies (fPAR) and vegetationnet primary production (NPP) at a few sites throughout NorthAmerica [15]–[17]. However, these intensive sampling andvalidation efforts were relatively infrequent in space and timedue to their high cost and logistical constraints. For this investi-gation, we evaluate regional patterns and temporal dynamics ofsatellite remote sensing estimates of seasonal and annual GPPfrom MODIS using more limited information from a greaternumber of sites within various biomes and climate regimes.Our effort is aimed at determining if there is a systematicbias in MODIS production estimates relative to network ob-servation-based GPP estimates, and if such a bias originatesfrom the MODIS input data. Specifically, we compare fluxtower-based estimates of GPP to MODIS-based estimates atfifteen research sites in six different biome classes across NorthAmerica (Fig. 1; Table I).
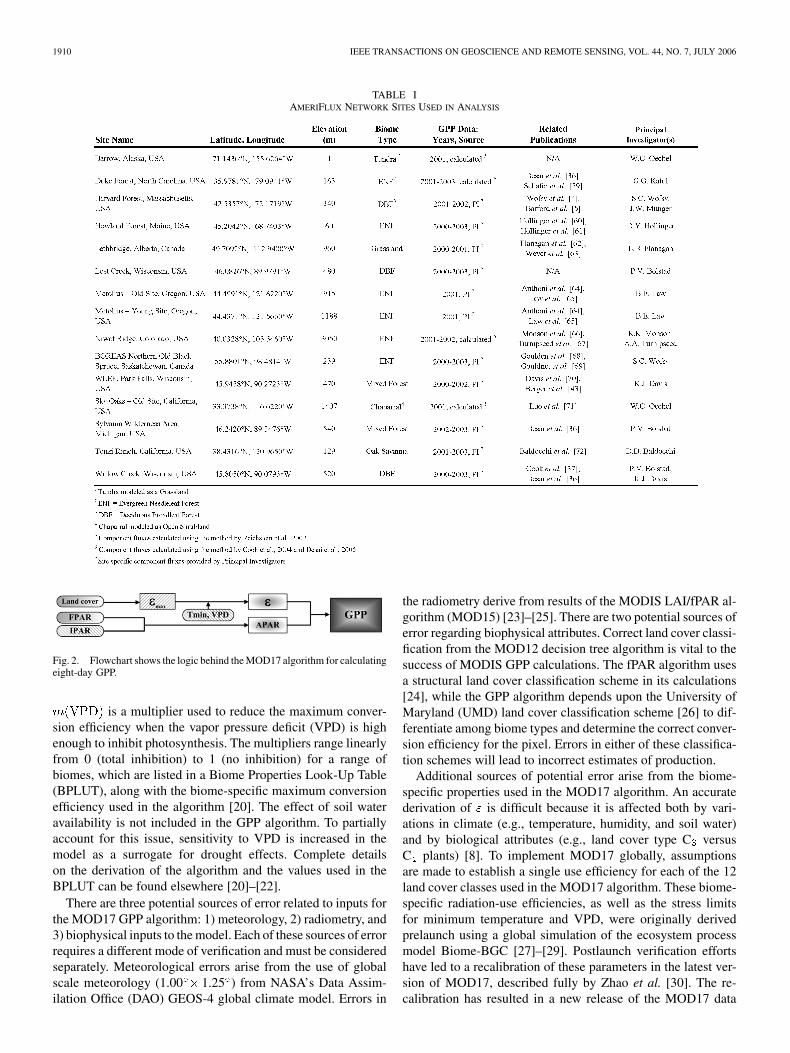
The calculation of GPP used in the MODIS GPP algorithm(MOD17; Fig. 2) is based on work done by Monteith [18],[19] relating gross photosynthesis to the amount of photosyn-thetically active radiation (PAR) absorbed by photosyntheticbiomass. A conversion efficiency term is used in the relation-ship, such that
(1)
where is the radiation use conversion efficiency (RUE) of thevegetation (kgC ), fPAR is the fraction of incident PARthat is absorbed by the canopy, and PAR is the PAR attendanton the canopy ( ).
The RUE (i.e., the amount of carbon a specific vegetation typecan produce per unit of energy ) is calculated as
(2)
where is the biome-specific maximum conversion effi-ciency, is a multiplier that reduces the conversionefficiency when cold temperatures limit plant function, and
1910 IEEE TRANSACTIONS ON GEOSCIENCE AND REMOTE SENSING, VOL. 44, NO. 7, JULY 2006
TABLE IAMERIFLUX NETWORK SITES USED IN ANALYSIS
Fig. 2. Flowchart shows the logic behind the MOD17 algorithm for calculatingeight-day GPP.
is a multiplier used to reduce the maximum conver-sion efficiency when the vapor pressure deficit (VPD) is highenough to inhibit photosynthesis. The multipliers range linearlyfrom 0 (total inhibition) to 1 (no inhibition) for a range ofbiomes, which are listed in a Biome Properties Look-Up Table(BPLUT), along with the biome-specific maximum conversionefficiency used in the algorithm [20]. The effect of soil wateravailability is not included in the GPP algorithm. To partiallyaccount for this issue, sensitivity to VPD is increased in themodel as a surrogate for drought effects. Complete detailson the derivation of the algorithm and the values used in theBPLUT can be found elsewhere [20]–[22].
There are three potential sources of error related to inputs forthe MOD17 GPP algorithm: 1) meteorology, 2) radiometry, and3) biophysical inputs to the model. Each of these sources of errorrequires a different mode of verification and must be consideredseparately. Meteorological errors arise from the use of globalscale meteorology (1.00 1.25 ) from NASA’s Data Assim-ilation Office (DAO) GEOS-4 global climate model. Errors in
the radiometry derive from results of the MODIS LAI/fPAR al-gorithm (MOD15) [23]–[25]. There are two potential sources oferror regarding biophysical attributes. Correct land cover classi-fication from the MOD12 decision tree algorithm is vital to thesuccess of MODIS GPP calculations. The fPAR algorithm usesa structural land cover classification scheme in its calculations[24], while the GPP algorithm depends upon the University ofMaryland (UMD) land cover classification scheme [26] to dif-ferentiate among biome types and determine the correct conver-sion efficiency for the pixel. Errors in either of these classifica-tion schemes will lead to incorrect estimates of production.
Additional sources of potential error arise from the biome-specific properties used in the MOD17 algorithm. An accuratederivation of is difficult because it is affected both by vari-ations in climate (e.g., temperature, humidity, and soil water)and by biological attributes (e.g., land cover type C versusC plants) [8]. To implement MOD17 globally, assumptionsare made to establish a single use efficiency for each of the 12land cover classes used in the MOD17 algorithm. These biome-specific radiation-use efficiencies, as well as the stress limitsfor minimum temperature and VPD, were originally derivedprelaunch using a global simulation of the ecosystem processmodel Biome-BGC [27]–[29]. Postlaunch verification effortshave led to a recalibration of these parameters in the latest ver-sion of MOD17, described fully by Zhao et al. [30]. The re-calibration has resulted in a new release of the MOD17 data
HEINSCH et al.: TERRESTRIAL PRODUCTIVITY FROM MODIS 1911
(Collection 4.5; C4.5), which is the basis for this investiga-tion. Finally, we assume that nutrient constraints on vegetationgrowth such as nitrogen stress are quantified by limiting canopyleaf area. While this assumption is not entirely accurate [31],spectral reflectances are somewhat sensitive to leaf chemistry,and MODIS-derived LAI and fPAR may partially assess differ-ences in leaf nitrogen content.
II. MATERIALS AND METHODS
This investigation focuses on error contributions from mete-orology, land cover, and the MOD15 LAI/fPAR algorithm only.Additional error sources may be due to uncertainties in the eco-physiological assumptions of the BPLUT, but these require fur-ther investigation.
A. Meteorological Data
Site meteorological data were obtained directly from partici-pating site researchers or were downloaded from the AmeriFluxnetwork website (public.ornl.gov/ameriflux). Half-hourly orhourly data consisting of air temperature ( , C); precipi-tation (PPT, cm); either PAR ( mol m s ) or incomingshortwave radiation ( , m ); and either relativehumidity (RH, %) or VPD, Pa were used in this analysis. Fromthese data, we obtained daily maximum air temperature ( ,C), minimum air temperature ( , C), average daytime
temperature ( , C), daytime average VPD ( ,Pa), and total (assuming ,
m ).Direct inputs to the MODIS GPP algorithm include ,
, , and , which were obtained fromNASA’s Data Assimilation Office (DAO, polar.gsfc.nasa.gov)GEOS-4 global climate model at a 1.00 1.25 resolution[32], [33]. Daily data for each pixel were first compiled fromthree-hour data and then interpolated using a nonlinear interpo-lation scheme based on the four nearest DAO cells [30].
B. Eddy Covariance CO Flux and Site Data
For this effort, we relied heavily upon members of theAmeriFlux community to provide ground-based measurementsof the net ecosystem exchange (NEE) of CO between the bio-sphere and the atmosphere, as well as LAI measurements andvegetation cover types. The NEE measurements are used withlocal meteorological measurements to estimate GPP for fifteenindividual sites (38 site years) in North America (Table I).AmeriFlux is a regional network of sites making microme-teorological, meteorological and biological measurements indifferent biomes of North and South America [34]. To ascertainthe quality of a global product, it is necessary to verify theproduct under many different scenarios, in this case, differingvegetation types and climate regimes. Many of the selectedsites are forest ecosystems with widely disparate climate. Anumber of these forests are boreal and transitional forests ofdiverse species composition, including hardwoods, conifersand mixed forest with dissimilar soils and hydrologic patterns.Other forests include a subalpine forest and a warm-temperateplanted pine forest. Additional biomes represented in this studyinclude artic tundra, northern grassland, oak savanna, and
chaparral. Climate regimes range from the northern arctic tomid-continent boreal and transition areas, as well as temperateand Mediterranean climates.
Available NEE estimates were obtained for the years 2000to 2003 (Table I). Many site investigators provided site-specificestimates of the component fluxes [GPP and ecosystem respi-ration (Reco)]. GPP and Reco were estimated for several addi-tional sites using a method that accounts for seasonal changes inthe temperature sensitivity of ecosystem respiration using NEE,canopy CO storage, air and soil temperatures, VPD, and in-coming shortwave radiation [35]. Estimates of GPP and Recofor the Duke Forest site were obtained using the method createdfor the Chequamegon Ecosystem Atmosphere Study (ChEAS)study sites (WLEF, Lost Creek, Sylvania, Willow Creek) [36],[37]. This method is a slight modification of the method used byFalge et al. [38], and Reco and GPP are modeled using responsefunctions based on soil temperature and PAR.
Site-specific LAI data were obtained from the literature,the AmeriFlux website, and site investigators. In general, onlyaverage maximum LAI measurements were available for thesites. Where possible, annual measurements corresponding tothe time of the MODIS estimates were obtained. Otherwise,multiyear means were calculated from available data, repre-senting typical values for each site. While spatial heterogeneitywithin a 1-km MODIS cell is common [15], it is not specificallytested in this study because of the large number of sites andlimited datasets available.
C. MODIS Data
The verification exercise is based on Collection 4.5 (C4.5)MODIS GPP (MOD17) data, available from the NTSG anony-mous ftp site (ftp.ntsg.umt.edu/pub/MODIS). Using the latitudeand longitude provided by the investigators, ASCII subsetsfor many of the MODIS land products are created at the OakRidge National Laboratory (ORNL) Distributed Active ArchiveCenter (DAAC) (www.modis.ornl.gov/modis/index.cfm). Weobtained 7 7 km cutouts centered over each eddy covarianceflux tower location representing:
1) land cover classification (MOD12Q1, C3);2) LAI and fraction of absorbed PAR (fPAR) (MOD15A2,
C4);3) GPP (MOD17A2, C4.5).The MODIS Collection 3 (C3) land cover classification [39]
is used in the Collection 4 (C4) LAI/fPAR and Collection 4.5(C4.5) MODIS GPP calculations. While the Collection 4 landcover dataset has been recently released and is a significant im-provement over the Collection 3 (C3) dataset [40], this analysisis restricted to the C3 MOD12 land cover classification dataset.There are two separate land cover classification schemes usedin the calculation of GPP. First, the MOD15 (LAI/fPAR) al-gorithm uses the MOD12Q1 Land Cover Classification Type 3(LAI/fPAR biome scheme) [24], [41]. The MOD17 algorithmuses the University of Maryland (UMD) land cover classifica-tion (MOD12Q1 Land Cover Classification Type 2 [26]). Er-rors in classifying either or both of these land cover types willpropagate to the MOD17 algorithm, resulting in erroneous GPPoutputs.
1912 IEEE TRANSACTIONS ON GEOSCIENCE AND REMOTE SENSING, VOL. 44, NO. 7, JULY 2006
The MOD15A2 LAI and fPAR data were subjected to a rig-orous quality check in which only those pixels that were of goodquality according to the MOD15A2 quality assurance productand that used the primary radiative transfer algorithm were ac-cepted [25]. Average eight-day LAI and fPAR were calculatedseparately for each land cover type found within a 7 7 km grid.Linear interpolation was used to fill data gaps in the LAI andfPAR as in the official C4.5 product [30]. Eight-day mean, totalseasonal, and total annual values of GPP were calculated foreach 7 7 km subset (49 pixels) and used for comparison withsite estimates of GPP. MODIS data collection began on Day 56of 2000. Therefore, to have four complete years of data, averageLAI and fPAR were calculated from the 2001 to 2003 data andused to simulate GPP estimates for January–February 2000.
Gaps within the MOD15 LAI and fPAR data were filled vialinear interpolation. An average of 15 ( ) eight-day averages(out of a possible 46) were missing during each site year witha median gap size of 6 ( at Barrow, AK; atnumerous sites). During March 30–October 15, there were anaverage of six ( ) missing datapoints with a median gap sizeof 2 ( 10 at Harvard Forest; 0 at Lethbridge).
Once the data were compiled, we made direct comparisonsof both total annual and seasonal MOD17 GPP with tower-es-timated GPP. To elucidate the effects of meteorology on the re-sults, we used an off-line, but identical, version of the MOD17GPP algorithm to calculate the GPP for each of the land covertypes at each site using the DAO meteorology and the land-coverspecific average fPAR mentioned in the previous paragraph. Wethen created weighted averages of GPP for each site year. Wereplaced the DAO meteorology with tower meteorology and fol-lowed the same procedure to obtain estimates of GPP based onthe local site environment. Use of the off–line algorithm ensuredthat the only variant in the input data was the meteorology.
D. Analytical Methods
All datasets were tested for normality using the Shapiro-Wilkes normality test. Pearson’s correlation analysis ( ) wasused when the data were normal, and the confidence limits(CL) surrounding were calculated as
(3)
where is the number of samples used in the analysis andis the Student t-statistic. When the data were not normally dis-tributed, a paired two-sided t-test was used, as it is more robustto the assumption of normality. In both cases, data were consid-ered statistically significant when . When data weresubset, such as the biome-specific data, a Bonferroni correctionwas applied, and data were considered statistically significantwhen . Finally, a relative error term ( , %) wascalculated for each comparison, such that
(4)
III. RESULTS
A. Annual GPP (MOD17, C4.5)
The most recent release of MOD17 data (C4.5) was comparedwith flux tower estimates of annual GPP (Table II). There is afairly strong correlation between the MOD17 standard productand tower estimates of annual GPP ( ), butMOD17 tends to overestimate tower GPP for most sites (
). For the most productive sites, however, MOD17 underes-timates tower GPP. Potential errors associated with the MOD17algorithm were described in the introduction and are covered in-dividually as follows.
B. Meteorology (DAO)
The NASA DAO global meteorology used with MODISspectral data to derive GPP is obtained at relatively coarse(1.00 1.25 ) spatial scales. The DAO-based MOD17 algo-rithm results (DAO-based GPP), using the off-line calculationsof fPAR, produced an mean annual GPP of 1039 gC m[Fig. 3(a); Table II], nearly identical to results from the standardproduct. Differences are attributed to the averaging techniqueused in the analysis. The remaining comparisons in this paperwill be made against these data as they are directly compa-rable to calculations made with tower meteorology. Theseresults also have good correlation with annual tower GPP (996gC m ; ). The DAO-based dataconsistently overestimated local tower-based estimates, witha relative error of 19%. Use of local tower meteorology inthe MOD17 algorithm [Fig. 3(b); Table II] reduced correla-tion when compared with tower network-based GPP results( ), but also reduced ( ). Underes-timation of tower GPP increased at the most productive site(Duke Forest), indicating that there are several factors affectingGPP estimates at this site.
Overall, the arithmetic mean difference between DAO andtower meteorology based GPP results is , indi-cating that the DAO meteorology plays an important role inthe accuracy of the GPP algorithm, and that this role is sitespecific (Fig. 4). Minimum daily temperatures are significantlydifferent from local measurements at both the Tonzi Ranchsite ( ) and the Niwot Ridge site ( ). On anannual basis, minimum daily temperatures are overestimated atthe Tonzi Ranch site ( ) and underestimated at theNiwot Ridge site ( ). The mean annual daytimeVPD is generally underestimated by the DAO meteorology[Fig. 4(c) and (f)] at both Niwot Ridge, the humid subalpinesite ( ), and dry sites, such as Metolius and TonziRanch ( ), although this trend is more apparent at thedry sites, particularly during the summer months [Summer
; Fig. 4(f)]. Radiation tends to be well represented,but localized cloud cover results in substantial day-to-dayvariability in the results, which can cause significant discrep-ancies between the DAO and tower meteorology at both sites( ). Variability in radiation is greater at the TonziRanch site ( ) than the Niwot Ridge site ( ).
The effect of meteorology varies by biome type and site(Figs. 1 and 3 and Table III). There are only two biomes asclassified by the C3 MOD12 land cover classification with
HEINSCH et al.: TERRESTRIAL PRODUCTIVITY FROM MODIS 1913
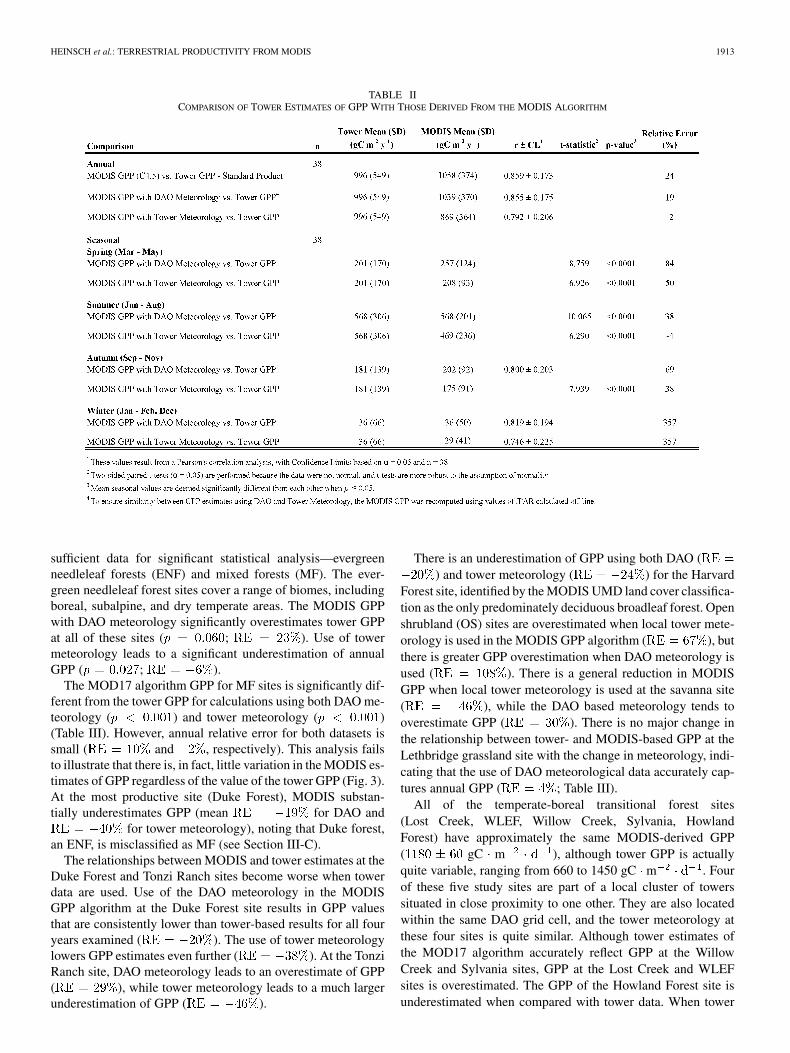
TABLE IICOMPARISON OF TOWER ESTIMATES OF GPP WITH THOSE DERIVED FROM THE MODIS ALGORITHM
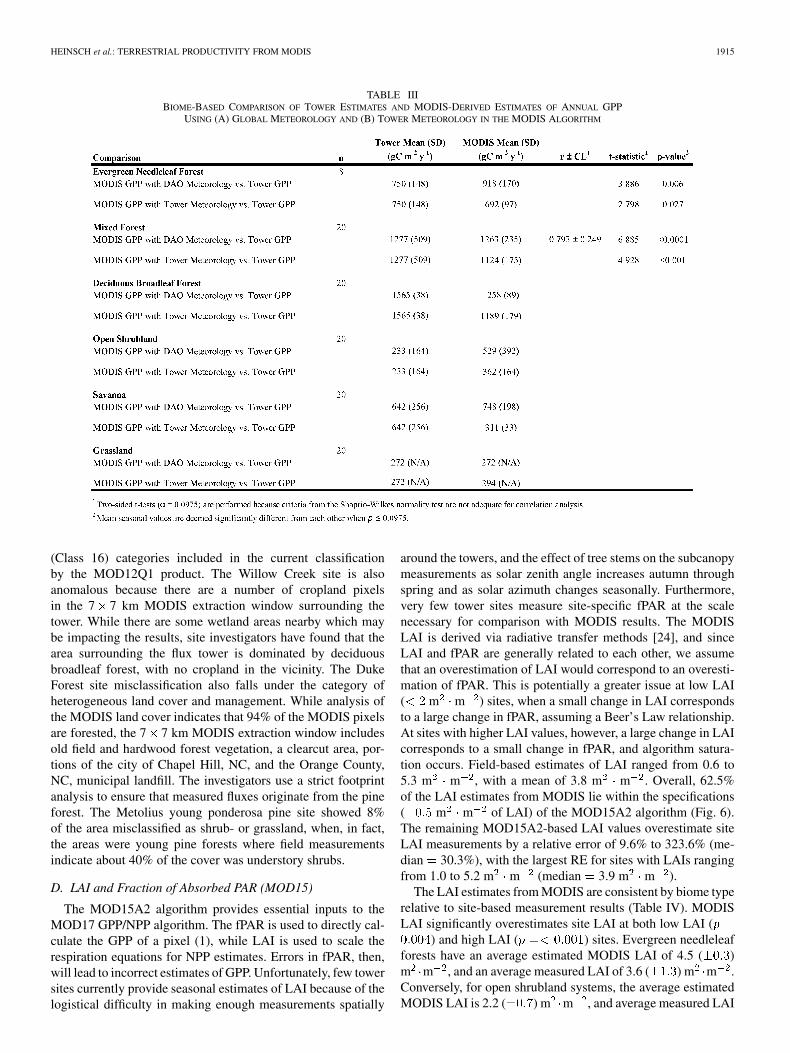
sufficient data for significant statistical analysis—evergreenneedleleaf forests (ENF) and mixed forests (MF). The ever-green needleleaf forest sites cover a range of biomes, includingboreal, subalpine, and dry temperate areas. The MODIS GPPwith DAO meteorology significantly overestimates tower GPPat all of these sites ( ; ). Use of towermeteorology leads to a significant underestimation of annualGPP ( ; ).
The MOD17 algorithm GPP for MF sites is significantly dif-ferent from the tower GPP for calculations using both DAO me-teorology ( ) and tower meteorology ( )(Table III). However, annual relative error for both datasets issmall ( and , respectively). This analysis failsto illustrate that there is, in fact, little variation in the MODIS es-timates of GPP regardless of the value of the tower GPP (Fig. 3).At the most productive site (Duke Forest), MODIS substan-tially underestimates GPP (mean for DAO and
for tower meteorology), noting that Duke forest,an ENF, is misclassified as MF (see Section III-C).
The relationships between MODIS and tower estimates at theDuke Forest and Tonzi Ranch sites become worse when towerdata are used. Use of the DAO meteorology in the MODISGPP algorithm at the Duke Forest site results in GPP valuesthat are consistently lower than tower-based results for all fouryears examined ( ). The use of tower meteorologylowers GPP estimates even further ( ). At the TonziRanch site, DAO meteorology leads to an overestimate of GPP( ), while tower meteorology leads to a much largerunderestimation of GPP ( ).
There is an underestimation of GPP using both DAO () and tower meteorology ( ) for the Harvard
Forest site, identified by the MODIS UMD land cover classifica-tion as the only predominately deciduous broadleaf forest. Openshrubland (OS) sites are overestimated when local tower mete-orology is used in the MODIS GPP algorithm ( ), butthere is greater GPP overestimation when DAO meteorology isused ( ). There is a general reduction in MODISGPP when local tower meteorology is used at the savanna site( ), while the DAO based meteorology tends tooverestimate GPP ( ). There is no major change inthe relationship between tower- and MODIS-based GPP at theLethbridge grassland site with the change in meteorology, indi-cating that the use of DAO meteorological data accurately cap-tures annual GPP ( ; Table III).
All of the temperate-boreal transitional forest sites(Lost Creek, WLEF, Willow Creek, Sylvania, HowlandForest) have approximately the same MODIS-derived GPP( gC m ), although tower GPP is actuallyquite variable, ranging from 660 to 1450 gC m . Fourof these five study sites are part of a local cluster of towerssituated in close proximity to one other. They are also locatedwithin the same DAO grid cell, and the tower meteorology atthese four sites is quite similar. Although tower estimates ofthe MOD17 algorithm accurately reflect GPP at the WillowCreek and Sylvania sites, GPP at the Lost Creek and WLEFsites is overestimated. The GPP of the Howland Forest site isunderestimated when compared with tower data. When tower
1914 IEEE TRANSACTIONS ON GEOSCIENCE AND REMOTE SENSING, VOL. 44, NO. 7, JULY 2006
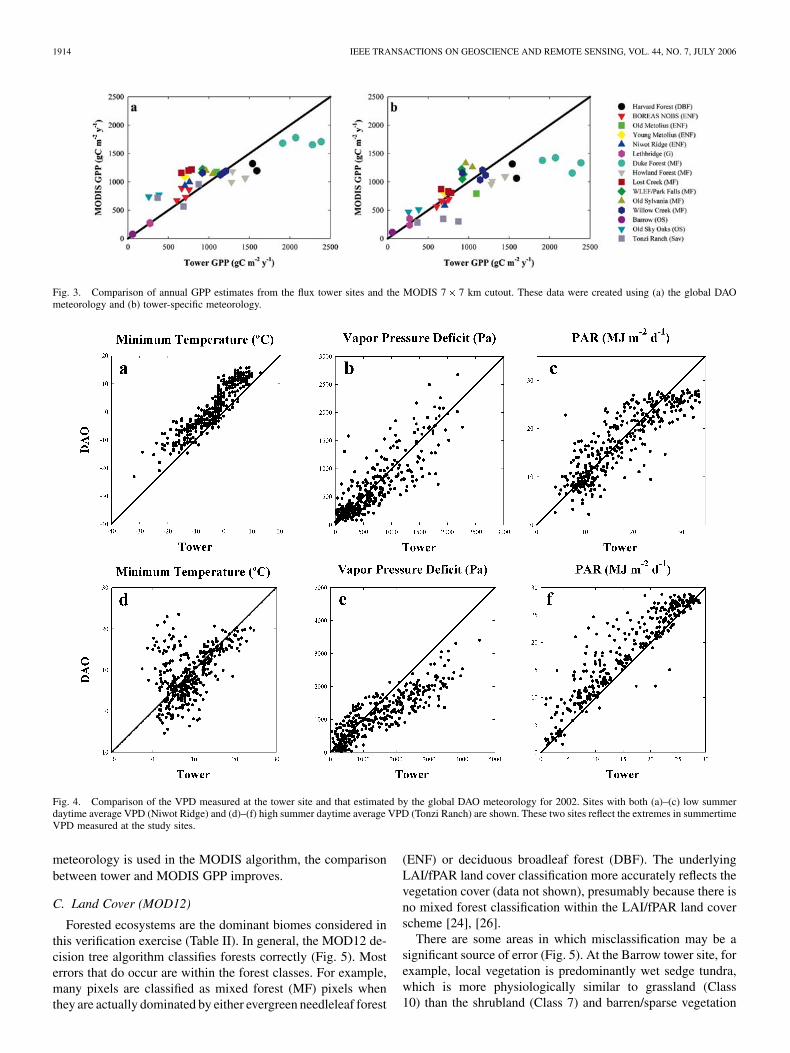
Fig. 3. Comparison of annual GPP estimates from the flux tower sites and the MODIS 7� 7 km cutout. These data were created using (a) the global DAOmeteorology and (b) tower-specific meteorology.
Fig. 4. Comparison of the VPD measured at the tower site and that estimated by the global DAO meteorology for 2002. Sites with both (a)–(c) low summerdaytime average VPD (Niwot Ridge) and (d)–(f) high summer daytime average VPD (Tonzi Ranch) are shown. These two sites reflect the extremes in summertimeVPD measured at the study sites.
meteorology is used in the MODIS algorithm, the comparisonbetween tower and MODIS GPP improves.
C. Land Cover (MOD12)
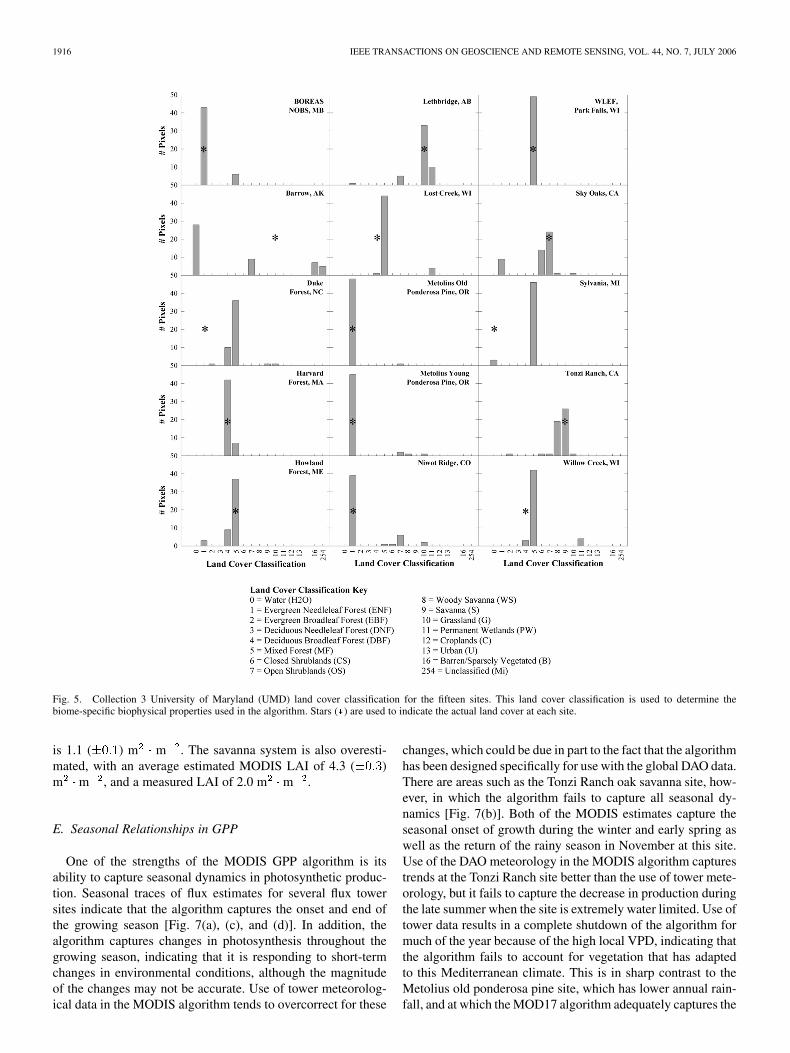
Forested ecosystems are the dominant biomes considered inthis verification exercise (Table II). In general, the MOD12 de-cision tree algorithm classifies forests correctly (Fig. 5). Mosterrors that do occur are within the forest classes. For example,many pixels are classified as mixed forest (MF) pixels whenthey are actually dominated by either evergreen needleleaf forest
(ENF) or deciduous broadleaf forest (DBF). The underlyingLAI/fPAR land cover classification more accurately reflects thevegetation cover (data not shown), presumably because there isno mixed forest classification within the LAI/fPAR land coverscheme [24], [26].
There are some areas in which misclassification may be asignificant source of error (Fig. 5). At the Barrow tower site, forexample, local vegetation is predominantly wet sedge tundra,which is more physiologically similar to grassland (Class10) than the shrubland (Class 7) and barren/sparse vegetation
HEINSCH et al.: TERRESTRIAL PRODUCTIVITY FROM MODIS 1915
TABLE IIIBIOME-BASED COMPARISON OF TOWER ESTIMATES AND MODIS-DERIVED ESTIMATES OF ANNUAL GPP
USING (A) GLOBAL METEOROLOGY AND (B) TOWER METEOROLOGY IN THE MODIS ALGORITHM
(Class 16) categories included in the current classificationby the MOD12Q1 product. The Willow Creek site is alsoanomalous because there are a number of cropland pixelsin the 7 7 km MODIS extraction window surrounding thetower. While there are some wetland areas nearby which maybe impacting the results, site investigators have found that thearea surrounding the flux tower is dominated by deciduousbroadleaf forest, with no cropland in the vicinity. The DukeForest site misclassification also falls under the category ofheterogeneous land cover and management. While analysis ofthe MODIS land cover indicates that 94% of the MODIS pixelsare forested, the 7 7 km MODIS extraction window includesold field and hardwood forest vegetation, a clearcut area, por-tions of the city of Chapel Hill, NC, and the Orange County,NC, municipal landfill. The investigators use a strict footprintanalysis to ensure that measured fluxes originate from the pineforest. The Metolius young ponderosa pine site showed 8%of the area misclassified as shrub- or grassland, when, in fact,the areas were young pine forests where field measurementsindicate about 40% of the cover was understory shrubs.
D. LAI and Fraction of Absorbed PAR (MOD15)
The MOD15A2 algorithm provides essential inputs to theMOD17 GPP/NPP algorithm. The fPAR is used to directly cal-culate the GPP of a pixel (1), while LAI is used to scale therespiration equations for NPP estimates. Errors in fPAR, then,will lead to incorrect estimates of GPP. Unfortunately, few towersites currently provide seasonal estimates of LAI because of thelogistical difficulty in making enough measurements spatially
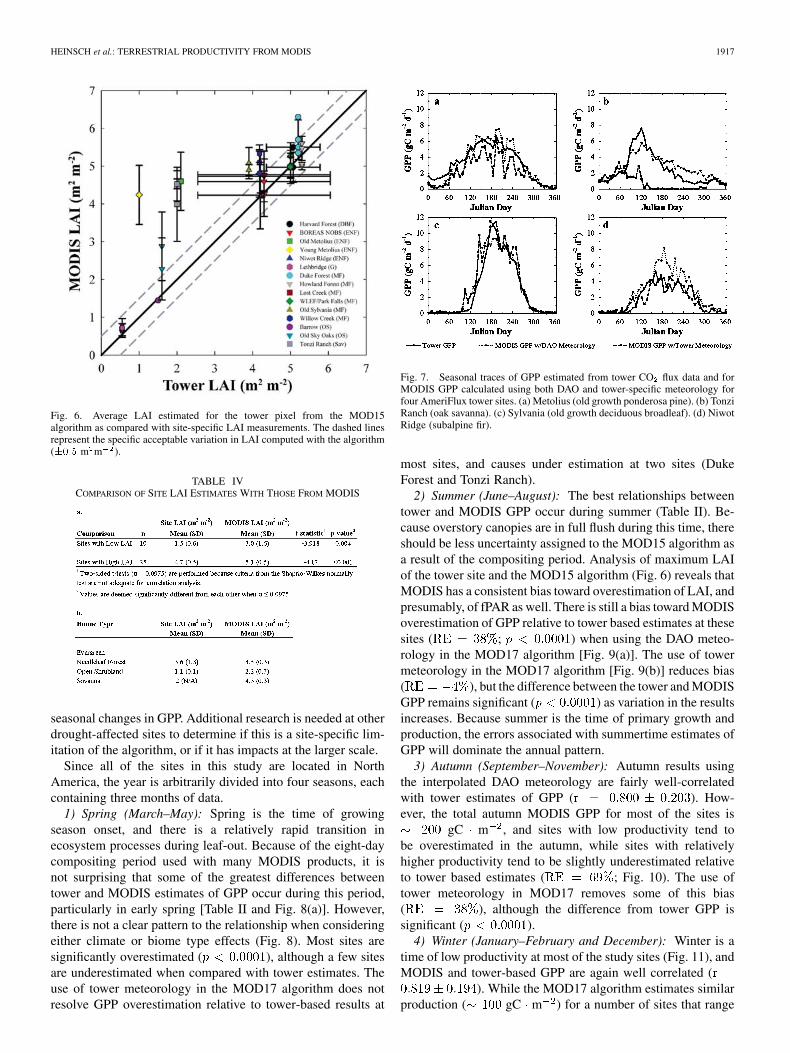
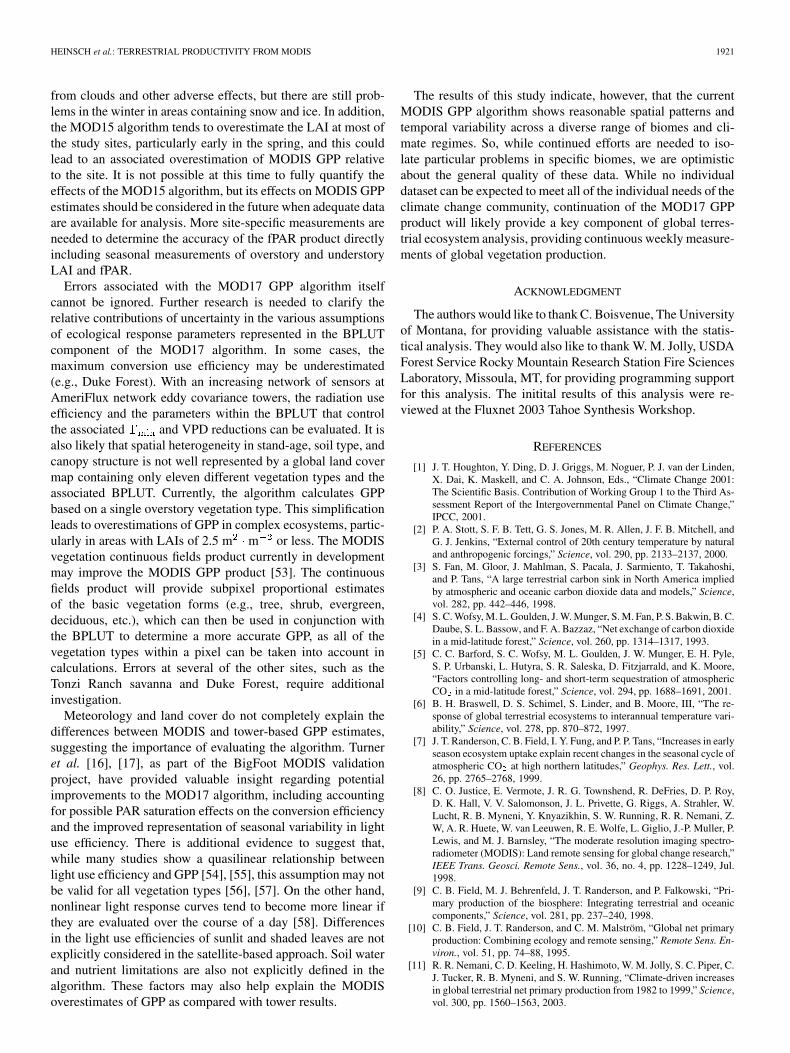
around the towers, and the effect of tree stems on the subcanopymeasurements as solar zenith angle increases autumn throughspring and as solar azimuth changes seasonally. Furthermore,very few tower sites measure site-specific fPAR at the scalenecessary for comparison with MODIS results. The MODISLAI is derived via radiative transfer methods [24], and sinceLAI and fPAR are generally related to each other, we assumethat an overestimation of LAI would correspond to an overesti-mation of fPAR. This is potentially a greater issue at low LAI( m m ) sites, when a small change in LAI correspondsto a large change in fPAR, assuming a Beer’s Law relationship.At sites with higher LAI values, however, a large change in LAIcorresponds to a small change in fPAR, and algorithm satura-tion occurs. Field-based estimates of LAI ranged from 0.6 to5.3 m m , with a mean of 3.8 m m . Overall, 62.5%of the LAI estimates from MODIS lie within the specifications( m m of LAI) of the MOD15A2 algorithm (Fig. 6).The remaining MOD15A2-based LAI values overestimate siteLAI measurements by a relative error of 9.6% to 323.6% (me-dian 30.3%), with the largest RE for sites with LAIs rangingfrom 1.0 to 5.2 m m (median 3.9 m m ).
The LAI estimates from MODIS are consistent by biome typerelative to site-based measurement results (Table IV). MODISLAI significantly overestimates site LAI at both low LAI (
) and high LAI ( ) sites. Evergreen needleleafforests have an average estimated MODIS LAI of 4.5 ( )m m , and an average measured LAI of 3.6 ( ) m m .Conversely, for open shrubland systems, the average estimatedMODIS LAI is 2.2 ( ) m m , and average measured LAI
1916 IEEE TRANSACTIONS ON GEOSCIENCE AND REMOTE SENSING, VOL. 44, NO. 7, JULY 2006
Fig. 5. Collection 3 University of Maryland (UMD) land cover classification for the fifteen sites. This land cover classification is used to determine thebiome-specific biophysical properties used in the algorithm. Stars (�) are used to indicate the actual land cover at each site.
is 1.1 ( ) m m . The savanna system is also overesti-mated, with an average estimated MODIS LAI of 4.3 ( )m m , and a measured LAI of 2.0 m m .
E. Seasonal Relationships in GPP
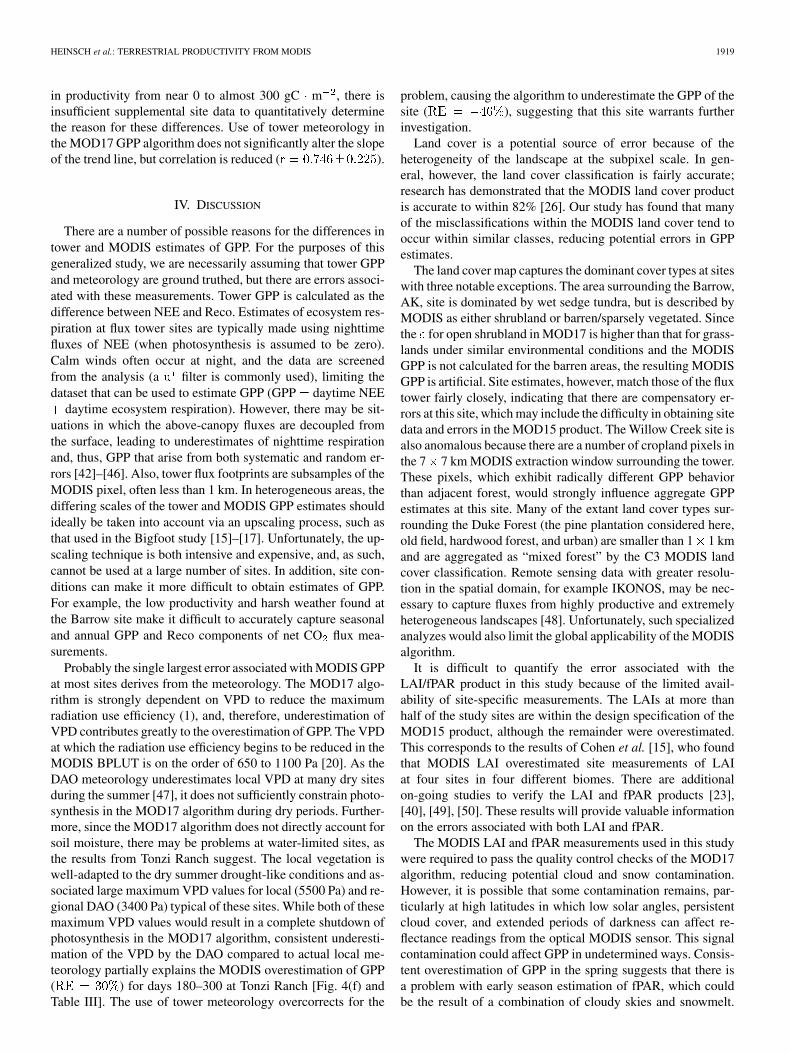
One of the strengths of the MODIS GPP algorithm is itsability to capture seasonal dynamics in photosynthetic produc-tion. Seasonal traces of flux estimates for several flux towersites indicate that the algorithm captures the onset and end ofthe growing season [Fig. 7(a), (c), and (d)]. In addition, thealgorithm captures changes in photosynthesis throughout thegrowing season, indicating that it is responding to short-termchanges in environmental conditions, although the magnitudeof the changes may not be accurate. Use of tower meteorolog-ical data in the MODIS algorithm tends to overcorrect for these
changes, which could be due in part to the fact that the algorithmhas been designed specifically for use with the global DAO data.There are areas such as the Tonzi Ranch oak savanna site, how-ever, in which the algorithm fails to capture all seasonal dy-namics [Fig. 7(b)]. Both of the MODIS estimates capture theseasonal onset of growth during the winter and early spring aswell as the return of the rainy season in November at this site.Use of the DAO meteorology in the MODIS algorithm capturestrends at the Tonzi Ranch site better than the use of tower mete-orology, but it fails to capture the decrease in production duringthe late summer when the site is extremely water limited. Use oftower data results in a complete shutdown of the algorithm formuch of the year because of the high local VPD, indicating thatthe algorithm fails to account for vegetation that has adaptedto this Mediterranean climate. This is in sharp contrast to theMetolius old ponderosa pine site, which has lower annual rain-fall, and at which the MOD17 algorithm adequately captures the
HEINSCH et al.: TERRESTRIAL PRODUCTIVITY FROM MODIS 1917
Fig. 6. Average LAI estimated for the tower pixel from the MOD15algorithm as compared with site-specific LAI measurements. The dashed linesrepresent the specific acceptable variation in LAI computed with the algorithm(�0:5 m m ).
TABLE IVCOMPARISON OF SITE LAI ESTIMATES WITH THOSE FROM MODIS
seasonal changes in GPP. Additional research is needed at otherdrought-affected sites to determine if this is a site-specific lim-itation of the algorithm, or if it has impacts at the larger scale.
Since all of the sites in this study are located in NorthAmerica, the year is arbitrarily divided into four seasons, eachcontaining three months of data.
1) Spring (March–May): Spring is the time of growingseason onset, and there is a relatively rapid transition inecosystem processes during leaf-out. Because of the eight-daycompositing period used with many MODIS products, it isnot surprising that some of the greatest differences betweentower and MODIS estimates of GPP occur during this period,particularly in early spring [Table II and Fig. 8(a)]. However,there is not a clear pattern to the relationship when consideringeither climate or biome type effects (Fig. 8). Most sites aresignificantly overestimated ( ), although a few sitesare underestimated when compared with tower estimates. Theuse of tower meteorology in the MOD17 algorithm does notresolve GPP overestimation relative to tower-based results at
Fig. 7. Seasonal traces of GPP estimated from tower CO flux data and forMODIS GPP calculated using both DAO and tower-specific meteorology forfour AmeriFlux tower sites. (a) Metolius (old growth ponderosa pine). (b) TonziRanch (oak savanna). (c) Sylvania (old growth deciduous broadleaf). (d) NiwotRidge (subalpine fir).
most sites, and causes under estimation at two sites (DukeForest and Tonzi Ranch).
2) Summer (June–August): The best relationships betweentower and MODIS GPP occur during summer (Table II). Be-cause overstory canopies are in full flush during this time, thereshould be less uncertainty assigned to the MOD15 algorithm asa result of the compositing period. Analysis of maximum LAIof the tower site and the MOD15 algorithm (Fig. 6) reveals thatMODIS has a consistent bias toward overestimation of LAI, andpresumably, of fPAR as well. There is still a bias toward MODISoverestimation of GPP relative to tower based estimates at thesesites ( ; ) when using the DAO meteo-rology in the MOD17 algorithm [Fig. 9(a)]. The use of towermeteorology in the MOD17 algorithm [Fig. 9(b)] reduces bias( ), but the difference between the tower and MODISGPP remains significant ( ) as variation in the resultsincreases. Because summer is the time of primary growth andproduction, the errors associated with summertime estimates ofGPP will dominate the annual pattern.
3) Autumn (September–November): Autumn results usingthe interpolated DAO meteorology are fairly well-correlatedwith tower estimates of GPP ( ). How-ever, the total autumn MODIS GPP for most of the sites is
gC m , and sites with low productivity tend tobe overestimated in the autumn, while sites with relativelyhigher productivity tend to be slightly underestimated relativeto tower based estimates ( ; Fig. 10). The use oftower meteorology in MOD17 removes some of this bias( ), although the difference from tower GPP issignificant ( ).
4) Winter (January–February and December): Winter is atime of low productivity at most of the study sites (Fig. 11), andMODIS and tower-based GPP are again well correlated (
). While the MOD17 algorithm estimates similarproduction ( gC m ) for a number of sites that range

1918 IEEE TRANSACTIONS ON GEOSCIENCE AND REMOTE SENSING, VOL. 44, NO. 7, JULY 2006
Fig. 8. Comparisons of tower GPP for Spring (March–May) with MODIS GPP estimated using (a) DAO meteorology and (b) tower-specific meteorology.
Fig. 9. Same as Fig. 8, but for Summer (June–August).
Fig. 10. Same as Fig. 8, but for Autumn (September–November).
Fig. 11. Same as Fig. 8, but for Winter (January–February and December).
HEINSCH et al.: TERRESTRIAL PRODUCTIVITY FROM MODIS 1919
in productivity from near 0 to almost 300 gC m , there isinsufficient supplemental site data to quantitatively determinethe reason for these differences. Use of tower meteorology inthe MOD17 GPP algorithm does not significantly alter the slopeof the trend line, but correlation is reduced ( ).
IV. DISCUSSION
There are a number of possible reasons for the differences intower and MODIS estimates of GPP. For the purposes of thisgeneralized study, we are necessarily assuming that tower GPPand meteorology are ground truthed, but there are errors associ-ated with these measurements. Tower GPP is calculated as thedifference between NEE and Reco. Estimates of ecosystem res-piration at flux tower sites are typically made using nighttimefluxes of NEE (when photosynthesis is assumed to be zero).Calm winds often occur at night, and the data are screenedfrom the analysis (a filter is commonly used), limiting thedataset that can be used to estimate GPP (GPP daytime NEE
daytime ecosystem respiration). However, there may be sit-uations in which the above-canopy fluxes are decoupled fromthe surface, leading to underestimates of nighttime respirationand, thus, GPP that arise from both systematic and random er-rors [42]–[46]. Also, tower flux footprints are subsamples of theMODIS pixel, often less than 1 km. In heterogeneous areas, thediffering scales of the tower and MODIS GPP estimates shouldideally be taken into account via an upscaling process, such asthat used in the Bigfoot study [15]–[17]. Unfortunately, the up-scaling technique is both intensive and expensive, and, as such,cannot be used at a large number of sites. In addition, site con-ditions can make it more difficult to obtain estimates of GPP.For example, the low productivity and harsh weather found atthe Barrow site make it difficult to accurately capture seasonaland annual GPP and Reco components of net CO flux mea-surements.
Probably the single largest error associated with MODIS GPPat most sites derives from the meteorology. The MOD17 algo-rithm is strongly dependent on VPD to reduce the maximumradiation use efficiency (1), and, therefore, underestimation ofVPD contributes greatly to the overestimation of GPP. The VPDat which the radiation use efficiency begins to be reduced in theMODIS BPLUT is on the order of 650 to 1100 Pa [20]. As theDAO meteorology underestimates local VPD at many dry sitesduring the summer [47], it does not sufficiently constrain photo-synthesis in the MOD17 algorithm during dry periods. Further-more, since the MOD17 algorithm does not directly account forsoil moisture, there may be problems at water-limited sites, asthe results from Tonzi Ranch suggest. The local vegetation iswell-adapted to the dry summer drought-like conditions and as-sociated large maximum VPD values for local (5500 Pa) and re-gional DAO (3400 Pa) typical of these sites. While both of thesemaximum VPD values would result in a complete shutdown ofphotosynthesis in the MOD17 algorithm, consistent underesti-mation of the VPD by the DAO compared to actual local me-teorology partially explains the MODIS overestimation of GPP( ) for days 180–300 at Tonzi Ranch [Fig. 4(f) andTable III]. The use of tower meteorology overcorrects for the
problem, causing the algorithm to underestimate the GPP of thesite ( ), suggesting that this site warrants furtherinvestigation.
Land cover is a potential source of error because of theheterogeneity of the landscape at the subpixel scale. In gen-eral, however, the land cover classification is fairly accurate;research has demonstrated that the MODIS land cover productis accurate to within 82% [26]. Our study has found that manyof the misclassifications within the MODIS land cover tend tooccur within similar classes, reducing potential errors in GPPestimates.
The land cover map captures the dominant cover types at siteswith three notable exceptions. The area surrounding the Barrow,AK, site is dominated by wet sedge tundra, but is described byMODIS as either shrubland or barren/sparsely vegetated. Sincethe for open shrubland in MOD17 is higher than that for grass-lands under similar environmental conditions and the MODISGPP is not calculated for the barren areas, the resulting MODISGPP is artificial. Site estimates, however, match those of the fluxtower fairly closely, indicating that there are compensatory er-rors at this site, which may include the difficulty in obtaining sitedata and errors in the MOD15 product. The Willow Creek site isalso anomalous because there are a number of cropland pixels inthe 7 7 km MODIS extraction window surrounding the tower.These pixels, which exhibit radically different GPP behaviorthan adjacent forest, would strongly influence aggregate GPPestimates at this site. Many of the extant land cover types sur-rounding the Duke Forest (the pine plantation considered here,old field, hardwood forest, and urban) are smaller than 1 1 kmand are aggregated as “mixed forest” by the C3 MODIS landcover classification. Remote sensing data with greater resolu-tion in the spatial domain, for example IKONOS, may be nec-essary to capture fluxes from highly productive and extremelyheterogeneous landscapes [48]. Unfortunately, such specializedanalyzes would also limit the global applicability of the MODISalgorithm.
It is difficult to quantify the error associated with theLAI/fPAR product in this study because of the limited avail-ability of site-specific measurements. The LAIs at more thanhalf of the study sites are within the design specification of theMOD15 product, although the remainder were overestimated.This corresponds to the results of Cohen et al. [15], who foundthat MODIS LAI overestimated site measurements of LAIat four sites in four different biomes. There are additionalon-going studies to verify the LAI and fPAR products [23],[40], [49], [50]. These results will provide valuable informationon the errors associated with both LAI and fPAR.
The MODIS LAI and fPAR measurements used in this studywere required to pass the quality control checks of the MOD17algorithm, reducing potential cloud and snow contamination.However, it is possible that some contamination remains, par-ticularly at high latitudes in which low solar angles, persistentcloud cover, and extended periods of darkness can affect re-flectance readings from the optical MODIS sensor. This signalcontamination could affect GPP in undetermined ways. Consis-tent overestimation of GPP in the spring suggests that there isa problem with early season estimation of fPAR, which couldbe the result of a combination of cloudy skies and snowmelt.

1920 IEEE TRANSACTIONS ON GEOSCIENCE AND REMOTE SENSING, VOL. 44, NO. 7, JULY 2006
Discovery of the true effects of fPAR in spring will require ex-tensive instrumentation, which is beyond the scope of the cur-rent study. Further, missing LAI/fPAR measurements are gapfilled using a simple linear function. During the active growingseason, most gaps were small, increasing the accuracy of the in-terpolation method. Gaps during the nongrowing season weremore common because of cloud cover and contamination bysnow and ice. This fact has a large impact on the seasonal anal-ysis of the data, but less of an impact at the annual timescale.Estimates at sites with large data gaps may be erroneous, par-ticularly if the gaps occur during times of rapid transition, suchas spring and autumn. The MODIS LAI/fPAR measurements atBarrow, AK, were difficult to obtain because of meteorologicalconditions at the site, resulting in 18 missing datapoints duringthe study period, with the largest gap (nine continuous measure-ments) occurring at the beginning of the growing season. It wasalso difficult to obtain accurate estimates of LAI and fPAR atthe Harvard Forest site, which had large data gaps during thegrowing season in both 2001 (ten points) and 2002 (nine points).These results could explain, in part, the differences between siteand MODIS data.
A possible contribution to the overestimation of LAI is theway in which it is measured. Sites typically only provide LAImeasurements of the dominant, overstory canopy, while theMODIS sensor receives reflectance information for a verticallyand horizontally integrated canopy. If the dominant canopy isopen, as it is at many of these sites, the MOD15 algorithm willconsider both overstory and understory surface reflectance asa single canopy unit of the land cover classification, leadingto overestimation of LAI relative to site-based measurements.In deciduous broadleaf forests where the understory may flushout earlier in the season. If the forest also contains evergreenneedleleaf trees, such as Harvard Forest (10% ENF), the algo-rithm will calculate an LAI and fPAR for a DBF forest canopyprior to actual leaf-out. At Metolius evergreen needleleaf sites,both understory and overstory LAI were measured in the field at20 1-ha plots [51], and the MOD15 LAI greatly overestimatedthe total LAI of these sites ( of 50%–100%), suggesting thatsites with open canopies should be considering the understorycontribution to LAI, GPP and NEE.
The MODIS GPP algorithm does not have a winter dor-mancy function to regulate winter productivity. Therefore, ifthe MOD15 algorithm reports a sizable LAI and fPAR for asite, and temperatures are not limiting, it is possible for theMODIS algorithm to calculate photosynthesis during that time.Alternately, the Duke Forest is classified as a mixed forest,but is actually dominated by loblolly pine (Pinus taeda). Thissite can maintain relatively high GPP in the winter under mildweather conditions, indicating that a winter dormancy functioncannot be used globally.
The fPAR tends to saturate in areas with high LAI values,limiting its ability to capture the activity of highly productivesites such as Duke Forest. Alternately, MODIS overestimatesthe LAI of the savanna site, which could lead to an increasedMODIS GPP estimate and explain, in part, the differences be-tween the MODIS and tower-derived GPP. In addition, measure-ments made by the BigFoot study group indicate that the fPAR isoverestimated at the Barrow site throughout the growing season,
while it is overestimated mid-season at the Metolius forest site[52]. Finally, studies need to be performed to determine the ac-curacy of the fPAR product for a senescing canopy or a canopyexperiencing prolonged water stress, and to quantify the true ef-fects of MODIS LAI/fPAR on GPP estimates.
The MODIS algorithm itself is a source of error in estimatingGPP. One of the largest assumptions made is for a constantmaximum radiation use efficiency for all sites within a givenbiome. However, one can easily imagine that the RUE of a bo-real forest is not the same as that of a southern U.S. warm-tem-perate planted pine forest, leading to overestimations at the bo-real forest and underestimations at the warmer site. It is alsopossible that the algorithm does not accurately account for VPDand temperature effects with the generalized scalars. However,this is a global product, which is produced every eight days, andcertain simplifying assumptions are necessary to ensure that rea-sonably accurate results are produced in a fairly rapid fashionfor all vegetated MODIS pixels.
V. CONCLUSION
The MODIS GPP algorithm has been developed to providea consistent, continuous global estimate of photosyntheticproduction. The resulting dataset is evaluated for 38 site yearsof data, comparing tower site estimates of GPP with those fromthe MODIS algorithm. Use of the global DAO meteorology isproblematic because of the scale of the product (1.00 1.25 ).There is a 28% difference between the MODIS GPP derivedwith DAO meteorology and the MODIS GPP derived withtower-specific meteorology. The resulting tower-specific esti-mates of MODIS GPP are not significantly different from theGPP estimates calculated from site measurements of NEE. Thisindicates that the DAO data can be a significant source of errorin the MOD17 algorithm. The VPD is the primary source oferror from the DAO, and the relative impact of this error onMODIS GPP increases as limitations from VPD become moresevere.
Additional errors, while difficult to quantify in this type ofgeneral analysis, propagate from the MODIS products used inthe GPP algorithm. The MOD12 land cover product can affectthe GPP output in two ways. It is used in the MOD15 LAIand fPAR product algorithm and is used to specify the biometype, and, hence, a set of ecophysiological parameters, forthe MOD17 GPP product. The MOD12 land cover accuratelycaptures the MOD15-associated land cover, which is basedon vegetation structural type. The MOD12 algorithm is lessaccurate at capturing the land cover for the MOD17 BiomeProperties Look-Up Table. However, most of the differencesare within the forest classes themselves, resulting in less errorthan would occur by misclassifying land cover morphology(e.g., forest versus grassland). The largest error associated withland cover is the assumption of a single land cover class for theentire 1-km pixel. This is not a valid assumption at many sitesand may need to be addressed in future research efforts.
Outputs from the MOD15 LAI/fPAR algorithm are anotherpotential source of error for MODIS GPP calculations. TheMOD17 algorithm uses a strict quality assurance control overMOD15 product inputs to eliminate potential contamination
HEINSCH et al.: TERRESTRIAL PRODUCTIVITY FROM MODIS 1921
from clouds and other adverse effects, but there are still prob-lems in the winter in areas containing snow and ice. In addition,the MOD15 algorithm tends to overestimate the LAI at most ofthe study sites, particularly early in the spring, and this couldlead to an associated overestimation of MODIS GPP relativeto the site. It is not possible at this time to fully quantify theeffects of the MOD15 algorithm, but its effects on MODIS GPPestimates should be considered in the future when adequate dataare available for analysis. More site-specific measurements areneeded to determine the accuracy of the fPAR product directlyincluding seasonal measurements of overstory and understoryLAI and fPAR.
Errors associated with the MOD17 GPP algorithm itselfcannot be ignored. Further research is needed to clarify therelative contributions of uncertainty in the various assumptionsof ecological response parameters represented in the BPLUTcomponent of the MOD17 algorithm. In some cases, themaximum conversion use efficiency may be underestimated(e.g., Duke Forest). With an increasing network of sensors atAmeriFlux network eddy covariance towers, the radiation useefficiency and the parameters within the BPLUT that controlthe associated and VPD reductions can be evaluated. It isalso likely that spatial heterogeneity in stand-age, soil type, andcanopy structure is not well represented by a global land covermap containing only eleven different vegetation types and theassociated BPLUT. Currently, the algorithm calculates GPPbased on a single overstory vegetation type. This simplificationleads to overestimations of GPP in complex ecosystems, partic-ularly in areas with LAIs of 2.5 m m or less. The MODISvegetation continuous fields product currently in developmentmay improve the MODIS GPP product [53]. The continuousfields product will provide subpixel proportional estimatesof the basic vegetation forms (e.g., tree, shrub, evergreen,deciduous, etc.), which can then be used in conjunction withthe BPLUT to determine a more accurate GPP, as all of thevegetation types within a pixel can be taken into account incalculations. Errors at several of the other sites, such as theTonzi Ranch savanna and Duke Forest, require additionalinvestigation.
Meteorology and land cover do not completely explain thedifferences between MODIS and tower-based GPP estimates,suggesting the importance of evaluating the algorithm. Turneret al. [16], [17], as part of the BigFoot MODIS validationproject, have provided valuable insight regarding potentialimprovements to the MOD17 algorithm, including accountingfor possible PAR saturation effects on the conversion efficiencyand the improved representation of seasonal variability in lightuse efficiency. There is additional evidence to suggest that,while many studies show a quasilinear relationship betweenlight use efficiency and GPP [54], [55], this assumption may notbe valid for all vegetation types [56], [57]. On the other hand,nonlinear light response curves tend to become more linear ifthey are evaluated over the course of a day [58]. Differencesin the light use efficiencies of sunlit and shaded leaves are notexplicitly considered in the satellite-based approach. Soil waterand nutrient limitations are also not explicitly defined in thealgorithm. These factors may also help explain the MODISoverestimates of GPP as compared with tower results.
The results of this study indicate, however, that the currentMODIS GPP algorithm shows reasonable spatial patterns andtemporal variability across a diverse range of biomes and cli-mate regimes. So, while continued efforts are needed to iso-late particular problems in specific biomes, we are optimisticabout the general quality of these data. While no individualdataset can be expected to meet all of the individual needs of theclimate change community, continuation of the MOD17 GPPproduct will likely provide a key component of global terres-trial ecosystem analysis, providing continuous weekly measure-ments of global vegetation production.
ACKNOWLEDGMENT
The authors would like to thank C. Boisvenue, The Universityof Montana, for providing valuable assistance with the statis-tical analysis. They would also like to thank W. M. Jolly, USDAForest Service Rocky Mountain Research Station Fire SciencesLaboratory, Missoula, MT, for providing programming supportfor this analysis. The initital results of this analysis were re-viewed at the Fluxnet 2003 Tahoe Synthesis Workshop.
REFERENCES
[1] J. T. Houghton, Y. Ding, D. J. Griggs, M. Noguer, P. J. van der Linden,X. Dai, K. Maskell, and C. A. Johnson, Eds., “Climate Change 2001:The Scientific Basis. Contribution of Working Group 1 to the Third As-sessment Report of the Intergovernmental Panel on Climate Change,”IPCC, 2001.
[2] P. A. Stott, S. F. B. Tett, G. S. Jones, M. R. Allen, J. F. B. Mitchell, andG. J. Jenkins, “External control of 20th century temperature by naturaland anthropogenic forcings,” Science, vol. 290, pp. 2133–2137, 2000.
[3] S. Fan, M. Gloor, J. Mahlman, S. Pacala, J. Sarmiento, T. Takahoshi,and P. Tans, “A large terrestrial carbon sink in North America impliedby atmospheric and oceanic carbon dioxide data and models,” Science,vol. 282, pp. 442–446, 1998.
[4] S. C. Wofsy, M. L. Goulden, J. W. Munger, S. M. Fan, P. S. Bakwin, B. C.Daube, S. L. Bassow, and F. A. Bazzaz, “Net exchange of carbon dioxidein a mid-latitude forest,” Science, vol. 260, pp. 1314–1317, 1993.
[5] C. C. Barford, S. C. Wofsy, M. L. Goulden, J. W. Munger, E. H. Pyle,S. P. Urbanski, L. Hutyra, S. R. Saleska, D. Fitzjarrald, and K. Moore,“Factors controlling long- and short-term sequestration of atmosphericCO in a mid-latitude forest,” Science, vol. 294, pp. 1688–1691, 2001.
[6] B. H. Braswell, D. S. Schimel, S. Linder, and B. Moore, III, “The re-sponse of global terrestrial ecosystems to interannual temperature vari-ability,” Science, vol. 278, pp. 870–872, 1997.
[7] J. T. Randerson, C. B. Field, I. Y. Fung, and P. P. Tans, “Increases in earlyseason ecosystem uptake explain recent changes in the seasonal cycle ofatmospheric CO at high northern latitudes,” Geophys. Res. Lett., vol.26, pp. 2765–2768, 1999.
[8] C. O. Justice, E. Vermote, J. R. G. Townshend, R. DeFries, D. P. Roy,D. K. Hall, V. V. Salomonson, J. L. Privette, G. Riggs, A. Strahler, W.Lucht, R. B. Myneni, Y. Knyazikhin, S. W. Running, R. R. Nemani, Z.W, A. R. Huete, W. van Leeuwen, R. E. Wolfe, L. Giglio, J.-P. Muller, P.Lewis, and M. J. Barnsley, “The moderate resolution imaging spectro-radiometer (MODIS): Land remote sensing for global change research,”IEEE Trans. Geosci. Remote Sens., vol. 36, no. 4, pp. 1228–1249, Jul.1998.
[9] C. B. Field, M. J. Behrenfeld, J. T. Randerson, and P. Falkowski, “Pri-mary production of the biosphere: Integrating terrestrial and oceaniccomponents,” Science, vol. 281, pp. 237–240, 1998.
[10] C. B. Field, J. T. Randerson, and C. M. Malström, “Global net primaryproduction: Combining ecology and remote sensing,” Remote Sens. En-viron., vol. 51, pp. 74–88, 1995.
[11] R. R. Nemani, C. D. Keeling, H. Hashimoto, W. M. Jolly, S. C. Piper, C.J. Tucker, R. B. Myneni, and S. W. Running, “Climate-driven increasesin global terrestrial net primary production from 1982 to 1999,” Science,vol. 300, pp. 1560–1563, 2003.

1922 IEEE TRANSACTIONS ON GEOSCIENCE AND REMOTE SENSING, VOL. 44, NO. 7, JULY 2006
[12] S. D. Prince and S. N. Goward, “Global primary production: A remotesensing approach,” J. Biogeography, vol. 22, pp. 815–835, 1995.
[13] A. Ruimy and B. Saugier, “Methodology for the estimation of terrestrialnet primary production from remotely sensed data,” J. Geophys. Res.,vol. 99, pp. 5263–5283, 1994.
[14] D. Schimel, “Terrestrial biogeochemical cycles: Global estimates withremote sensing,” Remote Sens. Environ., vol. 51, pp. 49–56, 1995.
[15] W. B. Cohen, T. K. Maiersperger, Z. Yang, S. T. Gower, D. P. Turner,W. D. Ritts, M. Berterretche, and S. W. Running, “Comparisons ofland cover and LAI estimates derived from ETM+ and MODIS for foursites in North America: A quality assessment of 2000/2001 provisionalMODIS products,” Remote Sens. Environ., vol. 88, pp. 233–255, 2003.
[16] D. P. Turner, W. D. Ritts, W. B. Cohen, S. T. Gower, M. Zhao, S. W. Run-ning, S. C. Wofsy, S. Urbanski, A. L. Dunn, and J. W. Munger, “Scalinggross primary production (GPP) over boreal and deciduous forest land-scapes in support of MODIS GPP product validation,” Remote Sens. En-viron., vol. 88, pp. 256–270, 2003.
[17] D. P. Turner, S. Urbanski, D. Bremer, S. C. Wofsy, T. Meyers, S. T.Gower, and M. Gregory, “A cross-biome comparison of daily light useefficiency for gross primary production,” Global Change Biol., vol. 9,pp. 383–395, 2003.
[18] J. L. Monteith, “Solar radiation and productivity in tropical ecosystems,”J. Appl. Ecol., vol. 9, pp. 747–766, 1972.
[19] , “Climate and the efficiency of crop production in Britain,”Philosoph. Trans. Roy. Soc. Lond. B, vol. 281, pp. 277–294, 1977.
[20] F. A. Heinsch, M. C. Reeves, P. Votava, S. Kang, C. Milesi, M. Zhao, J.Glassy, W. M. Jolly, R. Loehman, C. F. Bowker, J. S. Kimball, R. R. Ne-mani, and S. W. Running, User’s Guide: GPP and NPP (MOD17A2/A3)Products, NASA MODIS Land Algorithm. Missoula, MT: Univ. Mon-tana, 2003, p. 57.
[21] S. W. Running, R. R. Nemani, F. A. Heinsch, M. Zhao, M. C.Reeves, and H. Hashimoto, “A continuous satellite-derived measureof global terrestrial primary production,” BioScience, vol. 54, pp.547–560, 2004.
[22] S. W. Running, P. E. Thornton, R. R. Nemani, and J. M. Glassy, “Globalterrestrial gross and net primary productivity from the Earth ObservingSystem,” in Methods in Ecosystem Science, O. Sala, R. Jackson, and H.Mooney, Eds. New York: Springer-Verlag, 2000, pp. 44–57.
[23] R. B. Myneni, S. Hoffman, Y. Knyazikhin, J. L. Privette, J. Glassy, Y.Tian, Y. Wang, X. Song, Y. Zhang, G. R. Smith, A. Lotsch, M. Friedl,J. T. Morisette, P. Votava, R. R. Nemani, and S. W. Running, “Globalproducts of vegetation leaf area and fraction absorbed PAR from yearone of MODIS data,” Remote Sens. Environ., vol. 83, pp. 214–231,2002.
[24] R. B. Myneni, R. R. Nemani, and S. W. Running, “Estimation ofglobal leaf area index and absorbed PAR using radiative transfermodels,” IEEE Trans. Geosci. Remote Sens., vol. 35, no. 6, pp.1380–1393, Nov. 1997.
[25] R. Myneni, Y. Knyazikhin, J. Glassy, P. Votava, and N. Shabanov, User’sGuide: FPAR, LAI (ESDT:MOD15A2) 8-Day Composite NASA MODISLand Algorithm. Boston, MA: Boston Univ., 2003.
[26] M. C. Hansen, R. S. DeFries, J. R. G. Townshend, and R. Sohlberg,“Global land cover classification at 1 km spatial resolution using a clas-sification tree approach,” Int. J. Remote Sens., vol. 21, pp. 1331–1364,2000.
[27] M. A. White, P. E. Thornton, S. W. Running, and R. R. Nemani, “Pa-rameterization and sensitivity analysis of the BIOME-BGC terrestrialecosystem model: Net primary production controls,” Earth Interactions,vol. 4, pp. 1–84, 2000.
[28] P. E. Thornton, “Regional ecosystem simulation: Combining surface-and satellite-based observations to study linkages between terrestrial en-ergy and mass budgets,” in School of Forestry. Missoula, MT: Univ.Montana, 1998, p. 280.
[29] J. S. Kimball, P. E. Thornton, M. A. White, and S. W. Running,“Simulating forest productivity and surface-atmosphere carbon ex-change in the BOREAS study region,” Tree Physiol., vol. 17, pp.589–599, 1997.
[30] M. Zhao, F. A. Heinsch, R. R. Nemani, and S. W. Running, “Improve-ments of the MODIS terrestrial gross and net primary production globaldataset,” Remote Sens. Environ., vol. 95, pp. 164–176, 2005.
[31] E.-D. Schulze, F. M. Kelliher, C. Korner, C. R. Lloyd, J. Lloyd, andR. Leuning, “Relationships among maximum stomatal conductance,ecosystem surface conductance, carbon assimilation rate, and plantnitrogen nutrition: A global ecology scaling exercise,” Annu. Rev. Ecol.Syst., vol. 25, pp. 629–660, 1994.
[32] DAO, “Data Assimilation Office (DAO) Algorithm Theoretical BasisDocument (ATBD)”, Data Assimilation Office, Goddard Space FlightCenter, Greenbelt, MD, 2002.
[33] S. D. Schubert, R. B. Rood, and J. Pfaendtner, “An assimilated datasetfor Earth science applications,” Bull. Amer. Meteorol. Soc., vol. 74, pp.2331–2342, 1993.
[34] D. Baldocchi, E. Falge, L. Gu, R. Olson, D. Hollinger, S. W. Running, P.Anthoni, C. Bernhofer, K. Davis, R. Evans, J. Fuentes, A. Goldstein, G.Katul, B. Law, X. Lee, Y. Malhi, T. Meyers, W. Munger, W. Oechel, U.K. T. Paw, K. Kilegaard, H. P. Schmid, R. Valentini, S. Verma, T. Vesala,K. Wilson, and S. Wofsy, “FLUXNET: A new tool to study the tem-poral and spatial variability of ecosystem–scale carbon dioxide, watervapor, and energy flux densities,” Bull. Amer. Meteorol. Soc., vol. 82,pp. 2415–2434, 2001.
[35] M. Reichstein, J. D. Tenhunen, O. Roupsard, J.-M. Ourcival, S. Rambal,F. Miglietta, A. Peressotti, M. Pecchiari, G. Tirone, and R. Valentini,“Severe drought effects on ecosystem CO and H O fluxes at threeMediterranean evergreen sites: Revision of current hypotheses?,” GlobalChange Biol., vol. 8, pp. 999–1017, 2002.
[36] A. R. Desai, P. V. Bolstad, B. D. Cook, K. J. Davis, and E. V. Carey,“Comparing net ecosystem exchange of carbon dioxide between an old-growth and mature forest in the upper Midwest, USA,” Agricult. ForestMeteorol., vol. 128, pp. 33–55, 2005.
[37] B. D. Cook, K. J. Davis, W. Wang, A. Desai, B. W. Berger, R. M.Teclaw, J. G. Martin, P. V. Bolstad, P. S. Bakwin, C. Yi, and W.Heilman, “Carbon exchange and venting anomalies in an upland decid-uous forest in northern Wisconsin, USA,” Agricult. Forest Meteorol.,vol. 126, pp. 271–295, 2004.
[38] E. Falge, D. Baldocchi, R. Olson, P. Anthoni, M. Aubinet, C. Bern-hofer, G. Burba, R. Ceulemans, R. Clement, H. Dolman, A. Granier, P.Gross, T. Grünwald, D. Hollinger, N. O. Jensen, G. Katul, P. Keronen, A.Kowalski, C. T. Lai, B. E. Law, T. Meyers, J. Moncrieff, E. Moors, J. W.Munger, K. Pilegaard, Ü. Rannik, C. Rebmann, A. Suyker, J. Tenhunen,K. Tu, S. Verma, T. Vesala, K. Wilson, and S. Wofsy, “Gap filling strate-gies for defensible annual sums of net ecosystem exchange,” Agricult.Forest Meteorol., vol. 107, pp. 43–69, 2001.
[39] M. A. Friedl, D. K. McIver, J. C. F. Hodges, X. Y. Zhang, D. Muchoney,A. H. Strahler, C. E. Woodcock, S. Gopal, A. Schneider, A. Cooper,A. Baccini, F. Gao, and C. Schaaf, “Global land cover mapping fromMODIS: Algorithms and early results,” Remote Sens. Environ., vol. 83,pp. 287–302, 2002.
[40] M. Friedl, Personal Communication, Boston Univ., Boston, MA, May2004.
[41] A. Lotsch, Y. Tian, M. A. Friedl, and R. B. Myneni, “Land cover map-ping in support of LAI/FPAR retrievals from EOS MODIS and MISR.Classification methods and sensitivities to errors,” Int. J. Remote Sens.,vol. 24, pp. 1997–2016, 2003.
[42] M. Aubinet, B. Heinesch, and B. Longdoz, “Estimation of the carbonsequestration by a heterogeneous forest: Night flux corrections, hetero-geneity of the site and inter-annual variability,” Global Change Biol.,vol. 8, pp. 1053–1071, 2002.
[43] B. W. Berger, K. J. Davis, C. Yi, P. S. Bakwin, and C. L. Zhao, “Long-term carbon dioxide fluxes from a very tall tower in a northern forest:Flux measurement methodology,” J. Atmos. Ocean. Technol., vol. 18,pp. 529–542, 2001.
[44] J. Moncrieff, R. Valentini, S. Greco, G. Seufert, and P. Ciccioli, “Tracegas exchange over terrestrial ecosystems: Methods and perspectives inmicrometeorology,” J. Exp. Bot., vol. 48, pp. 1133–1142, 1997.
[45] J. B. Moncrieff, Y. Malhi, and R. Leuning, “The propagation of errorsin long-term measurements of land-atmosphere fluxes of carbon andwater,” Global Change Biol., vol. 2, pp. 231–240, 1996.
[46] E. Falge, D. Baldocchi, J. Tenhunen, M. Aubinet, P. Bakwin, P.Berbigier, C. Bernhofer, G. Burba, R. Clement, K. J. Davis, J. A.Elbers, A. H. Goldstein, A. Grelle, A. Granier, J. Guomundsson, D.Hollinger, A. S. Kowalski, G. Katul, B. E. Law, Y. Malhi, T. Meyers, R.K. Monson, J. W. Munger, W. Oechel, U. K. T. Paw, K. Pilegaard, Ü.Rannik, C. Rebmann, A. Suyker, R. Valenti, K. Wilson, and S. Wofsy,“Seasonality of ecosystem respiration and gross primary production asderived from FLUXNET measurements,” Agricult. Forest Meteorol.,vol. 113, pp. 75–95, 2002.
[47] M. Zhao, S. W. Running, and R. R. Nemani, “Sensitivity of MODISterrestrial primary production to the accuracy of meteorological reana-lyzes,” J. Geophys. Res., to be published.
[48] T. M. Scanlon and J. D. Albertson, “Water availability and the spa-tial complexity of CO , water, and energy fluxes over a heterogeneoussparse canopy,” J. Hydrometeorol., vol. 4, pp. 798–809, 2003.
HEINSCH et al.: TERRESTRIAL PRODUCTIVITY FROM MODIS 1923
[49] Y. Tian, C. E. Woodcock, Y. Wang, J. L. Privette, N. V. Shabanov, L.Zhou, Y. Zhang, W. Buermann, J. Dong, B. Veikkanen, T. Häme, K. An-dersson, M. Ozdogan, Y. Knyazikhin, and R. B. Myneni, “Multiscaleanalysis and validation of the MODIS LAI product. I. Uncertainty as-sessment,” Remote Sens. Environ., vol. 83, pp. 414–430, 2002.
[50] , “Multiscale analysis and validation of the MODIS LAI product.II. Sampling strategy,” Remote Sens. Environ., vol. 83, pp. 431–441,2002.
[51] B. E. Law, S. Van Tuyl, A. Cescatti, and D. D. Baldocchi, “Estimation ofleaf area index in open-canopy ponderosa pine forests at different suc-cessional stages and management regimes in Oregon,” Agricult. ForestMeteorol., vol. 108, pp. 1–14, 2001.
[52] D. P. Turner, W. D. Ritts, W. B. Cohen, T. K. Maeirsperger, S. T. Gower,A. A. Kirschbaum, S. W. Running, M. Zhao, S. C. Wofsy, A. L. Dunn,B. E. Law, J. L. Campbell, W. C. Oechel, H. Kwon, T. P. Meyers, E. E.Small, S. A. Kurc, and J. A. Gamon, “Site-level evaluation of satellite-based global terrestrial GPP and NPP monitoring,” Global Change Biol.,to be published.
[53] M. C. Hansen, R. S. DeFries, J. R. G. Townshend, M. Carroll,C. Dimiceli, and R. A. Sohlberg, “Global percent tree cover at aspatial resolution of 500 meters: First results of the MODIS vege-tation continuous fields algorithm,” Earth Interactions, vol. 7, pp.10.1175/1087–3562(2003)007, 2003.
[54] A. Ruimy, P. G. Jarvis, D. D. Baldocchi, and B. Saugier, “Carbon dioxidefluxes over plant canopies and solar radiation: A review,” Adv. Ecol. Res.,vol. 26, pp. 1–68, 1995.
[55] D. Baldocchi, “A comparative study of mass and energy exchangerates over a closed C (wheat) and an open C (corn) crop: II. COexchange and water use efficiency,” Agricult. Forest Meteorol., vol. 67,pp. 291–321, 1994.
[56] D. Y. Hollinger, F. M. Kelliher, J. N. Byers, J. E. Hunt, T. M. Mc-Seveny, and P. L. Weir, “Carbon dioxide exchange between an undis-turbed old-growth temperate forest and the atmosphere,” Ecology, vol.75, pp. 134–150, 1994.
[57] S. M. Fan, M. L. Goulden, J. W. Munger, B. C. Daube, P. S. Bakwin, S.C. Wofsy, J. S. Amthor, D. R. Fitzjarrald, K. E. Moore, and T. R. Moore,“Environmental controls on the photosynthesis and respiration of a bo-real lichen woodland, A growing season of whole-ecosystem exchangemeasurements by eddy correlation,” Oecologia, vol. 102, pp. 443–452,1995.
[58] R. Leuning, F. M. Kelliher, D. de Pury, and E.-D. Schulze, “Leafnitrogen, photosynthesis, conductance and transpiration: Scaling fromleaves to canopies,” Plant, Cell, Environ., vol. 18, pp. 1183–1200, 1995.
[59] K. V. R. Schäfer, R. Oren, D. S. Ellsworth, C. T. Lai, J. D. Herrick,A. C. Finzi, D. D. Richter, and G. G. Katul, “Exposure to an enrichedCO atmosphere alters carbon assimilation and allocation in a pine forestecosystem,” Global Change Biol., vol. 9, pp. 1378–1400, 2003.
[60] D. Y. Hollinger, J. Aber, B. Dail, E. A. Davidson, S. M. Goltz, H.Hughes, M. Y. Leclerc, J. T. Lee, A. D. Richardson, C. Rodrigues, N. A.Scott, D. Achuatavarier, and J. Walsh, “Spatial and temporal variabilityin forest-atmosphere CO exchange,” Global Change Biol., vol. 10, pp.1689–1706, 2004.
[61] D. Y. Hollinger, S. M. Goltz, E. A. Davidson, J. T. Lee, K. Tu, and H.T. Valentine, “Seasonal patterns and environmental control of carbondioxide and water vapor exchange in an ecotonal boreal forest,” GlobalChange Biol., vol. 5, pp. 891–902, 1999.
[62] L. B. Flanagan, L. A. Wever, and P. J. Carlson, “Seasonal and interannualvariation in carbon dioxide exchange and carbon balance in a northerntemperate grassland,” Global Change Biol., vol. 8, pp. 599–615, 2002.
[63] L. A. Wever, L. B. Flanagan, and P. J. Carlson, “Seasonal and interannualvariation in evapotranspiration, energy balance and surface conductancein a northern temperate grassland,” Agricult. Forest Meteorol., vol. 112,pp. 31–49, 2002.
[64] P. M. Anthoni, M. H. Unsworth, B. E. Law, J. Irvine, D. Baldocchi, andD. Moore, “Seasonal differences in carbon and water vapor exchangein young and old-growth ponderosa pine ecosystems,” Agricult. ForestMeteorol., vol. 111, pp. 203–222, 2002.
[65] B. E. Law, P. E. Thornton, J. Irvine, P. M. Anthoni, and S. Van Tuyl,“Carbon storage and fluxes in ponderosa pine forests at different devel-opmental stages,” Global Change Biol., vol. 7, pp. 755–777, 2001.
[66] R. K. Monson, A. A. Turnipseed, J. P. Sparks, P. C. Harley, L. E. Scott-Denton, K. Sparks, and T. E. Huxman, “Carbon sequestration in a high-elevation, subalpine forest,” Global Change Biol., vol. 8, pp. 459–178,2002.
[67] A. A. Turnipseed, P. D. Blanken, D. E. Anderson, and R. K. Monson,“Energy budget above a high-elevation subalpine forest in complex to-pography,” Agricult. Forest Meteorol., vol. 110, pp. 177–201, 2002.
[68] M. L. Goulden, B. C. Daube, S. M. Fan, D. J. Sutton, A. Bazzaz, J. W.Munger, and S. C. Wofsy, “Physiological responses of a black spruceforest to weather,” J. Geophys. Res., vol. 102, pp. 28 987–28 996, 1997.
[69] M. L. Goulden, S. C. Wofsy, J. W. Harden, S. E. Trumbore, P. M. Crill,S. T. Gower, T. Fries, B. C. Daube, S.-M. Fan, D. J. Sutton, A. Bazzaz,and J. W. Munger, “Sensitivity of boreal forest carbon balance to soilthaw,” Science, vol. 279, pp. 214–217, 1998.
[70] K. J. Davis, C. Zhao, R. M. Teclaw, J. G. Isebrands, P. S. Bakwin, C.Yi, and B. W. Berger, “The annual cycles of CO and H O exchangeover a northern mixed forest as observed from a very tall tower,” GlobalChange Biol., vol. 9, pp. 1278–1293, 2003.
[71] H. Luo, W. C. Oechel, H. Kwon, and Y. Qian, “Net ecosystem exchangeof carbon and water vapor in a southern California chaparral ecosystem,”presented at the Ecology, Conservation and Management of Mediter-ranean Climate Ecosystems Conf., Rhodes, Greece, 2004.
[72] D. D. Baldocchi, L. Xu, and N. Kiang, “How plant functional-type,weather, seasonal drought, and soil physical properties alter water andenergy fluxes of an oak-savanna and an annual grassland,” Agricult.Forest Meteorol., vol. 123, pp. 13–39, 2004.
Faith Ann Heinsch received the M.S. degree inatmospheric sciences from Oregon State University,Corvallis, in 1997, and the Ph.D. degree in soil sci-ence from Texas A&M University, College Station,in 2002.
She is currently a Postdoctoral Research Assis-tant with the Numerical Terradynamic SimulationGroup (NTSG), University of Montana, Mis-soula. Her research interests include the studyof soil-biosphere-atmosphere interactions on thecanopy to ecosystem scale using ecosystem models
and remote sensing applications.
Maosheng Zhao received the Ph.D. degree in cli-matology from the Institute of Atmospheric Physics,Chinese Academy of Sciences, Beijing, in 2001.
He is currently a Postdoctoral Researcher and Pri-mary Software Engineer with the Numerical Terra-dynamic Simulation Group (NTSG), The Universityof Montana, Missoula.
Steven W. Running received the B.S. degree inbotany and M.S. degree in forest management in1972 and 1973, respectively, both from Oregon StateUniversity, Corvallis, and the Ph.D. degree in forestecophysiology from Colorado State University, FortCollins, in 1979.
He is trained as a Terrestrial Ecologist. He hasbeen with The University of Montana, Missoula,since 1979, where he is currently a Professor ofEcology and Director of the Numerical Terrady-namic Simulation Group. His primary research
interest is the development of global and regional ecosystem biogeochemicalmodels by the integration of remote sensing with climatology and terrestrialecology.
Dr. Running is a Team Member for the NASA Earth Observing System, Mod-erate Resolution Imaging Spectroradiometer, and is responsible for the EOSglobal terrestrial net primary production and evaporative index datasets. He alsois a Science Team Member of the NASA Hydros mission.

1924 IEEE TRANSACTIONS ON GEOSCIENCE AND REMOTE SENSING, VOL. 44, NO. 7, JULY 2006
John S. Kimball was born in Hollywood, CA, onJuly 28, 1965. He received the B.A. and M.A. degreesin geography from San Diego State University, SanDiego, CA, in 1987 and 1990, respectively, and thePh.D. degree in bioengineering from Oregon StateUniversity, Corvallis, in 1995.
He is an Associate Professor of Biological Sci-ences at The University of Montana, Missoula.His research interests and activities involve thedevelopment and integration of biophysical theoryand emerging technologies including satellite re-
mote sensing and computer simulation and visualization models for betterunderstanding terrestrial and aquatic ecosystem structure and function fromindividual plot to global scales.
Dr. Kimball is a member of NASA MODIS, AMSR-E and Hydros scienceteams.
Ramakrishna R. Nemani received the Ph.D. degreefrom The University of Montana, Missoula, in 1987.
He was with The University of Montana until2003 as a research faculty. Since 2003, he has beena Physical Scientist with the NASA Ames ResearchCenter, Moffett Field, CA, and is primarily involvedwith using MODIS products for ecosystem modelingand forecasting.
Kenneth J. Davis received an A.B. degree inphysics, with honors, and a certificate in theater anddance from Princeton University, Princeton, NJ, in1987, and the Ph.D. degree in astrophysical, plane-tary, and atmospheric sciences from the Universityof Colorado, Boulder, in 1992.
He was a NASA Graduate Student Fellow duringhis Ph.D. research. He was a Postdoctoral Fellowwith the National Center for Atmospheric Researchfrom 1993 to 1994 and a Research Associate withthe University of Colorado’s Cooperative Institute
for Research in Environmental Science from 1995 to 1996. In 1996, he joinedthe Department of Soil, Water, and Climate, University of Minnesota, TwinCities, St. Paul, as an Assistant Professor, and remained there until 2000. Hejoined the Department of Meteorology at The Pennsylvania State University,University Park, as an Associate Professor in 2000. His research focuses onthe application of micrometeorological methods to the study of the earth’sbiogeochemical cycles and climate.
Paul V. Bolstad, photograph and biography not available at the time ofpublication.
Bruce D. Cook received the M.S. degree in soil science from the University ofMinnesota, Twin Cities, St. Paul, in 1990, where he is currently pursuing thePh.D. degree in natural resources science and management.
He is a Research Fellow with the Department of Forest Resources, Universityof Minnesota. Trained in biology and biogeochemical cycling, his research inter-ests involve the integration of process-based growth models and remote sensingto better understand and predict regional plant growth and terrestrial carbon ex-change in forests and wetlands of the Great Lakes.
Ankur R. Desai received the B.A. degree in environ-mental studies and computer science from OberlinCollege, Oberlin, OH, in 1997, and the M.A. degreein geography from the University of Minnesota,Minneapolis, in 2000. He is currently pursuing thePh.D. degree in meteorology at The PennsylvaniaState University, University Park
He is currently a Research Assistant for Dr. K. J.Davis at The Pennsylvania State University. His re-search focuses on surface-atmosphere exchange oftrace gases, atmospheric boundary layer structures,
and the measurement and modeling of regional-scale carbon dioxide fluxes.
Daniel M. Ricciuto, photograph and biography not available at the time ofpublication.
Beverly E. Law received the Ph.D. degree inforest science from Oregon State University (OSU),Corvallis.
She is currently an Associate Professor in the De-partment of Forest Science, OSU. Originally trainedin ecophysiology and remote sensing, she has beenactively involved in interdisciplinary research thatincludes micrometeorology, terrestrial ecosystemcarbon and water exchange, modeling, and remotesensing.
Dr. Law has been the Science Chair of the Ameri-Flux network of flux sites since 2001, and she and her colleagues were awardedthe World Meteorological Organization 2004 Paper of the Year for a publicationon environmental controls on carbon dioxide and water vapor exchange betweenterrestrial ecosystems and the atmosphere.
Walter C. Oechel, photograph and biography not available at the time ofpublication.
Hyojung Kwon, photograph and biography not available at the time ofpublication.
Hongyan Luo, photograph and biography not available at the time ofpublication.
Steven C. Wofsy, photograph and biography not available at the time ofpublication.
Allison L. Dunn, photograph and biography not available at the time ofpublication.
J. William Munger, photograph and biography not available at the time ofpublication.
Dennis D. Baldocchi, photograph and biography not available at the time ofpublication.

HEINSCH et al.: TERRESTRIAL PRODUCTIVITY FROM MODIS 1925
Liukang Xu received the Ph.D. degree in soil sci-ence from the Department of Land, Air, and WaterResource, University of California, Davis, in 2000.
His research experience and interests includecarbon and energy exchange at levels from soil sur-face, leaf, to whole ecosystem, and instrumentationin environmental related research. He is currentlya Senior Application Scientist in EnvironmentalProducts, LI-COR Biosciences.
David Y. Hollinger received the Ph.D. degree in biology from Stanford Univer-sity, Stanford, CA, in 1984.
He has been involved with measuring ecosystem-atmosphere CO2 exchangesince 1989 and is presently leading carbon cycling studies at the Howland Amer-iFlux site.
Andrew D. Richardson, photograph and biography not available at the time ofpublication.
Paul C. Stoy, photograph and biography not available at the time of publication.
Mario B. S. Siqueira, photograph and biography not available at the time ofpublication.
Russell K. Monson, photograph and biography not available at the time ofpublication.
Sean P. Burns received the M.S. degree in mechanical and aerospace engi-neering from the University of California, Irvine, in 1993.
He is currently managing the Niwot Ridge AmeriFlux tower for the Depart-ment of Ecology and Evolution and Evolutionary Biology at the University ofColorado, Boulder, and working at the National Center for Atmospheric Re-search (NCAR).
Lawrence B. Flanagan, photograph and biography not available at the time ofpublication.
Top Related
Copyright © 2022 FDOKUMEN

