


Bahasa
Halaman
Hukum

Environmental Indicators for Business: A Review ofthe Literature and Standardisation Methods
Xander Olsthoorn1, Daniel Tyteca2, Walter Wehrmeyer3, Marcus Wagner3
Manuscript for the Journal of Cleaner Production
Manuscript ref: CpDH/2000/000311
November 2000
1 Institute for Environmental Studies (IVM), Vrije Universiteit; De Boelelaan 1115, 1081 HVAmsterdam; Tel 31-20-4449509/4449555; Fax 31-20-4449553
2 Centre Entreprise - Environnement, Université Catholique de Louvain, Place des Doyens 1,B-1348 Louvain-la-Neuve, Belgium. Tel. +32.10.47.83.75, fax +32.10.47.83.24; [email protected].
3 Centre for Environmental Strategy; University of Surrey; GU2 5XH, Surrey, UK, Tel: +441483 259559, Fax: +44 1483 259394, E-mail: [email protected],[email protected]
Environmental Indicator for Business
page 2
Abstract
This paper reviews the existing literature on environmental performance indicators as they relate
to private sector organisations, followed by a basic classification of ways in which environmental
data is being standardised for use in indicators. It was found that the majority of standardisation
schemes for environmental information fall into one of five categories, namely standardised
using economic criteria, physical impact categories (such as Global Warming Potential), linear
programming methods (such as Productive Efficiency), economic valuation methods or as part
of business management review processes. The paper concludes that environmental data, once
normalised, should be used in a diversity of indicators that are tailored to the information needs
of the data users and that as long as normalisation of data is kept separate from aggregation and
standardisation, many different indicators can be developed based on a comparatively small
dataset.
1. Introduction
Decision making and management of complex issues requires methods for representing these
issues by simple units of measure. These are called indicators - condensed information for
decision-making. The natural environment is a typical example of such a complex issue for
which there is a need for appropriate indicators. It is obvious that the precise nature of the
information required for decision making varies with the type of decisions to be made, the
context of decision making and the stakeholders involved. For instance, a private consumer may
only want a simple signal that says whether a consumer product is "green" or not "green", while
an engineer engaged in product design needs more complex information that can guide specific
design strategies. Table 1 gives examples of the various functions that environmental indicators
may have, in different contexts.
Environmental Indicator for Business
page 3
The choice and use of environmental indicators by companies depend also to some, perhaps
large, extent on the type of firms, their sector, size, proximity to environmentally sensitive
consumer markets, the time horizon involved, type and degree of external environmental
regulation and the corporate culture of the organisation. In addition, the definition of
“environmental indicator” is frequently ambiguous.
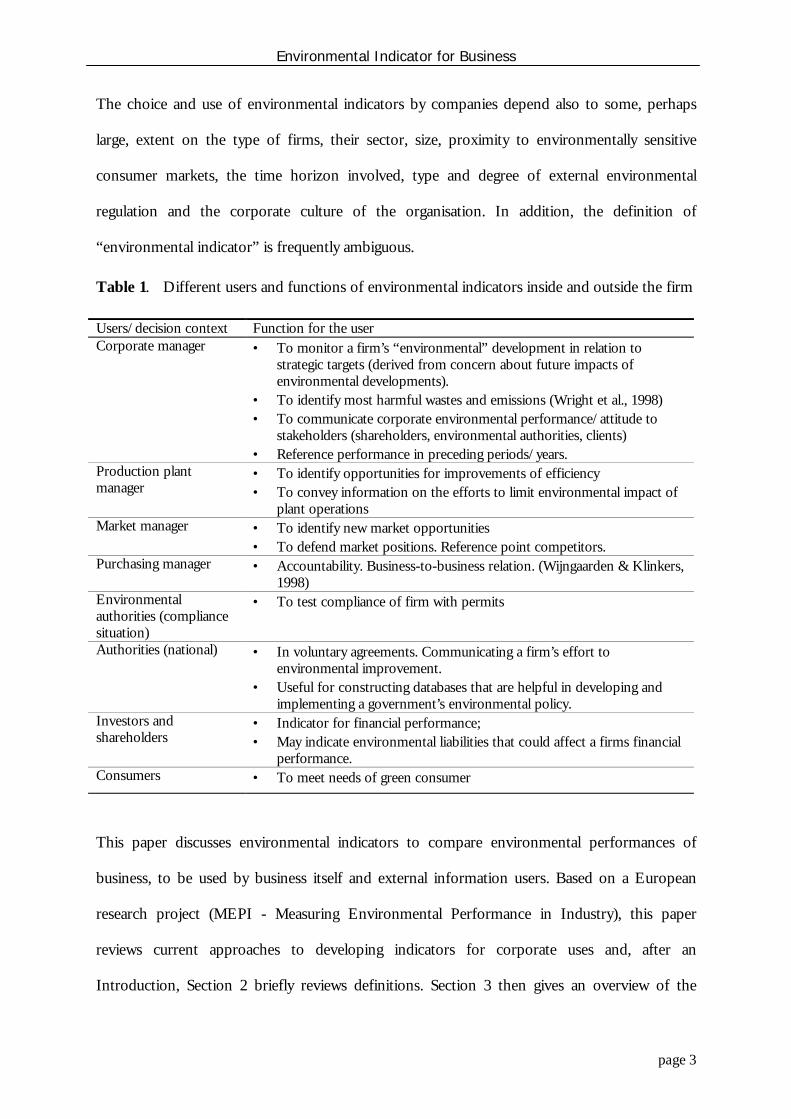
Table 1. Different users and functions of environmental indicators inside and outside the firm
Users/decision context Function for the userCorporate manager • To monitor a firm’s “environmental” development in relation to
strategic targets (derived from concern about future impacts ofenvironmental developments).
• To identify most harmful wastes and emissions (Wright et al., 1998)• To communicate corporate environmental performance/attitude to
stakeholders (shareholders, environmental authorities, clients)• Reference performance in preceding periods/years.
Production plantmanager
• To identify opportunities for improvements of efficiency• To convey information on the efforts to limit environmental impact of
plant operations Market manager • To identify new market opportunities
• To defend market positions. Reference point competitors. Purchasing manager • Accountability. Business-to-business relation. (Wijngaarden & Klinkers,
1998) Environmentalauthorities (compliancesituation)
• To test compliance of firm with permits
Authorities (national) • In voluntary agreements. Communicating a firm’s effort toenvironmental improvement.
• Useful for constructing databases that are helpful in developing andimplementing a government’s environmental policy.
Investors andshareholders
• Indicator for financial performance;• May indicate environmental liabilities that could affect a firms financial
performance. Consumers • To meet needs of green consumer
This paper discusses environmental indicators to compare environmental performances of
business, to be used by business itself and external information users. Based on a European
research project (MEPI - Measuring Environmental Performance in Industry), this paper
reviews current approaches to developing indicators for corporate uses and, after an
Introduction, Section 2 briefly reviews definitions. Section 3 then gives an overview of the

Environmental Indicator for Business
page 4
different indicators as found in the literature. From this overview we conclude that there is a
notable need for standardisation and aggregation of environmental information for both
external as well as internal users. Section 4 discusses 5 schemes by which environmental
information can be standardised. Based on the review of the literature and the data
standardisation methods, we propose a step-wise protocol to develop appropriate
environmental indicators at the firm or site level. By implication, such indicators do not relate to
environmental aspects of the type or origin of the purchased raw materials or energy, nor do
they relate to environmental aspects of the use of the products.
It should be noted that the main reason for standardisation of data is the need to make (more
or better) sense of environmental information. For instance, 1000 t of CO2 emitted does not
mean a lot without information about the context in which this emission took place - the
history, the size of the system under operation, and many other factors. Generally, the
conversion of standardised environmental information to indicators supports policy and assists
the regulation of environmental impacts of organisations. In addition, there is the need for
different standardisation schemes, as different stakeholders have different decision-making
paradigms, and environmental information needs to be made appropriate to the context in
which decisions are being made.
Generally, the requirements of environmental indicators are, firstly, those that can be
formulated for any kind of indicators, i.e., they should be objective, understandable, significant
(i.e., covering all relevant aspects), consistent with the objectives, responsive to stakeholder
expectations, and allow for meaningful comparisons (Bartolomeo 1995; CICA 1994) at a
reasonable cost. They should also be "workable", in the sense that the data required to
implement them is really available in practice.
Environmental Indicator for Business
page 5
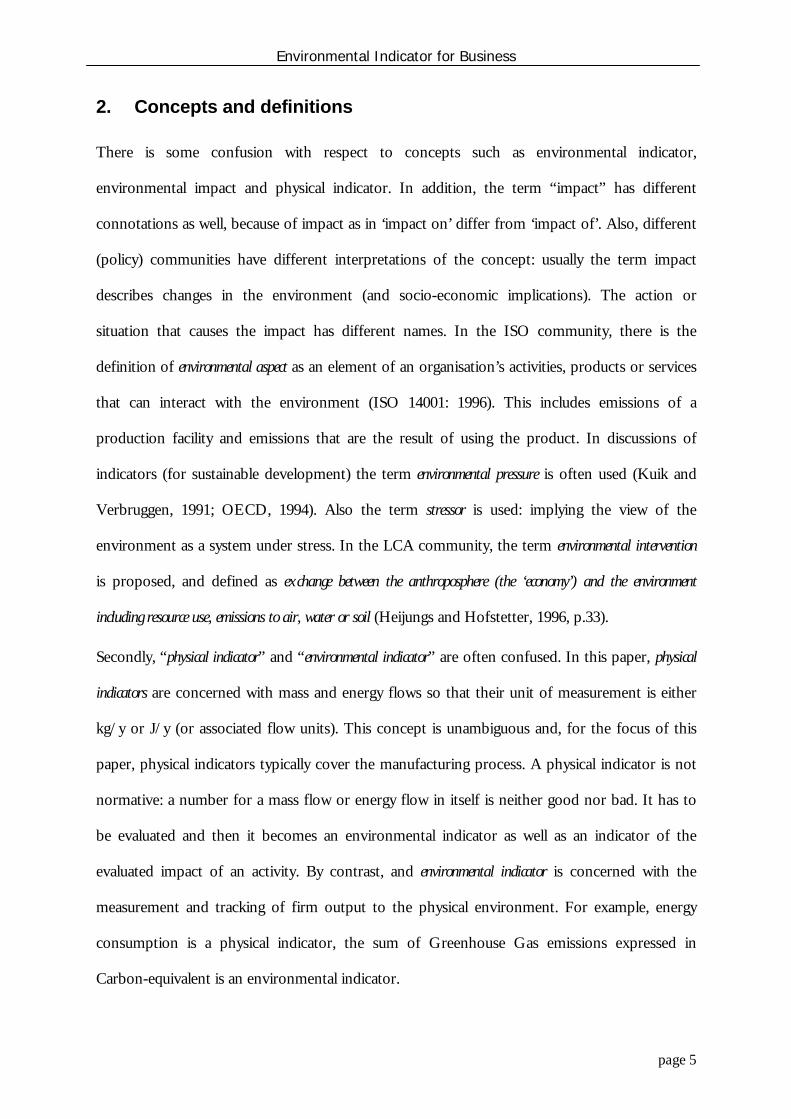
2. Concepts and definitions
There is some confusion with respect to concepts such as environmental indicator,
environmental impact and physical indicator. In addition, the term “impact” has different
connotations as well, because of impact as in ‘impact on’ differ from ‘impact of’. Also, different
(policy) communities have different interpretations of the concept: usually the term impact
describes changes in the environment (and socio-economic implications). The action or
situation that causes the impact has different names. In the ISO community, there is the
definition of environmental aspect as an element of an organisation’s activities, products or services
that can interact with the environment (ISO 14001: 1996). This includes emissions of a
production facility and emissions that are the result of using the product. In discussions of
indicators (for sustainable development) the term environmental pressure is often used (Kuik and
Verbruggen, 1991; OECD, 1994). Also the term stressor is used: implying the view of the
environment as a system under stress. In the LCA community, the term environmental intervention
is proposed, and defined as exchange between the anthroposphere (the ‘economy’) and the environment
including resource use, emissions to air, water or soil (Heijungs and Hofstetter, 1996, p.33).
Secondly, “physical indicator” and “environmental indicator” are often confused. In this paper, physical
indicators are concerned with mass and energy flows so that their unit of measurement is either
kg/y or J/y (or associated flow units). This concept is unambiguous and, for the focus of this
paper, physical indicators typically cover the manufacturing process. A physical indicator is not
normative: a number for a mass flow or energy flow in itself is neither good nor bad. It has to
be evaluated and then it becomes an environmental indicator as well as an indicator of the
evaluated impact of an activity. By contrast, and environmental indicator is concerned with the
measurement and tracking of firm output to the physical environment. For example, energy
consumption is a physical indicator, the sum of Greenhouse Gas emissions expressed in
Carbon-equivalent is an environmental indicator.
Environmental Indicator for Business
page 6
In addition, an environmental impact is defined by ISO 14001 as ‘any change in the environment,
whether adverse or beneficial, wholly or partially resulting from an organisation’s activities,
products or services’. This definition implies that this (marginal) change is expressed in physical
terms and – whether adverse or beneficial – that the impact itself is not interpreted normatively.
However, for environmental policy making the relevant question will always be “Is a certain
change in the environment good or bad? And how good or how bad?” Environmental
Indicators must be able to provide the appropriate information support to allow such a value
judgement, ideally based on explicit value systems.
3. A Review of Existing Classifications and Initiatives
Environmental performance measurement (EPM) can be defined as the measurement of the
interaction between business and the environment (Bennett & James, 1997). Issues and
perspectives of EPM can be analysed at the level of individual environmental performance
indicators, the level of the overall performance measurement system and at the level of the
relationship of this system with the external environment (Neely, 1993).
The contentious and complex issues in identifying what changes in the environmental system
can be attributed to be within the responsibility of the firm, and in normalisation and
aggregation of data as well as the use of conversion / potency factors and the units of analysis
require conceptual precision. They are briefly described and discussed in Section 4.
An example for a classification at the level of individual indicators is presented by Loew and
Kottmann (1996). They classify environmental indicators (EIs) - with some overlaps - according
to environmental protection areas (energy, transport, emissions, waste, packaging, production,
stock-keeping and water management), system boundaries (site/company, process or product)
or levels of analysis/representation (level of material and energy flows, polluters, cost or effect
level). This is an example for a classification at the level of individual indicators. On the polluter
Environmental Indicator for Business
page 7
level, the cause of energy and material flows is represented. The level of materials and energy
flows incorporates flow quantities that can be derived from site/company-, process- and
product-balances (which represent different forms of eco-balancing). EIs on the cost level can
be derived from data on the materials and energy flow level if such flows cause costs, but to
record such flow-induced costs and allocate them correctly to the polluter, environmental cost
and performance accounting is necessary. Finally, on the effect level, effects of material and
energy flows on e.g. climate, biosphere or atmosphere shall be represented in an aggregated way.
This requires a rarely-achieved overlap-free classification in e.g. environmental media (soil, water
and air) or in LCA impact categories (global warming, acidification, ozone depletion etc.).
An example for a classification at higher level, predominantly at the level of the overall
performance measurement system, is given by Bennett and James (1998) who describe three
generations of environment-related performance measurement that correspond with groups of
key indicators. First generation indicators describe the business process, indicators on regulated
emissions and wastes, and indicators for costly resources and compliance. Second generation
indicators reflect energy and materials usage/efficiency, and significant emissions and wastes as
well as financial and implementation indicators. Third generation EIs include relative indicators,
eco-efficiency, stakeholder, environmental condition and products indicators and the use of a
balanced scorecard of these indicators. Fisksel (1996) classifies environmental performance
approaches functionally in performance-tracking, decision-making and external reporting
approaches. This is closely related to the three generations proposed by James and Bennett
where the main objective in the first generation is risk management, whereas the second
generation is predominantly concerned with continuous improvement and can be related mainly
to performance-tracking. The third generation has a broader set of internal and external
objectives and broadly incorporates all three of Fisksel’s categories.
Examples of recent initiatives on environmental indicators (which represent the interests of a
variety of company stakeholders in various combinations) are:
Environmental Indicator for Business
page 8
• Association of Chartered Certified Accountants (ACCA) Report on Environment-RelatedPerformance Measurement (Jensen, 1998; Bennett & James, 1998)
• Global Reporting Initiative (CERES, 1998)
• EU Eco-Management and Audit Scheme (European Community, 1993)
• ISO 14031 – Environmental Performance Evaluation (Technical Committee 207, 1996)
• Guide to Corporate Environmental Indicators by the German Federal EnvironmentalAgency (Asmus, 1997; BMU & UBA, 1997)
• WBCSD Report on Eco-efficiency Metrics (Lehni, 1998)
• National Round Table on the Environment and the Economy (NRTEE, 1997)
• EEA Working Paper on Eco-efficiency Indicators (Gee & Moll, 1998)
• World Resources Institute (WRI) Report (Johnson, 1996; Ditz & Ranganathan, 1997)
Each approach has its different strengths and weaknesses with regard to several criteria as e.g.performance measurement or performance management, applicability within an environmentalmanagement system or reliability of data collection. Some of these initiatives, such as EMAS,ISO, by the WBCSD or the German Federal Environmental Agency, are more aimed towardsinternally oriented performance management whereas others are focused on externalperformance measurement (WRI, NRTEE, EEA, CERES, ACCA). Overall, the current practiceof using environmental indicators in business shows little standardisation and the use of manydifferent environmental indicators that only rarely attempt to measure overall Eco-efficiencyand almost never addresses overall sustainability (Wehrmeyer & Tyteca 1998). With regard toapplicability within an environmental management system, EMAS and ISO-basedenvironmental indicators are best-suited, since they originate either directly from the standard(EMAS) or from a linked standard (ISO, which is linked to ISO 14031 on EnvironmentalPerformance Evaluation). For indicators based on these initiatives, reliable firm level data isoften readily available, but guidelines regarding the suggested use of indicators are mainlyvoluntarily and rather general.By contrast, initiatives concerned with externally oriented performance measurement and more
homogeneous use of environmental performance indicators point to
• The need for more standardisation (Ditz & Ranganathan, 1998; Bennett & James, 1998,CERES, 1998),
• Measurement of sustainability (Wehrmeyer & Tyteca, 1998) and Eco-efficiency (WBCSD,1998),
• Life-cycle thinking (Bennett & James, 1998), and
• A narrower but deeper analysis of core areas of environmental performance (Benett &James, 1998).
Following this criticism, firms should aim to develop physical indicators in broad resource
categories, that reflect the requirements of sustainable development, especially eco-efficiency,

Environmental Indicator for Business
page 9
but can also be calculated on the basis of available data on more disaggregated indicators
currently used in firms and industrial sectors.
It should also be noted that all approaches outlined above deal with environmental aspect
indicators, rather than measures that indicate or identify changes in the environmental quality of
the system concerned. This is largely due to the non-availability of environmental impact data
that can be attributed with sufficient rigour to individual organisations' environmental resource
use behaviour as well as the complexities of such attribution in a complex and self-adaptive
ecosystem. However, in the choice between environmental aspects and environmental quality
indicators, the contribution of a firm to changes in environmental quality is arguably more
relevant. So that it can be argued that companies focus on measuring (and reporting) what they
can measure rather than what users of such information ideally would like to know. The most
pronounced manifestation of this unfortunate trend is the exclusion of environmental impact
indicators (there called environmental condition indicators) as relevant indicators in ISO14040 and it
highlights that firms publish data they have available rather than what external stakeholders
would like to see.
In addition, many indicator systems display a redundancy of indicators in that several variables
show intrinsic multicollinearity4. For example, collecting fossil-fuel input and CO2 output for
conventional power stations is merely an indication of its relative efficiency and production
volume, which suggests to focus on one indicator alone. In other words, if the input-output
conversion shows little diversity between production sites, gathering input as well as output data
is costly and unnecessary. However, the problem remains to identify that indicator which is best
suited to represent the group of interrelated indicators.
Finally, the majority of environmental information is only being used to compare organisations
over time, with little comparability offered between organisations. The current lack of
4 Collinearity (or multicollinearity) is the undesirable situation where the correlations among several independentvariables are strong.
Environmental Indicator for Business
page 10
standardisation (both in data gathering / measurement and conversion) and in aggregation
across business or functional units as well as the relative youth of the environmental indicator
field itself are the main reasons for this.
4. Standardisation and Aggregation
4.1.Basic Concepts
The field of environmental indicators is, though relatively young, already highly diversified with
approaches based on LCA, economics, management accounting, ecology and a physical gate-to-
gate analysis. The literature and practice review above has shown that little comparability exists
currently and environmental data is often displayed without known standardisation or
conversion factors, and with limited information as to what the data refers to or includes. This
makes comparisons and full understanding difficult for external users. To increase transparency
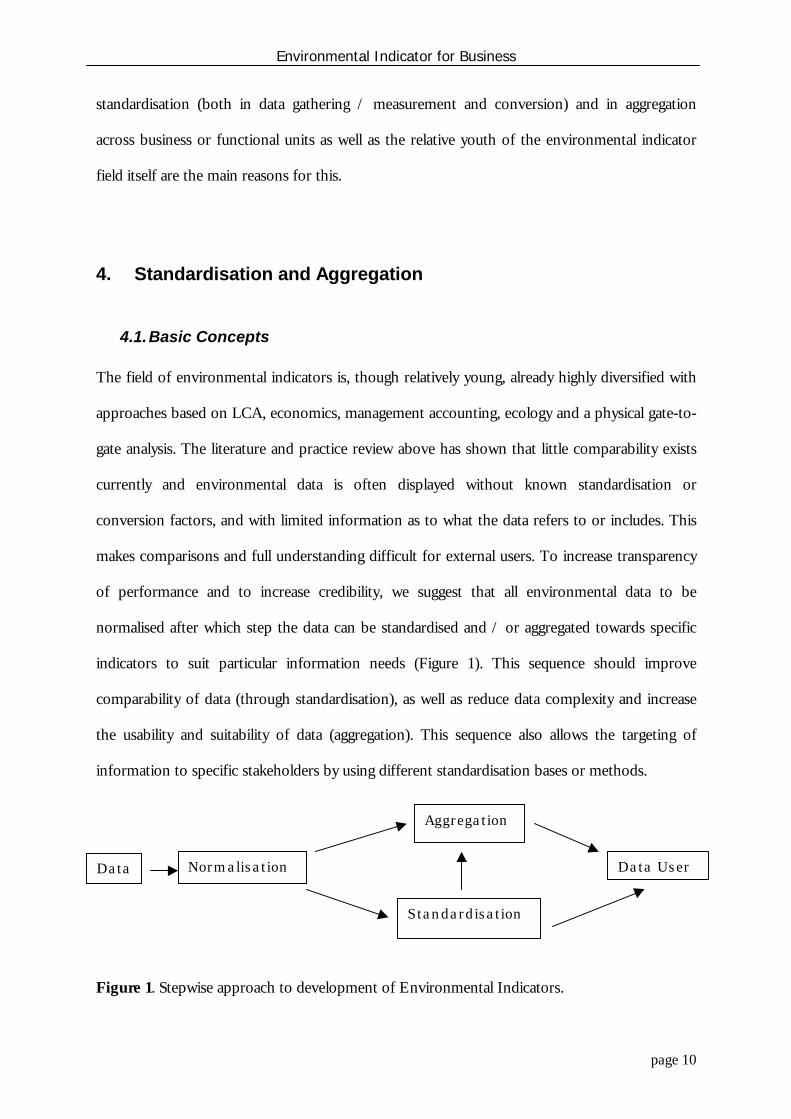
of performance and to increase credibility, we suggest that all environmental data to be
normalised after which step the data can be standardised and / or aggregated towards specific
indicators to suit particular information needs (Figure 1). This sequence should improve
comparability of data (through standardisation), as well as reduce data complexity and increase
the usability and suitability of data (aggregation). This sequence also allows the targeting of
information to specific stakeholders by using different standardisation bases or methods.
Figure 1. Stepwise approach to development of Environmental Indicators.
Data Normalisation Data User
Standardisation
Aggregation
Environmental Indicator for Business
page 11
Standardisation refers here to efforts to increase the comparability of environmental data,
between years (longitudinal), sites, functional units, products or resource uses. The most
common activity to standardise is normalisation, which transforms data into compatible or
comparable forms. Normalisation ensures that data is converted to units or to a form
compatible with a chosen standard or baseline or that it has common units. Typically,
normalised data allows more meaningful comparison across different seasons, production
volumes, product prices or physical characteristics, such as water or air temperature or other
variables.
By contrast, aggregation transforms data into different forms or formats to allow a better
understanding or interpretation of the data by different groups or for different purposes.
Aggregated physical indicators serve as summary indicators and give an overview of total
resource use, emissions and waste without being relative to production. Higher aggregation
allows the presentation of larger production units into an overall picture, thus allowing for the
interaction and interdependency of environmental effects. However, greater data aggregation
also imply less relevance for local or highly specific environmental issues. We suggest that data
aggregation is guided by the subsidiarity principle, namely that data is to be aggregated to the
lowest level of the organisational hierarchy where the decision can be made appropriately. We
also suggest as a general guidance, that indicators should be as simple as possible and only as
complex as necessary.
A special type of data aggregation uses potency factors, such as Ozone Depletion Potential, or
Global Warming Potential. Conversion or potency factors become relevant in intra-impact
assessment that aims to aggregate emissions of different physical/chemical nature into physical
indicators for pressures on various environmental endpoints. Common measurement units for
physical EIs are physical, chemical and biological units. Attempts to aggregate several indicators
will typically result in dimensionless measures (Tyteca 1996), outlined below.
Environmental Indicator for Business
page 12
4.2.Economic Standardisation (Business Activity Indicators)
A particular category of indicators are economic indicators, which link the information provided
by physical and impact indicators with relevant information on the activity of the production or
business units under investigation. Economic, financial and/or monetary quantities can be used
to scale the information contained in other kinds of indicators, i.e., physical and/or
environmental, or even impact indicators. Thus these indicators are typically in the form of
ratios, with the numerator containing the physical information, and the denominator holding
the economic or financial information:
Indicator = Physical and/or environmental quantityEconomic and/or financial quantity
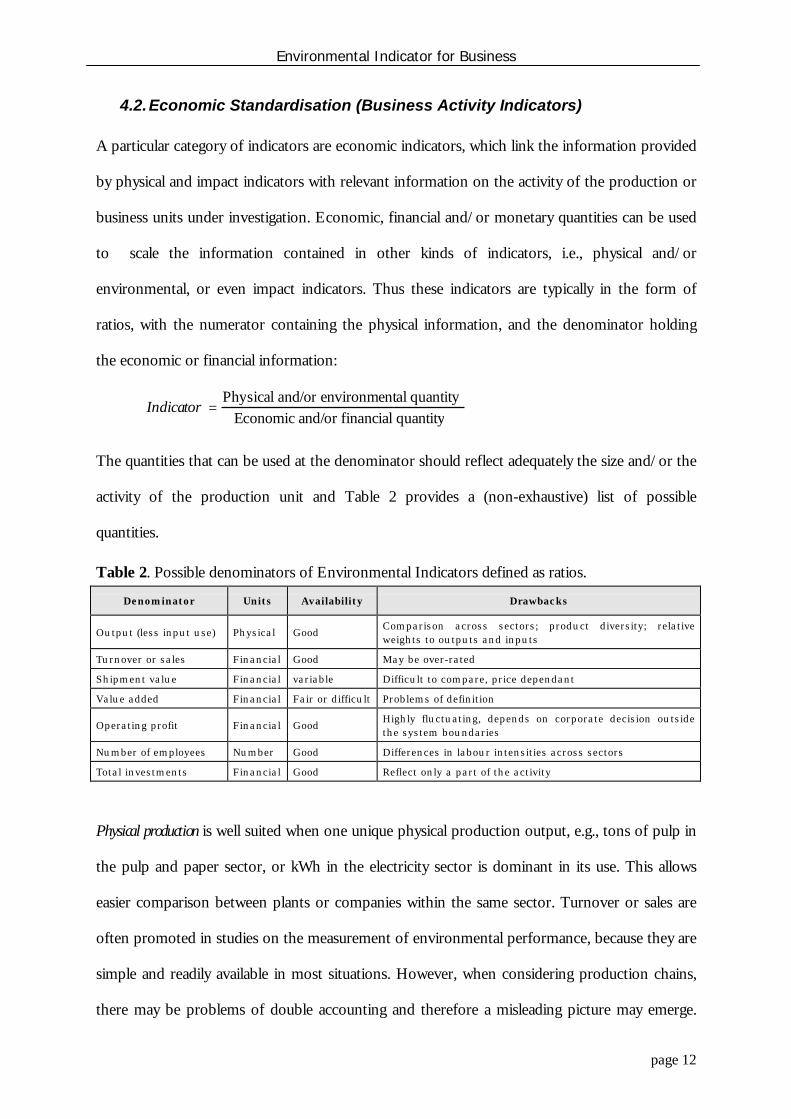
The quantities that can be used at the denominator should reflect adequately the size and/or the
activity of the production unit and Table 2 provides a (non-exhaustive) list of possible
quantities.
Table 2. Possible denominators of Environmental Indicators defined as ratios.
Denominator Units Availability Drawbacks
Output (less input use) Physical GoodComparison across sectors; product diversity; relativeweights to outputs and inputs
Turnover or sales Financial Good May be over-rated
Shipment value Financial variable Difficult to compare, price dependant
Value added Financial Fair or difficult Problems of definition
Operating profit Financial GoodHighly fluctuating, depends on corporate decision outsidethe system boundaries
Number of employees Number Good Differences in labour intensities across sectors
Total investments Financial Good Reflect only a part of the activity
Physical production is well suited when one unique physical production output, e.g., tons of pulp in
the pulp and paper sector, or kWh in the electricity sector is dominant in its use. This allows
easier comparison between plants or companies within the same sector. Turnover or sales are
often promoted in studies on the measurement of environmental performance, because they are
simple and readily available in most situations. However, when considering production chains,
there may be problems of double accounting and therefore a misleading picture may emerge.
Environmental Indicator for Business
page 13
Looking at environmental performance within a sector, a better measurement may therefore be
the shipment value (Martin et al. 1991).
The number of employees may be another proxy for the manufacturing activity; it is readily
available and does not entail the problems linked with financial quantities (Bartolomeo 1995;
Templet 1993). There may be additional problems using that quantity, due, e.g., to different
labour intensities in different sectors and/or different countries. Finally, total investments may
be taken as a substitute to either turnover or value added.
Value added is often advocated because it supposedly reflects the contribution of manufacturing
activity to the global welfare, as measured, e.g., by the national GDP. However, while its
definition at a macroeconomic level does not pose particular problems, definitions at the
corporate level may vary, depending upon the assumptions adopted and the socio-economic
and industrial context under consideration (Huizing & Dekker 1992). Economic value added
used at corporate level refers to above “normal” return on capital, which is not easily observable
and usually not reported by firms.
However, a particular problem regarding economic standardisation across sectors or nations is
the different degree of internalisation of environmental costs by the price mechanism. Firms in
an economy with few environmental taxes will be economically favoured compared to firms
operating in economies with “green taxes”. Indicators normalising with value added or profit
would thus favour firms in economies with low degree of internalisation.
Globally, it is surprising to see the large multiplicity of data and measurement units that are used
to describe business activities. Therefore, methods are needed to integrate various parameters
from different levels of analysis; the most frequently used of which are linear programming-
based methods (such as Data Envelope Analysis and the Productive Efficiency Method outlined
below), or, generally, multicriteria analysis.
Environmental Indicator for Business
page 14
4.3.Physical Aggregation: Impact Categories and Indicators
In policy making, the issue of changes in the environment is conceptualised as an ensemble of
environmental problems that can be addressed more or less mutually independently. The impact
of an emission (environmental pressure) relates then to different environmental fields (e.g.,
climate change, waste production). Following the practice in Life Cycle Assessment (SETAC-
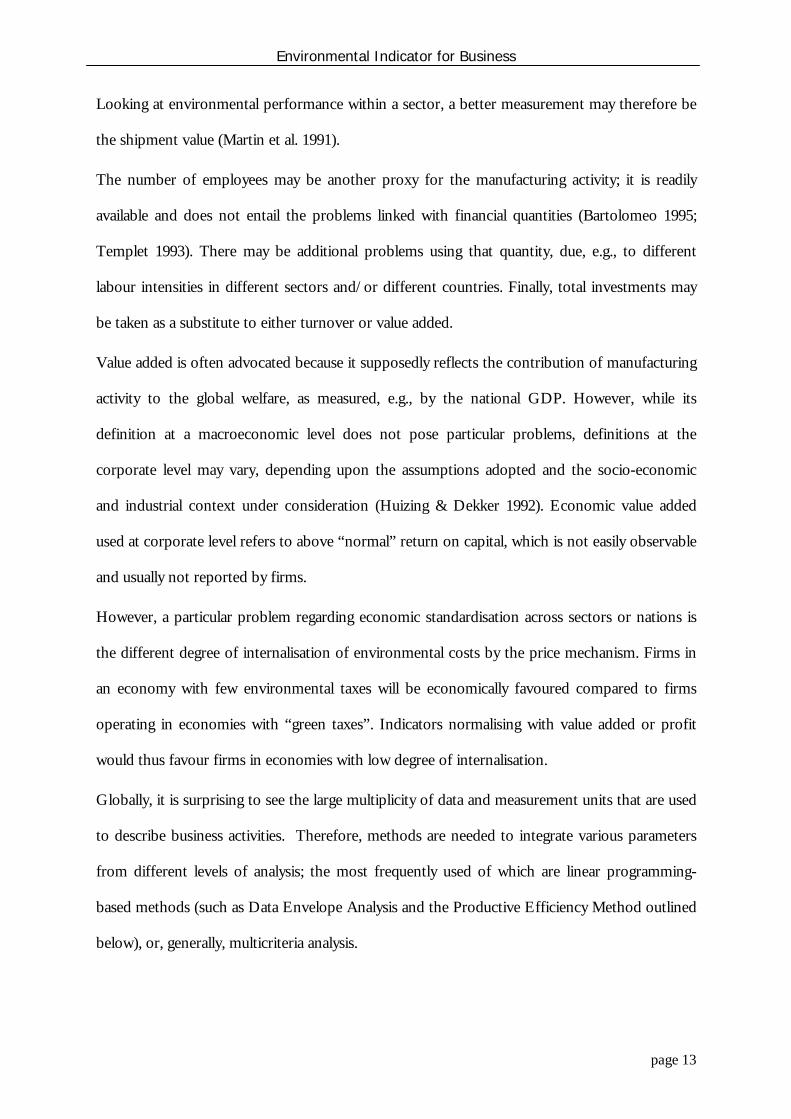
LCA, 1997) of products we call these fields impact categories. In the ISO terminology one speaks
of “environmental categories" (ISO 14042).
Table 3: Topics in environmental policies in different decisions contexts.Product policy. LCA-community SETAC (Udode Haes, 1996)
EU-environmental qualitypolicy.(EUROSTAT,1998;Lammers et al. 1999))
Corporate environmental policy indicators(Brophy, 1995 in Azzone et al. (1996).
Depletion andcompetition of abioticresources
Air pollutionWaste minimisation, reduceconsumption of non-renewableresources, energy efficient
Depletion andcompetition of bioticresources
Biodiversity loss Shared responsibility
Depletion andcompetition of land Climate Change Environmental training
Global warming Marine environment andcoastal zones
Targets and objectives set beyondminimum compliance
Depletion ofstratospheric ozone Ozone layer depletion Public disclosure
Human toxicologicalimpacts Resource depletion Sustainable development
Ecotoxicological impacts Dispersion of toxicsubstances Habitat conservation
Photo-oxidant formation Urban environmentalproblems Research and development
Acidification Waste BS7750, EMAS
Eutrophication Water pollution andwater resources World-wide standard
Odour Compensation for environmentaldamage
Radiation casualties Legislative compliance, liability onenvironmental issues
Noise
The concept of “an environmental problem or impact category” is a social construct, and
listings of environmental problems differ with the contexts within which impact categories have
Environmental Indicator for Business
page 15
been identified. For instance, Table 3, first column, lists impact categories that are often used in
product LCA and the second column shows impact categories as they are perceived in the
European context of environmental (quality) policy making. These indicators refer to
environmental condition in countries, and not to impacts of firms. The third column lists
impact categories as used in corporate environmental policy. This list shows that from a firm
management point of view there can be several dimensions that are relevant for constructing
indicators for corporate environmental policy making
An environmental impact may be the result of different environmental pressures. For instance,
the change in the condition of the ozone layer is the result of the emissions of different
substances. Similarly, the acidity of soils and surface water can be changed by different
pollutants. In those cases there are possibilities to normalise the impacts of these environmental
pressures (e.g., emissions) with respect to their impacts (e.g. impacts per kg emission). From the
above, we suggest that agreement should be sought to establish a list of relevant impact
categories that can be used as a guiding matrix for corporate environmental indicators.
4.4.Productive efficiency indicators
A further class of aggregate indicators is derived from the productive efficiency framework. This
methodology is based on quantities and information that are readily available, i.e., physical and
economic/financial quantities. A detailed discussion of the approach can be found in Tyteca
(1996 and 1998).
Essentially, the principles of the method are based on the premise that a production unit that
produces more output with the same level of inputs, or releases less of undesirable outputs (i.e.,
pollutants) for a given level of output production, is more efficient. Based on that standpoint,
for a given set of similar observed production units, the method then constructs a so-called
production frontier, such that observations lying on the frontier are declared "efficient", while

Environmental Indicator for Business
page 16
observations lying inside the frontier are declared "non-efficient", implying that the latter have
productivity slacks and that they can improve either their output production or their release of
undesirable outputs.
The method is an aggregation method in the sense that all relevant information taken into
account (i.e., production inputs and outputs, pollutants, financial quantities) are aggregated using
self-defined weighting coefficients, to produce an aggregate quantity, conventionally taken as 1
for units that are efficient, and less than 1 for non-efficient units. For each producing unit, the
method (based on linear programming techniques) seeks a weight combination that will yield the
maximum value of the efficiency. If the unit is efficient, that value will be 1; if no weight
combination exists such that efficiency takes the value 1, the unit is non-efficient. The
production frontier may be paralleled with the concept of best available technology, since points
lying on the frontier reflect best practice, relative to the observed data set.
The advantages of productive efficiency methods include standardisation, flexibility (since
various ratio alternatives can be formulated right away), robustness of the associated linear
programming methods, and "objectivity", because the weights are self-defined. However, we
should also be aware of a potential drawback of productive efficiency, i.e., the high sensitivity of
the results with respect to the number of factors and units considered. One should therefore be
aware that a given result can only be considered with reference to the associated data set.
However, this is no longer a drawback if we recall that best practice, or best available
technology, is always a relative concept that heavily depends on what actually exists. In general,
the higher the number of observations, and/or the lower the number of variables, the better the
discriminating power of productive efficiency methods. The productive efficiency methods such
as described can provide us with aggregate environmental indicators, that can be termed
"economic", because they are grounded in a theory that is basically economic.
Environmental Indicator for Business
page 17
4.5. Impact assessment and economic valuation
Many impact assessments involve an often subjective evaluation of the impact, and economics
offers a methodology to avoid such subjectivity, because, at least conceptually, it attempts to
apply societal judgement as it is revealed by market prices. In practice, this methodology is
difficult to follow since there is no market for the type of economic goods (e.g., environmental
quality) that impacts ‘constitute’.
Activities that cause environmental concerns are also often beneficial to individuals. From a
welfare economics perspective, a firm’s activities pose an (environmental) problem if the valued
concerns are larger than the valued benefits (optimal welfare is defined here as a Pareto
optimum). In a world which is ideal according to neo-classical economics, concerns and benefits
are priced by the market mechanism and in such a world there is no problem from a societal
point of view (individuals may still have problems). Coase (1960) argued famously that from the
perspective of economic efficiency, it does not matter if we tax the polluter or compensate the
pollution victim and that, accordingly, we should identify the alternative that has least
transaction cost and most social benefit.
However, in the real world there are concerns that environmental resources are not adequately
priced, the famous externalities of economic activities (e.g. safety in transport, environmental
externalities). Taking this view, the impact categories that are chosen should relate to
environmental externalities.
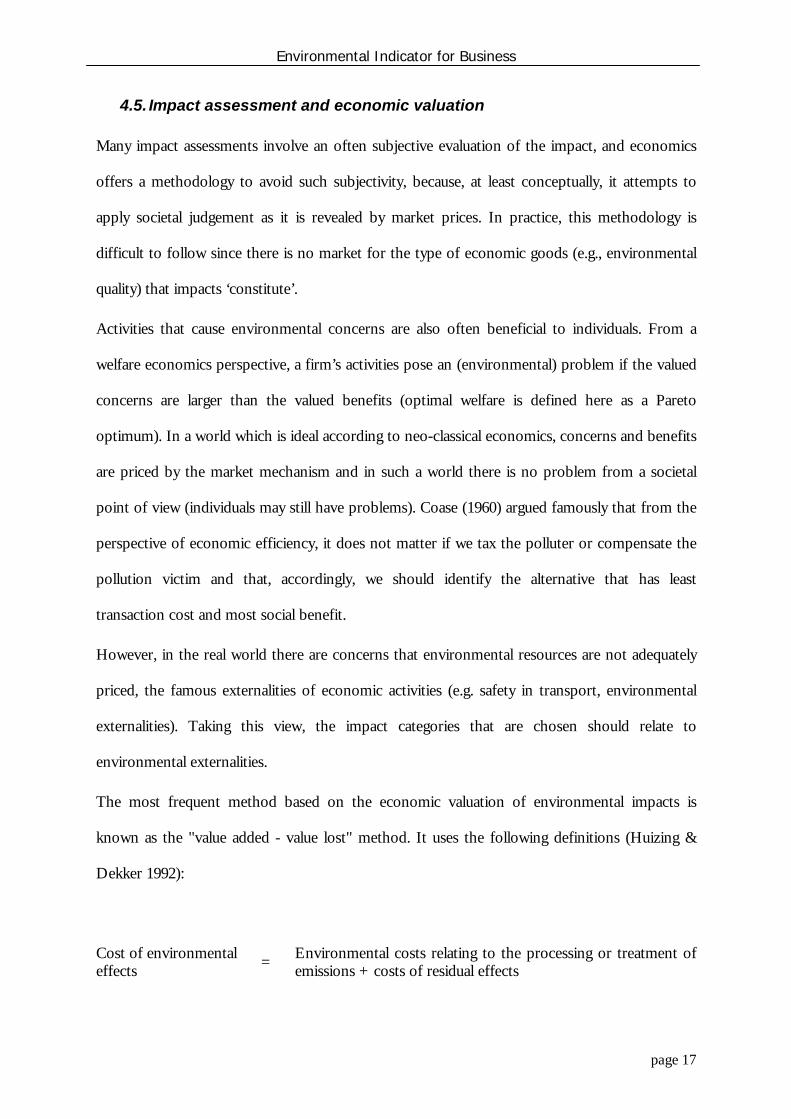
The most frequent method based on the economic valuation of environmental impacts is
known as the "value added - value lost" method. It uses the following definitions (Huizing &
Dekker 1992):
Cost of environmentaleffects = Environmental costs relating to the processing or treatment of
emissions + costs of residual effects
Environmental Indicator for Business
page 18
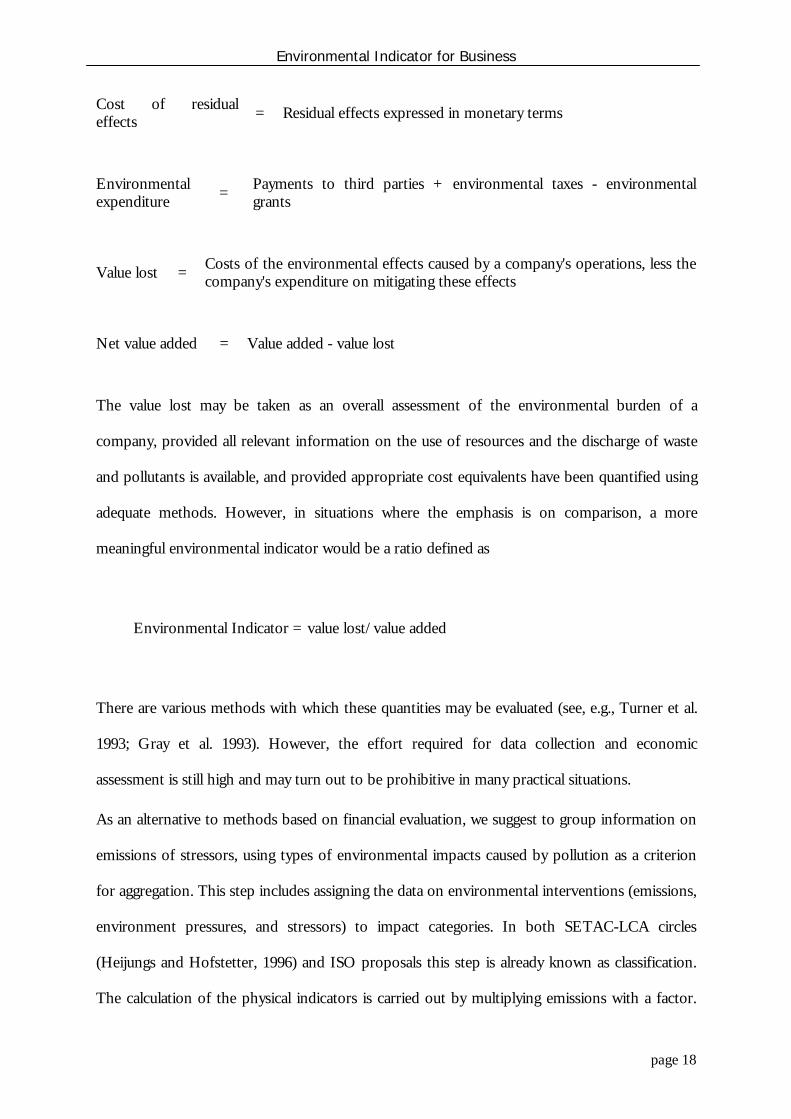
Cost of residualeffects = Residual effects expressed in monetary terms
Environmentalexpenditure = Payments to third parties + environmental taxes - environmental
grants
Value lost = Costs of the environmental effects caused by a company's operations, less thecompany's expenditure on mitigating these effects
Net value added = Value added - value lost
The value lost may be taken as an overall assessment of the environmental burden of a
company, provided all relevant information on the use of resources and the discharge of waste
and pollutants is available, and provided appropriate cost equivalents have been quantified using
adequate methods. However, in situations where the emphasis is on comparison, a more
meaningful environmental indicator would be a ratio defined as
Environmental Indicator = value lost/value added
There are various methods with which these quantities may be evaluated (see, e.g., Turner et al.
1993; Gray et al. 1993). However, the effort required for data collection and economic
assessment is still high and may turn out to be prohibitive in many practical situations.
As an alternative to methods based on financial evaluation, we suggest to group information on
emissions of stressors, using types of environmental impacts caused by pollution as a criterion
for aggregation. This step includes assigning the data on environmental interventions (emissions,
environment pressures, and stressors) to impact categories. In both SETAC-LCA circles
(Heijungs and Hofstetter, 1996) and ISO proposals this step is already known as classification.
The calculation of the physical indicators is carried out by multiplying emissions with a factor.
Environmental Indicator for Business
page 19
Such factor is called a characterisation factor (Udo de Haes, 1996), potency factor (Wright et al.,
1998) or equivalency factor (Heijungs et al., 1992; Hauschild and Wenzel, 1998)). Udo de Haes
(1996) distinguishes three broad groups of impact categories, namely (a) resources and related
impact categories; (b) human and eco-toxicity; and (c) non-toxic pollution.
Some studies have applied a broader approach, with the indicators ‘energy consumption’ or
‘tonnes of materials consumption’. These are aggregate measures. However, these indicators
should preferably not be used in combination with impact categories discussed above to avoid
double counting.
4.6.Management indicators
Management indicators (MIs) do not per se belong to the categories of standardised or aggregate
indicators of physical environmental performance. However, they are mentioned here because
they yield complementary information that often explains the environmental performance as
quantified by the physical, economic or impact indicators. MIs provide information on the
organisation’s capability and efforts in managing matters such as training, legal requirements,
resource allocation, documentation, and corrective action which have or can have an influence
on the organisation’s environmental performance. These MIs should assist evaluation of efforts
undertaken by management and actions to improve environmental performance. Two broad
classes can be identified, which (caricaturally) are referred to as "qualitative, subjective" and
"quantitative, objective".
The first class of MIs corresponds to those described in the Business Environment Barometer
(e.g., Belz & Strannegård 1997). They are designed for the measurement of perceptions,
attitudes, and strategies towards the environment. They also need global surveys to allow for the
assessment of the influence of various factors on perceptions and attitudes, or for cross sectoral
comparisons. Since there is no standardisation as to what is a "good" or "bad" attitude or
Environmental Indicator for Business
page 20
perception, even if we translate such information on Likert scales, there may be little
relationship between these and physical or impact indicators, especially if we want to compare
results from different surveys.
The second broad class of management indicators have the same goals as the previous ones, i.e.,
assess the efforts made, but here the information is based on quantified, verifiable information.
For instance, the European Green Table (1997) highlights examples of MIs as:
• Environmental investments;
• Running costs pertaining to environmental protection (fees, personnel expenses, fines,
energy, maintenance);
• Number of employees with specific environmental tasks;
• Number of reported incidents;
• Degree of compliance with regulation.
Some of the categories may be hard to distinguish and/or assess. As a traditional example, what
is the part of total investments that is devoted to the environment? This may be easy to answer
in the case of end-of-pipe treatment investments, but much harder in the case of new (cleaner)
production technologies. There is also the problem of distinguishing between recurrent and
capital investment and, in the latter category, between investment that replaces, upgrades on
environmental grounds, replaces on purely environmental grounds, or upgrades that
fundamentally alters the production system.
5. Conclusions
As the above literature review and the review of standardisation schemes has shown, many
divers and diverging approaches to environmental indicators exist for the firm level. These are

Environmental Indicator for Business
page 21
unlikely to be amalgamated into a single set of indicators - certainly not in the near future. In
addition, it is questionable whether such an approach is as desirable as it appears at first glance,
given the great diversity of applications, industries and stakeholders. As James March famously
observed: The World has an uncomfortable way of not permitting itself to be fitted into clean classifications.
However, it is still possible to point at standardised or aggregate indicators that prove popular in
practice, or have been proposed in the reviewed literature. It is the main point of this paper
that, to allow meaningful data use and cost-effective data collection and storage, that
environmental data should be normalised and, in a separate step, aggregated or standardised to
firm indicators that are suitable for the information needs of many different stakeholders.
5.1.Suggested Indicators
Table 4 gives an account of the essential results of this paper as they relate to standardisation or
aggregation. The operational uses, based on data availability, is generally good or fair, except for
category 4, where very large amounts of information is required to assess the costs of emission
treatment or processing as well as the financial equivalents of environmental impacts.
Table 4. Summary of candidate standardised and/or aggregate indicators and data requirements.
Category Possibleindicators
Data requirements
Physical production Physical quantities of inputs used and outputs producedFinancial quantities Value added, turnover, sales, shipment values, total investmentOperating profit Revenues, cost of sales, selling and administrative expenses
Business activityindicators
No of employees Total; engaged in production; wages
Environmentalimpactindicators
Contribution togreenhouse effectSurface waterpollution
Annual emissions and effluents (tons/year)Potency factors
Productiveefficiencyindicators
Various, dependingon emphasis oninputs and/oremissions and/orimpacts
Any kind as requested (same as in environmental and impactindicators): Physical quantities of inputs used (including, e.g.,number of employees, capital, energy, raw materials, (non-)renewable resources) and outputs produced; levels ofemissions and waste production; environmental impacts;financial quantities
Environmental Indicator for Business
page 22
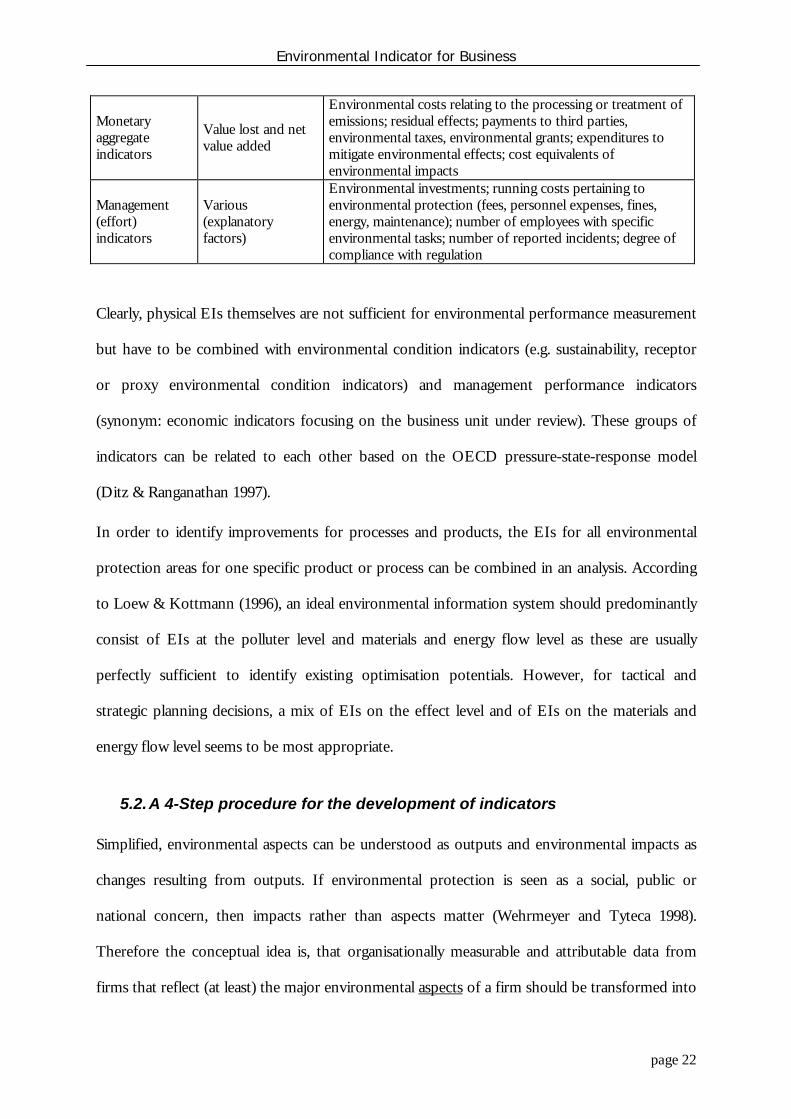
Monetaryaggregateindicators
Value lost and netvalue added
Environmental costs relating to the processing or treatment ofemissions; residual effects; payments to third parties,environmental taxes, environmental grants; expenditures tomitigate environmental effects; cost equivalents ofenvironmental impacts
Management(effort)indicators
Various(explanatoryfactors)
Environmental investments; running costs pertaining toenvironmental protection (fees, personnel expenses, fines,energy, maintenance); number of employees with specificenvironmental tasks; number of reported incidents; degree ofcompliance with regulation
Clearly, physical EIs themselves are not sufficient for environmental performance measurement
but have to be combined with environmental condition indicators (e.g. sustainability, receptor
or proxy environmental condition indicators) and management performance indicators
(synonym: economic indicators focusing on the business unit under review). These groups of
indicators can be related to each other based on the OECD pressure-state-response model
(Ditz & Ranganathan 1997).
In order to identify improvements for processes and products, the EIs for all environmental
protection areas for one specific product or process can be combined in an analysis. According
to Loew & Kottmann (1996), an ideal environmental information system should predominantly
consist of EIs at the polluter level and materials and energy flow level as these are usually
perfectly sufficient to identify existing optimisation potentials. However, for tactical and
strategic planning decisions, a mix of EIs on the effect level and of EIs on the materials and
energy flow level seems to be most appropriate.
5.2.A 4-Step procedure for the development of indicators
Simplified, environmental aspects can be understood as outputs and environmental impacts as
changes resulting from outputs. If environmental protection is seen as a social, public or
national concern, then impacts rather than aspects matter (Wehrmeyer and Tyteca 1998).
Therefore the conceptual idea is, that organisationally measurable and attributable data from
firms that reflect (at least) the major environmental aspects of a firm should be transformed into
Environmental Indicator for Business
page 23
at least indicative or surrogate information on environmental impacts, grouped in impact
categories or scaled using science-based potency factors or other alternative methods (e.g. asking
for public assessment, given the nature of environmental problems as a social construct).
The central challenge in developing indicators is to generate and disseminate information about
the environmental behaviour of the decision-making unit that is meaningful, accurate relevant
for the information user and cost-effective. There are no universal ways to achieve this, as each
set of indicators should be specific to the organisational context and the information
requirements of the user. However, to harmonise the indicator development and information
dissemination efforts, we propose harmonisation and, ipso facto, collaboration on the
development of indicators as well as a separation between data gathering and normalisation and
the use of data as inputs for indicators. Therefore, the process of developing appropriate
indicators has these core elements:
1. The collection of (time-series) data on firms/facilities about physical indicators,
economic/business/management and environmental indicators. The result of this step are
economic or environmental or social variables that are describing the system under review.
2. The establishment of the database with environmental indicators, requiring the later use of
potency factors (e.g. Greenhouse Gas warming potentials) for aggregating emission data.
The result of this step is an electronic storage of normalised data. This normalisation refers
to the physical units in which the data is stored as well as the uniformity of measurement,
often described in the data collection protocol. It thus prevents that, for example, energy
data is collected in GigaJoules as well as BTUs, Therms and kWhrs. It also ensures that, in
the case of a company with several sites, all sites measure energy at the same point and to
the same criteria.
3. Where appropriate and feasible to aggregate environmental indicators (by category) into a
single indicator for environmental impacts (possibly with public assessment). The result of

Environmental Indicator for Business
page 24
this step is an integration of different environmental time series to describe environmental
performance at the appropriate level - be this for the site, a company, several companies of
the same area or sector, nationally or globally.
4. Combine these data into performance indicators, using any of the above standardisation
schemes as denominator or normalising factor.
This then allows an analysis of differences in environmental performances of different firms or
over time. Table 5 provides an illustrative example:
Step Example1 Data Collection Energy consumption data
2 Establishmentof database
Normalise data into common unit of measure (J), normalise for differentprocesses, ensure normalisation of collection protocol etc.
3 Aggregation Aggregate to tons of Carbon Equivalent / Greenhouse WarmingPotential
4 Standardisation Carbon equivalent per turnover etc.
The proposed methodology allows flexibility in the way data is standardised and tailored towards
specific data users and their requirements, without actually preventing the data from being used
for other purposes as well. By separating data normalisation from subsequent stages in the data
manipulation from “raw” data to environmental information, including aggregation or
standardisation, the indicator generation is also separated from the data collection. It is hoped
that such a “pooling” of normalised data can further facilitate a cost-effective use of
environmental information for a variety of purposes and users. If in due course, the
standardisation procedures themselves become standardised - which is especially necessary in
the economic valuation and the management indicator schemes as outlined above - the dataset
should be available.
Environmental Indicator for Business
page 25
6. References
Azzone, G., G. Noci, R. Manzini, R. Welford and C. William Young, 1996. Defining
environmental performance indicators: an integrated framework, Business Strategy and the
Environment, Vol. 5, p. 69-80.
Bartolomeo, M., 1995. Environmental performance indicators in industry. Fondazione Eni
Enrico Matei, Nota di Lavoro 41.95, Milano (Italy).
Belz, F. & Strannegård, L. (eds.), 1997. International Business Environmental Barometer.
Cappelen Akademisk Forlag, Oslo.
Bennett, M. and P. James, 1997. Environment-related Performance Measurement: Current
Practice and Trends. Ashridge Management College, Berkhansted, Herts, UK.
Bennett M. and James P., 1998. Environment under the Spotlight: Current Practice and Future
Trends in Environment-Related Performance Measurement for Business. London:
ACCA
Bundesumweltministerium and Umweltbundesamt (1997): Leitfaden Betriebliche
Umweltkennzahlen. January 1997: BMU/UBA.
Canadian Institute of Chartered Accountants (CICA), 1994. Reporting on Environmental
Performance. Toronto, Ontario.
CERES, (1996), 1995 CERES Report Standard Form and Help guide. Instructions for
Companies, Coalition for Environmentally Responsible Economies, Boston MA
Coase, R. (1960) The Problem of Social Cost. The Journal of Law and Economics, Vol. 3, 1-45.
Ditz D. and Ranganathan J. (1997): Measuring Up. Toward a Common Framework for Tracking
Corporate Environmental Performance. Washington D.C.: World Resources Institute
European Green Table, 1997. Environmental Performance Indicators in Industry. Report 5:
Practical experiences with developing EPIs in 12 companies. Oslo, March 1997.
EUROSTAT 1998. www.telcom.es/tau/indicat.htm.
Fisksel, D. (1996): Design for the Environment. New York: McGraw-Hill; .
Gee, D. and Moll, D. (1998) Information for Sustainability: Eco-Efficiency Indicators.
Kopenhagen: European Environment Agency (EEA); 1998 Jun 15.
Gray, R., with Bebbington, J. & Walters, D., 1993. Accounting for the Environment. Paul
Chapman Publishing Ltd., London.
Hauschild, M. and H. Wenzel, (1998), Environmental Assessment of Products. Volume 2:
Scientific background, Chapman & Hall, London
Environmental Indicator for Business
page 26
Heijungs R., and P. Hofstetter, 1996. Definitions of terms and symbols, In: Udo de Haes Ed.:
Towards a Methodology for Life Cycle Impact Assessment, p. 31-39, SETAC Europe,
Brussels.
Huizing, A. & Dekker, H.C., 1992. Helping to pull our planet out of the red: an environmental
report of BSO/Origin. Accounting, Organizations and Society 17: 449-458.
ICI. Environmental Burden: The ICI Approach. London: ICI; 1997.
ISO, (1997), Certified ISO14000 US Companies/Facilities, http:/www.iso4000.net/
James, P. and Bennett, M. (1996): Environment-related Performance Measurement in Business -
From Emissions to Profit and Sustainability? Ashridge Management Research Group; .
Kuik. O. and H. Verbruggen (eds), (1991), In search of indicators for sustainable development,
Kluwer, Dordrecht.
Lammers, P.E.M., and A.J. Gilbert (Eds.), 1999. Handbook of Environmental Pressure Indices,
Institute for Environmental Studies, IVM-VU E-99/07, Amsterdam.
Loew T. and Kottmann H. (1996): Kennzahlen im Umweltmanagement. Oekologisches
Wirtschaften. Vol 1; pp. 10-12
Martin, P., Wheeler, D., Hettige, M. & Stengren, R., 1991. The industrial pollution projection
system: concept, initial development and critical assessment. World Bank, Discussion
paper, October 1991.
NRTEE (National Round Table on the Environment and the Economy), (1997), Measuring
Eco-Efficiency in Business: backgrounder, (NRTEE- www.nrtee-trnee.can), Renouf,
Ottowa
OECD, 1994, Environmental indicators: OECD core set, OECD, Paris
Ranganathan, J. Sustainability Rulers: Measuring Corporate Environmental & Social
Performance. Washington D.C.: World Resources Institute (WRI); 1998 May.
SETAC . Life-cycle assessment. Brussels: Society of Environmental Toxicology and Chemistry -
Europe (SETAC); 1992.
Technical Committee 207. ISO14031 Environmental Management - Environmental
Performance Evaluation, International Standard. ISO; 1996.
Templet, P.H., 1993. The emissions-to-job ratio. Environmental Science & Technology 27: 810-812.
Turner, R.K., Pearce, D. & Bateman, I., 1993. Environmental economics - An elementary
introduction. Johns Hopkins University Press, Baltimore, Maryland.
Tyteca, D., 1996. On the measurement of the environmental performance of firms - a literature
review and a productive efficiency perspective. Journal of Environmental Management 46:
281-308.
Environmental Indicator for Business
page 27
Tyteca, D., 1998. Sustainability indicators at the firm level: pollution and resource efficiency as a
necessary condition towards sustainability. Journal of Industrial Ecology 2 (4): 61-77.
Udo de Haes, H.A., Ed., (1996), Towards a methodology for life cycle impact assessment,
SETAC-Europe, Brussels
Wehrmeyer, W and Tyteca, D. (1998) Measuring Environmental Performance for Industry:
From Legitimacy to Sustainability? The International Journal of Sustainable Development and
World Ecology. Sep; Vol 5, pp 111-124
World Business Council for Sustainable Development (WBCSD). Eco-Efficient Leadership.
Geneva: 1996
Wright, M., D. Allen, R. Clift, and H. Sas, (1998), Measuring Corporate Environmental
Performance. The ICI Environmental Burden System. Journal of Industrial Ecology, Vol 1,
No. 4, p 117-127.
7. Acknowledgements
Thanks are due to several colleagues for valuable discussions and information, and more
especially Terje Synnestvedt and Bjarne Ytterhus from the Norwegian School of Managmeent,
Oslo. Within the MEPI team, the report benefited from suggestions and ideas by Frans
Berkhout, Malcolm Eames and Christine Jasch. We dedicate this paper to the memory of
Jérôme Carlens who sadly died recently.
Top Related
Copyright © 2022 FDOKUMEN

