


Bahasa
Halaman
Hukum

Environment Impact assessment Report for M/s. Kapila Metals Pvt. Ltd, MIDC, Jalna 1
ENVIRONMENTAL IMPACT ASSESSMENT REPORT
For
PROPOSED PROJECT (Production of Sponge iron 1000 TPD, Captive Power 50 MW,
Billets 1000 TPD/TMT Bar 1000 TPD)
By
M/s. KAPILA METALS PVT.LTD.
At Additional MIDC, Phase –III,
Plot No: B-102 to 105, ,Dist : Jalna
Maharashtra
Prepared by
ULTRA-TECH
Environmental Consultancy & Laboratory)
Recognized by MoEF and NABET Accredited
August 2016
Revision 01
Environment Impact assessment Report for M/s. Kapila Metals Pvt. Ltd, MIDC, Jalna 2
INDEX
1 CHAPTER – INTRODUCTION........................................................................................... 16
1.1 Introduction: ................................................................................................................... 16
1.2 Size Location and Nature of the project: ........................................................................ 16
1.3 Geographical location of site : (Generic ToR point 3 (iii, iv,v)) .................................... 17
1.4 ToR Compliance Details ................................................................................................ 18
2 CHAPTER - PROJECT DESCRIPTION .............................................................................. 26
2.1 Process Description: (ToR point No. 11,15) .................................................................. 26
2.1.1 List of Raw Material: .................................................................................................. 26
2.1.2 Process Description of DRI (Sponge Iron) SL/RN Process: ...................................... 26
2.1.3 Process Description for Billet Production: ................................................................. 29
2.1.4 Manufacturing Process of Rolled Products: ............................................................... 32
2.2 Power Generation Process: (ToR point No.15) .............................................................. 34
2.3 Raw Materials: ................................................................ Error! Bookmark not defined.
2.4 Process Equipment: ........................................................................................................ 37
2.4.1 Power: ......................................................................................................................... 38
2.4.2 Water: .......................................................................................................................... 38
2.4.3 Sewage generation: ..................................................................................................... 38
2.4.4 Total solid waste generation: ...................................................................................... 39
2.4.5 Manpower: .................................................................................................................. 39
3 CHAPTER – BASELINE ENVIRONMENTAL STATUS .................................................. 40
3.1 Introduction: ................................................................................................................... 40
3.2 Air Quality...................................................................................................................... 40
3.2.1 Selection of sampling Locations (Generic ToR point No. 21) ................................... 41
3.3 Water Environment (Generic ToR point No. 23) ........................................................... 42
3.4 Soil Environment: .......................................................................................................... 45
3.5 Noise Environment:........................................................................................................ 49
3.5.1 Noise Levels (Generic ToR point No. 25) .................................................................. 49
3.6 Land use Studies: ........................................................................................................... 50
3.6.1 Land use/Land cover Classification System : ............................................................. 51
3.6.2 Topography: ................................................................................................................ 52
3.7 Geology: (Generic ToR point No. 18) ........................................................................... 53
3.7.1 Meteorology: ............................................................................................................... 54
3.7.2 Temperature: ............................................................................................................... 54
3.7.3 Humidity: .................................................................................................................... 56
3.7.4 Cloudiness: .................................................................................................................. 56
3.7.5 Wind speed and Wind direction: ................................................................................. 56
3.7.6 Windrows: ................................................................................................................... 57
3.8 Biological Environment: ................................................................................................ 58
3.8.1 Biological assessment (Generic TOR Point No. 28) .................................................. 58
3.8.2 Flora: ........................................................................................................................... 59
3.8.3 Avifauna in the study area: ......................................................................................... 60
3.8.4 Aquatic Flora: ............................................................................................................. 60
3.9 Socio-Economic: ............................................................................................................ 63
3.9.1 Jalna District: Basic Information: ............................................................................... 63
3.9.2 Database and Methodology: ....................................................................................... 63
3.9.3 Demography ................................................................................................................ 64
3.9.4 Working Population: ................................................................................................... 64
3.9.5 Infrastructure: .............................................................................................................. 66
Environment Impact assessment Report for M/s. Kapila Metals Pvt. Ltd, MIDC, Jalna 3
3.9.6 Historical/Archeological/Forest: ................................................................................. 67
3.9.7 Industries: .................................................................................................................... 67
4 CHAPTER - ENVIRONMENTAL IMPACT ASSESSMENT, PREDICTION AND
MITIGATION MEASURES ................................................................................................. 69
4.1 Air Environment:............................................................. Error! Bookmark not defined.
(Generic ToR point No. 36, 37) ................................................. Error! Bookmark not defined.
4.1.1 Description of Electro Static Precipitator (ESP) for 500 TPD DRI kiln unit: ..... Error!
Bookmark not defined. 4.2 Air Modeling : (Generic ToR point No. 22,29,30,31) .................................................... 73
4.2.1 Input to Model............................................................................................................. 73
4.2.2 Prediction: ................................................................................................................... 74
4.2.3 Impact Assessment...................................................................................................... 75
4.2.4 Emission with & without air pollution control device: Error! Bookmark not defined.
4.3 Water Environment: (Generic ToR point No. 32, 33,35) ............................................... 78
4.3.1 ETP Capacity 20KLD: (Generic ToR point No. 34) .................................................. 79
4.3.2 Rain water Harvesting: (Generic ToR point No. 41) .................................................. 79
4.4 Soil and Biological Environment: ................................... Error! Bookmark not defined.
4.4.1 Solid Waste Management: (Generic ToR point No. 38) ............................................. 80
4.5 Green belt: ...................................................................................................................... 81
4.6 Mitigation Measures:....................................................... Error! Bookmark not defined.
4.6.1 Air Environment: ......................................................... Error! Bookmark not defined.
4.7 Noise Environment:......................................................... Error! Bookmark not defined.
4.7.1 Impacts due to Construction Equipment: ..................... Error! Bookmark not defined.
4.7.2 Operation phase: .......................................................... Error! Bookmark not defined.
4.8 Water Environment: ........................................................ Error! Bookmark not defined.
4.8.1 Construction Phase: ..................................................... Error! Bookmark not defined.
4.8.2 Operation Phase: .......................................................... Error! Bookmark not defined.
4.9 Impact on socio-economic status: ................................... Error! Bookmark not defined.
4.9.1 Mitigation Measures: ................................................... Error! Bookmark not defined.
5 CHAPTER - ANALYSIS OF ALTERNATIVESTECHNOLOGY & SITE ........................ 83
5.1 Raw materials and Technology: ..................................................................................... 83
5.2 Site Alternatives: ............................................................................................................ 84
5.3 ‘NO-PROJECT’ Option: ................................................................................................ 84
6 CHAPTER – ENVIRONMENT MANAGEMENT PLAN .................................................. 85
6.1 Introduction: ................................................................................................................... 85
6.2 EMP structure and funds (Generic ToR point No. 44) .................................................. 85
6.3 Environmental Monitoring Schedule: ............................................................................ 86
6.3.1 Action Schedules: ....................................................................................................... 86
6.3.2 Daily Compliance: ...................................................................................................... 86
6.3.3 Monthly Compliance: ................................................................................................. 87
6.3.4 Quarterly Compliance: ................................................................................................ 87
6.3.5 Yearly Compliance: .................................................................................................... 87
7 CHAPTER - ADDITIONAL STUDIES ............................................................................... 88
7.1 Public consultation: ........................................................................................................ 88
7.2 Risk assessment: ............................................................................................................. 88
7.3 Disaster Management Plan:(Generic ToR point No. 45) ............................................... 92
7.4 HAZOP: ......................................................................................................................... 90
7.4.1 Objectives ................................................................................................................... 90
7.4.2 Elements of On-Site Plan: ........................................................................................... 90
7.5 Social Impact Assessment ............................................... Error! Bookmark not defined.
Environment Impact assessment Report for M/s. Kapila Metals Pvt. Ltd, MIDC, Jalna 4
7.5.1 Employment & Wages: ................................................ Error! Bookmark not defined.
7.6 Traffic Management: (Generic ToR Point No. 27) ........................................................ 93
7.7 Conclusion:..................................................................................................................... 93
8 CHAPTER - PROJECT BENEFITS ..................................................................................... 94
8.1 Improvements in the physical infrastructure: ................................................................. 94
8.2 Improvements in the social infrastructure: ..................................................................... 94
8.3 Other tangible benefits: .................................................................................................. 95
9 CHAPTER - ENVIRONMENT MANAGEMENT PLAN (EMP) ....................................... 96
9.1 Need: .............................................................................................................................. 96
9.2 Objectives: ...................................................................................................................... 96
9.2.1 Environment Components: ......................................................................................... 96
9.3 Environmental Monitoring Schedule: .......................................................................... 101
9.4 Watch-dog Committee: ................................................................................................ 102
9.4.1 Construction Phase Management:............................................................................. 103
9.5 Conclusion:................................................................................................................... 104
10 CHAPTER CONSULTANTS ENGAGED ......................................................................... 105
Environment Impact assessment Report for M/s. Kapila Metals Pvt. Ltd, MIDC, Jalna 5
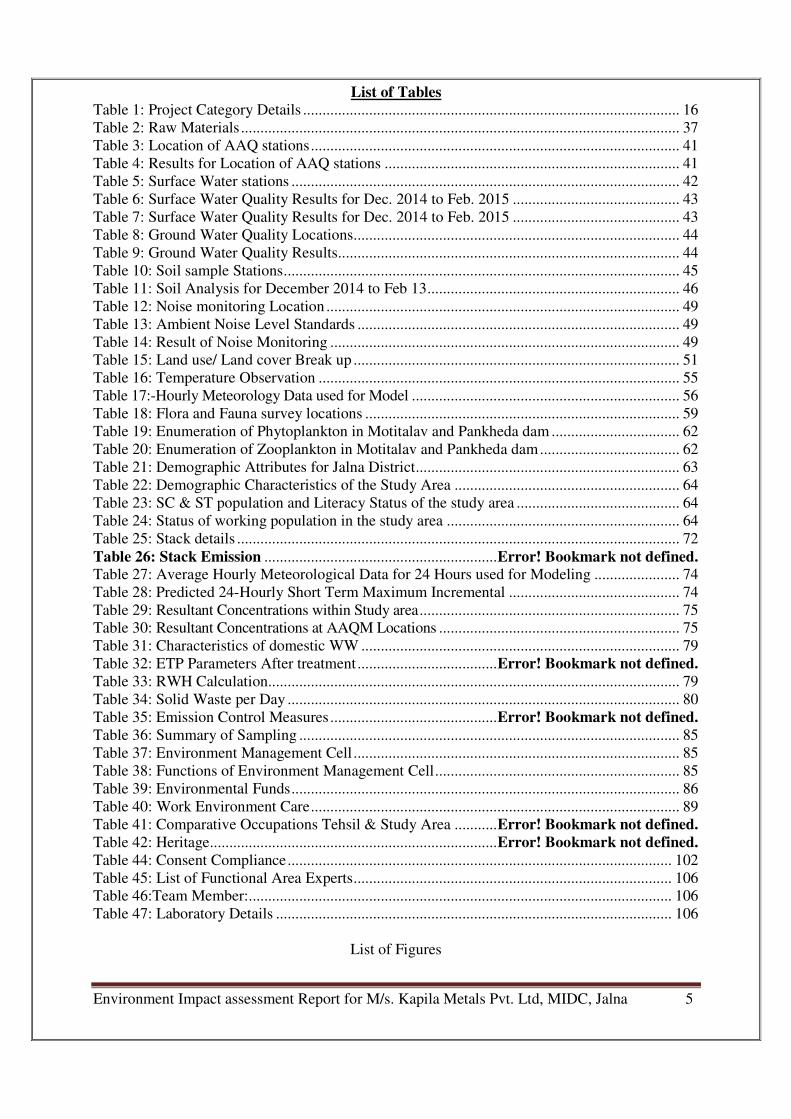
List of Tables Table 1: Project Category Details ................................................................................................. 16
Table 2: Raw Materials ................................................................................................................. 37
Table 3: Location of AAQ stations ............................................................................................... 41
Table 4: Results for Location of AAQ stations ............................................................................ 41
Table 5: Surface Water stations .................................................................................................... 42
Table 6: Surface Water Quality Results for Dec. 2014 to Feb. 2015 ........................................... 43
Table 7: Surface Water Quality Results for Dec. 2014 to Feb. 2015 ........................................... 43
Table 8: Ground Water Quality Locations .................................................................................... 44
Table 9: Ground Water Quality Results ........................................................................................ 44
Table 10: Soil sample Stations ...................................................................................................... 45
Table 11: Soil Analysis for December 2014 to Feb 13 ................................................................. 46
Table 12: Noise monitoring Location ........................................................................................... 49
Table 13: Ambient Noise Level Standards ................................................................................... 49
Table 14: Result of Noise Monitoring .......................................................................................... 49
Table 15: Land use/ Land cover Break up .................................................................................... 51
Table 16: Temperature Observation ............................................................................................. 55
Table 17:-Hourly Meteorology Data used for Model ..................................................................... 56
Table 18: Flora and Fauna survey locations ................................................................................. 59
Table 19: Enumeration of Phytoplankton in Motitalav and Pankheda dam ................................. 62
Table 20: Enumeration of Zooplankton in Motitalav and Pankheda dam .................................... 62
Table 21: Demographic Attributes for Jalna District .................................................................... 63
Table 22: Demographic Characteristics of the Study Area .......................................................... 64
Table 23: SC & ST population and Literacy Status of the study area .......................................... 64
Table 24: Status of working population in the study area ............................................................ 64
Table 25: Stack details .................................................................................................................. 72
Table 26: Stack Emission ............................................................ Error! Bookmark not defined. Table 27: Average Hourly Meteorological Data for 24 Hours used for Modeling ...................... 74
Table 28: Predicted 24-Hourly Short Term Maximum Incremental ............................................ 74
Table 29: Resultant Concentrations within Study area ................................................................... 75
Table 30: Resultant Concentrations at AAQM Locations .............................................................. 75
Table 31: Characteristics of domestic WW .................................................................................. 79
Table 32: ETP Parameters After treatment .................................... Error! Bookmark not defined.
Table 33: RWH Calculation.......................................................................................................... 79
Table 34: Solid Waste per Day ..................................................................................................... 80
Table 35: Emission Control Measures ........................................... Error! Bookmark not defined.
Table 36: Summary of Sampling .................................................................................................. 85
Table 37: Environment Management Cell .................................................................................... 85
Table 38: Functions of Environment Management Cell ............................................................... 85
Table 39: Environmental Funds .................................................................................................... 86
Table 40: Work Environment Care ............................................................................................... 89
Table 41: Comparative Occupations Tehsil & Study Area ........... Error! Bookmark not defined.
Table 42: Heritage.......................................................................... Error! Bookmark not defined.
Table 44: Consent Compliance ................................................................................................... 102
Table 45: List of Functional Area Experts .................................................................................. 106
Table 46:Team Member:............................................................................................................. 106
Table 47: Laboratory Details ...................................................................................................... 106
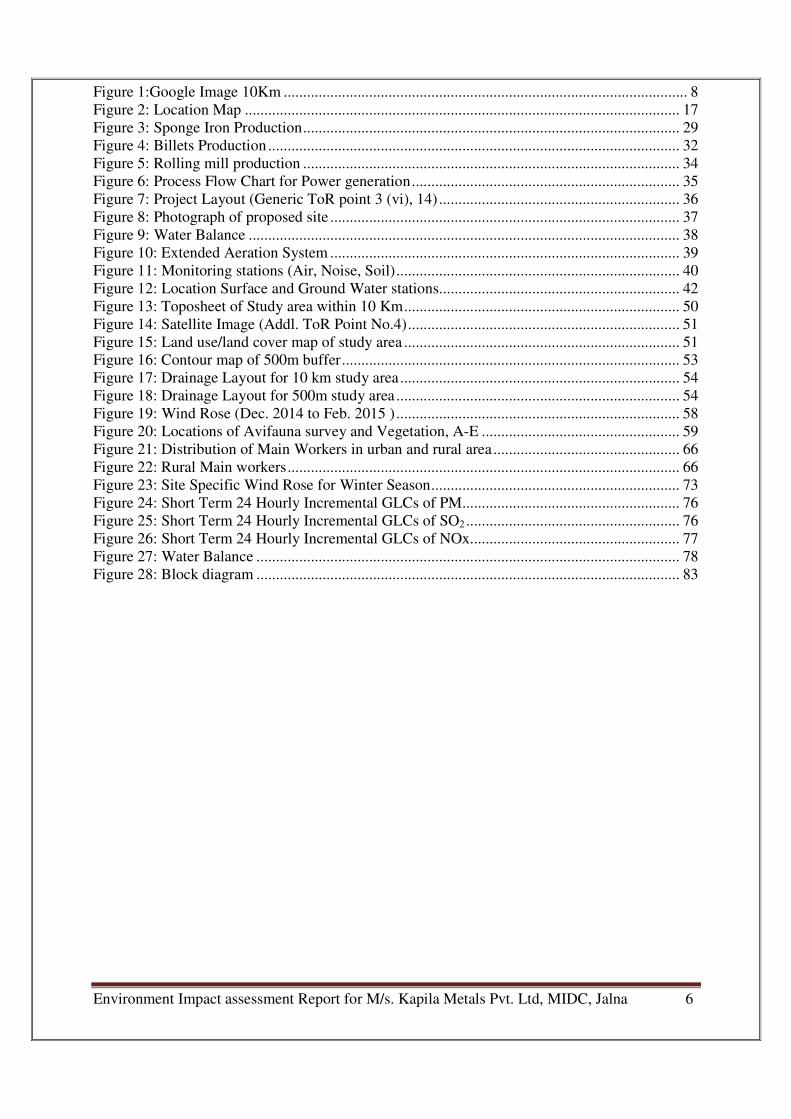
List of Figures
Environment Impact assessment Report for M/s. Kapila Metals Pvt. Ltd, MIDC, Jalna 6
Figure 1:Google Image 10Km ........................................................................................................ 8
Figure 2: Location Map ................................................................................................................ 17
Figure 3: Sponge Iron Production ................................................................................................. 29
Figure 4: Billets Production .......................................................................................................... 32
Figure 5: Rolling mill production ................................................................................................. 34
Figure 6: Process Flow Chart for Power generation ..................................................................... 35
Figure 7: Project Layout (Generic ToR point 3 (vi), 14) .............................................................. 36
Figure 8: Photograph of proposed site .......................................................................................... 37
Figure 9: Water Balance ............................................................................................................... 38
Figure 10: Extended Aeration System .......................................................................................... 39
Figure 11: Monitoring stations (Air, Noise, Soil) ......................................................................... 40
Figure 12: Location Surface and Ground Water stations.............................................................. 42
Figure 13: Toposheet of Study area within 10 Km ....................................................................... 50
Figure 14: Satellite Image (Addl. ToR Point No.4) ...................................................................... 51
Figure 15: Land use/land cover map of study area ....................................................................... 51
Figure 16: Contour map of 500m buffer ....................................................................................... 53
Figure 17: Drainage Layout for 10 km study area ........................................................................ 54
Figure 18: Drainage Layout for 500m study area ......................................................................... 54
Figure 19: Wind Rose (Dec. 2014 to Feb. 2015 ) ......................................................................... 58
Figure 20: Locations of Avifauna survey and Vegetation, A-E ................................................... 59
Figure 21: Distribution of Main Workers in urban and rural area ................................................ 66
Figure 22: Rural Main workers ..................................................................................................... 66
Figure 23: Site Specific Wind Rose for Winter Season ................................................................ 73
Figure 24: Short Term 24 Hourly Incremental GLCs of PM ........................................................ 76
Figure 25: Short Term 24 Hourly Incremental GLCs of SO2 ....................................................... 76
Figure 26: Short Term 24 Hourly Incremental GLCs of NOx ...................................................... 77
Figure 27: Water Balance ............................................................................................................. 78
Figure 28: Block diagram ............................................................................................................. 83
Environment Impact assessment Report for M/s. Kapila Metals Pvt. Ltd, MIDC, Jalna 7
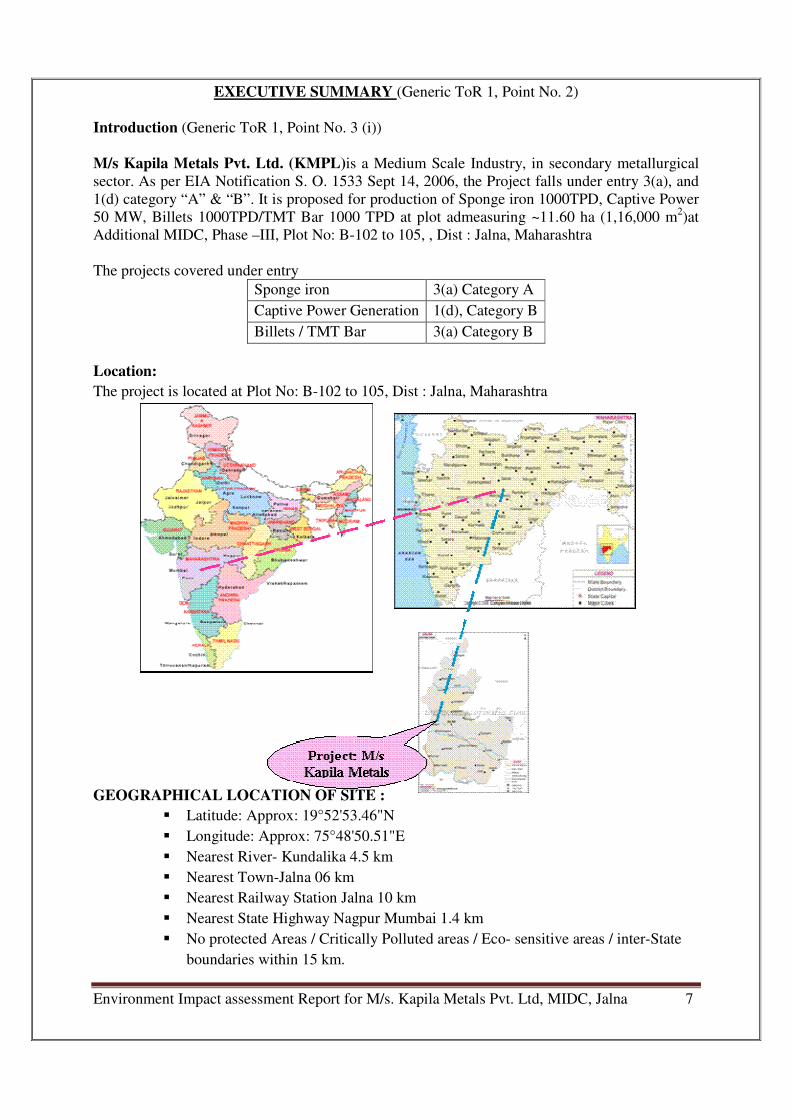
EXECUTIVE SUMMARY (Generic ToR 1, Point No. 2)
Introduction (Generic ToR 1, Point No. 3 (i))
M/s Kapila Metals Pvt. Ltd. (KMPL)is a Medium Scale Industry, in secondary metallurgical
sector. As per EIA Notification S. O. 1533 Sept 14, 2006, the Project falls under entry 3(a), and
1(d) category “A” & “B”. It is proposed for production of Sponge iron 1000TPD, Captive Power
50 MW, Billets 1000TPD/TMT Bar 1000 TPD at plot admeasuring ~11.60 ha (1,16,000 m2)at
Additional MIDC, Phase –III, Plot No: B-102 to 105, , Dist : Jalna, Maharashtra
The projects covered under entry
Sponge iron 3(a) Category A
Captive Power Generation 1(d), Category B
Billets / TMT Bar 3(a) Category B
Location:
The project is located at Plot No: B-102 to 105, Dist : Jalna, Maharashtra
GEOGRAPHICAL LOCATION OF SITE :
� Latitude: Approx: 19°52'53.46"N
� Longitude: Approx: 75°48'50.51"E
� Nearest River- Kundalika 4.5 km
� Nearest Town-Jalna 06 km
� Nearest Railway Station Jalna 10 km
� Nearest State Highway Nagpur Mumbai 1.4 km
� No protected Areas / Critically Polluted areas / Eco- sensitive areas / inter-State
boundaries within 15 km.
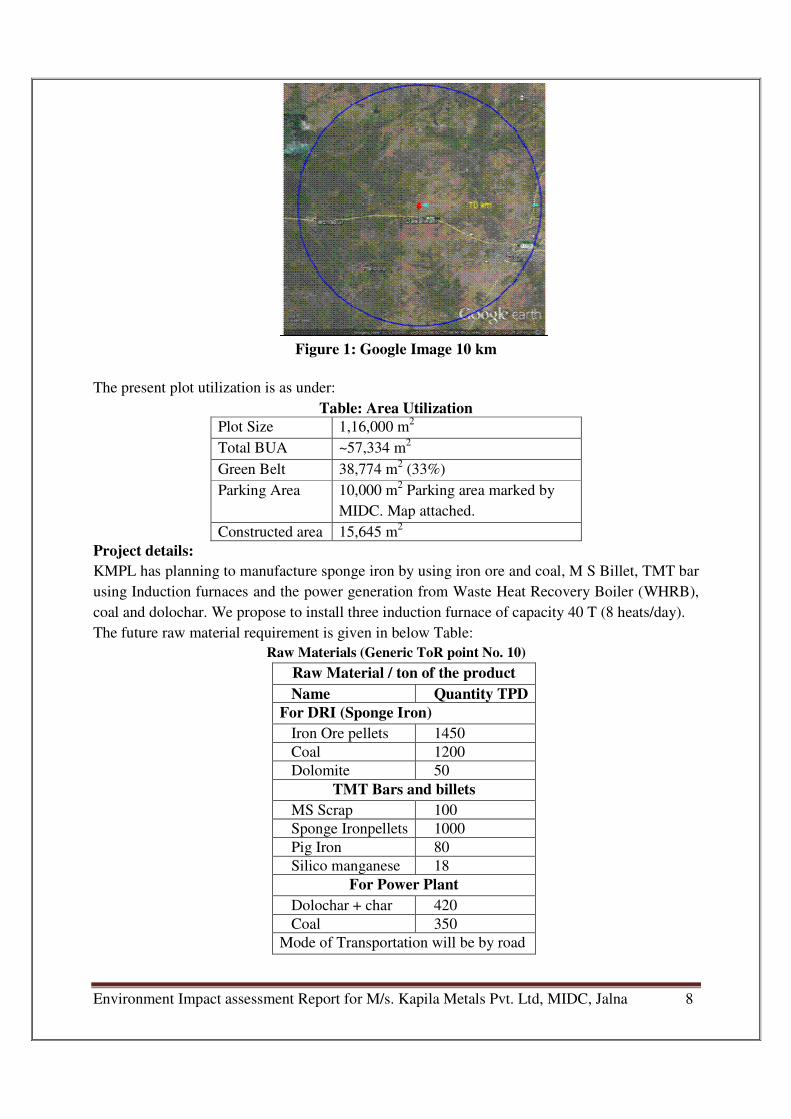
Environment Impact assessment Report for M/s. Kapila Metals Pvt. Ltd, MIDC, Jalna 8
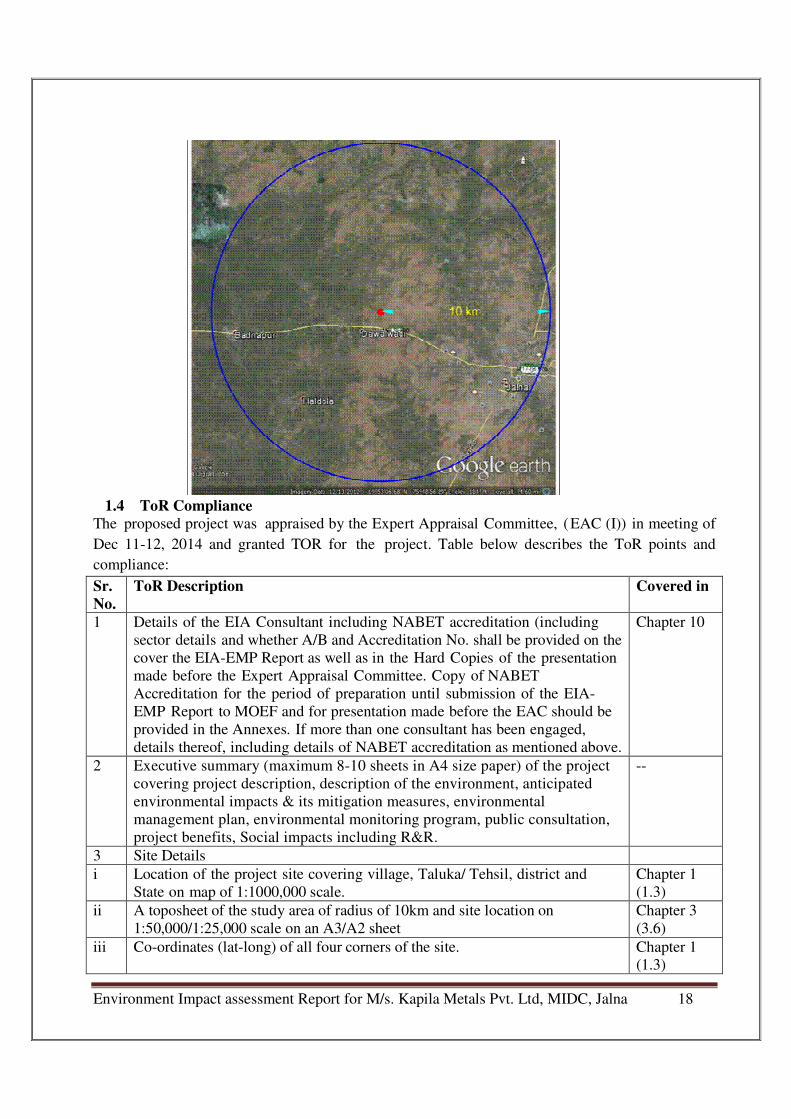
Figure 1: Google Image 10 km
The present plot utilization is as under:
Table: Area Utilization
Plot Size 1,16,000 m2
Total BUA ~57,334 m2
Green Belt 38,774 m2 (33%)
Parking Area 10,000 m2 Parking area marked by
MIDC. Map attached.
Constructed area 15,645 m2
Project details:
KMPL has planning to manufacture sponge iron by using iron ore and coal, M S Billet, TMT bar
using Induction furnaces and the power generation from Waste Heat Recovery Boiler (WHRB),
coal and dolochar. We propose to install three induction furnace of capacity 40 T (8 heats/day).
The future raw material requirement is given in below Table:
Raw Materials (Generic ToR point No. 10)
Raw Material / ton of the product
Name Quantity TPD
For DRI (Sponge Iron)
Iron Ore pellets 1450
Coal 1200
Dolomite 50
TMT Bars and billets
MS Scrap 100
Sponge Ironpellets 1000
Pig Iron 80
Silico manganese 18
For Power Plant
Dolochar + char 420
Coal 350
Mode of Transportation will be by road
Environment Impact assessment Report for M/s. Kapila Metals Pvt. Ltd, MIDC, Jalna 9
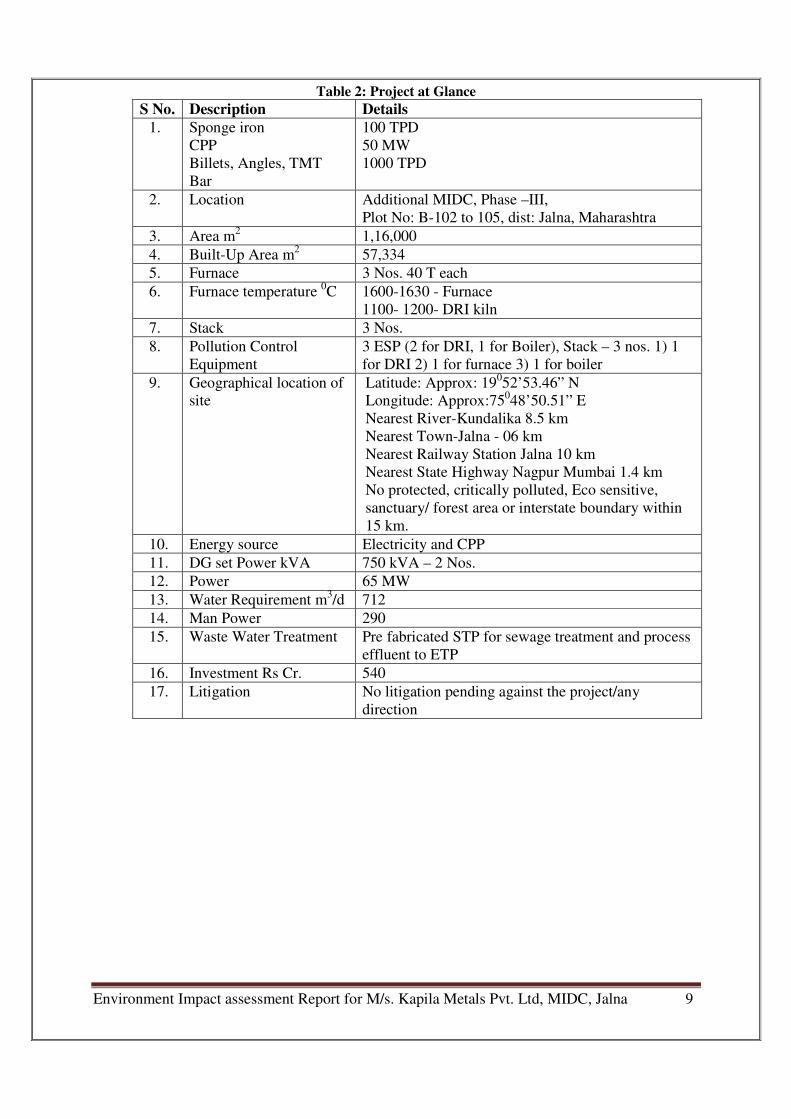
Table 2: Project at Glance
S No. Description Details
1. Sponge iron
CPP
Billets, Angles, TMT
Bar
100 TPD
50 MW
1000 TPD
2. Location Additional MIDC, Phase –III,
Plot No: B-102 to 105, dist: Jalna, Maharashtra
3. Area m2 1,16,000
4. Built-Up Area m2 57,334
5. Furnace 3 Nos. 40 T each
6. Furnace temperature 0C 1600-1630 - Furnace
1100- 1200- DRI kiln
7. Stack 3 Nos.
8. Pollution Control
Equipment
3 ESP (2 for DRI, 1 for Boiler), Stack – 3 nos. 1) 1
for DRI 2) 1 for furnace 3) 1 for boiler
9. Geographical location of
site
Latitude: Approx: 19052’53.46” N
Longitude: Approx:75048’50.51” E
Nearest River-Kundalika 8.5 km
Nearest Town-Jalna - 06 km
Nearest Railway Station Jalna 10 km
Nearest State Highway Nagpur Mumbai 1.4 km
No protected, critically polluted, Eco sensitive,
sanctuary/ forest area or interstate boundary within
15 km.
10. Energy source Electricity and CPP
11. DG set Power kVA 750 kVA – 2 Nos.
12. Power 65 MW
13. Water Requirement m3/d 712
14. Man Power 290
15. Waste Water Treatment Pre fabricated STP for sewage treatment and process
effluent to ETP
16. Investment Rs Cr. 540
17. Litigation No litigation pending against the project/any
direction
Environment Impact assessment Report for M/s. Kapila Metals Pvt. Ltd, MIDC, Jalna 10
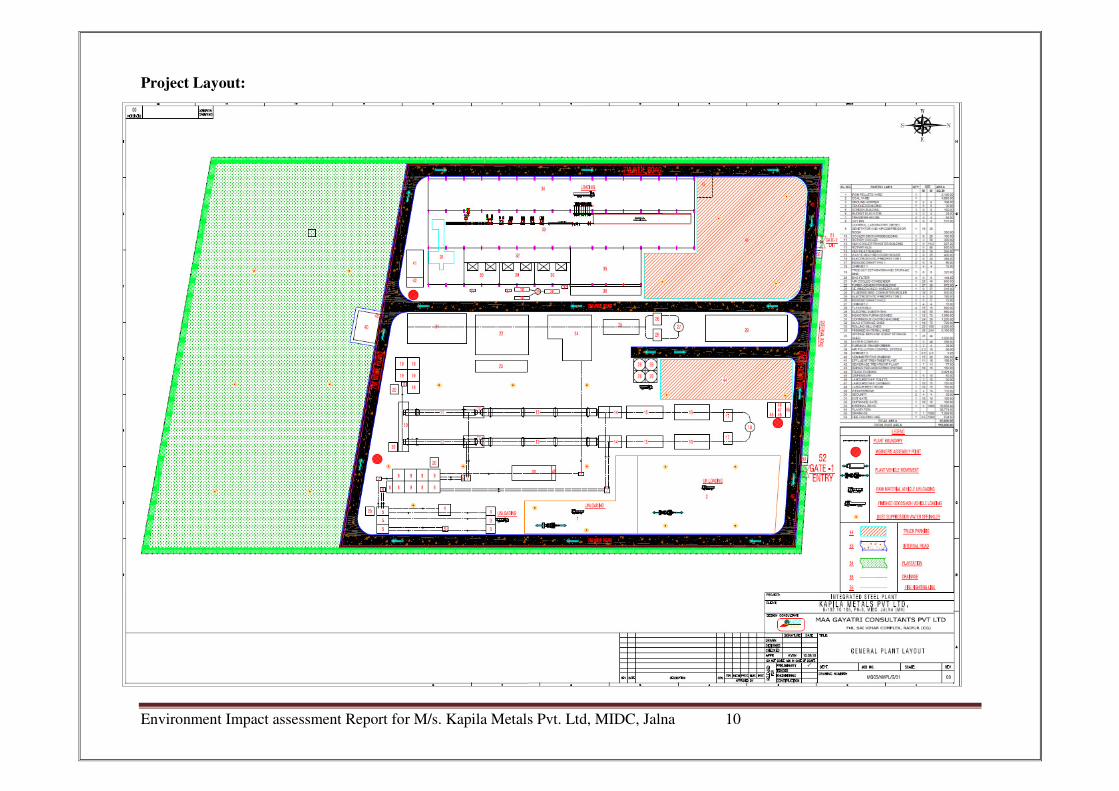
Project Layout:
Environment Impact assessment Report for M/s. Kapila Metals Pvt. Ltd, MIDC, Jalna 11
Process:
Sponge Iron:
• This process utilizes non-cooking coal as reducing agent along with lumpy rich grade iron
ore.
• The reduction is carried out in an inclined horizontal rotary kiln, which rotates at a
predetermined speed. A temperature profile ranging from 800-10500 C is maintained along
the length of the kiln at different zones and as the material flows down due to gravity the ore
is reduced.
• The hot reduced sponge iron along with semi-burnt coal, discharged from kiln is cooled in
water-cooled cylindrical rotary cooler to a temperature of 100–2000 C.
• The discharge from cooler consisting of sponge iron, char other contaminations are passed
on through magnetic separators so that sponge iron can be separated from other impurities.
Captive Power:
Total 50 MW power will be generated from the project.
24 MW power will be generated from Waste heat recovery boiler and 26 MW from coal based
power plant.
Billets &TMT Bars:
Raw material, basically iron scrap, is charged from the top of the furnace. Once charged to the
capacity, the furnace is switched on. High current flows at a comparatively low voltage through the
induction coils of the furnace, producing an induced magnetic field inside the central space of the
coils where the crucible is located. The induced magnetic flux heats the scrap resulting in melting.
The molten metal is circulated automatically by electromagnetic action so that when additions are
made, a homogeneous product is ensured in minimum time. This hot billet will be transferred to the
rolling mill, and rolled in various sizes.
Steel production using Induction furnace is basically low pollution process as no fuel, except
electricity, is used in the process.
Baseline Monitoring: We have conducted baseline monitoring for Air, water, soil & noise for various locations within 10
Km.
Air – 9 locations, results within the prescribed limit.
Surface Water: 8 locations, results are found to be satisfactory.
Ground Water: 8 locations, results are found to be satisfactory.
Soil: 9 locations
Noise: 9 locations, results within the prescribed limit.
Biological Environment: Five stations each were surveyed for flora and fauna studies in the 10 km radius. The project site
exhibits some varieties of plants like Calatropisprocera, Cassia tora, Micheliachampaca,
Environment Impact assessment Report for M/s. Kapila Metals Pvt. Ltd, MIDC, Jalna 12
Cocosnucifera, etc. There is no aquatic body within the project site. 29 genera and 29 species from
20 families were found during field studies. None of these animals are endangered (Schedule I) as
per Wildlife (Protection) Act 1972.
Socio Economic:
The data is collected and analysed using secondary sources viz. Census Reports, District Statistical
Abstract etc. The 10 km radius area is known as the Study Area, and it consists of 31 villages, 1
town spread over the talukas of Badnapur and Jalna in the district. The demographic profile,
infrastructure facilities and socio-economic condition is being described under different
classifications.
Out of the total population of study area, 83.32% lives in urban regions and only 16.68% lives in
rural areas of villages. In total 2,85,577 people lives in urban areas of which males are 147,092 and
females are 30,075, whereas 57,183 people live in rural areas of which males are 30,075 and 27,108
are females.
Infrastructure:
Educational facilities, medical facilities, drinking water, road and rail connectivity are good.
Impact & mitigation measures:
Air Environment:
The air pollution caused by this industry is mainly from dust as SPM and fumes. The dust is due to
the composition and handling of raw material and fumes are from furnace level as well as from
ladle and roof level.
Pollution Control measures -- Air:
The air pollution is caused mainly by particulate matter and fumes during charging operation. 3
ESP, 3 Stack, forced draft cooler; bag filter will be provided to minimize the air pollution.
Fugitive:
Fugitive emission will be controlled by:
• Regular water sprinkling
• Rubber tired trolleys for material handling
• Adopting layout to minimize manual material movement
• Tree plantation
Ground level concentrations (GLCs) have been predicted using AERMOD Cloud software. The
application incorporates popular U.S. EPA air dispersion models AERMOD and ISCST3 into one
integrated graphical interface. The model follows rural dispersion and regulatory defaults options as
per guidelines on air quality models (PROBES/70/1997-1998).
Environment Impact assessment Report for M/s. Kapila Metals Pvt. Ltd, MIDC, Jalna 13
Ambient air quality in study area w.r.t. PM, SO2 and NOx is within NAAQS 2009 as seen. Hence,
any significant impact is not envisaged within study area.
Water Environment:
Water is required for cooling water makeup and domestic purposes. Domestic wastewater is treated
in STP (18 m3/day) with overflow being used for green belt. Water from the process will be treated
in ETP (20 m3/day)
Total water requirement will be 712 m3/day
Pollution Control -- Water and Wastewater
Water Quality: Total water requirement is 712 m
3/day, which will be provided by MIDC.
Water is required for cooling purpose and boiler. Only domestic wastewater will be generated in the
project and it shall be treated in Sewage Treatment Plant. Overflow will be reused for landscaping
after disinfection.
The water used for this plant will be made available by Jalna MIDC. Total water requirement is
estimated at 712 m3/day. An application is be made to Jalna MIDC Water Works for the
permission.
Mitigation:
As additional mitigation measures are as under:
• To spread awareness to the workers about the importance of water conservation.
• Shop-floor supervisors are encouraged for mopping up, dry collection and good house-
keeping.
Solid Waste
The only solid waste produced by the induction furnace is about 170 MT slag per day. It will be
used for road making and land leveling. In addition, office waste generated shall be disposed off to
local authority.
Non Hazardous Solid Waste:
Solid Waste Details
Sr. No. Waste Quantity Disposal
1 Office waste ~44 kg/day Dry waste mainly paper waste will
be recycled
2 STP sludge ~1 kg/day Own garden
3 Packing waste Nominal Sale, Recycle
4 Process waste- Ash 300-400 MTD Will be sent to cement Industry
5 Slag ~170 MTD Resale, Can be used for Building
construction material, road making
Environment Impact assessment Report for M/s. Kapila Metals Pvt. Ltd, MIDC, Jalna 14
(b) Hazardous Waste:
Empty oil drum shall be sold to recyclers.
Risk Assessment
Following safety measures are proposed:
• Limiting the vehicles speed within the premises to 15 km/hr.
• Raw materials other than scrap are brought in closed containers to minimize dust
generation. No hooks shall be used for lifting bags. Cranes, tackles and forklift trucks shall
be used for unloading and loading bags.
• Before storage all units are to be inspected for cleanliness and for damage.
• All bags are to be stacked on pallets.
• Dyke walls, smooth sloping floors provided around storage tanks.
• Use of PPE is mandatory for all floor personnel
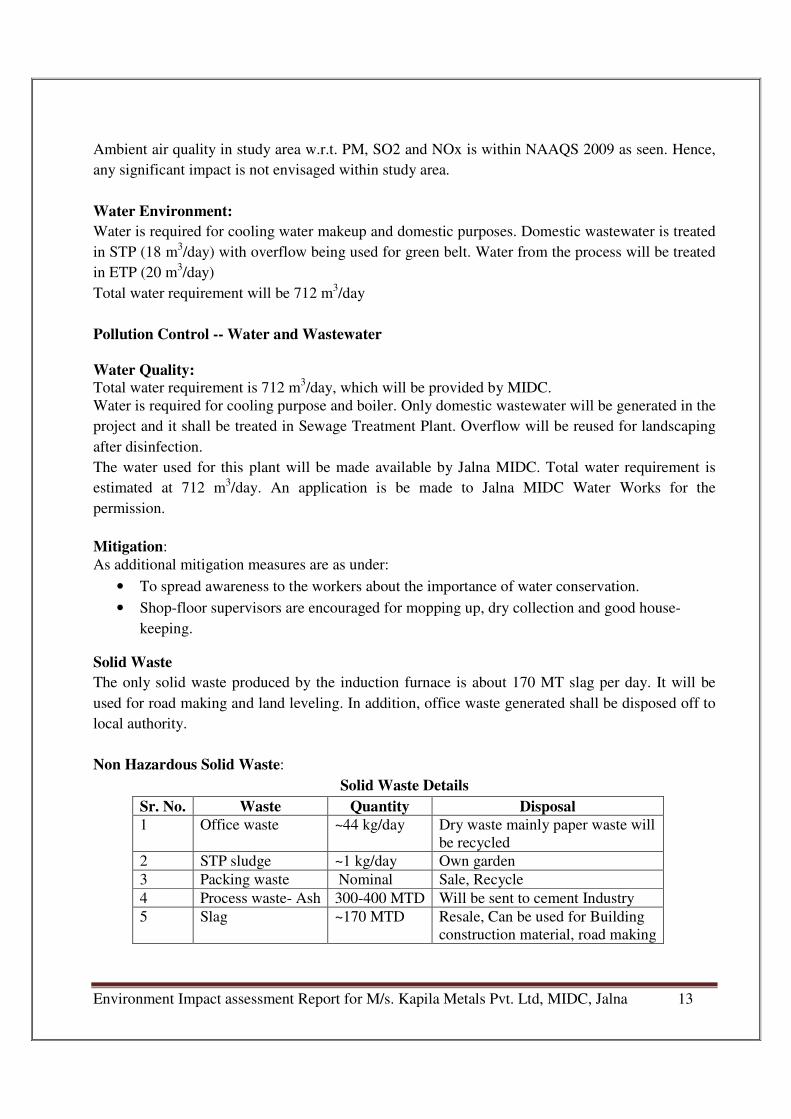
Following scenario emerged during HAZOP and measures to make operations safe have been
defined. Risk can be due to:
The use of process equipment, including machinery may result in accidents; some of these could be
serious and fatal. The particular areas of concern include:
� Lack of guards or inadequate guards on machines that may lead to accidents caused by
entanglement, sheering, crushing, trapping, etc.
� Insufficient strength of materials and improper design of machines,
� failure to provide the right information, instructions and training to operators using the
equipment;
All power tools will be used with appropriate shields, guards and attachments and in accordance
with the recommendations of the manufacturers.
Workers shall be trained in the use of power tools and safety requirements.
Disaster Management Plan and off-site emergency plan will be in place. Consulting Physician is
available in case of emergency.
Environment Monitoring Program during construction and operational phase is given in Chapter 6.
Conclusion
The industry will manufacture steel TMT bars and/or structural which has good demand for infra-
structural facilities in the region. The proposed project does not change the land use as the area falls
in MIDC.
Falling
Object
Contact
with
hot
Fire &
Explosion
Extreme
Temp. Noise Electric
Shocks
&

Environment Impact assessment Report for M/s. Kapila Metals Pvt. Ltd, MIDC, Jalna 15
• This project will add to the waste reuse i.e. wealth from waste.
• Provide employment opportunity to local skilled man power
• Will improve socio-economic condition of the area
• Minimal air pollution and water pollution
• Green belt development
Environment Impact assessment Report for M/s. Kapila Metals Pvt. Ltd, MIDC, Jalna 16
1 CHAPTER – INTRODUCTION
1.1 Introduction: M/s Kapila Metals Pvt. Ltd. (KMPL) is a mini steel industry in secondary metallurgical sector. It
proposes to produce
1. sponge iron 1000 TPD,
2. Power 50 MW,
3. Billets/TMT bars 1000 TPD,
at Additional MIDC, Phase –III, Plot No: B-102 to 105, , Dist : Jalna, Maharashtra
1.2 Size Location and Nature of the project: Industry occupies a MIDC plot of about~11.60 ha (1,16,000 m2). the Project falls under entry 3 (a),
and 1(d) category “A” & “B”. It proposes to produce Sponge iron 1000 TPD, Captive Power 50
MW, Billets 1000TPD, TMT Bar 1000 MTPD.
The projects covered under entry;
Table 1: Project Category Details
Sponge iron 3(a) Category A
Captive Power
Generation
1(d), Category B
Billets
TMT Bar
3(a) Category B
It is planned to have 38,774 m2 for green belt development.
The plant is accessible by all-weather road. The MIDC layout in Jalna is shown below.
Following facilities will be installed to produce billets/ingots:
1. Boiler
2. Induction furnace shed,
3. Transformer,
4. Laboratory,
5. Caster,
6. Rolling mill shade and
7. Off site facilities.
The plant is accessible by all-weather road. The MIDC layout in Jalna is shown in Figure 1.
Environment Impact assessment Report for M/s. Kapila Metals Pvt. Ltd, MIDC, Jalna 17
Project:M/s Kapila
Metals Pvt.Ltd
Location
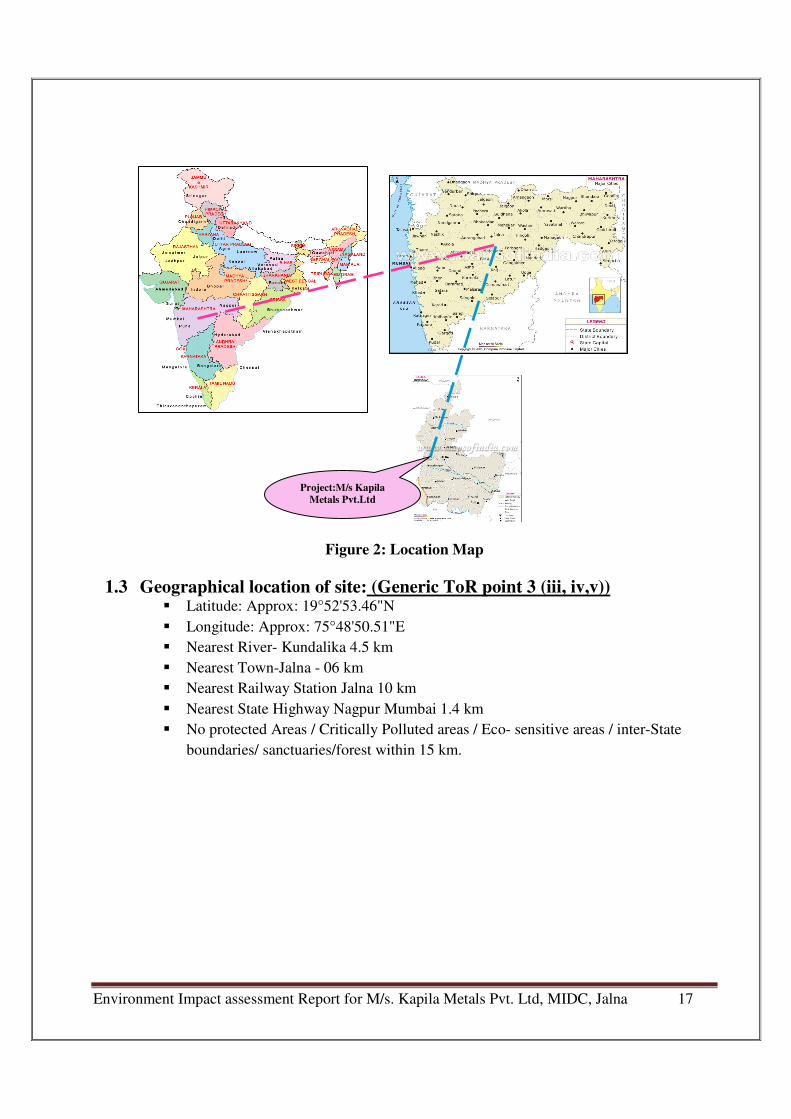
Figure 2: Location Map
1.3 Geographical location of site: (Generic ToR point 3 (iii, iv,v)) � Latitude: Approx: 19°52'53.46"N
� Longitude: Approx: 75°48'50.51"E
� Nearest River- Kundalika 4.5 km
� Nearest Town-Jalna - 06 km
� Nearest Railway Station Jalna 10 km
� Nearest State Highway Nagpur Mumbai 1.4 km
� No protected Areas / Critically Polluted areas / Eco- sensitive areas / inter-State
boundaries/ sanctuaries/forest within 15 km.
Environment Impact assessment Report for M/s. Kapila Metals Pvt. Ltd, MIDC, Jalna 18
Google Image 10Km (Generic ToR point 3 (iv))
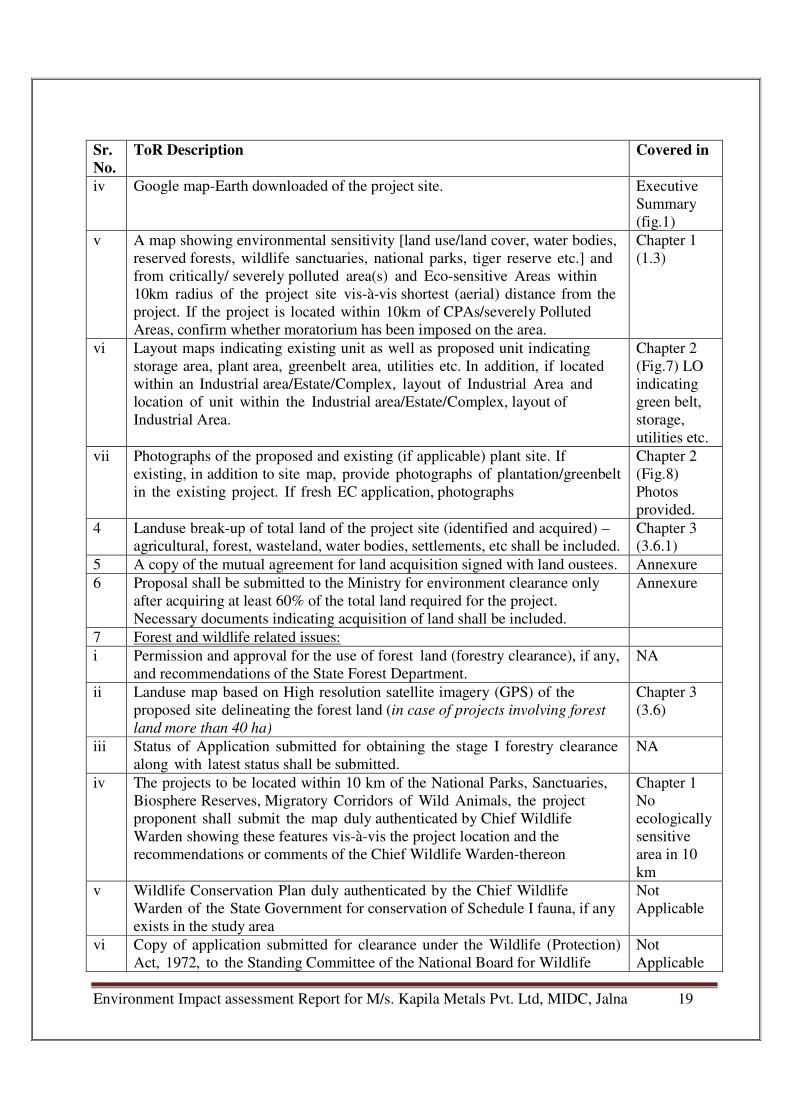
1.4 ToR Compliance
The proposed project was appraised by the Expert Appraisal Committee, (EAC (I)) in meeting of
Dec 11-12, 2014 and granted TOR for the project. Table below describes the ToR points and
compliance:
Sr.
No.
ToR Description Covered in
1 Details of the EIA Consultant including NABET accreditation (including
sector details and whether A/B and Accreditation No. shall be provided on the
cover the EIA-EMP Report as well as in the Hard Copies of the presentation
made before the Expert Appraisal Committee. Copy of NABET
Accreditation for the period of preparation until submission of the EIA-
EMP Report to MOEF and for presentation made before the EAC should be
provided in the Annexes. If more than one consultant has been engaged,
details thereof, including details of NABET accreditation as mentioned above.
Chapter 10
2 Executive summary (maximum 8-10 sheets in A4 size paper) of the project
covering project description, description of the environment, anticipated
environmental impacts & its mitigation measures, environmental
management plan, environmental monitoring program, public consultation,
project benefits, Social impacts including R&R.
--
3 Site Details
i Location of the project site covering village, Taluka/ Tehsil, district and
State on map of 1:1000,000 scale.
Chapter 1
(1.3)
ii A toposheet of the study area of radius of 10km and site location on
1:50,000/1:25,000 scale on an A3/A2 sheet
Chapter 3
(3.6)
iii Co-ordinates (lat-long) of all four corners of the site. Chapter 1
(1.3)
Environment Impact assessment Report for M/s. Kapila Metals Pvt. Ltd, MIDC, Jalna 19
Sr.
No.
ToR Description Covered in
iv Google map-Earth downloaded of the project site. Executive
Summary
(fig.1)
v A map showing environmental sensitivity [land use/land cover, water bodies,
reserved forests, wildlife sanctuaries, national parks, tiger reserve etc.] and
from critically/ severely polluted area(s) and Eco-sensitive Areas within
10km radius of the project site vis-à-vis shortest (aerial) distance from the
project. If the project is located within 10km of CPAs/severely Polluted
Areas, confirm whether moratorium has been imposed on the area.
Chapter 1
(1.3)
vi Layout maps indicating existing unit as well as proposed unit indicating
storage area, plant area, greenbelt area, utilities etc. In addition, if located
within an Industrial area/Estate/Complex, layout of Industrial Area and
location of unit within the Industrial area/Estate/Complex, layout of
Industrial Area.
Chapter 2
(Fig.7) LO
indicating
green belt,
storage,
utilities etc.
vii Photographs of the proposed and existing (if applicable) plant site. If
existing, in addition to site map, provide photographs of plantation/greenbelt
in the existing project. If fresh EC application, photographs
Chapter 2
(Fig.8)
Photos
provided.
4 Landuse break-up of total land of the project site (identified and acquired) –
agricultural, forest, wasteland, water bodies, settlements, etc shall be included.
Chapter 3
(3.6.1)
5 A copy of the mutual agreement for land acquisition signed with land oustees. Annexure
6 Proposal shall be submitted to the Ministry for environment clearance only
after acquiring at least 60% of the total land required for the project.
Necessary documents indicating acquisition of land shall be included.
Annexure
7 Forest and wildlife related issues:
i Permission and approval for the use of forest land (forestry clearance), if any,
and recommendations of the State Forest Department.
NA
ii Landuse map based on High resolution satellite imagery (GPS) of the
proposed site delineating the forest land (in case of projects involving forest
land more than 40 ha)
Chapter 3
(3.6)
iii Status of Application submitted for obtaining the stage I forestry clearance
along with latest status shall be submitted.
NA
iv The projects to be located within 10 km of the National Parks, Sanctuaries,
Biosphere Reserves, Migratory Corridors of Wild Animals, the project
proponent shall submit the map duly authenticated by Chief Wildlife
Warden showing these features vis-à-vis the project location and the
recommendations or comments of the Chief Wildlife Warden-thereon
Chapter 1
No
ecologically
sensitive
area in 10
km
v Wildlife Conservation Plan duly authenticated by the Chief Wildlife
Warden of the State Government for conservation of Schedule I fauna, if any
exists in the study area
Not
Applicable
vi Copy of application submitted for clearance under the Wildlife (Protection)
Act, 1972, to the Standing Committee of the National Board for Wildlife
Not
Applicable
Environment Impact assessment Report for M/s. Kapila Metals Pvt. Ltd, MIDC, Jalna 20
Sr.
No.
ToR Description Covered in
8 Expansion/modernization proposals:
I Copy of all the Environmental Clearance(s) including Amendments
thereto obtained for the project from MOEF/SEIAA shall be attached as an
Annexure. A certified copy of the latest Monitoring Report of the Regional
Office of the Ministry of Environment and Forests as per circular dated
30th
May, 2012 on the status of compliance of conditions stipulated in all
the existing environmental clearances including Amendments shall be
provided. In addition, status of compliance of Consent to Operate for the
ongoing Iexisting operation of the project from SPCB shall be attached with
the EIA-EMP report.
Not
Applicable
ii In case the existing project has not obtained environmental clearance, reasons
for not taking EC under the provisions of the EIA Notification 1994 and/or
EIA Notification 2006 shall be provided. Copies of Consent to Establish/No
Objection Certificate and Consent to Operate (in case of units operating prior
to EIA Notification 2006, CTE and CTO of FY 2005-2006) obtained from
the SPCB shall be submitted. Further, compliance report to the conditions of
consents from the SPCB shall be submitted.
Not
Applicable
9 Details of Industrial Operations:
A list of major industries with name and type within study area (10km radius)
shall be incorporated.
Chapter 7
(7.5),
Similar
industries
operating
10 Details of proposed raw materials and products along with production
capacity. If expansion project, details for existing unit, separately for existing
and new (proposed) unit
Chapter 2
(2.1.1)
11 Details of manufacturing process, major equipment and machinery. If
expansion project, details of existing unit, separately for existing and new
(proposed) unit.
Chapter 2
(2.1)
12 List of raw materials required and its source along with mode of
transportation shall be included. All the trucks for raw material and
finished product transportation must be “Environmentally Compliant”
Chapter 2
(2.1.1)
13 Quantity of fuel required, its source and characteristics and documentary
evidence to substantiate confirmed fuel linkage shall be furnished
14 Project site layout plan to scale using AutoCAD showing raw materials, fly
ash and other storage plans, bore well or water storage, aquifers (within 1
km) dumping, waste disposal, green areas, water bodies, rivers/drainage
passing through the project site shall be included.
Chapter 2
(Fig.7)
15 Manufacturing process details of all the plants including captive power
plant if any along with process flow chart shall be included.
Chapter 2
(2.1,2.1)
16 Mass balance for the raw material and products shall be included.
17 Energy balance data for all the components of the plant shall be incorporated.
18 Geological features and Geo-hydrological status of the study area shall be
included.
Chapter 3
(3.7)
19 Details of Drainage of the project upto 5km radius of study area. If the site is Chapter 3
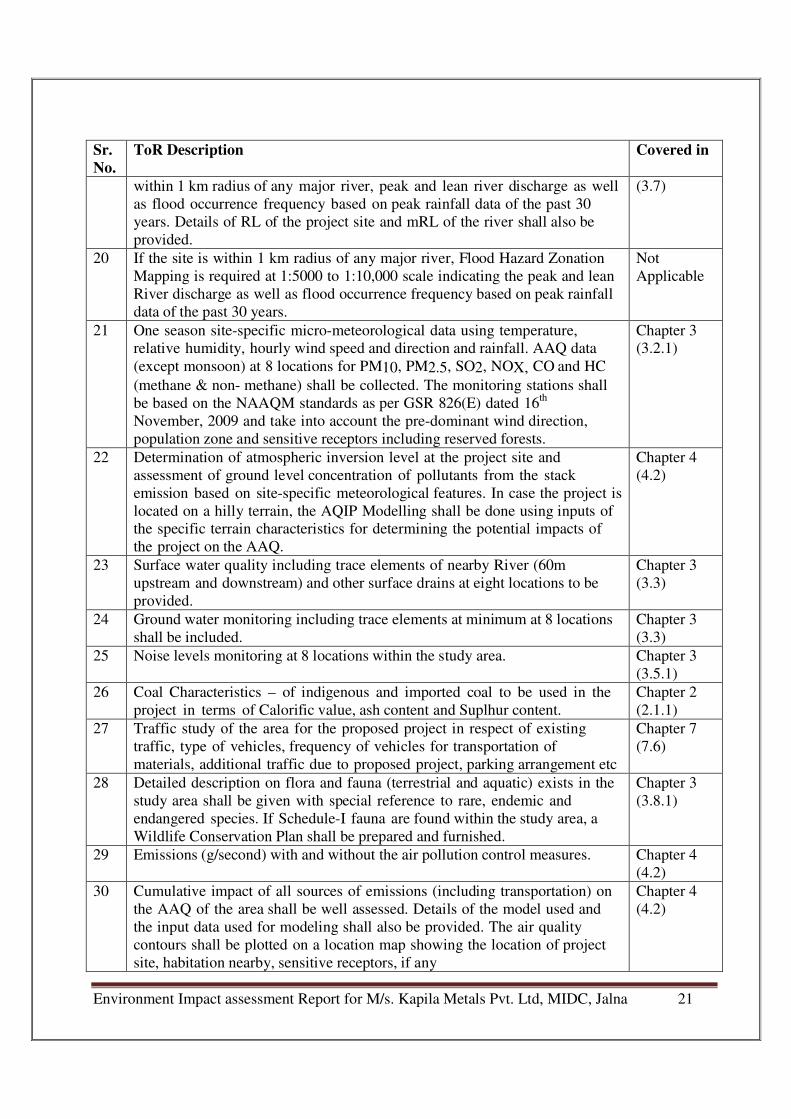
Environment Impact assessment Report for M/s. Kapila Metals Pvt. Ltd, MIDC, Jalna 21
Sr.
No.
ToR Description Covered in
within 1 km radius of any major river, peak and lean river discharge as well
as flood occurrence frequency based on peak rainfall data of the past 30
years. Details of RL of the project site and mRL of the river shall also be
provided.
(3.7)
20 If the site is within 1 km radius of any major river, Flood Hazard Zonation
Mapping is required at 1:5000 to 1:10,000 scale indicating the peak and lean
River discharge as well as flood occurrence frequency based on peak rainfall
data of the past 30 years.
Not
Applicable
21 One season site-specific micro-meteorological data using temperature,
relative humidity, hourly wind speed and direction and rainfall. AAQ data
(except monsoon) at 8 locations for PM10, PM2.5, SO2, NOX, CO and HC
(methane & non- methane) shall be collected. The monitoring stations shall
be based on the NAAQM standards as per GSR 826(E) dated 16th
November, 2009 and take into account the pre-dominant wind direction,
population zone and sensitive receptors including reserved forests.
Chapter 3
(3.2.1)
22 Determination of atmospheric inversion level at the project site and
assessment of ground level concentration of pollutants from the stack
emission based on site-specific meteorological features. In case the project is
located on a hilly terrain, the AQIP Modelling shall be done using inputs of
the specific terrain characteristics for determining the potential impacts of
the project on the AAQ.
Chapter 4
(4.2)
23 Surface water quality including trace elements of nearby River (60m
upstream and downstream) and other surface drains at eight locations to be
provided.
Chapter 3
(3.3)
24 Ground water monitoring including trace elements at minimum at 8 locations
shall be included.
Chapter 3
(3.3)
25 Noise levels monitoring at 8 locations within the study area. Chapter 3
(3.5.1)
26 Coal Characteristics – of indigenous and imported coal to be used in the
project in terms of Calorific value, ash content and Suplhur content.
Chapter 2
(2.1.1)
27 Traffic study of the area for the proposed project in respect of existing
traffic, type of vehicles, frequency of vehicles for transportation of
materials, additional traffic due to proposed project, parking arrangement etc
Chapter 7
(7.6)
28 Detailed description on flora and fauna (terrestrial and aquatic) exists in the
study area shall be given with special reference to rare, endemic and
endangered species. If Schedule-I fauna are found within the study area, a
Wildlife Conservation Plan shall be prepared and furnished.
Chapter 3
(3.8.1)
29 Emissions (g/second) with and without the air pollution control measures. Chapter 4
(4.2)
30 Cumulative impact of all sources of emissions (including transportation) on
the AAQ of the area shall be well assessed. Details of the model used and
the input data used for modeling shall also be provided. The air quality
contours shall be plotted on a location map showing the location of project
site, habitation nearby, sensitive receptors, if any
Chapter 4
(4.2)
Environment Impact assessment Report for M/s. Kapila Metals Pvt. Ltd, MIDC, Jalna 22
Sr.
No.
ToR Description Covered in
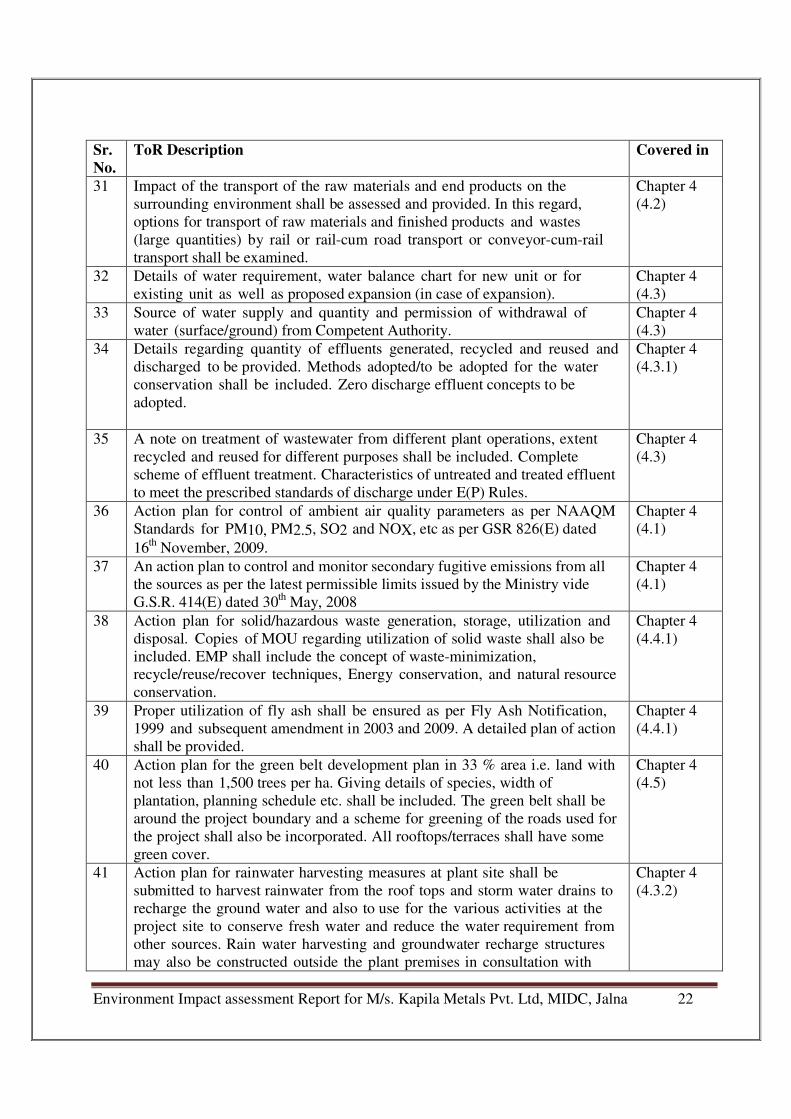
31 Impact of the transport of the raw materials and end products on the
surrounding environment shall be assessed and provided. In this regard,
options for transport of raw materials and finished products and wastes
(large quantities) by rail or rail-cum road transport or conveyor-cum-rail
transport shall be examined.
Chapter 4
(4.2)
32 Details of water requirement, water balance chart for new unit or for
existing unit as well as proposed expansion (in case of expansion).
Chapter 4
(4.3)
33 Source of water supply and quantity and permission of withdrawal of
water (surface/ground) from Competent Authority.
Chapter 4
(4.3)
34 Details regarding quantity of effluents generated, recycled and reused and
discharged to be provided. Methods adopted/to be adopted for the water
conservation shall be included. Zero discharge effluent concepts to be
adopted.
Chapter 4
(4.3.1)
35 A note on treatment of wastewater from different plant operations, extent
recycled and reused for different purposes shall be included. Complete
scheme of effluent treatment. Characteristics of untreated and treated effluent
to meet the prescribed standards of discharge under E(P) Rules.
Chapter 4
(4.3)
36 Action plan for control of ambient air quality parameters as per NAAQM
Standards for PM10, PM2.5, SO2 and NOX, etc as per GSR 826(E) dated
16th
November, 2009.
Chapter 4
(4.1)
37 An action plan to control and monitor secondary fugitive emissions from all
the sources as per the latest permissible limits issued by the Ministry vide
G.S.R. 414(E) dated 30th
May, 2008
Chapter 4
(4.1)
38 Action plan for solid/hazardous waste generation, storage, utilization and
disposal. Copies of MOU regarding utilization of solid waste shall also be
included. EMP shall include the concept of waste-minimization,
recycle/reuse/recover techniques, Energy conservation, and natural resource
conservation.
Chapter 4
(4.4.1)
39 Proper utilization of fly ash shall be ensured as per Fly Ash Notification,
1999 and subsequent amendment in 2003 and 2009. A detailed plan of action
shall be provided.
Chapter 4
(4.4.1)
40 Action plan for the green belt development plan in 33 % area i.e. land with
not less than 1,500 trees per ha. Giving details of species, width of
plantation, planning schedule etc. shall be included. The green belt shall be
around the project boundary and a scheme for greening of the roads used for
the project shall also be incorporated. All rooftops/terraces shall have some
green cover.
Chapter 4
(4.5)
41 Action plan for rainwater harvesting measures at plant site shall be
submitted to harvest rainwater from the roof tops and storm water drains to
recharge the ground water and also to use for the various activities at the
project site to conserve fresh water and reduce the water requirement from
other sources. Rain water harvesting and groundwater recharge structures
may also be constructed outside the plant premises in consultation with
Chapter 4
(4.3.2)
Environment Impact assessment Report for M/s. Kapila Metals Pvt. Ltd, MIDC, Jalna 23
Sr.
No.
ToR Description Covered in
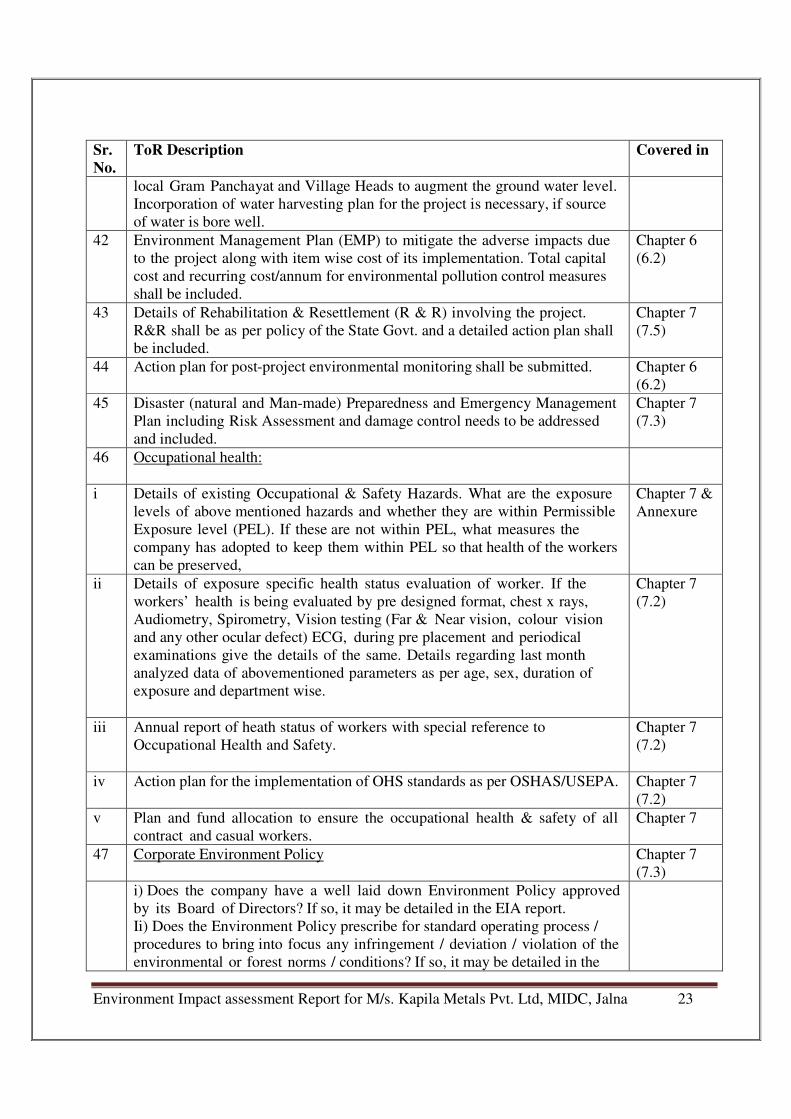
local Gram Panchayat and Village Heads to augment the ground water level.
Incorporation of water harvesting plan for the project is necessary, if source
of water is bore well.
42 Environment Management Plan (EMP) to mitigate the adverse impacts due
to the project along with item wise cost of its implementation. Total capital
cost and recurring cost/annum for environmental pollution control measures
shall be included.
Chapter 6
(6.2)
43 Details of Rehabilitation & Resettlement (R & R) involving the project.
R&R shall be as per policy of the State Govt. and a detailed action plan shall
be included.
Chapter 7
(7.5)
44 Action plan for post-project environmental monitoring shall be submitted. Chapter 6
(6.2)
45 Disaster (natural and Man-made) Preparedness and Emergency Management
Plan including Risk Assessment and damage control needs to be addressed
and included.
Chapter 7
(7.3)
46 Occupational health:
i Details of existing Occupational & Safety Hazards. What are the exposure
levels of above mentioned hazards and whether they are within Permissible
Exposure level (PEL). If these are not within PEL, what measures the
company has adopted to keep them within PEL so that health of the workers
can be preserved,
Chapter 7 &
Annexure
ii Details of exposure specific health status evaluation of worker. If the
workers’ health is being evaluated by pre designed format, chest x rays,
Audiometry, Spirometry, Vision testing (Far & Near vision, colour vision
and any other ocular defect) ECG, during pre placement and periodical
examinations give the details of the same. Details regarding last month
analyzed data of abovementioned parameters as per age, sex, duration of
exposure and department wise.
Chapter 7
(7.2)
iii Annual report of heath status of workers with special reference to
Occupational Health and Safety.
Chapter 7
(7.2)
iv Action plan for the implementation of OHS standards as per OSHAS/USEPA. Chapter 7
(7.2)
v Plan and fund allocation to ensure the occupational health & safety of all
contract and casual workers.
Chapter 7
47 Corporate Environment Policy Chapter 7
(7.3)
i) Does the company have a well laid down Environment Policy approved
by its Board of Directors? If so, it may be detailed in the EIA report.
Ii) Does the Environment Policy prescribe for standard operating process /
procedures to bring into focus any infringement / deviation / violation of the
environmental or forest norms / conditions? If so, it may be detailed in the
Environment Impact assessment Report for M/s. Kapila Metals Pvt. Ltd, MIDC, Jalna 24
Sr.
No.
ToR Description Covered in
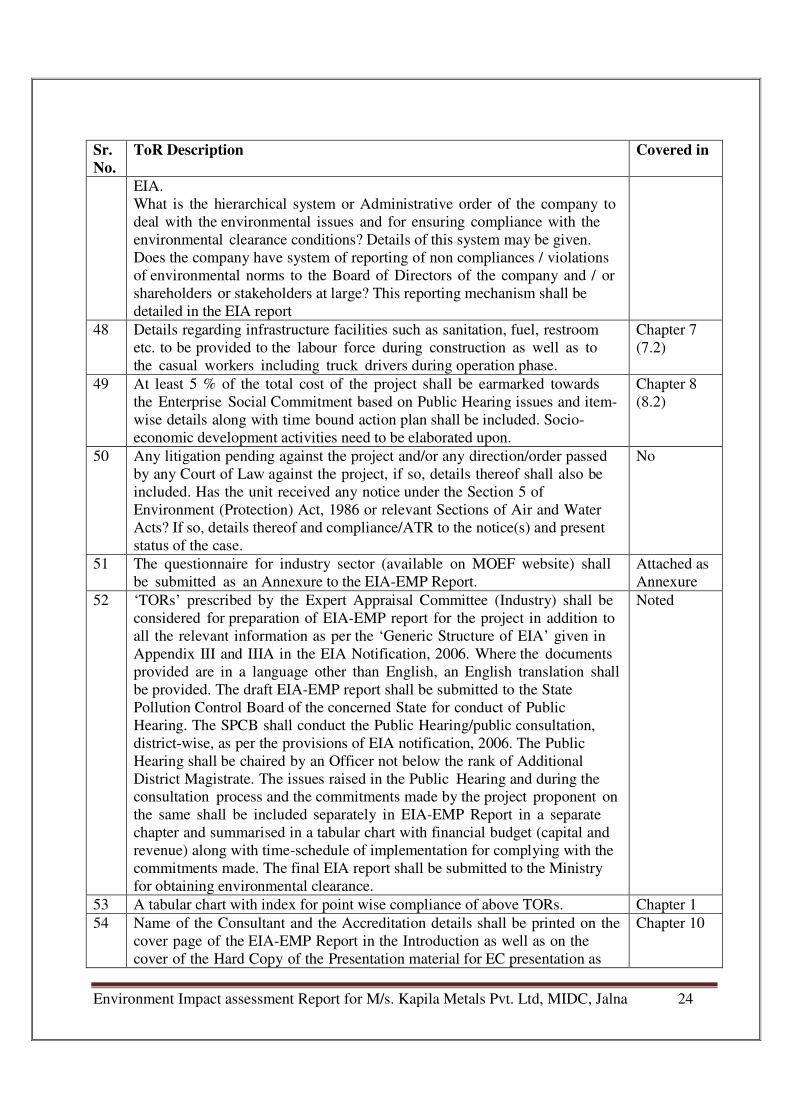
EIA.
What is the hierarchical system or Administrative order of the company to
deal with the environmental issues and for ensuring compliance with the
environmental clearance conditions? Details of this system may be given.
Does the company have system of reporting of non compliances / violations
of environmental norms to the Board of Directors of the company and / or
shareholders or stakeholders at large? This reporting mechanism shall be
detailed in the EIA report
48 Details regarding infrastructure facilities such as sanitation, fuel, restroom
etc. to be provided to the labour force during construction as well as to
the casual workers including truck drivers during operation phase.
Chapter 7
(7.2)
49 At least 5 % of the total cost of the project shall be earmarked towards
the Enterprise Social Commitment based on Public Hearing issues and item-
wise details along with time bound action plan shall be included. Socio-
economic development activities need to be elaborated upon.
Chapter 8
(8.2)
50 Any litigation pending against the project and/or any direction/order passed
by any Court of Law against the project, if so, details thereof shall also be
included. Has the unit received any notice under the Section 5 of
Environment (Protection) Act, 1986 or relevant Sections of Air and Water
Acts? If so, details thereof and compliance/ATR to the notice(s) and present
status of the case.
No
51 The questionnaire for industry sector (available on MOEF website) shall
be submitted as an Annexure to the EIA-EMP Report.
Attached as
Annexure
52 ‘TORs’ prescribed by the Expert Appraisal Committee (Industry) shall be
considered for preparation of EIA-EMP report for the project in addition to
all the relevant information as per the ‘Generic Structure of EIA’ given in
Appendix III and IIIA in the EIA Notification, 2006. Where the documents
provided are in a language other than English, an English translation shall
be provided. The draft EIA-EMP report shall be submitted to the State
Pollution Control Board of the concerned State for conduct of Public
Hearing. The SPCB shall conduct the Public Hearing/public consultation,
district-wise, as per the provisions of EIA notification, 2006. The Public
Hearing shall be chaired by an Officer not below the rank of Additional
District Magistrate. The issues raised in the Public Hearing and during the
consultation process and the commitments made by the project proponent on
the same shall be included separately in EIA-EMP Report in a separate
chapter and summarised in a tabular chart with financial budget (capital and
revenue) along with time-schedule of implementation for complying with the
commitments made. The final EIA report shall be submitted to the Ministry
for obtaining environmental clearance.
Noted
53 A tabular chart with index for point wise compliance of above TORs. Chapter 1
54 Name of the Consultant and the Accreditation details shall be printed on the
cover page of the EIA-EMP Report in the Introduction as well as on the
cover of the Hard Copy of the Presentation material for EC presentation as
Chapter 10
Environment Impact assessment Report for M/s. Kapila Metals Pvt. Ltd, MIDC, Jalna 25
Sr.
No.
ToR Description Covered in
per requirements in TOR condition No. (1).
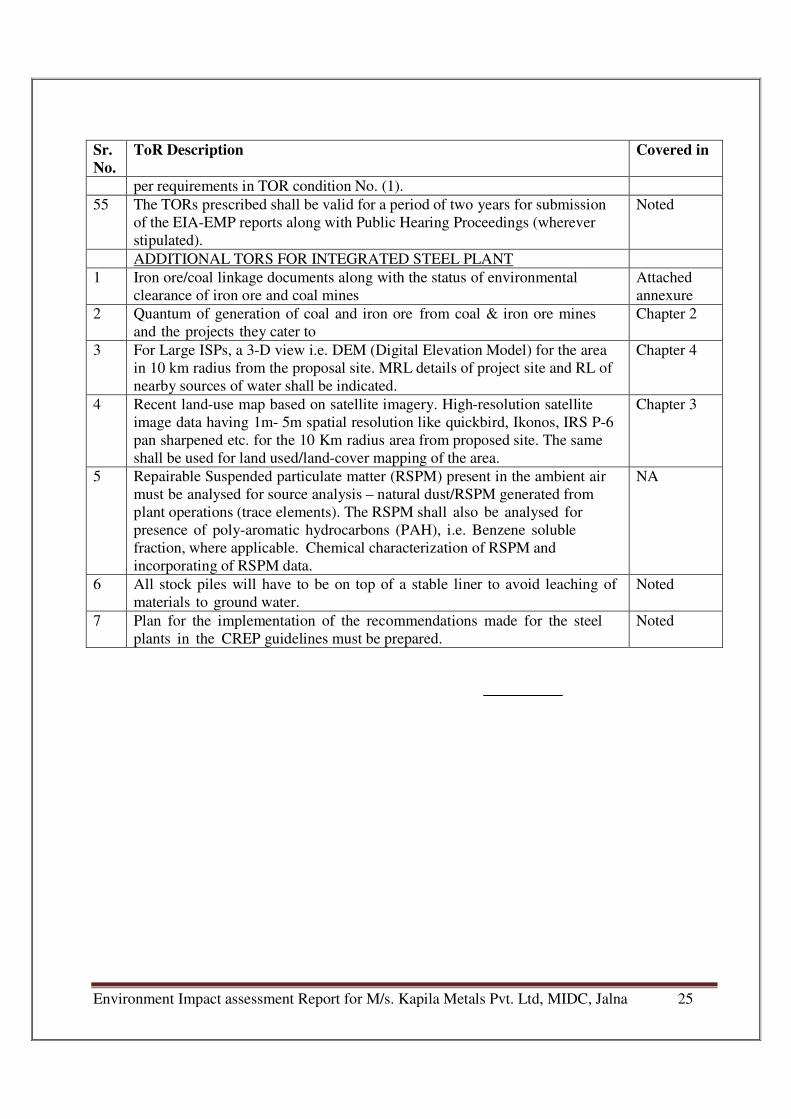
55 The TORs prescribed shall be valid for a period of two years for submission
of the EIA-EMP reports along with Public Hearing Proceedings (wherever
stipulated).
Noted
ADDITIONAL TORS FOR INTEGRATED STEEL PLANT
1 Iron ore/coal linkage documents along with the status of environmental
clearance of iron ore and coal mines
Attached
annexure
2 Quantum of generation of coal and iron ore from coal & iron ore mines
and the projects they cater to
Chapter 2
3 For Large ISPs, a 3-D view i.e. DEM (Digital Elevation Model) for the area
in 10 km radius from the proposal site. MRL details of project site and RL of
nearby sources of water shall be indicated.
Chapter 4
4 Recent land-use map based on satellite imagery. High-resolution satellite
image data having 1m- 5m spatial resolution like quickbird, Ikonos, IRS P-6
pan sharpened etc. for the 10 Km radius area from proposed site. The same
shall be used for land used/land-cover mapping of the area.
Chapter 3
5 Repairable Suspended particulate matter (RSPM) present in the ambient air
must be analysed for source analysis – natural dust/RSPM generated from
plant operations (trace elements). The RSPM shall also be analysed for
presence of poly-aromatic hydrocarbons (PAH), i.e. Benzene soluble
fraction, where applicable. Chemical characterization of RSPM and
incorporating of RSPM data.
NA
6 All stock piles will have to be on top of a stable liner to avoid leaching of
materials to ground water.
Noted
7 Plan for the implementation of the recommendations made for the steel
plants in the CREP guidelines must be prepared.
Noted
Environment Impact assessment Report for M/s. Kapila Metals Pvt. Ltd, MIDC, Jalna 26
2 CHAPTER - PROJECT DESCRIPTION
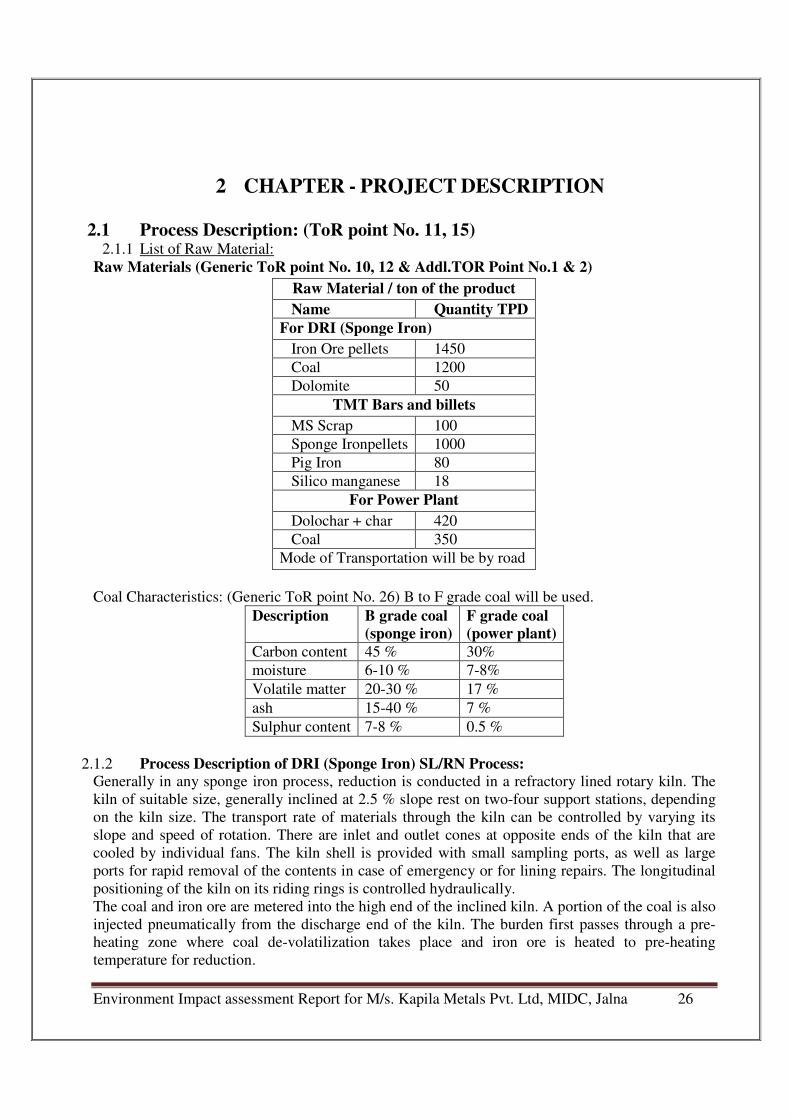
2.1 Process Description: (ToR point No. 11, 15) 2.1.1 List of Raw Material:
Raw Materials (Generic ToR point No. 10, 12 & Addl.TOR Point No.1 & 2)
Raw Material / ton of the product
Name Quantity TPD
For DRI (Sponge Iron)
Iron Ore pellets 1450
Coal 1200
Dolomite 50
TMT Bars and billets
MS Scrap 100
Sponge Ironpellets 1000
Pig Iron 80
Silico manganese 18
For Power Plant
Dolochar + char 420
Coal 350
Mode of Transportation will be by road
Coal Characteristics: (Generic ToR point No. 26) B to F grade coal will be used.
Description B grade coal
(sponge iron)
F grade coal
(power plant)
Carbon content 45 % 30%
moisture 6-10 % 7-8%
Volatile matter 20-30 % 17 %
ash 15-40 % 7 %
Sulphur content 7-8 % 0.5 %
2.1.2 Process Description of DRI (Sponge Iron) SL/RN Process: Generally in any sponge iron process, reduction is conducted in a refractory lined rotary kiln. The
kiln of suitable size, generally inclined at 2.5 % slope rest on two-four support stations, depending
on the kiln size. The transport rate of materials through the kiln can be controlled by varying its
slope and speed of rotation. There are inlet and outlet cones at opposite ends of the kiln that are
cooled by individual fans. The kiln shell is provided with small sampling ports, as well as large
ports for rapid removal of the contents in case of emergency or for lining repairs. The longitudinal
positioning of the kiln on its riding rings is controlled hydraulically.
The coal and iron ore are metered into the high end of the inclined kiln. A portion of the coal is also
injected pneumatically from the discharge end of the kiln. The burden first passes through a pre-
heating zone where coal de-volatilization takes place and iron ore is heated to pre-heating
temperature for reduction.
Environment Impact assessment Report for M/s. Kapila Metals Pvt. Ltd, MIDC, Jalna 27
Temperature and process control in the kiln are carried out by installing suitable no. of air injection
tubes made of heat-resistant steel spaced evenly along the kiln length and countercurrent to the flow
of iron ore. Tips of the air tubes are equipped with special internal swirlers to improve uniformity
of combustion.
A central burner located at the kiln discharge end is used with LDO for heating the cold kiln. After
initial heating, the fuel supply is turned off and the burner is used to inject air for coal combustion.
The kiln temperatures are measured with fixed thermocouples and Quick Response Thermocouples
(QRT). Fixed thermocouples are located along the length of the kiln so that temperatures at various
sections of the kiln can be monitored. Fixed thermocouples, at times may give erratic readings in
case they get coated with ash, ore or accretion. In such cases QRT are used for monitoring the kiln
temperatures.
The product (DRI) is discharged from the kiln at about 900 to 1000°C. An enclosed chute at the
kiln discharge end transfers the hot DRI to a rotary cooler. The cooler is a horizontal revolving
cylinder of appropriate size. The DRI is cooled indirectly by water spray on the cooler upper
surface. The cooling water is collected in troughs below the cooler and pumped to the cooling tower
for recycling along-with make-up water.
Solids discharged to the cooler through an enclosed chute are cooled to about 100°C. without air
contact. A grizzly in the chute removes accretions that are large to plug up or damage the cooler
discharge mechanisms. The undersize – a mix of DRI, dolo char and coal ash are screened into +/-
3mm fractions. Each fraction passes through a magnetic separator. The non-magnetic portion of the
plus 3mm fraction is mostly char and can be recycled to the kiln if desired. The non-magnetic
portion of – 3mm fraction mostly spent lime, ash and fine char is discarded. The magnetic portion
of each fraction is DRI. The plus 3mm fraction can be used directly for steel making and the finer
fraction can be briquetted / collected in bags.
The kiln waste gases at about 850-900°C pass through a dust settling chamber where heavier dust
particles settle down due to sudden decrease in velocity of gases. The flue gases then pass through
an after burning. The flue gases after the after burning chamber pass through an elbow duct to
waste heat boiler where sensible heat of the gases is extracted. The gas is then let off into the
atmosphere after passing through pollution control equipment like ESP, ID fan and stack.
Reaction mechanism There are two major temperature zones in the kiln. The first pre-heat zone is where the charge is
heated to 900 – 1000°C. The second metallization zone is held fairly constant at 1000-1050°C.
The charge into the kiln consists of a mixture of iron oxide lump, fluxes such as limestone and/or
dolomite (amount depending of sulfur content of the coal) and medium volatile non-coking coal. In
the pre-heating zone, the moisture is driven off first, and then the hydrocarbons and hydrogen
evolve by thermal decomposition of the coal.

Environment Impact assessment Report for M/s. Kapila Metals Pvt. Ltd, MIDC, Jalna 28
As the combustible gases rise from the bed of solid material, a portion of the gases is burnt in the
free board above the bed by controlled quantities of air introduced through the air tubes. As the kiln
rotates, the primary mode of heat transfer is by radiation to the tumbling charge and subsequently
by internal solids mixing and renewal of the exposed bed surface.
In the pre-heat zone, the reduction of iron oxide proceeds only to ferrous oxide (FeO) (Equation I).
Fe2O
3 + CO = 2 FeO + CO
2 ............................ (I)
Final reduction to metallic iron occurs in the metallization zone by reaction of CO with FeO to
form CO2
and metallic iron (Equation II).
FeO + CO = Fe + CO2 ........................... (II)
Most of the CO2
reacts with the excess solid fuel in the kiln and is converted to CO according to the
Boudouard reaction (Equation III).
CO2
+ C = 2 CO ............................ (III)
Coals with higher reactivity are preferred as they provide rapid conversion of CO2
to CO, thereby
maintaining reducing conditions in the kiln metallization zone. The highly endothermic reaction of
coal with CO2
prevents the bed from over heating and attaining high temperature that could lead to
melting or sticking of the charge.
Environment Impact assessment Report for M/s. Kapila Metals Pvt. Ltd, MIDC, Jalna 29
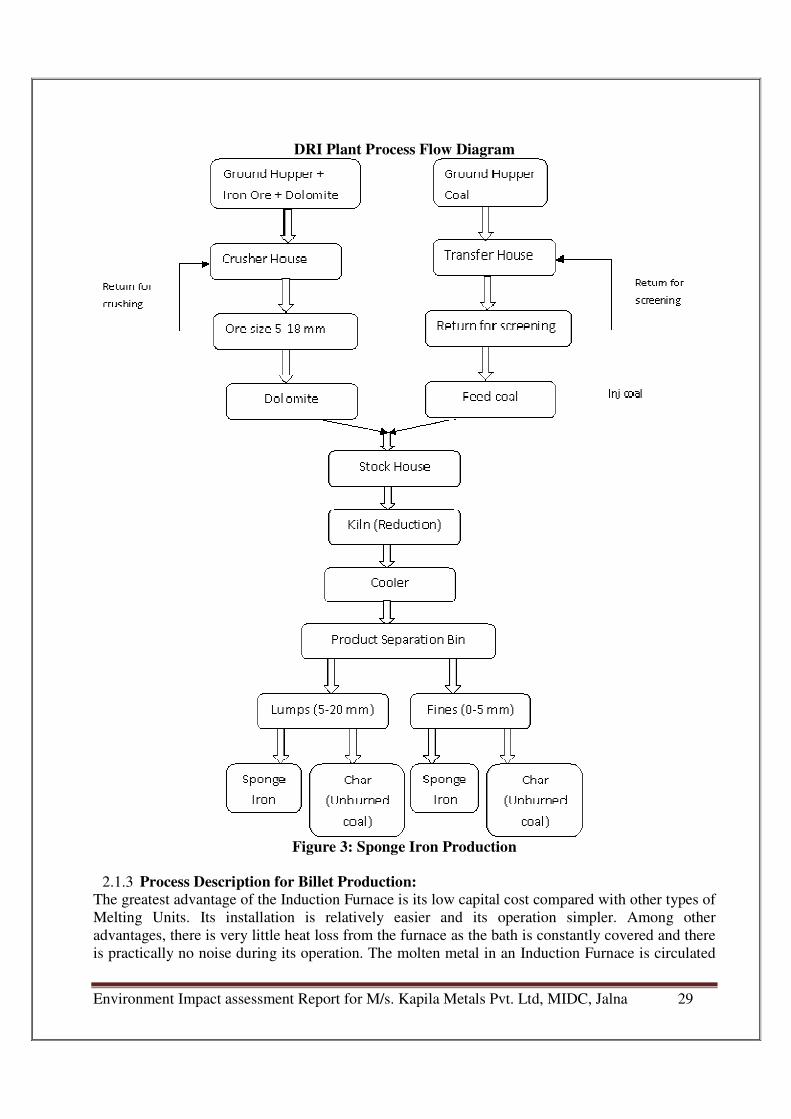
DRI Plant Process Flow Diagram
Figure 3: Sponge Iron Production
2.1.3 Process Description for Billet Production: The greatest advantage of the Induction Furnace is its low capital cost compared with other types of
Melting Units. Its installation is relatively easier and its operation simpler. Among other
advantages, there is very little heat loss from the furnace as the bath is constantly covered and there
is practically no noise during its operation. The molten metal in an Induction Furnace is circulated
Environment Impact assessment Report for M/s. Kapila Metals Pvt. Ltd, MIDC, Jalna 30
automatically by electromagnetic action so that when alloy additions are made, a homogeneous
product is ensured in minimum time. The time between tap and charge, the charging time, power
delays etc. are items of utmost importance are meeting the objective of maximum output in
tones/hour at a low operational cost. The process for manufacturing steel may be broadly divided
into the following stages:
Melting the charge mixed of steel & Iron scrap.
Ladle teeming practice for Casting (OR)
Direct teeming practice for Ingot Casting unloadable teeming machine.
(i) Melting the charge The furnace is switched on, current starts flowing at a high rate and a comparatively low voltage
through the induction coils of the furnace, producing an induced magnetic field inside the central
space of the coils where the crucible is located. The induced magnetic fluxes thus generated out
through the packed charge in the crucible, which is placed centrally inside the induction coil.
As the magnetic fluxes generated out through the scraps and complete the circuit, they generate and
induce eddy current in the scrap. This induced eddy current, as it flows through the highly resistive
bath of scrap, generates tremendous heat and melting starts. It is thus apparent that the melting rate
depends primarily on two things (1) the density of magnetic fluxes and (2) compactness of the
charge. The magnetic fluxes can be controlled by varying input of power to the furnace, especially
the current and frequency.
In a medium frequency furnace, the frequency range normally varies between 150-10K
cycles/second. This heat is developed mainly in the outer rim of the metal in the charge but is
carried quickly to the center by conduction. Soon a pool of molten metal forms in the bottom
causing the charge to sink. At this point any remaining charge mixed is added gradually. The eddy
current, which is generated in the charge, has other uses. It imparts a molten effect on the liquid
steel, which is thereby stirred and mixed and heated more homogeneously. This stirring effect is
inversely proportional to the frequency of the furnace and so that furnace frequency is selected in
accordance with the purpose for which the furnace will be utilized.
The melting continues till all the charge is melted and the bath develops a convex surface. However
as the convex surface is not favorable to slag treatment, the power input is then naturally decreased
to flatten the convexity and to reduce the circulation rate when refining under a reducing slag. The
reduced flow of the liquid metal accelerates the purification reactions by constantly bringing new
metal into close contact with the slag. Before the actual reduction of steel is done, the liquid steel
which might contain some trapped oxygen is first treated with some suitable deoxidizer. When no
purification is attempted, the chief metallurgical advantages of the process attributable to the
stirring action are uniformity of the product, control over the super heat temperature and the
opportunity afforded by the conditions of the melt to control de-oxidation through proper addition.
As soon as the charge has melted and de-oxidizing ions have ceased, any objectionable slag is
skimmed off, and the necessary alloying elements are added. When these additives have melted and
diffused through the bath of the power input may be increased to bring the temperature of metal up
to the point most desirable for pouring. The current is then turned off and the furnace is tilted for
Environment Impact assessment Report for M/s. Kapila Metals Pvt. Ltd, MIDC, Jalna 31
pouring into a ladle. As soon as pouring has ceased, any slag adhering to the wall of the crucible is
rapped out and the furnace is readied for charging again.
As the furnace is equipped with a higher cover over the crucible very little oxidation occurs during
melting. Such a cover also serves to prevent cooling by radiation from the surface heat loss and
protecting the metal is unnecessary, though slags are used in special cases. Another advantage of
the induction furnace is that there is hardly any melting loss compared with the arc furnace.
(ii) Ladle Teeming Practice The molten metal from crucible taken out in a ladle by tilting the crucible and crucible is made free
for further charge of next batch.
(iii) Direct Teeming Practice In addition to the bottom pouring Ladle Teeming process, Direct Teeming process can also be used
as and when required. Direct teeming of liquid metal from induction furnace to mould assemble is
another process of the Billet casting practice. In this process the mould assemble comprising
bottom plate; Billet mould and trumpet properly lined with refractories are placed on top of a rail
bound transfer trolley moving across in front of the crucible which is supported properly from the
furnace structure.
While teeming the mould bogie transfer car is so positioned that the trumpet of the mould assembly
is properly aligned with the outlet nozzle of the tundish. The liquid metal from the spout is directed
through the tundish to the trumpet for casting of Billets. After the teeming is over, the car is moved
aside for stripping and removal of Billets. Normally two (2) such transfer cars are provided. While
one is engaged for casting purposes the other is kept ready for next melt. Direct teeming practice
obviates the use of stopper sleeve, stopper head and ladle refractory and requires only a nominal
quantity of refractory for lining the tundish and thus affects substantial savings in refractory costs.
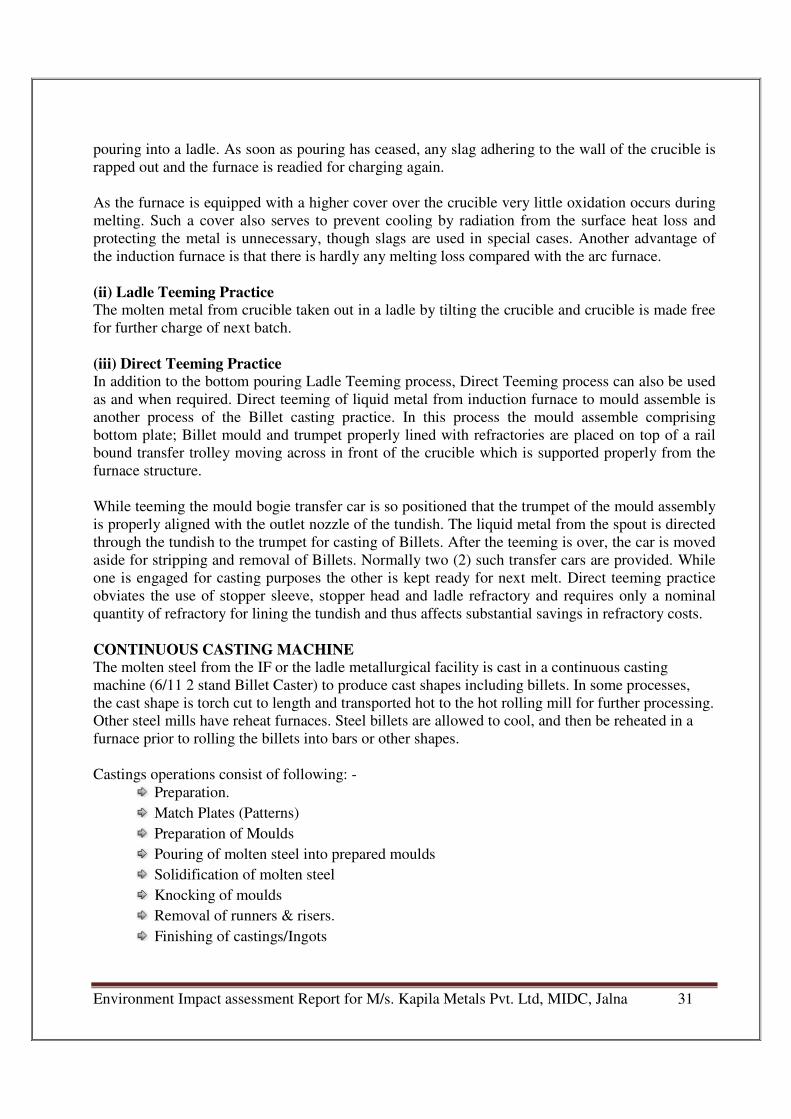
CONTINUOUS CASTING MACHINE The molten steel from the IF or the ladle metallurgical facility is cast in a continuous casting
machine (6/11 2 stand Billet Caster) to produce cast shapes including billets. In some processes,
the cast shape is torch cut to length and transported hot to the hot rolling mill for further processing.
Other steel mills have reheat furnaces. Steel billets are allowed to cool, and then be reheated in a
furnace prior to rolling the billets into bars or other shapes.
Castings operations consist of following: -
Preparation.
Match Plates (Patterns)
Preparation of Moulds
Pouring of molten steel into prepared moulds
Solidification of molten steel
Knocking of moulds
Removal of runners & risers.
Finishing of castings/Ingots
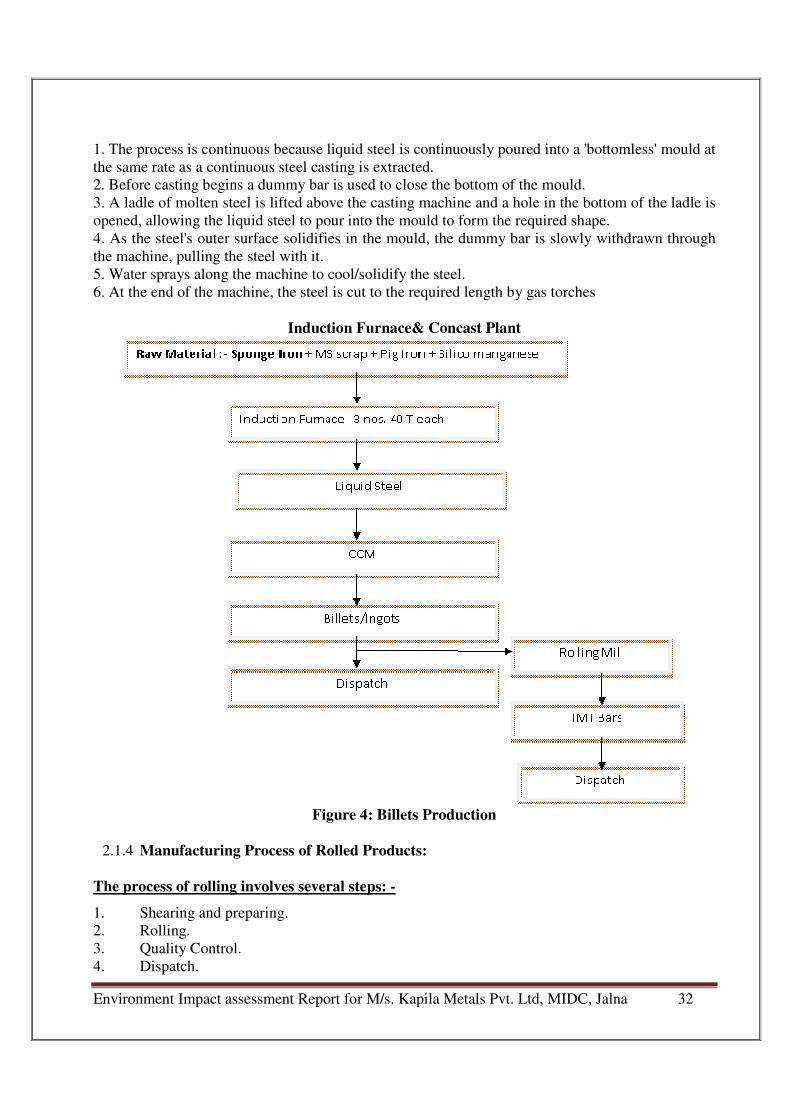
Environment Impact assessment Report for M/s. Kapila Metals Pvt. Ltd, MIDC, Jalna 32
1. The process is continuous because liquid steel is continuously poured into a 'bottomless' mould at
the same rate as a continuous steel casting is extracted.
2. Before casting begins a dummy bar is used to close the bottom of the mould.
3. A ladle of molten steel is lifted above the casting machine and a hole in the bottom of the ladle is
opened, allowing the liquid steel to pour into the mould to form the required shape.
4. As the steel's outer surface solidifies in the mould, the dummy bar is slowly withdrawn through
the machine, pulling the steel with it.
5. Water sprays along the machine to cool/solidify the steel.
6. At the end of the machine, the steel is cut to the required length by gas torches
Induction Furnace& Concast Plant
Figure 4: Billets Production
2.1.4 Manufacturing Process of Rolled Products:
The process of rolling involves several steps: -
1. Shearing and preparing.
2. Rolling.
3. Quality Control.
4. Dispatch.

Environment Impact assessment Report for M/s. Kapila Metals Pvt. Ltd, MIDC, Jalna 33
The raw material for the proposed unit is billet bloom, slab etc are collected from Billet Caster. The
material passed for rolling will be hot-charged to rolling stands. Basically, the heating operation is
intended to raise as uniformly as possible, the temperature of the ingot/billet/blash etc., to the level
appropriate for hot rolling. Optimum temperature for rolling semi-finished products depends upon
their compositions. Preferred rolling temperature for high carbon steels reached in oxidizing
atmosphere are usually in the rate of 1100ºC. The adequately heated work pieces are introduced
into re-rolling mills in which a number of carbon steels are chilled steel rolls works successively.
These cross-sections of the material decrease to a fixed value after every pass. Adjusting the roll
passes and designs can obtain the Products of desired cross section. The desired shaped produce is
obtained from last or finishing rolls. Thus the Ingot / Billets after testing are processed through a
shearing machine so as to cut them into required size depending upon the section to be rolled.
The material is then inducted into reheating furnace, where it is heated at a temperature of 1100 to
1200ºC. Reduction by compression in rollers and mills stands. This operation is normally carried
out in a roughing mill stand intermediate stand and finishing mill stand in total seven stands it
passes. The hot rolled products are then cooled on a cooling bed i.e. platform open to atmosphere.
The edges of the rolled products are trimmed and normal grinding operations are carried out. The
output is now finished goods. Quality control measures include dimensional check-up in shares and
sizes, tensile testing, chemical analysis to conform to the desired specification, etc. The processing
time in the furnace takes about 5 to 6 hours. No by-products are generated except the wastage due
to end cuttings. Burning loss has been assumed at 8% based on similar unit operations.
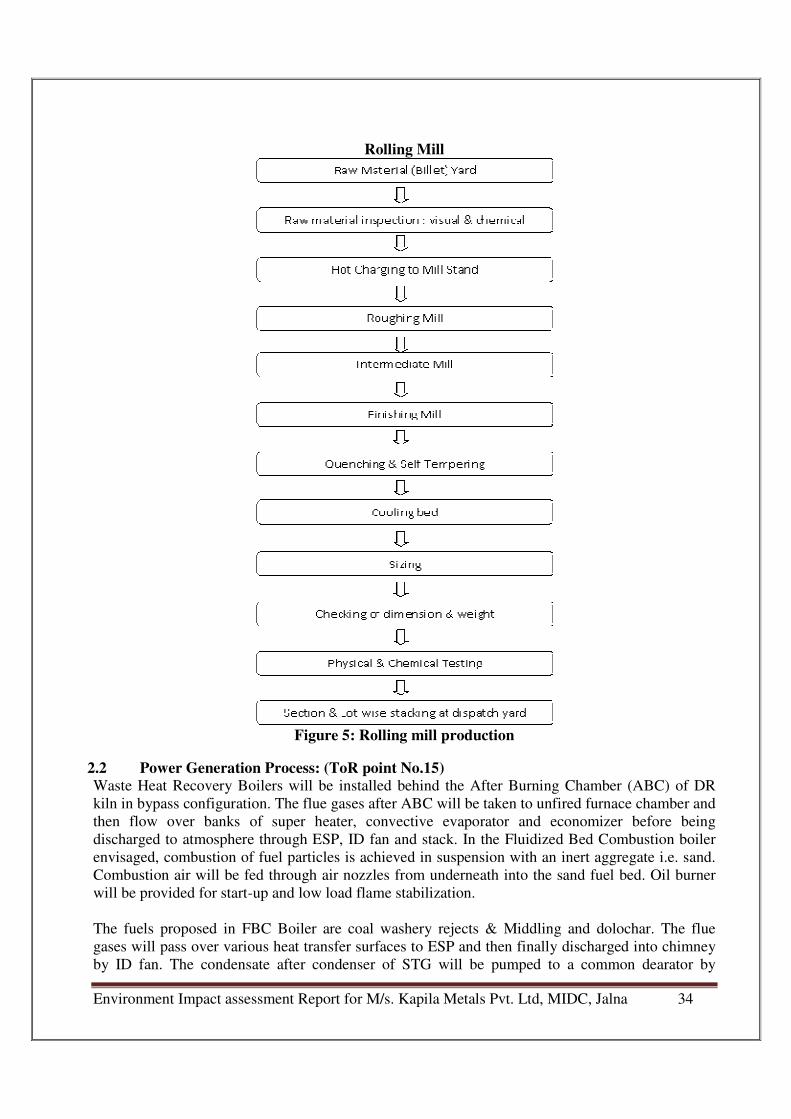
Environment Impact assessment Report for M/s. Kapila Metals Pvt. Ltd, MIDC, Jalna 34
Rolling Mill
Figure 5: Rolling mill production
2.2 Power Generation Process: (ToR point No.15) Waste Heat Recovery Boilers will be installed behind the After Burning Chamber (ABC) of DR
kiln in bypass configuration. The flue gases after ABC will be taken to unfired furnace chamber and
then flow over banks of super heater, convective evaporator and economizer before being
discharged to atmosphere through ESP, ID fan and stack. In the Fluidized Bed Combustion boiler
envisaged, combustion of fuel particles is achieved in suspension with an inert aggregate i.e. sand.
Combustion air will be fed through air nozzles from underneath into the sand fuel bed. Oil burner
will be provided for start-up and low load flame stabilization.
The fuels proposed in FBC Boiler are coal washery rejects & Middling and dolochar. The flue
gases will pass over various heat transfer surfaces to ESP and then finally discharged into chimney
by ID fan. The condensate after condenser of STG will be pumped to a common dearator by
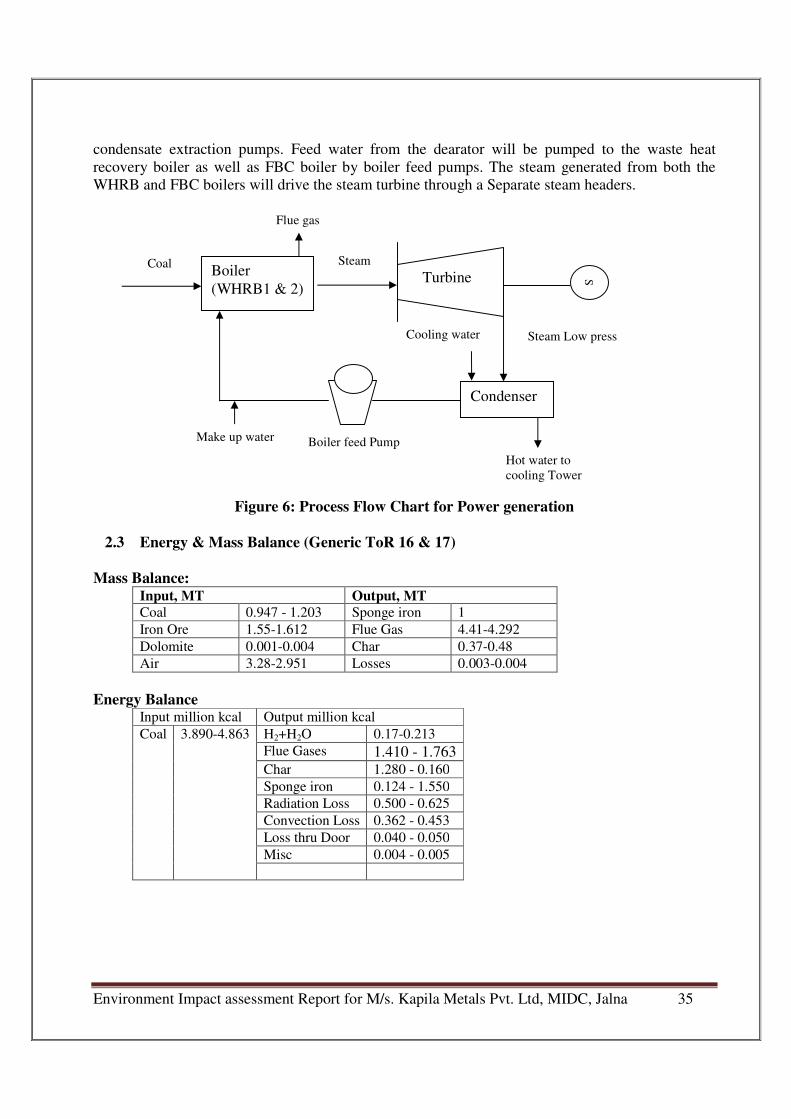
Environment Impact assessment Report for M/s. Kapila Metals Pvt. Ltd, MIDC, Jalna 35
condensate extraction pumps. Feed water from the dearator will be pumped to the waste heat
recovery boiler as well as FBC boiler by boiler feed pumps. The steam generated from both the
WHRB and FBC boilers will drive the steam turbine through a Separate steam headers.
Figure 6: Process Flow Chart for Power generation
2.3 Energy & Mass Balance (Generic ToR 16 & 17)
Mass Balance: Input, MT Output, MT
Coal 0.947 - 1.203 Sponge iron 1
Iron Ore 1.55-1.612 Flue Gas 4.41-4.292
Dolomite 0.001-0.004 Char 0.37-0.48
Air 3.28-2.951 Losses 0.003-0.004
Energy Balance Input million kcal Output million kcal
Coal 3.890-4.863 H2+H2O 0.17-0.213
Flue Gases 1.410 - 1.763
Char 1.280 - 0.160
Sponge iron 0.124 - 1.550
Radiation Loss 0.500 - 0.625
Convection Loss 0.362 - 0.453
Loss thru Door 0.040 - 0.050
Misc 0.004 - 0.005
Boiler
(WHRB1 & 2)
Coal
Turbine S
Condenser
Boiler feed Pump
Cooling water Steam Low press
Steam
Flue gas
Hot water to
cooling Tower
Make up water
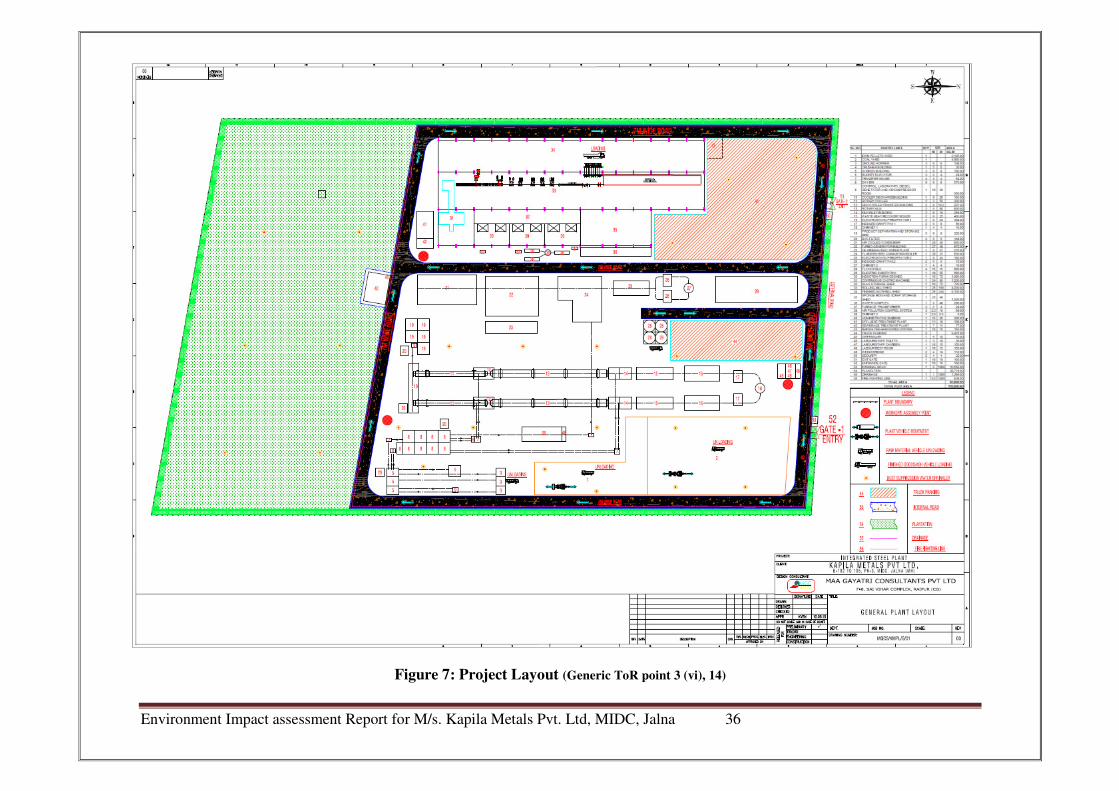
Environment Impact assessment Report for M/s. Kapila Metals Pvt. Ltd, MIDC, Jalna 36
Figure 7: Project Layout (Generic ToR point 3 (vi), 14)
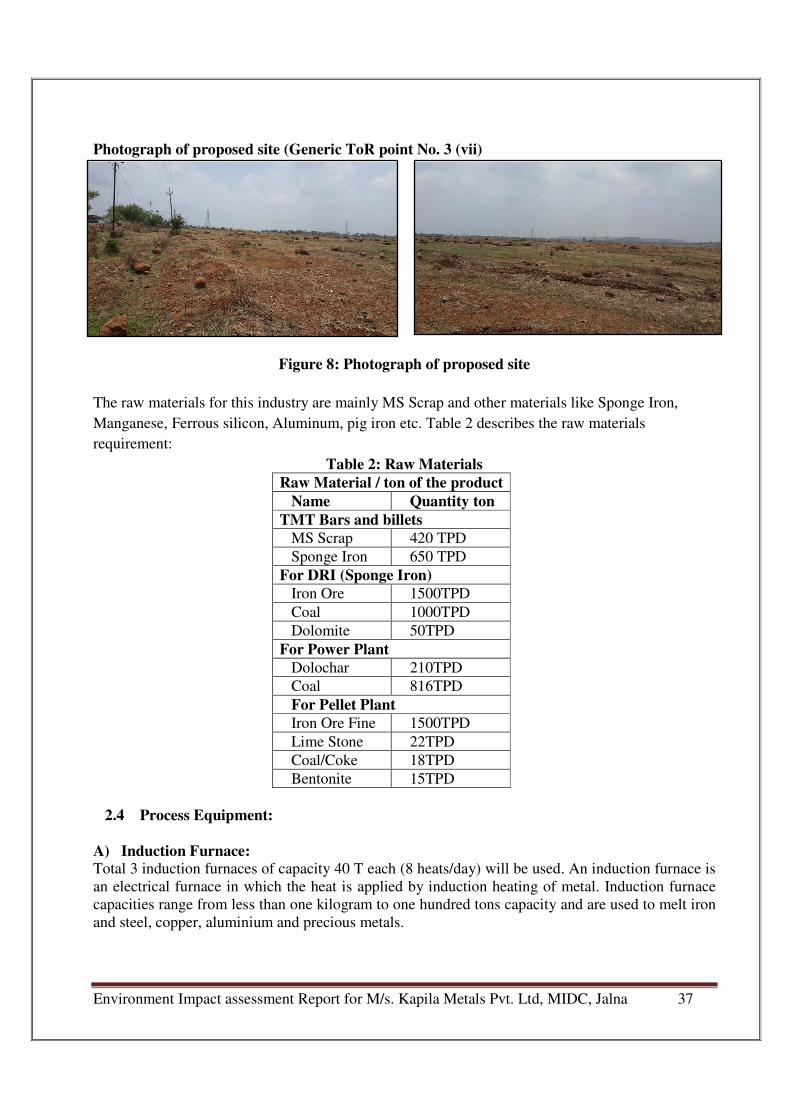
Environment Impact assessment Report for M/s. Kapila Metals Pvt. Ltd, MIDC, Jalna 37
Photograph of proposed site (Generic ToR point No. 3 (vii)
Figure 8: Photograph of proposed site
The raw materials for this industry are mainly MS Scrap and other materials like Sponge Iron,
Manganese, Ferrous silicon, Aluminum, pig iron etc. Table 2 describes the raw materials
requirement:
Table 2: Raw Materials
Raw Material / ton of the product
Name Quantity ton
TMT Bars and billets
MS Scrap 420 TPD
Sponge Iron 650 TPD
For DRI (Sponge Iron)
Iron Ore 1500TPD
Coal 1000TPD
Dolomite 50TPD
For Power Plant
Dolochar 210TPD
Coal 816TPD
For Pellet Plant
Iron Ore Fine 1500TPD
Lime Stone 22TPD
Coal/Coke 18TPD
Bentonite 15TPD
2.4 Process Equipment:
A) Induction Furnace: Total 3 induction furnaces of capacity 40 T each (8 heats/day) will be used. An induction furnace is
an electrical furnace in which the heat is applied by induction heating of metal. Induction furnace
capacities range from less than one kilogram to one hundred tons capacity and are used to melt iron
and steel, copper, aluminium and precious metals.
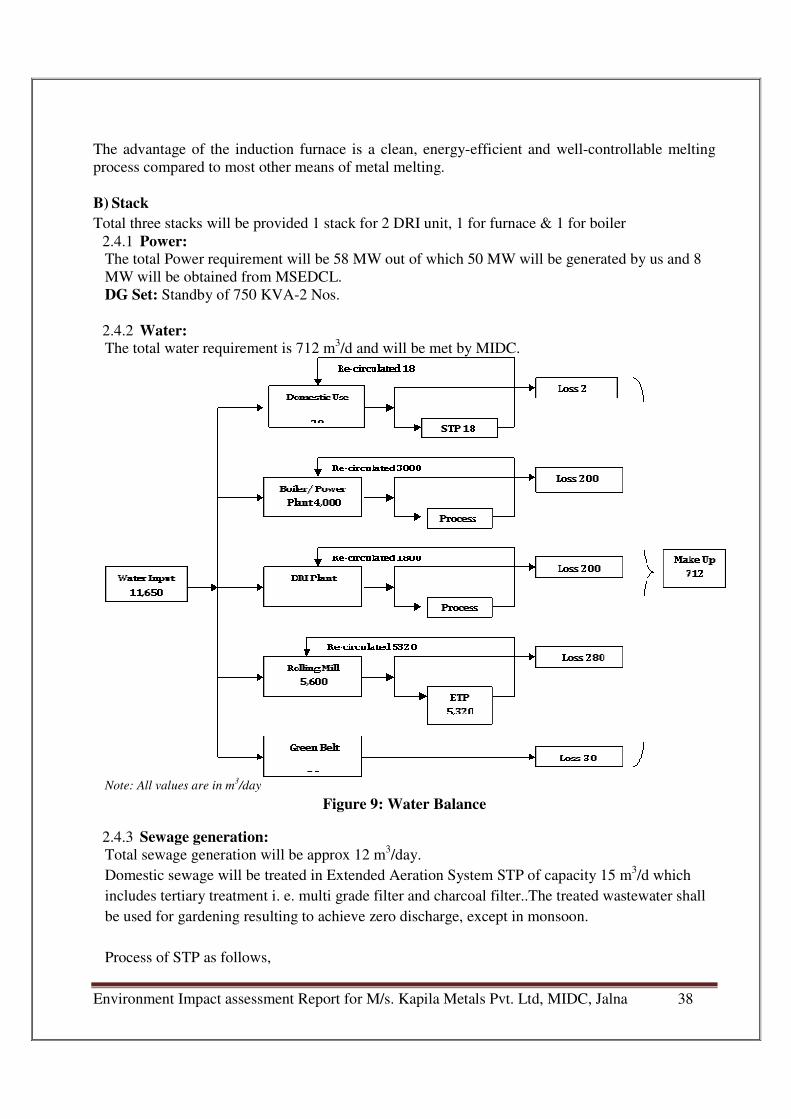
Environment Impact assessment Report for M/s. Kapila Metals Pvt. Ltd, MIDC, Jalna 38
The advantage of the induction furnace is a clean, energy-efficient and well-controllable melting
process compared to most other means of metal melting.
B) Stack
Total three stacks will be provided 1 stack for 2 DRI unit, 1 for furnace & 1 for boiler
2.4.1 Power: The total Power requirement will be 58 MW out of which 50 MW will be generated by us and 8
MW will be obtained from MSEDCL.
DG Set: Standby of 750 KVA-2 Nos.
2.4.2 Water: The total water requirement is 712 m3/d and will be met by MIDC.
Note: All values are in m
3/day
Figure 9: Water Balance
2.4.3 Sewage generation:
Total sewage generation will be approx 12 m3/day.
Domestic sewage will be treated in Extended Aeration System STP of capacity 15 m3/d which
includes tertiary treatment i. e. multi grade filter and charcoal filter..The treated wastewater shall
be used for gardening resulting to achieve zero discharge, except in monsoon.
Process of STP as follows,
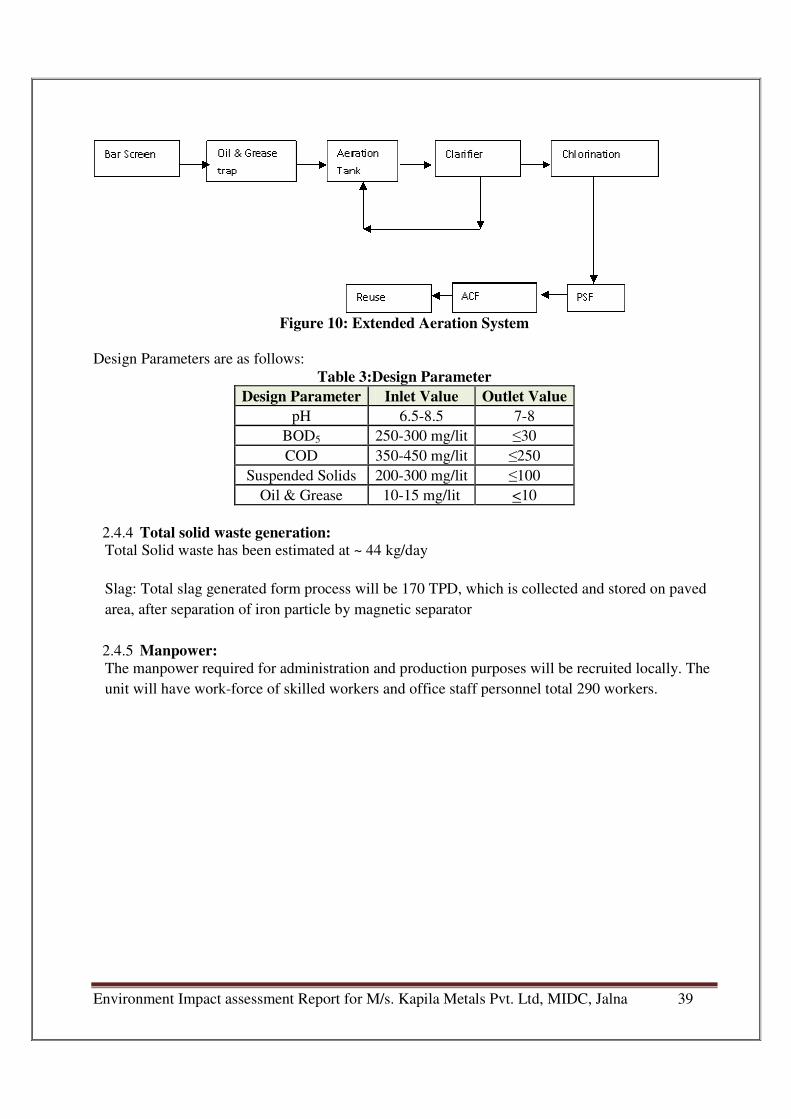
Environment Impact assessment Report for M/s. Kapila Metals Pvt. Ltd, MIDC, Jalna 39
Figure 10: Extended Aeration System
Design Parameters are as follows:
Table 3:Design Parameter
Design Parameter Inlet Value Outlet Value
pH 6.5-8.5 7-8
BOD5 250-300 mg/lit ≤30
COD 350-450 mg/lit ≤250
Suspended Solids 200-300 mg/lit ≤100
Oil & Grease 10-15 mg/lit <10
2.4.4 Total solid waste generation: Total Solid waste has been estimated at ~ 44 kg/day
Slag: Total slag generated form process will be 170 TPD, which is collected and stored on paved
area, after separation of iron particle by magnetic separator
2.4.5 Manpower:
The manpower required for administration and production purposes will be recruited locally. The
unit will have work-force of skilled workers and office staff personnel total 290 workers.
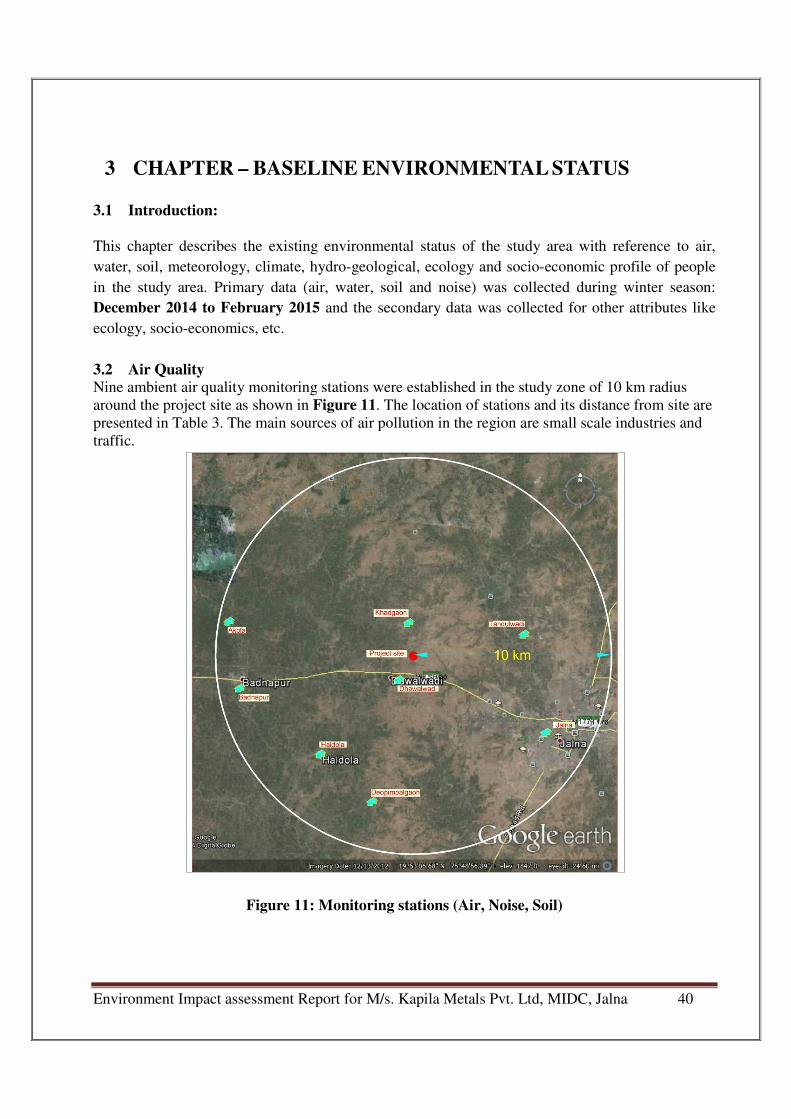
Environment Impact assessment Report for M/s. Kapila Metals Pvt. Ltd, MIDC, Jalna 40
3 CHAPTER – BASELINE ENVIRONMENTAL STATUS
3.1 Introduction:
This chapter describes the existing environmental status of the study area with reference to air,
water, soil, meteorology, climate, hydro-geological, ecology and socio-economic profile of people
in the study area. Primary data (air, water, soil and noise) was collected during winter season:
December 2014 to February 2015 and the secondary data was collected for other attributes like
ecology, socio-economics, etc.
3.2 Air Quality Nine ambient air quality monitoring stations were established in the study zone of 10 km radius
around the project site as shown in Figure 11. The location of stations and its distance from site are
presented in Table 3. The main sources of air pollution in the region are small scale industries and
traffic.
Figure 11: Monitoring stations (Air, Noise, Soil)
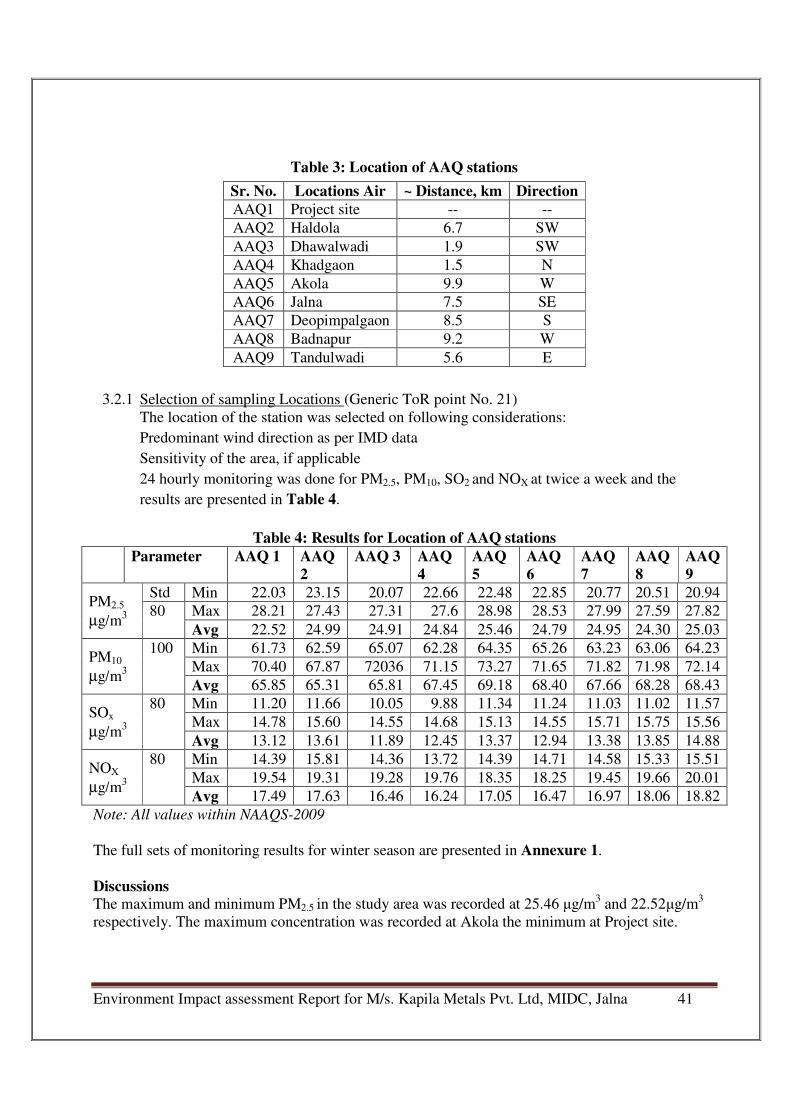
Environment Impact assessment Report for M/s. Kapila Metals Pvt. Ltd, MIDC, Jalna 41
Table 3: Location of AAQ stations
3.2.1 Selection of sampling Locations (Generic ToR point No. 21)
The location of the station was selected on following considerations:
Predominant wind direction as per IMD data
Sensitivity of the area, if applicable
24 hourly monitoring was done for PM2.5, PM10, SO2 and NOX at twice a week and the
results are presented in Table 4.
Table 4: Results for Location of AAQ stations
Parameter AAQ 1 AAQ
2
AAQ 3 AAQ
4
AAQ
5
AAQ
6
AAQ
7
AAQ
8
AAQ
9
PM2.5
µg/m3
Std Min 22.03 23.15 20.07 22.66 22.48 22.85 20.77 20.51 20.94
80 Max 28.21 27.43 27.31 27.6 28.98 28.53 27.99 27.59 27.82
Avg 22.52 24.99 24.91 24.84 25.46 24.79 24.95 24.30 25.03
PM10
µg/m3
100 Min 61.73 62.59 65.07 62.28 64.35 65.26 63.23 63.06 64.23
Max 70.40 67.87 72036 71.15 73.27 71.65 71.82 71.98 72.14
Avg 65.85 65.31 65.81 67.45 69.18 68.40 67.66 68.28 68.43
SOx
µg/m3
80 Min 11.20 11.66 10.05 9.88 11.34 11.24 11.03 11.02 11.57
Max 14.78 15.60 14.55 14.68 15.13 14.55 15.71 15.75 15.56
Avg 13.12 13.61 11.89 12.45 13.37 12.94 13.38 13.85 14.88
NOX
µg/m3
80 Min 14.39 15.81 14.36 13.72 14.39 14.71 14.58 15.33 15.51
Max 19.54 19.31 19.28 19.76 18.35 18.25 19.45 19.66 20.01
Avg 17.49 17.63 16.46 16.24 17.05 16.47 16.97 18.06 18.82
Note: All values within NAAQS-2009
The full sets of monitoring results for winter season are presented in Annexure 1.
Discussions The maximum and minimum PM2.5 in the study area was recorded at 25.46 µg/m
3 and 22.52µg/m
3
respectively. The maximum concentration was recorded at Akola the minimum at Project site.
Sr. No. Locations Air ~ Distance, km Direction
AAQ1 Project site -- --
AAQ2 Haldola 6.7 SW
AAQ3 Dhawalwadi 1.9 SW
AAQ4 Khadgaon 1.5 N
AAQ5 Akola 9.9 W
AAQ6 Jalna 7.5 SE
AAQ7 Deopimpalgaon 8.5 S
AAQ8 Badnapur 9.2 W
AAQ9 Tandulwadi 5.6 E
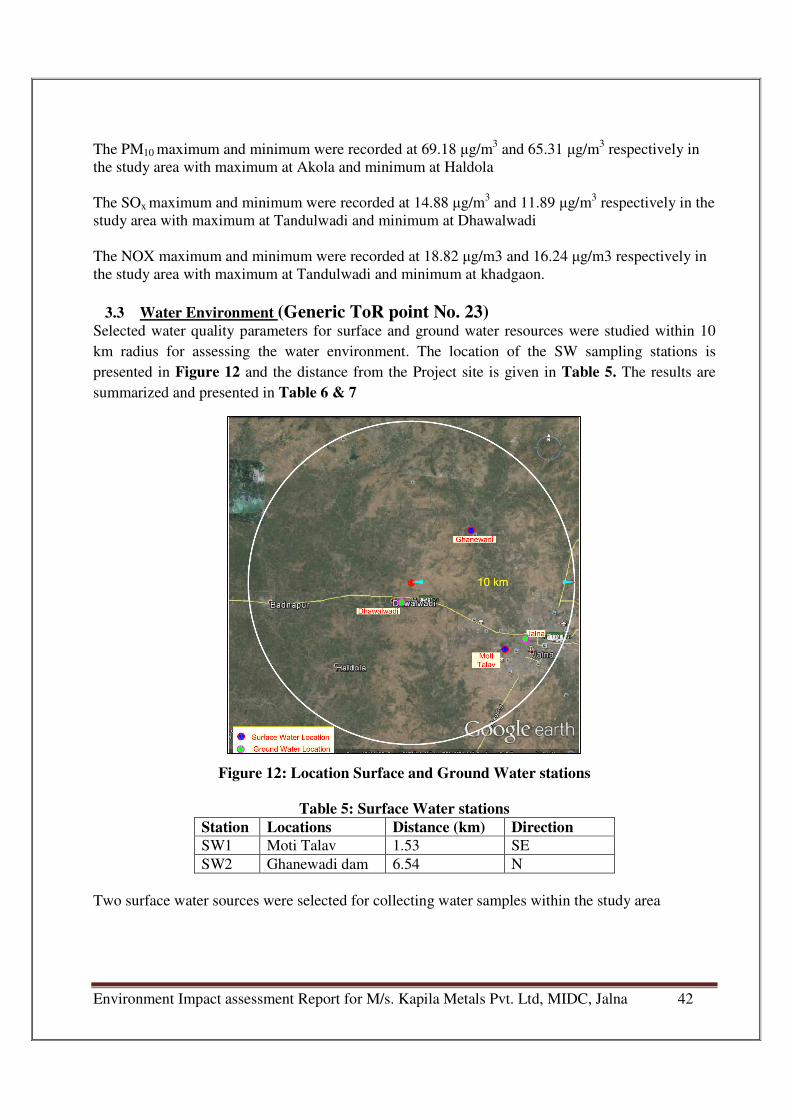
Environment Impact assessment Report for M/s. Kapila Metals Pvt. Ltd, MIDC, Jalna 42
The PM10 maximum and minimum were recorded at 69.18 µg/m3 and 65.31 µg/m
3 respectively in
the study area with maximum at Akola and minimum at Haldola
The SOx maximum and minimum were recorded at 14.88 µg/m3 and 11.89 µg/m3 respectively in the
study area with maximum at Tandulwadi and minimum at Dhawalwadi
The NOX maximum and minimum were recorded at 18.82 µg/m3 and 16.24 µg/m3 respectively in
the study area with maximum at Tandulwadi and minimum at khadgaon.
3.3 Water Environment (Generic ToR point No. 23) Selected water quality parameters for surface and ground water resources were studied within 10
km radius for assessing the water environment. The location of the SW sampling stations is
presented in Figure 12 and the distance from the Project site is given in Table 5. The results are
summarized and presented in Table 6 & 7
Figure 12: Location Surface and Ground Water stations
Table 5: Surface Water stations
Station Locations Distance (km) Direction
SW1 Moti Talav 1.53 SE
SW2 Ghanewadi dam 6.54 N
Two surface water sources were selected for collecting water samples within the study area
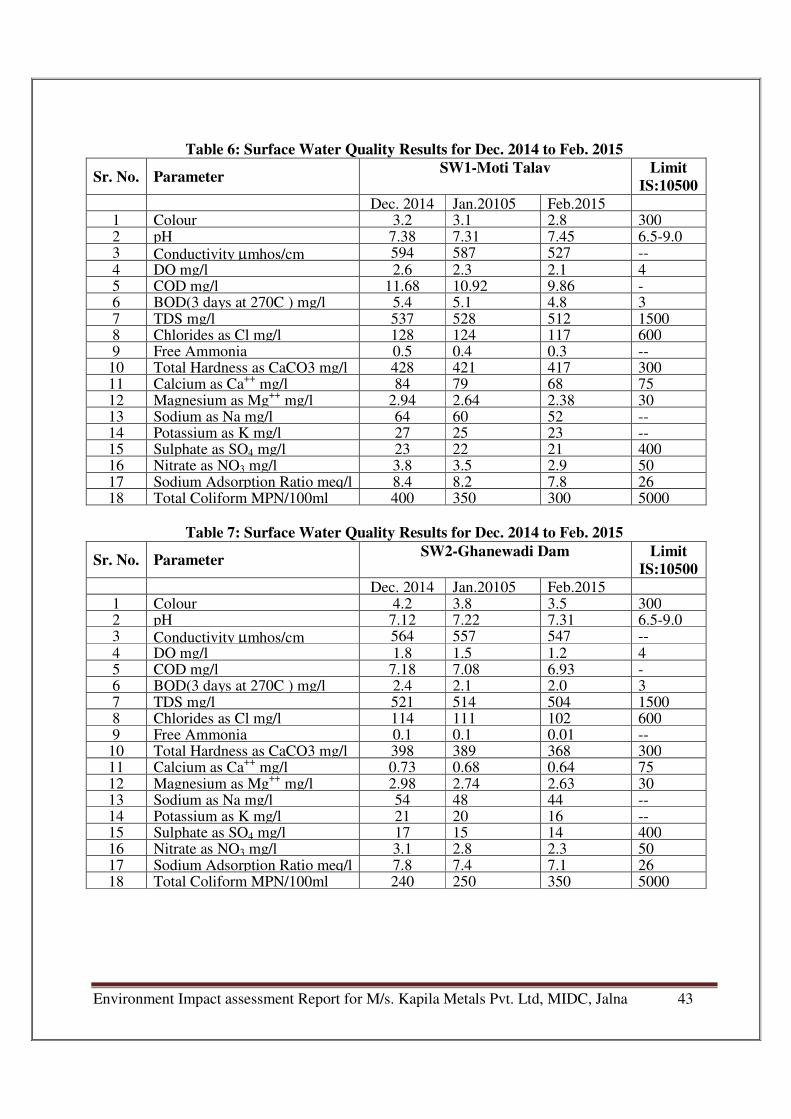
Environment Impact assessment Report for M/s. Kapila Metals Pvt. Ltd, MIDC, Jalna 43
Table 6: Surface Water Quality Results for Dec. 2014 to Feb. 2015
Sr. No. Parameter SW1-Moti Talav
Limit
IS:10500
Dec. 2014 Jan.20105 Feb.2015
1 Colour 3.2 3.1 2.8 300 2 pH 7.38 7.31 7.45 6.5-9.0 3 Conductivity µmhos/cm 594 587 527 -- 4 DO mg/l 2.6 2.3 2.1 4 5 COD mg/l 11.68 10.92 9.86 - 6 BOD(3 days at 270C ) mg/l 5.4 5.1 4.8 3 7 TDS mg/l 537 528 512 1500 8 Chlorides as Cl mg/l 128 124 117 600 9 Free Ammonia 0.5 0.4 0.3 --
10 Total Hardness as CaCO3 mg/l 428 421 417 300 11 Calcium as Ca++ mg/l 84 79 68 75 12 Magnesium as Mg
++ mg/l 2.94 2.64 2.38 30
13 Sodium as Na mg/l 64 60 52 -- 14 Potassium as K mg/l 27 25 23 -- 15 Sulphate as SO4 mg/l 23 22 21 400 16 Nitrate as NO3 mg/l 3.8 3.5 2.9 50 17 Sodium Adsorption Ratio meq/l 8.4 8.2 7.8 26 18 Total Coliform MPN/100ml 400 350 300 5000
Table 7: Surface Water Quality Results for Dec. 2014 to Feb. 2015
Sr. No. Parameter SW2-Ghanewadi Dam
Limit
IS:10500
Dec. 2014 Jan.20105 Feb.2015
1 Colour 4.2 3.8 3.5 300 2 pH 7.12 7.22 7.31 6.5-9.0 3 Conductivity µmhos/cm 564 557 547 -- 4 DO mg/l 1.8 1.5 1.2 4 5 COD mg/l 7.18 7.08 6.93 - 6 BOD(3 days at 270C ) mg/l 2.4 2.1 2.0 3 7 TDS mg/l 521 514 504 1500 8 Chlorides as Cl mg/l 114 111 102 600 9 Free Ammonia 0.1 0.1 0.01 --
10 Total Hardness as CaCO3 mg/l 398 389 368 300 11 Calcium as Ca++ mg/l 0.73 0.68 0.64 75 12 Magnesium as Mg
++ mg/l 2.98 2.74 2.63 30
13 Sodium as Na mg/l 54 48 44 -- 14 Potassium as K mg/l 21 20 16 -- 15 Sulphate as SO4 mg/l 17 15 14 400 16 Nitrate as NO3 mg/l 3.1 2.8 2.3 50 17 Sodium Adsorption Ratio meq/l 7.8 7.4 7.1 26 18 Total Coliform MPN/100ml 240 250 350 5000
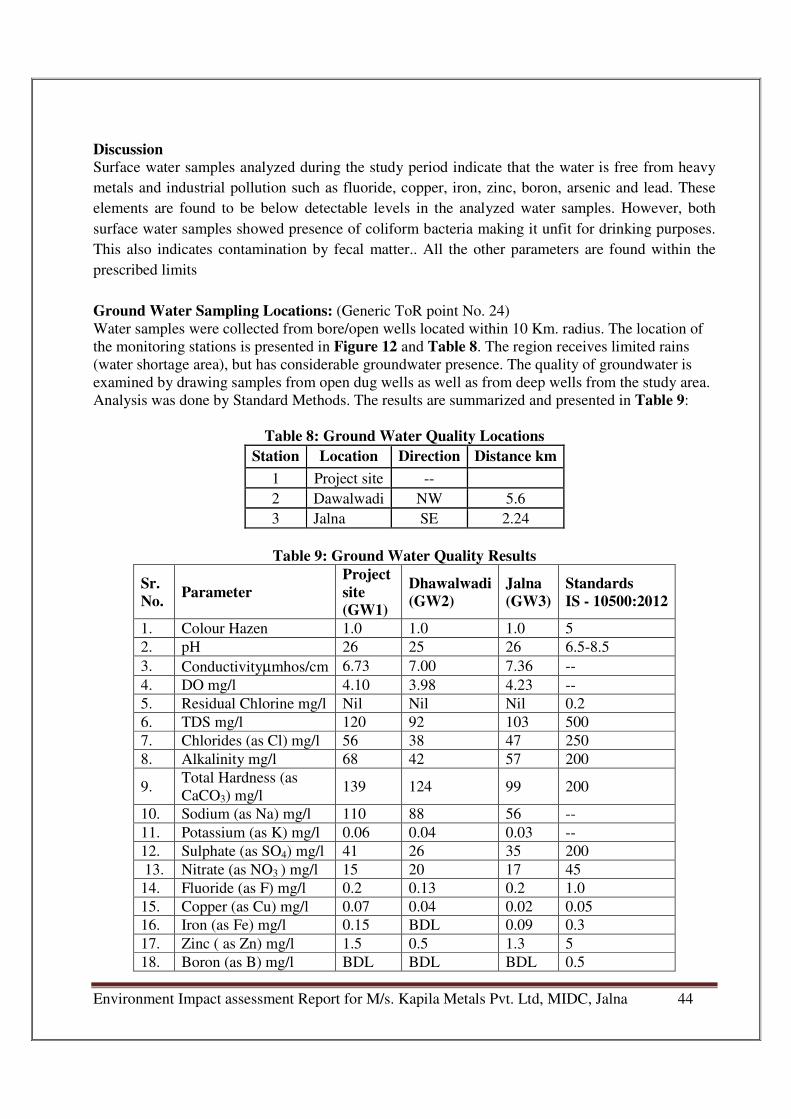
Environment Impact assessment Report for M/s. Kapila Metals Pvt. Ltd, MIDC, Jalna 44
Discussion
Surface water samples analyzed during the study period indicate that the water is free from heavy
metals and industrial pollution such as fluoride, copper, iron, zinc, boron, arsenic and lead. These
elements are found to be below detectable levels in the analyzed water samples. However, both
surface water samples showed presence of coliform bacteria making it unfit for drinking purposes.
This also indicates contamination by fecal matter.. All the other parameters are found within the
prescribed limits
Ground Water Sampling Locations: (Generic ToR point No. 24)
Water samples were collected from bore/open wells located within 10 Km. radius. The location of
the monitoring stations is presented in Figure 12 and Table 8. The region receives limited rains
(water shortage area), but has considerable groundwater presence. The quality of groundwater is
examined by drawing samples from open dug wells as well as from deep wells from the study area.
Analysis was done by Standard Methods. The results are summarized and presented in Table 9:
Table 8: Ground Water Quality Locations
Station Location Direction Distance km
1 Project site --
2 Dawalwadi NW 5.6
3 Jalna SE 2.24
Table 9: Ground Water Quality Results
Sr.
No. Parameter
Project
site
(GW1)
Dhawalwadi
(GW2)
Jalna
(GW3)
Standards
IS - 10500:2012
1. Colour Hazen 1.0 1.0 1.0 5
2. pH 26 25 26 6.5-8.5
3. Conductivityµmhos/cm 6.73 7.00 7.36 --
4. DO mg/l 4.10 3.98 4.23 --
5. Residual Chlorine mg/l Nil Nil Nil 0.2
6. TDS mg/l 120 92 103 500
7. Chlorides (as Cl) mg/l 56 38 47 250
8. Alkalinity mg/l 68 42 57 200
9. Total Hardness (as
CaCO3) mg/l 139 124 99 200
10. Sodium (as Na) mg/l 110 88 56 --
11. Potassium (as K) mg/l 0.06 0.04 0.03 --
12. Sulphate (as SO4) mg/l 41 26 35 200
13. Nitrate (as NO3 ) mg/l 15 20 17 45
14. Fluoride (as F) mg/l 0.2 0.13 0.2 1.0
15. Copper (as Cu) mg/l 0.07 0.04 0.02 0.05
16. Iron (as Fe) mg/l 0.15 BDL 0.09 0.3
17. Zinc ( as Zn) mg/l 1.5 0.5 1.3 5
18. Boron (as B) mg/l BDL BDL BDL 0.5
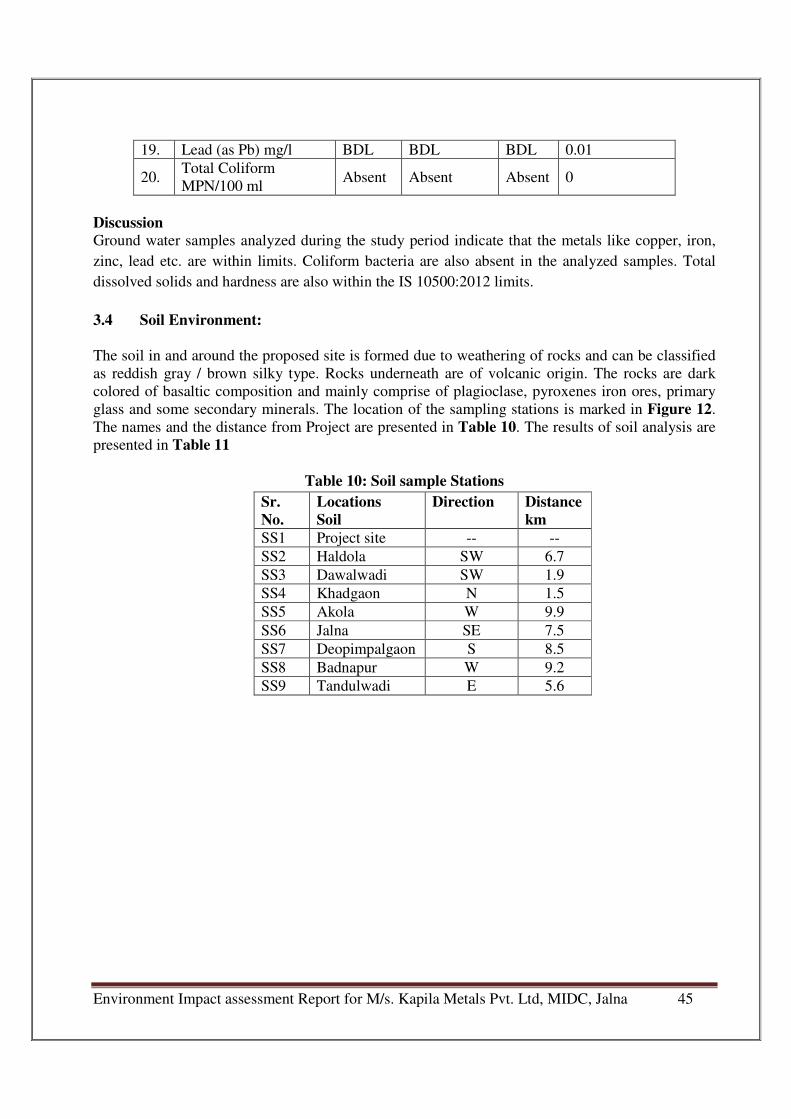
Environment Impact assessment Report for M/s. Kapila Metals Pvt. Ltd, MIDC, Jalna 45
19. Lead (as Pb) mg/l BDL BDL BDL 0.01
20. Total Coliform
MPN/100 ml Absent Absent Absent 0
Discussion
Ground water samples analyzed during the study period indicate that the metals like copper, iron,
zinc, lead etc. are within limits. Coliform bacteria are also absent in the analyzed samples. Total
dissolved solids and hardness are also within the IS 10500:2012 limits.
3.4 Soil Environment:
The soil in and around the proposed site is formed due to weathering of rocks and can be classified
as reddish gray / brown silky type. Rocks underneath are of volcanic origin. The rocks are dark
colored of basaltic composition and mainly comprise of plagioclase, pyroxenes iron ores, primary
glass and some secondary minerals. The location of the sampling stations is marked in Figure 12.
The names and the distance from Project are presented in Table 10. The results of soil analysis are
presented in Table 11
Table 10: Soil sample Stations
Sr.
No.
Locations
Soil
Direction Distance
km
SS1 Project site -- --
SS2 Haldola SW 6.7
SS3 Dawalwadi SW 1.9
SS4 Khadgaon N 1.5
SS5 Akola W 9.9
SS6 Jalna SE 7.5
SS7 Deopimpalgaon S 8.5
SS8 Badnapur W 9.2
SS9 Tandulwadi E 5.6
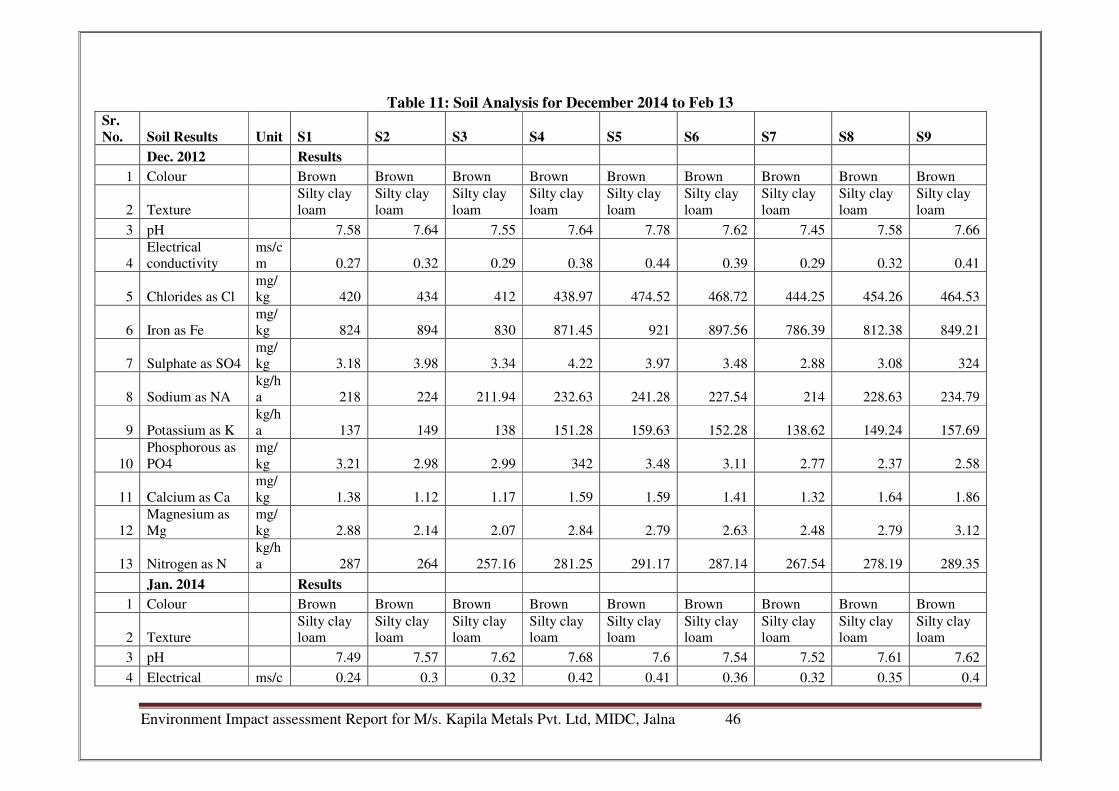
Environment Impact assessment Report for M/s. Kapila Metals Pvt. Ltd, MIDC, Jalna 46
Table 11: Soil Analysis for December 2014 to Feb 13 Sr.
No. Soil Results Unit S1 S2 S3 S4 S5 S6 S7 S8 S9
Dec. 2012 Results
1 Colour
Brown Brown Brown Brown Brown Brown Brown Brown Brown
2 Texture
Silty clay
loam
Silty clay
loam
Silty clay
loam
Silty clay
loam
Silty clay
loam
Silty clay
loam
Silty clay
loam
Silty clay
loam
Silty clay
loam
3 pH
7.58 7.64 7.55 7.64 7.78 7.62 7.45 7.58 7.66
4
Electrical
conductivity
ms/c
m 0.27 0.32 0.29 0.38 0.44 0.39 0.29 0.32 0.41
5 Chlorides as Cl
mg/
kg 420 434 412 438.97 474.52 468.72 444.25 454.26 464.53
6 Iron as Fe
mg/
kg 824 894 830 871.45 921 897.56 786.39 812.38 849.21
7 Sulphate as SO4
mg/
kg 3.18 3.98 3.34 4.22 3.97 3.48 2.88 3.08 324
8 Sodium as NA
kg/h
a 218 224 211.94 232.63 241.28 227.54 214 228.63 234.79
9 Potassium as K
kg/h
a 137 149 138 151.28 159.63 152.28 138.62 149.24 157.69
10
Phosphorous as
PO4
mg/
kg 3.21 2.98 2.99 342 3.48 3.11 2.77 2.37 2.58
11 Calcium as Ca
mg/
kg 1.38 1.12 1.17 1.59 1.59 1.41 1.32 1.64 1.86
12
Magnesium as
Mg
mg/
kg 2.88 2.14 2.07 2.84 2.79 2.63 2.48 2.79 3.12
13 Nitrogen as N
kg/h
a 287 264 257.16 281.25 291.17 287.14 267.54 278.19 289.35
Jan. 2014 Results
1 Colour
Brown Brown Brown Brown Brown Brown Brown Brown Brown
2 Texture
Silty clay
loam
Silty clay
loam
Silty clay
loam
Silty clay
loam
Silty clay
loam
Silty clay
loam
Silty clay
loam
Silty clay
loam
Silty clay
loam
3 pH
7.49 7.57 7.62 7.68 7.6 7.54 7.52 7.61 7.62
4 Electrical ms/c 0.24 0.3 0.32 0.42 0.41 0.36 0.32 0.35 0.4
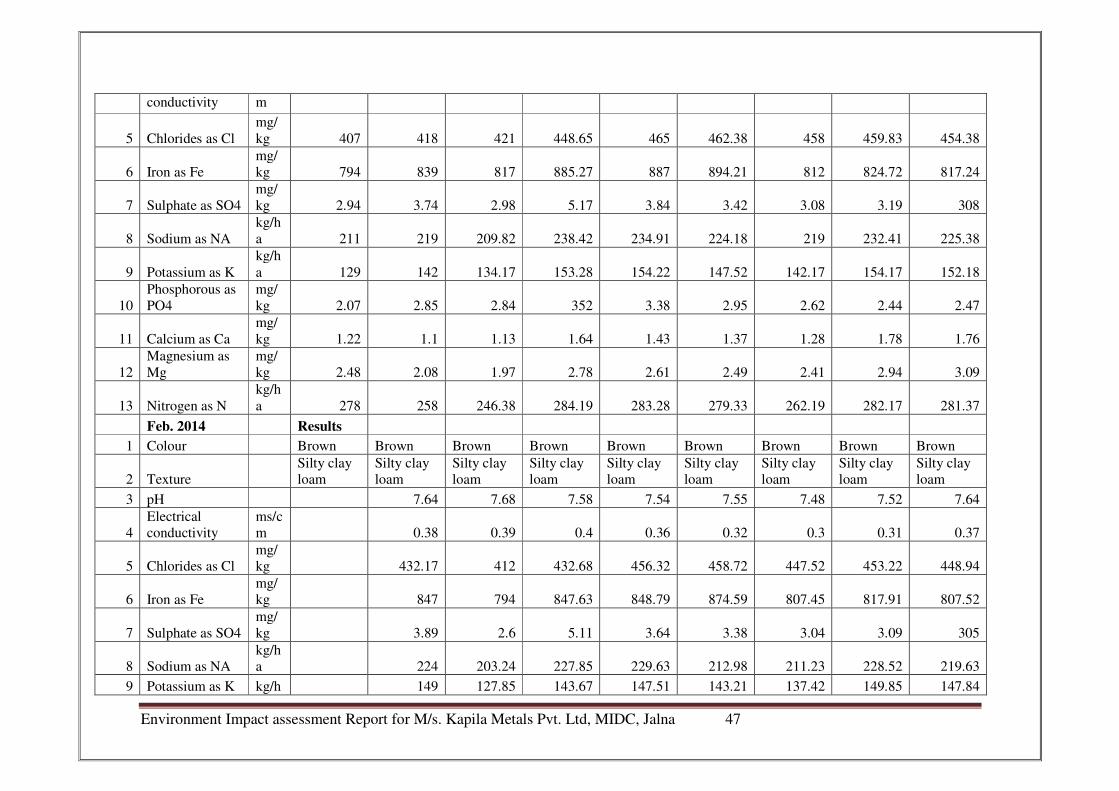
Environment Impact assessment Report for M/s. Kapila Metals Pvt. Ltd, MIDC, Jalna 47
conductivity m
5 Chlorides as Cl
mg/
kg 407 418 421 448.65 465 462.38 458 459.83 454.38
6 Iron as Fe
mg/
kg 794 839 817 885.27 887 894.21 812 824.72 817.24
7 Sulphate as SO4
mg/
kg 2.94 3.74 2.98 5.17 3.84 3.42 3.08 3.19 308
8 Sodium as NA
kg/h
a 211 219 209.82 238.42 234.91 224.18 219 232.41 225.38
9 Potassium as K
kg/h
a 129 142 134.17 153.28 154.22 147.52 142.17 154.17 152.18
10
Phosphorous as
PO4
mg/
kg 2.07 2.85 2.84 352 3.38 2.95 2.62 2.44 2.47
11 Calcium as Ca
mg/
kg 1.22 1.1 1.13 1.64 1.43 1.37 1.28 1.78 1.76
12
Magnesium as
Mg
mg/
kg 2.48 2.08 1.97 2.78 2.61 2.49 2.41 2.94 3.09
13 Nitrogen as N
kg/h
a 278 258 246.38 284.19 283.28 279.33 262.19 282.17 281.37
Feb. 2014
Results 1 Colour
Brown Brown Brown Brown Brown Brown Brown Brown Brown
2 Texture
Silty clay
loam
Silty clay
loam
Silty clay
loam
Silty clay
loam
Silty clay
loam
Silty clay
loam
Silty clay
loam
Silty clay
loam
Silty clay
loam
3 pH
7.64 7.68 7.58 7.54 7.55 7.48 7.52 7.64
4
Electrical
conductivity
ms/c
m
0.38 0.39 0.4 0.36 0.32 0.3 0.31 0.37
5 Chlorides as Cl
mg/
kg
432.17 412 432.68 456.32 458.72 447.52 453.22 448.94
6 Iron as Fe
mg/
kg
847 794 847.63 848.79 874.59 807.45 817.91 807.52
7 Sulphate as SO4
mg/
kg
3.89 2.6 5.11 3.64 3.38 3.04 3.09 305
8 Sodium as NA
kg/h
a
224 203.24 227.85 229.63 212.98 211.23 228.52 219.63
9 Potassium as K kg/h
149 127.85 143.67 147.51 143.21 137.42 149.85 147.84
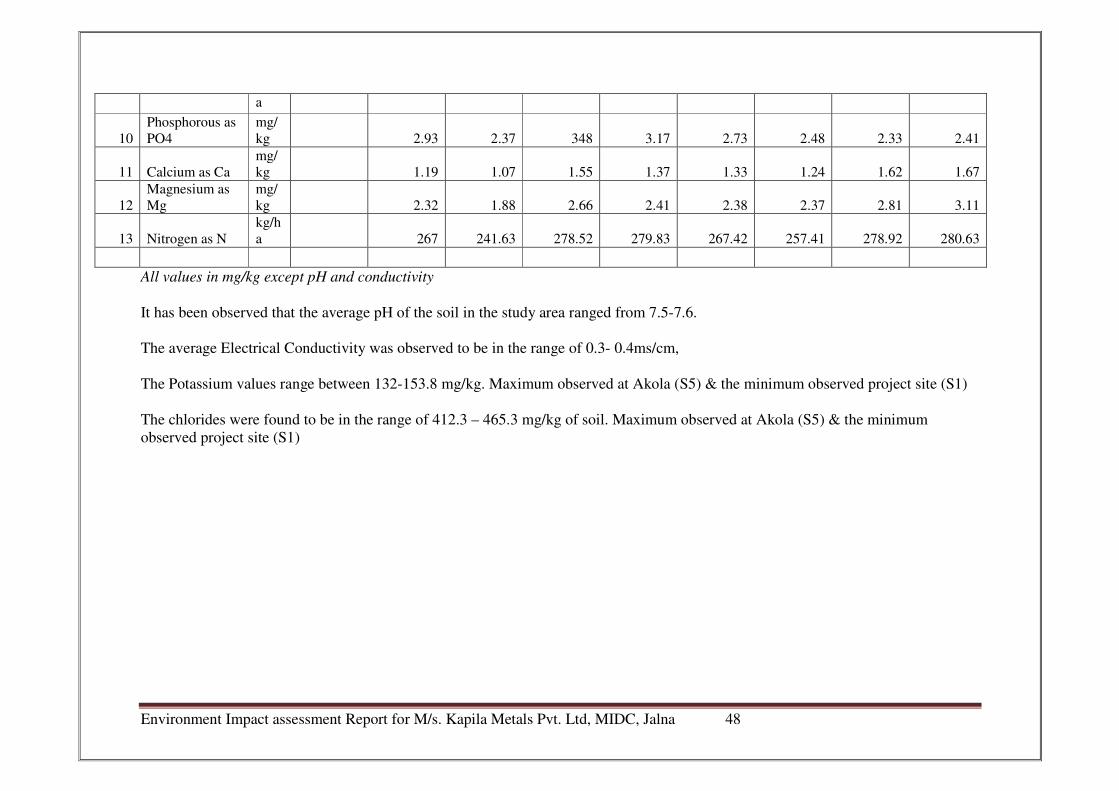
Environment Impact assessment Report for M/s. Kapila Metals Pvt. Ltd, MIDC, Jalna 48
a
10
Phosphorous as
PO4
mg/
kg
2.93 2.37 348 3.17 2.73 2.48 2.33 2.41
11 Calcium as Ca
mg/
kg
1.19 1.07 1.55 1.37 1.33 1.24 1.62 1.67
12
Magnesium as
Mg
mg/
kg
2.32 1.88 2.66 2.41 2.38 2.37 2.81 3.11
13 Nitrogen as N
kg/h
a
267 241.63 278.52 279.83 267.42 257.41 278.92 280.63
All values in mg/kg except pH and conductivity
It has been observed that the average pH of the soil in the study area ranged from 7.5-7.6.
The average Electrical Conductivity was observed to be in the range of 0.3- 0.4ms/cm,
The Potassium values range between 132-153.8 mg/kg. Maximum observed at Akola (S5) & the minimum observed project site (S1)
The chlorides were found to be in the range of 412.3 – 465.3 mg/kg of soil. Maximum observed at Akola (S5) & the minimum
observed project site (S1)
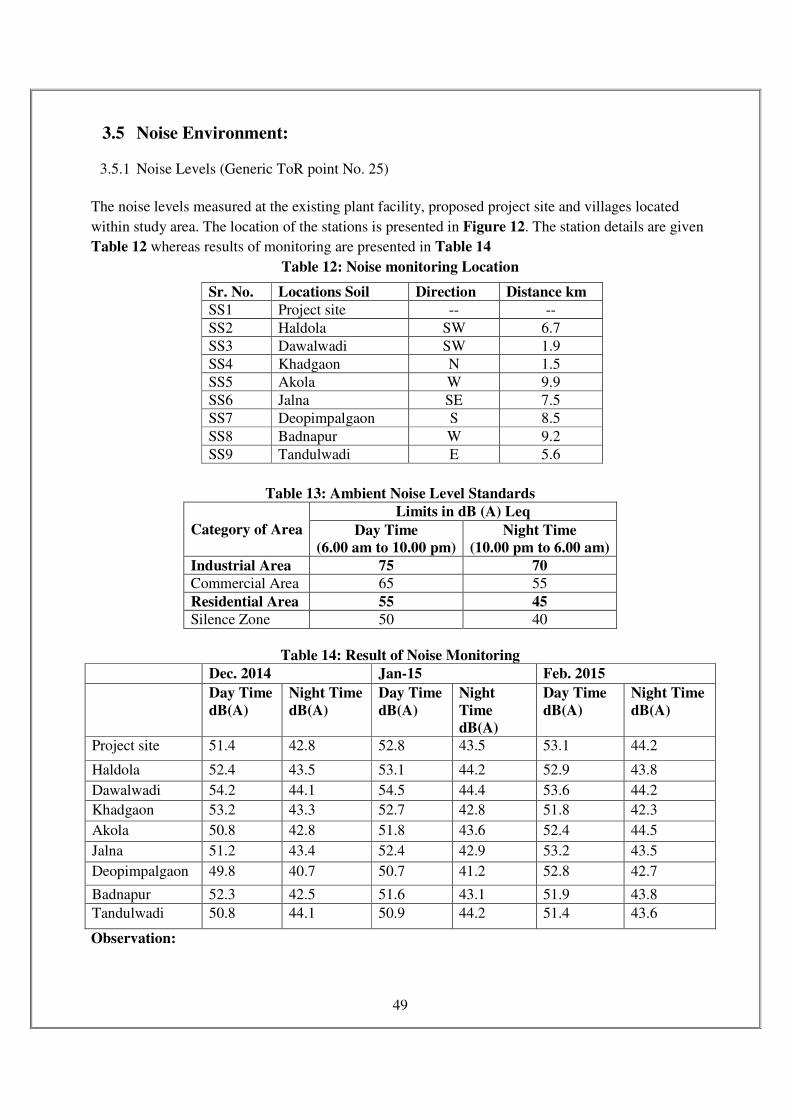
49
3.5 Noise Environment:
3.5.1 Noise Levels (Generic ToR point No. 25)
The noise levels measured at the existing plant facility, proposed project site and villages located
within study area. The location of the stations is presented in Figure 12. The station details are given
Table 12 whereas results of monitoring are presented in Table 14
Table 12: Noise monitoring Location
Table 13: Ambient Noise Level Standards
Category of Area
Limits in dB (A) Leq
Day Time
(6.00 am to 10.00 pm)
Night Time
(10.00 pm to 6.00 am)
Industrial Area 75 70
Commercial Area 65 55
Residential Area 55 45
Silence Zone 50 40
Table 14: Result of Noise Monitoring
Dec. 2014 Jan-15 Feb. 2015
Day Time
dB(A)
Night Time
dB(A)
Day Time
dB(A)
Night
Time
dB(A)
Day Time
dB(A)
Night Time
dB(A)
Project site 51.4 42.8 52.8 43.5 53.1 44.2
Haldola 52.4 43.5 53.1 44.2 52.9 43.8
Dawalwadi 54.2 44.1 54.5 44.4 53.6 44.2
Khadgaon 53.2 43.3 52.7 42.8 51.8 42.3
Akola 50.8 42.8 51.8 43.6 52.4 44.5
Jalna 51.2 43.4 52.4 42.9 53.2 43.5
Deopimpalgaon 49.8 40.7 50.7 41.2 52.8 42.7
Badnapur 52.3 42.5 51.6 43.1 51.9 43.8
Tandulwadi 50.8 44.1 50.9 44.2 51.4 43.6
Observation:
Sr. No. Locations Soil Direction Distance km
SS1 Project site -- --
SS2 Haldola SW 6.7
SS3 Dawalwadi SW 1.9
SS4 Khadgaon N 1.5
SS5 Akola W 9.9
SS6 Jalna SE 7.5
SS7 Deopimpalgaon S 8.5
SS8 Badnapur W 9.2
SS9 Tandulwadi E 5.6
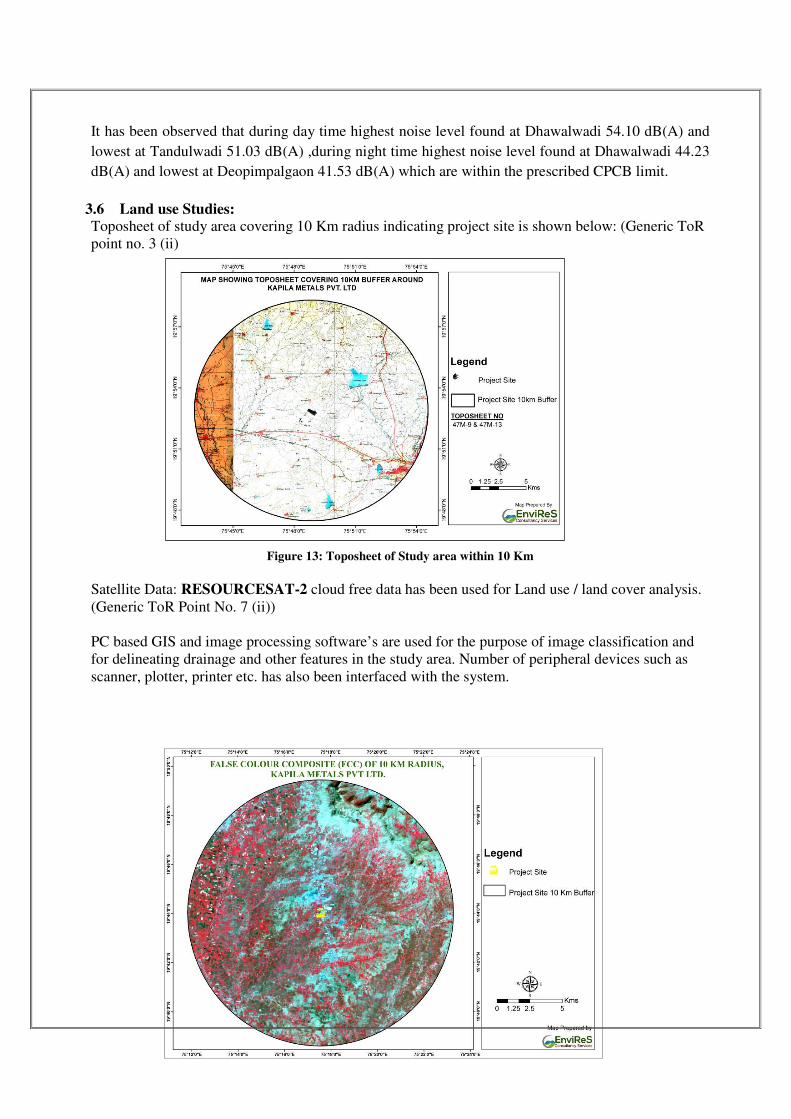
50
It has been observed that during day time highest noise level found at Dhawalwadi 54.10 dB(A) and
lowest at Tandulwadi 51.03 dB(A) ,during night time highest noise level found at Dhawalwadi 44.23
dB(A) and lowest at Deopimpalgaon 41.53 dB(A) which are within the prescribed CPCB limit.
3.6 Land use Studies: Toposheet of study area covering 10 Km radius indicating project site is shown below: (Generic ToR
point no. 3 (ii)
Figure 13: Toposheet of Study area within 10 Km
Satellite Data: RESOURCESAT-2 cloud free data has been used for Land use / land cover analysis.
(Generic ToR Point No. 7 (ii))
PC based GIS and image processing software’s are used for the purpose of image classification and
for delineating drainage and other features in the study area. Number of peripheral devices such as
scanner, plotter, printer etc. has also been interfaced with the system.
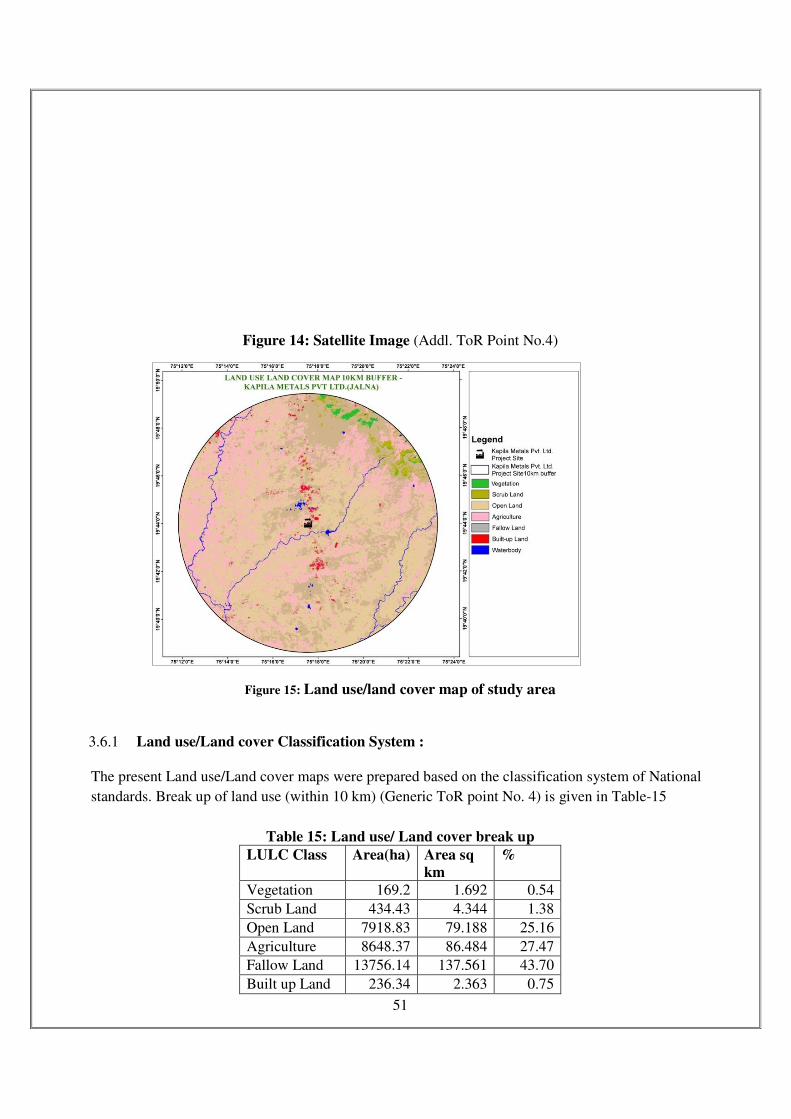
51
Figure 14: Satellite Image (Addl. ToR Point No.4)
Figure 15: Land use/land cover map of study area
3.6.1 Land use/Land cover Classification System :
The present Land use/Land cover maps were prepared based on the classification system of National
standards. Break up of land use (within 10 km) (Generic ToR point No. 4) is given in Table-15
Table 15: Land use/ Land cover break up
LULC Class Area(ha) Area sq
km
%
Vegetation 169.2 1.692 0.54
Scrub Land 434.43 4.344 1.38
Open Land 7918.83 79.188 25.16
Agriculture 8648.37 86.484 27.47
Fallow Land 13756.14 137.561 43.70
Built up Land 236.34 2.363 0.75
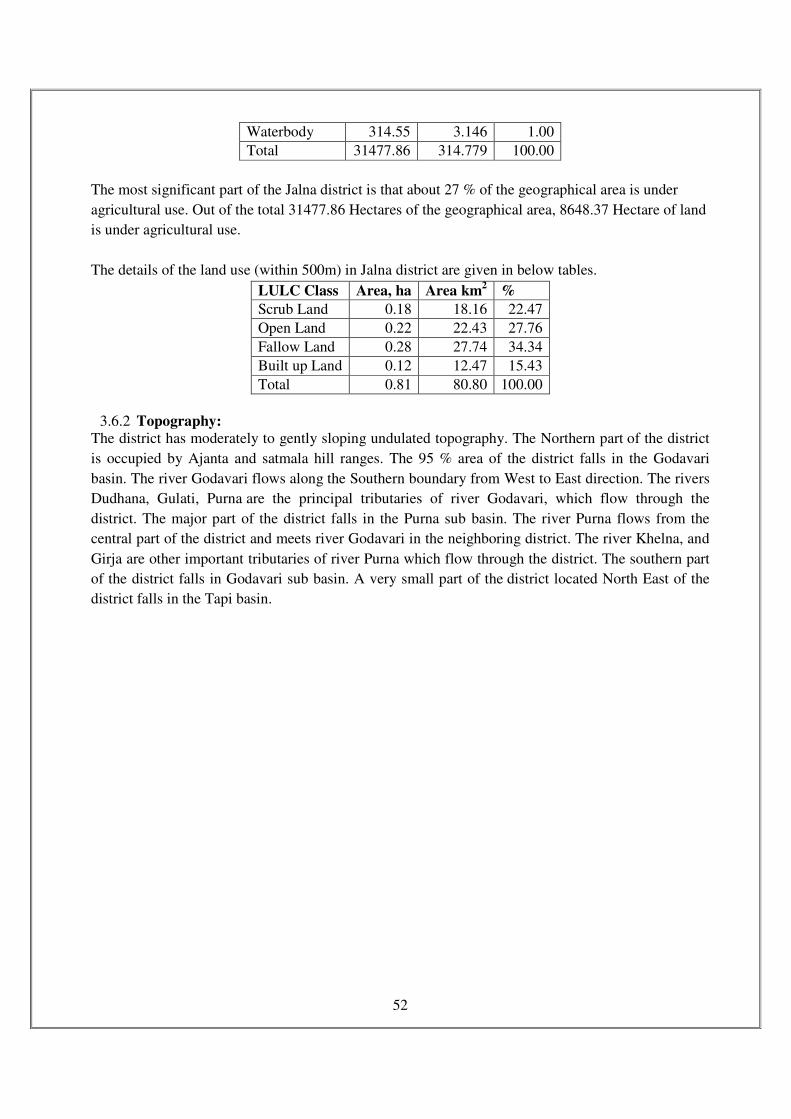
52
Waterbody 314.55 3.146 1.00
Total 31477.86 314.779 100.00
The most significant part of the Jalna district is that about 27 % of the geographical area is under
agricultural use. Out of the total 31477.86 Hectares of the geographical area, 8648.37 Hectare of land
is under agricultural use.
The details of the land use (within 500m) in Jalna district are given in below tables.
LULC Class Area, ha Area km2 %
Scrub Land 0.18 18.16 22.47
Open Land 0.22 22.43 27.76
Fallow Land 0.28 27.74 34.34
Built up Land 0.12 12.47 15.43
Total 0.81 80.80 100.00
3.6.2 Topography:
The district has moderately to gently sloping undulated topography. The Northern part of the district
is occupied by Ajanta and satmala hill ranges. The 95 % area of the district falls in the Godavari
basin. The river Godavari flows along the Southern boundary from West to East direction. The rivers
Dudhana, Gulati, Purna are the principal tributaries of river Godavari, which flow through the
district. The major part of the district falls in the Purna sub basin. The river Purna flows from the
central part of the district and meets river Godavari in the neighboring district. The river Khelna, and
Girja are other important tributaries of river Purna which flow through the district. The southern part
of the district falls in Godavari sub basin. A very small part of the district located North East of the
district falls in the Tapi basin.
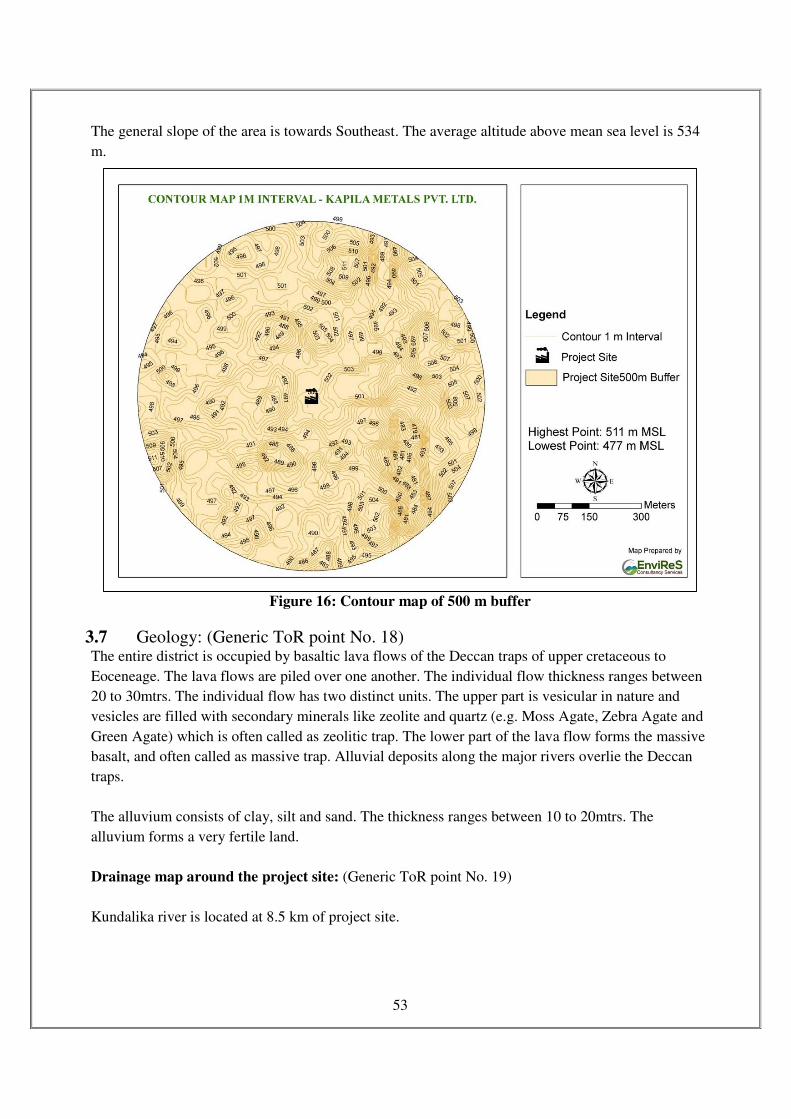
53
The general slope of the area is towards Southeast. The average altitude above mean sea level is 534
m.
Figure 16: Contour map of 500 m buffer
3.7 Geology: (Generic ToR point No. 18) The entire district is occupied by basaltic lava flows of the Deccan traps of upper cretaceous to
Eoceneage. The lava flows are piled over one another. The individual flow thickness ranges between
20 to 30mtrs. The individual flow has two distinct units. The upper part is vesicular in nature and
vesicles are filled with secondary minerals like zeolite and quartz (e.g. Moss Agate, Zebra Agate and
Green Agate) which is often called as zeolitic trap. The lower part of the lava flow forms the massive
basalt, and often called as massive trap. Alluvial deposits along the major rivers overlie the Deccan
traps.
The alluvium consists of clay, silt and sand. The thickness ranges between 10 to 20mtrs. The
alluvium forms a very fertile land.
Drainage map around the project site: (Generic ToR point No. 19)
Kundalika river is located at 8.5 km of project site.
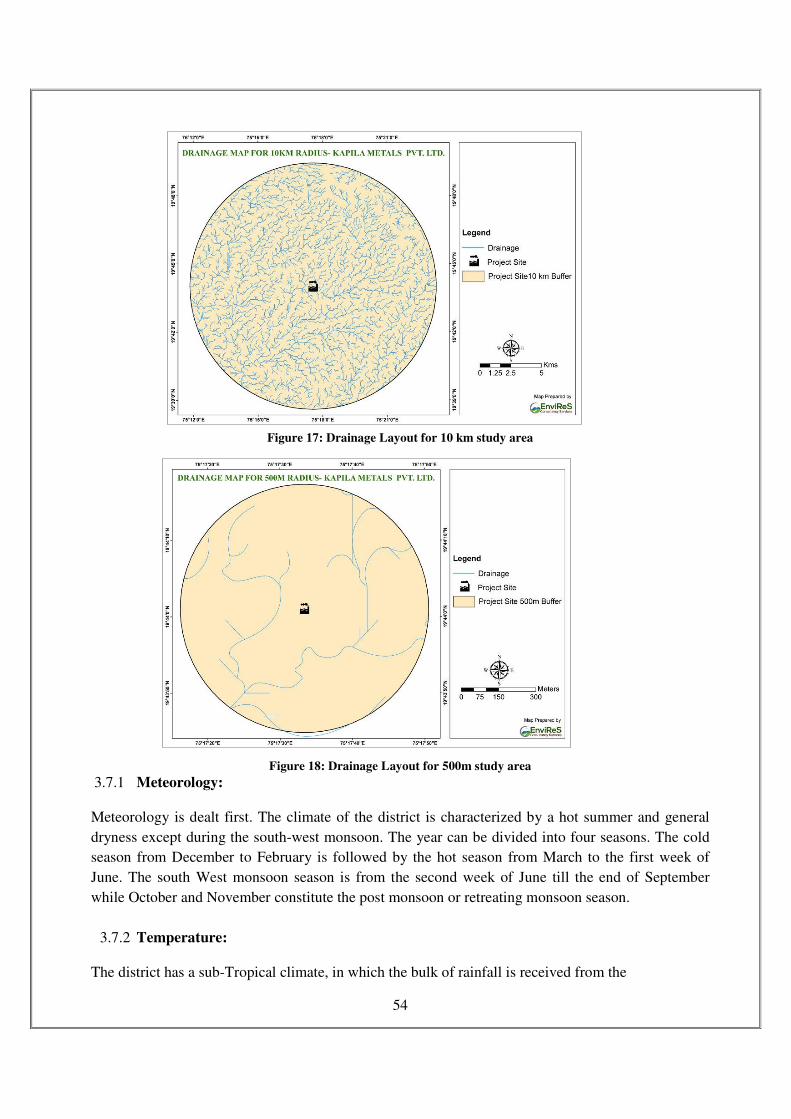
54
Figure 17: Drainage Layout for 10 km study area
Figure 18: Drainage Layout for 500m study area
3.7.1 Meteorology:
Meteorology is dealt first. The climate of the district is characterized by a hot summer and general
dryness except during the south-west monsoon. The year can be divided into four seasons. The cold
season from December to February is followed by the hot season from March to the first week of
June. The south West monsoon season is from the second week of June till the end of September
while October and November constitute the post monsoon or retreating monsoon season.
3.7.2 Temperature:
The district has a sub-Tropical climate, in which the bulk of rainfall is received from the
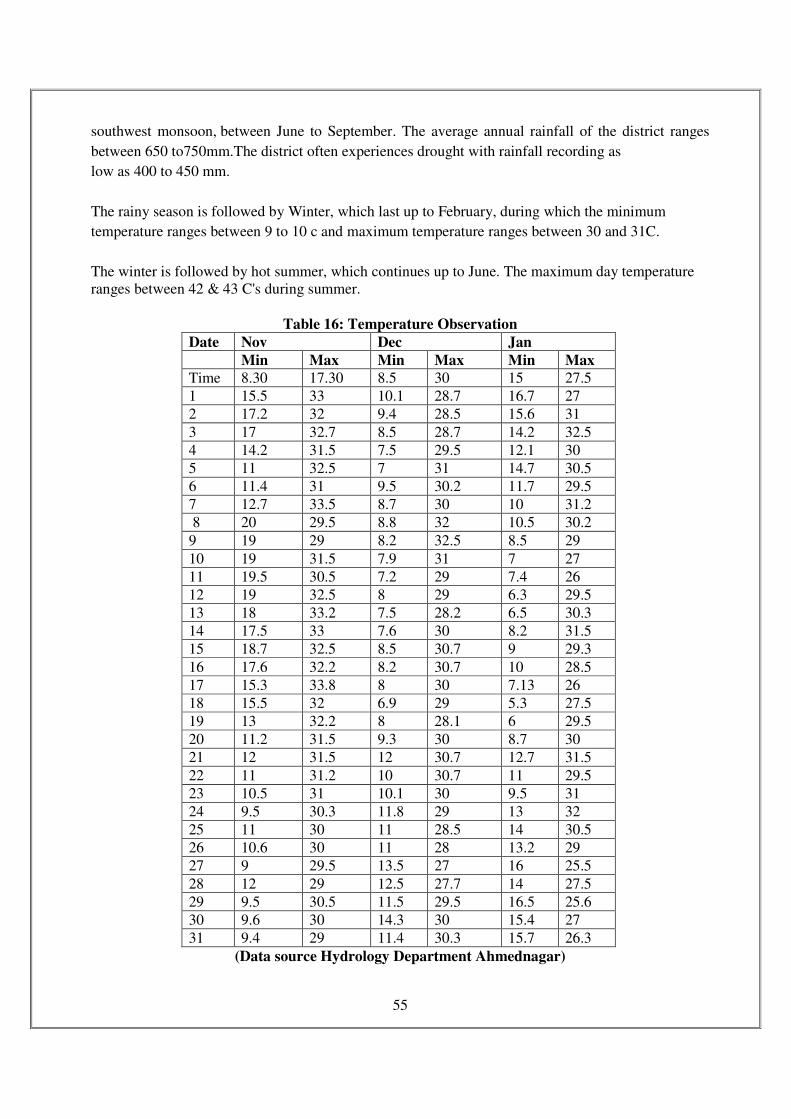
55
southwest monsoon, between June to September. The average annual rainfall of the district ranges
between 650 to750mm.The district often experiences drought with rainfall recording as
low as 400 to 450 mm.
The rainy season is followed by Winter, which last up to February, during which the minimum
temperature ranges between 9 to 10 c and maximum temperature ranges between 30 and 31C.
The winter is followed by hot summer, which continues up to June. The maximum day temperature
ranges between 42 & 43 C's during summer.
Table 16: Temperature Observation
Date Nov Dec Jan
Min Max Min Max Min Max
Time 8.30 17.30 8.5 30 15 27.5
1 15.5 33 10.1 28.7 16.7 27
2 17.2 32 9.4 28.5 15.6 31
3 17 32.7 8.5 28.7 14.2 32.5
4 14.2 31.5 7.5 29.5 12.1 30
5 11 32.5 7 31 14.7 30.5
6 11.4 31 9.5 30.2 11.7 29.5
7 12.7 33.5 8.7 30 10 31.2
8 20 29.5 8.8 32 10.5 30.2
9 19 29 8.2 32.5 8.5 29
10 19 31.5 7.9 31 7 27
11 19.5 30.5 7.2 29 7.4 26
12 19 32.5 8 29 6.3 29.5
13 18 33.2 7.5 28.2 6.5 30.3
14 17.5 33 7.6 30 8.2 31.5
15 18.7 32.5 8.5 30.7 9 29.3
16 17.6 32.2 8.2 30.7 10 28.5
17 15.3 33.8 8 30 7.13 26
18 15.5 32 6.9 29 5.3 27.5
19 13 32.2 8 28.1 6 29.5
20 11.2 31.5 9.3 30 8.7 30
21 12 31.5 12 30.7 12.7 31.5
22 11 31.2 10 30.7 11 29.5
23 10.5 31 10.1 30 9.5 31
24 9.5 30.3 11.8 29 13 32
25 11 30 11 28.5 14 30.5
26 10.6 30 11 28 13.2 29
27 9 29.5 13.5 27 16 25.5
28 12 29 12.5 27.7 14 27.5
29 9.5 30.5 11.5 29.5 16.5 25.6
30 9.6 30 14.3 30 15.4 27
31 9.4 29 11.4 30.3 15.7 26.3
(Data source Hydrology Department Ahmednagar)
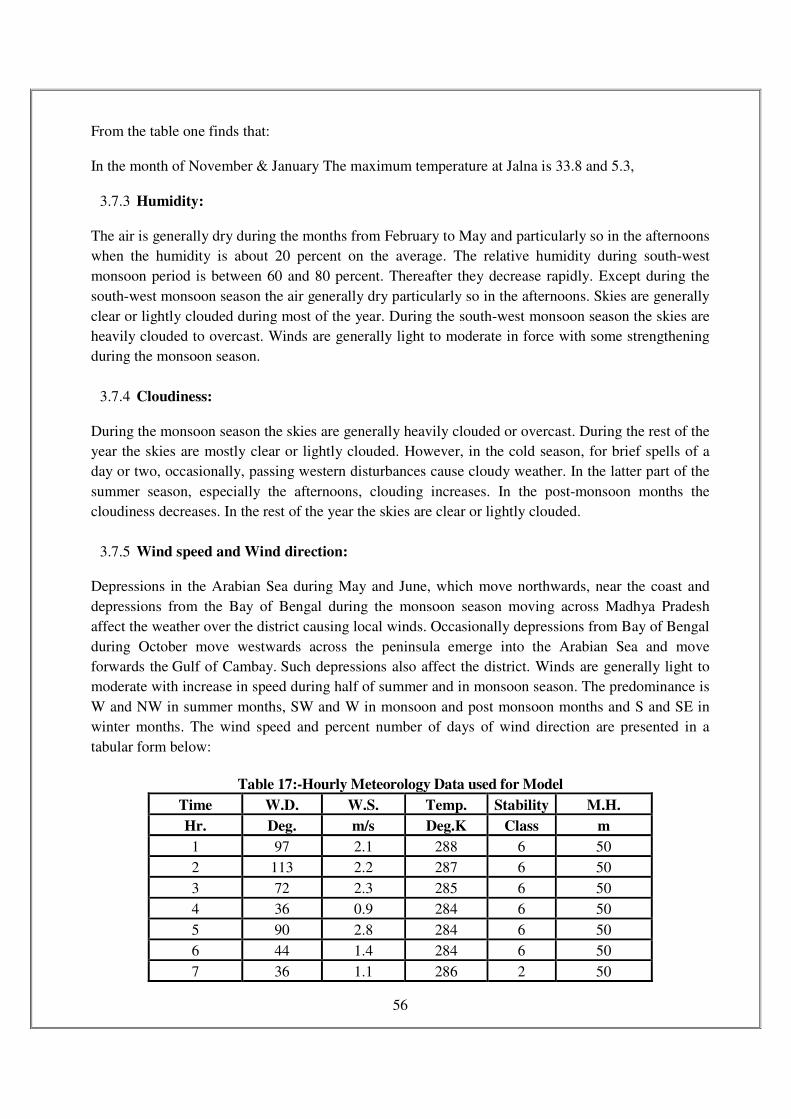
56
From the table one finds that:
In the month of November & January The maximum temperature at Jalna is 33.8 and 5.3,
3.7.3 Humidity:
The air is generally dry during the months from February to May and particularly so in the afternoons
when the humidity is about 20 percent on the average. The relative humidity during south-west
monsoon period is between 60 and 80 percent. Thereafter they decrease rapidly. Except during the
south-west monsoon season the air generally dry particularly so in the afternoons. Skies are generally
clear or lightly clouded during most of the year. During the south-west monsoon season the skies are
heavily clouded to overcast. Winds are generally light to moderate in force with some strengthening
during the monsoon season.
3.7.4 Cloudiness:
During the monsoon season the skies are generally heavily clouded or overcast. During the rest of the
year the skies are mostly clear or lightly clouded. However, in the cold season, for brief spells of a
day or two, occasionally, passing western disturbances cause cloudy weather. In the latter part of the
summer season, especially the afternoons, clouding increases. In the post-monsoon months the
cloudiness decreases. In the rest of the year the skies are clear or lightly clouded.
3.7.5 Wind speed and Wind direction:
Depressions in the Arabian Sea during May and June, which move northwards, near the coast and
depressions from the Bay of Bengal during the monsoon season moving across Madhya Pradesh
affect the weather over the district causing local winds. Occasionally depressions from Bay of Bengal
during October move westwards across the peninsula emerge into the Arabian Sea and move
forwards the Gulf of Cambay. Such depressions also affect the district. Winds are generally light to
moderate with increase in speed during half of summer and in monsoon season. The predominance is
W and NW in summer months, SW and W in monsoon and post monsoon months and S and SE in
winter months. The wind speed and percent number of days of wind direction are presented in a
tabular form below:
Table 17:-Hourly Meteorology Data used for Model
Time W.D. W.S. Temp. Stability M.H.
Hr. Deg. m/s Deg.K Class m
1 97 2.1 288 6 50
2 113 2.2 287 6 50
3 72 2.3 285 6 50
4 36 0.9 284 6 50
5 90 2.8 284 6 50
6 44 1.4 284 6 50
7 36 1.1 286 2 50

57
8 0 0.0 289 2 50
9 49 1.5 292 1 200
10 72 2.4 295 2 500
11 135 4.4 297 2 700
12 120 4.2 298 2 1000
13 130 4.6 299 2 1200
14 90 3.3 300 2 1200
15 113 3.8 301 2 1200
16 94 3.0 300 2 1200
17 113 3.3 299 3 1000
18 61 1.8 296 2 700
19 48 1.4 293 6 600
20 0 0.0 290 6 400
21 25 0.7 288 6 300
22 14 0.3 287 6 200
23 45 1.1 287 6 100
24 11 0.1 287 6 100
3.7.6 Windrows:
Met data collected during December. 2014 to February 2015 has been used for modeling input while
CPCB document PROBES/88/2002-2003 is followed for site-specific mixing heights. Wind speed
and direction is presented as wind rose in Figure-19.
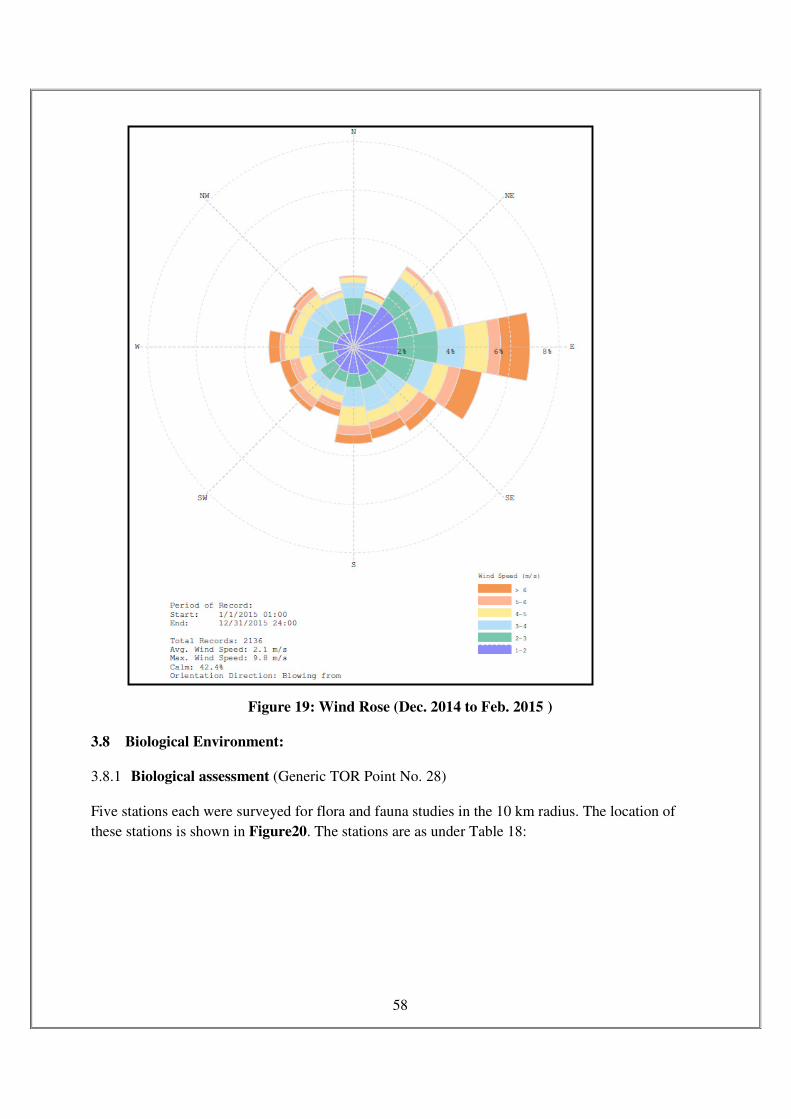
58
Figure 19: Wind Rose (Dec. 2014 to Feb. 2015 )
3.8 Biological Environment:
3.8.1 Biological assessment (Generic TOR Point No. 28)
Five stations each were surveyed for flora and fauna studies in the 10 km radius. The location of
these stations is shown in Figure20. The stations are as under Table 18:
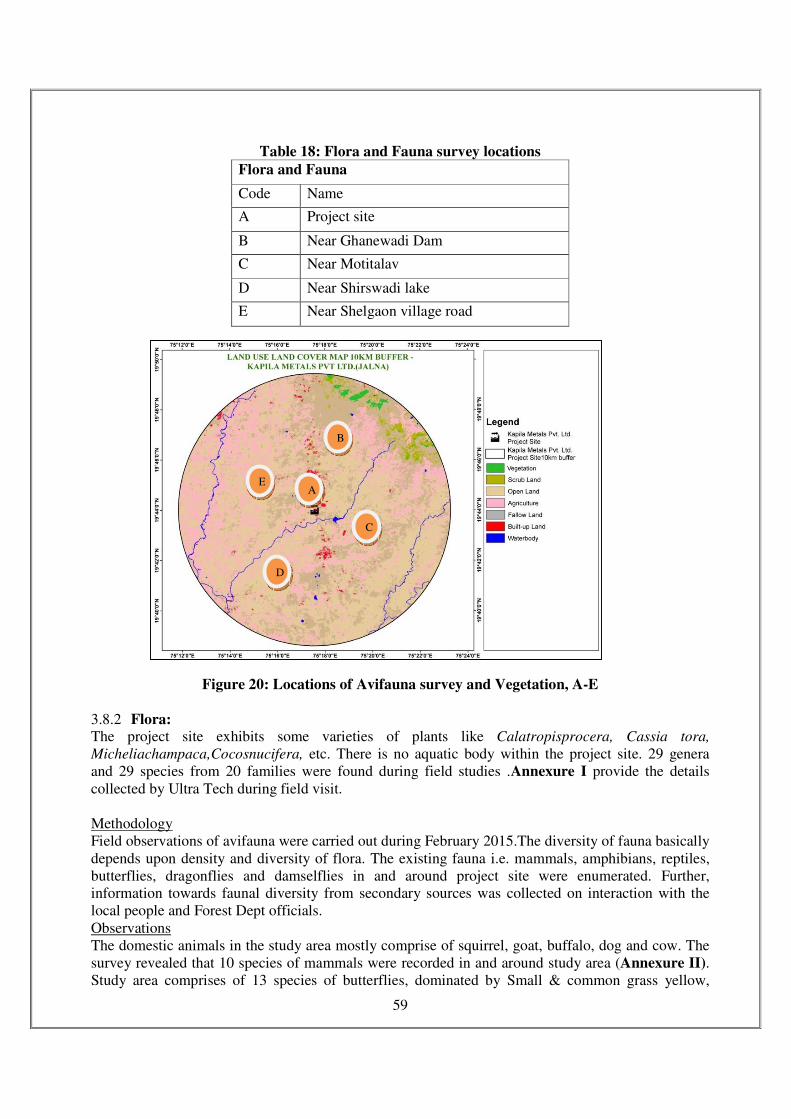
59
Table 18: Flora and Fauna survey locations
Flora and Fauna
Code Name
A Project site
B Near Ghanewadi Dam
C Near Motitalav
D Near Shirswadi lake
E Near Shelgaon village road
Figure 20: Locations of Avifauna survey and Vegetation, A-E
3.8.2 Flora: The project site exhibits some varieties of plants like Calatropisprocera, Cassia tora,
Micheliachampaca,Cocosnucifera, etc. There is no aquatic body within the project site. 29 genera
and 29 species from 20 families were found during field studies .Annexure I provide the details
collected by Ultra Tech during field visit.
Methodology
Field observations of avifauna were carried out during February 2015.The diversity of fauna basically
depends upon density and diversity of flora. The existing fauna i.e. mammals, amphibians, reptiles,
butterflies, dragonflies and damselflies in and around project site were enumerated. Further,
information towards faunal diversity from secondary sources was collected on interaction with the
local people and Forest Dept officials.
Observations
The domestic animals in the study area mostly comprise of squirrel, goat, buffalo, dog and cow. The
survey revealed that 10 species of mammals were recorded in and around study area (Annexure II).
Study area comprises of 13 species of butterflies, dominated by Small & common grass yellow,
A
C
D
B
E
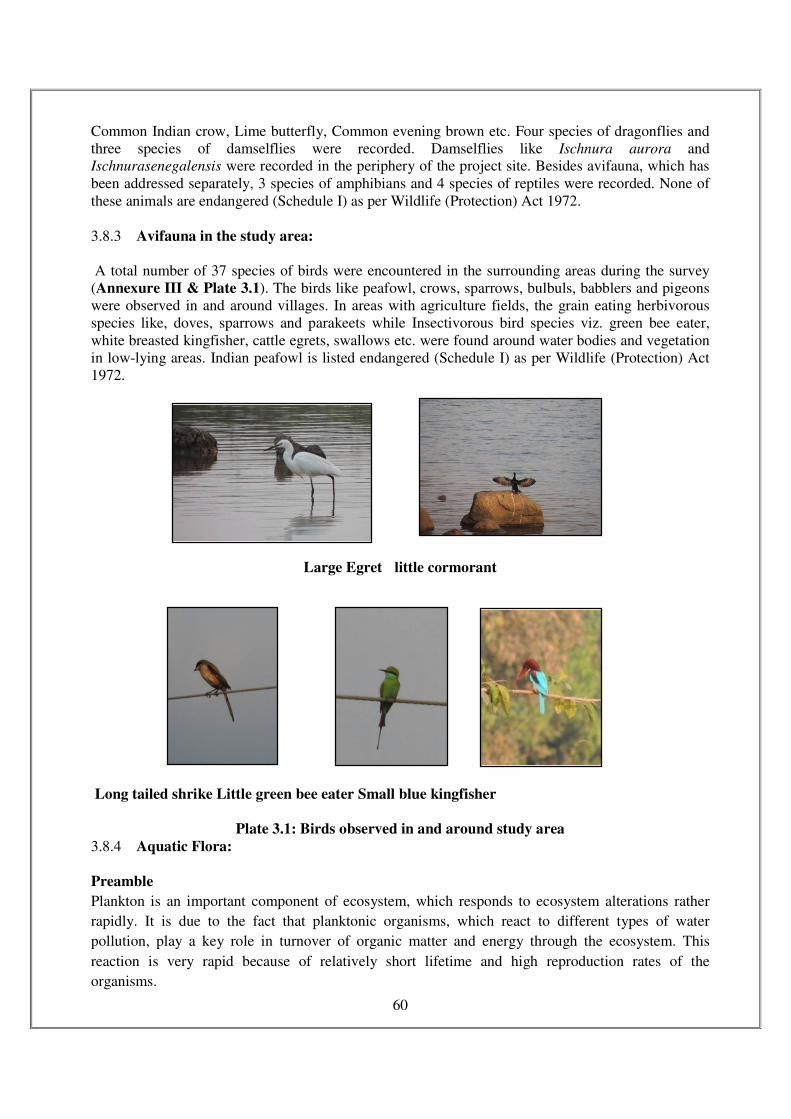
60
Common Indian crow, Lime butterfly, Common evening brown etc. Four species of dragonflies and
three species of damselflies were recorded. Damselflies like Ischnura aurora and
Ischnurasenegalensis were recorded in the periphery of the project site. Besides avifauna, which has
been addressed separately, 3 species of amphibians and 4 species of reptiles were recorded. None of
these animals are endangered (Schedule I) as per Wildlife (Protection) Act 1972.
3.8.3 Avifauna in the study area:
A total number of 37 species of birds were encountered in the surrounding areas during the survey
(Annexure III & Plate 3.1). The birds like peafowl, crows, sparrows, bulbuls, babblers and pigeons
were observed in and around villages. In areas with agriculture fields, the grain eating herbivorous
species like, doves, sparrows and parakeets while Insectivorous bird species viz. green bee eater,
white breasted kingfisher, cattle egrets, swallows etc. were found around water bodies and vegetation
in low-lying areas. Indian peafowl is listed endangered (Schedule I) as per Wildlife (Protection) Act
1972.
Large Egret little cormorant
Long tailed shrike Little green bee eater Small blue kingfisher
Plate 3.1: Birds observed in and around study area
3.8.4 Aquatic Flora:
Preamble
Plankton is an important component of ecosystem, which responds to ecosystem alterations rather
rapidly. It is due to the fact that planktonic organisms, which react to different types of water
pollution, play a key role in turnover of organic matter and energy through the ecosystem. This
reaction is very rapid because of relatively short lifetime and high reproduction rates of the
organisms.
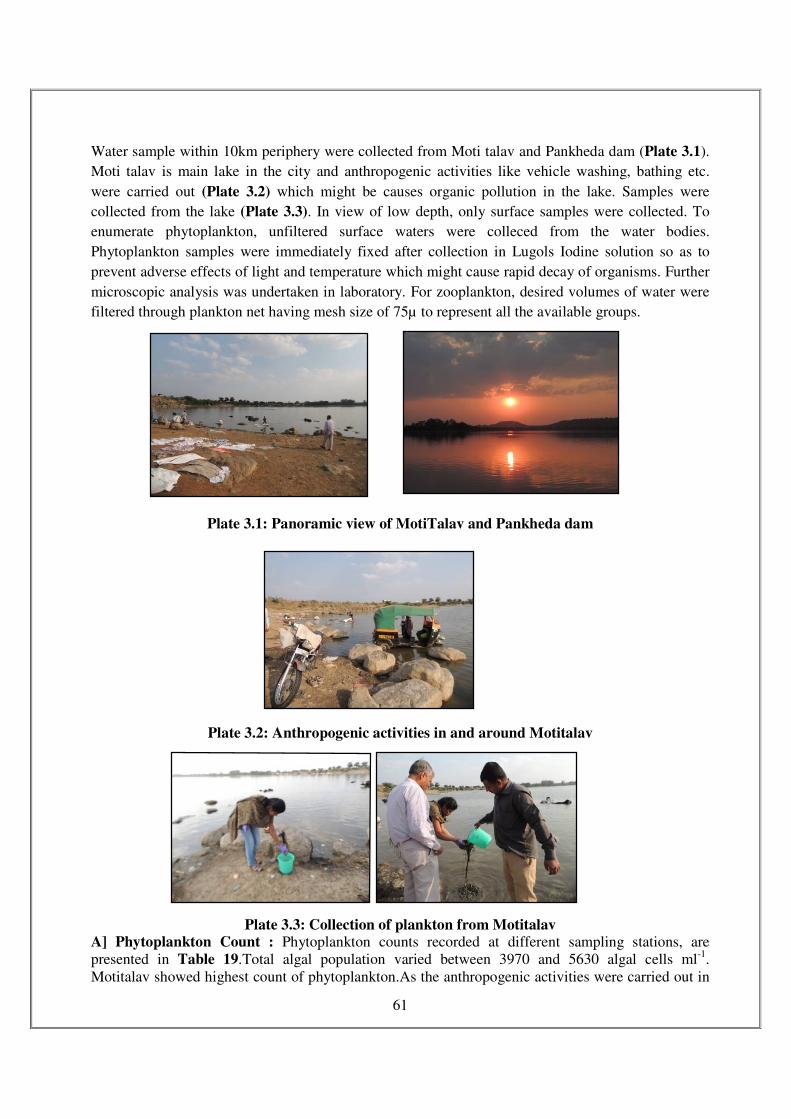
61
Water sample within 10km periphery were collected from Moti talav and Pankheda dam (Plate 3.1).
Moti talav is main lake in the city and anthropogenic activities like vehicle washing, bathing etc.
were carried out (Plate 3.2) which might be causes organic pollution in the lake. Samples were
collected from the lake (Plate 3.3). In view of low depth, only surface samples were collected. To
enumerate phytoplankton, unfiltered surface waters were colleced from the water bodies.
Phytoplankton samples were immediately fixed after collection in Lugols Iodine solution so as to
prevent adverse effects of light and temperature which might cause rapid decay of organisms. Further
microscopic analysis was undertaken in laboratory. For zooplankton, desired volumes of water were
filtered through plankton net having mesh size of 75µ to represent all the available groups.
Plate 3.1: Panoramic view of MotiTalav and Pankheda dam
Plate 3.2: Anthropogenic activities in and around Motitalav
Plate 3.3: Collection of plankton from Motitalav A] Phytoplankton Count : Phytoplankton counts recorded at different sampling stations, are
presented in Table 19.Total algal population varied between 3970 and 5630 algal cells ml-1.
Motitalav showed highest count of phytoplankton.As the anthropogenic activities were carried out in
62
and around the lake might be reason of high plankton count. The phytoplankton population
comprised of 4 major groups, namelyBacillariophyceae, Chlorophyceae, Cyanophyceae and
Cryptophyceae. Bacillariophyceae dominated all the samples indicating good water quality. Besides
diatoms, the most common genera were Fragillaria, Anabaena,Ulothrixetc. The average scores of
PPI varied within the range of 19 - 22, indicating probable organic pollution while the SWI values
varied between 0.96 and 2.23 that suggest low to medium impact of pollution or adverse factor. Solid
waste disposal and surface run off coming out from surrounding areas might be a reason for organic
pollution in the lake.
Table 19: Enumeration of Phytoplankton in Motitalav and Pankheda dam
Ranges of Palmer’s Pollution index (PPI) <15: Indicate absence of organic pollution
15 - <20: Indicate presence of organic pollution
>20: Indicate presence of high organic pollution
Ranges of Shannon Wiener Diversity Index (SWI)
<1: Indicate poor productive water
1-3 Indicate medium productive water
>3 Indicate good productive water
Ranges of Shannon Wiener Diversity Index (SWI)
<1: Indicate poor productive water
1-3 Indicate medium productive water
>3 Indicate good productive water
Table 20: Enumeration of Zooplankton in Motitalav and Pankheda dam
Location Plankton
Count No/m3
% Composition of zooplanktons groups SWI
Rotifera Copepoda Cladocera
MotiTalav
(South East side) 10250 50 30 20 1.20
MotiTalav
( South East side) 9250 40 30 30 1.98
Pankheda dam
(East side) 6750 65 15 20 1.52
Sample
No.
Name of
River
Phyto-
plankton
(No/ml)
Percent Composition of algal groups SWI PPI
Cyano-
phyceae
Chloro-
phyceae
Bacillario-
phyceae
Crypto-
phyceae
MotiTalav
(South East
side)
5630 60 20 10 10 2.23 22
MotiTalav
(South East
side )
4620 50 20 20 10 1.56 20
Pankheda
dam(East
side)
4500 65 20 15 - 0.96 19
Pankheda
dam(West
side)
3970 55 15 20 10 1.69 21
63
Pankheda dam
(West side) 6500 50 20 30 0.96
B] Zooplankton
Zooplankton counts, recorded at different sampling stations, are shown in Table 20 Density of
zooplankton varied between 6500 and 10250 N/m3. A large number of zooplankton, recorded in
Motitalav could be due to the presence of ample amount of phytoplankton in the respective stations.
Rotifera was dominant. The SWI, observed to vary from 0.96 to 1.98 indicated low to medium load
of organic pollution or adverse factors.
3.9 Socio-Economic:
The present section addresses the socio-economic environment of the 10 km radius area for the M/s
Kapila Metals Pvt. Ltd. It includes description of demography, available basic amenities such as
housing, health care services, education, transportation etc.
3.9.1 Jalna District: Basic Information:
Jalna district is approximately situated in central part of Maharashtra. The boundaries of Jalna district
are adjacent to Parbhani & Buldhana on east, Aurangabad on west, Jalgaon on north and Beed on
south. It covers an area of 7,616 sq. km, which is 2.47% of the total state area. Out of the total
geographical area 7616 sq. km. (98.68%) is rural and 34.5 sq. km. (1.32%) is urban.
There are 960 villages in the district with 4 towns. The district has a population of 1,959,046
representing 1.74% of the state population with a population density of 254 persons per sq. km. The
decadal growth rate was 21.46%. The district has a sex ratio of 951 females for 1000 males and a
literacy rate of 71.52%. Table 21 presents these details.
Table 21: Demographic Attributes for Jalna District
1. Area 7616 sq. km.
2. Population 1959 thousand
3. Decadal Growth rate 21.46%
4. Male population 826 thousand
5. Female population 786 thousand
6. Density of population (persons per km2) 254
7. Sex Ratio (females per 1000 males) 951
8. Literacy 71.52%
9. Male literacy 81.53%
10. Female literacy 60.95%
11. Urban Population 19.27%
Source: Provisional Population Totals, Census of India 2011
3.9.2 Database and Methodology:
The data is collected and analysed using secondary sources viz. Census Reports, District Statistical
Abstract etc. The 10 km radius area is known as the Study Area, and it consists of 31 villages, 1 town
spread over the talukas of Badnapur and Jalna in the district. The demographic profile, infrastructure
64
facilities and socio-economic condition is being described under different classifications in the
following section.
3.9.3 Demography
Summary of demographic information with reference to population, household, literacy, community
structure and employment are presented in Table 24. There are 64,863 households in the study area
and the average size of household is 5.28 members per household.
The details regarding the demographic aspect of the study area is taken from Census of India website.
Population size ranges from 221 persons in Pankheda to 5336 in Deomurti village and 285,577 in
Jalna city. Population within the age class 0-6 year accounts for 13.80% of the total population in the
study area.
Table 22: Demographic Characteristics of the Study Area
Name No. of
HH
Total
Population
Male Female Sex
Ratio
Population
(0-6)
Size
of
HH
Total 64863 342760 177167 165593 935 47324 5.28
The demographic characteristics of the study area are depicted in Table 22. Average sex ratio for the
study area is 935 females per 1000 males, which is lower than the sex ratio of the district (937) and
higher than the sex ratio of the state (929). Some villages such as Kharpudi (587), Nidhona (839), and
Antarwala (850) has a very low sex ratio, whereas Tatewadi (1020), Matarewadi (991) and Shelgaon
(972) has higher sex ratio.
According to the 2011 census, the ratio of scheduled caste population in the study area to the total
population is 13.80% and scheduled tribe population is 1.50%. This can be observed in Table 23.
Table 23: SC & ST population and Literacy Status of the study area
Name Total
Population
SC ST Literates % SC % ST Literacy
rate
Total 342760 47300 5146 236763 13.80 1.50 80.14
The average literacy rate is 80.14%, which is considerably higher in male population (86.26%) as
compared to female population (73.63%). The average literacy rate is higher in the urban settlements
of the study area (81.80%), as compared to the rural settlements (71.74%). The literacy rate of
80.14% is higher than district (71.52%) and slightly lower than state (82.34) averages.
3.9.4 Working Population: About 36.29% of the total population is total workers in the study area, engaged as cultivators,
agriculture labours, households industry, others etc (Table 24 ). Of the total workers, nearly 88.36%
are main workers, of which male main workers are (75.35%).
Table 24: Status of working population in the study area
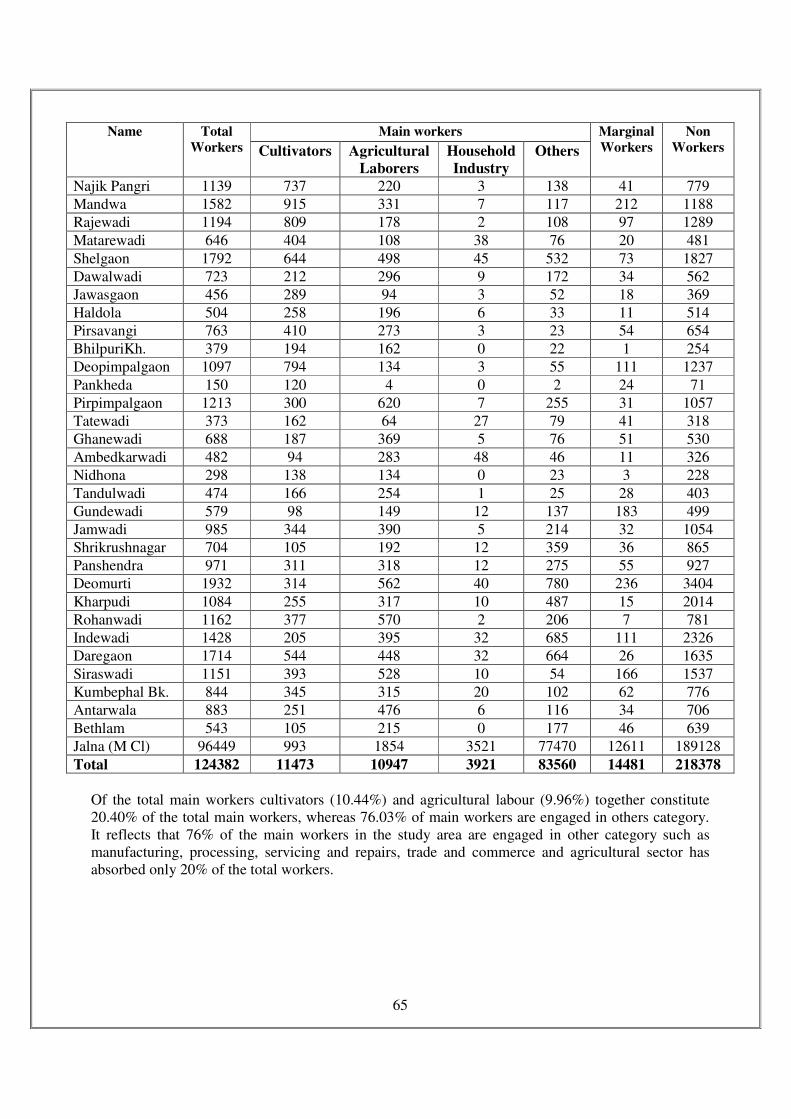
65
Name Total
Workers
Main workers Marginal
Workers
Non
Workers Cultivators Agricultural
Laborers
Household
Industry
Others
Najik Pangri 1139 737 220 3 138 41 779
Mandwa 1582 915 331 7 117 212 1188
Rajewadi 1194 809 178 2 108 97 1289
Matarewadi 646 404 108 38 76 20 481
Shelgaon 1792 644 498 45 532 73 1827
Dawalwadi 723 212 296 9 172 34 562
Jawasgaon 456 289 94 3 52 18 369
Haldola 504 258 196 6 33 11 514
Pirsavangi 763 410 273 3 23 54 654
BhilpuriKh. 379 194 162 0 22 1 254
Deopimpalgaon 1097 794 134 3 55 111 1237
Pankheda 150 120 4 0 2 24 71
Pirpimpalgaon 1213 300 620 7 255 31 1057
Tatewadi 373 162 64 27 79 41 318
Ghanewadi 688 187 369 5 76 51 530
Ambedkarwadi 482 94 283 48 46 11 326
Nidhona 298 138 134 0 23 3 228
Tandulwadi 474 166 254 1 25 28 403
Gundewadi 579 98 149 12 137 183 499
Jamwadi 985 344 390 5 214 32 1054
Shrikrushnagar 704 105 192 12 359 36 865
Panshendra 971 311 318 12 275 55 927
Deomurti 1932 314 562 40 780 236 3404
Kharpudi 1084 255 317 10 487 15 2014
Rohanwadi 1162 377 570 2 206 7 781
Indewadi 1428 205 395 32 685 111 2326
Daregaon 1714 544 448 32 664 26 1635
Siraswadi 1151 393 528 10 54 166 1537
Kumbephal Bk. 844 345 315 20 102 62 776
Antarwala 883 251 476 6 116 34 706
Bethlam 543 105 215 0 177 46 639
Jalna (M Cl) 96449 993 1854 3521 77470 12611 189128
Total 124382 11473 10947 3921 83560 14481 218378
Of the total main workers cultivators (10.44%) and agricultural labour (9.96%) together constitute
20.40% of the total main workers, whereas 76.03% of main workers are engaged in others category.
It reflects that 76% of the main workers in the study area are engaged in other category such as
manufacturing, processing, servicing and repairs, trade and commerce and agricultural sector has
absorbed only 20% of the total workers.
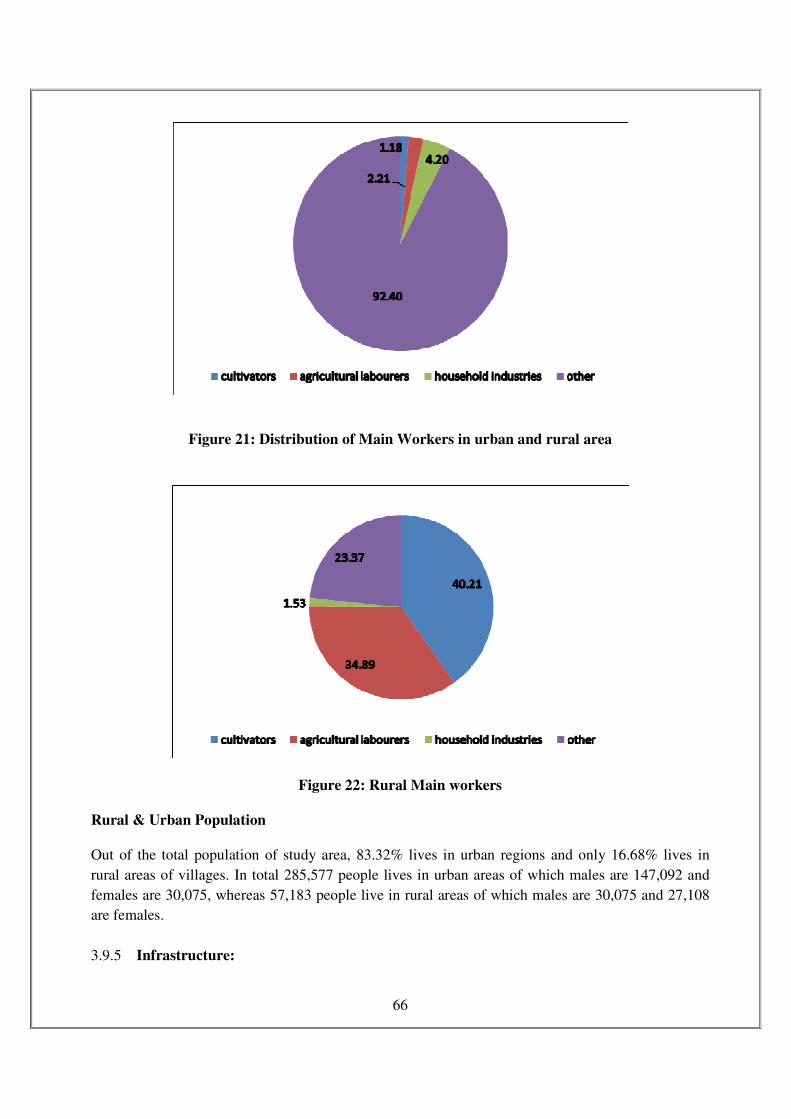
66
Figure 21: Distribution of Main Workers in urban and rural area
Figure 22: Rural Main workers
Rural & Urban Population
Out of the total population of study area, 83.32% lives in urban regions and only 16.68% lives in
rural areas of villages. In total 285,577 people lives in urban areas of which males are 147,092 and
females are 30,075, whereas 57,183 people live in rural areas of which males are 30,075 and 27,108
are females.
3.9.5 Infrastructure:
67
This section analyses the infrastructure facilities like water supply, roads, markets, banks, post
offices, schools and electrification in the study area.
Educational facilities at the minimum level of primary education are available in all the villages of
the study area. There are many villages having more than one primary school. Jalna town in the study
area is renowned educational centre with top colleges and schools providing quality education. After
the completion of school, students for higher education the go to the city like Jalna& Aurangabad.
Medical facilities of one or the other type are available in all the villages in the study area. There are
about 40 primary health centres (PHCs) and 171 sub centres in the district. Public health facilities in
the talukas of the district are majorly located in rural areas, excepting in Jalnataluka where 10 of the
17 facilities are in the urban areas. However, the distribution of private health facilities in the talukas
is disproportionate to the percentage of urban population in them. In Jalnataluka, a whopping 87.67%
of the private health facilities are in urban areas.
Post and Telegraph facility is available in all the villages and towns of study area. Although phone
connections are available in most of the villages but people tend to use mobile phones for
communication.
Drinking water is not a problem as most of the villages and towns have the facility of tap water and
well water. Water is also sourced from bore wells & hand pumps. Although supply is good but there
could be acute shortage in the summer months due to poor rainfall etc.
Road and Rail connectivity is good as all villages and towns have paved roads and connected by
bus services. Jalna is primarily connected with the rest of India by railway and road. Jalna is a station
located on the Kachiguda-Manmad railway. Jalna is connected to major towns of the state by state
highways. Road connectivity is excellent, roads connecting to Aurangabad, Pune, Ahmednagar,
Nagpur, Beed, Mumbai having been upgraded to four-lane highways. A New Nagpur-Aurangabad-
Mumbai highway, passing through Jalna, is being developed. All villages and town (100%) are
enjoying power supply facility for all the purposes.
3.9.6 Historical/Archeological/Forest:
No cultural heritage site (temple, mass bathing site during religious festivals, etc) is located close to
the project site that could be affected during the construction stage.
3.9.7 Industries:
Jalna district is relatively industrially backward as compared to some of the other advanced districts
of Maharashtra. The lack of good quality infrastructural facilities, inadequate local market,
unavailability of skilled labour, immobility of local persons and lack of entrepreneurial environment
are some of the major constraints for the lack of industrialization of the district. There is one large
MIDC Jalna, consisting of large, medium, and small-scale industries. It has large number of steel

68
rolling mills; agro-based units like dal mills and, most significantly, a large number of seed
manufacturing units.
The industries are facing the major problems of frequent power cut-off, water shortage etc. There are
24 large and medium scale industries in Jalna district, out of which 4 are sugar factories.
69
4 CHAPTER - ENVIRONMENTAL IMPACT ASSESSMENT, PREDICTION
AND MITIGATION MEASURES
This chapter describes the identification, assessment and mitigation methods proposed for impacts on
various components viz, air, water, soil, etc. during construction phase and operational phase.
Identification of Impacts The environmental impacts will be identified during Construction and operation phase of the Projects
and these impacts can be categorized as either primary or secondary. Primary impacts are those,
which are due to the project whereas secondary impacts are induced and typically include the
associated investment and changed pattern of social and economic activities by the proposed action.
The impacts have been assessed for the proposed steel project assuming that the pollution due to the
existing activities has already been covered under baseline environmental monitoring and continue to
remain same till the operation of the project.
Impacts and mitigation during Construction phase
The construction of the proposed steel project comprises various activities each of which may have
an impact on some or other environmental parameters. Various impacts during the construction phase
on the environment parameters have been presented below:
Land use The total project area is 11.6 ha consists of ~70% of fallow/waste/open land and ~33% scrub land.
Clearing of trees/shrubs at some locations will be required during construction phase. It is proposed
to develop greenbelt and landscaping (~33%) around plant boundary to improve the aesthetics of the
area. Thus, the overall impact will be beneficial in nature. The land use remains unchanged as it is
identified Industrial area.
Impact on Soil Quality
The soil at the project site predominantly consists of clay. The sub-strata of this area is rocky,
however no blasting is envisaged for either leveling or during foundation since the site is almost plain
with gentle slope and needs very little grading, filling and leveling.
The construction activities will result in loss of topsoil to some extent in the plant area and waste
disposal area. The topsoil requires proper handling like separate stacking so that it can be used for
green belt development. Apart from very localized construction impacts at the plant site, no
significant adverse impact on soil in the surrounding area is anticipated.
Mitigation Measures The following mitigation measures shall be adopted for soil and land environment:
• After completion of the construction phase, the surplus earth shall be utilized to fill up the low
lying areas, the rubble shall be cleared
• The top soil from the excavated areas shall be preserved for re-use for green belt development
during construction phase so that plantation will grow to adequate height by the time of plant
commissioning. Thus, green belt will be effective in containing the fugitive emissions during
operation, if any;
• Species selected in this plantation shall be fast growing and they shall be adaptable to local
conditions. Most of the varieties shall be eco-friendly and help reduce/absorb gases and dust;
70
• Entire plant shall be aesthetically landscaped and as much as feasible natural gradient shall be
maintained;
• There shall be minimum concreting of the top surface so that there is a scope for maximum
ground water recharge during scanty rainfall; and
Impact on Air Quality During construction phase, particulate matter will be the main pollutant, which would be generated
during site development activities and vehicular movement. Further, concentration of NOx and CO
may also slightly increase due to increased vehicular traffic movement. However, the impact on
ambient air quality will be negligible and temporary. As most of the construction equipment will be
mobile, the emissions are likely to be fugitive. The dust generated will also be fugitive in nature and
will be controlled by sprinkling of water.
The impacts will be localized in nature and the areas outside the project boundary are not likely to
have any major adverse impact with respect to ambient air quality.
Air Pollution Control Measures
There will be no major leveling operations required as the plant site is having a gradual gradient.
Hence, no significant excavation of the area except for the purpose of foundations is envisaged.
Regular water sprinkling will be done to minimize fugitive PM generation.
Ambient levels of SO2 and NOX are likewise expected to increase marginally due to operation of
construction machinery such as bulldozers, pay loaders, trucks, etc. However, these levels are
expected to be insignificant since these machines will be operated intermittently. It shall be ensured
that construction vehicles are properly maintained with valid PUC. Additional recommendations
include the following
Water Resources and Quality
Impact on Water Resources and Quality
The water requirement during construction phase is estimated at about 30 m3/d and will be sourced
through mainly tankers.
The wastewater generation during the construction period will be from the temporary sanitary units
provided for the workers. This waste will be treated in septic tanks and discharged into soak pits.
Hence, there will not be any impact on the water regime due to discharge of sanitary treated
wastewater.
Water Quality Mitigation Measures
The earth work (cutting and filling) will be avoided during rainy season and will be completed during
summer season. Also development of green belt in and around plant will be taken up during the
monsoon season. All in-plant roads will be paved.
Soil binding and fast growing vegetation will be grown within the plant premises to arrest the soil
erosion. Toilets with septic tanks will be constructed at site for workers.
Noise Environment Impact due to Noise Levels
The major sources of noise during the construction phase will be from 70-80 trucks and construction
equipment. The operation of equipment will generate noise ranging between 85-90 dB (A) at 1 m
from the source. However, it will attenuate in a short distance. Moreover, it will be during daytime
only and for short construction phase only.
Noise Levels Mitigation
71
Equipment will be maintained appropriately to keep the proper working condition. Wherever
possible, equipment will be provided with silencers and mufflers. Construction activities will be
restricted to day time only. Further, workers working in high noise areas will be provided with
necessary protective devices e.g. ear plugs ear-muffs, etc.
Ecology The proposed project area is mostly barren/fallow land. Therefore, no major loss of biomass is
envisaged during construction phase.
A good green belt and landscaping will be developed within the plant premises. Greenbelt as per
CPCB guidelines will be developed.
Impacts and Mitigation Measures during Operational Phase
The proposed project operation will involve production of sponge iron 100 TPD, billets/TMT bars
1000 TPD and 50 MW power. For the purpose of impact assessment during the operational phase, the
following components have been considered although some of these will be overlapping:
• Land use;
• Topography and climate;
• Air quality;
• Water resources and quality;
• Traffic and Noise levels;
• Solid waste management
Land use The total project area of 11.6 ha is mostly waste land in MIDC area. Thus present land use will
remain unchanged. The existing trees/shrubs/plantation will be retained to the extent possible in line
with the plant design. Further, suitable greenbelt development will also be implemented.
Topography The proposed project site is fairly flat with gentle slope and few trees/shrubs present at some places.
There will not be much cutting and filling required for the proposed project. The additional structures
such as industrial building, stacks, power plant, ETP, etc. will be constructed. The general appearance
of the site will change into an industrial set up couple of tall structures like stacks.
Air Quality
The iron and steel industry from its various processes emits of pollutants into the air. The main
source of air pollution during construction phase will be due to from the Project is:
1. Emission from SL/RN Kiln namely particulate matter
2. Fumes and dust from Induction furnace during charging and
3. PM, SO2 from CPP
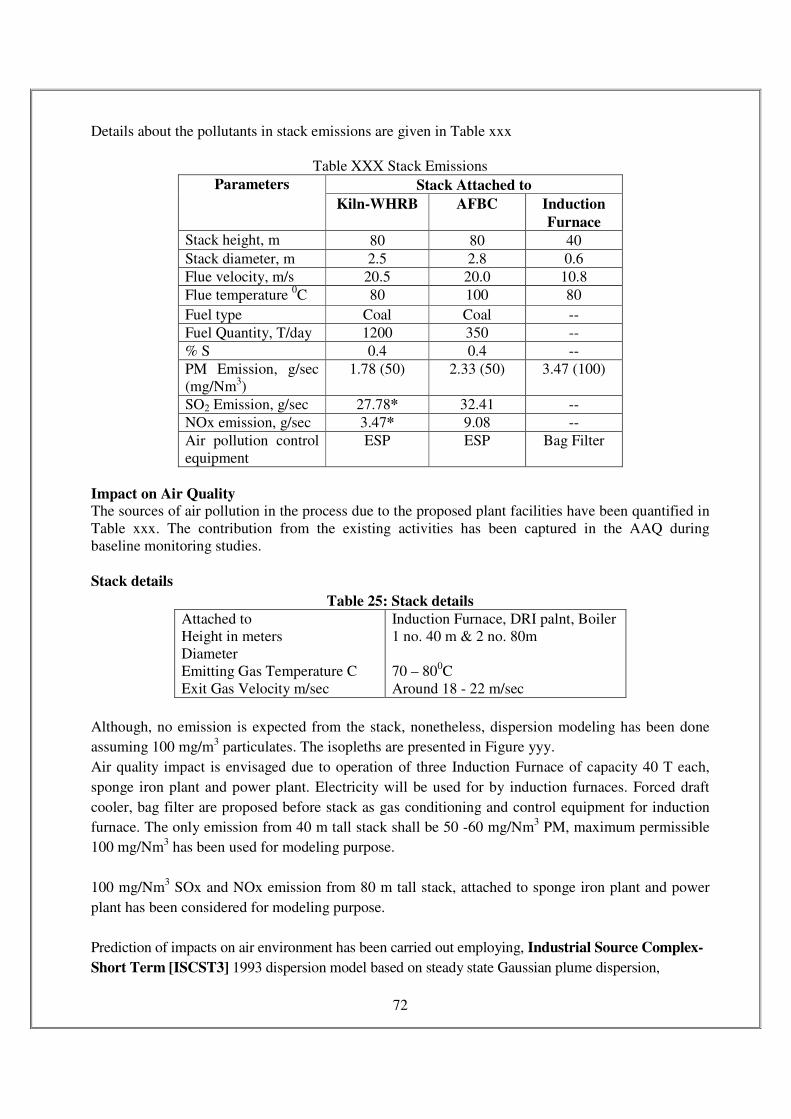
72
Details about the pollutants in stack emissions are given in Table xxx
Table XXX Stack Emissions
Parameters Stack Attached to
Kiln-WHRB AFBC Induction
Furnace
Stack height, m 80 80 40
Stack diameter, m 2.5 2.8 0.6
Flue velocity, m/s 20.5 20.0 10.8
Flue temperature 0C 80 100 80
Fuel type Coal Coal --
Fuel Quantity, T/day 1200 350 --
% S 0.4 0.4 --
PM Emission, g/sec
(mg/Nm3)
1.78 (50) 2.33 (50) 3.47 (100)
SO2 Emission, g/sec 27.78* 32.41 --
NOx emission, g/sec 3.47* 9.08 --
Air pollution control
equipment
ESP ESP Bag Filter
Impact on Air Quality The sources of air pollution in the process due to the proposed plant facilities have been quantified in
Table xxx. The contribution from the existing activities has been captured in the AAQ during
baseline monitoring studies.
Stack details
Table 25: Stack details
Attached to
Height in meters
Diameter
Emitting Gas Temperature C
Exit Gas Velocity m/sec
Induction Furnace, DRI palnt, Boiler
1 no. 40 m & 2 no. 80m
70 – 800C
Around 18 - 22 m/sec
Although, no emission is expected from the stack, nonetheless, dispersion modeling has been done
assuming 100 mg/m3 particulates. The isopleths are presented in Figure yyy.
Air quality impact is envisaged due to operation of three Induction Furnace of capacity 40 T each,
sponge iron plant and power plant. Electricity will be used for by induction furnaces. Forced draft
cooler, bag filter are proposed before stack as gas conditioning and control equipment for induction
furnace. The only emission from 40 m tall stack shall be 50 -60 mg/Nm3 PM, maximum permissible
100 mg/Nm3 has been used for modeling purpose.
100 mg/Nm3 SOx and NOx emission from 80 m tall stack, attached to sponge iron plant and power
plant has been considered for modeling purpose.
Prediction of impacts on air environment has been carried out employing, Industrial Source Complex-
Short Term [ISCST3] 1993 dispersion model based on steady state Gaussian plume dispersion,
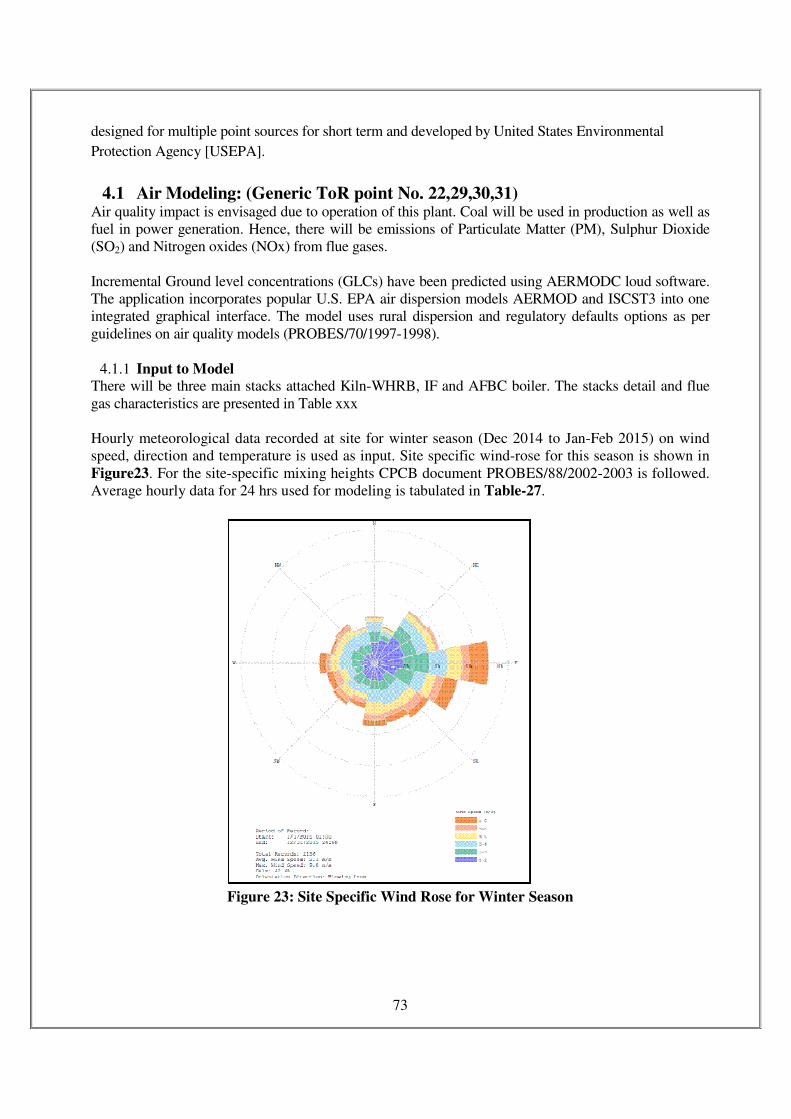
73
designed for multiple point sources for short term and developed by United States Environmental
Protection Agency [USEPA].
4.1 Air Modeling: (Generic ToR point No. 22,29,30,31) Air quality impact is envisaged due to operation of this plant. Coal will be used in production as well as
fuel in power generation. Hence, there will be emissions of Particulate Matter (PM), Sulphur Dioxide
(SO2) and Nitrogen oxides (NOx) from flue gases.
Incremental Ground level concentrations (GLCs) have been predicted using AERMODC loud software.
The application incorporates popular U.S. EPA air dispersion models AERMOD and ISCST3 into one
integrated graphical interface. The model uses rural dispersion and regulatory defaults options as per
guidelines on air quality models (PROBES/70/1997-1998).
4.1.1 Input to Model There will be three main stacks attached Kiln-WHRB, IF and AFBC boiler. The stacks detail and flue
gas characteristics are presented in Table xxx
Hourly meteorological data recorded at site for winter season (Dec 2014 to Jan-Feb 2015) on wind
speed, direction and temperature is used as input. Site specific wind-rose for this season is shown in
Figure23. For the site-specific mixing heights CPCB document PROBES/88/2002-2003 is followed.
Average hourly data for 24 hrs used for modeling is tabulated in Table-27.
Figure 23: Site Specific Wind Rose for Winter Season
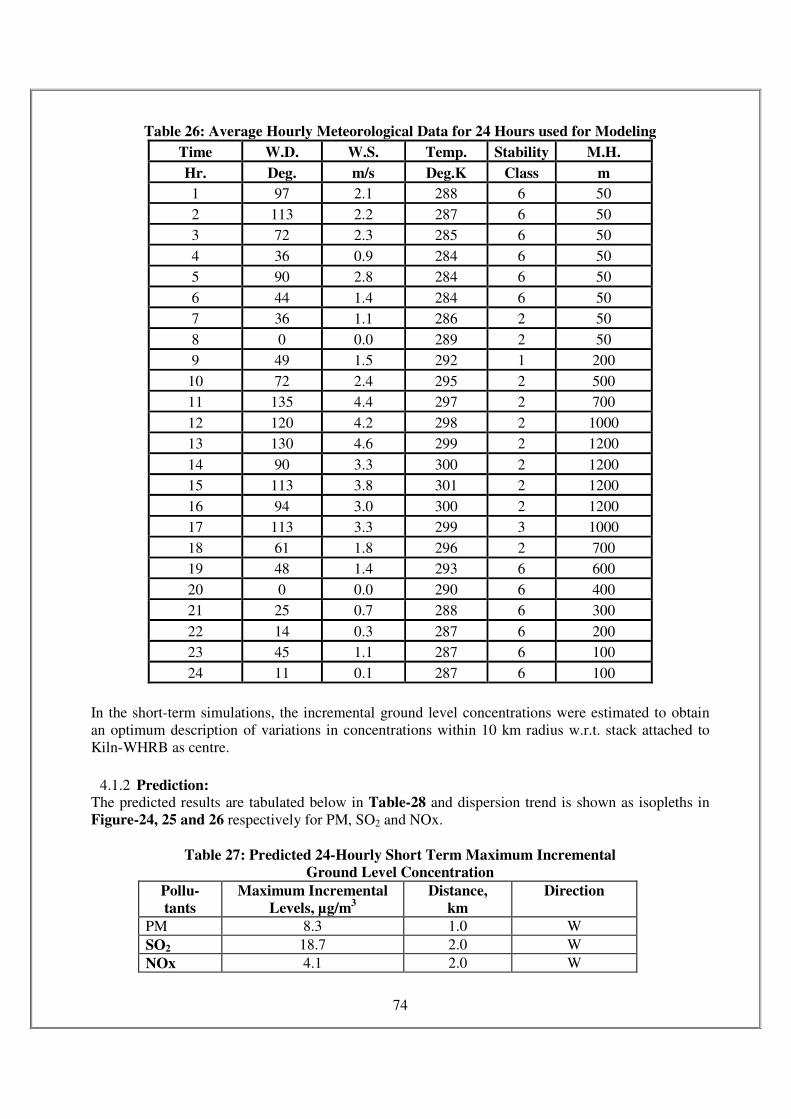
74
Table 26: Average Hourly Meteorological Data for 24 Hours used for Modeling
Time W.D. W.S. Temp. Stability M.H.
Hr. Deg. m/s Deg.K Class m
1 97 2.1 288 6 50
2 113 2.2 287 6 50
3 72 2.3 285 6 50
4 36 0.9 284 6 50
5 90 2.8 284 6 50
6 44 1.4 284 6 50
7 36 1.1 286 2 50
8 0 0.0 289 2 50
9 49 1.5 292 1 200
10 72 2.4 295 2 500
11 135 4.4 297 2 700
12 120 4.2 298 2 1000
13 130 4.6 299 2 1200
14 90 3.3 300 2 1200
15 113 3.8 301 2 1200
16 94 3.0 300 2 1200
17 113 3.3 299 3 1000
18 61 1.8 296 2 700
19 48 1.4 293 6 600
20 0 0.0 290 6 400
21 25 0.7 288 6 300
22 14 0.3 287 6 200
23 45 1.1 287 6 100
24 11 0.1 287 6 100
In the short-term simulations, the incremental ground level concentrations were estimated to obtain
an optimum description of variations in concentrations within 10 km radius w.r.t. stack attached to
Kiln-WHRB as centre.
4.1.2 Prediction: The predicted results are tabulated below in Table-28 and dispersion trend is shown as isopleths in
Figure-24, 25 and 26 respectively for PM, SO2 and NOx.
Table 27: Predicted 24-Hourly Short Term Maximum Incremental
Ground Level Concentration
Pollu-
tants
Maximum Incremental
Levels, µg/m3
Distance,
km
Direction
PM 8.3 1.0 W
SO2 18.7 2.0 W
NOx 4.1 2.0 W
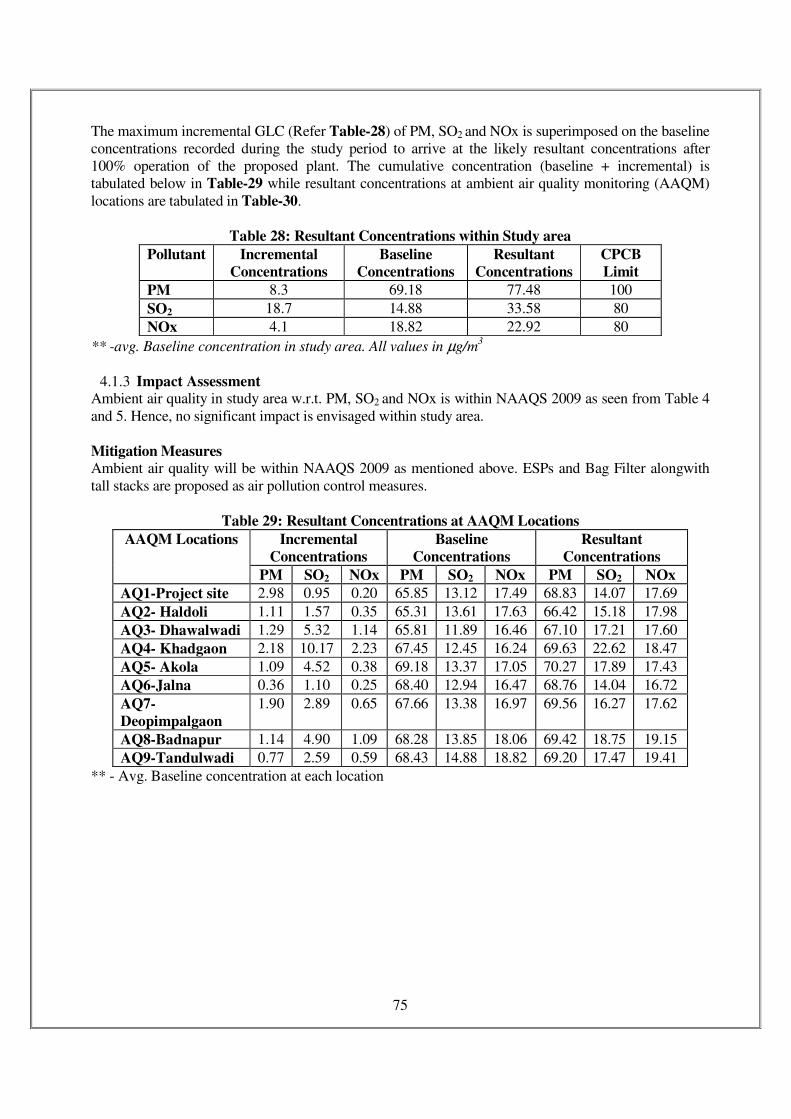
75
The maximum incremental GLC (Refer Table-28) of PM, SO2 and NOx is superimposed on the baseline
concentrations recorded during the study period to arrive at the likely resultant concentrations after
100% operation of the proposed plant. The cumulative concentration (baseline + incremental) is
tabulated below in Table-29 while resultant concentrations at ambient air quality monitoring (AAQM)
locations are tabulated in Table-30.
Table 28: Resultant Concentrations within Study area
Pollutant Incremental
Concentrations
Baseline
Concentrations
Resultant
Concentrations
CPCB
Limit
PM 8.3 69.18 77.48 100
SO2 18.7 14.88 33.58 80
NOx 4.1 18.82 22.92 80
** -avg. Baseline concentration in study area. All values in µg/m3
4.1.3 Impact Assessment Ambient air quality in study area w.r.t. PM, SO2 and NOx is within NAAQS 2009 as seen from Table 4
and 5. Hence, no significant impact is envisaged within study area.
Mitigation Measures Ambient air quality will be within NAAQS 2009 as mentioned above. ESPs and Bag Filter alongwith
tall stacks are proposed as air pollution control measures.
Table 29: Resultant Concentrations at AAQM Locations
AAQM Locations Incremental
Concentrations
Baseline
Concentrations
Resultant
Concentrations
PM SO2 NOx PM SO2 NOx PM SO2 NOx
AQ1-Project site 2.98 0.95 0.20 65.85 13.12 17.49 68.83 14.07 17.69
AQ2- Haldoli 1.11 1.57 0.35 65.31 13.61 17.63 66.42 15.18 17.98
AQ3- Dhawalwadi 1.29 5.32 1.14 65.81 11.89 16.46 67.10 17.21 17.60
AQ4- Khadgaon 2.18 10.17 2.23 67.45 12.45 16.24 69.63 22.62 18.47
AQ5- Akola 1.09 4.52 0.38 69.18 13.37 17.05 70.27 17.89 17.43
AQ6-Jalna 0.36 1.10 0.25 68.40 12.94 16.47 68.76 14.04 16.72
AQ7-
Deopimpalgaon
1.90 2.89 0.65 67.66 13.38 16.97 69.56 16.27 17.62
AQ8-Badnapur 1.14 4.90 1.09 68.28 13.85 18.06 69.42 18.75 19.15
AQ9-Tandulwadi 0.77 2.59 0.59 68.43 14.88 18.82 69.20 17.47 19.41
** - Avg. Baseline concentration at each location
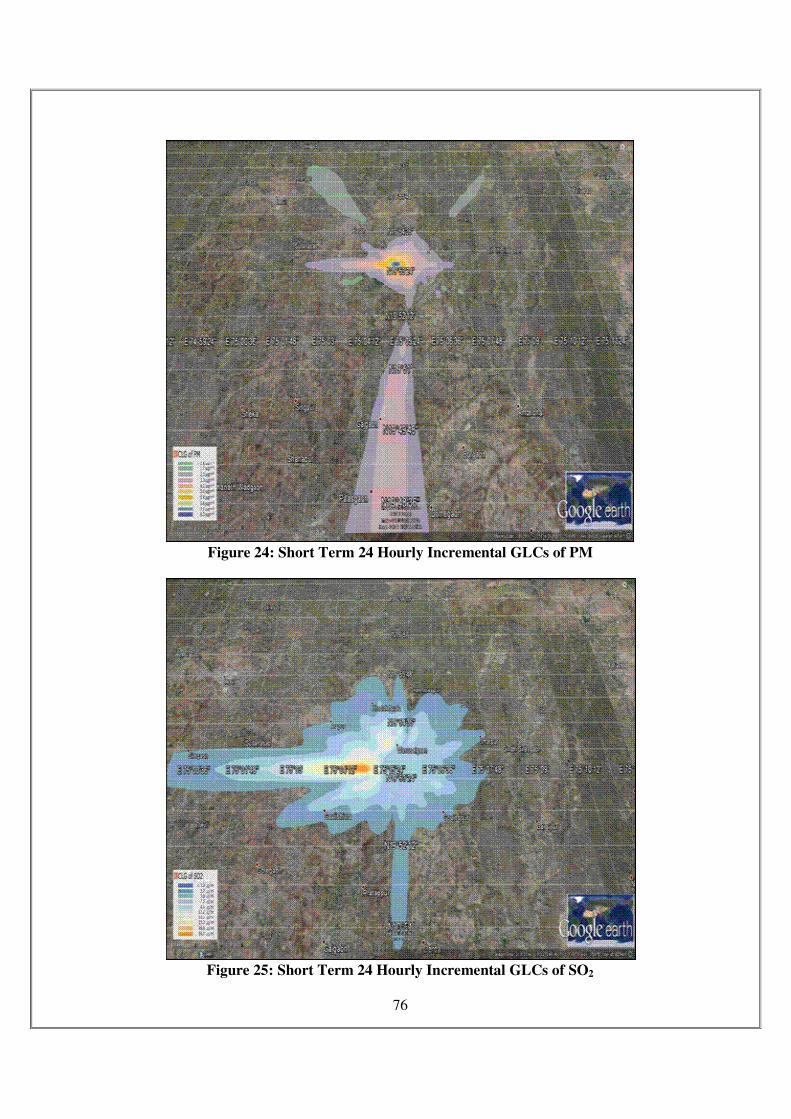
76
Figure 24: Short Term 24 Hourly Incremental GLCs of PM
Figure 25: Short Term 24 Hourly Incremental GLCs of SO2
77
Figure 26: Short Term 24 Hourly Incremental GLCs of NOx
Stack height Calculation based on PM emissions:
Stack Height for 2 x 500 TPD DRI Kilns:-
Coal Consumption (Indian coal) : 1200 TPD (Common For 2x500 TPD Kiln)
Sulphur content in : 0.5 % (max. by mass)
SO2 emission : 1200 x 1000 x 0.5 x 2/2400: 500 Kg/hr
Stack Height H, : 14 (Q)0.3
: 14 (500)0.3 = 73.37 m
Considered Stack height : 80 m
Stack Height for FBC Boiler for 24 MW Power Plant:-
Coal Consumption (Indian coal) : 576 TPD
Sulphur content in : 0.5 % (max. by mass)
SO2 emission : 576 x 1000 x 0.5 x 2/2400: 240 Kg/hr
Stack Height H : 14 (Q)0.3
: 14 (240)0.3
= 58.87 m
Considered Stack height : 80 m
Stack Height for 3X40MT Induction Furnace:-
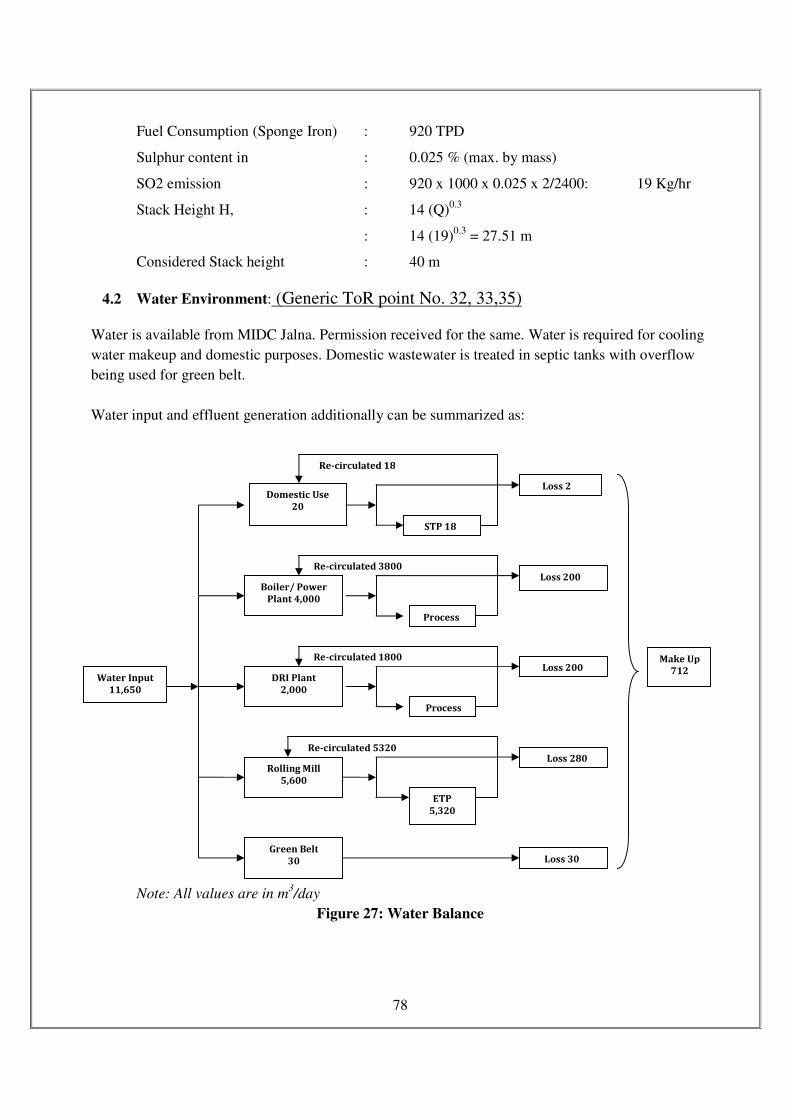
78
Fuel Consumption (Sponge Iron) : 920 TPD
Sulphur content in : 0.025 % (max. by mass)
SO2 emission : 920 x 1000 x 0.025 x 2/2400: 19 Kg/hr
Stack Height H, : 14 (Q)0.3
: 14 (19)0.3
= 27.51 m
Considered Stack height : 40 m
4.2 Water Environment: (Generic ToR point No. 32, 33,35)
Water is available from MIDC Jalna. Permission received for the same. Water is required for cooling
water makeup and domestic purposes. Domestic wastewater is treated in septic tanks with overflow
being used for green belt.
Water input and effluent generation additionally can be summarized as:
Note: All values are in m3/day
Figure 27: Water Balance
Water Input
11,650
Domestic Use
20
Loss 2
STP 18
Re-circulated 18
Boiler/ Power
Plant 4,000
Loss 200
Process
DRI Plant
2,000
Loss 200
Process
Rolling Mill
5,600
Loss 280
ETP
5,320
Green Belt
30 Loss 30
Re-circulated 3800
Re-circulated 1800
Re-circulated 5320
Make Up
712
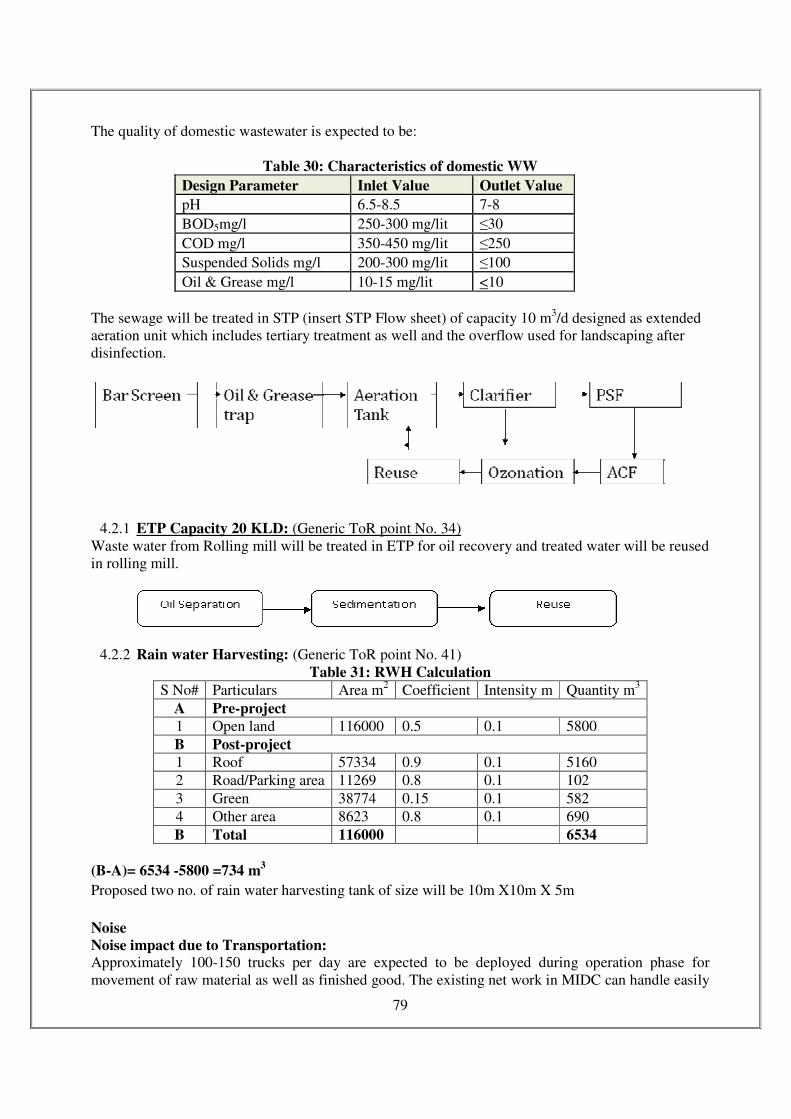
79
The quality of domestic wastewater is expected to be:
Table 30: Characteristics of domestic WW
Design Parameter Inlet Value Outlet Value
pH 6.5-8.5 7-8
BOD5mg/l 250-300 mg/lit ≤30
COD mg/l 350-450 mg/lit ≤250
Suspended Solids mg/l 200-300 mg/lit ≤100
Oil & Grease mg/l 10-15 mg/lit <10
The sewage will be treated in STP (insert STP Flow sheet) of capacity 10 m3/d designed as extended
aeration unit which includes tertiary treatment as well and the overflow used for landscaping after
disinfection.
4.2.1 ETP Capacity 20 KLD: (Generic ToR point No. 34)
Waste water from Rolling mill will be treated in ETP for oil recovery and treated water will be reused
in rolling mill.
4.2.2 Rain water Harvesting: (Generic ToR point No. 41)
Table 31: RWH Calculation
S No# Particulars Area m2 Coefficient Intensity m Quantity m
3
A Pre-project
1 Open land 116000 0.5 0.1 5800
B Post-project
1 Roof 57334 0.9 0.1 5160
2 Road/Parking area 11269 0.8 0.1 102
3 Green 38774 0.15 0.1 582
4 Other area 8623 0.8 0.1 690
B Total 116000 6534
(B-A)= 6534 -5800 =734 m3
Proposed two no. of rain water harvesting tank of size will be 10m X10m X 5m
Noise
Noise impact due to Transportation: Approximately 100-150 trucks per day are expected to be deployed during operation phase for
movement of raw material as well as finished good. The existing net work in MIDC can handle easily
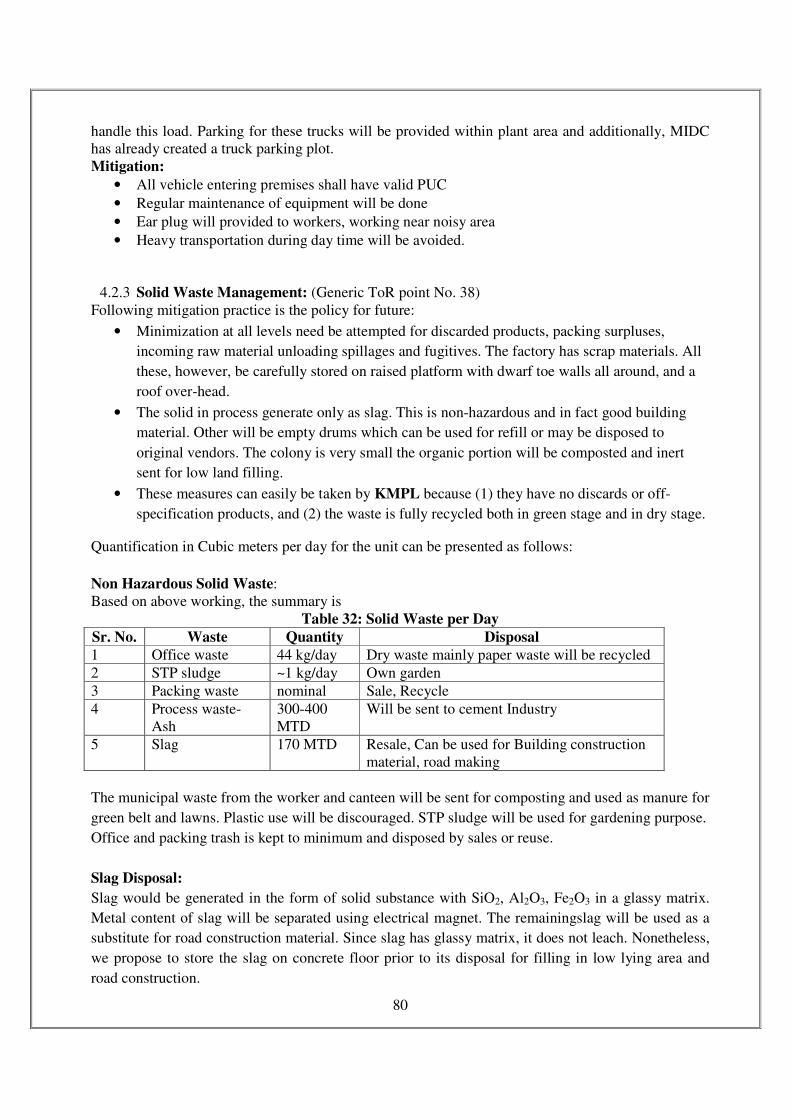
80
handle this load. Parking for these trucks will be provided within plant area and additionally, MIDC
has already created a truck parking plot.
Mitigation:
• All vehicle entering premises shall have valid PUC
• Regular maintenance of equipment will be done
• Ear plug will provided to workers, working near noisy area
• Heavy transportation during day time will be avoided.
4.2.3 Solid Waste Management: (Generic ToR point No. 38)
Following mitigation practice is the policy for future:
• Minimization at all levels need be attempted for discarded products, packing surpluses,
incoming raw material unloading spillages and fugitives. The factory has scrap materials. All
these, however, be carefully stored on raised platform with dwarf toe walls all around, and a
roof over-head.
• The solid in process generate only as slag. This is non-hazardous and in fact good building
material. Other will be empty drums which can be used for refill or may be disposed to
original vendors. The colony is very small the organic portion will be composted and inert
sent for low land filling.
• These measures can easily be taken by KMPL because (1) they have no discards or off-
specification products, and (2) the waste is fully recycled both in green stage and in dry stage.
Quantification in Cubic meters per day for the unit can be presented as follows:
Non Hazardous Solid Waste:
Based on above working, the summary is
Table 32: Solid Waste per Day
Sr. No. Waste Quantity Disposal
1 Office waste 44 kg/day Dry waste mainly paper waste will be recycled
2 STP sludge ~1 kg/day Own garden
3 Packing waste nominal Sale, Recycle
4 Process waste-
Ash
300-400
MTD
Will be sent to cement Industry
5 Slag 170 MTD Resale, Can be used for Building construction
material, road making
The municipal waste from the worker and canteen will be sent for composting and used as manure for
green belt and lawns. Plastic use will be discouraged. STP sludge will be used for gardening purpose.
Office and packing trash is kept to minimum and disposed by sales or reuse.
Slag Disposal:
Slag would be generated in the form of solid substance with SiO2, Al2O3, Fe2O3 in a glassy matrix.
Metal content of slag will be separated using electrical magnet. The remainingslag will be used as a
substitute for road construction material. Since slag has glassy matrix, it does not leach. Nonetheless,
we propose to store the slag on concrete floor prior to its disposal for filling in low lying area and
road construction.
81
Ash Disposal: (Generic ToR point No. 39)
Coal consumption 1550 MT/Day
Char + Dolochar 420 MT/Day
Iron ore Pellet 1450 MT/Day
Ash generation 300-400 MT/Day
Days of storage 2 days
Storage required 800 MTD
No. of Silos 2 Nos
Capacity of each silo 100 MT
Following points will be considered while designing of ash silos.
1. Ash silos of 100 mt of net ash capacity, 2 nos, will be provided.
2. The silo will have conical bottom with adequate slope for easy discharge of ash.
3. The bottom outlet elevation will be such that the truck should be able to load ash from the
bottom.
4. The material of construction of Silos will be RCC.
5. Silos will be provided with dust suppression system to avoid any release of dust from the top.
6. Pneumatic bulk conveying system will be installed.
The ash produced from the boiler to be given brick manufacturers
4.3 Green belt: (Generic ToR point No. 40)
Objective:
To provide a measure of air pollution mitigation, fugitive dust control, shed for men, cooler
atmosphere, camouflage the land-use, aesthetics of the region, absorption of green-house gas,
utilization of NPK of the wastewater after treatment. 38774 m2 area is provided as green area with
4975 numbers of trees.
Methodology
Design of Plantation will be such as:
No interference for future activities
Locally grown species with large canopy
Be nearer to source of water and supervision.
Capability of securing maximum survival rate with an aim of 100%
Selection of species will be done by detailed considerations:
A large variety of species selected to have bio-diversity
Species that will grow rapidly under local dominant stress of soil salinity, high wind, water needs,
sustainability in dry months
Sections will be at least four for greening drive:
Three row curtain on periphery
Avenue trees near approach road and internal roads
Ornamental trees in the garden
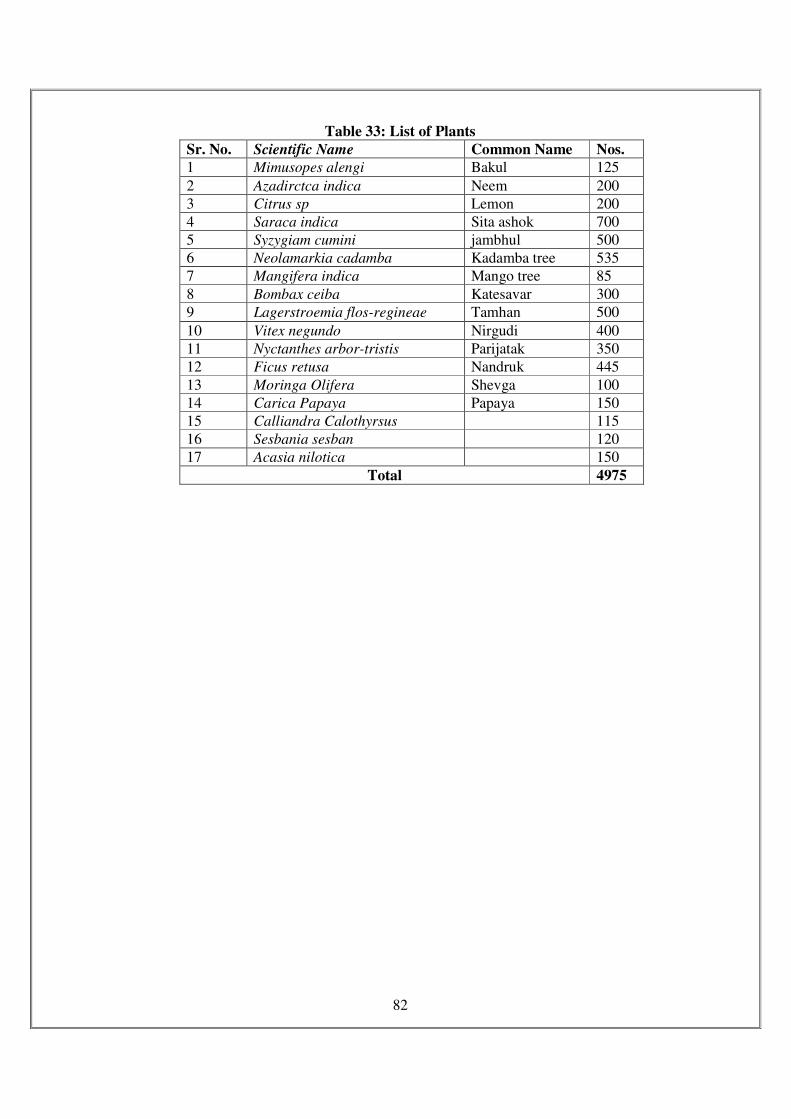
82
Table 33: List of Plants
Sr. No. Scientific Name Common Name Nos.
1 Mimusopes alengi Bakul 125
2 Azadirctca indica Neem 200
3 Citrus sp Lemon 200
4 Saraca indica Sita ashok 700
5 Syzygiam cumini jambhul 500
6 Neolamarkia cadamba Kadamba tree 535
7 Mangifera indica Mango tree 85
8 Bombax ceiba Katesavar 300
9 Lagerstroemia flos-regineae Tamhan 500
10 Vitex negundo Nirgudi 400
11 Nyctanthes arbor-tristis Parijatak 350
12 Ficus retusa Nandruk 445
13 Moringa Olifera Shevga 100
14 Carica Papaya Papaya 150
15 Calliandra Calothyrsus 115
16 Sesbania sesban 120
17 Acasia nilotica 150
Total 4975
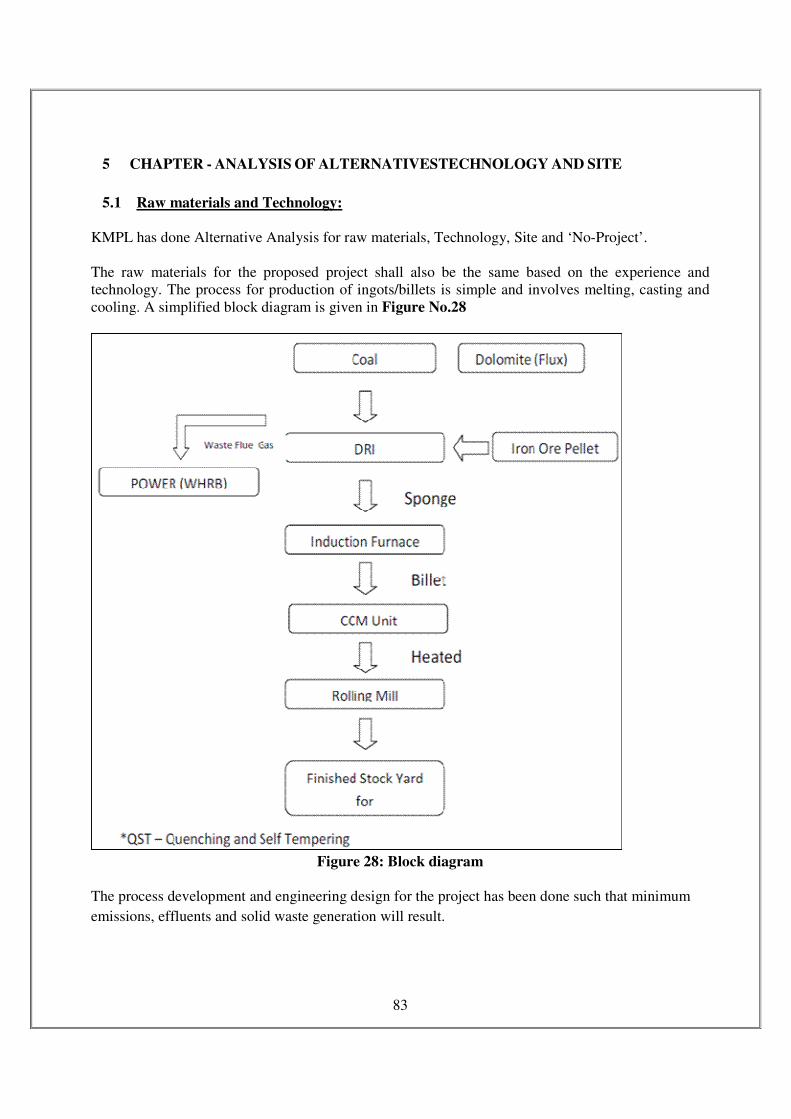
83
5 CHAPTER - ANALYSIS OF ALTERNATIVESTECHNOLOGY AND SITE
5.1 Raw materials and Technology:
KMPL has done Alternative Analysis for raw materials, Technology, Site and ‘No-Project’.
The raw materials for the proposed project shall also be the same based on the experience and
technology. The process for production of ingots/billets is simple and involves melting, casting and
cooling. A simplified block diagram is given in Figure No.28
Figure 28: Block diagram
The process development and engineering design for the project has been done such that minimum
emissions, effluents and solid waste generation will result.
84
5.2 Site Alternatives:
No other site has been examined as the existing MIDC plot has sufficient land for the installation of
additional capacity. This will also help proponents to optimize the use of existing facilities.
It may also be noted that other industrial units are located on all sides of this plot, no habitation exists
nearby. There are no sensitive receptors in the vicinity.
5.3 ‘NO-PROJECT’ Option:
The district statistical Census report and Gazetteer of the District states that the socio-economic
conditions in this district are very poor. To improve the status, industrialization will be a big boost. In
this background, KMPL has proposed this Project to produce quality steel to meet the market
demand.
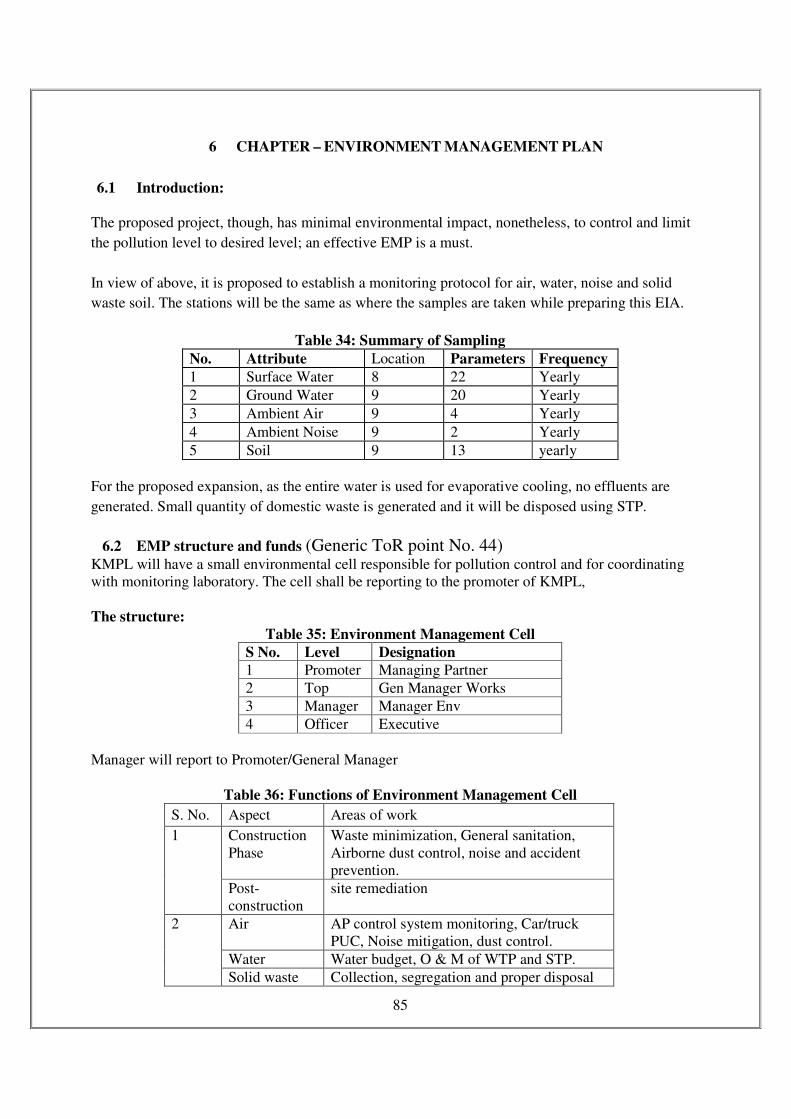
85
6 CHAPTER – ENVIRONMENT MANAGEMENT PLAN
6.1 Introduction:
The proposed project, though, has minimal environmental impact, nonetheless, to control and limit
the pollution level to desired level; an effective EMP is a must.
In view of above, it is proposed to establish a monitoring protocol for air, water, noise and solid
waste soil. The stations will be the same as where the samples are taken while preparing this EIA.
Table 34: Summary of Sampling
No. Attribute Location Parameters Frequency
1 Surface Water 8 22 Yearly
2 Ground Water 9 20 Yearly
3 Ambient Air 9 4 Yearly
4 Ambient Noise 9 2 Yearly
5 Soil 9 13 yearly
For the proposed expansion, as the entire water is used for evaporative cooling, no effluents are
generated. Small quantity of domestic waste is generated and it will be disposed using STP.
6.2 EMP structure and funds (Generic ToR point No. 44) KMPL will have a small environmental cell responsible for pollution control and for coordinating
with monitoring laboratory. The cell shall be reporting to the promoter of KMPL,
The structure:
Table 35: Environment Management Cell
S No. Level Designation
1 Promoter Managing Partner
2 Top Gen Manager Works
3 Manager Manager Env
4 Officer Executive
Manager will report to Promoter/General Manager
Table 36: Functions of Environment Management Cell
S. No. Aspect Areas of work
1 Construction
Phase
Waste minimization, General sanitation,
Airborne dust control, noise and accident
prevention.
Post-
construction
site remediation
2 Air AP control system monitoring, Car/truck
PUC, Noise mitigation, dust control.
Water Water budget, O & M of WTP and STP.
Solid waste Collection, segregation and proper disposal
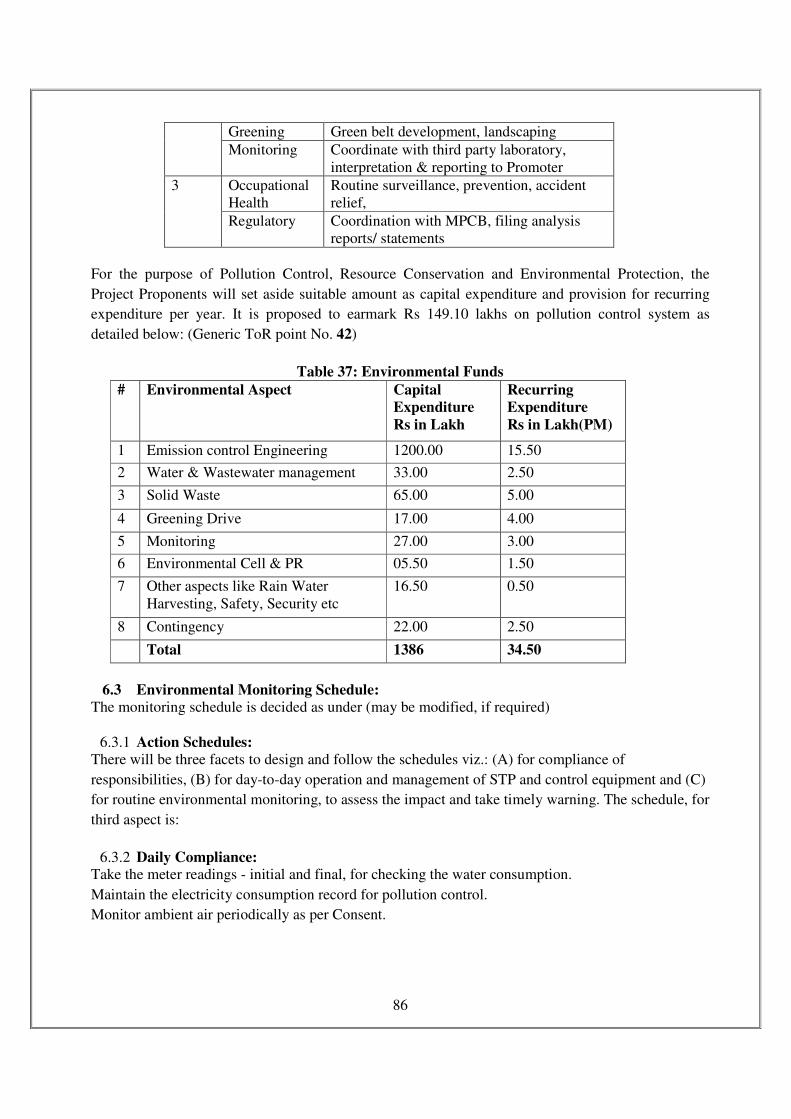
86
Greening Green belt development, landscaping
Monitoring Coordinate with third party laboratory,
interpretation & reporting to Promoter
3 Occupational
Health
Routine surveillance, prevention, accident
relief,
Regulatory Coordination with MPCB, filing analysis
reports/ statements
For the purpose of Pollution Control, Resource Conservation and Environmental Protection, the
Project Proponents will set aside suitable amount as capital expenditure and provision for recurring
expenditure per year. It is proposed to earmark Rs 149.10 lakhs on pollution control system as
detailed below: (Generic ToR point No. 42)
Table 37: Environmental Funds
# Environmental Aspect Capital
Expenditure
Rs in Lakh
Recurring
Expenditure
Rs in Lakh(PM)
1 Emission control Engineering 1200.00 15.50
2 Water & Wastewater management 33.00 2.50
3 Solid Waste 65.00 5.00
4 Greening Drive 17.00 4.00
5 Monitoring 27.00 3.00
6 Environmental Cell & PR 05.50 1.50
7 Other aspects like Rain Water
Harvesting, Safety, Security etc
16.50 0.50
8 Contingency 22.00 2.50
Total 1386 34.50
6.3 Environmental Monitoring Schedule:
The monitoring schedule is decided as under (may be modified, if required)
6.3.1 Action Schedules:
There will be three facets to design and follow the schedules viz.: (A) for compliance of
responsibilities, (B) for day-to-day operation and management of STP and control equipment and (C)
for routine environmental monitoring, to assess the impact and take timely warning. The schedule, for
third aspect is:
6.3.2 Daily Compliance: Take the meter readings - initial and final, for checking the water consumption.
Maintain the electricity consumption record for pollution control.
Monitor ambient air periodically as per Consent.
87
6.3.3 Monthly Compliance:
Monitor the emission sources through the competent authority and submit the analysis reports to the
board.
Monitor ambient/work zone noise levels & ensure conformance to standards.
6.3.4 Quarterly Compliance:
Monitor the ambient air quality at upwind and downwind locations of the factory.
Review the Water Reuse performance.
6.3.5 Yearly Compliance:
Carryout “Environmental Audit Statement” of various environmental aspects, reviews the
environmental policies with the help of experts and make the up gradation /changes accordingly.
Submit the “Environmental Statement” to the State Pollution Control Board in Form V under Rule 14
of the Environment (Protection) Second Amendment Rules 1992 of the Environment (Protection)
Act, 1986.
Renew the Consent to Operate under the Water and Air Acts.
File the Cess returns to the State PCB under the Water (Prevention and Control of Pollution) Cess
Act, 1977.
Renew the Hazardous Waste Authorization under sub-rule 3 of the Hazardous Waste (Management
and Handling) Rules, 1989.
88
7 CHAPTER - ADDITIONAL STUDIES
7.1 Public consultation:
This is a proposal for expanding an established Engineering industry of Small Size which is in a
notified Government MIDC Industrial Estate, which on adjunct industrial area. This is mainly for one
standard product of mild steel in form of billets and ingots but improving the process. The Proponents
are M/s Kapila Metal Pvt. Ltd. presently at Jalna, Dist. Jalna, Maharashtra and running. However,
in order to ascertain the concern of the local persons, who have plausible stake in the environmental
impact of this project, the Proponents thought it fit to interview some people as sample survey basis.
These interviews were oral and informal. This was not to meet any statutory requirement or a
mechanical formality. Proponent really wanted to know as to whether this project is a welcome
addition in the minds of surrounding people. They never wanted to force their presence.
The interviews generally brought out the following points –
• The workings of existing steel units of other proponents are working well to give benefit to
the local people.
• The payment of materials and wages here will be satisfactory, as also the weighment
• There is a constant rapport, open corridors for discussion and transparency in transactions.
• No odour or noise nuisance is felt.
• Sons of soil are employed and benefited.
• Establishing new venture to convert waste into wealth is a step in right direction for the small
suppliers.
• It is however, necessary to see that no water pollution and odour nuisance is created by the
unit, for which the proposed arrangement appears to be satisfactory.
• The MIDC neighboring industrial units, local people and Proponents are generally
comfortable with each other.
7.2 Risk assessment:
The Environmental risks are inherent in operation of any industry, or any human activity for that
matter. Any system failure can lead to disaster.
Steel manufacturing is a simple three step process, as seen earlier. However Risk is posed by (1) Dust
in various operational steps and (2) Fuel, which here is in the form of power only.
Dust is generated in many steps from raw material handling, transfer, heating, cooling, transporting
out and waste treatment. In order to reduce this risk, steps like capturing the same, conveying through
ducts, and controlling by Fly Ash Arrestors are attempted. Conveying by smooth internal roads,
watering the roads, regular and quick sweeping and monitoring the efforts, are the minimum actions
to be taken.
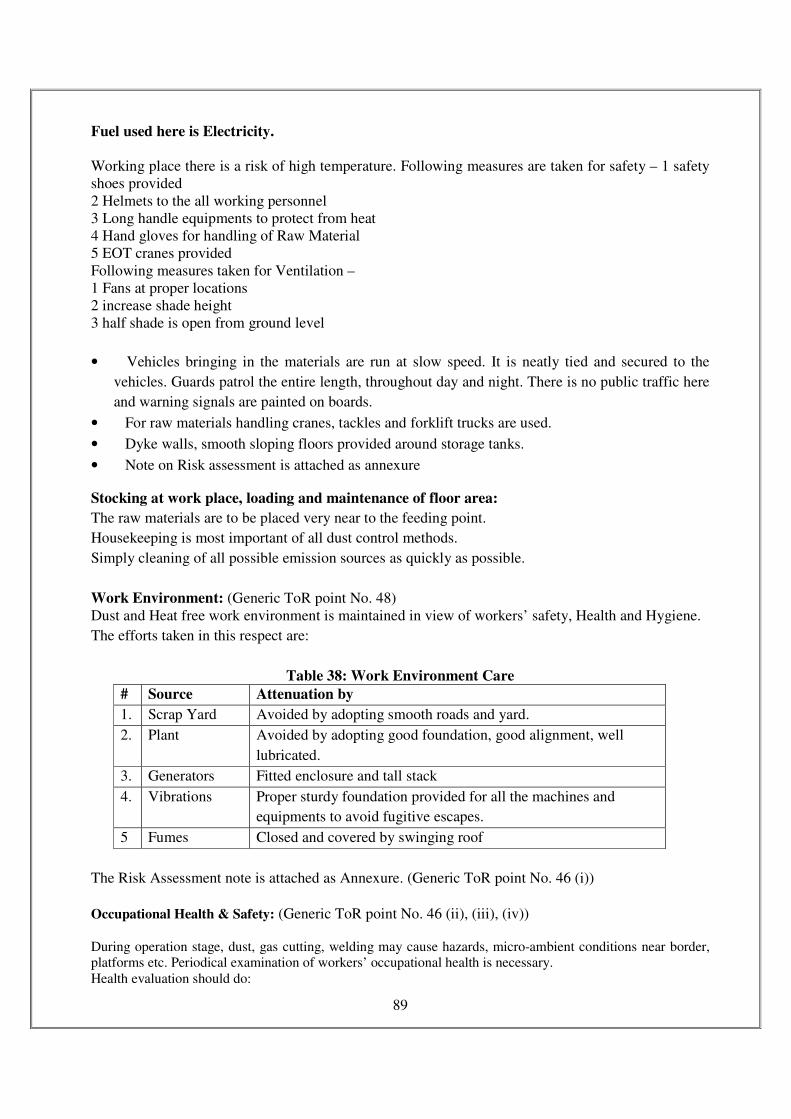
89
Fuel used here is Electricity.
Working place there is a risk of high temperature. Following measures are taken for safety – 1 safety
shoes provided
2 Helmets to the all working personnel
3 Long handle equipments to protect from heat
4 Hand gloves for handling of Raw Material
5 EOT cranes provided
Following measures taken for Ventilation –
1 Fans at proper locations
2 increase shade height
3 half shade is open from ground level
• Vehicles bringing in the materials are run at slow speed. It is neatly tied and secured to the
vehicles. Guards patrol the entire length, throughout day and night. There is no public traffic here
and warning signals are painted on boards.
• For raw materials handling cranes, tackles and forklift trucks are used.
• Dyke walls, smooth sloping floors provided around storage tanks.
• Note on Risk assessment is attached as annexure
Stocking at work place, loading and maintenance of floor area:
The raw materials are to be placed very near to the feeding point.
Housekeeping is most important of all dust control methods.
Simply cleaning of all possible emission sources as quickly as possible.
Work Environment: (Generic ToR point No. 48)
Dust and Heat free work environment is maintained in view of workers’ safety, Health and Hygiene.
The efforts taken in this respect are:
Table 38: Work Environment Care
# Source Attenuation by
1. Scrap Yard Avoided by adopting smooth roads and yard.
2. Plant Avoided by adopting good foundation, good alignment, well
lubricated.
3. Generators Fitted enclosure and tall stack
4. Vibrations Proper sturdy foundation provided for all the machines and
equipments to avoid fugitive escapes.
5 Fumes Closed and covered by swinging roof
The Risk Assessment note is attached as Annexure. (Generic ToR point No. 46 (i))
Occupational Health & Safety: (Generic ToR point No. 46 (ii), (iii), (iv))
During operation stage, dust, gas cutting, welding may cause hazards, micro-ambient conditions near border,
platforms etc. Periodical examination of workers’ occupational health is necessary.
Health evaluation should do:
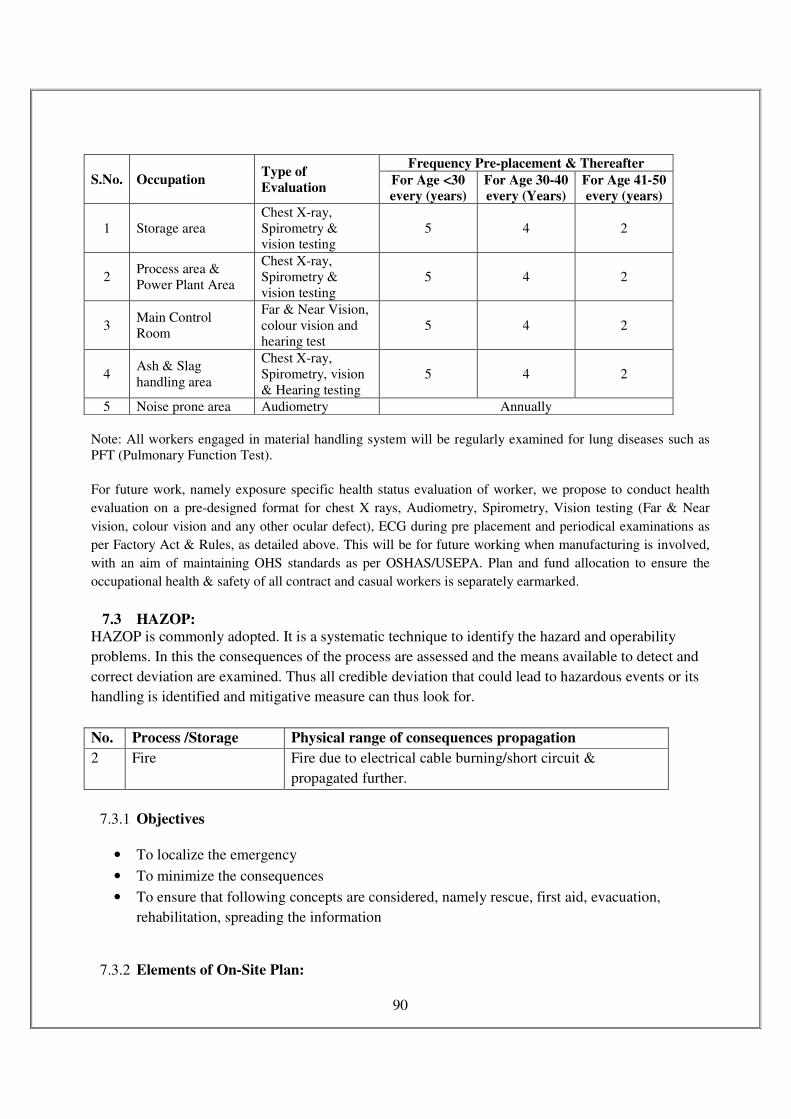
90
S.No. Occupation Type of
Evaluation
Frequency Pre-placement & Thereafter
For Age <30
every (years)
For Age 30-40
every (Years)
For Age 41-50
every (years)
1 Storage area
Chest X-ray,
Spirometry &
vision testing
5 4 2
2 Process area &
Power Plant Area
Chest X-ray,
Spirometry &
vision testing
5 4 2
3 Main Control
Room
Far & Near Vision,
colour vision and
hearing test
5 4 2
4 Ash & Slag
handling area
Chest X-ray,
Spirometry, vision
& Hearing testing
5 4 2
5 Noise prone area Audiometry Annually
Note: All workers engaged in material handling system will be regularly examined for lung diseases such as
PFT (Pulmonary Function Test).
For future work, namely exposure specific health status evaluation of worker, we propose to conduct health
evaluation on a pre-designed format for chest X rays, Audiometry, Spirometry, Vision testing (Far & Near
vision, colour vision and any other ocular defect), ECG during pre placement and periodical examinations as
per Factory Act & Rules, as detailed above. This will be for future working when manufacturing is involved,
with an aim of maintaining OHS standards as per OSHAS/USEPA. Plan and fund allocation to ensure the
occupational health & safety of all contract and casual workers is separately earmarked.
7.3 HAZOP:
HAZOP is commonly adopted. It is a systematic technique to identify the hazard and operability
problems. In this the consequences of the process are assessed and the means available to detect and
correct deviation are examined. Thus all credible deviation that could lead to hazardous events or its
handling is identified and mitigative measure can thus look for.
No. Process /Storage Physical range of consequences propagation
2 Fire Fire due to electrical cable burning/short circuit &
propagated further.
7.3.1 Objectives
• To localize the emergency
• To minimize the consequences
• To ensure that following concepts are considered, namely rescue, first aid, evacuation,
rehabilitation, spreading the information
7.3.2 Elements of On-Site Plan:
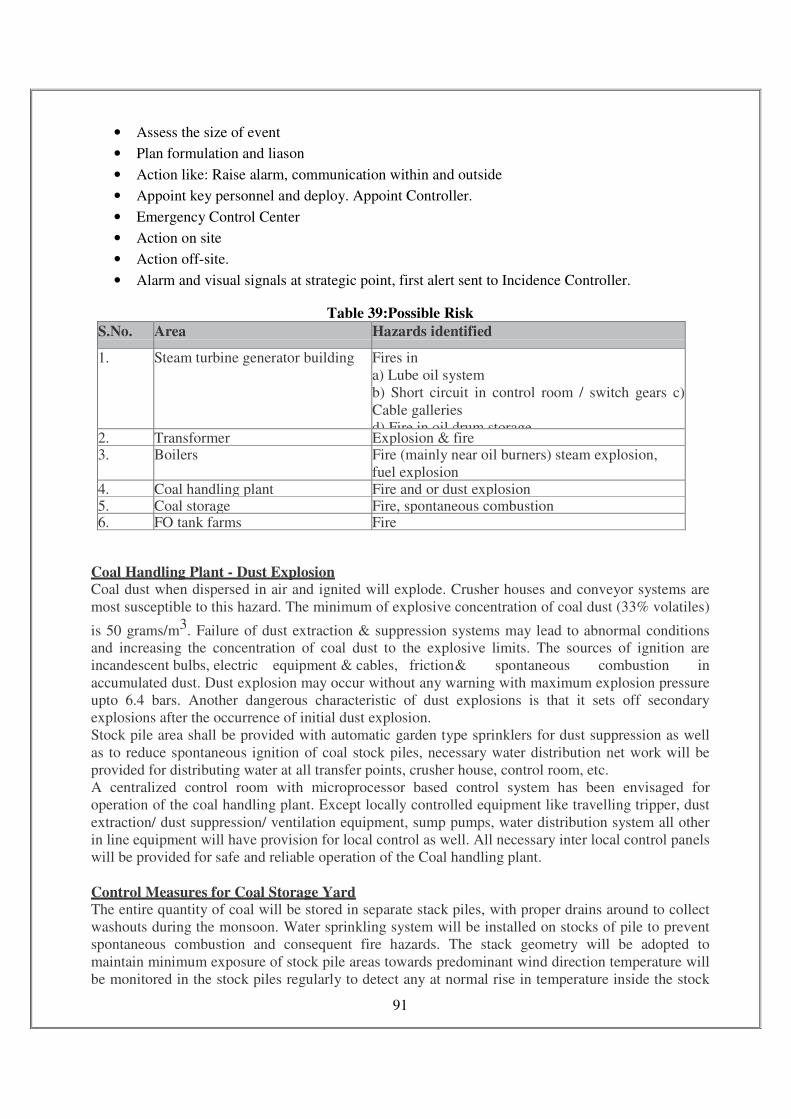
91
• Assess the size of event
• Plan formulation and liason
• Action like: Raise alarm, communication within and outside
• Appoint key personnel and deploy. Appoint Controller.
• Emergency Control Center
• Action on site
• Action off-site.
• Alarm and visual signals at strategic point, first alert sent to Incidence Controller.
Table 39:Possible Risk
S.No. Area Hazards identified
1. Steam turbine generator building Fires in
a) Lube oil system
b) Short circuit in control room / switch gears c)
Cable galleries
d) Fire in oil drum storage 2. Transformer Explosion & fire 3. Boilers Fire (mainly near oil burners) steam explosion,
fuel explosion 4. Coal handling plant Fire and or dust explosion 5. Coal storage Fire, spontaneous combustion 6. FO tank farms Fire
Coal Handling Plant - Dust Explosion Coal dust when dispersed in air and ignited will explode. Crusher houses and conveyor systems are
most susceptible to this hazard. The minimum of explosive concentration of coal dust (33% volatiles)
is 50 grams/m3. Failure of dust extraction & suppression systems may lead to abnormal conditions
and increasing the concentration of coal dust to the explosive limits. The sources of ignition are
incandescent bulbs, electric equipment & cables, friction & spontaneous combustion in
accumulated dust. Dust explosion may occur without any warning with maximum explosion pressure
upto 6.4 bars. Another dangerous characteristic of dust explosions is that it sets off secondary
explosions after the occurrence of initial dust explosion.
Stock pile area shall be provided with automatic garden type sprinklers for dust suppression as well
as to reduce spontaneous ignition of coal stock piles, necessary water distribution net work will be
provided for distributing water at all transfer points, crusher house, control room, etc.
A centralized control room with microprocessor based control system has been envisaged for
operation of the coal handling plant. Except locally controlled equipment like travelling tripper, dust
extraction/ dust suppression/ ventilation equipment, sump pumps, water distribution system all other
in line equipment will have provision for local control as well. All necessary inter local control panels
will be provided for safe and reliable operation of the Coal handling plant.
Control Measures for Coal Storage Yard The entire quantity of coal will be stored in separate stack piles, with proper drains around to collect
washouts during the monsoon. Water sprinkling system will be installed on stocks of pile to prevent
spontaneous combustion and consequent fire hazards. The stack geometry will be adopted to
maintain minimum exposure of stock pile areas towards predominant wind direction temperature will
be monitored in the stock piles regularly to detect any at normal rise in temperature inside the stock
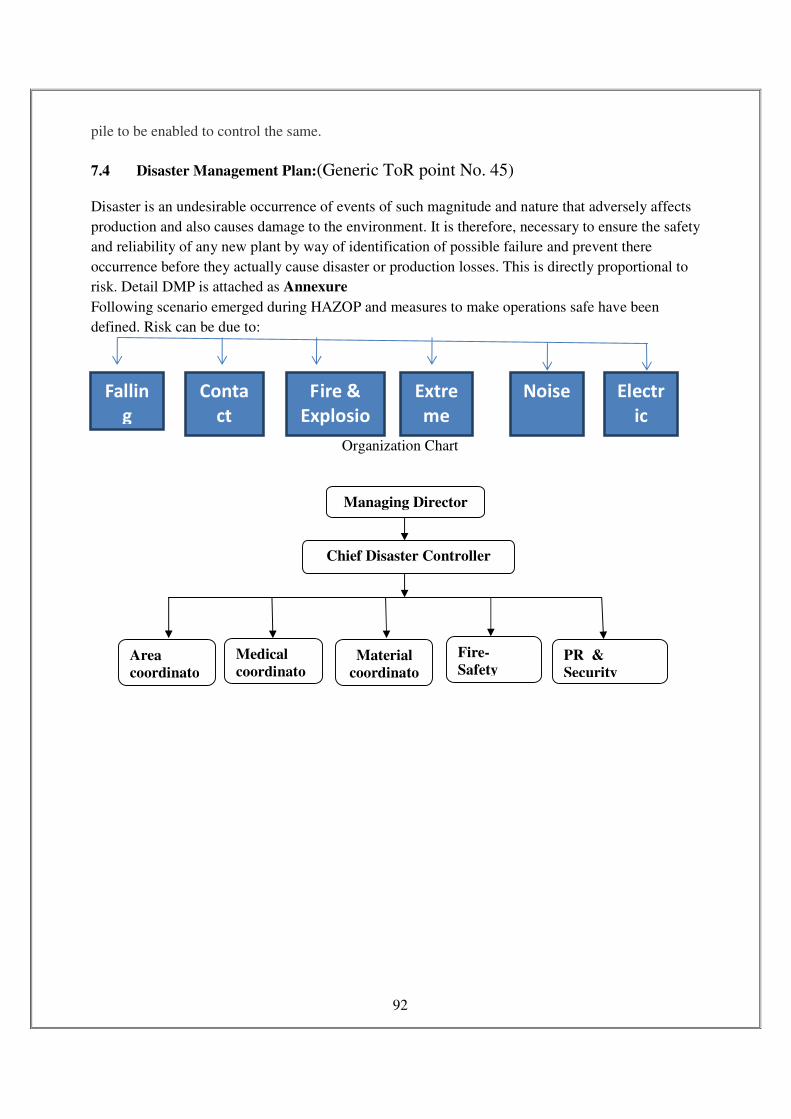
92
pile to be enabled to control the same.
7.4 Disaster Management Plan:(Generic ToR point No. 45)
Disaster is an undesirable occurrence of events of such magnitude and nature that adversely affects
production and also causes damage to the environment. It is therefore, necessary to ensure the safety
and reliability of any new plant by way of identification of possible failure and prevent there
occurrence before they actually cause disaster or production losses. This is directly proportional to
risk. Detail DMP is attached as Annexure
Following scenario emerged during HAZOP and measures to make operations safe have been
defined. Risk can be due to:
Organization Chart
Fallin
g
Conta
ct
with
Fire &
Explosio
n
Extre
me
Temp.
Noise Electr
ic
Shock
Managing Director
Chief Disaster Controller
Area
coordinato
Medical
coordinatoMaterial
coordinato
Fire-
Safety PR &
Security
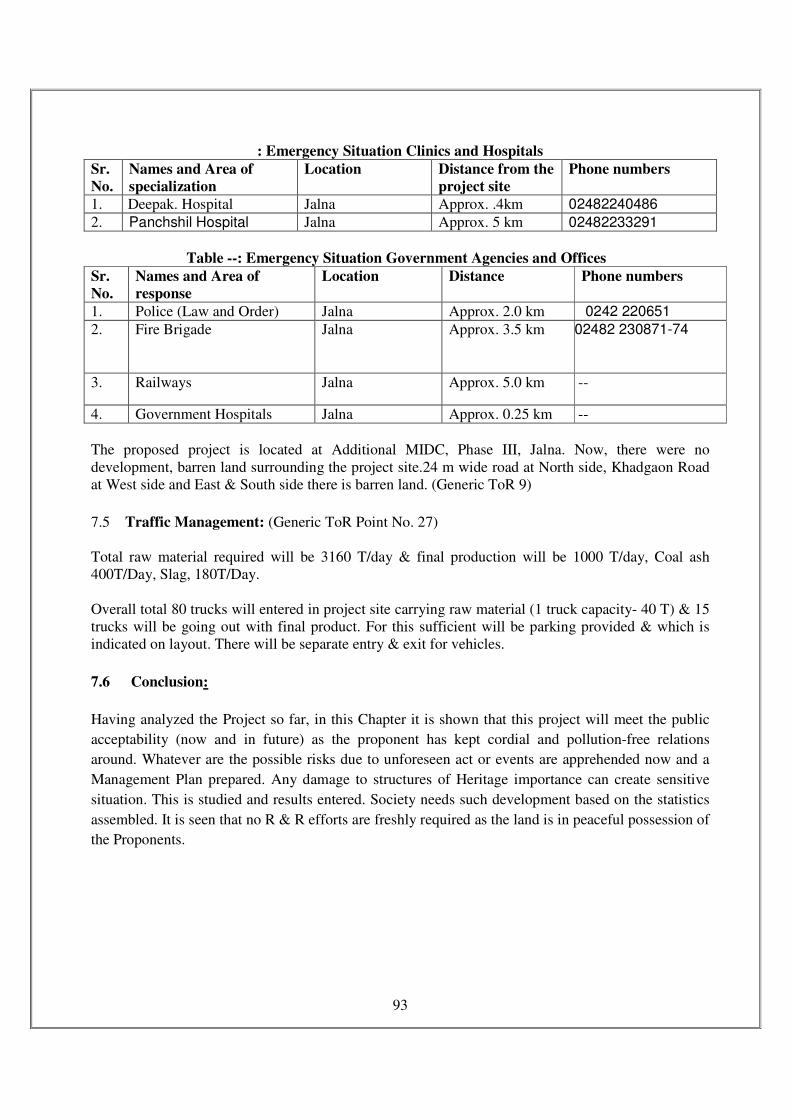
93
: Emergency Situation Clinics and Hospitals
Sr.
No.
Names and Area of
specialization
Location Distance from the
project site
Phone numbers
1. Deepak. Hospital Jalna Approx. .4km 02482240486
2. Panchshil Hospital Jalna Approx. 5 km 02482233291
Table --: Emergency Situation Government Agencies and Offices
Sr.
No.
Names and Area of
response
Location Distance Phone numbers
1. Police (Law and Order) Jalna Approx. 2.0 km 0242 220651
2. Fire Brigade Jalna Approx. 3.5 km
02482 230871-74
3. Railways Jalna Approx. 5.0 km --
4. Government Hospitals Jalna Approx. 0.25 km --
The proposed project is located at Additional MIDC, Phase III, Jalna. Now, there were no
development, barren land surrounding the project site.24 m wide road at North side, Khadgaon Road
at West side and East & South side there is barren land. (Generic ToR 9)
7.5 Traffic Management: (Generic ToR Point No. 27)
Total raw material required will be 3160 T/day & final production will be 1000 T/day, Coal ash
400T/Day, Slag, 180T/Day.
Overall total 80 trucks will entered in project site carrying raw material (1 truck capacity- 40 T) & 15
trucks will be going out with final product. For this sufficient will be parking provided & which is
indicated on layout. There will be separate entry & exit for vehicles.
7.6 Conclusion:
Having analyzed the Project so far, in this Chapter it is shown that this project will meet the public
acceptability (now and in future) as the proponent has kept cordial and pollution-free relations
around. Whatever are the possible risks due to unforeseen act or events are apprehended now and a
Management Plan prepared. Any damage to structures of Heritage importance can create sensitive
situation. This is studied and results entered. Society needs such development based on the statistics
assembled. It is seen that no R & R efforts are freshly required as the land is in peaceful possession of
the Proponents.
94
8 CHAPTER - PROJECT BENEFITS
It is seen that the Project is aimed to fulfill the objective of Sustainable Development. It will improve
economic status of the nearby area in the district.
8.1 Improvements in the physical infrastructure:
This Project will improve the physical infrastructure of this area:
As roof rain harvesting and recharging is proposed, there will not be any incremental run-off causing
floods downstream. It will improve the water table in the long run. The nearby nalla is trained by
good civil engineering practice and hence physical infrastructure will improve.
The industry is dependent on raw materials and helping chemicals, which arrives by road. The
finished goods will be dispatched by road. All the labour force will come by road. The proponents
will assist the administration to maintain the roads in good conditions. This improved physical
infrastructure will be an added facility to the community for surface transport.
Greening drive in the premises will give a pleasant look to the land. It will absorb some portion of the
CO2 produced by fuel burning (utilities) as well as created by induction furnace (process). It is
proposed to use treated domestic wastewater for green area development. Canopy of trees will arrest
dust fugitive SPM as well as the noise.
8.2 Improvements in the social infrastructure:
The Project will aid in the improvement of the social infrastructure of this area:
In the District Similar industries are already running their units over the years. These are not only
running with efficiency but are running with no disturbance to the local people. Local people have
even encouraged the expansion of such mills for production. The same is the case for diversification.
PP will employ sons of the soil without discrimination, wherever feasible. The Proponent’s
management keeps the transparent account.
Education level goes along with flow of funds and avenue of livelihood. Dependence on Government
subsidy also goes along with political stability of the area. The level of education and literacy
(especially rural and women) is very poor, needing improvement. This activity by this Proponent will
certainly play a catalytic role in this.
Likewise the health level goes along with flow of funds and avenue of livelihood. Dependence on
Government institutes like PHC (Primary Health Centre) also goes along with political stability of the
area. The level of health and medication (especially children and women) is very poor, needing
improvement. This activity by this Proponent will certainly play a catalytic role in this.
Health awareness and economic independence may also help in Family Planning decision-making.
Living in harmony is an important aspect of the society. This can happen only if all the components
are comfortably placed. Persons engaged in their respective vocation and accruing job satisfaction
leads to this. This will become possible by this venture.
We will earmark Rs. 6.8 Cr. for CSR activities.
List of CSR activities:
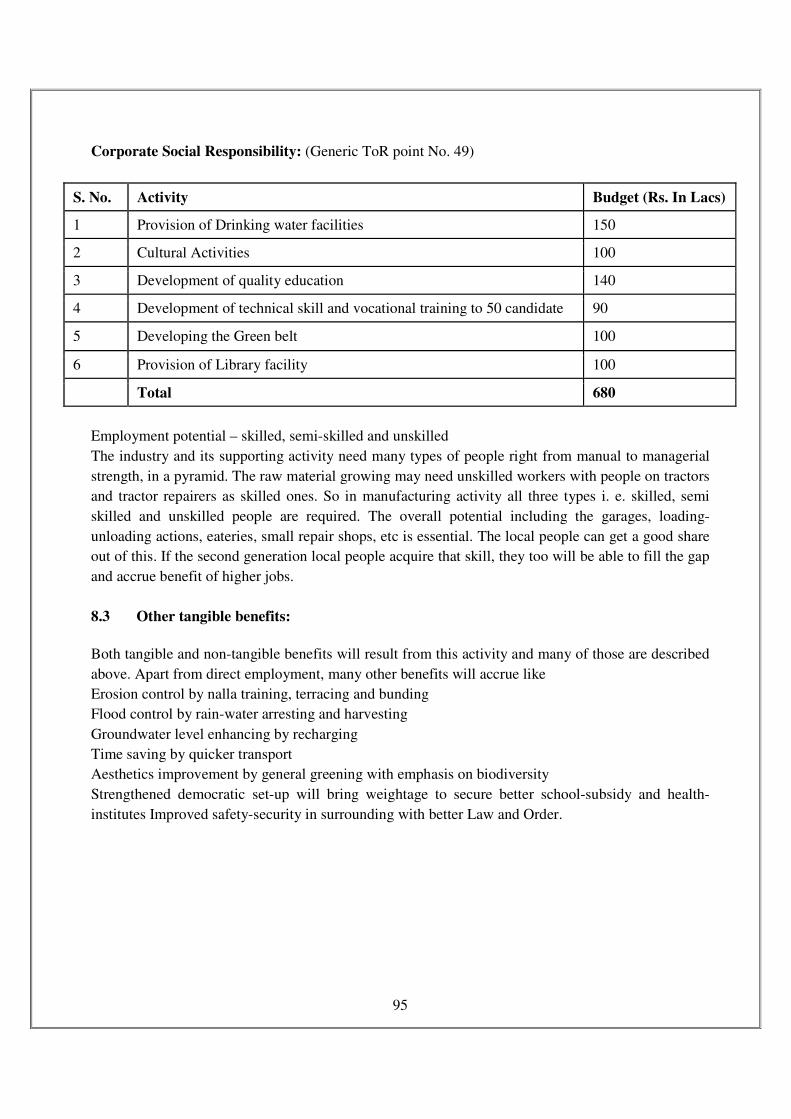
95
Corporate Social Responsibility: (Generic ToR point No. 49)
S. No. Activity Budget (Rs. In Lacs)
1 Provision of Drinking water facilities 150
2 Cultural Activities 100
3 Development of quality education 140
4 Development of technical skill and vocational training to 50 candidate 90
5 Developing the Green belt 100
6 Provision of Library facility 100
Total 680
Employment potential – skilled, semi-skilled and unskilled
The industry and its supporting activity need many types of people right from manual to managerial
strength, in a pyramid. The raw material growing may need unskilled workers with people on tractors
and tractor repairers as skilled ones. So in manufacturing activity all three types i. e. skilled, semi
skilled and unskilled people are required. The overall potential including the garages, loading-
unloading actions, eateries, small repair shops, etc is essential. The local people can get a good share
out of this. If the second generation local people acquire that skill, they too will be able to fill the gap
and accrue benefit of higher jobs.
8.3 Other tangible benefits:
Both tangible and non-tangible benefits will result from this activity and many of those are described
above. Apart from direct employment, many other benefits will accrue like
Erosion control by nalla training, terracing and bunding
Flood control by rain-water arresting and harvesting
Groundwater level enhancing by recharging
Time saving by quicker transport
Aesthetics improvement by general greening with emphasis on biodiversity
Strengthened democratic set-up will bring weightage to secure better school-subsidy and health-
institutes Improved safety-security in surrounding with better Law and Order.
96
9 CHAPTER - ENVIRONMENT MANAGEMENT PLAN (EMP)
9.1 Need:
The economic development of any country depends mainly on the core sector development such as
infrastructure, agriculture, etc. Iron and steel products form the backbone of infrastructure
development. This type of plant is likely to be more viable in view of present situation, when the steel
has demand in the market and global inflow of money is permissible. This has a foreign-exchange
saving potential.
9.2 Objectives:
To define the components of environmental management..
To prepare an environmental hierarchy.
To prepare a checklist for statutory compliance.
To prepare environmental organization.
To prepare a schedule for monitoring and compliance.
To establish a watchdog committee voluntarily with an ultimate aim to get ISO 14000 certification.
The Company has an environment policy, which basically includes all these objectives. The
administrative hierarchy is so kept that any untoward incident will be reported directly to the
Managing Director. This has avoided generation of complaints or environmental misbehavior like
violations. For prevention, abatement and control, followed by mitigation, proper hierarchical system
or Administrative order of the company is maintained with Director reporting to the Managing
Director. For day to day control, General Manager & Environmental Scientist are responsible and
they are supported by field officers, field inspectors, laboratory staff, garden supervisors, mechanical
and electrical fitters and CSR/CER in-charge. For this purpose, adequate funds for capital cost &
recurring cost/annum for environmental pollution control measures are earmarked and will be spent.
This will also include Corporate Social Responsibility & Corporate Environment Responsibility.
9.2.1 Environment Components:
KMPL is aware that environmental management is not a job, which can be handled without a careful
planning. The success lies if three components are simultaneously present viz. (1) management
support, (2) efficiency of the environment management cell and (3) acceptability of resulting
environmental quality, both by SPCB and by public. A structure of this plan and hierarchy of process
flow for environmental management is prepared and enclosed as logics, which is self-explanatory.
KMPL will adopt this structure and hierarchy, which is akin to principles and practice.
9.3 Environmental management plan: Construction Phase Environment impacts during construction phase will be mainly due to civil works such as site
clearing, foundation, construction, material and machinery transportation etc. The construction phase
impact will be temporary in nature and localized phenomena except the permanent change in land-
use pattern at the project site.
97
9.3.1 Site Preparation
The development of site for erections of plant structure, office building and other allied activities will
require careful management planning as the construction activities shall be located in barren land
owned by the project proponent. Therefore, construction site development process should incorporate
certain precautions.
It is necessary to control the dust nuisance, through regular water sprinkling, that would be created by
excavation, leveling and transportation activities so that impacts on the various components of
environment would be minimized.
9.3.2 Construction Equipment and Waste
Transport vehicles as well as transport routes will be properly maintained during whole construction
phase to minimize smoke / dust emission from vehicle exhausts and unpaved roads. Composite solid
wastes including metal scrap, earthwork, other wastes, getting generated in construction process will
be disposed off in safe manner.
9.3.3 Air Environment
The construction of proposed plant would result in the increase of SPM concentrations due to fugitive
dust. Frequent water sprinkling in the vicinity of the construction sites would be undertaken and will
be continued after the completion of plant construction as there is scope for heavy truck mobility. It
will be ensured that both gasoline and diesel powered vehicles are properly maintained to comply
with exhaust emission requirements.
9.3.4 Noise Environment
There will be marginal increase in noise levels during construction phase which is temporary. No
construction activities are planned during night time which may contribute to the existing baseline.
9.3.5 Water Environment
During construction, provision for infra-structural services including water supply, sewage, drainage
facilities and electrification will be made. The construction site would be provided with suitable toilet
facilities for the workers to allow proper standards of hygiene. These facilities would be connected to
a STP to ensure minimum impact on the environment.
9.3.6 Safety & Health
Adequate space will be provided for construction of temporary sheds for construction workers
mobilized by the contractors. Potable water supply will be provided for the construction workers. The
safety department will supervise the safe working of the contractor and their employees. Work spots
will be maintained clean, provided with optimum lighting and enough ventilation to eliminate
dust/fumes.
9.4 Environmental management plan: operation Phase
Environmental Management Plan is detailed under the following heads:
� Air Quality Management
� Noise Management
� Waste Water Management
� Solid & Hazardous Waste Management
� Energy Conservation
� Greenbelt Development & Plantation Programme
� Occupational Health & Safety Measures.
98
9.4.1 AIR QUALITY MANAGEMENT
The major pollutants of air in a distillery are the particulate matters from the stack and fugitive
emissions due to material handling.
Stack Emission
To keep the PM emissions from stack below permissible limits (i.e. <50 mg/Nm3), stack will be
provided with ESP and care shall be taken as listed below:
• Regular cleaning of ESP
• Maintenance of boiler for optimum performance
• Emergency power supply to ESP in case of power failure
Fugitive Emission Fugitive emissions are the air pollutants released in the air other than those from stacks or vents.
Factors affecting emissions that are common to most operations include the following:
• Moisture content of the material
• Type of material processed
• Type of equipment
• Operating practices employed.
Sources of fugitive emission:
1) Material Storage Dust may be generated here due to carryover by wind. However, to avoid this, material like coal, ash
etc. will be kept in covered location, preferably in silos or covered shed.
2) Transportation Transportation of material like coal and ash shall be done carefully, preferably in covered belt
conveyor to avoid dust emission.
Movement of heavy trucks/vehicles on the non-metallic road generates substantial quantity of dust
emission. This is due to the presence of dust over the road, which is carried away by wind. To control
the generation of dust, all the roads inside the plant premises will be tar roads. Regular sweeping of
all the roads and floors is being done by vacuum sweeper. Sprinkling of water through tankers is
being done on bare lands and roads.
9.4.2 Noise Management
Exposure of high noise level to workers for long duration may lead to certain occupational diseases.
To mitigate the high noise level, following measures are being adopted. The same will be practiced
for proposed expansion also.
• Walls and ceilings of the concerned buildings are lined with sound absorbing materials.
• Properly insulated enclosures are provided to equipment making excessive noise.
• Improved silencers are provided in the equipment generating high noise.
• Proper maintenance, oiling and greasing of machines at regular intervals is being done to
reduce generation of noise.
• Personal Protective Equipment (PPEs) like earplugs and earmuffs is being provided to the
workers exposed to high noise level.
• Area having high noise level being displayed at site with Noise level and signage for usages
of Personal Protective Equipments (PPE’s).
• Green area (33774 m2 and 4975 native trees) of appropriate width inside the plant premises
and at the plant boundary has been developed and same will be maintained in future.
99
• Regular monitoring of noise level is being carried out and corrective measures in concerned
machinery are being adapted accordingly to the possible extent.
9.4.3 Water Management
Waste Water Management
• Effluent generated during rolling process which will be treated in ETP.
• Domestic waste water generated from office / worker will be treated in STP and treated water
will be utilized for greenbelt development / plantation.
• No effluent will be discharged outside the plant premises.
Water Conservation The following measures will be adopted to minimize use of fresh water:
• Re-use of effluent and domestic wastewater
• Periodic preventive maintenance of water distribution systems
• Rain water harvesting at plant, 2 No. of rain water harvesting tank will be provided)
• Training and awareness on water conservation measures
9.4.4 Solid and hazardous Waste Management
Solid waste generated shall be recycled, reused or disposed off as per norms.
• Office waste mainly paper waste shall be sent to authorized recycler
• Waste oil drums shall be sent to authorized recyclers
• Waste oil shall be used for greasing
• Ash will be sent to Cement Industry & slag can be used for road making.
9.4.5 Concept of waste minimization - 3R (Reuse, recycle and recover), energy and resource
conservation
Reuse and recycle
• Treated water from STP, ETP will be reused for greenbelt development and rolling mill.
Recover
• STP and ETP sludge will be used as manure
• Slag will be used as a substitute for road/building construction material.
Energy Conservation
• Installation of energy efficient lightings. Use of energy saving light fittings
• Procurement of energy efficient machineries
• Minimizing idle running of vehicle, machines and electrical appliances
• Optimizing loads and periodic preventive maintenance & lubrication
• Prevention of leakages
• Periodic energy audits
• Training, awareness and motivational programmers.
Natural Resource Conservation
• Rain water harvesting shall be done in the factory premises
• Wastewater shall be recycled so that fresh water requirement will be reduced
100
9.4.6 Biological Environment and green belt development
• Development & maintenance of green belt to be considered.
• No outside soil is brought for any building/ greenery developments.
Plantation Programme
33% of the land shall be brought under green belt. 6 m wide green belt shall be developed around the
periphery of factory and 1-2 lines of trees shall be planted along the both sides of internal roads.
Trees shall also be planted around plant, coal yard, ash storage, boiler room etc.
9.4.7 Occupational Health & Safety
Occupational Health
Occupational health needs attention both during construction & erection and operation &
maintenance phases. However, the problem varies both in magnitude and variety in the above phases.
Construction & Erection
The occupational health problems envisaged at this stage can mainly be due to constructional
accident and noise. To overcome these hazards, in addition to arrangements to reduce it within TLV’s
personal protective devices should also be supplied to workers.
Operation and Maintenance The problem of occupational health, in the operation and maintenance phase is due to respirable dust
and noise. With suitable engineering controls the exposures can be reduced to less than TLV limits
and proper personnel protective devices should be given to employees. The working personnel should
be given the following appropriate personnel protective devices.
• Industrial safety helmet;
• Crash helmets;
• Face shield with replacement acrylic vision;
• Zero power plain goggles with cut type filters on both ends;
• Zero power goggles with cut type filters on both sides and blue colour glasses;
• Welders equipment for eye & face protection;
• Cylindrical type earplug;
• Ear muffs;
• Dust masks;
• Canister gas mask;
• Self contained breathing apparatus;
• Leather apron;
• Aluminized fiber glass fix proximity suit with hood and gloves;
• Boiler suit;
• Safety belt/lime man’s safety belt;
• Leather hand gloves;
• Asbestos hand gloves;
• Canvas cum leather hand gloves with leather palm;
• Lead hand glove;
• Electrically tested electrical resistance hand gloves;
• Industrial safety shoes with steel toe;
• Rubber boots (alkali resistant); and
• Electrical safety shoes without steel toe and gum boots.
101
Full fledged hospital facilities should be made available round the clock for attending emergency
arising out of accidents, if any. All working personnel should be medically examined at least once in
every year and at the end of his term of employment. This is in addition to the pre-employment
medical examination.
9.5 Environmental Monitoring Schedule:
A judgment can become truncated if it is not scientifically supported. This work is done by an
appropriate monitoring which is a technique of drawing a sample and deriving inferences from the
same for knowledge and improvements.
A judgment can become truncated if it is not scientifically supported. This work is done by an
appropriate monitoring which is a technique of drawing a sample and understanding from it the
universe. The sampling station, the parameters and frequency is of extreme importance as also the
careful analysis, reporting and interpretation. The schedule decided for a small activity like that of
KMPL is as given in chapter six:
Schedules:
There will be three facets to design and follow the schedules viz.: (A) for compliance of
responsibilities, (B) for day-to-day operation and management of ECE, and (C) for routine
environmental monitoring, to assess the impact and take timely warning. The schedule:
Daily Compliance:
Take the meter readings - initial and final, for checking the water consumption.
Maintain the electricity consumption record for pollution control.
Monitor ambient air periodically as per Consent.
Monthly Compliance:
Monitor the emission sources through the competent authority and submit the analysis reports to the
board.
Monitor ambient/work zone noise levels & ensure conformance to standards.
Quarterly Compliance:
Monitor the ambient air quality at upwind and downwind locations of the factory.
Review the Water Reuse performance.
Yearly Compliance:
Carryout “Environmental Audit Statement” of various environmental aspects, review the
environmental policies with the help of experts and make the up-gradation /changes accordingly.
Submit the “Environmental Statement” to the State Pollution Control Board in Form V under Rule 14
of the Environment (Protection) Second Amendment Rules 1992 of the Environment (Protection)
Act, 1986.
Renew the Consent to Operate under the Water and Air Acts.
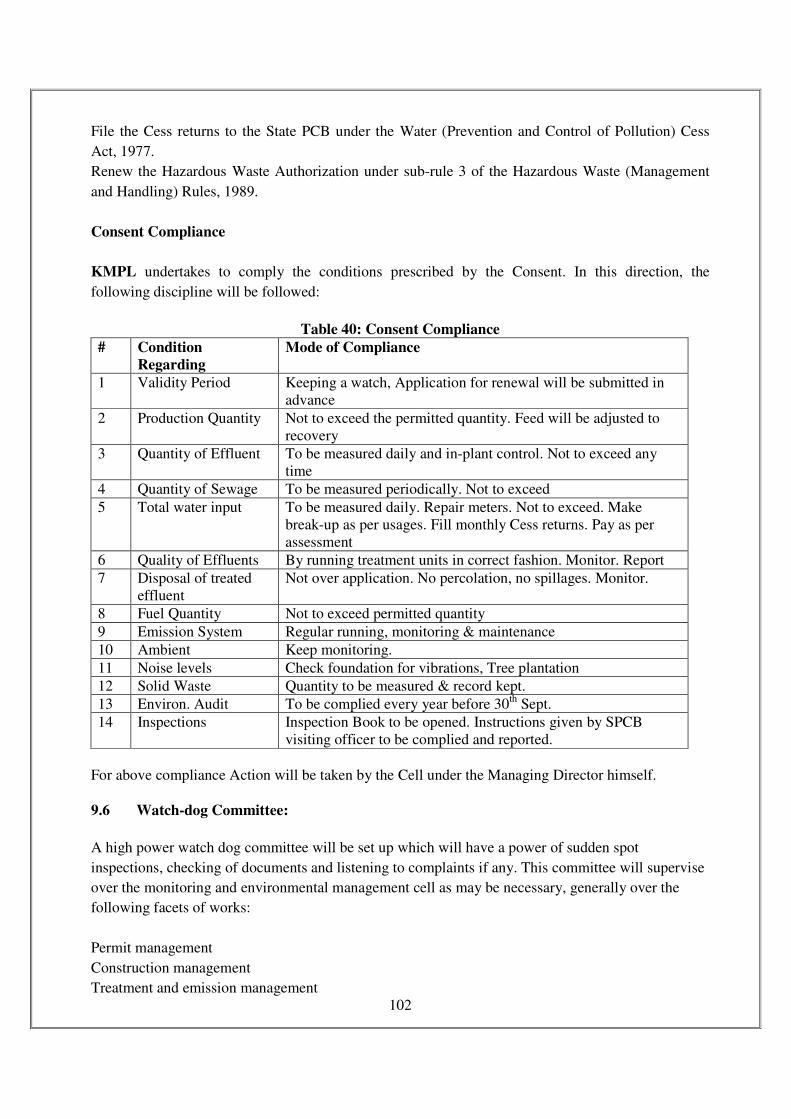
102
File the Cess returns to the State PCB under the Water (Prevention and Control of Pollution) Cess
Act, 1977.
Renew the Hazardous Waste Authorization under sub-rule 3 of the Hazardous Waste (Management
and Handling) Rules, 1989.
Consent Compliance
KMPL undertakes to comply the conditions prescribed by the Consent. In this direction, the
following discipline will be followed:
Table 40: Consent Compliance
#
Condition
Regarding
Mode of Compliance
1 Validity Period Keeping a watch, Application for renewal will be submitted in
advance
2 Production Quantity Not to exceed the permitted quantity. Feed will be adjusted to
recovery
3 Quantity of Effluent To be measured daily and in-plant control. Not to exceed any
time
4 Quantity of Sewage To be measured periodically. Not to exceed
5 Total water input To be measured daily. Repair meters. Not to exceed. Make
break-up as per usages. Fill monthly Cess returns. Pay as per
assessment
6 Quality of Effluents By running treatment units in correct fashion. Monitor. Report
7 Disposal of treated
effluent
Not over application. No percolation, no spillages. Monitor.
8 Fuel Quantity Not to exceed permitted quantity
9 Emission System Regular running, monitoring & maintenance
10 Ambient Keep monitoring.
11 Noise levels Check foundation for vibrations, Tree plantation
12 Solid Waste Quantity to be measured & record kept.
13 Environ. Audit To be complied every year before 30th
Sept.
14 Inspections Inspection Book to be opened. Instructions given by SPCB
visiting officer to be complied and reported.
For above compliance Action will be taken by the Cell under the Managing Director himself.
9.6 Watch-dog Committee:
A high power watch dog committee will be set up which will have a power of sudden spot
inspections, checking of documents and listening to complaints if any. This committee will supervise
over the monitoring and environmental management cell as may be necessary, generally over the
following facets of works:
Permit management
Construction management
Treatment and emission management
103
Transport management
Disposal management
Monitoring
Documentation
Law enforcement
9.6.1 Construction Phase Management:
Site Preparation:
The clearance of site may involve the movement of soil. No major leveling operations are envisaged.
During dry weather conditions it is necessary to control dust nuisance created by excavation and
transportation activities. However, because the proposed built-up area is of considerable low
requirement, this problem should not be insurmountable, or else some water sprinkling will be
resorted to.
Sanitation:
The construction site shall be provided with sufficient and suitable toilet facilities for construction
workers to allow proper standards of personal hygiene. These facilities shall be connected to a septic
tank and maintained to ensure minimum or no environmental impact.
Noise:
Though the noise effect on the nearest inhabitants due to construction activity will be negligible
(being away) it is advisable that on site workers using high noise equipment adopt noise protection
devices like earmuffs.
Construction Equipment and Waste:
It shall be ensured that both gasoline and diesel powered construction vehicles are properly
maintained to minimize smoke in the exhaust emissions. The vehicle maintenance area shall be
located in such a manner to avoid sources by accidental spillage of oil. Unauthorized dumping of
waste oil should be prohibited. Wastes shall be disposed off at an approved site.
Site Security:
Construction site is a potential hazardous environment. To ensure that the local inhabitants and stray
cattle are not exposed to these hazards, the site shall be secured by fencing and manned entry points.
It will be fully illuminated.
Land Environment:
An inventory shall be prepared of standing trees and bushes of significance. To prevent unauthorized
felling of trees by construction workers for their fuel needs it will be ensured that the contractor
provides fuel to them.
104
9.7 Conclusion:
Commencing from Introductory, this EIA study has reported the details on Proponents, Project,
natural and manmade facets of background environment, how and how much residual pollution will
be added after prevention, abatement, control and mitigation. Whether the overall impact will be
adverse, beneficial or marginal is found out by two accredited systems. Justification of the Project or
“No Project” is also considered. This, however, is required to be manned properly. Unless an EMP is
prepared in advance, as like production campaign the environmental protection will not automatically
happen. Such EMP, and its implementation with commitment from the higher management is stated.
This Study when scrupulously followed, will meet the objectives of fulfilling the legal requirements
and not causing any hardships to people.
105
10 CHAPTER CONSULTANTS ENGAGED
This EIA report is prepared on behalf of the proponents, taking inputs from proponent’s office staff,
their R & D wing, Architects, Project Management Professionals etc. by Environmental Consultants
M/s. Ultra-Tech Environmental Consultancy & Laboratory, Thane, Mumbai , who have been
accredited NABET Accreditation Certificate No. NABET/EIA/1417/RA010
M/s Ultra-Tech Environmental Consultancy & Laboratory: (Generic ToR 1, Point No. 1, 54)
Ultra-Tech Environmental Consultancy & Laboratory [Lab Gazetted by MoEF – Govt. of India] not
only give environmental solutions for sustainable development, but make sure that they are
economically feasible. With innovative ideas and impact mitigation measures offered, make them
distinguished in environmental consulting business. The completion of tasks in record time is the key
feature of Ultra-Tech. A team of more than hundred environmental brigadiers consists of engineers,
experts, ecologists, hydrologists, geologists, socio-economic experts, solid waste and hazard waste
experts apart from environmental media sampling and monitoring experts and management experts ,
strive hard to serve the clients with up to mark and best services.
Ultra-Tech offers environmental consultancy services to assist its clients to obtain environmental
clearance for their large buildings, construction, CRZ, SEZ, high rise buildings, township projects
and industries covering sugar and distilleries from respective authorities. Ultra-Tech is in the process
of getting QCI-NABET final accreditation for its EIA organization.
Ultra-Tech also provide STP/ETP /WTP project consultancy on turn-key basis apart from Operation
and Maintenance of these projects on annual contract basis. Also, having MoEF approved
environmental laboratory, Ultra-Tech provide laboratory services for monitoring and analysis of
various environmental media like air, water, waste water, stack, noise and meteorological data to its
clients all over India and abroad.
Functional area experts and assistance to FAE involved in the EIA study for M/s. Kapila Metal Pvt
Ltd., at. Additional MIDC, Phase –III, Plot No: B-102 to 105, , Dist : Jalna, Maharashtra;
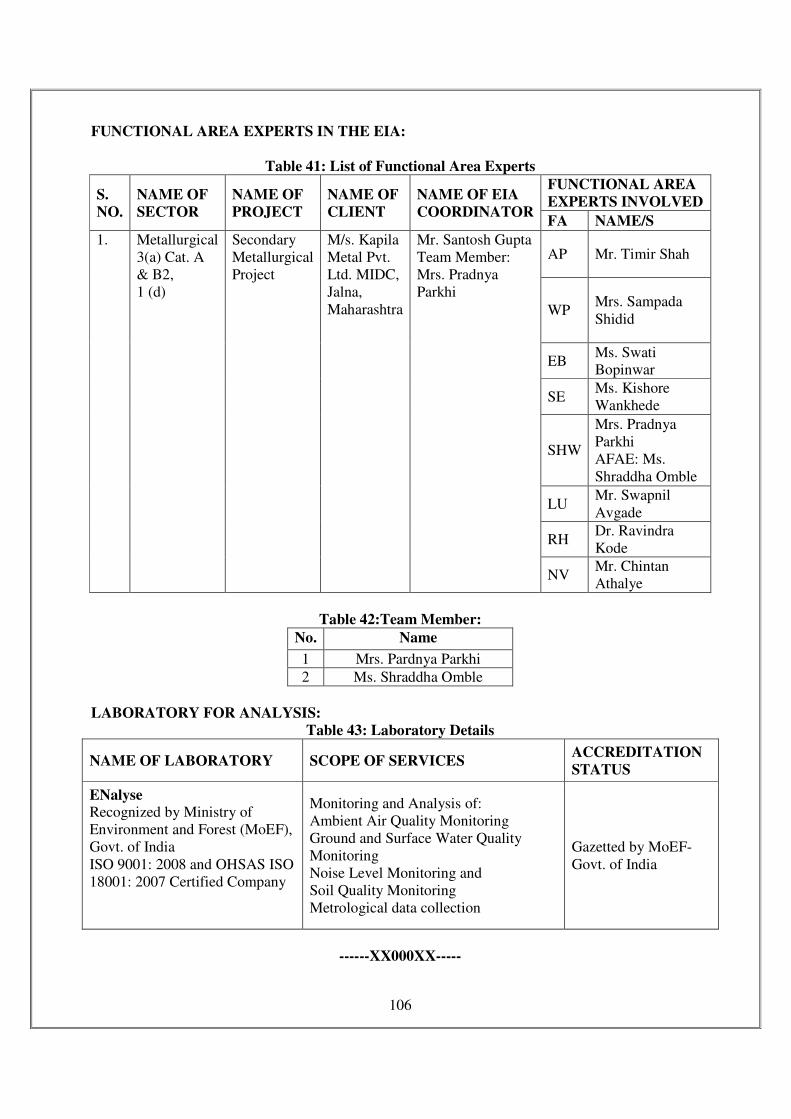
106
FUNCTIONAL AREA EXPERTS IN THE EIA:
Table 41: List of Functional Area Experts
S.
NO.
NAME OF
SECTOR
NAME OF
PROJECT
NAME OF
CLIENT
NAME OF EIA
COORDINATOR
FUNCTIONAL AREA
EXPERTS INVOLVED
FA NAME/S
1. Metallurgical
3(a) Cat. A
& B2,
1 (d)
Secondary
Metallurgical
Project
M/s. Kapila
Metal Pvt.
Ltd. MIDC,
Jalna,
Maharashtra
Mr. Santosh Gupta
Team Member:
Mrs. Pradnya
Parkhi
AP Mr. Timir Shah
WP Mrs. Sampada
Shidid
EB Ms. Swati
Bopinwar
SE Ms. Kishore
Wankhede
SHW
Mrs. Pradnya
Parkhi
AFAE: Ms.
Shraddha Omble
LU Mr. Swapnil
Avgade
RH Dr. Ravindra
Kode
NV Mr. Chintan
Athalye
Table 42:Team Member:
No. Name
1 Mrs. Pardnya Parkhi
2 Ms. Shraddha Omble
LABORATORY FOR ANALYSIS:
Table 43: Laboratory Details
NAME OF LABORATORY SCOPE OF SERVICES ACCREDITATION
STATUS
ENalyse Recognized by Ministry of
Environment and Forest (MoEF),
Govt. of India
ISO 9001: 2008 and OHSAS ISO
18001: 2007 Certified Company
Monitoring and Analysis of:
Ambient Air Quality Monitoring
Ground and Surface Water Quality
Monitoring
Noise Level Monitoring and
Soil Quality Monitoring
Metrological data collection
Gazetted by MoEF-
Govt. of India
------XX000XX-----
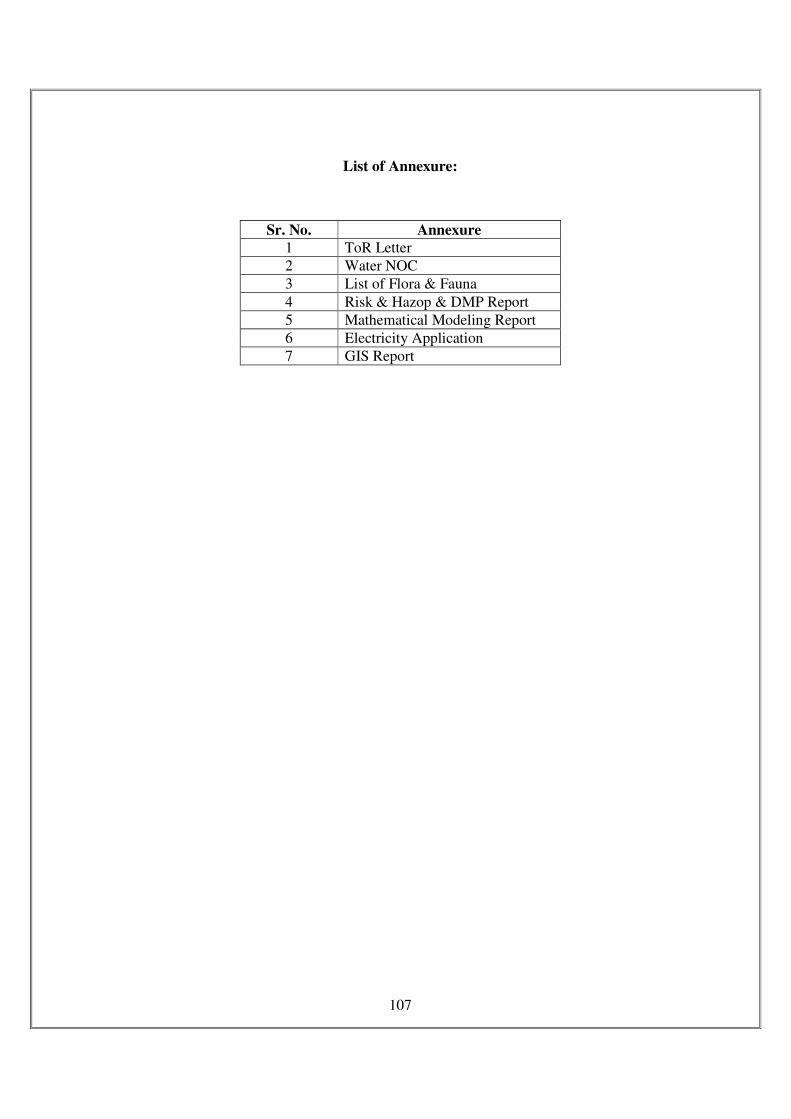
107
List of Annexure:
Sr. No. Annexure
1 ToR Letter
2 Water NOC
3 List of Flora & Fauna
4 Risk & Hazop & DMP Report
5 Mathematical Modeling Report
6 Electricity Application
7 GIS Report


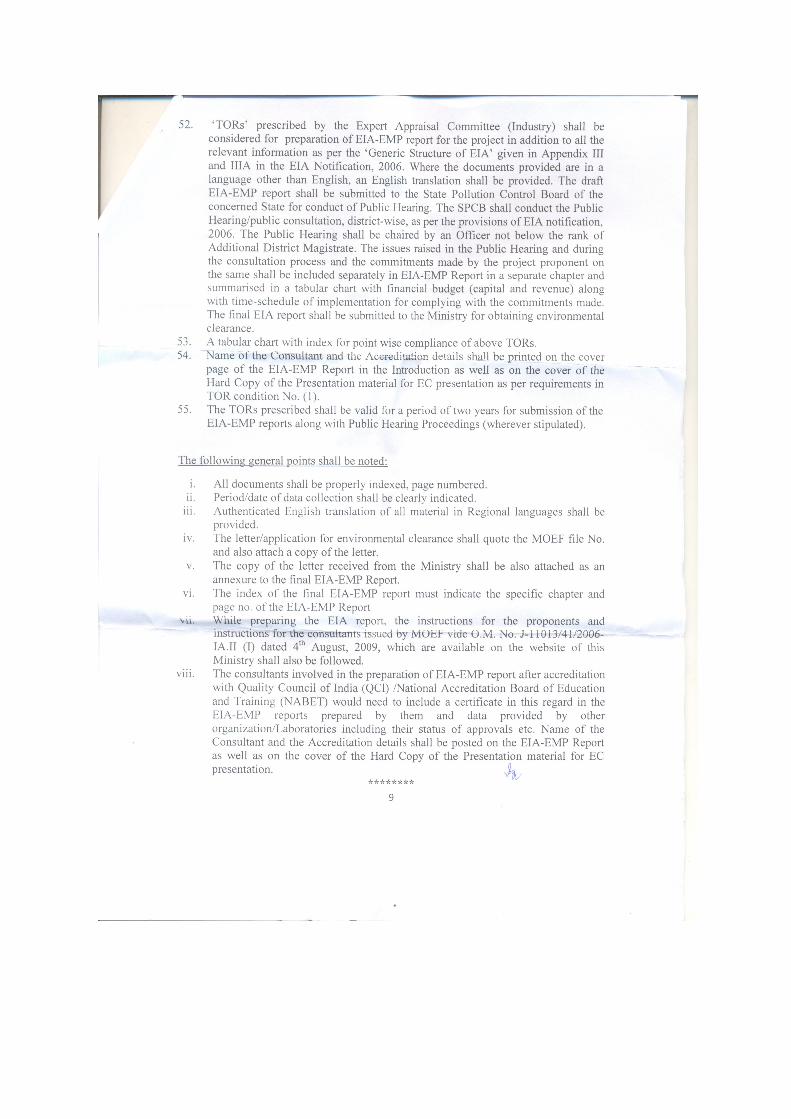
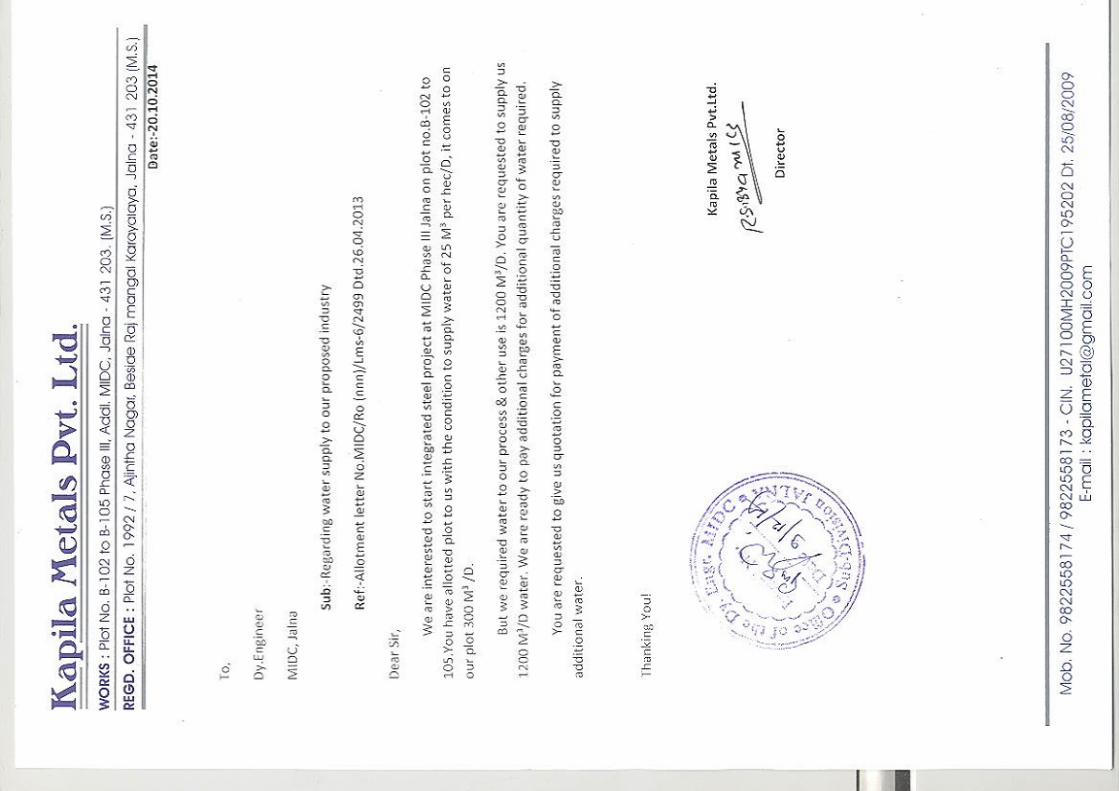
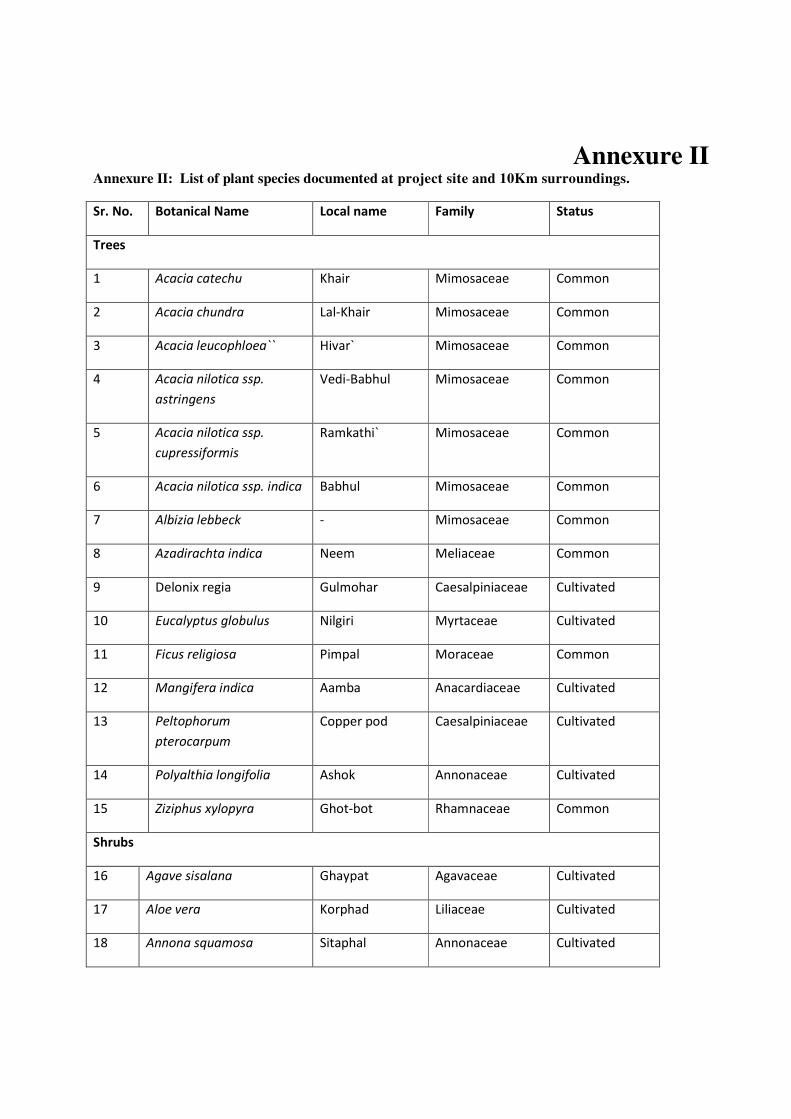
Annexure II Annexure II: List of plant species documented at project site and 10Km surroundings.
Sr. No. Botanical Name Local name Family Status
Trees
1 Acacia catechu Khair Mimosaceae Common
2 Acacia chundra Lal-Khair Mimosaceae Common
3 Acacia leucophloea`` Hivar` Mimosaceae Common
4 Acacia nilotica ssp.
astringens
Vedi-Babhul Mimosaceae Common
5 Acacia nilotica ssp.
cupressiformis
Ramkathi` Mimosaceae Common
6 Acacia nilotica ssp. indica Babhul Mimosaceae Common
7 Albizia lebbeck - Mimosaceae Common
8 Azadirachta indica Neem Meliaceae Common
9 Delonix regia Gulmohar Caesalpiniaceae Cultivated
10 Eucalyptus globulus Nilgiri Myrtaceae Cultivated
11 Ficus religiosa Pimpal Moraceae Common
12 Mangifera indica Aamba Anacardiaceae Cultivated
13 Peltophorum
pterocarpum
Copper pod Caesalpiniaceae Cultivated
14 Polyalthia longifolia Ashok Annonaceae Cultivated
15 Ziziphus xylopyra Ghot-bot Rhamnaceae Common
Shrubs
16 Agave sisalana Ghaypat Agavaceae Cultivated
17 Aloe vera Korphad Liliaceae Cultivated
18 Annona squamosa Sitaphal Annonaceae Cultivated
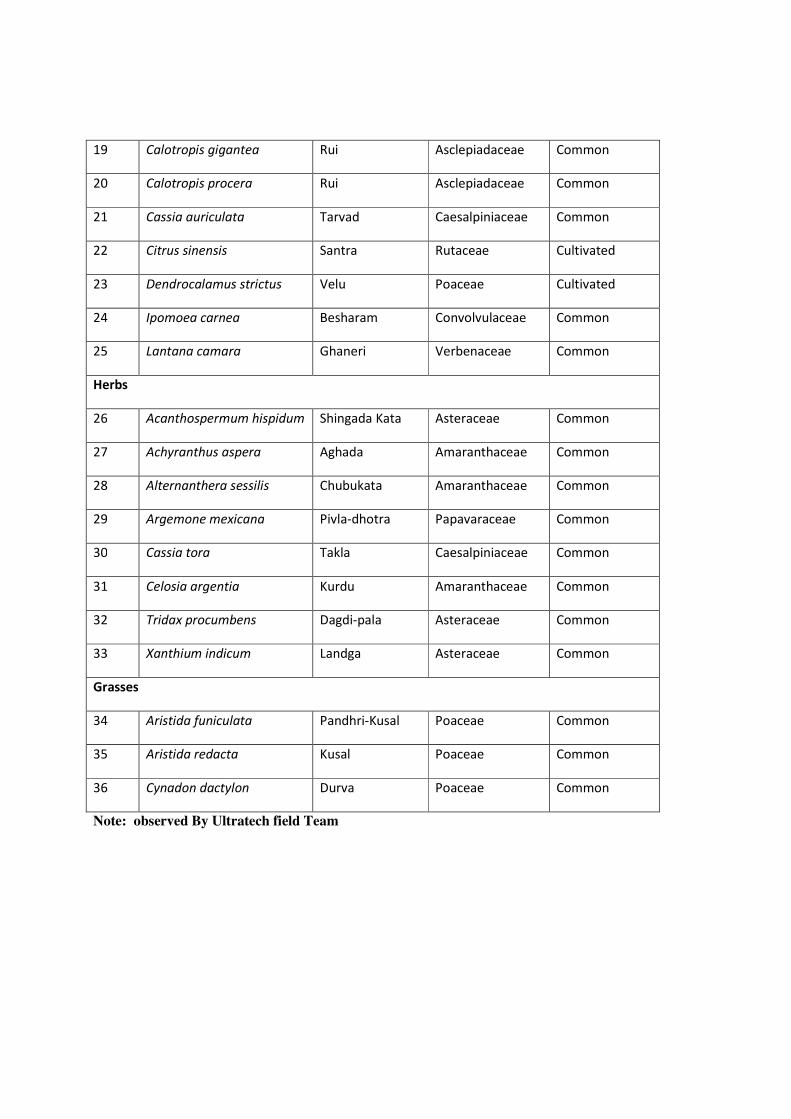
19 Calotropis gigantea Rui Asclepiadaceae Common
20 Calotropis procera Rui Asclepiadaceae Common
21 Cassia auriculata Tarvad Caesalpiniaceae Common
22 Citrus sinensis Santra Rutaceae Cultivated
23 Dendrocalamus strictus Velu Poaceae Cultivated
24 Ipomoea carnea Besharam Convolvulaceae Common
25 Lantana camara Ghaneri Verbenaceae Common
Herbs
26 Acanthospermum hispidum Shingada Kata Asteraceae Common
27 Achyranthus aspera Aghada Amaranthaceae Common
28 Alternanthera sessilis Chubukata Amaranthaceae Common
29 Argemone mexicana Pivla-dhotra Papavaraceae Common
30 Cassia tora Takla Caesalpiniaceae Common
31 Celosia argentia Kurdu Amaranthaceae Common
32 Tridax procumbens Dagdi-pala Asteraceae Common
33 Xanthium indicum Landga Asteraceae Common
Grasses
34 Aristida funiculata Pandhri-Kusal Poaceae Common
35 Aristida redacta Kusal Poaceae Common
36 Cynadon dactylon Durva Poaceae Common
Note: observed By Ultratech field Team
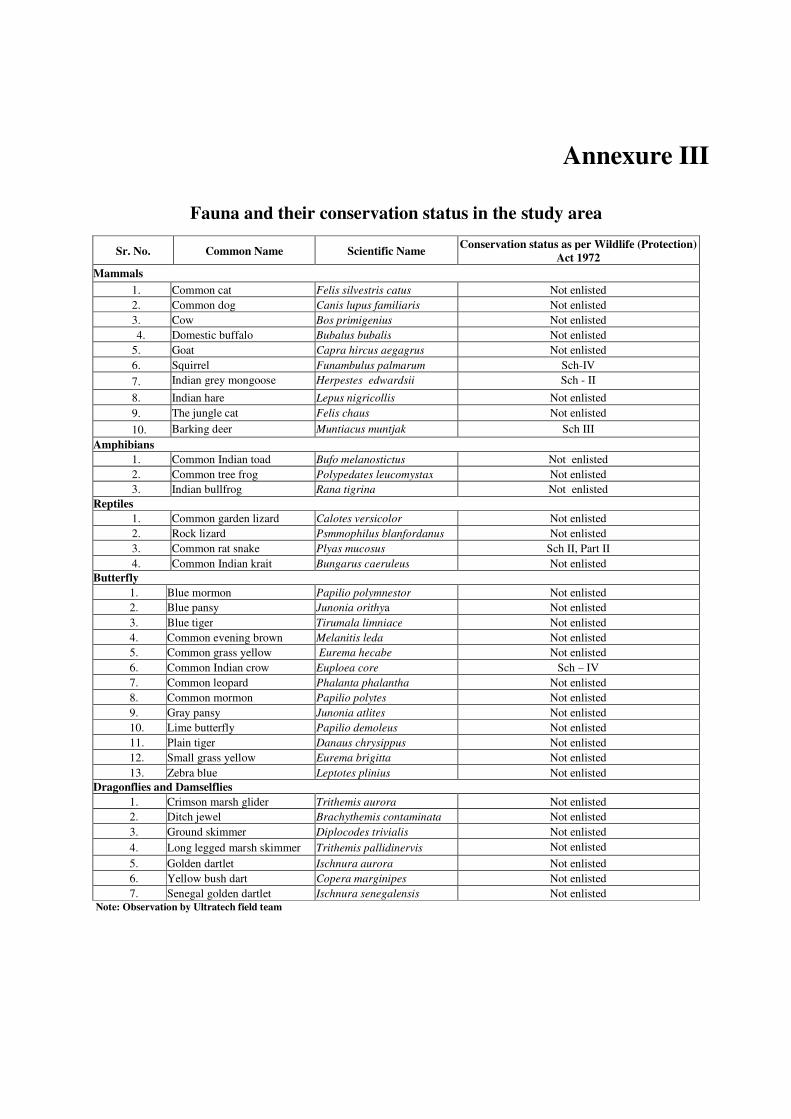
Annexure III
Fauna and their conservation status in the study area
Note: Observation by Ultratech field team
Sr. No. Common Name Scientific Name Conservation status as per Wildlife (Protection)
Act 1972
Mammals
1. Common cat Felis silvestris catus Not enlisted
2. Common dog Canis lupus familiaris Not enlisted
3. Cow Bos primigenius Not enlisted
4. Domestic buffalo Bubalus bubalis Not enlisted
5. Goat Capra hircus aegagrus Not enlisted
6. Squirrel Funambulus palmarum Sch-IV
7. Indian grey mongoose Herpestes edwardsii Sch - II
8. Indian hare Lepus nigricollis Not enlisted
9. The jungle cat Felis chaus Not enlisted
10. Barking deer Muntiacus muntjak Sch III
Amphibians
1. Common Indian toad Bufo melanostictus Not enlisted
2. Common tree frog Polypedates leucomystax Not enlisted
3. Indian bullfrog Rana tigrina Not enlisted
Reptiles
1. Common garden lizard Calotes versicolor Not enlisted
2. Rock lizard Psmmophilus blanfordanus Not enlisted
3. Common rat snake Plyas mucosus Sch II, Part II
4. Common Indian krait Bungarus caeruleus Not enlisted
Butterfly
1. Blue mormon Papilio polymnestor Not enlisted
2. Blue pansy Junonia orithya Not enlisted
3. Blue tiger Tirumala limniace Not enlisted
4. Common evening brown Melanitis leda Not enlisted
5. Common grass yellow Eurema hecabe Not enlisted
6. Common Indian crow Euploea core Sch – IV
7. Common leopard Phalanta phalantha Not enlisted
8. Common mormon Papilio polytes Not enlisted
9. Gray pansy Junonia atlites Not enlisted
10. Lime butterfly Papilio demoleus Not enlisted
11. Plain tiger Danaus chrysippus Not enlisted
12. Small grass yellow Eurema brigitta Not enlisted
13. Zebra blue Leptotes plinius Not enlisted
Dragonflies and Damselflies
1. Crimson marsh glider Trithemis aurora Not enlisted
2. Ditch jewel Brachythemis contaminata Not enlisted
3. Ground skimmer Diplocodes trivialis Not enlisted
4. Long legged marsh skimmer Trithemis pallidinervis Not enlisted
5. Golden dartlet Ischnura aurora Not enlisted
6. Yellow bush dart Copera marginipes Not enlisted
7. Senegal golden dartlet Ischnura senegalensis Not enlisted
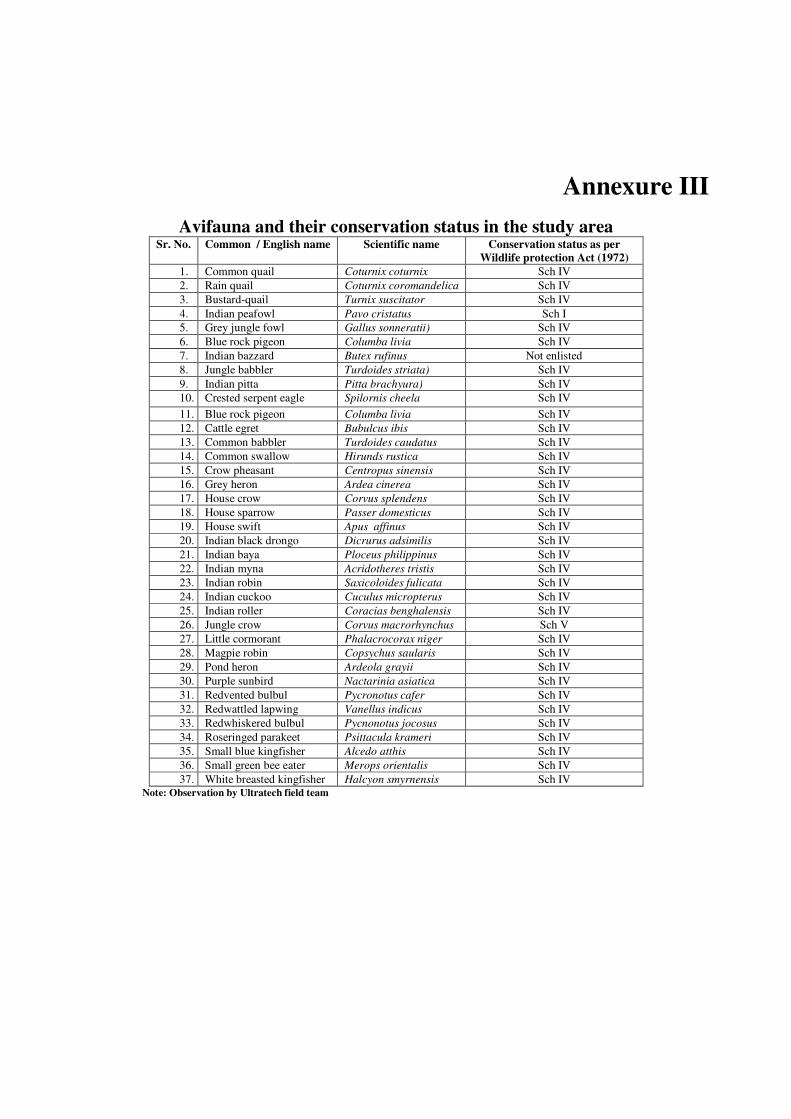
Annexure III
Avifauna and their conservation status in the study area Sr. No. Common / English name Scientific name Conservation status as per
Wildlife protection Act (1972)
1. Common quail Coturnix coturnix Sch IV
2. Rain quail Coturnix coromandelica Sch IV
3. Bustard-quail Turnix suscitator Sch IV
4. Indian peafowl Pavo cristatus Sch I
5. Grey jungle fowl Gallus sonneratii) Sch IV
6. Blue rock pigeon Columba livia Sch IV
7. Indian bazzard Butex rufinus Not enlisted
8. Jungle babbler Turdoides striata) Sch IV
9. Indian pitta Pitta brachyura) Sch IV
10. Crested serpent eagle Spilornis cheela Sch IV
11. Blue rock pigeon Columba livia Sch IV
12. Cattle egret Bubulcus ibis Sch IV
13. Common babbler Turdoides caudatus Sch IV
14. Common swallow Hirunds rustica Sch IV
15. Crow pheasant Centropus sinensis Sch IV
16. Grey heron Ardea cinerea Sch IV
17. House crow Corvus splendens Sch IV
18. House sparrow Passer domesticus Sch IV
19. House swift Apus affinus Sch IV
20. Indian black drongo Dicrurus adsimilis Sch IV
21. Indian baya Ploceus philippinus Sch IV
22. Indian myna Acridotheres tristis Sch IV
23. Indian robin Saxicoloides fulicata Sch IV
24. Indian cuckoo Cuculus micropterus Sch IV
25. Indian roller Coracias benghalensis Sch IV
26. Jungle crow Corvus macrorhynchus Sch V
27. Little cormorant Phalacrocorax niger Sch IV
28. Magpie robin Copsychus saularis Sch IV
29. Pond heron Ardeola grayii Sch IV
30. Purple sunbird Nactarinia asiatica Sch IV
31. Redvented bulbul Pycronotus cafer Sch IV
32. Redwattled lapwing Vanellus indicus Sch IV
33. Redwhiskered bulbul Pycnonotus jocosus Sch IV
34. Roseringed parakeet Psittacula krameri Sch IV
35. Small blue kingfisher Alcedo atthis Sch IV
36. Small green bee eater Merops orientalis Sch IV
37. White breasted kingfisher Halcyon smyrnensis Sch IV Note: Observation by Ultratech field team
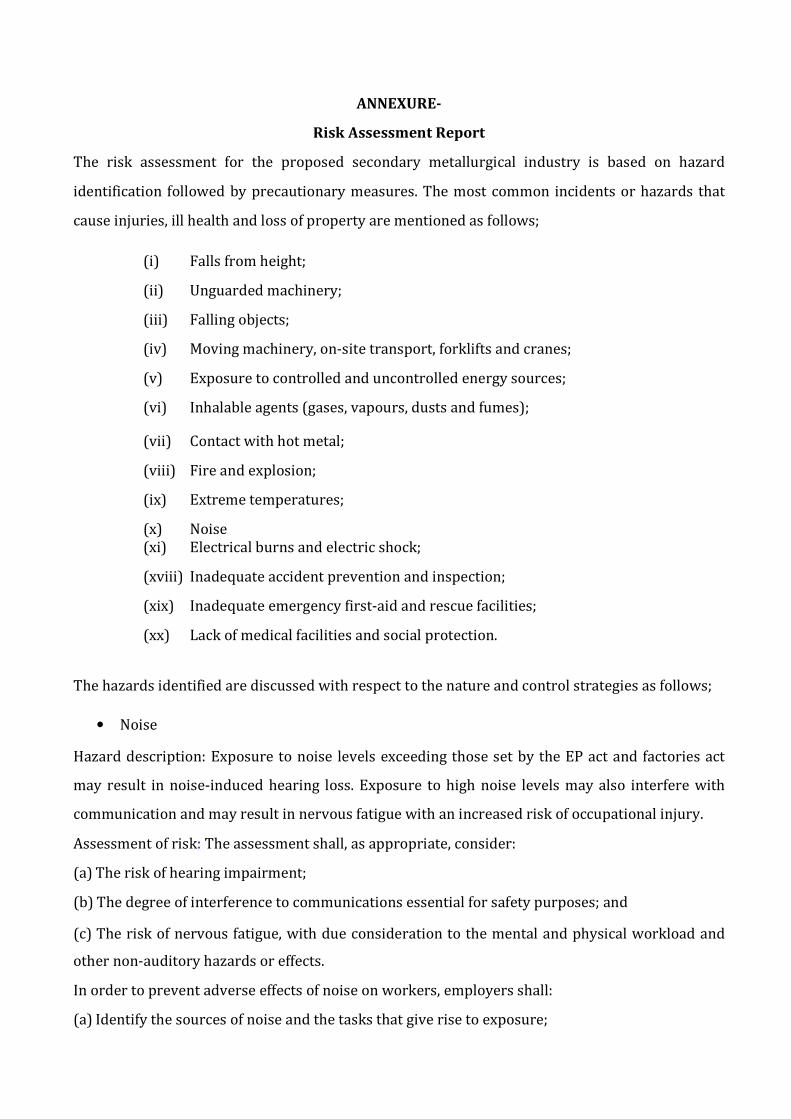
ANNEXURE-
Risk Assessment Report
The risk assessment for the proposed secondary metallurgical industry is based on hazard
identification followed by precautionary measures. The most common incidents or hazards that
cause injuries, ill health and loss of property are mentioned as follows;
(i) Falls from height;
(ii) Unguarded machinery;
(iii) Falling objects;
(iv) Moving machinery, on-site transport, forklifts and cranes;
(v) Exposure to controlled and uncontrolled energy sources;
(vi) Inhalable agents (gases, vapours, dusts and fumes);
(vii) Contact with hot metal;
(viii) Fire and explosion;
(ix) Extreme temperatures;
(x) Noise
(xi) Electrical burns and electric shock;
(xviii) Inadequate accident prevention and inspection;
(xix) Inadequate emergency first-aid and rescue facilities;
(xx) Lack of medical facilities and social protection.
The hazards identified are discussed with respect to the nature and control strategies as follows;
• Noise
Hazard description: Exposure to noise levels exceeding those set by the EP act and factories act
may result in noise-induced hearing loss. Exposure to high noise levels may also interfere with
communication and may result in nervous fatigue with an increased risk of occupational injury. Assessment of risk: The assessment shall, as appropriate, consider: (a) The risk of hearing impairment; (b) The degree of interference to communications essential for safety purposes; and (c) The risk of nervous fatigue, with due consideration to the mental and physical workload and
other non-auditory hazards or effects. In order to prevent adverse effects of noise on workers, employers shall: (a) Identify the sources of noise and the tasks that give rise to exposure;
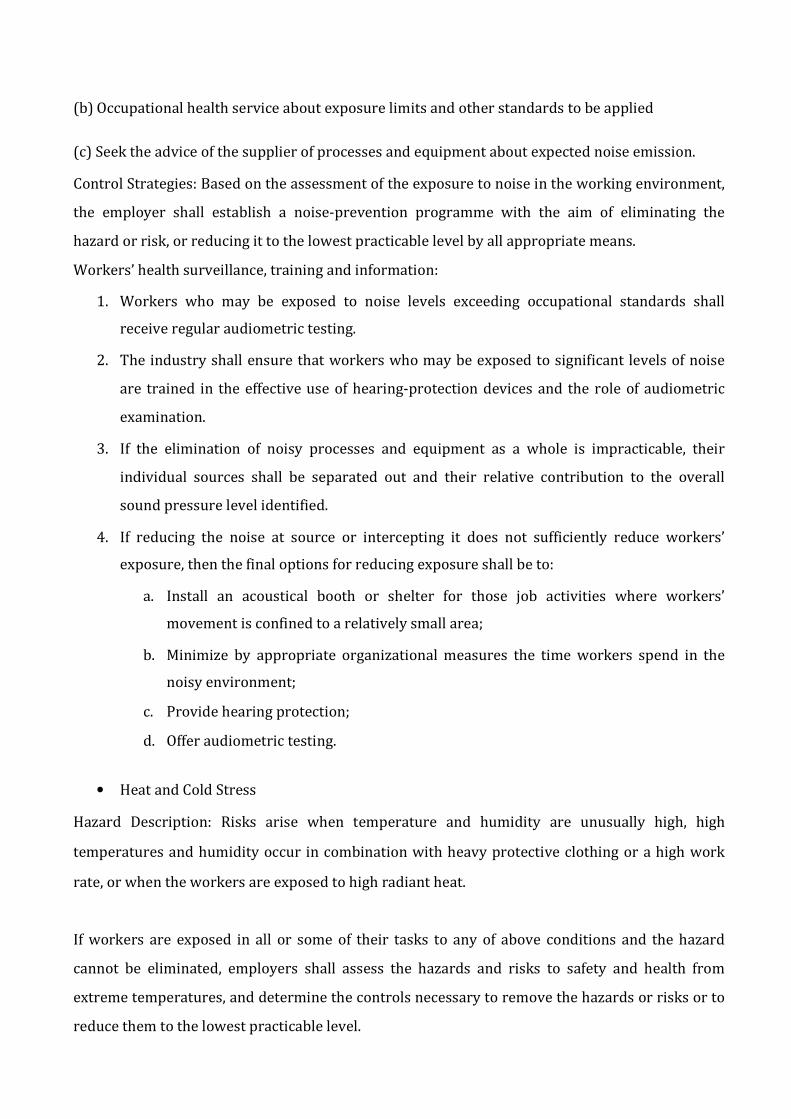
(b) Occupational health service about exposure limits and other standards to be applied
(c) Seek the advice of the supplier of processes and equipment about expected noise emission. Control Strategies: Based on the assessment of the exposure to noise in the working environment,
the employer shall establish a noise-prevention programme with the aim of eliminating the
hazard or risk, or reducing it to the lowest practicable level by all appropriate means. Workers’ health surveillance, training and information:
1. Workers who may be exposed to noise levels exceeding occupational standards shall
receive regular audiometric testing.
2. The industry shall ensure that workers who may be exposed to significant levels of noise
are trained in the effective use of hearing-protection devices and the role of audiometric
examination.
3. If the elimination of noisy processes and equipment as a whole is impracticable, their
individual sources shall be separated out and their relative contribution to the overall
sound pressure level identified.
4. If reducing the noise at source or intercepting it does not sufficiently reduce workers’
exposure, then the final options for reducing exposure shall be to:
a. Install an acoustical booth or shelter for those job activities where workers’
movement is confined to a relatively small area;
b. Minimize by appropriate organizational measures the time workers spend in the
noisy environment;
c. Provide hearing protection;
d. Offer audiometric testing.
• Heat and Cold Stress Hazard Description: Risks arise when temperature and humidity are unusually high, high
temperatures and humidity occur in combination with heavy protective clothing or a high work
rate, or when the workers are exposed to high radiant heat.
If workers are exposed in all or some of their tasks to any of above conditions and the hazard
cannot be eliminated, employers shall assess the hazards and risks to safety and health from
extreme temperatures, and determine the controls necessary to remove the hazards or risks or to
reduce them to the lowest practicable level.
The assessment for the thermal environment shall take into account the risks arising from
working. (a) A hot environment that makes respiratory protectors un-comfortable and less likely to be used, and necessitates re-structuring of jobs in order to reduce the risks. Control Strategies:
1. Workers exposed to heat will be trained to recognize symptoms which may lead to heat
stress or hypothermia, in themselves or others, and the steps to be taken to prevent onset
and/or emergencies, in the use of rescue and first-aid measures; and in action to be taken
in the event of increased risks of accidents because of high or low temperatures.
2. The importance of physical fitness for work in hot environments.
3. The importance of drinking sufficient quantities of suitable liquid and the dietary
requirements providing intake of salt and potassium and other elements that are depleted
due to sweating.
4. When the assessment reveals that the workers may be at risk of heat stress or
hypothermia, employers shall eliminate the need for work in such conditions or take
measures to reduce the risks from extreme temperatures.
5. Where workers are at risk from exposure to radiant heat by working near hot surfaces the
employer may increase the distance between the equipment to reduce the temperature of
the surface by changing plant-operating temperatures, insulating the surfaces or reduce
the emissivity of the surface.
6. The industry shall take particular care with ventilation design where work is undertaken in
enclosed spaces or areas. When fail-safe systems are not in operation, there will be
adequate supervision of workers at risk to ensure that they can be removed from danger.
• Inhalable agents (gases, vapors, dusts and fumes) Hazard Description: The production of billets/ingots & bars involves dusts, fumes, smokes and
aerosols. The pulmonary system (lungs) can be affected by exposure to harmful agents through
acute (short-term) injury to lung tissue, the development of pneumoconiosis, pulmonary
dysfunction
Specific agents that may be found in the iron and steel industry include heavy metals
(e.g. lead, chromium, zinc, nickel and manganese) in the form of fumes, particulates and
adsorbates on inert dust particles.
Control Strategies:
1. Where it is not possible, exposure to harmful inhalable agents with which they
work or may come in contact shall be minimized.
• Control of Energy Hazard Description: The industry uses electrical energy. The safe control of energy shall
be addressed by procedure and carried out by appropriately trained personnel in
accordance with the nature of the energy source and the characteristics of the facilities.
Energy sources for equipment shall be turned off or disconnected or de-energized and
the switch locked or labeled with a warning tag. Control Strategies:
1. All electrical installations shall be appropriately designed and shall include
appropriate protection systems, such as automatic shut-off systems, interlocks
and emergency controls.
2. Energy sources and facilities shall be appropriately labelled.
3. A risk assessment shall be conducted before isolating the energy source to
ensure that the consequences have been evaluated.
• Work equipment and machinery guarding Hazard Description: The use of work equipment, including machinery may result in
accidents, many of which are serious and some fatal. Of the many factors that can cause
risk, particular areas of concern include: A lack of guards or inadequate guards on machines which can lead to accidents caused
by entanglement, sheering, crushing, trapping, cutting, etc.; Insufficient strength of
materials and inappropriate design of machines; failure to provide the right
information, instruction and training for those using the equipment; All power tools
shall be used with appropriate shields, guards and attachments and in accordance with
the recommendations of the manufacturers. Workers shall be trained in the use of
power tools and safety requirements. Control Strategies: Controlling risks often means guarding those parts of machines and
equipment that could cause injury. Many accidents happen because of the failure to
select the right equipment for the work to be done.
1. The industry shall ensure that fixed guards are used wherever necessary, and
properly fastened in place with appropriate fasteners including, screws or nuts
and bolts which need tools to remove them; workers will be trained to operate
equipment before they are directed to do so;
2. Regular maintenance of machinery and equipment is required to ensure that
they are in a safe condition, and maintenance records are kept;
3. Workers shall be authorized to immediately stop the machine if it is not working
safely or if any guards or protective devices are faulty, and inform the supervisor
as soon as possible.
• Hazards in operating the furnace Preventing fires and explosions Fires and explosions in furnaces most often result from water coming into contact with
molten metal. The water may be present in scrap material, damp moulds, from leaks in
the furnace cooling systems or leaks in the building. Following precautions shall be
taken to prevent fires:
a. Operators shall be trained in safe systems of work. The building shall be
designed to be non-combustible, with automatic fire suppression engineered or
designed into the process where appropriate.
b. Regular safety audits shall be undertaken to ensure that hazards are clearly
identified and risk-control measures maintained at an optimum level. Furnaces
shall not be operated beyond their safe lives.
• Dusts and Fibres When a furnace is stripped for maintenance purposes, particular care shall be taken to
avoid inhaling dusts or fibres from the insulating material. Dust and fume collectors
shall be incorporated into the furnace design.
• Preventing steam explosion
Molten slag and metal shall be prevented from coming into contact with water, which
will cause a steam explosion. Equipment and piping for furnace gas cleaning, and piping
carrying gas in the air preheating system of the dry dust catchers, shall be built in such
a way that they can be ventilated and cleaned.
• Handling molten metal, dross or slag Hazard Description: Burns may occur at many points in the steel-making process: at the
front of the furnace during tapping from molten metal or slag; from spills, spatters or
eruptions of hot metal from ladles or vessels during processing, teeming (pouring) or
transporting; and from contact with hot metal as it is being formed into a final product.
Assessment of risk: The likelihood of injury in the handling of molten metal shall be
assessed at all stages in the process. This includes the integrity, stability and use of the
furnace and transport ladles, the nature and use of vehicle/crane transport, and the
systems in place for pouring molten metal.
Control Strategies:
1. Personnel handling molten metal shall be trained in the proper procedures to
adopt, and in the relevant safety and health precautions, including use of
appropriate PPE.
2. Only essential personnel shall be in the vicinity of pouring operations.
3. Moulds and tundishes shall not be damp, nor shall there be any means whereby
water may enter the melt because of the risk of explosion.
4. The area will be cordoned off prior to the transport of molten metal if there is a
possibility of spillage.
5. A competent person shall regularly inspect ladle buckets and their supporting,
locking and tipping mechanisms.
6. Corrective repair measures that are recommended shall be planned and
implemented on a timely basis.
• Rolling Mill Hazard Description: In any rolling mill, there is a risk of trapping between the rolls.
Severe injuries may be caused by shearing, cropping, trimming and guillotine machines,
unless the dangerous parts are securely guarded. Injuries may occur, especially in hot-
rolling, if workers attempt to cross roller conveyors at unauthorized points. Even in
automated works, accidents occur in conversion work while changing heavy rollers in
the stands. In hot-rolling, burns, eye injuries or other injuries may be caused by flying
mill scale and dust particles or by whipping of cable slings. Eyes may also be affected by
glare.
Control Strategies:
1. Nips of rolls shall be effectively guarded based on an appropriate risk
assessment, and strict supervision exercised to prevent any work which is in
motion.
2. Dangerous parts shall be securely guarded to prevent severe injuries caused by
shearing, cropping, trimming and guillotine machines.
3. Good planning often reduces the number of roll changes required. The change of
heavy rollers in the stands shall not be done with time pressure and without
suitable tools.
• Internal Transport
Hazard Description: The hazards can be caused by interaction between
vehicles, vehicles and other objects and personnel, or by loads falling off or
from the vehicle. Control strategies:
1. Operators shall have the necessary knowledge of the hazards and potential risks
concerning the transportation of cargo.
2. Operators of certain types of vehicles may require regular medical surveillance.
3. Contractors and other visitors shall be appropriately instructed about the
hazards and potential risks. They shall be instructed about the rules of how to
move in the area.
4. Transport routes shall be planned and constructed to minimize the risk of
collision and with sufficient safe clearance to allow for aisles and turns, or other
types of control area.
5. The safe operating speed for vehicles shall be posted and enforced. The operator
shall be protected from cargo, such as molten metal splashes, chemicals and
unsecured cargo. Loads shall be lowered slowly and smoothly.
6. Lifting devices shall be made of steel that is not prone to hydrogen
embrittlement and shall be shielded from radiant heat. Workstations shall not be
located underneath the path of molten material.
• Personal Protective Equipment (PPE)
• General provisions PPE shall be selected considering the characteristics of the wearer and additional
physiological load or other harmful effects caused by the PPE. It shall be used,
maintained, stored and replaced in accordance with the standards or guidance.
PPE shall be examined periodically to ensure that it is in good condition. Employer shall
ensure that the workers who are required to wear PPE are fully informed of the
requirements and of the reasons for them, and are given adequate training in the
selection, wearing, maintenance and storage of this equipment. When workers have
been informed accordingly, they shall use the equipment provided throughout the time
they may be exposed to the risk that requires the use of PPE for protection.
The PPE shall not be used for longer than the time indicated by the manufacturer.
Workers shall make proper use of the PPE provided, and maintain it in good condition,
consistent with their training and be provided with the proper means for doing so.
Before reissuing the clothing or equipment, employers shall provide for the laundering,
cleaning, disinfecting and examination of protective clothing or equipment which has
been used and may be contaminated by materials that are hazardous to health.
Employers shall ensure that workers do not take contaminated clothing home and shall
provide for the cleaning of such clothing at no cost to the worker.
• Head protection Helmets intended for use in the metallurgical industry shall be subjected to a test for
resistance to splashes of molten metal. If splits or cracks appear, or if a helmet shows
signs of ageing or deterioration of the harness, the helmet shall be discard
• Face and eye protection
Goggles, helmets or shields that give maximum eye protection for each
welding and cutting process shall be worn by operators, welders and their
helpers. Welding and cutting processes of furnaces emit radiation in the
ultraviolet, visible and infrared bands of the spectrum, which are all able to
produce harmful effects upon the eyes. In welding operations, helmet type
protection and hand shield type protection shall be used. Protection is also
necessary for the welder’s assistant and those who may be exposed to the
hazards shall be appropriately protected.
• Leg Protection
Shoes or boots shall be without tongues and trouser legs shall be pulled over
the top of the boot and not tucked inside. Slip-resistance properties shall be
taken into account when choosing footwear. Rubber or metallic spats, gaiters
or leggings shall be used to protect the leg above the shoe line, especially from
risks of burns. Knee protectors may be necessary, especially where work
involves kneeling. Aluminized heat-protective shoes, boots or leggings shall be
used near sources of intense heat. All professional footwear shall be kept clean
and dry when not in use and shall be replaced as soon as necessary.
• Hearing protection
Hearing loss of speech frequencies may occur with elevated long-term
exposure to noise. The use of hearing protectors gives the best results to users
who are well informed of the risks and trained in their use. If earplugs are
used, special attention shall be paid to the proper fitting technique.
Hearing protectors shall be made available at the entrance to the noisy area
and they shall be put on before entering the noisy area. Noisy areas shall be
indicated by appropriate signs.
• Work clothing
Where required on the basis of a risk assessment, workers shall wear the
appropriate protective clothing provided by the employer. The selection of protective clothing shall take into account: (a) The adequacy of the design and the fit of the clothing, allowing freedom of
movement to perform tasks, and whether it is suitable for the intended use; (b) Te environment in which it will be worn, including the ability of the
material from which it is made to resist penetration by chemicals, minimize
heat stress, release dust, resist catching fire and not discharge static
electricity; and (c) Te special requirements of workers exposed to molten metal and
associated hazards, such as the need for reflective clothing or insulated
clothing with reflective surfaces during exposure to high radiant heat and hot
air.
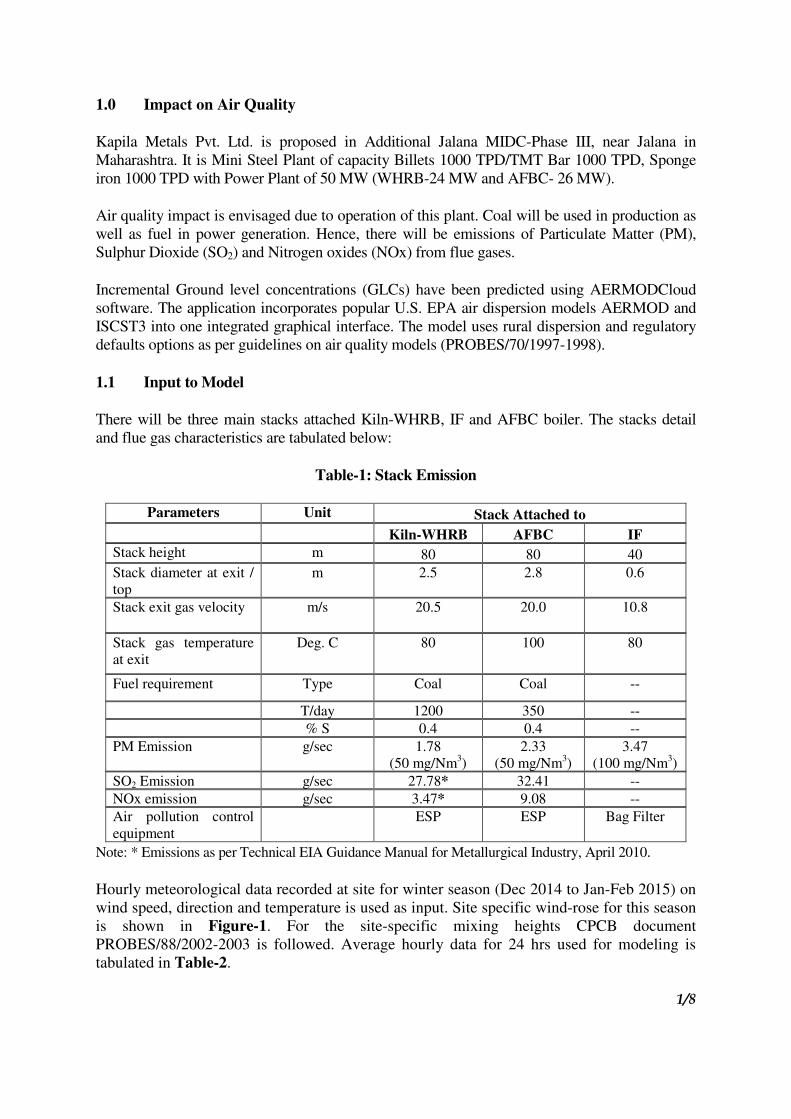
1/8
1.0 Impact on Air Quality
Kapila Metals Pvt. Ltd. is proposed in Additional Jalana MIDC-Phase III, near Jalana in
Maharashtra. It is Mini Steel Plant of capacity Billets 1000 TPD/TMT Bar 1000 TPD, Sponge
iron 1000 TPD with Power Plant of 50 MW (WHRB-24 MW and AFBC- 26 MW).
Air quality impact is envisaged due to operation of this plant. Coal will be used in production as
well as fuel in power generation. Hence, there will be emissions of Particulate Matter (PM),
Sulphur Dioxide (SO2) and Nitrogen oxides (NOx) from flue gases.
Incremental Ground level concentrations (GLCs) have been predicted using AERMODCloud
software. The application incorporates popular U.S. EPA air dispersion models AERMOD and
ISCST3 into one integrated graphical interface. The model uses rural dispersion and regulatory
defaults options as per guidelines on air quality models (PROBES/70/1997-1998).
1.1 Input to Model
There will be three main stacks attached Kiln-WHRB, IF and AFBC boiler. The stacks detail
and flue gas characteristics are tabulated below:
Table-1: Stack Emission
Parameters Unit Stack Attached to
Kiln-WHRB AFBC IF
Stack height m 80 80 40
Stack diameter at exit /
top
m 2.5 2.8 0.6
Stack exit gas velocity m/s 20.5 20.0 10.8
Stack gas temperature
at exit
Deg. C 80 100 80
Fuel requirement Type Coal Coal --
T/day 1200 350 --
% S 0.4 0.4 --
PM Emission g/sec 1.78
(50 mg/Nm3)
2.33
(50 mg/Nm3)
3.47
(100 mg/Nm3)
SO2 Emission g/sec 27.78* 32.41 --
NOx emission g/sec 3.47* 9.08 --
Air pollution control
equipment
ESP ESP Bag Filter
Note: * Emissions as per Technical EIA Guidance Manual for Metallurgical Industry, April 2010.
Hourly meteorological data recorded at site for winter season (Dec 2014 to Jan-Feb 2015) on
wind speed, direction and temperature is used as input. Site specific wind-rose for this season
is shown in Figure-1. For the site-specific mixing heights CPCB document
PROBES/88/2002-2003 is followed. Average hourly data for 24 hrs used for modeling is
tabulated in Table-2.
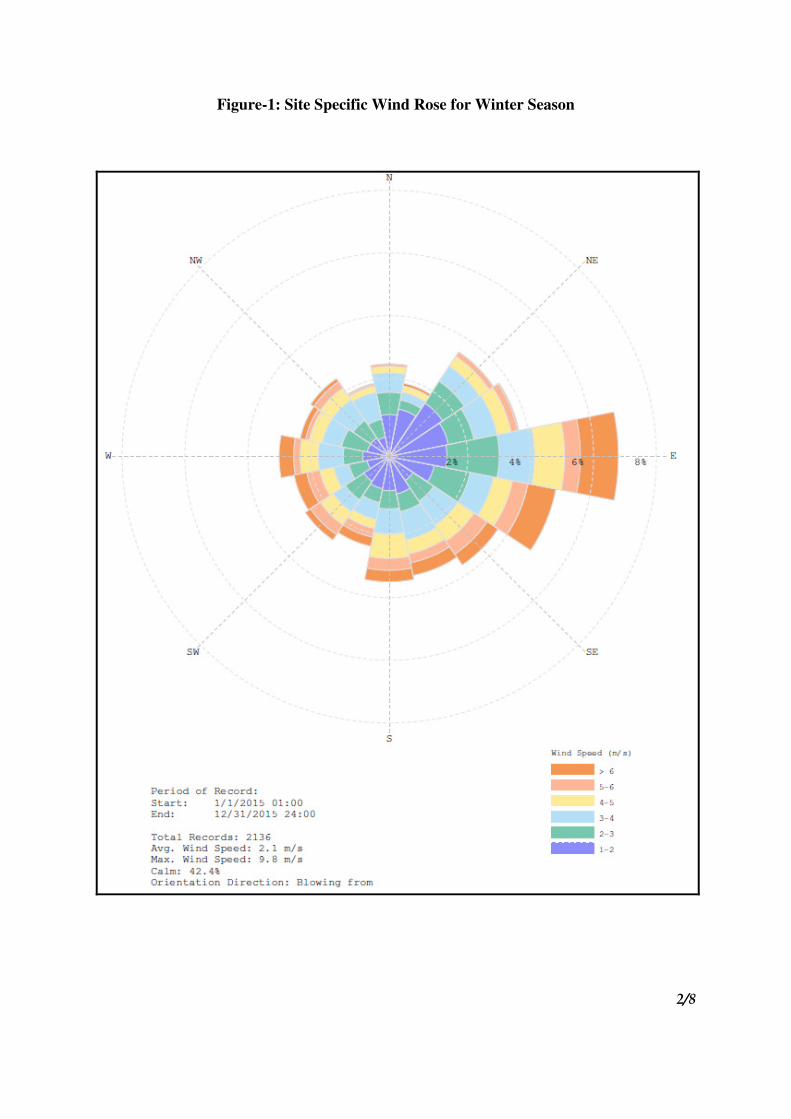
2/8
Figure-1: Site Specific Wind Rose for Winter Season
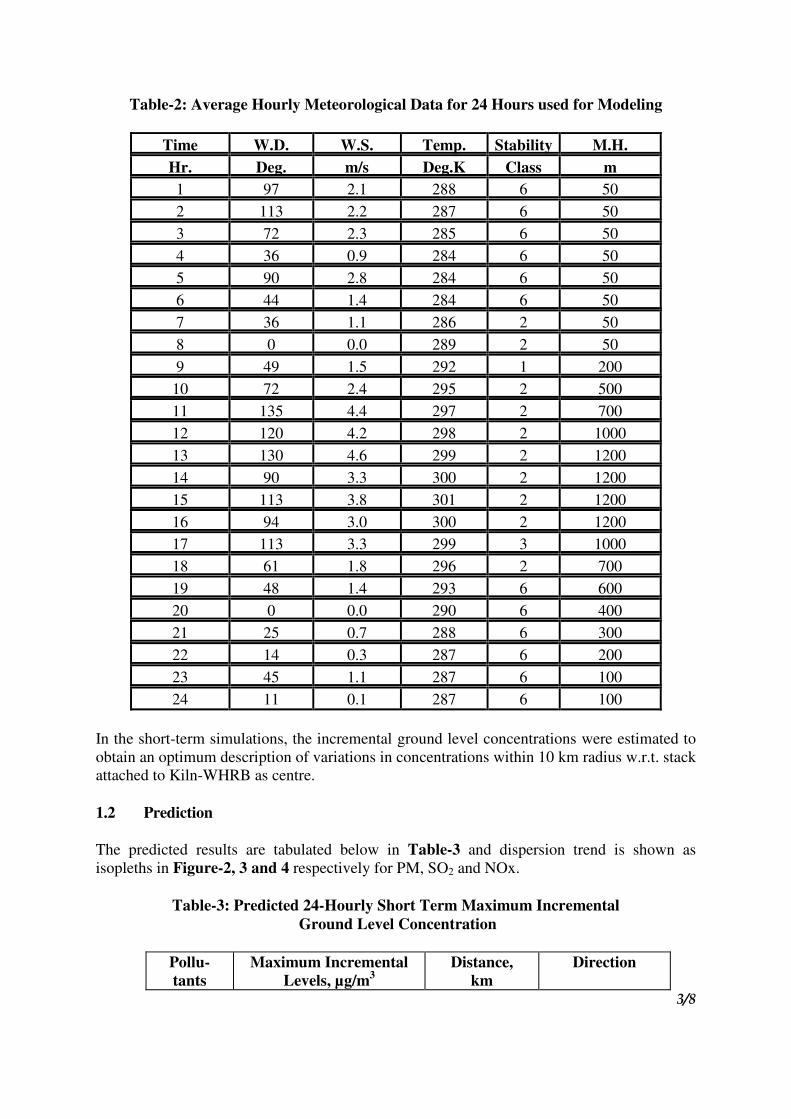
3/8
Table-2: Average Hourly Meteorological Data for 24 Hours used for Modeling
Time W.D. W.S. Temp. Stability M.H.
Hr. Deg. m/s Deg.K Class m
1 97 2.1 288 6 50
2 113 2.2 287 6 50
3 72 2.3 285 6 50
4 36 0.9 284 6 50
5 90 2.8 284 6 50
6 44 1.4 284 6 50
7 36 1.1 286 2 50
8 0 0.0 289 2 50
9 49 1.5 292 1 200
10 72 2.4 295 2 500
11 135 4.4 297 2 700
12 120 4.2 298 2 1000
13 130 4.6 299 2 1200
14 90 3.3 300 2 1200
15 113 3.8 301 2 1200
16 94 3.0 300 2 1200
17 113 3.3 299 3 1000
18 61 1.8 296 2 700
19 48 1.4 293 6 600
20 0 0.0 290 6 400
21 25 0.7 288 6 300
22 14 0.3 287 6 200
23 45 1.1 287 6 100
24 11 0.1 287 6 100
In the short-term simulations, the incremental ground level concentrations were estimated to
obtain an optimum description of variations in concentrations within 10 km radius w.r.t. stack
attached to Kiln-WHRB as centre.
1.2 Prediction
The predicted results are tabulated below in Table-3 and dispersion trend is shown as
isopleths in Figure-2, 3 and 4 respectively for PM, SO2 and NOx.
Table-3: Predicted 24-Hourly Short Term Maximum Incremental
Ground Level Concentration
Pollu-
tants
Maximum Incremental
Levels, µg/m3
Distance,
km
Direction
4/8
Pollu-
tants
Maximum Incremental
Levels, µg/m3
Distance,
km
Direction
PM 8.3 1.0 W
SO2 18.7 2.0 W
NOx 4.1 2.0 W
The maximum incremental GLC (Refer Table-3) of PM, SO2 and NOx is superimposed on the
baseline concentrations recorded during the study period to arrive at the likely resultant
concentrations after 100% operation of the proposed plant. The cumulative concentration
(baseline + incremental) is tabulated below in Table-4 while resultant concentrations at ambient
air quality monitoring (AAQM) locations are tabulated in Table-5.
Table-4: Resultant Concentrations within Study area
Sce-
nario
Incremental
Concentrations,
µµµµg/m3
Baseline
Concentrations,**
µµµµg/m3
Resultant
Concentrations,
µµµµg/m3
CPCB Limit for
Industrial, Residential,
Rural & Other Area,
µµµµg/m3
PM 8.3 69.18 77.48 100
SO2 18.7 14.88 33.58 80
NOx 4.1 18.82 22.92 80
** -Avg. Baseline concentration in study area
1.3 Impact Assessment
Ambient air quality in study area w.r.t. PM, SO2 and NOx is within NAAQS 2009 as seen from
Table-4 & 5. Hence, any significant impact is not envisaged within study area.
2.0 Mitigation Measures
Ambient air quality will be within NAAQS 2009 as mentioned above. ESPs and Bag Filter are
proposed as air pollution control measures. Also, stacks of adequate height are proposed to
disperse the flue gas.
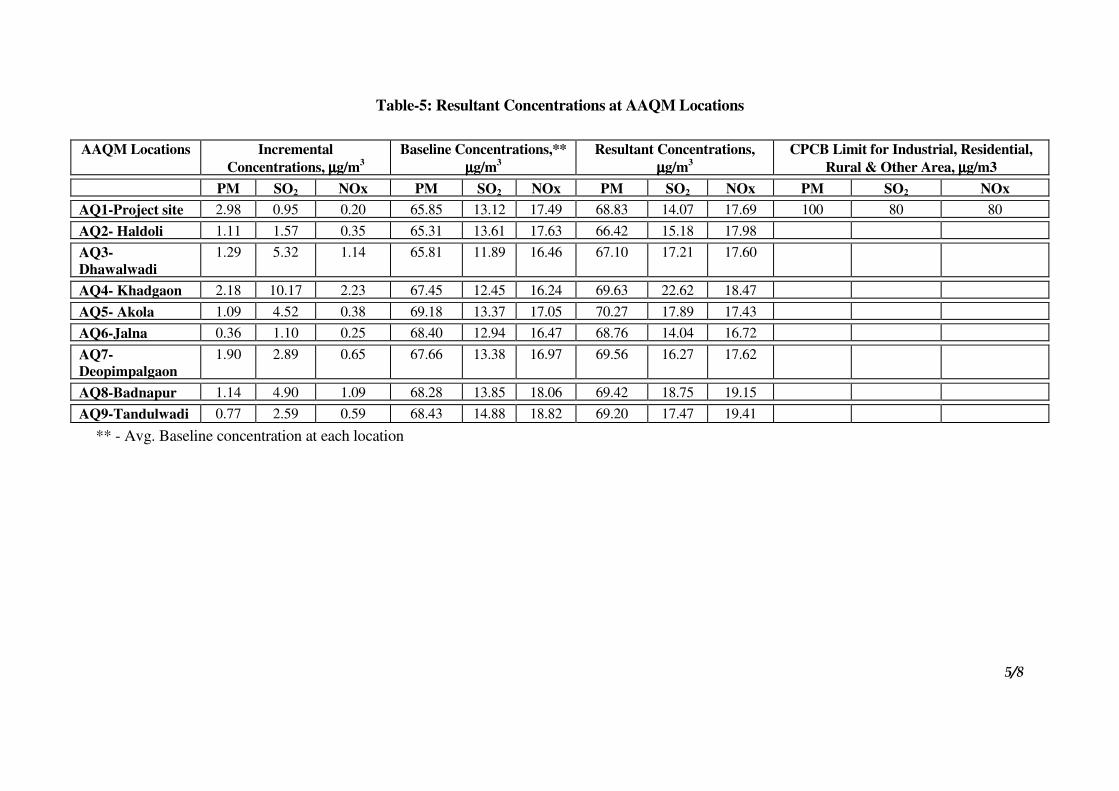
5/8
Table-5: Resultant Concentrations at AAQM Locations
AAQM Locations Incremental
Concentrations, µµµµg/m3
Baseline Concentrations,**
µµµµg/m3
Resultant Concentrations,
µµµµg/m3
CPCB Limit for Industrial, Residential,
Rural & Other Area, µµµµg/m3
PM SO2 NOx PM SO2 NOx PM SO2 NOx PM SO2 NOx
AQ1-Project site 2.98 0.95 0.20 65.85 13.12 17.49 68.83 14.07 17.69 100 80 80
AQ2- Haldoli 1.11 1.57 0.35 65.31 13.61 17.63 66.42 15.18 17.98
AQ3-
Dhawalwadi
1.29 5.32 1.14 65.81 11.89 16.46 67.10 17.21 17.60
AQ4- Khadgaon 2.18 10.17 2.23 67.45 12.45 16.24 69.63 22.62 18.47
AQ5- Akola 1.09 4.52 0.38 69.18 13.37 17.05 70.27 17.89 17.43
AQ6-Jalna 0.36 1.10 0.25 68.40 12.94 16.47 68.76 14.04 16.72
AQ7-
Deopimpalgaon
1.90 2.89 0.65 67.66 13.38 16.97 69.56 16.27 17.62
AQ8-Badnapur 1.14 4.90 1.09 68.28 13.85 18.06 69.42 18.75 19.15
AQ9-Tandulwadi 0.77 2.59 0.59 68.43 14.88 18.82 69.20 17.47 19.41
** - Avg. Baseline concentration at each location
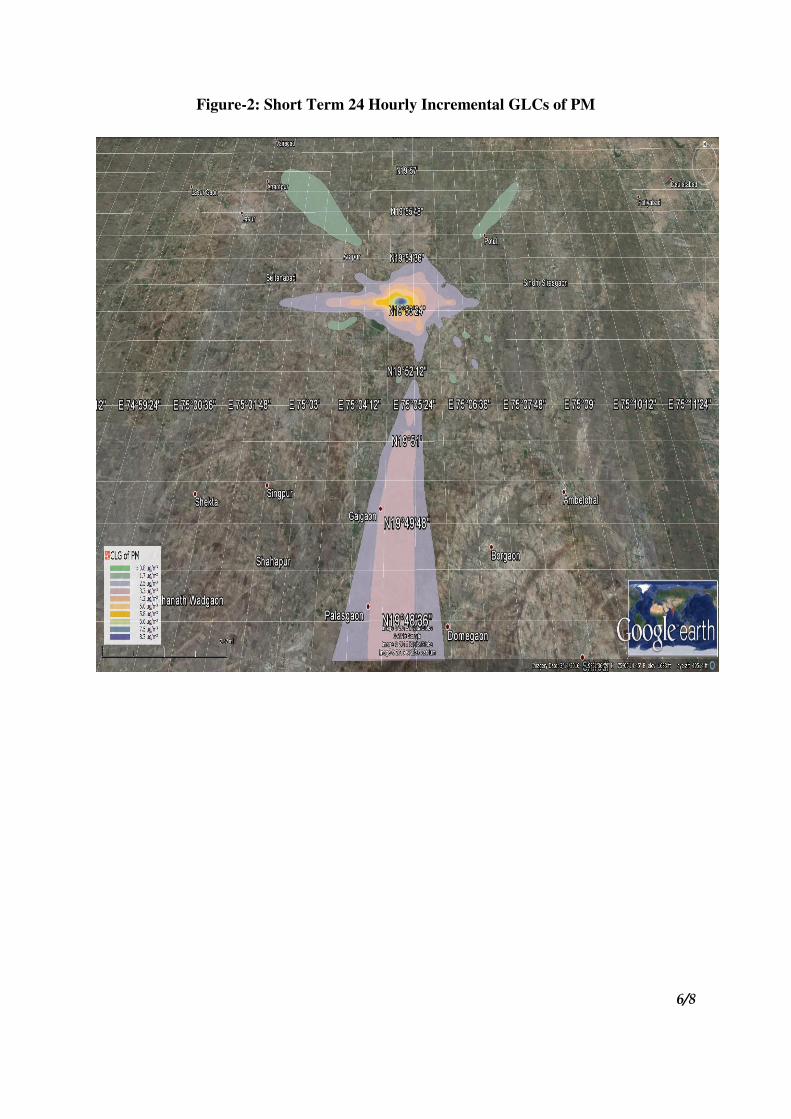
6/8
Figure-2: Short Term 24 Hourly Incremental GLCs of PM
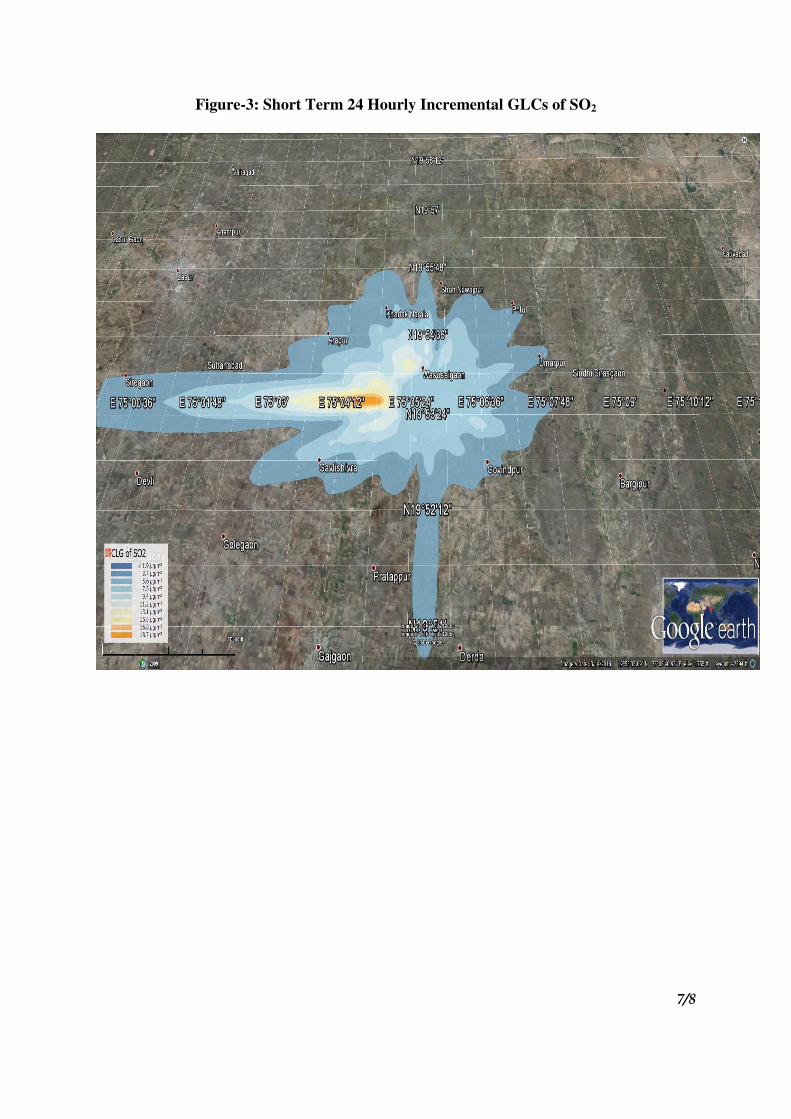
7/8
Figure-3: Short Term 24 Hourly Incremental GLCs of SO2
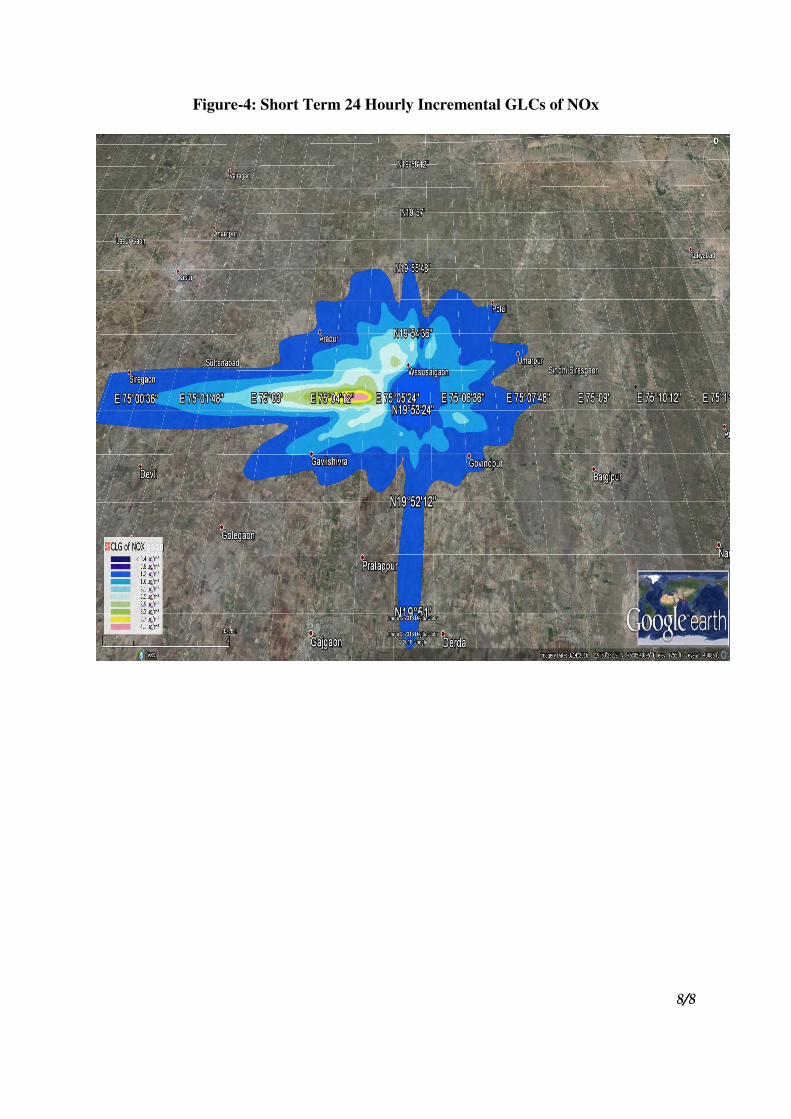
8/8
Figure-4: Short Term 24 Hourly Incremental GLCs of NOx
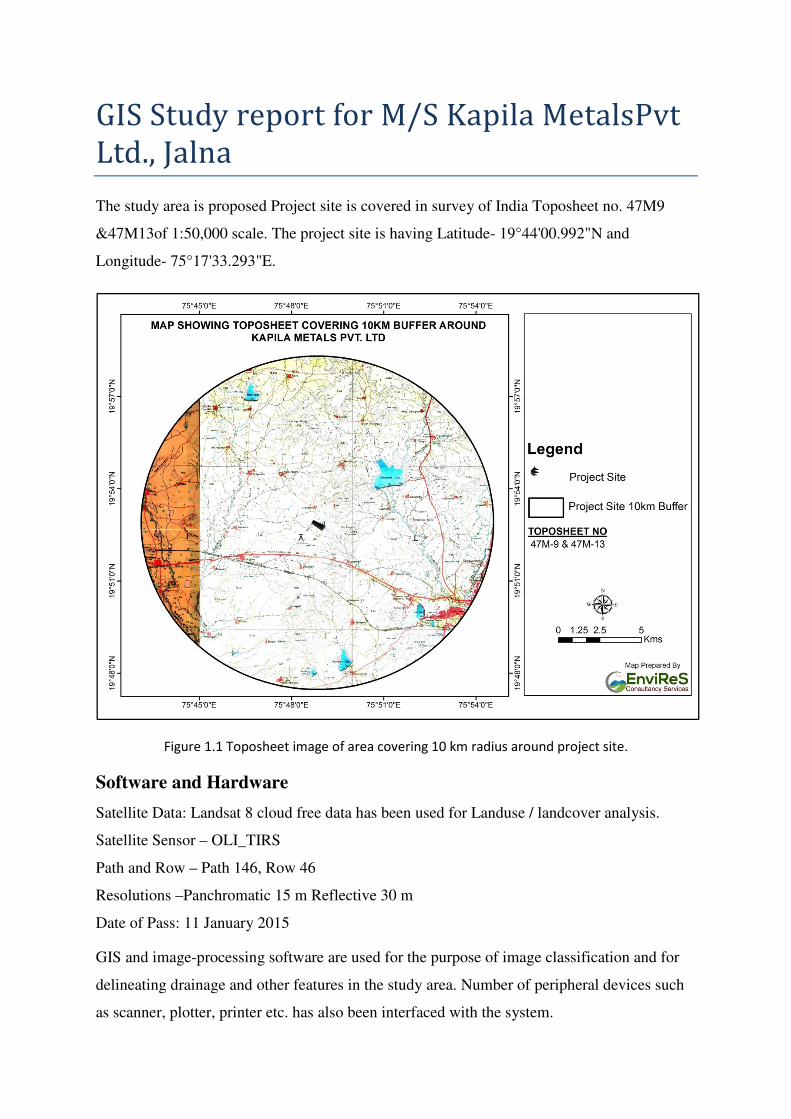
GIS Study report for M/S Kapila MetalsPvt
Ltd., Jalna
The study area is proposed Project site is covered in survey of India Toposheet no. 47M9
&47M13of 1:50,000 scale. The project site is having Latitude- 19°44'00.992"N and
Longitude- 75°17'33.293"E.
Figure 1.1 Toposheet image of area covering 10 km radius around project site.
Software and Hardware
Satellite Data: Landsat 8 cloud free data has been used for Landuse / landcover analysis.
Satellite Sensor – OLI_TIRS
Path and Row – Path 146, Row 46
Resolutions –Panchromatic 15 m Reflective 30 m
Date of Pass: 11 January 2015
GIS and image-processing software are used for the purpose of image classification and for
delineating drainage and other features in the study area. Number of peripheral devices such
as scanner, plotter, printer etc. has also been interfaced with the system.
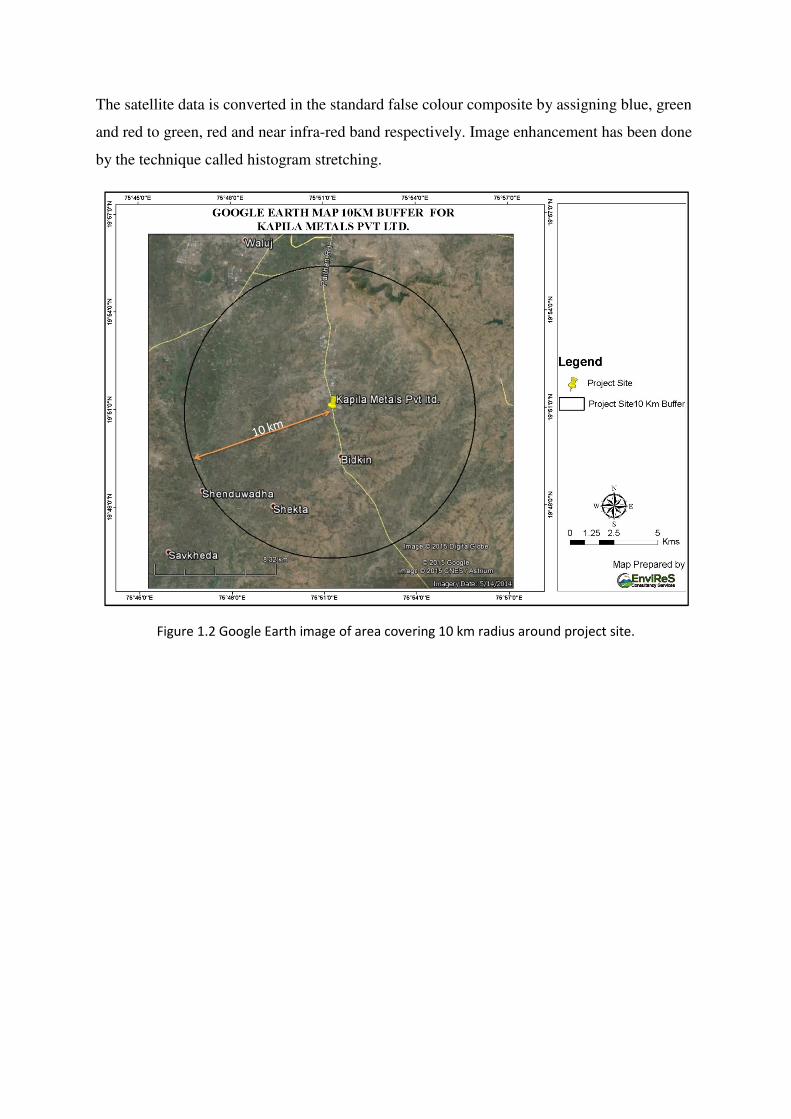
The satellite data is converted in the standard false colour composite by assigning blue, green
and red to green, red and near infra-red band respectively. Image enhancement has been done
by the technique called histogram stretching.
Figure 1.2 Google Earth image of area covering 10 km radius around project site.
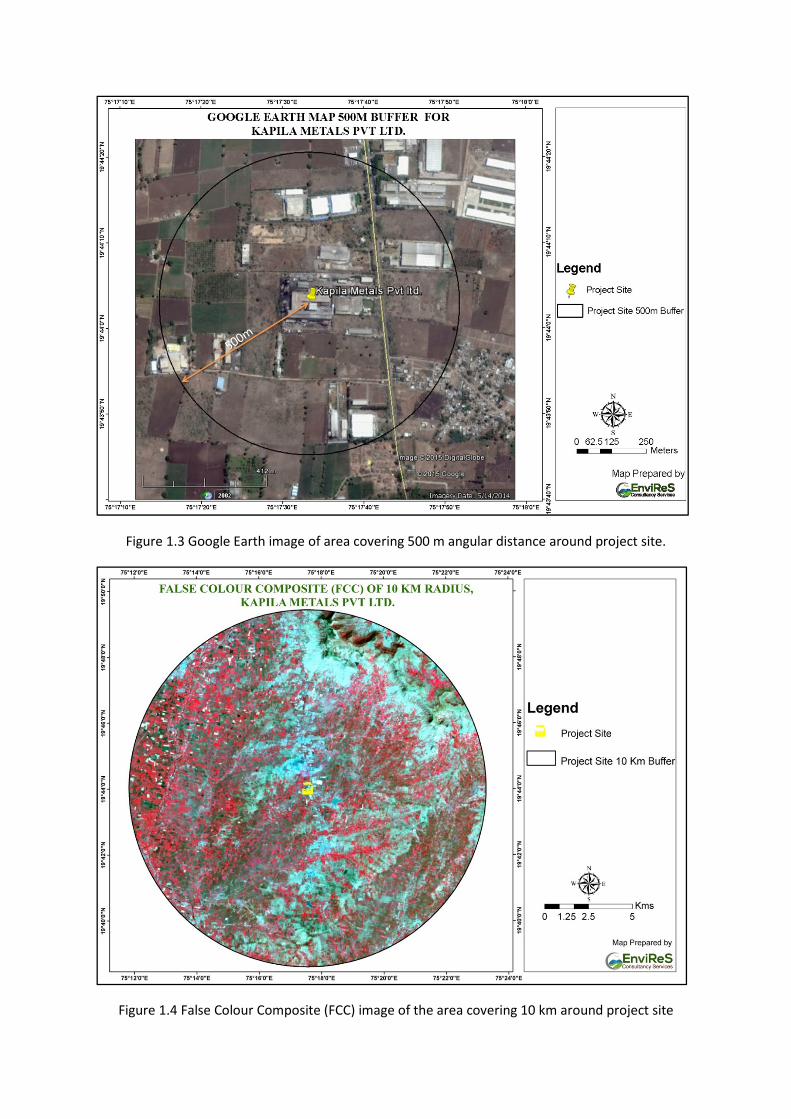
Figure 1.3 Google Earth image of area covering 500 m angular distance around project site.
Figure 1.4 False Colour Composite (FCC) image of the area covering 10 km around project site
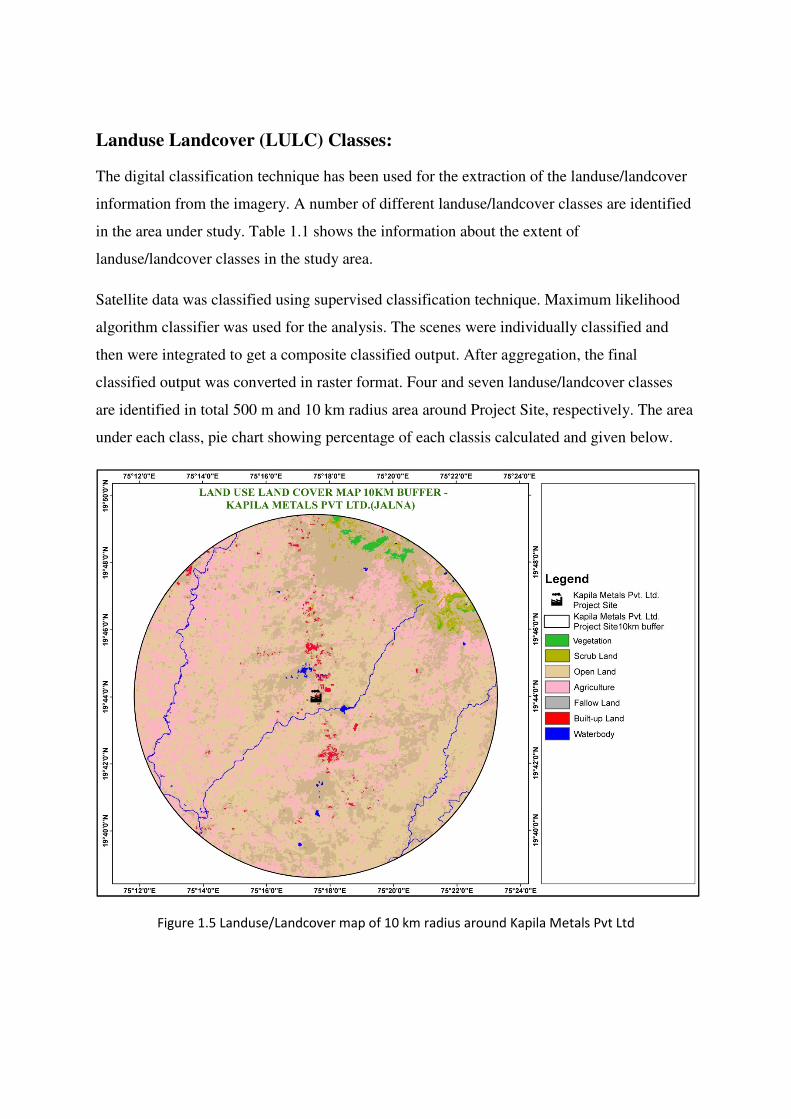
Landuse Landcover (LULC) Classes:
The digital classification technique has been used for the extraction of the landuse/landcover
information from the imagery. A number of different landuse/landcover classes are identified
in the area under study. Table 1.1 shows the information about the extent of
landuse/landcover classes in the study area.
Satellite data was classified using supervised classification technique. Maximum likelihood
algorithm classifier was used for the analysis. The scenes were individually classified and
then were integrated to get a composite classified output. After aggregation, the final
classified output was converted in raster format. Four and seven landuse/landcover classes
are identified in total 500 m and 10 km radius area around Project Site, respectively. The area
under each class, pie chart showing percentage of each classis calculated and given below.
Figure 1.5 Landuse/Landcover map of 10 km radius around Kapila Metals Pvt Ltd
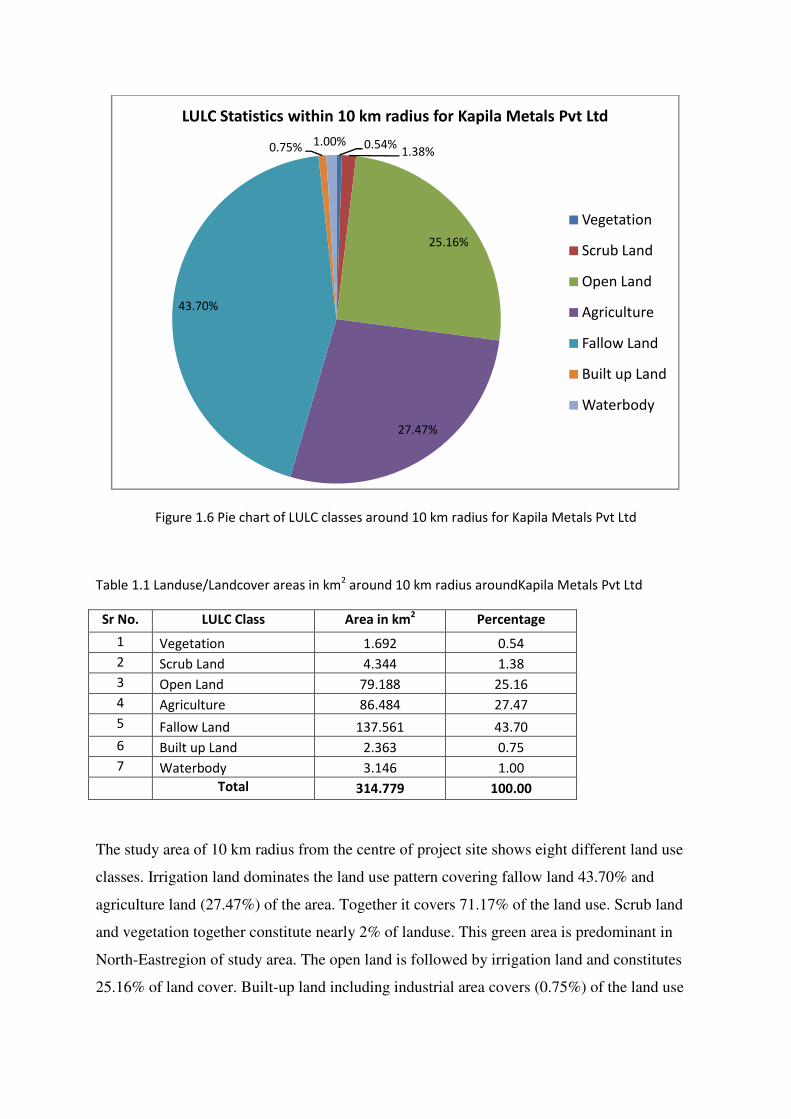
Figure 1.6 Pie chart of LULC classes around 10 km radius for Kapila Metals Pvt Ltd
Table 1.1 Landuse/Landcover areas in km2 around 10 km radius aroundKapila Metals Pvt Ltd
Sr No. LULC Class Area in km2 Percentage
1 Vegetation 1.692 0.54
2 Scrub Land 4.344 1.38
3 Open Land 79.188 25.16
4 Agriculture 86.484 27.47
5 Fallow Land 137.561 43.70
6 Built up Land 2.363 0.75
7 Waterbody 3.146 1.00
Total 314.779 100.00
The study area of 10 km radius from the centre of project site shows eight different land use
classes. Irrigation land dominates the land use pattern covering fallow land 43.70% and
agriculture land (27.47%) of the area. Together it covers 71.17% of the land use. Scrub land
and vegetation together constitute nearly 2% of landuse. This green area is predominant in
North-Eastregion of study area. The open land is followed by irrigation land and constitutes
25.16% of land cover. Built-up land including industrial area covers (0.75%) of the land use
0.54%1.38%
25.16%
27.47%
43.70%
0.75% 1.00%
LULC Statistics within 10 km radius for Kapila Metals Pvt Ltd
Vegetation
Scrub Land
Open Land
Agriculture
Fallow Land
Built up Land
Waterbody
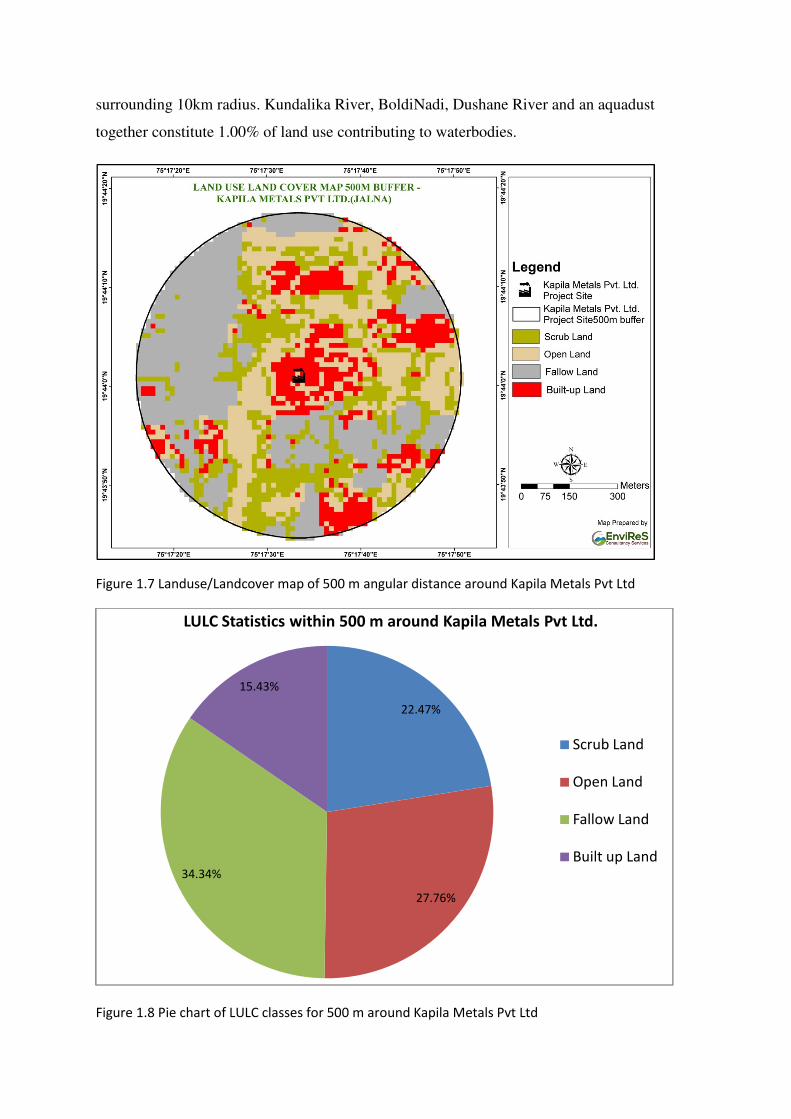
surrounding 10km radius. Kundalika River, BoldiNadi, Dushane River and an aquadust
together constitute 1.00% of land use contributing to waterbodies.
Figure 1.7 Landuse/Landcover map of 500 m angular distance around Kapila Metals Pvt Ltd
Figure 1.8 Pie chart of LULC classes for 500 m around Kapila Metals Pvt Ltd
22.47%
27.76%
34.34%
15.43%
LULC Statistics within 500 m around Kapila Metals Pvt Ltd.
Scrub Land
Open Land
Fallow Land
Built up Land
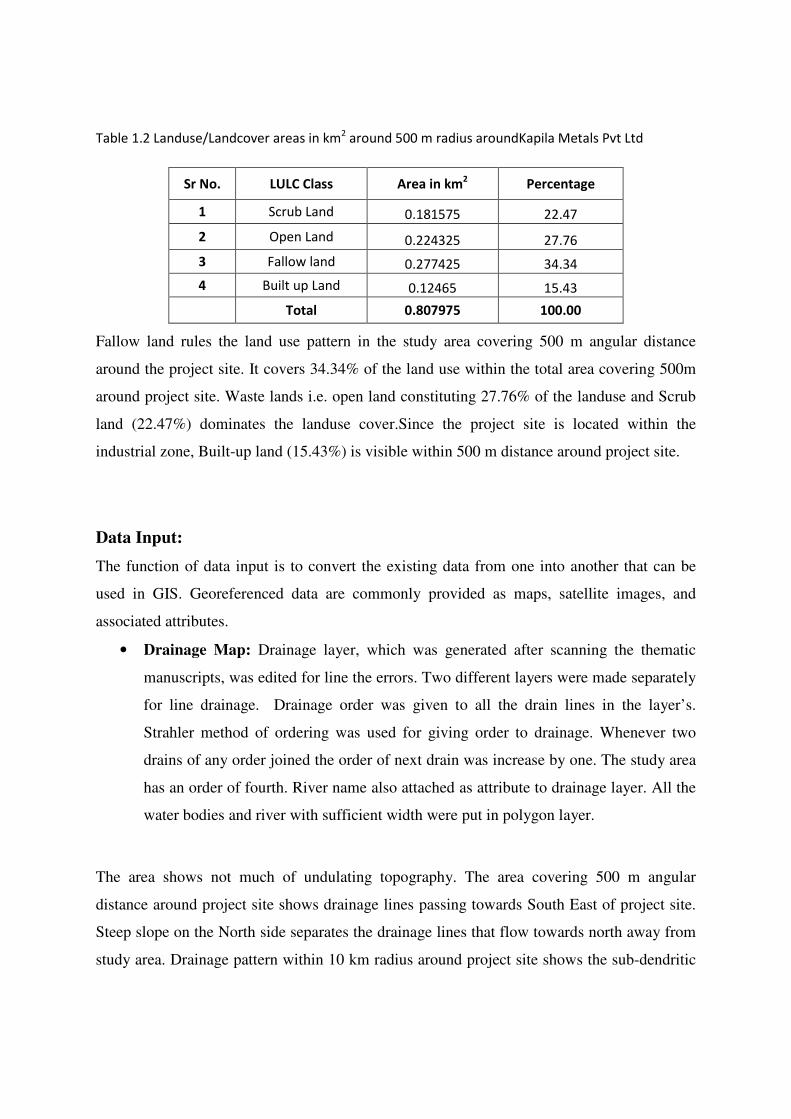
Table 1.2 Landuse/Landcover areas in km2 around 500 m radius aroundKapila Metals Pvt Ltd
Fallow land rules the land use pattern in the study area covering 500 m angular distance
around the project site. It covers 34.34% of the land use within the total area covering 500m
around project site. Waste lands i.e. open land constituting 27.76% of the landuse and Scrub
land (22.47%) dominates the landuse cover.Since the project site is located within the
industrial zone, Built-up land (15.43%) is visible within 500 m distance around project site.
Data Input:
The function of data input is to convert the existing data from one into another that can be
used in GIS. Georeferenced data are commonly provided as maps, satellite images, and
associated attributes.
• Drainage Map: Drainage layer, which was generated after scanning the thematic
manuscripts, was edited for line the errors. Two different layers were made separately
for line drainage. Drainage order was given to all the drain lines in the layer’s.
Strahler method of ordering was used for giving order to drainage. Whenever two
drains of any order joined the order of next drain was increase by one. The study area
has an order of fourth. River name also attached as attribute to drainage layer. All the
water bodies and river with sufficient width were put in polygon layer.
The area shows not much of undulating topography. The area covering 500 m angular
distance around project site shows drainage lines passing towards South East of project site.
Steep slope on the North side separates the drainage lines that flow towards north away from
study area. Drainage pattern within 10 km radius around project site shows the sub-dendritic
Sr No. LULC Class Area in km2 Percentage
1 Scrub Land 0.181575 22.47
2 Open Land 0.224325 27.76
3 Fallow land 0.277425 34.34
4 Built up Land 0.12465 15.43
Total 0.807975 100.00
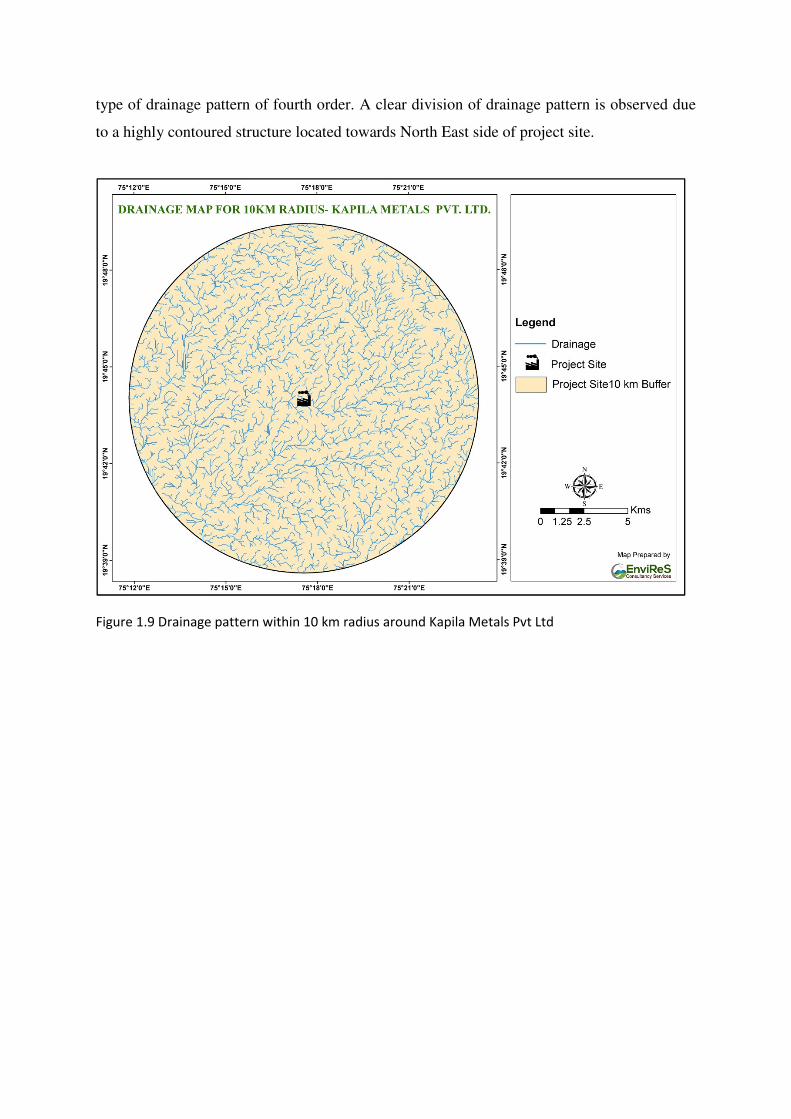
type of drainage pattern of fourth order. A clear division of drainage pattern is observed due
to a highly contoured structure located towards North East side of project site.
Figure 1.9 Drainage pattern within 10 km radius around Kapila Metals Pvt Ltd
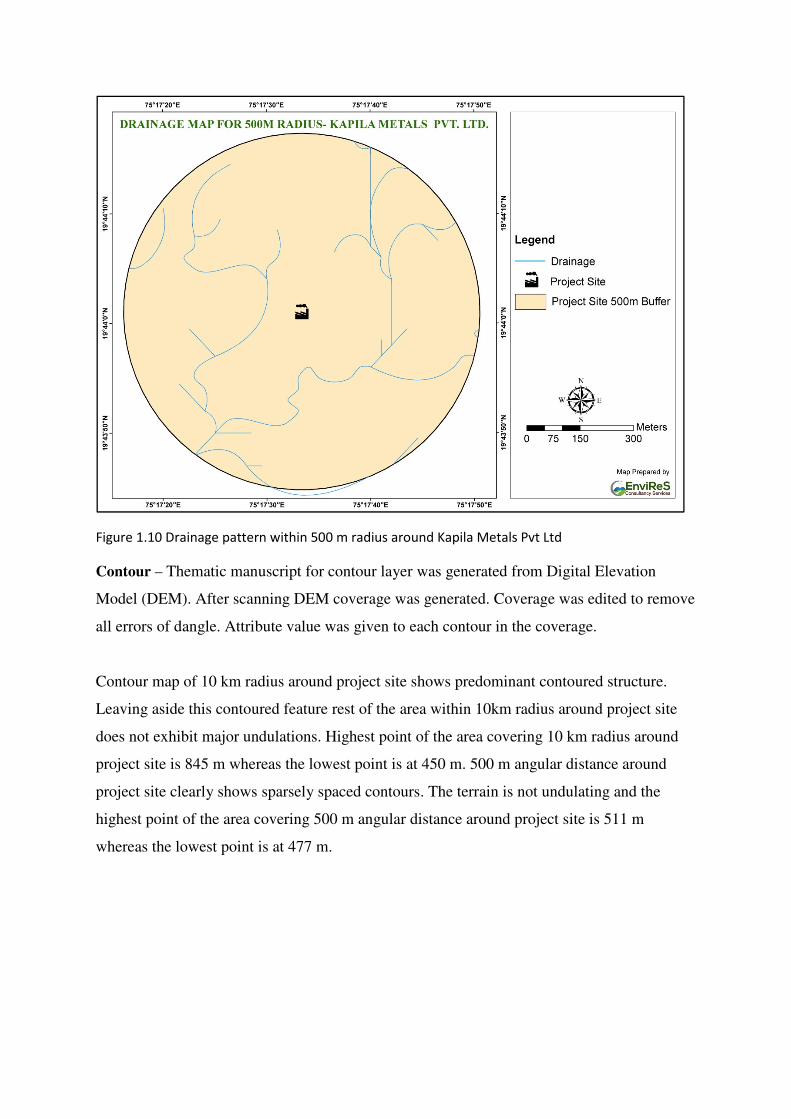
Figure 1.10 Drainage pattern within 500 m radius around Kapila Metals Pvt Ltd
Contour – Thematic manuscript for contour layer was generated from Digital Elevation
Model (DEM). After scanning DEM coverage was generated. Coverage was edited to remove
all errors of dangle. Attribute value was given to each contour in the coverage.
Contour map of 10 km radius around project site shows predominant contoured structure.
Leaving aside this contoured feature rest of the area within 10km radius around project site
does not exhibit major undulations. Highest point of the area covering 10 km radius around
project site is 845 m whereas the lowest point is at 450 m. 500 m angular distance around
project site clearly shows sparsely spaced contours. The terrain is not undulating and the
highest point of the area covering 500 m angular distance around project site is 511 m
whereas the lowest point is at 477 m.
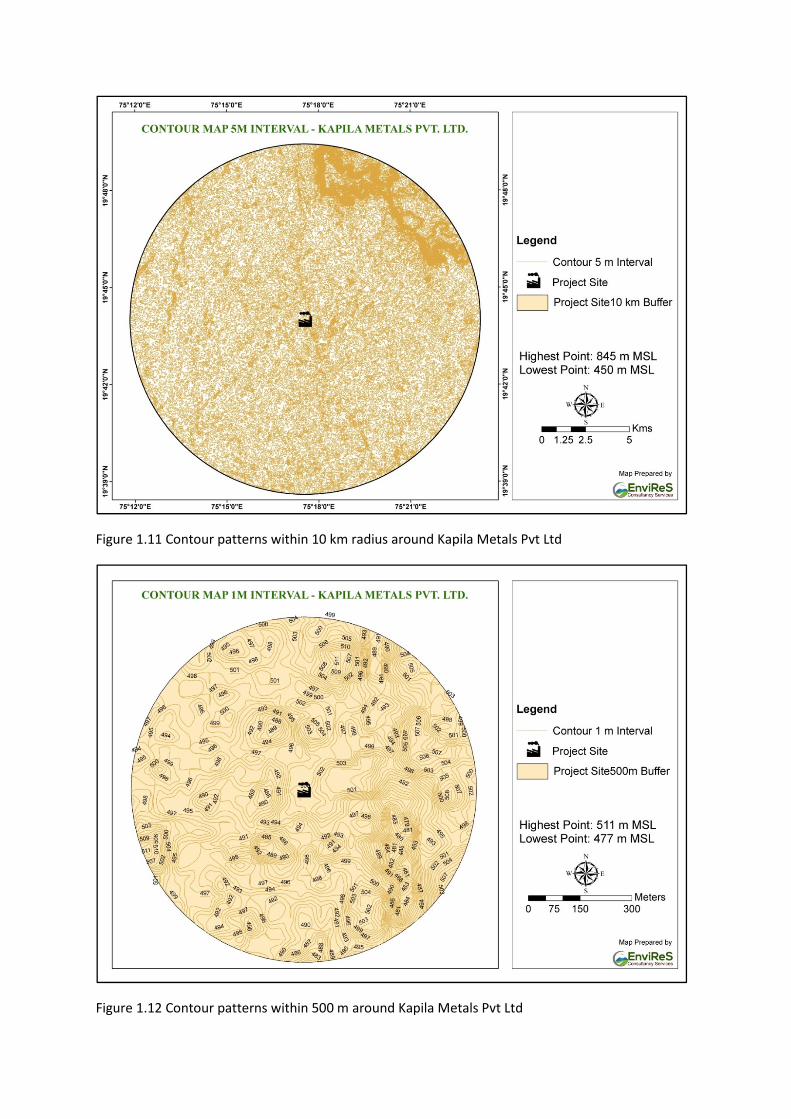
Figure 1.11 Contour patterns within 10 km radius around Kapila Metals Pvt Ltd
Figure 1.12 Contour patterns within 500 m around Kapila Metals Pvt Ltd
1. Disaster Management Plant
1.1 Disaster
A disaster is a catastrophic situation in which suddenly, people are plunged into
helplessness and suffering, as a result, need protection, clothing, shelter, medical and
social care and other necessities of life.
Disasters can be divided into two main groups. In the first, disasters resulting from
natural phenomena like earthquakes, volcanic eruptions, storm surges, cyclones, tropical
storms, floods, avalanches, landslides, forest fires etc.
The second group includes disastrous events occasioned by man, or man’s impact upon
the environment. Examples are armed conflict, industrial accidents, radiation accidents,
factory fires, explosions and escape of toxic gases or chemical substances, river
pollution, mining or other structural collapses, air, sea, rail and road transport accidents
and can reach catastrophic dimensions in terms of human loss.
There can be no set criteria for assessing the gravity of a disaster in the abstract since this
depends to a large extent on the physical, economic and social environment in which it
occurs. What would be considered a major disaster in a developing country, ill equipped
to cope with the problems involved, may not mean more than a temporary emergency
elsewhere.
1.2 Objectives of Disaster Management Plan (DMP)
The Disaster Management Plan is aimed to ensure safety of life, protection of
environment, protection of installation, restoration of production and salvage operations
in this same order of priorities. For effective implementation of the Disaster Management
Plan, it will be widely circulated and personnel training given through rehearsals/drills.
The Disaster Management Plan would reflect the probable, consequential severalties of
the undesired event due to deteriorating conditions or through ‘Knock on’ effects.
Further, the management should be able to demonstrate that their assessment of the
consequences uses good supporting evidence and is based on currently available and
reliable information, incident data from internal and external sources and if necessary the
reports of out side agencies.
To tackle the consequences of a major emergency inside the factory or immediate
vicinity of the factory, a Disaster Management Plan has to be formulated and this
planned emergency document is called “Disaster Management Plan”.
The objective of the Industrial Disaster Management Plan is to make use of the combined
resources of the plant and the outside services to achieve the following:
• Effect the rescue and medical treatment of casualties;
• Safeguard other people;
• Minimize damage to property and the environment;
• Initially contain and ultimately bring the incident under control;
• Identify any dead;
• Provide for needs of relatives;
• Provide authoritative information to the news media;
• Secure the safe rehabilitation of affected area; and
• Preserve relevant records and equipment for the subsequent inquiry into the cause and
circumstances of the Emergency.
In effect, it is to optimize operational efficiency to rescue rehabilitation and render
medical help and to restore normalcy.
1.3 Emergencies
1.3.1 General, Industrial Emergencies
The emergencies that could be envisaged in the plant and tank farm are as follows:
A situation of fire at tank farm of storage;
• Slow isolated fires;
• Fast spreading fires;
• Structural failures;
• Contamination of food/water; and
• Sabotage/Social disorder.
1.3.2 Specific Emergencies Anticipated
• Fire and Explosion
Fire consequences can be disastrous, since they involve quantities of fuel either stored or
in dynamic inventory in pipelines or in nearby areas. Toxic releases can affect persons
working around. Preliminary hazard analysis has provided a basis for consequences
estimation. Estimation can be made by using various pool fire, tank fire consequence
calculations. During the study of Risk Assessment, the natures of damages are worked
out and probability of occurrence of such hazards is also drawn up.
1.3.3 Emergency Organization
It is recommended to setup an Emergency Organization. A senior executive who has
control over the affairs of the plant would be heading the Emergency Organization. He
would be designated as Site Controller. As per the General Organization chart, would be
designated as the Incident Controller. In the case of stores, utilities, open areas, which are
not under the control of the Production Heads, Senior Executive responsible for
maintenance of utilities would be designated as Incident Controller. All the Incident
Controllers would be reporting to the Site Controller.
Each Incident Controller, for himself, organize a team responsible for controlling the
incidence with the personnel under his control. Shift Incharge would be the reporting
officer, who would bring the incidence to the notice of the Incidence Controller and Site
Controller.
Emergency Coordinators would be appointed who would undertake the responsibilities
like fire fighting, rescue, rehabilitation, transport and provide essential and support
services. For this purposes, Security Incharge, Personnel Department, Essential services
personnel would be engaged. All these personnel would be designated as Key personnel.
In each shift, electrical supervisor, electrical fitters, pump house Incharge, and other
maintenance staff would be drafted for emergency operations. In the event of power or
communication system failure, some of the staff members in the office/plant offices
would be drafted and their services would be utilized as messengers for quick passing of
communications. All these personnel would be declared as essential personnel.
1.3.4 Emergency Communication
Whoever notices an emergency situation such as fire, growth of fire, leakage etc. would
inform his immediate superior and Emergency Control Centre. The person on duty in the
Emergency Control Centre would appraise the Site Controller. Site Controller verifies
the situation from the Incident Controller of that area or the Shift Incharge and takes a
decision about an impending On Site Emergency. This would be communicated to all the
Incident Controllers, Emergency Coordinators. Simultaneously, the emergency warning
system would be activated on the instructions of the Site Controller.
1.3.5 Emergency Responsibilities
The responsibilities of the key personnel are appended below:
1.3.5.1 Site Controller
On receiving information about emergency he would rush to Emergency Control Centre
and take charge of ECC and the situation;
• Assesses the magnitude of the situation on the advice of incident controller and
decides;
• Whether the affected area needs to be evacuated;
• Whether personnel who are at assembly points need to be evacuated;
• Declares emergency and orders for operation of emergency siren;
• Organizes announcement by public address system about location of emergency;
• Assesses which areas are likely to be affected, or need to be evacuated or are to
be alerted;
• Maintains a continuous review of possible development and assesses the situation
in consultation with Incident Controller and other Key Personnel as to whether
shutting down the plant or any section of the plant is required and if evacuation of
persons is needed;
• Directs personnel for Rescue, rehabilitation, transport, fire, brigade, medical and
other designated mutual support systems locally available, for meeting
emergencies;
• Controls evacuation of affected areas, if the situation is likely to go out of control
or effects are likely to go beyond the premises of the factory, informs to district
emergency authority, police, hospital and seeks their intervention and help;
• Informs Inspector of Factories, Deputy Chief Inspector of Factories, PCB and
other statutory authorities;
• Gives a public statement in necessary;
• Keeps record of chronological events and prepares an investigation report and
preserves evidence; and
• On completion of On Site Emergency and restoration of normalcy, declares all
clear and orders for all clear warning.
1.3.5.2 Incident Controller
• Assembles the incident control team;
• Directs operations within the affected areas with the priorities for safety to
personnel, minimize damage to the plant, property and environment and
minimize the loss of materials;
• Directs the shutting down and evacuation of plant and areas likely to be adversely
affected by the emergency;
• Ensures that all key personnel help is sought;
• Provides advice and information to the Fire and Security Officer and the Local
Fire Services as and when they arrive;
• Ensures that all non-essential workers/staff of the affected areas evacuated to the
appropriate assembly points, and the areas are searched for causalities;
• Has regard to the need for preservation of evidence so as to facilitate any inquiry
into the causes and circumstances, which caused or escalated the emergency;
• Co-ordinates with emergency services at the site;
• Provides tools and safety equipment to the team members;
• Keeps in touch with the team and advise them regarding the method of control to
be used; and Keeps the Site Controller of Emergency informed of the progress
being made.
1.3.5.3Emergency Coordinator - Rescue, Fire Fighting
• On knowing about emergency, rushes to ECC;
• Helps the incident Controller in containment of the emergency;
• Ensure fire pumps in operating conditions and instructs pump house operator to
ready for any emergency with standby arrangement;
• Guides the fire fighting crew i.e. firemen, trained plant personnel and security
staff;
• Organizes shifting the fire fighting facilities to the emergency site, if required;
• Takes guidance of the Incident Controller for fire fighting as well as assesses the
requirements of outside help;
• Arranges to control the traffic at the gate and the incident area;
• Directs the security staff to the incident site to take part in the emergency
operations under his guidance and supervision;
• Evacuates the people in the plant or in the nearby areas as advised by Site
Controller;
• Searches for casualties and arranges proper aid for them;
• Assembles search and evacuation team;
• Arranges for safety equipment for the members of this team;
• Decides which paths the evacuated workers should follow; and
• Maintains law and order in the area, and if necessary seeks the help of police.
1.3.5.4 Emergency Coordinator-Medical, Mutual Aid, Rehabilitation, Transport and
Communication
• In the event of failure of electric supply and thereby internal telephone, sets up
communication point and establishes contact with the Emergency Control Center
(ECC)
• Organizes medical treatment to the injured and if necessary will shift the injured
to nearby hospitals
• Mobilizes extra medical help from outside, if necessary;
• Keeps a list of qualified first aiders of the factory and seek their assistance;
• Maintains first aid and medical emergency requirements;
• Makes sure that all safety equipment are made available to the emergency team;
• Assists Site Controller with necessary data and coordinate the emergency
activities;
• Assists Site Controller in updating emergency plan, organizing mock drills
verification of inventory of emergency facilities and furnishing report to the Site
Controller;
• Maintains liaison with civil administration;
• Ensure availability of canteen facilities and maintenance of rehabilitation center;
• He will be in liaison with Site Controller/Incident Controller;
• Ensure transportation facility;
• Ensures availability of necessary cash for rescue/rehabilitation and emergency
expenditure;
• Controls rehabilitation of affected areas on discontinuation of emergency; and
• Makes available diesel/petrol for transport vehicles engaged in emergency
operation.
1.3.5.5 Emergency Coordinator - Essential Services
• He would assist Site controller and Incident Controller;
• Maintains essential services like Diesel Generator, Water, Fire Water,
Compressed Air/Instrument Air, power supply for lighting;
• He would plan alternate facilities in the event of power failure, to maintain
essential services such as lighting, refrigeration plant etc;
• He would organize separate electrical connections for all utilities and emergency
services so that in the event of emergency or fires, essential services and utilities
are not affected;
• Gives necessary instructions regarding emergency electrical supply, isolation of
certain sections etc. to shift Incharge and electricians; and
• Ensures availability of adequate quantities of protective equipment and other
emergency materials, spares etc.
1.3.5.6 General Responsibilities of Employees During an Emergency
During an emergency, especially it becomes more enhanced and pronounced when an
emergency warning is raised, the workers if they are incharge of process equipment
should adopt safe and emergency shut down and attend any prescribed duty as essential
employee. If no such responsibilities assigned, he should adopt a safe course to assembly
point and await instructions. He should not resort to spread panic. On the other hand, he
must assist emergency personnel towards objectives of DMP.
1.4 Emergency Facilities
1.4.1 Emergency Control Centre (ECC)
For the time being Office Block is identified as Emergency Control Centre. It would
have external Telephone, Fax, Telex facility. All the Site Controller/Incident Controller
Officers, Senior Personnel would be located here. Also, it would be an elevated place.
Various other materials that are to be maintained in the Emergency Control Centre are:
The following information and equipment are to be provided at the Emergency Control
Centre (ECC).
• Intercom, telephone
• P & T telephone
• Self contained breathing apparatus
• Fire suit/gas tight goggles/gloves/helmets
• Hand tools, wind direction/velocities indications
• Public address megaphone, hand bell, telephone directories
• (internal, P&T) factory layout, site plan
• Emergency lamp/torch light/batteries
• Plan indicating locations of hazard inventories, plant control room, sources of safety
equipment, work road plan, assembly points, rescue location vulnerable zones, escape
routes.
• Hazard chart
• Emergency shut-down procedures
• Nominal roll of employees
• List of key personnel, list of essential employees, list of Emergency Co-ordinators
• Duties of key personnel
• Address with telephone numbers and key personnel, emergency coordinator, essential
employees.
• Important address and telephone numbers including Government agencies,
neighbouring industries and sources of help, out side experts, chemical fact sheets
population details around the factory.
1.4.2 Assembly Point
Number of assembly depending upon the plant location would be identified wherein
employees who are not directly connected with the disaster management would be
assembled for safety and rescue. Emergency breathing apparatus, minimum facilities like
water etc. would be organized.
1.4.3 Emergency Power Supply
Plant facilities would be connected to Diesel Generator and would be placed in auto
mode. Thus water pumps, plants lighting and emergency control centre. Administrative
building and other auxiliary services are connected to emergency power supply. In all the
blocks flame proof type emergency lamps would be provided.
1.4.4 Fire Fighting Facilities
First aid fire fighting equipment suitable for emergency should be maintained in each
section the plant. This would be as per statutory requirements as well as per TAC
Regulations. However, fire hydrant line covering major areas would be laid. It would be
maintained as 6 kg/sqcm pressure. Fire alarms would be located in the bulk storage areas.
In order to combat any occurrence of fire in plant premises, the following fire protection
facilities have been envisaged for the various units of the plant.
� Fire Station Building
One fire station building has been envisaged, where all the fire personnel will be
stationed. All fire related signal from various units shall receive in this building to take
necessary action to extinguish and control the fire.
� Fire fighting Vehicles (Fire Tenders)
To meet any eventuality of fire, fire-fighting vehicles (one crash fire tender and one dry
power tender) have been considered.
� Portable Fire Extinguishers
All plant units, office buildings, stores, laboratories etc will be provided with adequate
number of portable fire extinguishers to be used as first aid fire appliances. The
distribution and selection of extinguishers will be done in accordance with the
requirement of IS: 2190-92.
� Hydrant System
The fire hydrant network system has been envisaged for the plant. Internal hydrants will
be provided at suitable locations and at different levels inside the major plant units. Yard
hydrants will be provided normally along the road and in the close vicinity of the units to
meet the requirement of water for extinguishing fire. Hydrant system shall have
dedicated pump house, pumps, water storage and piping network etc.
� Automatic Fire Detection System
Unattended and vulnerable electrical premises like electrical control rooms, cable
tunnels, MCC, transformer rooms, switch gear room, oil cellers, etc will be provided
with automatic fire detection and alarm system.
� Automatic Extinguishing System
Installation like transformers of MSDS will be provided with fire detection and
emulsifier (high velocity water spray) system. Water spray system (MVWS) shall be
provided for the natural gas/LPG storage area.
1.4.5 Location of Wind Sock
On the top of the administration block, top of each production blocks, wind socks would
be installed to indicate direction of wind for emergency escape.
1.4.6 Emergency Medical Facilities
Stretchers, gas masks and general first aid materials for dealing with chemical burns, and
inhalations, fire burns etc. would be maintained in the medical centre as well as in the
emergency control room. Private medical practitioners help would be sought.
Government hospital would be approached for emergency help.
Apart from plant first aid facilities, external facilities would be augmented. Names of
medical personnel, medical facilities in the surrounding area and near towns would be
prepared and updated. Necessary specific medicines and antidotes for emergency
treatment of Burns Patients and for those affected by toxicity would be maintained.
Breathing apparatus and other emergency medical equipment would be provided and
maintained. The help of nearby industrial management in this regard would be taken on
mutual support basis.
1.4.7 Ambulance
An ambulance with driver availability in all the shifts, emergency shift vehicle would be
ensured and maintained to transport the injured or affected persons. A number of persons
would be trained in first aid so that, in every shift first aid personnel would be available.
1.5 Emergency Actions
1.5.1 Emergency Warning
Communication of emergency would be made familiar to the personnel inside the plant
and people outside. An emergency warning system would be established.
1.5.2 Emergency Shutdown
There are number of facilities, which can be provided to help deal with hazardous
conditions, when a tank is on fire. The suggested arrangements are:
� Stop feed;
� Dilute contents;
� Remove heat;
� Deluge with water; and
� Transfer contents.
Whether a given method is appropriate depends on the particular case. Cessation of
agitation may be the best action in some instances but not in others. Stopping of the feed
may require the provision of by pass arrangements.
Methods of removing additional heat include removal through the normal cooling
arrangements or use of an emergency cooling system. Cooling facilities which use
vapouring liquid may be particularly effective, since a large increase in vaporization can
be obtained by dropping pressure.
1.5.3 Evacuation of Personnel
There could be more number of persons in the storage area and other areas in the
vicinity. The area would have adequate number of exits, stair cases. In the event of an
emergency, unconnected personnel have to escape to assembly point. Operators have to
take emergency shutdown procedure and escape. Time Office maintains a copy of
deployment of employees in each shift, at ECC. If necessary, persons can be evacuated
by rescue teams.
1.5.4 All Clear Signal
Also, at the end of an emergency, after discussing with Incident Controllers and
Emergency Co-ordinators, the Site Controller orders an all clear signal. When it becomes
essential, the Site Controller communicates to the District Emergency Authority, Police,
Fire Service personnel regarding help required or development of the situation into an
Off-Site Emergency.
1.6 General
1.6.1 Employee Information
During an emergency, employees would be warned by raising siren in specific pattern.
employees would be given training of escape routes, taking shelter, protecting from toxic
effects. Employees would be provided with information related to fire hazards, antidotes
and first aid measures. Those who would designated as key personnel and essential
employees should be given training to emergency response.
1.6.2 Public Information and Warning
The industrial disaster effects related to this plant may mostly be confined to the plant
area. The detailed risk analysis has indicated that the pool fire effects would not be felt
outside. However, as an abundant precaution, the information related to chemicals in use
would be furnished to District Emergency Authority for necessary dissemination to
general public and for any use during an off site emergency.
1.6.3 Co-ordination with Local Authorities
Keeping in view of the nature of emergency, two levels of coordination are proposed. In
the case of an On Site Emergency, resources within the organization would be mobilized
and in the event extreme emergency local authorities help should be sought.
In the event of an emergency developing into an off site emergency, local authority and
District Emergency Authority (normally the Collector) would be appraised and under his
supervision, the Off Site Disaster Management Plant would be exercised. For this
purpose, the facilities that are available locally, i.e. medical, transport, personnel, rescue
accommodation, voluntary organizations etc. would be measured. Necessary rehearsals
and training in the form of mock drills should be organized.
1.6.4 Mutual Aid
Mutual aid in the form of technical personnel, runners, helpers special protective
equipment, transport vehicles, communication facility etc. should be sought from the
neighbouring industrial management.
1.6.5 Mock Drills
Emergency preparedness is an important on that of planning in Industrial Disaster
Management. Personnel would be trained suitably and prepared mentally and physically
in emergency response through carefully planned, simulated procedures. Similarly, the
key personnel and essential personnel should be trained in the operations.
1.6.6 Important Information
Once the Plant goes into stream, important information such as names and addresses of
key personnel, essential employees, medical personnel out side the plant, transporter’s
address, address of those connected with Off Site Emergency such as Police, Local
Authorities, Fire Services, District Emergency Authority should be prepared and
maintained.
1.7 Off-Site Emergency Preparedness Plan
The task of preparing the Off-Site Emergency Plan lies with the district collector,
however the off-site plan will be prepared with the help of the local district authorities.
Aspects Proposed to be considered in the Off-Site Emergency Plan
The main aspects, which will be included in the emergency plan are:
� Organization
Detail of command structure, warning systems, implementation procedures, emergency
control centres.
Names and appointments of incident controller, site main controller, their deputies and
other key personnel.
� Communications
Identification of personnel involved, communication centre, call signs, network, lists of
telephone numbers.
� Specialized Knowledge
Details of specialist bodies, firms and people upon whom it may be necessary to call i.e.
those with specialized chemical knowledge, laboratories.
� Voluntary Organizations
Details of organizers, telephone numbers, resources etc.
� Chemical Information
Details of the hazardous substances stored or procedure on each site and a summary of
the risk associated with them.
� Meteorological Information
Arrangements for obtaining details of whether conditions prevailing at the time and
weather forecasts.
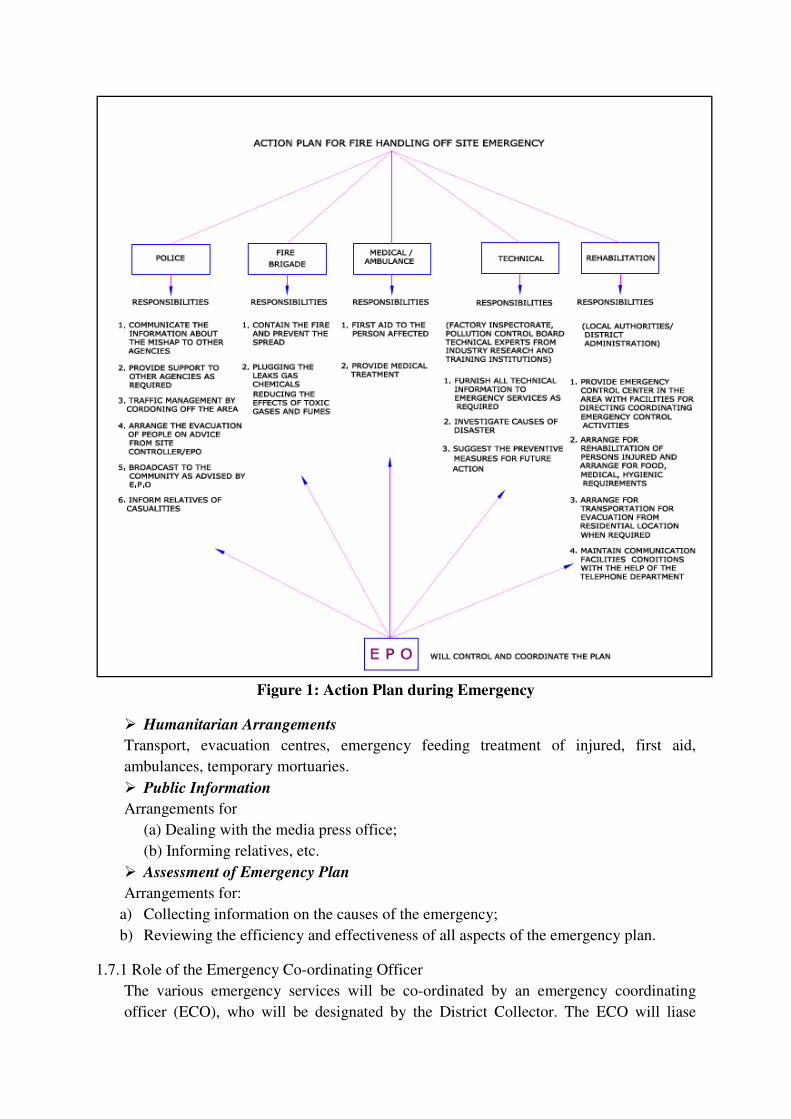
Figure 1: Action Plan during Emergency
� Humanitarian Arrangements
Transport, evacuation centres, emergency feeding treatment of injured, first aid,
ambulances, temporary mortuaries.
� Public Information
Arrangements for
(a) Dealing with the media press office;
(b) Informing relatives, etc.
� Assessment of Emergency Plan
Arrangements for:
a) Collecting information on the causes of the emergency;
b) Reviewing the efficiency and effectiveness of all aspects of the emergency plan.
1.7.1 Role of the Emergency Co-ordinating Officer
The various emergency services will be co-ordinated by an emergency coordinating
officer (ECO), who will be designated by the District Collector. The ECO will liase
closely with the site main controller. Again depending on local arrangements, for very
severe incidents with major or prolonged off-site consequences, the external control will
be passed to a senior local authority administrator or even an administrator appointed by
the central or state government.
1.7.2 Role of the Local Authority
The duty to prepare the off-site plan lies with the local authorities. The emergency
planning officer (EPO) appointed will carry out his duty in preparing for a whole range
of different emergencies within the local authority area. The EPO will liase with the
works, to obtain the information to provide the basis for the plan. This liaison will ensure
that the plan is continually kept up-to-date.
It will be the responsibility of the EPO to ensure that all those organizations which will
be involved off site in handling the emergency, know of their role and are able to accept
it by having for example, sufficient staff and appropriate equipment to cover their
particular responsibilities. Rehearsals for off-site plans will be organized by the EPO.
1.7.3 Role of Police
Formal duties of the police during an emergency include protecting life and property and
controlling traffic movements.
Their functions will include controlling bystanders evacuating the public, identifying the
dead and dealing with casualties, and informing relatives of death or injury.
1.7.4 Role of Fire Authorities
The control of a fire will be normally the responsibility of the senior fire brigade officer
who would take over the handling of the fire from the site incident controller on arrival at
the site. The senior fire brigade officer will also have a similar responsibility for other
events, such as explosions and toxic release. Fire authorities in the region will be
apprised about the location of all stores of flammable materials, water and foam supply
points, and fire-fighting equipment. They will be involved in on-site emergency
rehearsals both as participants and on occasions, as observes of exercises involving only
site personnel.
1.7.5 Role of Health Authorities
Health authorities, including doctors, surgeons, hospitals, ambulances, and so on, will
have a vital part to play following a major accident, and they will form an integral part of
the emergency plan.
For major fires, injuries will be the result of the effects of thermal radiation to a varying
degree, and the knowledge and experience to handle this in all but extreme cases may be
generally available in most hospitals. For major toxic releases, the effects vary according
to the chemical in question, and the health authorities will be apprised about the likely
toxic releases from the plant which will unable them in dealing with the aftermath of a
toxic release with treatment appropriate to such casualties.
Major off-site incidents are likely to require medical equipment and facilities additional
to those available locally, and a medical “ mutual aid “ scheme should exist to enable the
assistance of neighbouring authorities to be obtained in the event of an emergency.
1.7.6 Role of Government Safety Authority
This will be the factory inspectorate available in the region. Inspectors are likely to want
to satisfy themselves that the organization responsible for producing the off-site plan has
made adequate arrangements for handling emergencies of all types including major
emergencies. They may wish to see well documented producers and evidence of exercise
undertaken to test the plan.
In the event of an accident, local arrangements regarding the role of the factory inspector
will apply. These may vary from keeping a watching brief to a close involvement in
advising on operations. In cases where toxic gases may have been released, the Factory
Inspectorate may be the only external agency with equipment and resources to carry out
tests.
1.8 Occupational Health and Safety
Large industries, in general, and chemical plants in particular where multifarious
activities are involved during construction, erection, testing, commissioning, operation &
maintenance, the men, materials and machines are the basic inputs. Along with the
boons, the industrialization generally brings several problems like occupational health
and safety.
1.8.1 Occupational Health
Occupational health needs attention both during construction & erection and operation &
maintenance phases. However, the problem varies both in magnitude and variety in the
above phases.
• Construction & Erection
The occupational health problems envisaged at this stage can mainly be due to
constructional accident and noise.
To overcome these hazards, in addition to arrangements to reduce it within TLV’s
personal protective devices should also be supplied to workers.
• Operation and Maintenance
The problem of occupational health, in the operation and maintenance phase is due to
respirable dust and noise. With suitable engineering controls the exposures can be
reduced to less than TLV limits and proper personnel protective devices should be given
to employees.
The working personnel should be given the following appropriate personnel protective
devices.
• Industrial Safety Helmet
• Crash Helmets
• Face shield with replacement acrylic vision
• Zero power plain goggles with cut type filters on both ends.
• Zero power goggles with cut type filters on both sides and blue colour glasses
• Chemical goggles
• Welders equipment for eye & face protection
• Cylindrical type earplug
• Ear muffs
• Dust masks
• Canister Gas mask
• Self contained breathing apparatus
• Leather apron
• Aluminized fiber glass fix proximity suit with hood and gloves
• Boiler suit
• Safety belt/lime man’s safety belt
• Leather hand gloves
• Asbestos hand gloves
• Acid/Alkali proof rubberized hand gloves
• Canvas cum leather hand gloves with leather palm
• Lead hand glove
• Electrically tested electrical resistance hand gloves
• Industrial safety shoes with steel toe
• Rubber boots (alkali resistant)
• Electrical safety shoes without steel toe and gum boots
Full fledged hospital facilities should be made available round the clock for attending
emergency arising out of accidents, if any. All working personnel should be medically
examined at least once in every year and at the end of his term of employment. This is in
addition to the pre-employment medical examination.
1.8.2 Safety Plan
Safety of both men and materials during construction and operation phases is of concern.
The preparedness of an industry for the occurrence of possible disasters is known as
emergency plan. The disaster in the plant is possible due to leakage of hazardous
chemicals, collapse of structures and fire/explosion etc.
Keeping in view the safety requirement during construction, operation and maintenance
phases, steel plant has formulated safety policy with the following regulations:
• To allocate sufficient resources to maintain safe and healthy conditions of work;
• To take steps to ensure that all known safety factors are taken into account in the
design, construction, operation and maintenance of plants, machinery and equipment;
• To ensure that adequate safety instruction are given to all employees;
• To provide wherever necessary protective equipment, safety appliances and clothing,
and to ensure their proper use;
• To inform employees about materials equipment or processes used in their work
which are known to be potentially hazardous to health or safety;
• To keep all operations and methods of work under regular review for making
necessary changes from the point of view of safety in the light of experience and upto
date knowledge;
• To provide appropriate facilities for fist aid and prompt treatment of injuries and
illness at work;
• To provide appropriate instruction, training, retraining and supervision to employees
in health and safety, first aid and to ensure that adequate publicity is given to these
matters;
• To ensure proper implementation of fire prevention methods and an appropriate fire
fighting service together with training facilities for personnel involved in this service;
• To organize collection, analysis and presentation of data on accident, sickness and
incident involving personnel injury or injury to health with a view to taking
corrective, remedial and preventive action;
• To promote through the established machinery, joint consultation in health and safety
matters to ensure effective participation by all employees;
• To publish/notify regulations, instruction and notices in the common language of
employees;
• To prepare separate safety rules for each types of occupation/processes involved in a
project; and
• To ensure regular safety inspection by a competent person at suitable intervals of all
buildings, equipment, work places and operations.
1.8.3 Safety Organization
• Construction & Erection Phase
A qualified and experienced safety officer will be appointed. The responsibilities of the
safety officers include identification of the hazardous conditions and unsafe acts of
workers and advice on corrective actions, conduct safety audit, organize training
programs and provide professional expert advice on various issues related to
occupational safety and health. He is also responsible to ensure compliance of works
Safety Rules/Statutory Provisions.
In addition to employment of safety officer by steel plant every contractor, who employs
more than 250 workers, should also employ one safety officer to ensure safety of the
worker, in accordance with the conditions of contract.
• Operation & Maintenance Phase
When the construction is completed the posting of safety officers should be in
accordance with the requirement of Factories Act and their duties and responsibilities
should be as defined thereof.
1.8.4 Safety Circle
In order to fully develop the capabilities of the employees in identification of hazardous
processes and improving safety and health, safety circles would be constituted in each
area of work. The circle would consist of 5-6 employees from that area. The circle
normally should meet for about an hour every week.
1.8.5 Safety Training
A full fledged training centre will be set up. Safety training will be provided by the
Safety Officer with the assistance of faculty members called from Corporate Centre,
Professional Safety Institutions and Universities. In addition to regular employees,
limited contractor labours are also provided safety training.
To create safety awareness safety films will be shown to workers and leaflets etc. will be
distributed.
Some precautions and remedial measures proposed to be adopted to prevent fires are:
• Compartmentation of cable galleries, use of proper sealing techniques of cable
passages and crevices in all directions would help in localizing and identifying the
area of occurrence of fire as well as ensure effective automatic and manual fire
fighting operations;
• Spread of fire in horizontal direction would be checked by providing fire stops for
cable shafts;
• Reliable and dependable type of fire detection system with proper zoning and
interlocks for alarms are effective protection methods for conveyor galleries;
• House keeping of high standard helps in eliminating the causes of fire and regular fire
watching system strengthens fire prevention and fire fighting; and
• Proper fire watching by all concerned would be ensured.
1.8.6 Health and Safety Monitoring Plan
All the potential occupational hazardous work places such as iron ore handling, dolomite,
limestone, coal handling and storage areas will be monitored regularly. The health of
employees will be monitored once in a year for early detection of any ailment due to
exposure to noise, respirable dust and hazardous chemicals. The audiometry and lung
function tests will be included in this surveillance program.
Top Related
Copyright © 2022 FDOKUMEN

