


Bahasa
Halaman
Hukum


1
ENTREPENEURSHIP TRENDS IN MALAYSIA:
A National Five Year Longitudinal Study Using GEM Methodology
2
ENTREPENEURSHIP TRENDS IN MALAYSIA:
A National Five Year Longitudinal Study Using GEM Methodology
Siri Roland Xavier
Garry J. Clayton
Mohar Yusof
Leilanie Mohd Nor
Dewi Amat Sapuan
A very special thanks is extended to Datuk Seri Dr Md Zabid, President and Vice-Chancellor
of UNIRAZAK for his fervent belief and support for this project at the national, regional and
global levels. His guidance and inspiration has broken new grounds for Malaysia and
brought about impactful gains in the field of entrepreneurship.
We would also like to thank the GEM Data Team headed by Yana Litovsky and Rehanstat
Sdn Bhd, our Malaysian research surveyors, headed by Datin Dr Rehana Kassim and her
team. Thanks also goes to Alicia Coduras-Martínez for her contribution to assisting with the
SEA NES data.
Thanks is also extended to the Global Entrepreneurship Research Association for their
continued support under the leadership of Professor Mike Herrington.
Lastly the we the Malaysian GEM team members would also like to express our gratitude to
all participating GEM 2009-2013 national teams.
At the outset it should be noted that although GEM data were used in the preparation of
this report, their interpretation and use are the sole responsibility of the authors.
The usual disclaimer applies.
© 2014 by Universiti Tun Abdul Razak.
3
CONTENTS
Foreword
Executive Summary
CHAPTER 1: INTRODUCTION AND BACKGROUND
1.1 The Global Entrepreneurship Monitor (GEM) Research Project
1.2 The GEM Conceptual Model
1.3 GEM Methodology
CHAPTER 2: MAIN RESULTS OF MALAYSIA’S FIVE YEAR ENTREPRENEURSHIP RESEARCH
STUDY
2.1 Entrepreneurial Attitudes and Perceptions
2.2 Entrepreneurial Intentions
2.3 National Attitudes: Career Choice, Status and Media Attention
2.4 Entrepreneurial Activities
2.5 Entrepreneurial Aspirations
2.6 Entrepreneurship and Well-Being
CHAPTER 3: ENTREPRENEURIAL FRAMEWORK CONDITIONS IN MALAYSIA
3.1 Introduction
3.2. The GEM National Experts Survey
3.3. An Overview of Entrepreneurship Institutions
CHAPTER 4: RECOMMENDATIONS FOR POLICY AND PRACTICE
REFERENCES
APPENDICES
AUTHOR AND MALAYSIAN GEM TEAM MEMBERS
LIST OF FIGURES
Figure 1.1 The Entrepreneurship Process and GEM Operational Definitions
Figure 1.2 The GEM Conceptual Framework
Figure 2.2 Entrepreneurial Perceptions and Attitudes: Averages by Phase of Economic
Development
Figure 2.3 Intentional Entrepreneurs
Figure 2.4 Early Stage Perceptions, 2009-2013
4
Figure 2.5 Nascent Entrepreneurs, 2009-2013
Figure 2.6 New Entrepreneurs, 2009-2013
Figure 2.7 Established Business Owners
Figure 2.8 Entrepreneurial Attitudes and Perceptions – 2009-2013
Figure 2.9 Total Early-Stage Entrepreneurial Activity (Tea) 2013, By Phase of Economic
Development
Figure 2.10 Malaysia’s Total Early-Stage Entrepreneurial Activity (TEA) – 2009-2013
Figure 2.11 Percentage of Entrepreneurs Motivated By Necessity and Opportunity, By Phase of
Economic Development, 2013
Figure 2.12 Entrepreneurial Activity – Malaysia 2009-2013
Figure 2.13 Entrepreneurial Employee Activity (EEA) In 2013 Participant Countries, By Phase of
Economic Development
Figure 2.14 Reasons for Business Discontinuance by Geographic Region
Figure 2.15 Reasons behind Business Discontinuation in Malaysia, 2009-2013
Figure 2.16 Male and Female Early-Stage Entrepreneurial Activity 2013, By Geographic Regions
Figure 2.17 Early-Stage Entrepreneurial Activity Rates within Age Groups, By Geographic Regions
Figure 2.18 Total Early Stage Entrepreneurial Activity by Gender and Age, 2009-2013
Figure 2.19 The Malaysian Male TEA, 2009-2013
Figure 2.20 The Malaysian Female TEA, 2009-2013
Figure 2.21 Malaysian Nascent Entrepreneurial Activity by Gender and Age, 2009-2013
Figure 2.22 Malaysian New Business Owner-Managers by Gender and Age, 2009-2013
Figure 2.23 Malaysian Established Business Owners-Managers by Gender and Age, 2009-2013
Figure 2.24 Perceptions by Gender, 2009-2013
Figure 2.25 Overall Malaysian Entrepreneurial Activity by Gender, 2009-2013
Figure 2.26 Overall Malaysian Male Entrepreneurial Activity, 2009-2013
Figure 2.27 Overall Malaysian Female Entrepreneurial Activity, 2009-2013
Figure 2.28 Overall Malaysian Male and Female Entrepreneurial Activity, 2009-2013
Figure 2.29 Female Male Entrepreneurship and Established Business Ownership Rates in
Malaysia, 2009-2013
Figure 2.30 Job Expectations for Early-Stage Entrepreneurs, By Geographic Regions
Figure 2.31 Malaysia’s Job Growth Expectations for Early-Stage Entrepreneurship Activity
Figure 2.32 Innovative Orientation of Early-Stage Entrepreneurs, By Geographic Regions
5
Figure 2.33 Innovative Orientation of Early Stage Entrepreneurs in Malaysia, 2009-2013
Figure 2.34 International Orientation of Early-Stage Entrepreneurs, By Geographic Regions
Figure 2.35 International Orientation of Early Stage Entrepreneurs in Malaysia, 2009-2013
Figure 2.36 Nascent Entrepreneurs by Education, 2009-2013
Figure 2.37 New Business Owners-Managers by Education, 2009-2013
Figure 2.38 Total Early Stage Entrepreneurial Activity (TEA) by Education, 2009-2013
Figure 2.39 Established Business Owners-Managers by Education, 2009-2013
Figure 2.40 Nascent Entrepreneurs by Area, 2009-2013
Figure 2.41 Nascent Entrepreneurs by Area, 2009-2013
Figure 2.42 New Business Owners-Managers by Area, 2009-2013
Figure 2.43 New Business Owners-Managers by Area, 2009-2013
Figure 2.44 Subjective Well-Being, By Phase of Entrepreneurship and Stages of Economic
Development
Figure 2.45 Subjective Well-Being and Entrepreneurship Motivations and Gender, Stages of
Economic Development
Figure 2.46 Malaysia’s Subjective Well-Being, 2013
Figure 3.1 Model of Entrepreneurial Processes Affecting National Economy Growth
Figure 3.2 Entrepreneurial Finance
Figure 3.3 Government Policy
Figure 3.4 Government Entrepreneurship Programs
Figure 3.5 Entrepreneurship Education
Figure 3.6 R&D Transfer
Figure 3.7 Commercial and Legal Infrastructure
Figure 3.8 Entry Regulation: Market Openness and Market Dynamics
Figure 3.9 Access to Physical Infrastructure
Figure 3.10 Cultural and Social Norms
Figure 3.11 Start Up Opportunities
Figure 3.12 Knowledge and Skills for Start Up
Figure 3.13 Social Image
Figure 3.14 Intellectual Property Rights Protection
Figure 3.15 Support for Women
Figure 3.16 Attention to High Growth
6
Figure 3.17 Interest in Innovation
Figure 3.18 Wellbeing Conditions
Figure 3.19 Youth Entrepreneurship (14-20)
Figure 3.20 Young Adults Entrepreneurship (21-34)
Figure 3.21 Overall Rating for Malaysia’s Entrepreneurial Framework Conditions
Figure 3.22 Composite Indicators on Entrepreneurship Institutions, By Stage of Development
(1/2)
Figure 3.23 Composite Indicators on Entrepreneurship Institutions, By Stage of Development
(2/2)
Figure 3.24 Malaysia’s Composite Indicators on Entrepreneurship Institutions, By Stage of
Development (1/2)
Figure 3.25 Malaysia’s Composite Indicators on Entrepreneurship Institutions, By Stage of
Development (2/2)
Figure 3.26 Malaysia’s Overall Composite Indicators on Entrepreneurship Institutions, By Stage
of Development
Figure 3.27 Malaysia’s Overall Composite Indicators on Entrepreneurship Institutions, By Stage
of Development
Figure 3.28 Vietnam’s Overall Composite Indicators on Entrepreneurship Institutions, By Stage
of Development
Figure 3.29 The Philippines’s Overall Composite Indicators on Entrepreneurship Institutions, By
Stage of Development
Figure 3.30 Indonesia’s Overall Composite Indicators on Entrepreneurship Institutions, By Stage
of Development – 2013
Figure 3.31 Thailand’s Overall Composite Indicators on Entrepreneurship Institutions, By Stage
of Development
Figure 3.32 Singapore’s Overall Composite Indicators on Entrepreneurship Institutions, By Stage
of Development
LIST OF TABLES
Table 1.1 The Role of Entrepreneurship in Different Phases of Economic Development
Table 2.1 Gem Economies by Geographic Region and Economic Development Level
Table 3.1 Gem’s Key Entrepreneurial Framework Conditions
Table 3.2 Entrepreneurial Framework Conditions in 5 South East Asian countries – 2013
Table 4.1 National Entrepreneurship Framework
7
Universiti Tun Abdul Razak (UNIRAZAK) was established on 18 December 1997 as one of the first
private universities in Malaysia. The University was named after Malaysia’s second Prime Minister,
the late YAB Tun Abdul Razak bin Dato’ Hussein, and was officially launched on 21 December 1998
by Tun Abdul Razak’s eldest son, YAB Dato’ Seri Mohd Najib bin Tun Abdul Razak, current Prime
Minister of Malaysia.
UNIRAZAK recognized the imperative for Malaysia’s future entrepreneurs to equip themselves with
the proper tools and expertise to survive and flourish in today’s modern competitive economic
climate.
Thus UNIRAZAK founded The Bank Rakyat School of Business and Entrepreneurship (BRSBE) a unique
school, dedicated to providing quality education in entrepreneurial and business leadership in
Malaysia. BRSBE was formed with the view that entrepreneurial activity is one of the pillars of a
strong and vibrant economy. Although big business is extremely vital for economic health and
prosperity, a strong cadre of SMIs and SMEs is also essential to ensure a diverse economy and to
provide the required support to big business companies and the community. In fact the dramatic
economic development in Asia over the past two decades highlights the importance of
understanding entrepreneurship in the region.
In this regard UNIRAZAK through BRSBE is ideally poised to play both a national and regional role in
developing entrepreneurship and meeting challenges unique to Asia.
For information visit www.unirazak.edu.my
8
FOREWORD
Universiti Tun Abdul Razak has conducted the national GEM research study for 5 years
consecutively. This longitudinal report represents a milestone that marks our commitment to
entrepreneurship research, not just for our university, but for Malaysia.
Ours is a nation that is both young and vibrant. It is precisely at this stage that we need good
guidance. Just as a sapling needs protection and nurture before it can become an oak that can
withstand the stormy winds of change. Guidance for a nation takes many forms including the
wisdom of our leaders both past and present. Guidance also comes from research studies and they
serve as an evidenced based yardstick.
This research study not only takes cognisance of entrepreneurship activities but also measures
aspirations and attitudes. These measures are important as they serve not just to inform what has
happened in the past based on entrepreneurial activities undertaken but also what is needed in the
future based on the future perceptions of our entrepreneurial rakyat. Simultaneously it also allows
us to benchmark globally against other advanced innovation-driven economies.
This report should serve to strike our imagination forward to what we can be by knowing who and
where we are. Our goal is to become an entrepreneurial nation built and sustained by innovation
composed of ideas galvanised through our rakyat. In that regard this learning paves the way for
recommendations that can impact and improve policy.
Entrepreneurship and Innovation are the cornerstones of our universities focus and we aspire to
continue our work to make them strategic pillars of growth for Malaysia.
To all our stakeholders I invite you to take advantage of our research initiatives. Our joint efforts can
only further the success of Malaysia as we strive to become an innovation-driven developed nation
by the year 2020. Lastly I thank the author and the GEM team for sharing and contributing to the
aspirations of our university.
Prof. Datuk Seri Dr. Md Zabid Haji Abdul Rashid
President & Vice Chancellor
Universiti Tun Abdul Razak
9
Executive Summary
The sampling in this GEM 2013 research study covered an estimated 75% of the world’s population
and 90% of the world’s total GDP. The research is done using the GEM APS and NES surveys.
Malaysia has participated every year since 2009 thus allowing for a longitudinal study. This
individual-level measurement goes to the root of business activity and allows for a more
comprehensive account of business activity as compared to measuring formally registered
businesses. It captures both formal and informal business activity measuring Malaysia’s aspirations,
attitudes and activities.
Malaysia is amongst the few economies in Asia Pacific and South Asia where finance and physical
infrastructure to support entrepreneurship is widely available. More importantly it has a forward
looking entrepreneur-friendly national policy. In this regard Malaysia leads the region where tertiary
enrolment rates are concerned when compared with the region. In fact within SEA, Malaysia and
Singapore’s education budgets are amongst the highest. A positive trend is the closing gap between
rural and urban new business owners between 2009 and 2013. This five year study reveals that for
nascent entrepreneurs1 the gaps have reduced considerably due the governments initiatives
targeting the rural sectors as much as the urban sectors. Malaysia has amongst the best start-up
funding provisions not just regionally but globally as well.
The attitudinal measures shows that proactive Malaysian government policies and evolving cultures2
may have played a role in reducing individuals fear of failure, increasing perceived capabilities and
increased perception of entrepreneurial opportunities. These attitudes tend to positively drive up
and sustain entrepreneurial businesses and greatly work to reduce the fear of failure whilst
increasing optimism for would be entrepreneurs.
However despite this Malaysia’s TEA3 is the second lowest within Asia Pacific and South Asia
surpassed only by Japan. Intentions for entrepreneurship and attitudes towards entrepreneurship
are also among the lowest within the region. Malaysia's lack of entrepreneurial education in primary
and secondary schools, national regulations4, R&D transfer and market openness represent gaps
that can impede entrepreneurial growth.
Malaysia’s TEA rate is 6.6% against an average of 12.4% across Asia Pacific and South Asia. The
nation reported an average GDP annual growth rate of 5.78% between 2010 and 2013.5 With
economic growth more institutions are created that offer up increasing and relatively lucrative
employment options. This is further predicated by the 3% unemployment level in December 2013.
Malaysia has successfully transformed itself from exporting of raw materials and basic
manufacturing to a more diversified economy which includes high end manufacturing and services
which also contributes to the moderately lower TEA rate at this stage of Malaysia’s development.
Over the last five years Malaysia’s overall trend appears to be a lowering of Necessity-Driven TEA
even as Improvement-Driven Opportunity TEA grows. Where opportunities are improvement driven
there is an innate tendency for entrepreneurs to select business opportunities rather than accept
just any business. This correlates with the reduction of Business Discontinuation over the last 5
years. Consequently the Established Business ownership rate sees an upward trend. It is noteworthy
1 i.e. individuals starting new enterprises and are less than three months old. 2 i.e. cultures embracing innovation and entrepreneurship 3 Total early stage entrepreneurial activity 4 Refers to taxes and bureaucracy. Here we note that despite being ranked 6th overall for World Banks Ease of Doing Business the individual ranking for starting a business is 16, paying taxes 36, enforcing contracts 30 and resolving insolvency 42. 5 Department of Statistics Malaysia – GDP Annual Growth Rate
10
that a prevalent reason (45% of responses) for business discontinuation is low profitability. Problems
with financing was comparatively less (10% of responses). The government initiatives to provide
funding for entrepreneurs through their agencies have been effective even by global standards.
Where EEA6 is concerned Malaysia is rated the lowest amongst the efficiency-driven economies.
Existing organisations in Malaysia still lack the propensity for new initiatives and opportunities by
their employees. It signals a lack of innovativeness when it comes to exploiting their human
potential.
Growth aspirations is the clearest manifestation of entrepreneurship that can directly be linked to
the number one objective of most governments which is to create more jobs. However new
businesses expectations to create more than 20 jobs in Malaysia is rated lowest in Asia Pacific and
South Asia at 0.1%. The highest were Singapore and Taiwan both rated at 2.5%. These numbers are
critical as they point to the quality and sustainability of new businesses in Malaysia. A further
indication is where Malaysia’s data displays a low level of international orientated entrepreneurs.
Over the five years more than 70% on average of TEA have no customers outside the country. The
growing of jobs is important but having businesses with an innovative orientation that will allow for
consistent renewal is crucial for the long run.
In measuring Malaysia’s well-being it is seen that established business owners have a higher level of
satisfaction with their work and personal life. Those who are in the early stage for opportunity are
also fairly satisfied based on their subjective well-being answers. Conversely those who are in the
early stage business activity out of necessity are least satisfied overall. Fortunately there are fewer
of them as Malaysia’s TEA is highly opportunity oriented.
Why does Malaysia have such low entrepreneurial growth both in terms of job creation and TEA and
what can we do about it? Firstly in Malaysia there is ample options for potential entrepreneurs. Our
overall economic growth becomes a double edged sword drawing human resources away from the
plunge into entrepreneurship. The solution would be to recalibrate our emphasis and make EEA
equally our focus as we do TEA.
Secondly we lack stringent evaluations of proposed businesses by nascent entrepreneurs. We tend
to take a less than Kirznerian view7 when what is needed is a Schumpeterian view.8 Currently the
approach is akin to steroidal entrepreneurship. It only serves to conjure a picture that meets data
statistics and government agencies KPI’s. When the waves of competition both regional and global
arrive those ‘me-too’ businesses will be the first to falter.
Thirdly we need to cure the pain points of our national entrepreneurship strategy. It needs to
spearhead the enhancement of education and training, facilitate R&D transfer, emphasize attention
to high growth business and inculcate both TEA and EEA as benchmarks for measurement. A further
sub condition will be to include entrepreneurship education within primary, secondary and
vocational schools and to have more inclusive government programs involving the private sector
with a view to enhance the abilities and skills for start-ups.
The global scenario has shown that the private sector, driven by expediency and urgency, is best
placed to achieve this. The government’s role will be as gate constructors and facilitators of an
entrepreneurial ecosystem. An ecosystem that facilitates private sector initiative. For sure much has
6 Entrepreneurial Employee Activity includes corporate entrepreneurship or intrapreneurship. 7 i.e. an incremental approach 8 i.e. a view that promotes significant innovation that changes small businesses into larger ones.
11
been done and so now is the time to hone those measures and prepare, develop and make
sustainable an innovation-driven economy.
Chapter 1: Introduction and Background
Entrepreneurship is well understood as a key mechanism that can alleviate poverty, create
employment, uplift women and engage the youth of a nation. And this is achieved in many
innovative ways. At its minimum Cantillon’s theory of entrepreneurship comes to mind. In Brown
and Thornton’s (2013) review of Cantillons work, entrepreneurship is, ‘anyone who invests (in the
sense of acquiring and employing resources) with the purpose of selling goods in the future at an
uncertain price’ and is, ‘therefore narrowly defined but broadly applicable’.
Today more than ever entrepreneurship is a necessity for economies. At its core it is the focus of the
a gearing for real innovation which results in self-fulfilment as entrepreneurs endeavour, sometimes
in baby steps and other time in leaps, towards improving and creating a prosperous economy; and in
tandem a better world.
However entrepreneurial idealism without the requisite actions will remain potential unexploited
and this is mostly the case with our potential entrepreneurs. And this is where the shortcomings of
an entrepreneurial mind set and foresight and an insufficient eco system structure needs to be
scrutinised.
Malaysia is amongst the few economies in Asia Pacific and South Asia where finance and physical
infrastructure to support entrepreneurship is widely available. However despite such positives
entrepreneurial activity in terms of total early stage entrepreneurial activity is the second lowest in
Asia Pacific and South Asia surpassed only by Japan. Intentions for entrepreneurship and attitudes
towards entrepreneurship are also among the lowest within the region. Job growth expectations is
relatively low at below 0.01%9 of new businesses expecting to hire more than 20 workers. Close to
84% (average over the last 5 years) see themselves creating less than 5 jobs.
The country has a forward looking entrepreneur friendly national policy. This is supplemented by
good finance opportunities and support, accelerated government programs, strong internal market
dynamics, commercial services and physical infrastructure. These conditions equal or exceed those
found in other efficiency and even some innovation driven economies. However Malaysia's lack of
entrepreneurial education in primary and secondary schools, national regulations-taxes and
bureaucracy, R&D transfer and market openness represent gaps that can impede entrepreneurial
growth.
This research study and trends analysis over 5 years as such looks to shed some light on our
entrepreneurial position. Who and where we are and how we can move forward to achieve greater
entrepreneurial success as we aspire to make entrepreneurship and innovation a key pillar of growth
for Malaysia.
1.1 The Global Entrepreneurship Monitor (GEM) Research Project
Entrepreneurship globally and particularly in South East Asia is reflected in many different ways and
certainly different languages. However the key denominator is that it has become an increasingly
fundamental and integral part of each economies growth. There is an upsurge in awareness over the
9 in 2013 compared against Asia Pacific and South Asia economies
12
last 10 years. This is apparent from evidence ranging from media coverage to government initiatives
in almost all 10 countries.
THE GEM RESEARCH INITIATIVE
The Global Entrepreneurship Monitor was conceived in September 1997 by Michael Hay of London
Business School (LBS) and Bill Bygrave of Babson College. LBS and Babson funded a prototype study
that year. In order to govern the interests of the GEM National Teams, the Global Entrepreneurship
Research Association (GERA) was formed in 2004 to serve as the oversight body for GEM. GERA is a
not-for-profit organization governed by representatives of the national teams, the two founding
institutions and sponsoring institutions.
Now, fifteen years later, GEM has measured entrepreneurship in 104 economies, and has gained
widespread recognition as the most authoritative longitudinal study of entrepreneurship in the
world. In 2013, more than 197,000 individuals have been surveyed and approximately 3,800 country
experts on entrepreneurship participated in the study across 70 economies, collectively representing
all regions of the world and a broad range of economic development levels. The samples in the GEM
study covered an estimated 75% of the world’s population and 90% of the world’s total GDP. In
addition to its annual measures of entrepreneurial attitudes and activity, GEM analysed well-being
as a special topic focus in 2013.
GERA’s mission is to contribute to global economic development through entrepreneurship. To
achieve this, GERA seeks to increase worldwide knowledge about entrepreneurship by conducting
and disseminating world class research that:
1. Uncovers and measures factors impacting the level of entrepreneurial dynamics among
economies,
2. Aids in identifying policies that may lead to appropriate levels of entrepreneurial activity, and
3. Increases the influence of education in supporting successful entrepreneurship.10
GEMs core role of assessing the contribution of entrepreneurship to economies is thus most
opportune. SEA as a region displays a wide spectrum of economies that does not easily fit into any
one category of description. GEM has both a conceptual and methodological approach that
measures realities from the ground up. Both the “Kirznerian” and “Schumpeterian” views are
encompassed. And this fits well with SEA's diversity and dynamism. An entrepreneurship that
galvanizes ambition, forces competition and spurs structural changes in economies, which leads to
job creation and national competitiveness.
The GEM research project makes it contribution by focussing on;
The different types and roles of entrepreneurship within economies being studied.11
How and to what extent individuals show relevant attitudes and perceptions towards
entrepreneurship.
Involvement in entrepreneurial activity compared between countries as well as regionally.
The environment or external conditions that entrepreneurs find themselves in.
The impact of these factors upon entrepreneurs over time.
10 GEM Global Report 2013 11 The type of entrepreneurship does not find a definitional consensus in literature. It ranges from self-employment, start-ups, small business activity and contrasted between innovative and replicated enterprises (Henrekson and Sanandaji, 2013)
13
As a result, GEM was established with the following objectives:
• To allow for comparisons with regard to the level and characteristics of entrepreneurial activity
among different economies;
• To determine the extent to which entrepreneurial activity influences economic growth within
individual economies;
• To identify factors which encourage and/or hinder entrepreneurial activity; and
• To guide the formulation of effective and targeted policies aimed at stimulating entrepreneurship
GEM provides a comprehensive view of entrepreneurship across the globe by measuring the
attitudes of a population, and the activities and characteristics of individuals involved in various
phases and types of entrepreneurial activity.
Research teams in each participating economy administer an Adult Population Survey (APS) of at
least 2,000 adults annually. Complementing the APS is a National Expert Survey (NES), which
provides in-depth opinions from selected national experts on the factors that impact the nature and
level of entrepreneurship in each economy.12
GEM defines entrepreneurship as “any attempt at new business or new venture creation, such as
self-employment, a new business organization, or the expansion of an existing business, by an
individual, a team of individuals, or an established business” (Bosma, Wennekers and Amorós, 2012,
pg. 9).
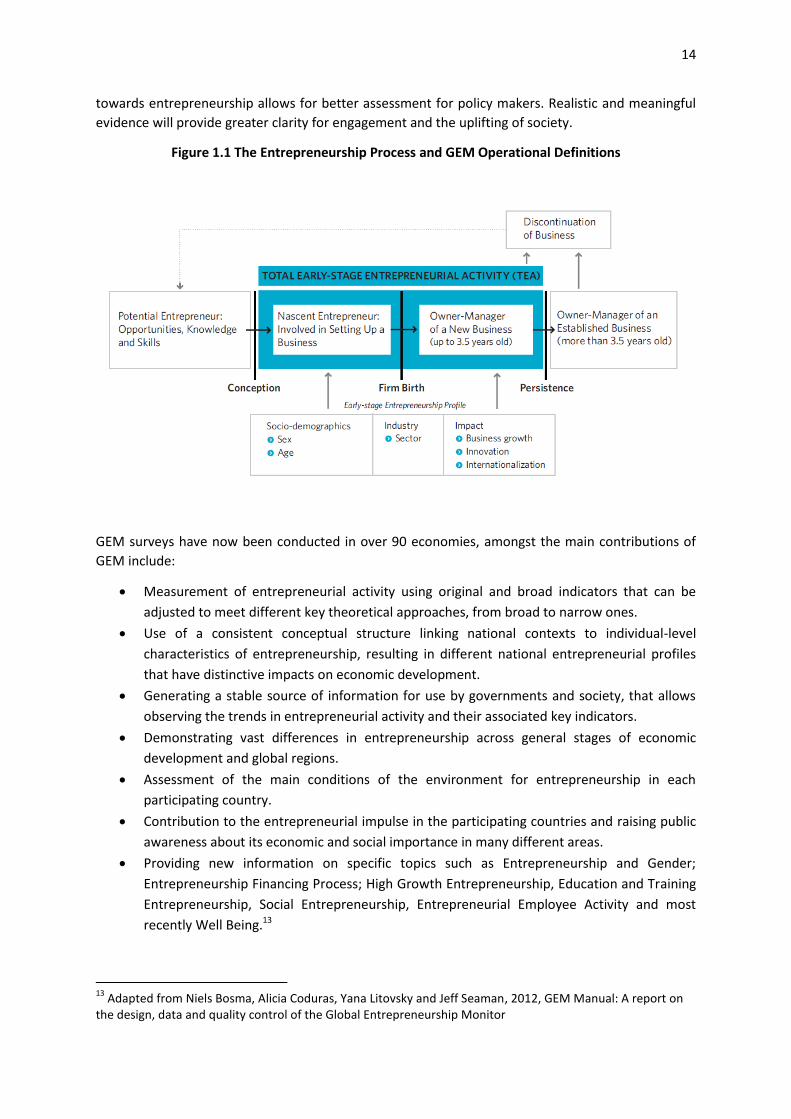
Effectively GEM takes into consideration the multiple phases of the entrepreneurial process (Figure
1.1). By measuring individual participation keen insights may be observed within each stage of the
process. Each stage within societies that have different rates of development will undergo varying
levels of participation. Every stage of the process essentially leads into the next phase and GEM
looks to measuring the key phases within this broad spectrum. The key phases measured are as
follows;
Potential entrepreneurs – those who see opportunities in their environments, have the
capabilities to start businesses and are undeterred by fear of failure.
Intentional entrepreneurs – those who intend to start in the future (within the next three
years).
Nascent entrepreneurs – those who have taken steps to start a new business, but have not
yet paid salaries or wages for more than three months.
New entrepreneurs – those who are running new businesses that have been in operation
between three and 42 months and are paying salaries.
Established business owners – those who are running a mature business and have been
operating for more than 42 months.
Discontinued entrepreneurs – those who, for whatever reason, have exited from running a
business in the past year.
This individual-level measurement goes to the root of business activity and allows for a more
comprehensive account of business activity as compared to measuring formally registered
businesses. Thus GEMs design allows for the capture of both formal and informal business activity
across countries where, in some economies, the latter is equally impactful. In a broader sense
societal attitudes towards entrepreneurship get measured. Understanding the views of society
12
GEM Global Report, 2013.
14
towards entrepreneurship allows for better assessment for policy makers. Realistic and meaningful
evidence will provide greater clarity for engagement and the uplifting of society.
Figure 1.1 The Entrepreneurship Process and GEM Operational Definitions
GEM surveys have now been conducted in over 90 economies, amongst the main contributions of
GEM include:
Measurement of entrepreneurial activity using original and broad indicators that can be
adjusted to meet different key theoretical approaches, from broad to narrow ones.
Use of a consistent conceptual structure linking national contexts to individual-level
characteristics of entrepreneurship, resulting in different national entrepreneurial profiles
that have distinctive impacts on economic development.
Generating a stable source of information for use by governments and society, that allows
observing the trends in entrepreneurial activity and their associated key indicators.
Demonstrating vast differences in entrepreneurship across general stages of economic
development and global regions.
Assessment of the main conditions of the environment for entrepreneurship in each
participating country.
Contribution to the entrepreneurial impulse in the participating countries and raising public
awareness about its economic and social importance in many different areas.
Providing new information on specific topics such as Entrepreneurship and Gender;
Entrepreneurship Financing Process; High Growth Entrepreneurship, Education and Training
Entrepreneurship, Social Entrepreneurship, Entrepreneurial Employee Activity and most
recently Well Being.13
13
Adapted from Niels Bosma, Alicia Coduras, Yana Litovsky and Jeff Seaman, 2012, GEM Manual: A report on the design, data and quality control of the Global Entrepreneurship Monitor
15
1.2 The GEM Conceptual Model
There is wide agreement on the importance of entrepreneurship for economic development.14
Business entrepreneurs drive and shape innovation, they speed up structural changes in the
economy, and they introduce new competition, thereby contributing to productivity. Social
entrepreneurs perform a similar function in the social economy, filling gaps in social needs that are
left unfilled or poorly addressed by both business and governments.
While important, the contribution of entrepreneurs to an economy also varies according to its phase
of economic development. This report is framed around a model, introduced in the GEM 2008
report. It includes a distinction among phases of economic development in line with Porter’s
typology of “factor-driven economies,” “efficiency-driven economies” and “innovation-driven
economies”.15 As previous GEM reports have shown, necessity-driven self-employment activity
tends to be higher in less developed economies. Such economies are unable to keep pace with the
demand for jobs in high-productivity sectors, and so many people must create their own economic
activity. As an economy develops, the level of necessity-driven entrepreneurial activity gradually
declines as productive sectors grow and supply more employment opportunities. At the same time,
opportunity driven entrepreneurial activity tends to pick up with improvements in wealth and
infrastructure, introducing a qualitative change in overall entrepreneurial activity. Further details on
the role of entrepreneurship in different phases of economic development are provided in Table 1.1.
14
Evidence is documented by e.g. Carree and Thurik (2003), Acs (2006), Audretsch (2007). 15
Porter, Sachs and McArthur, 2002
16
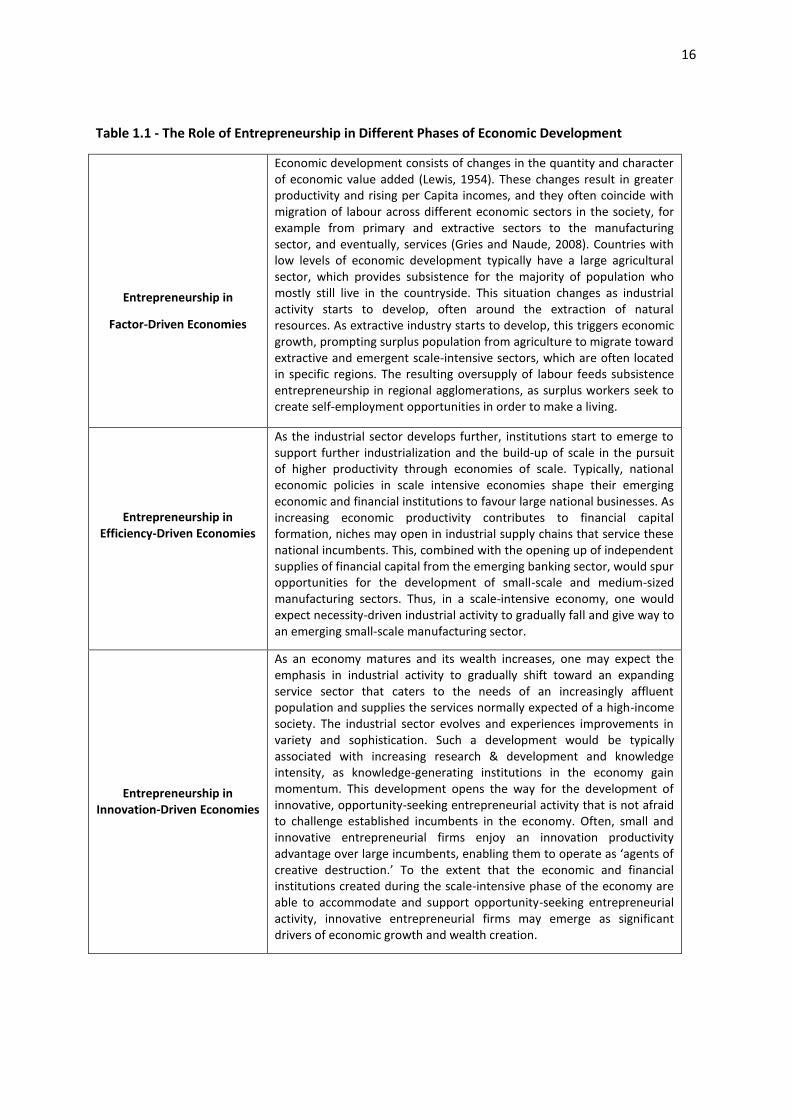
Table 1.1 - The Role of Entrepreneurship in Different Phases of Economic Development
Entrepreneurship in
Factor-Driven Economies
Economic development consists of changes in the quantity and character of economic value added (Lewis, 1954). These changes result in greater productivity and rising per Capita incomes, and they often coincide with migration of labour across different economic sectors in the society, for example from primary and extractive sectors to the manufacturing sector, and eventually, services (Gries and Naude, 2008). Countries with low levels of economic development typically have a large agricultural sector, which provides subsistence for the majority of population who mostly still live in the countryside. This situation changes as industrial activity starts to develop, often around the extraction of natural resources. As extractive industry starts to develop, this triggers economic growth, prompting surplus population from agriculture to migrate toward extractive and emergent scale-intensive sectors, which are often located in specific regions. The resulting oversupply of labour feeds subsistence entrepreneurship in regional agglomerations, as surplus workers seek to create self-employment opportunities in order to make a living.
Entrepreneurship in Efficiency-Driven Economies
As the industrial sector develops further, institutions start to emerge to support further industrialization and the build-up of scale in the pursuit of higher productivity through economies of scale. Typically, national economic policies in scale intensive economies shape their emerging economic and financial institutions to favour large national businesses. As increasing economic productivity contributes to financial capital formation, niches may open in industrial supply chains that service these national incumbents. This, combined with the opening up of independent supplies of financial capital from the emerging banking sector, would spur opportunities for the development of small-scale and medium-sized manufacturing sectors. Thus, in a scale-intensive economy, one would expect necessity-driven industrial activity to gradually fall and give way to an emerging small-scale manufacturing sector.
Entrepreneurship in Innovation-Driven Economies
As an economy matures and its wealth increases, one may expect the emphasis in industrial activity to gradually shift toward an expanding service sector that caters to the needs of an increasingly affluent population and supplies the services normally expected of a high-income society. The industrial sector evolves and experiences improvements in variety and sophistication. Such a development would be typically associated with increasing research & development and knowledge intensity, as knowledge-generating institutions in the economy gain momentum. This development opens the way for the development of innovative, opportunity-seeking entrepreneurial activity that is not afraid to challenge established incumbents in the economy. Often, small and innovative entrepreneurial firms enjoy an innovation productivity advantage over large incumbents, enabling them to operate as ‘agents of creative destruction.’ To the extent that the economic and financial institutions created during the scale-intensive phase of the economy are able to accommodate and support opportunity-seeking entrepreneurial activity, innovative entrepreneurial firms may emerge as significant drivers of economic growth and wealth creation.
17
GEM takes a comprehensive socio-economic approach and considers the degree of involvement in
entrepreneurial activity within a country, identifying different types and phases of
entrepreneurship16. This approach, and especially the focus on the individual as the embodiment of
entrepreneurship, differentiates GEM measures from other data sets that measure new business
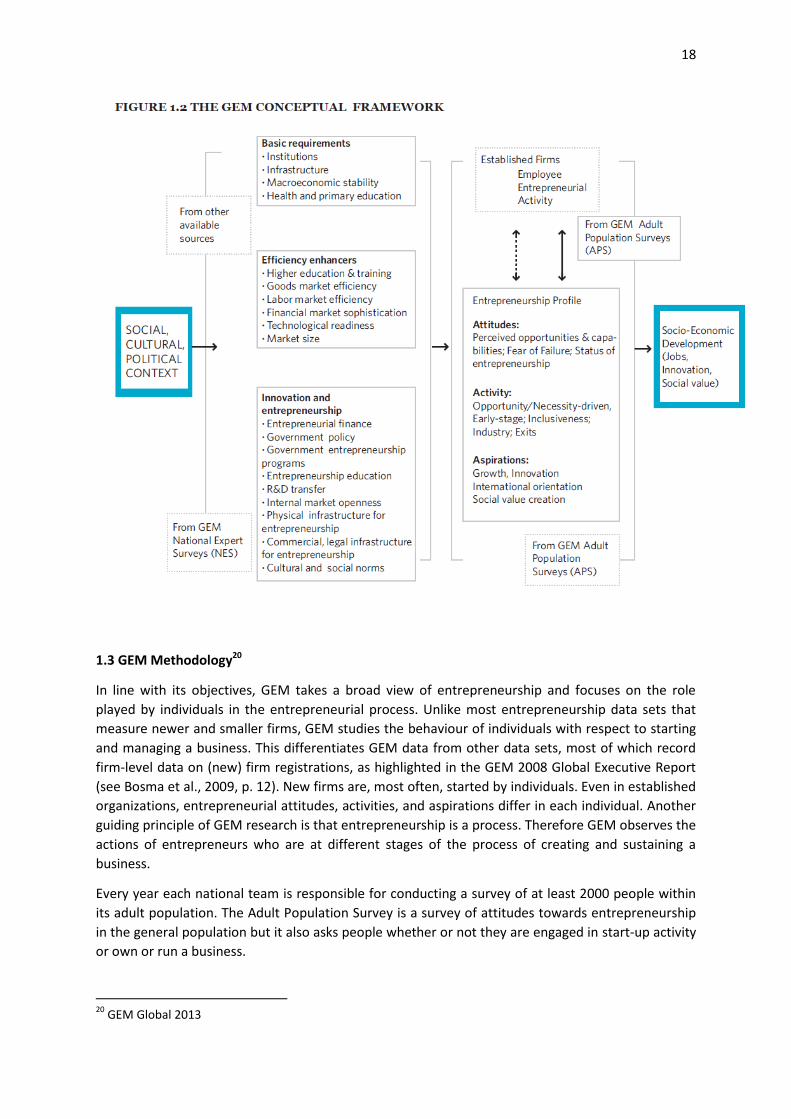
registrations17. Figure 1 visualizes the model that drives GEM research. The GEM model documents
how entrepreneurship is affected by national conditions. It also shows that GEM considers three
major components of entrepreneurship: attitudes, activity and aspirations. GEM monitors
entrepreneurial framework conditions in each country through harmonized surveys of experts in the
field of entrepreneurship18.
The GEM model incorporates an understanding of how economies change as they develop, and the
changing nature and contribution of entrepreneurship in this development. For factor-driven
economies, economic development is primarily driven by basic requirements: development of
institutions, infrastructure, macroeconomic stability and health and primary education. In efficiency-
driven economies, government focus is (or should be) on ensuring smooth mechanisms such as a
proper functioning of the market; higher education systems, goods and lab or markets and
technological readiness. Even though these conditions are not directly related to entrepreneurship
in the Schumpeterian sense of “creative destruction”, they are indirectly related since the
development of markets will also attract and enable more entrepreneurship. Finally, for countries
whose economic development is primarily innovation-driven, entrepreneurial framework conditions
become more important as levers of economic development than basic requirements or efficiency
enhancers. The outcome of the model is national economic growth through, as an example, job
creation and technical innovation. The GEM data collection efforts allow for an exploration of the
role of entrepreneurship in national economic development. GEM’s ability to map this territory
grows with each annual cycle as combined sample sizes grow and as trends over time become
apparent.19
16 See e.g. Shane (2009) for the importance of identifying differences in types and phases of entrepreneurship. 17 For an explanation about these differences see Bosma et al., 2009 p. 12 “Main distinctions between GEM Adult population Survey Data and Business Registration Data” 18 The National Experts Survey provides qualitative and subjective information on the state of several framework conditions whose evaluation is not measured by objective and quantitative variables. For the rest of contextual variables, GEM collects each year, objective information from the most reputed sources offering it: World Bank, United Nations, OECD, World Economic Forum and many others. 19 Source: GEM Global Report 2013.
18
1.3 GEM Methodology20
In line with its objectives, GEM takes a broad view of entrepreneurship and focuses on the role
played by individuals in the entrepreneurial process. Unlike most entrepreneurship data sets that
measure newer and smaller firms, GEM studies the behaviour of individuals with respect to starting
and managing a business. This differentiates GEM data from other data sets, most of which record
firm-level data on (new) firm registrations, as highlighted in the GEM 2008 Global Executive Report
(see Bosma et al., 2009, p. 12). New firms are, most often, started by individuals. Even in established
organizations, entrepreneurial attitudes, activities, and aspirations differ in each individual. Another
guiding principle of GEM research is that entrepreneurship is a process. Therefore GEM observes the
actions of entrepreneurs who are at different stages of the process of creating and sustaining a
business.
Every year each national team is responsible for conducting a survey of at least 2000 people within
its adult population. The Adult Population Survey is a survey of attitudes towards entrepreneurship
in the general population but it also asks people whether or not they are engaged in start-up activity
or own or run a business.
20
GEM Global 2013
19
The individual national team surveys are all collected in exactly the same way and at exactly the
same time of year to ensure the quality of the data. The individual national team surveys are
harmonized into one master dataset that allows users to investigate entrepreneurial activity at
various stages of the entrepreneurial process, as well as to study a variety of factors characterizing
both entrepreneurs and their businesses in each participating nation and across countries.
Adult Population Survey (APS)
Each participating economy conducts a survey of a random representative sample of at least 2,000
adults (over 18 years old). Surveys are conducted at the same time of year (generally between April
and June), using a standardized questionnaire developed by the GEM consortium. The APS is
generally conducted by an independent survey vendor, chosen by each economy’s GEM team. The
vendor submits a proposal for the GEM data collection, which is reviewed by the GEM coordination
team on various criteria. The raw data is sent directly to the GEM data team for review, quality check
and uniform statistical calculations before being made available to the participating economies.21
The most up-to-date information on data collection methodology is available in the GEM Data
Manual, available on www.gemconsortium.org.
National Expert Survey (NES)
The National Experts Survey provides insights into the entrepreneurial start-up environment in each
economy with regard to the nine entrepreneurial framework conditions:
• Financing
• Governmental policies
• Governmental programs
• Education and training
• Research and development transfer
• Commercial infrastructure
• Internal market openness
• Physical infrastructure
• Cultural and social norms
Entrepreneurial Framework Conditions (EFCs) reflect major features of a country’s socio-economic
milieu that are expected to have a significant impact on the entrepreneurial sector. The GEM model
maintains that, at the national level, different framework conditions apply to established business
activity and to new business activity. The relevant national conditions for factor-driven economic
activity and efficiency-driven economic activity are adopted from the Global Competitiveness Report
(GCR) 2013-2014.
With respect to innovation-driven economic activity, the GEM model contributes to the GCR
perspective on economic development by identifying framework conditions that are specific to
innovation and entrepreneurship (see Levie and Autio, 2008 for a theoretical underpinning). As Acs
21
Adapted from GEM Global Report 2013
20
and Armington (2006), among others, proposes, it is the entrepreneurial mechanism that turns
innovation into economic output. A lack of entrepreneurship can therefore be seen as a bottleneck
for innovation-driven countries in achieving their growth ambitions.
It is important to recognize that all three principal types of economic activity: factor-driven,
efficiency-driven, and innovation-driven, are present in all national economies. But their relative
prevalence and their contribution to economic development varies. The GCR proposition is that each
phase of economic development has a different optimal combination of these three activities. The
three phases are labelled according to the activity that is most significant for that phase. Thus, the
relative importance of entrepreneurial framework conditions to a country’s advancement in
economic development may vary by phase of economic development.
The NES sample comprises a minimum of 36 respondents, with four experts drawn from each of the
entrepreneurial framework condition categories. Out of this sample, a minimum of 25% must be
entrepreneurs or business owners, and 50% must be professionals. Additional aspects such as
geographic distribution, gender, the public versus private sector, and level of experience are also
taken into account in selecting the sample. Manual, available on www.gemconsortium.org.22
22
Adapted from GEM Global Report 2013
21
Chapter 2: Main Results of Malaysia Entrepreneurship Research Study
The importance of entrepreneurship and its contribution to economic theory by Brown and
Thornton (2013)23 lends description to entrepreneurship in South East Asia. Their evidence from
Cantillon’s theory of entrepreneurship suggest pointedly that entrepreneurship ‘is not merely an
isolated brick in his system of economics, but in fact is better understood as the tool used to build a
brick wall’. This would appear to describe how entrepreneurship plays a key role in Malaysia. A
gradual building up of capacity.
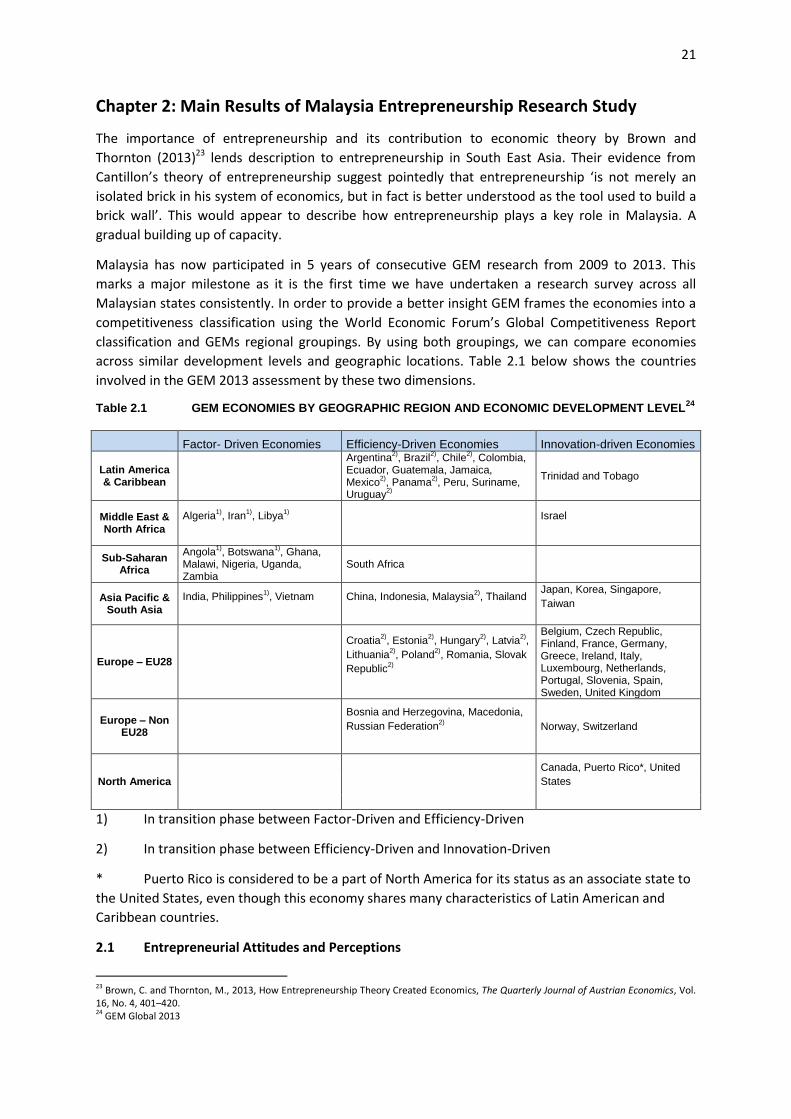
Malaysia has now participated in 5 years of consecutive GEM research from 2009 to 2013. This
marks a major milestone as it is the first time we have undertaken a research survey across all
Malaysian states consistently. In order to provide a better insight GEM frames the economies into a
competitiveness classification using the World Economic Forum’s Global Competitiveness Report
classification and GEMs regional groupings. By using both groupings, we can compare economies
across similar development levels and geographic locations. Table 2.1 below shows the countries
involved in the GEM 2013 assessment by these two dimensions.
Table 2.1 GEM ECONOMIES BY GEOGRAPHIC REGION AND ECONOMIC DEVELOPMENT LEVEL24
Factor- Driven Economies Efficiency-Driven Economies Innovation-driven Economies
Latin America & Caribbean
Argentina2), Brazil
2), Chile
2), Colombia,
Ecuador, Guatemala, Jamaica, Mexico
2), Panama
2), Peru, Suriname,
Uruguay2)
Trinidad and Tobago
Middle East & North Africa
Algeria1), Iran
1), Libya
1) Israel
Sub-Saharan Africa
Angola1), Botswana
1), Ghana,
Malawi, Nigeria, Uganda, Zambia
South Africa
Asia Pacific & South Asia
India, Philippines1), Vietnam China, Indonesia, Malaysia
2), Thailand
Japan, Korea, Singapore,
Taiwan
Europe – EU28
Croatia2), Estonia
2), Hungary
2), Latvia
2),
Lithuania2), Poland
2), Romania, Slovak
Republic2)
Belgium, Czech Republic, Finland, France, Germany, Greece, Ireland, Italy, Luxembourg, Netherlands, Portugal, Slovenia, Spain, Sweden, United Kingdom
Europe – Non EU28
Bosnia and Herzegovina, Macedonia,
Russian Federation2) Norway, Switzerland
North America
Canada, Puerto Rico*, United
States
1) In transition phase between Factor-Driven and Efficiency-Driven
2) In transition phase between Efficiency-Driven and Innovation-Driven
* Puerto Rico is considered to be a part of North America for its status as an associate state to
the United States, even though this economy shares many characteristics of Latin American and
Caribbean countries.
2.1 Entrepreneurial Attitudes and Perceptions
23 Brown, C. and Thornton, M., 2013, How Entrepreneurship Theory Created Economics, The Quarterly Journal of Austrian Economics, Vol. 16, No. 4, 401–420. 24 GEM Global 2013
22
A unique feature of this study is the capturing of attitudes and perceptions towards
entrepreneurship in Malaysia. Perceptions relate to individual assessments that relate to
perceptions of opportunities, self-efficacy, fear of failure and acquaintance with entrepreneurship
through others in the personal network. Attitudes, on the other hand, capture assessments by the
individual respondent, on what the national beliefs are with respect to some items associated with
entrepreneurship. These national beliefs are also assessed in the GEM National Expert Surveys (NES).
Table A1 in the Appendix displays the results for such an assessment by participating countries by
phase of economic development.
Individuals’ Perceptions: Opportunities, Capabilities and Fear of Failure
The perception of entrepreneurial opportunities measured in Appendices Table A1 reflects the
percentage of individuals who believe there are opportunities to start a business in the area they live
in. Malaysians as a percentage of population (18-64) rates entrepreneurial opportunities at 41%.
Within the Asia Pacific and South Asia region with an average entrepreneurial opportunity
perception of 34% this is fairly high. Indonesia is highest at 47%. The countries with the lowest
opportunity perception are Japan (8%) and Korea (13%).
Perceived capabilities reflect the percentages of individuals who believe they have the required
skills, knowledge and experience to start a new business. Malaysians rate their capabilities at 28%
against the average for the region at 40%. Indonesia and the Philippines are highest at 62% and 68%
respectively. The lowest for the region is Japan at 13%. This marked disparity may be explained by
the levels of skills, knowledge and experience required based on the phase and innovation
development levels of each economy. A highly developed economy will call for higher skills due to
automation and requirements for R&D development as compared to lower basic skills requirement
to start and manage businesses in less developed economies. This would directly affect the
perceptions of capabilities of individuals.
The measure of fear of failure (when it comes to starting your own business) applies to those who
perceive opportunities only.25 In this measure, within the Asia Pacific and South Asia region,
Malaysia has the lowest fear of failure amongst those who see opportunities at 33% against the
regional average of 41%. Malaysia is closely followed by China (34%) and Indonesia (35%). Vietnam
ranks highest at 57%. Proactive Malaysian government policies and evolving cultures (embracing
innovation and entrepreneurship) have played a role in causing such perceptions amongst those
who anticipate opportunities for entrepreneurship.
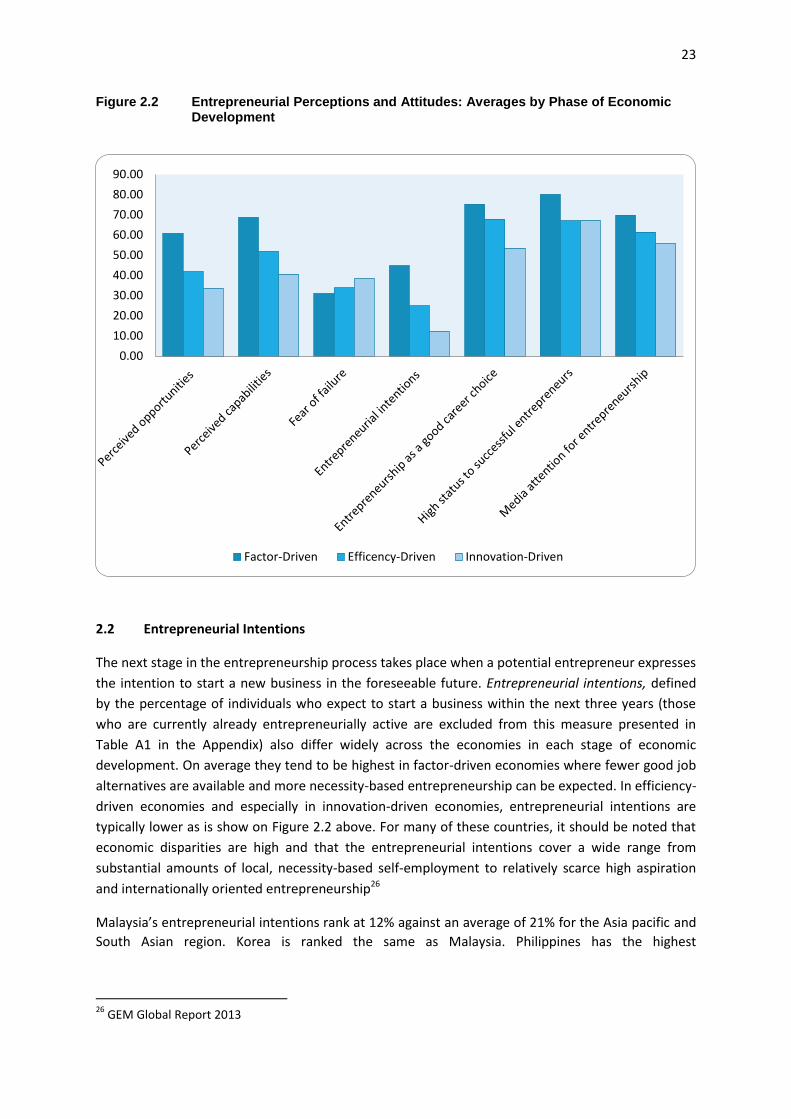
Figure 2.2 below provides an overview of entrepreneurial perceptions across phases of economic
development.
25
GEM Global Report 2013.
23
Figure 2.2 Entrepreneurial Perceptions and Attitudes: Averages by Phase of Economic Development
2.2 Entrepreneurial Intentions
The next stage in the entrepreneurship process takes place when a potential entrepreneur expresses
the intention to start a new business in the foreseeable future. Entrepreneurial intentions, defined
by the percentage of individuals who expect to start a business within the next three years (those
who are currently already entrepreneurially active are excluded from this measure presented in
Table A1 in the Appendix) also differ widely across the economies in each stage of economic
development. On average they tend to be highest in factor-driven economies where fewer good job
alternatives are available and more necessity-based entrepreneurship can be expected. In efficiency-
driven economies and especially in innovation-driven economies, entrepreneurial intentions are
typically lower as is show on Figure 2.2 above. For many of these countries, it should be noted that
economic disparities are high and that the entrepreneurial intentions cover a wide range from
substantial amounts of local, necessity-based self-employment to relatively scarce high aspiration
and internationally oriented entrepreneurship26
Malaysia’s entrepreneurial intentions rank at 12% against an average of 21% for the Asia pacific and
South Asian region. Korea is ranked the same as Malaysia. Philippines has the highest
26
GEM Global Report 2013
0.00
10.00
20.00
30.00
40.00
50.00
60.00
70.00
80.00
90.00
Factor-Driven Efficency-Driven Innovation-Driven
24
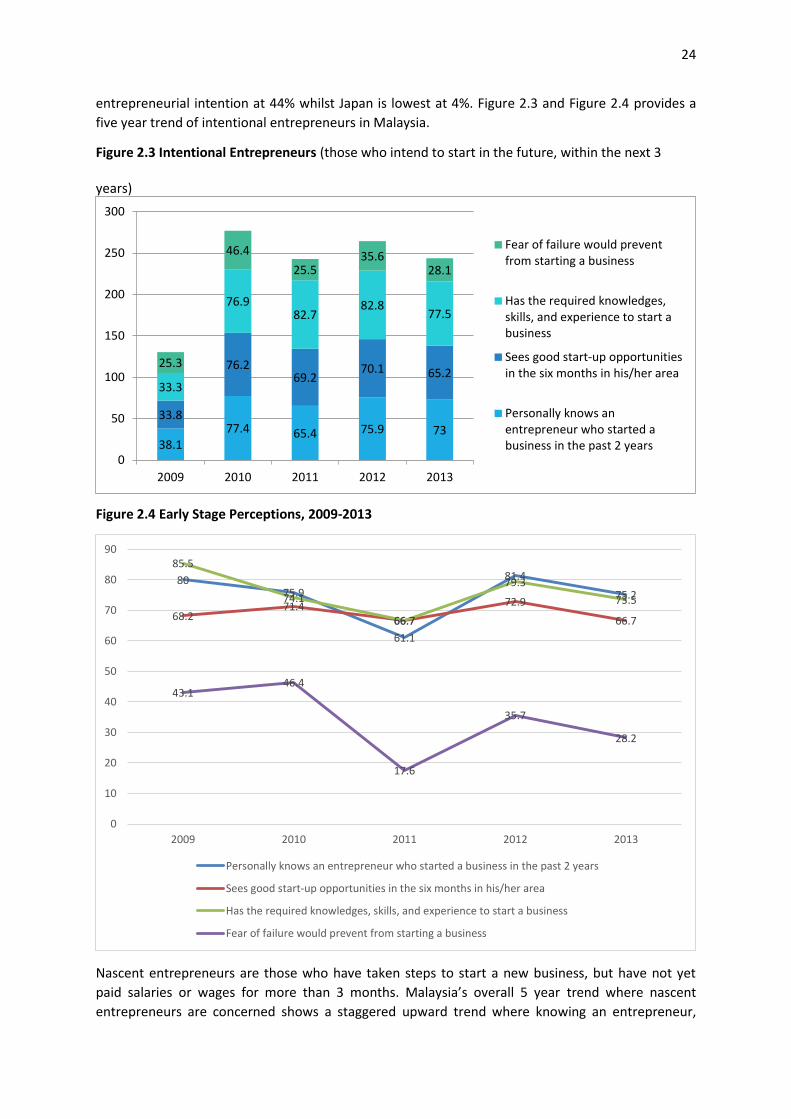
entrepreneurial intention at 44% whilst Japan is lowest at 4%. Figure 2.3 and Figure 2.4 provides a
five year trend of intentional entrepreneurs in Malaysia.
Figure 2.3 Intentional Entrepreneurs (those who intend to start in the future, within the next 3
years)
Figure 2.4 Early Stage Perceptions, 2009-2013
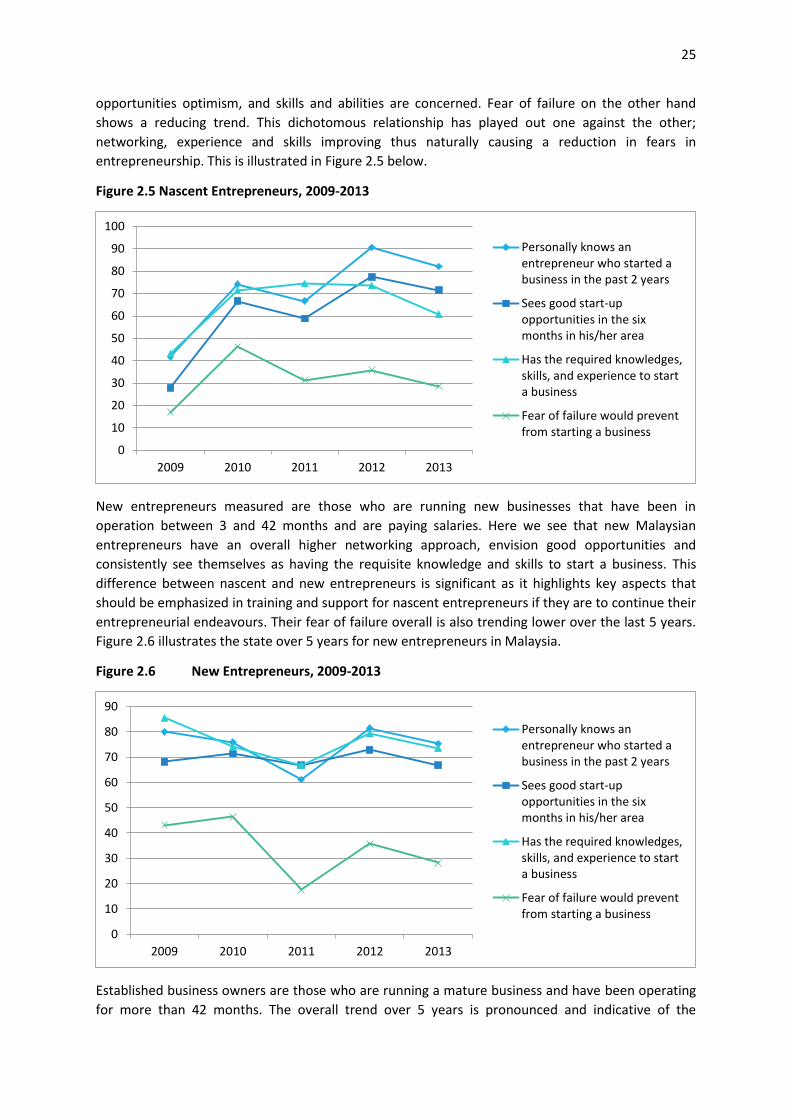
Nascent entrepreneurs are those who have taken steps to start a new business, but have not yet
paid salaries or wages for more than 3 months. Malaysia’s overall 5 year trend where nascent
entrepreneurs are concerned shows a staggered upward trend where knowing an entrepreneur,
38.1 77.4 65.4 75.9 73
33.8
76.2 69.2
70.1 65.2 33.3
76.9 82.7
82.8 77.5
25.3
46.4
25.5 35.6
28.1
0
50
100
150
200
250
300
2009 2010 2011 2012 2013
Fear of failure would preventfrom starting a business
Has the required knowledges,skills, and experience to start abusiness
Sees good start-up opportunitiesin the six months in his/her area
Personally knows anentrepreneur who started abusiness in the past 2 years
80 75.9
61.1
81.4
75.2
68.2 71.4
66.7
72.9
66.7
85.5
74.1
66.7
79.3
73.5
43.1 46.4
17.6
35.7
28.2
0
10
20
30
40
50
60
70
80
90
2009 2010 2011 2012 2013
Personally knows an entrepreneur who started a business in the past 2 years
Sees good start-up opportunities in the six months in his/her area
Has the required knowledges, skills, and experience to start a business
Fear of failure would prevent from starting a business
25
opportunities optimism, and skills and abilities are concerned. Fear of failure on the other hand
shows a reducing trend. This dichotomous relationship has played out one against the other;
networking, experience and skills improving thus naturally causing a reduction in fears in
entrepreneurship. This is illustrated in Figure 2.5 below.
Figure 2.5 Nascent Entrepreneurs, 2009-2013
New entrepreneurs measured are those who are running new businesses that have been in
operation between 3 and 42 months and are paying salaries. Here we see that new Malaysian
entrepreneurs have an overall higher networking approach, envision good opportunities and
consistently see themselves as having the requisite knowledge and skills to start a business. This
difference between nascent and new entrepreneurs is significant as it highlights key aspects that
should be emphasized in training and support for nascent entrepreneurs if they are to continue their
entrepreneurial endeavours. Their fear of failure overall is also trending lower over the last 5 years.
Figure 2.6 illustrates the state over 5 years for new entrepreneurs in Malaysia.
Figure 2.6 New Entrepreneurs, 2009-2013
Established business owners are those who are running a mature business and have been operating
for more than 42 months. The overall trend over 5 years is pronounced and indicative of the
0
10
20
30
40
50
60
70
80
90
100
2009 2010 2011 2012 2013
Personally knows anentrepreneur who started abusiness in the past 2 years
Sees good start-upopportunities in the sixmonths in his/her area
Has the required knowledges,skills, and experience to starta business
Fear of failure would preventfrom starting a business
0
10
20
30
40
50
60
70
80
90
2009 2010 2011 2012 2013
Personally knows anentrepreneur who started abusiness in the past 2 years
Sees good start-upopportunities in the sixmonths in his/her area
Has the required knowledges,skills, and experience to starta business
Fear of failure would preventfrom starting a business
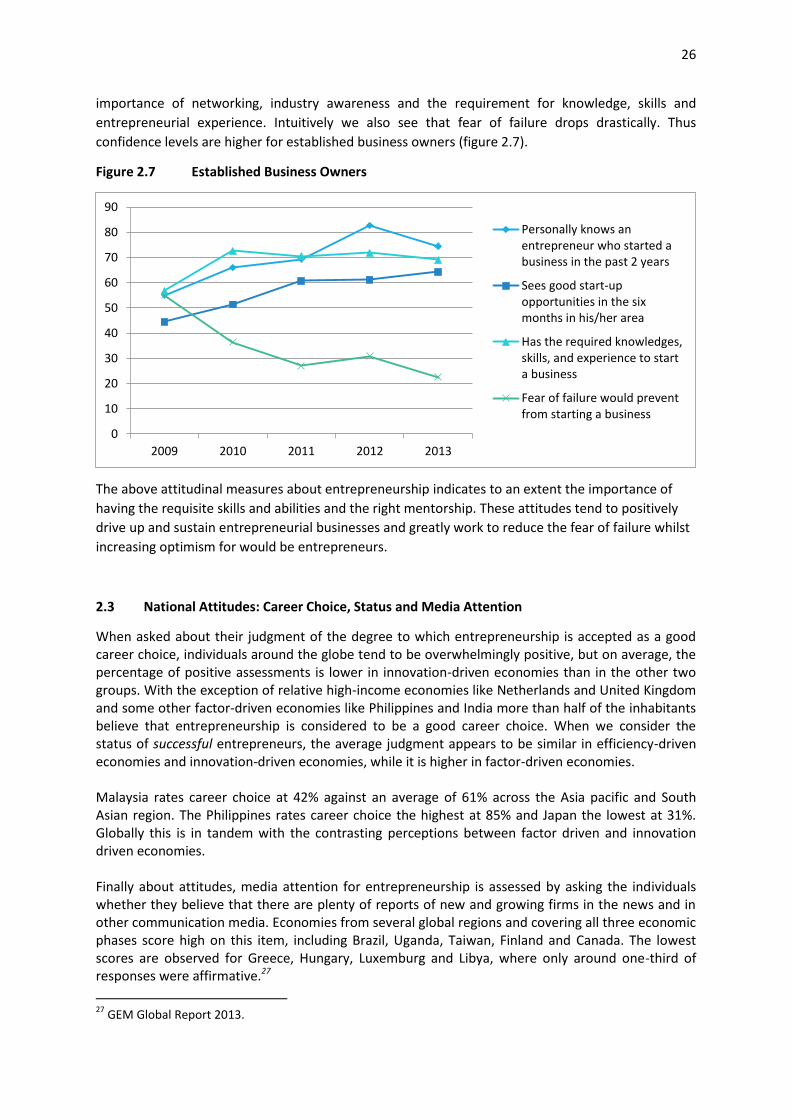
26
importance of networking, industry awareness and the requirement for knowledge, skills and
entrepreneurial experience. Intuitively we also see that fear of failure drops drastically. Thus
confidence levels are higher for established business owners (figure 2.7).
Figure 2.7 Established Business Owners
The above attitudinal measures about entrepreneurship indicates to an extent the importance of
having the requisite skills and abilities and the right mentorship. These attitudes tend to positively
drive up and sustain entrepreneurial businesses and greatly work to reduce the fear of failure whilst
increasing optimism for would be entrepreneurs.
2.3 National Attitudes: Career Choice, Status and Media Attention
When asked about their judgment of the degree to which entrepreneurship is accepted as a good career choice, individuals around the globe tend to be overwhelmingly positive, but on average, the percentage of positive assessments is lower in innovation-driven economies than in the other two groups. With the exception of relative high-income economies like Netherlands and United Kingdom and some other factor-driven economies like Philippines and India more than half of the inhabitants believe that entrepreneurship is considered to be a good career choice. When we consider the status of successful entrepreneurs, the average judgment appears to be similar in efficiency-driven economies and innovation-driven economies, while it is higher in factor-driven economies. Malaysia rates career choice at 42% against an average of 61% across the Asia pacific and South Asian region. The Philippines rates career choice the highest at 85% and Japan the lowest at 31%. Globally this is in tandem with the contrasting perceptions between factor driven and innovation driven economies. Finally about attitudes, media attention for entrepreneurship is assessed by asking the individuals whether they believe that there are plenty of reports of new and growing firms in the news and in other communication media. Economies from several global regions and covering all three economic phases score high on this item, including Brazil, Uganda, Taiwan, Finland and Canada. The lowest scores are observed for Greece, Hungary, Luxemburg and Libya, where only around one-third of responses were affirmative.27
27
GEM Global Report 2013.
0
10
20
30
40
50
60
70
80
90
2009 2010 2011 2012 2013
Personally knows anentrepreneur who started abusiness in the past 2 years
Sees good start-upopportunities in the sixmonths in his/her area
Has the required knowledges,skills, and experience to starta business
Fear of failure would preventfrom starting a business
27
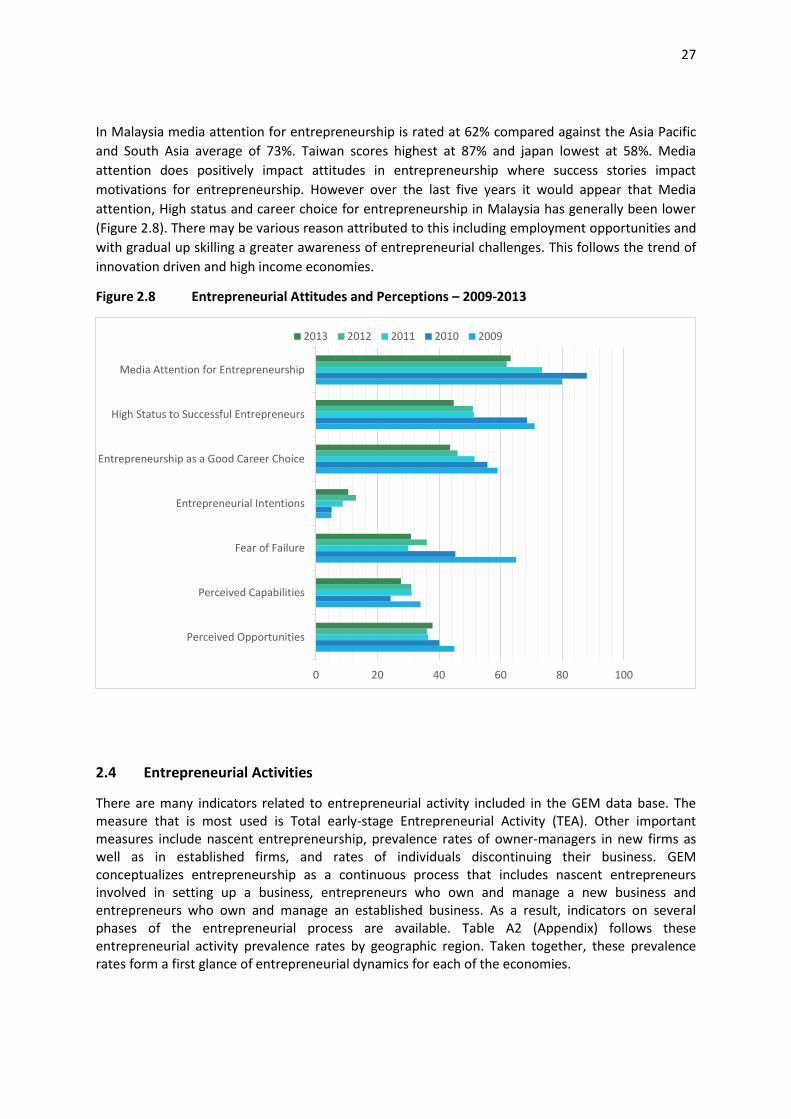
In Malaysia media attention for entrepreneurship is rated at 62% compared against the Asia Pacific
and South Asia average of 73%. Taiwan scores highest at 87% and japan lowest at 58%. Media
attention does positively impact attitudes in entrepreneurship where success stories impact
motivations for entrepreneurship. However over the last five years it would appear that Media
attention, High status and career choice for entrepreneurship in Malaysia has generally been lower
(Figure 2.8). There may be various reason attributed to this including employment opportunities and
with gradual up skilling a greater awareness of entrepreneurial challenges. This follows the trend of
innovation driven and high income economies.
Figure 2.8 Entrepreneurial Attitudes and Perceptions – 2009-2013
2.4 Entrepreneurial Activities
There are many indicators related to entrepreneurial activity included in the GEM data base. The measure that is most used is Total early-stage Entrepreneurial Activity (TEA). Other important measures include nascent entrepreneurship, prevalence rates of owner-managers in new firms as well as in established firms, and rates of individuals discontinuing their business. GEM conceptualizes entrepreneurship as a continuous process that includes nascent entrepreneurs involved in setting up a business, entrepreneurs who own and manage a new business and entrepreneurs who own and manage an established business. As a result, indicators on several phases of the entrepreneurial process are available. Table A2 (Appendix) follows these entrepreneurial activity prevalence rates by geographic region. Taken together, these prevalence rates form a first glance of entrepreneurial dynamics for each of the economies.
0 20 40 60 80 100
Perceived Opportunities
Perceived Capabilities
Fear of Failure
Entrepreneurial Intentions
Entrepreneurship as a Good Career Choice
High Status to Successful Entrepreneurs
Media Attention for Entrepreneurship
2013 2012 2011 2010 2009
28
The most popular measure of GEM, the Total Early-Stage Entrepreneurial Activity (TEA) rate, which consists of the percentage of individuals aged 18–64 in an economy who are in the process of starting or are already running new businesses. GEM has focused on the phase that combines the stage in advance of the start of a new firm (nascent entrepreneurship) and the stage directly after the start of a new firm (owning-managing a new firm). Taken together this phase is denoted as “early-stage entrepreneurial activity” (TEA).28 This is the phase that is crucial for most entrepreneurs. At the macro level, most dynamism, future job creation and innovation can be expected from this group of entrepreneurs.29
TOTAL EARLY-STAGE ENTREPRENEURIAL ACTIVITY
An economy’s Total Early-stage Entrepreneurial Activity (TEA) rate is defined as the prevalence rate
of individuals in the working age population who are actively involved in business start-ups, either in
the phase in advance of the birth of the firm (nascent entrepreneurs), or the phase spanning 42
months after the birth of the firm (owner-managers of new firms). As such, GEM takes the payment
of any wages for more than three months as the “birth event” of the firm. Several other definitions
for what constitutes the birth of a firm have been put forward in the entrepreneurship literature,
using different perspectives. The payment of wages proved to be the best approach for making
international comparisons. Individuals who are actively committing resources to start a business
(that they expect to own or co-own) but for whom the business has not yet yielded wages or salaries
are labelled nascent entrepreneurs. The individuals who did pass this “birth event” but are
operational for less than 42 months are labelled as owner-managers in new firms. The cut-off point
of 42 months has been made on a combination of theoretical and practical considerations.30
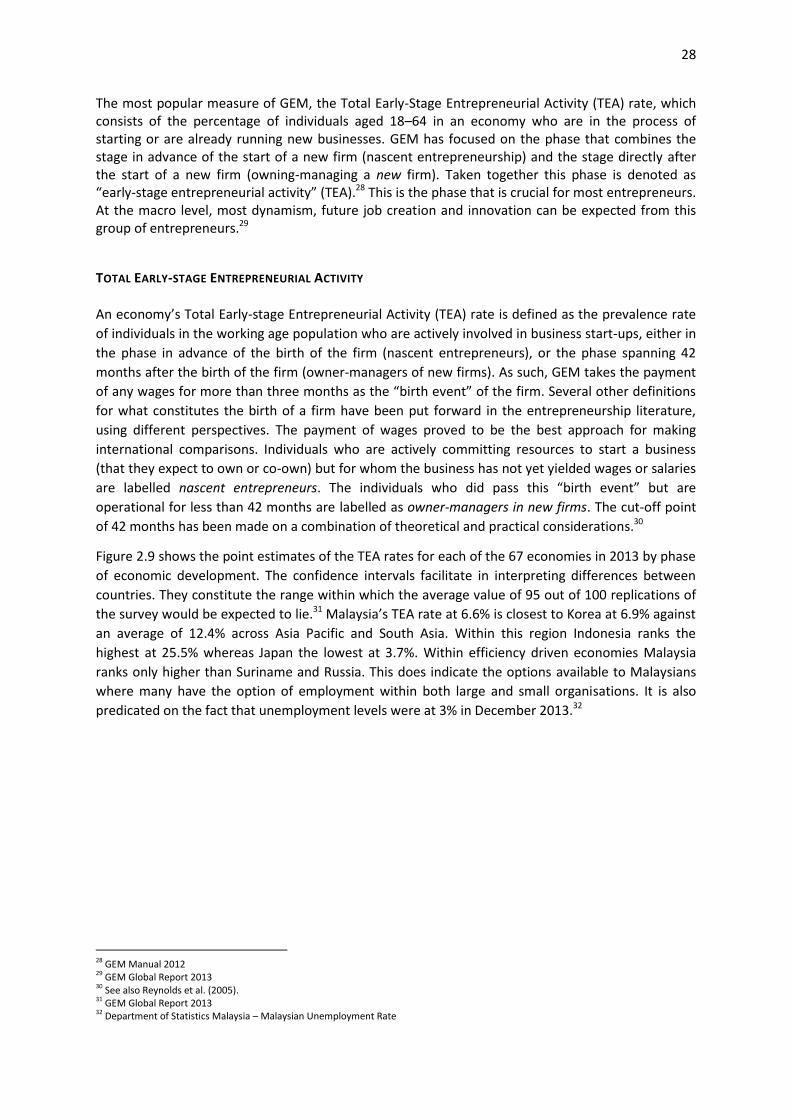
Figure 2.9 shows the point estimates of the TEA rates for each of the 67 economies in 2013 by phase
of economic development. The confidence intervals facilitate in interpreting differences between
countries. They constitute the range within which the average value of 95 out of 100 replications of
the survey would be expected to lie.31 Malaysia’s TEA rate at 6.6% is closest to Korea at 6.9% against
an average of 12.4% across Asia Pacific and South Asia. Within this region Indonesia ranks the
highest at 25.5% whereas Japan the lowest at 3.7%. Within efficiency driven economies Malaysia
ranks only higher than Suriname and Russia. This does indicate the options available to Malaysians
where many have the option of employment within both large and small organisations. It is also
predicated on the fact that unemployment levels were at 3% in December 2013.32
28 GEM Manual 2012 29 GEM Global Report 2013 30 See also Reynolds et al. (2005). 31 GEM Global Report 2013 32 Department of Statistics Malaysia – Malaysian Unemployment Rate
29
FIGURE 2.9 TOTAL EARLY-STAGE ENTREPRENEURIAL ACTIVITY (TEA) 2013, BY PHASE OF ECONOMIC
DEVELOPMENT
Figure 2.9 illustrates economic growth is not dependent on TEA rates or does not positively correlate
to an economy achieving higher economic development. Rather it is the context and profile of
entrepreneurship that matters.33 In fact where GDP per capita increases it more the norm that TEA
rates tend to fall (see Kelley et al., 2011a). As mentioned above the job availabilities tend to increase
as an economy grows. With economic growth more institutions are created that offer up increasing
and relatively lucrative employment options. This is the case for Malaysia which reported an average
GDP annual growth rate of 5.78% between 2010 and 2013.34 Malaysia has successfully transformed
itself from exporting of raw materials and basic manufacturing to a more diversified economy which
includes high end manufacturing and services. Thus employment opportunities have been
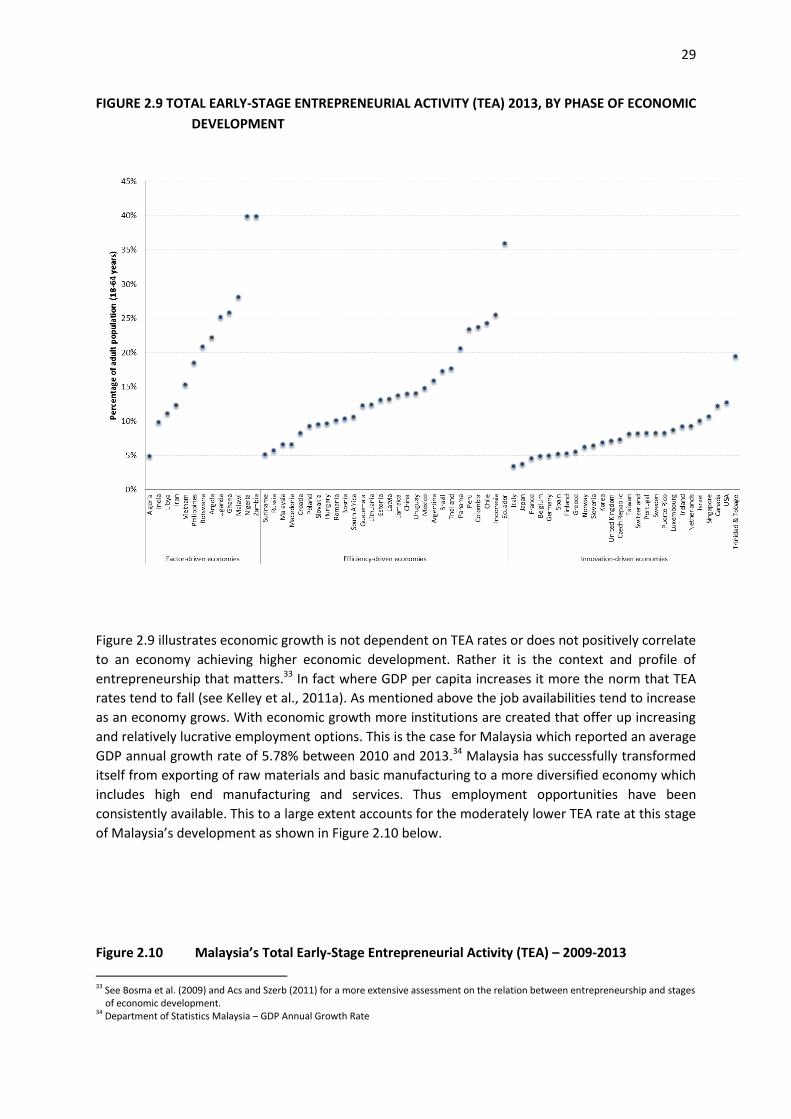
consistently available. This to a large extent accounts for the moderately lower TEA rate at this stage
of Malaysia’s development as shown in Figure 2.10 below.
Figure 2.10 Malaysia’s Total Early-Stage Entrepreneurial Activity (TEA) – 2009-2013
33 See Bosma et al. (2009) and Acs and Szerb (2011) for a more extensive assessment on the relation between entrepreneurship and stages
of economic development. 34 Department of Statistics Malaysia – GDP Annual Growth Rate
30
INDIVIDUAL DRIVERS: MOTIVATIONS TO START BUSINESSES AND ESTABLISHED BUSINESS RATES
Motivations to start businesses differ vastly across the globe. Individual drivers are traditionally
captured within the GEM framework with a simple contrast between necessity-driven motives and
opportunity-driven motives. A necessity-driven entrepreneur is one who indicates in the GEM Adult
Population Survey that s/he started the business because there were no better options for work,
rather than because s/he saw the start-up as an opportunity. For those who did see the start-up as
an opportunity (rather than no other options for work), a further assessment was made on the
nature of this opportunity. Improvement-driven opportunity (IDO) entrepreneurs are defined as
those opportunity-driven entrepreneurs who sought to either earn more money or be more
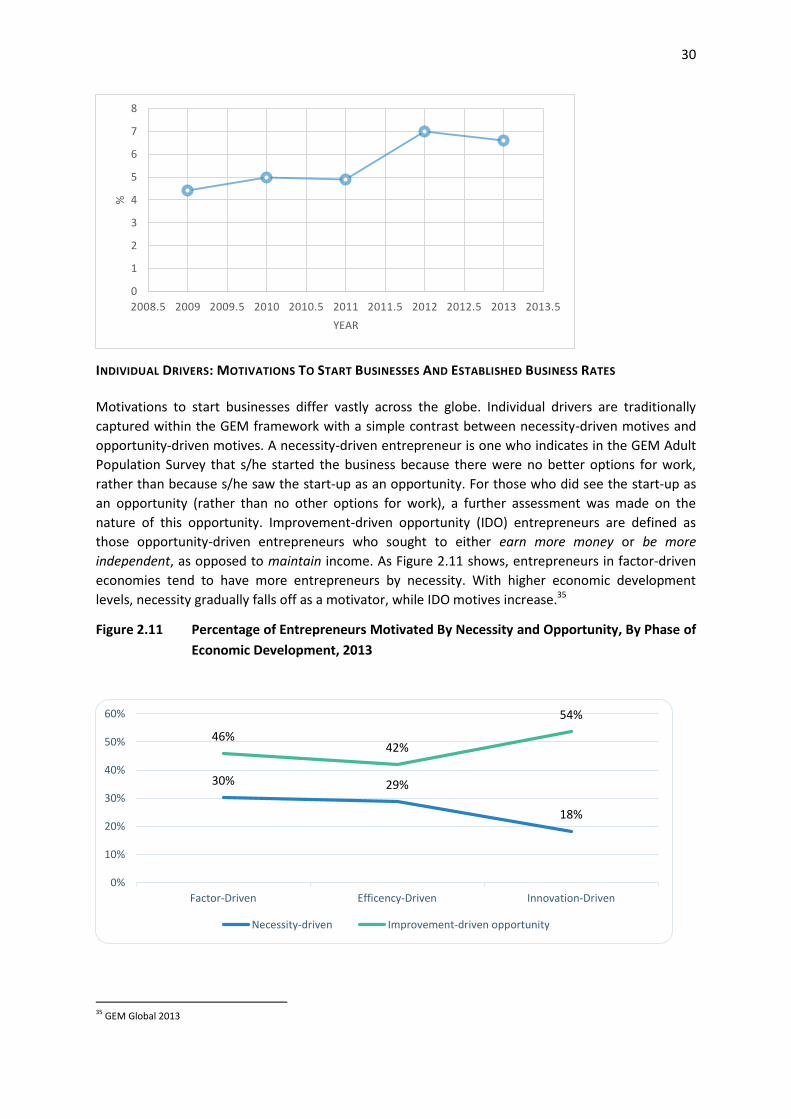
independent, as opposed to maintain income. As Figure 2.11 shows, entrepreneurs in factor-driven
economies tend to have more entrepreneurs by necessity. With higher economic development
levels, necessity gradually falls off as a motivator, while IDO motives increase.35
Figure 2.11 Percentage of Entrepreneurs Motivated By Necessity and Opportunity, By Phase of
Economic Development, 2013
35 GEM Global 2013
0
1
2
3
4
5
6
7
8
2008.5 2009 2009.5 2010 2010.5 2011 2011.5 2012 2012.5 2013 2013.5
%
YEAR
30% 29%
18%
46% 42%
54%
0%
10%
20%
30%
40%
50%
60%
Factor-Driven Efficency-Driven Innovation-Driven
Necessity-driven Improvement-driven opportunity
31
Necessity motives can be impacted by economic conditions. For example, people in early
development stage economies may start businesses because there is an insufficient supply of jobs
and a low level of social security entitlements, and they are pushed into creating a source of income.
As economies develop, the supply of jobs generally increases, so fewer people are pushed into
entrepreneurship.
Improvement-driven opportunity motives may be less dependent on the economic environment and
of more intrinsic nature, as the individual opts for pursuing an opportunity that is believed to
increase income and/or independence. One could question whether this can be stimulated by, for
example, greater exposure to entrepreneurial opportunities in one’s environment. On average,
improvement-driven opportunity motives tend to be more prevalent among early-stage
entrepreneurs as the economy develops. The GEM 2010 Global Report (Kelley et al., 2011) highlights
a number of factors which can have a marked impact on the level of improvement-driven
opportunity motivation within an economy.
There are substantial regional differences in established business ownership rates, particularly when
compared with TEA rates. TEA rates tend to be high in emerging economies, but established
business activity is often low. The opposite pattern tends to dominate the innovation-driven
economies. Two factors may contribute to this result. First, as mentioned previously, there are more
employment alternatives in societies where industrialization and institutionalization have taken
hold; more people may choose employment over starting businesses in the more developed
economies, accounting for lower TEA rates. Second, where there are sophisticated ecosystems for
business, people that do start businesses are more able to sustain them because of more favourable
conditions, such as access to finance, a highly educated workforce, rule of law and so on.36
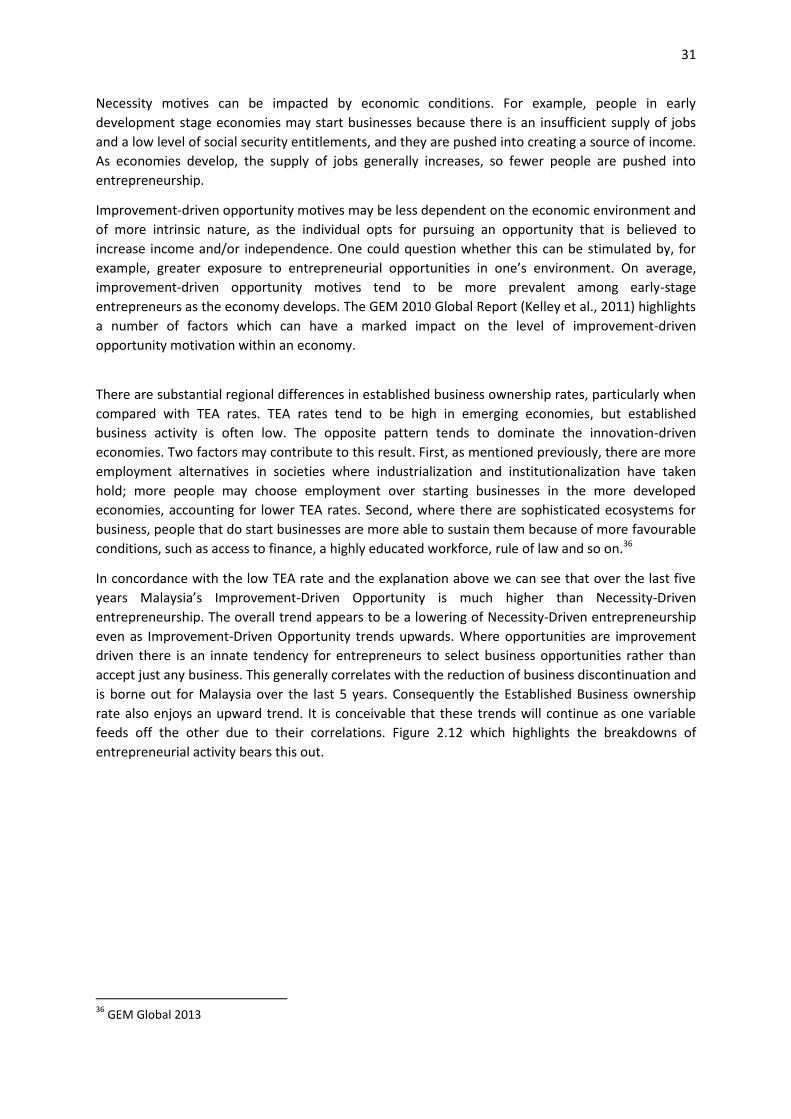
In concordance with the low TEA rate and the explanation above we can see that over the last five
years Malaysia’s Improvement-Driven Opportunity is much higher than Necessity-Driven
entrepreneurship. The overall trend appears to be a lowering of Necessity-Driven entrepreneurship
even as Improvement-Driven Opportunity trends upwards. Where opportunities are improvement
driven there is an innate tendency for entrepreneurs to select business opportunities rather than
accept just any business. This generally correlates with the reduction of business discontinuation and
is borne out for Malaysia over the last 5 years. Consequently the Established Business ownership
rate also enjoys an upward trend. It is conceivable that these trends will continue as one variable
feeds off the other due to their correlations. Figure 2.12 which highlights the breakdowns of
entrepreneurial activity bears this out.
36
GEM Global 2013
32
Figure 2.12 Entrepreneurial Activity – Malaysia 2009-2013
ENTREPRENEURIAL EMPLOYEE ACTIVITY
A major distinction in the entrepreneurship domain exists between “independent entrepreneurship”
and “entrepreneurship within an existing organization.” Both fields are large research areas,
employing a wide range of definitions and perspectives. Entrepreneurial employee activity (EEA) is
increasingly as accepted as a relevant type of entrepreneurship in the sense that it aims at new
venture creation and the introduction of new products and services. It also shares many behavioural
characteristics with the overall concept of entrepreneurship, such as taking initiative, pursuit of
opportunities and innovativeness. GEM operationalizes entrepreneurial employee activity as
“employees developing new activities for their main employer, such as developing or launching new
goods or services, or setting up a new business unit, a new establishment or subsidiary” (Bosma et
al., 2012). This definition is wider than new organization creation, but it excludes employee
initiatives that mainly aim at optimizing internal work processes.
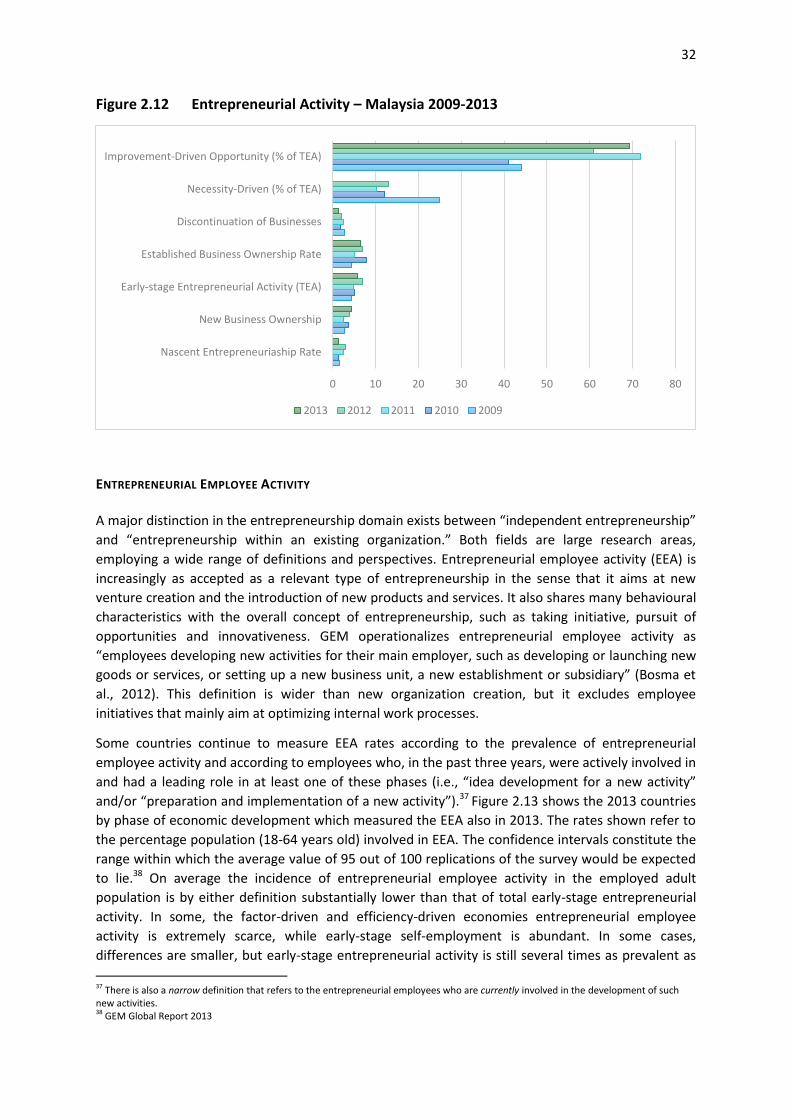
Some countries continue to measure EEA rates according to the prevalence of entrepreneurial
employee activity and according to employees who, in the past three years, were actively involved in
and had a leading role in at least one of these phases (i.e., “idea development for a new activity”
and/or “preparation and implementation of a new activity”).37 Figure 2.13 shows the 2013 countries
by phase of economic development which measured the EEA also in 2013. The rates shown refer to
the percentage population (18-64 years old) involved in EEA. The confidence intervals constitute the
range within which the average value of 95 out of 100 replications of the survey would be expected
to lie.38 On average the incidence of entrepreneurial employee activity in the employed adult
population is by either definition substantially lower than that of total early-stage entrepreneurial
activity. In some, the factor-driven and efficiency-driven economies entrepreneurial employee
activity is extremely scarce, while early-stage self-employment is abundant. In some cases,
differences are smaller, but early-stage entrepreneurial activity is still several times as prevalent as
37 There is also a narrow definition that refers to the entrepreneurial employees who are currently involved in the development of such new activities. 38 GEM Global Report 2013
0 10 20 30 40 50 60 70 80
Nascent Entrepreneuriaship Rate
New Business Ownership
Early-stage Entrepreneurial Activity (TEA)
Established Business Ownership Rate
Discontinuation of Businesses
Necessity-Driven (% of TEA)
Improvement-Driven Opportunity (% of TEA)
2013 2012 2011 2010 2009
33
entrepreneurial employee activity. Only in the innovation-driven economies, the incidence of
entrepreneurial employee activity in the adult population is in the same order of magnitude as that
of total early-stage entrepreneurial activity.39 Malaysia is rated the lowest amongst the efficiency-
driven economies. This implies that existing organisations in Malaysia still lack the propensity for
new initiatives and opportunities by their employees. It signals an overall lack of incentives and
innovativeness when it comes to exploiting their human potential.
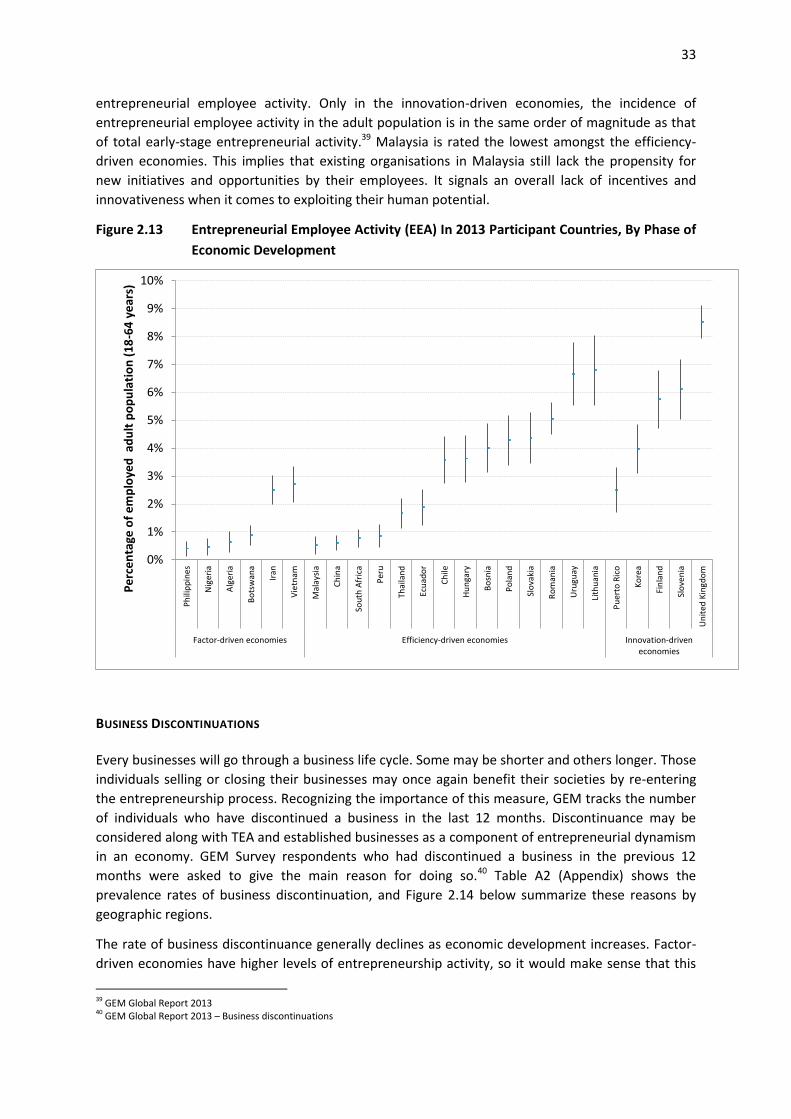
Figure 2.13 Entrepreneurial Employee Activity (EEA) In 2013 Participant Countries, By Phase of
Economic Development
BUSINESS DISCONTINUATIONS
Every businesses will go through a business life cycle. Some may be shorter and others longer. Those
individuals selling or closing their businesses may once again benefit their societies by re-entering
the entrepreneurship process. Recognizing the importance of this measure, GEM tracks the number
of individuals who have discontinued a business in the last 12 months. Discontinuance may be
considered along with TEA and established businesses as a component of entrepreneurial dynamism
in an economy. GEM Survey respondents who had discontinued a business in the previous 12
months were asked to give the main reason for doing so.40 Table A2 (Appendix) shows the
prevalence rates of business discontinuation, and Figure 2.14 below summarize these reasons by
geographic regions.
The rate of business discontinuance generally declines as economic development increases. Factor-
driven economies have higher levels of entrepreneurship activity, so it would make sense that this
39 GEM Global Report 2013 40 GEM Global Report 2013 – Business discontinuations
0%
1%
2%
3%
4%
5%
6%
7%
8%
9%
10%
Ph
ilip
pin
es
Nig
eria
Alg
eria
Bo
tsw
ana
Iran
Vie
tnam
Mal
aysi
a
Ch
ina
Sou
th A
fric
a
Per
u
Thai
lan
d
Ecu
ado
r
Ch
ile
Hu
nga
ry
Bo
snia
Po
lan
d
Slo
vaki
a
Ro
man
ia
Uru
guay
Lith
uan
ia
Pu
erto
Ric
o
Ko
rea
Fin
lan
d
Slo
ven
ia
Un
ited
Kin
gdo
m
Factor-driven economies Efficiency-driven economies Innovation-driveneconomies
Pe
rce
nta
ge o
f e
mp
loye
d a
du
lt p
op
ula
tio
n (
18
-64
ye
ars)
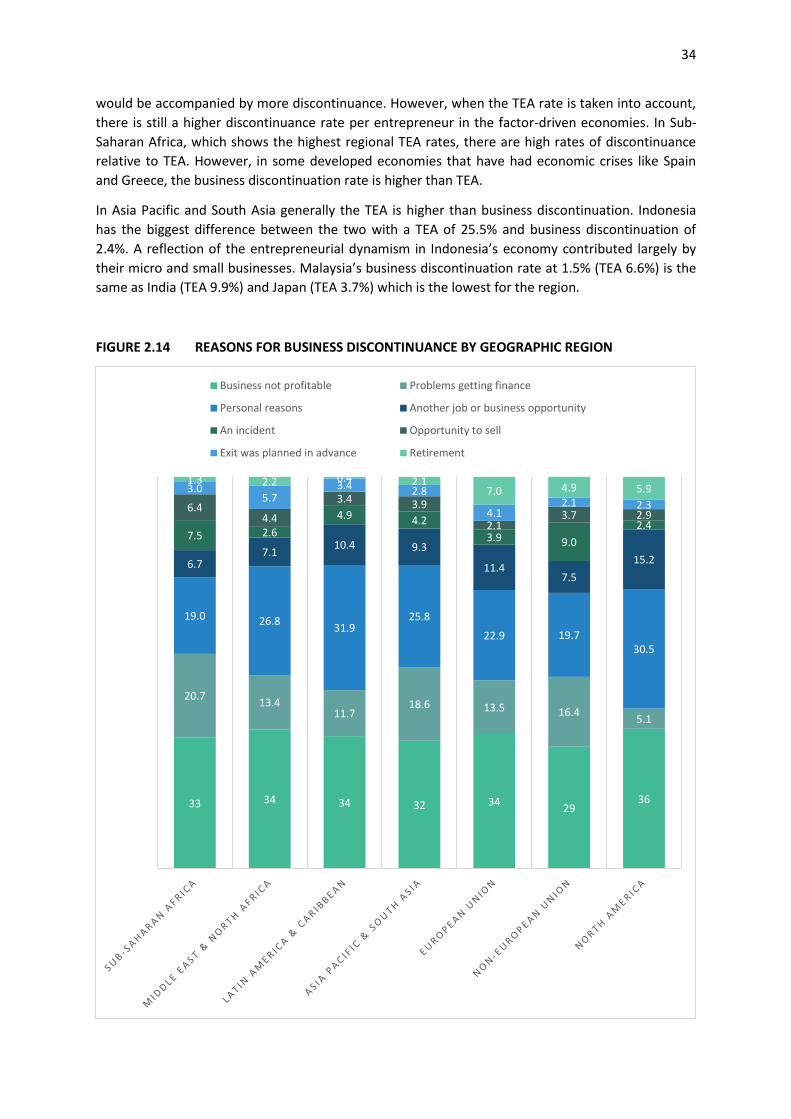
34
would be accompanied by more discontinuance. However, when the TEA rate is taken into account,
there is still a higher discontinuance rate per entrepreneur in the factor-driven economies. In Sub-
Saharan Africa, which shows the highest regional TEA rates, there are high rates of discontinuance
relative to TEA. However, in some developed economies that have had economic crises like Spain
and Greece, the business discontinuation rate is higher than TEA.
In Asia Pacific and South Asia generally the TEA is higher than business discontinuation. Indonesia
has the biggest difference between the two with a TEA of 25.5% and business discontinuation of
2.4%. A reflection of the entrepreneurial dynamism in Indonesia’s economy contributed largely by
their micro and small businesses. Malaysia’s business discontinuation rate at 1.5% (TEA 6.6%) is the
same as India (TEA 9.9%) and Japan (TEA 3.7%) which is the lowest for the region.
FIGURE 2.14 REASONS FOR BUSINESS DISCONTINUANCE BY GEOGRAPHIC REGION
33 34 34 32 34 29
36
20.7 13.4
11.7 18.6 13.5 16.4
5.1
19.0 26.8 31.9
25.8
22.9 19.7 30.5
6.7 7.1
10.4 9.3
11.4 7.5
15.2
7.5 2.6
4.9 4.2
3.9 9.0
2.4
6.4 4.4
3.4 3.9
2.1 3.7 2.9
3.0 5.7
3.4 2.8
4.1 2.1 2.3
1.3 2.2 0.4 2.1 7.0 4.9 5.9
Business not profitable Problems getting finance
Personal reasons Another job or business opportunity
An incident Opportunity to sell
Exit was planned in advance Retirement
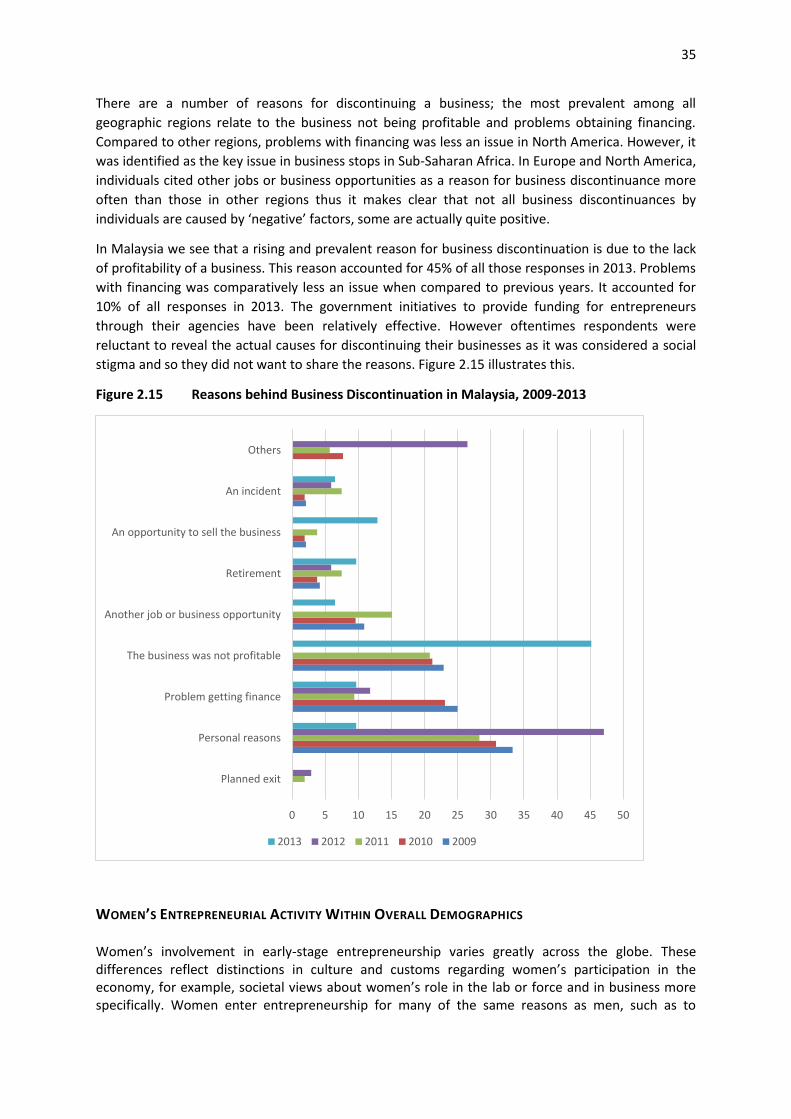
35
There are a number of reasons for discontinuing a business; the most prevalent among all
geographic regions relate to the business not being profitable and problems obtaining financing.
Compared to other regions, problems with financing was less an issue in North America. However, it
was identified as the key issue in business stops in Sub-Saharan Africa. In Europe and North America,
individuals cited other jobs or business opportunities as a reason for business discontinuance more
often than those in other regions thus it makes clear that not all business discontinuances by
individuals are caused by ‘negative’ factors, some are actually quite positive.
In Malaysia we see that a rising and prevalent reason for business discontinuation is due to the lack
of profitability of a business. This reason accounted for 45% of all those responses in 2013. Problems
with financing was comparatively less an issue when compared to previous years. It accounted for
10% of all responses in 2013. The government initiatives to provide funding for entrepreneurs
through their agencies have been relatively effective. However oftentimes respondents were
reluctant to reveal the actual causes for discontinuing their businesses as it was considered a social
stigma and so they did not want to share the reasons. Figure 2.15 illustrates this.
Figure 2.15 Reasons behind Business Discontinuation in Malaysia, 2009-2013
WOMEN’S ENTREPRENEURIAL ACTIVITY WITHIN OVERALL DEMOGRAPHICS
Women’s involvement in early-stage entrepreneurship varies greatly across the globe. These differences reflect distinctions in culture and customs regarding women’s participation in the economy, for example, societal views about women’s role in the lab or force and in business more specifically. Women enter entrepreneurship for many of the same reasons as men, such as to
0 5 10 15 20 25 30 35 40 45 50
Planned exit
Personal reasons
Problem getting finance
The business was not profitable
Another job or business opportunity
Retirement
An opportunity to sell the business
An incident
Others
2013 2012 2011 2010 2009
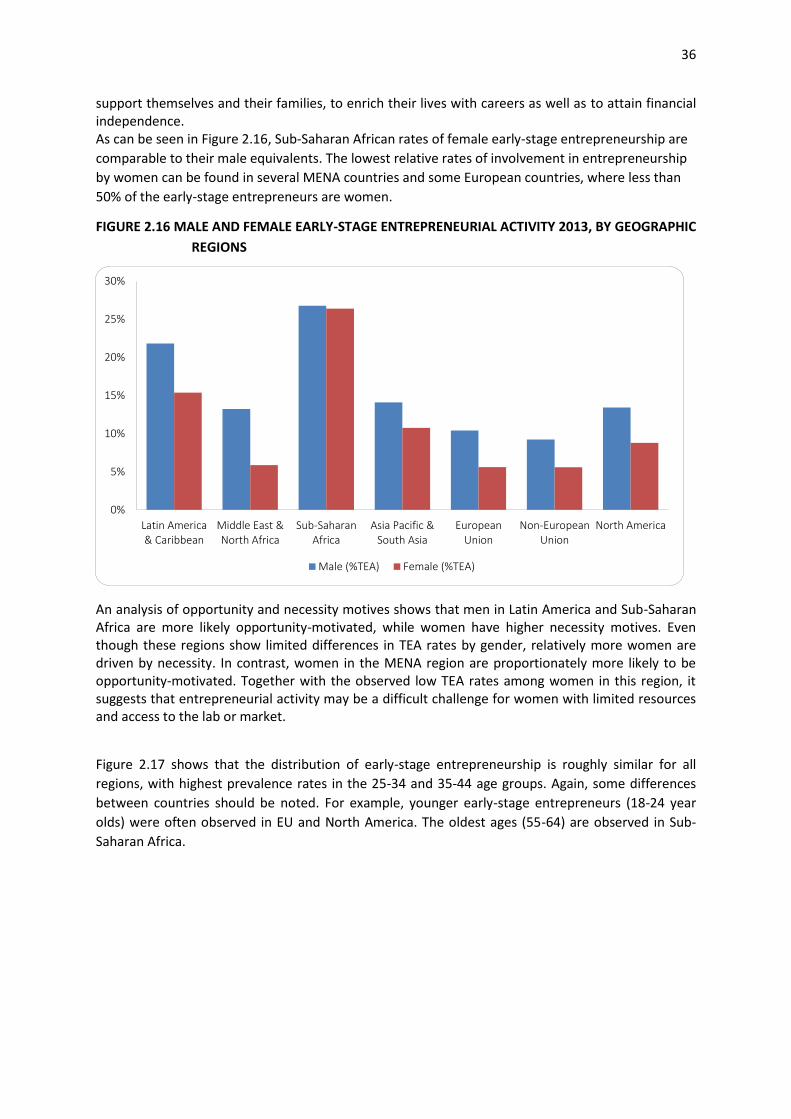
36
support themselves and their families, to enrich their lives with careers as well as to attain financial independence. As can be seen in Figure 2.16, Sub-Saharan African rates of female early-stage entrepreneurship are
comparable to their male equivalents. The lowest relative rates of involvement in entrepreneurship
by women can be found in several MENA countries and some European countries, where less than
50% of the early-stage entrepreneurs are women.
FIGURE 2.16 MALE AND FEMALE EARLY-STAGE ENTREPRENEURIAL ACTIVITY 2013, BY GEOGRAPHIC
REGIONS
An analysis of opportunity and necessity motives shows that men in Latin America and Sub-Saharan Africa are more likely opportunity-motivated, while women have higher necessity motives. Even though these regions show limited differences in TEA rates by gender, relatively more women are driven by necessity. In contrast, women in the MENA region are proportionately more likely to be opportunity-motivated. Together with the observed low TEA rates among women in this region, it suggests that entrepreneurial activity may be a difficult challenge for women with limited resources and access to the lab or market.
Figure 2.17 shows that the distribution of early-stage entrepreneurship is roughly similar for all
regions, with highest prevalence rates in the 25-34 and 35-44 age groups. Again, some differences
between countries should be noted. For example, younger early-stage entrepreneurs (18-24 year
olds) were often observed in EU and North America. The oldest ages (55-64) are observed in Sub-
Saharan Africa.
0%
5%
10%
15%
20%
25%
30%
Latin America& Caribbean
Middle East &North Africa
Sub-SaharanAfrica
Asia Pacific &South Asia
EuropeanUnion
Non-EuropeanUnion
North America
Male (%TEA) Female (%TEA)
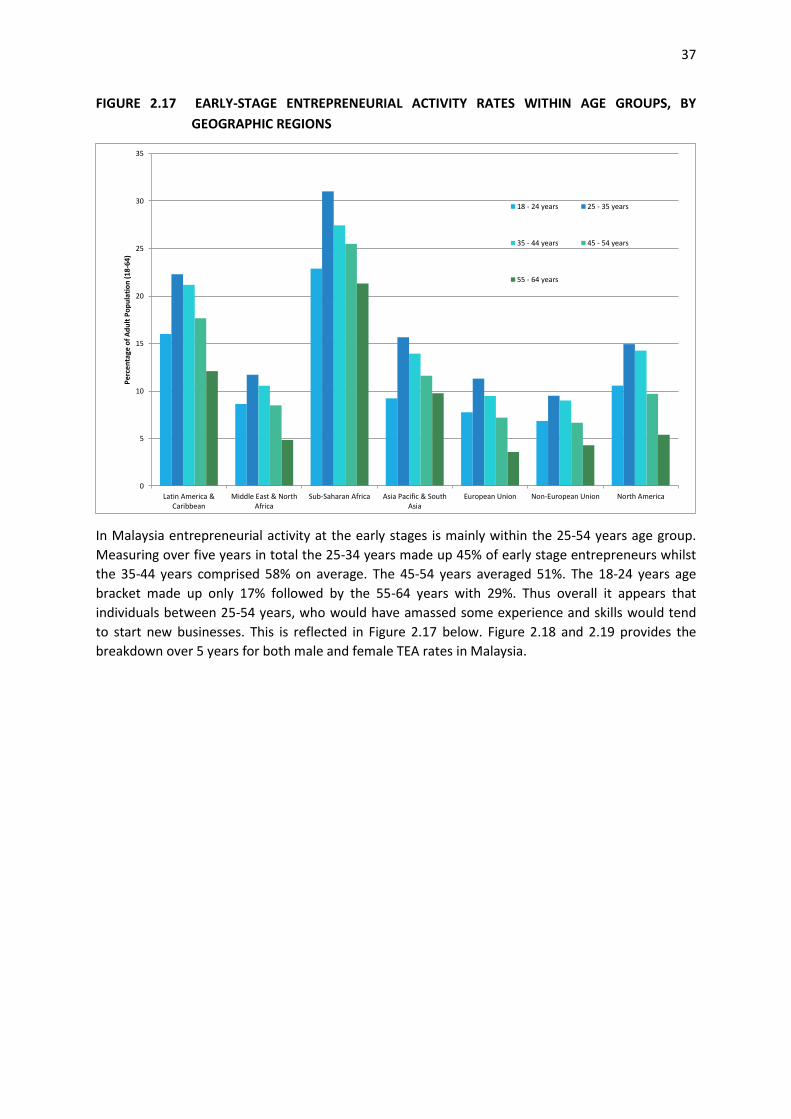
37
FIGURE 2.17 EARLY-STAGE ENTREPRENEURIAL ACTIVITY RATES WITHIN AGE GROUPS, BY
GEOGRAPHIC REGIONS
In Malaysia entrepreneurial activity at the early stages is mainly within the 25-54 years age group.
Measuring over five years in total the 25-34 years made up 45% of early stage entrepreneurs whilst
the 35-44 years comprised 58% on average. The 45-54 years averaged 51%. The 18-24 years age
bracket made up only 17% followed by the 55-64 years with 29%. Thus overall it appears that
individuals between 25-54 years, who would have amassed some experience and skills would tend
to start new businesses. This is reflected in Figure 2.17 below. Figure 2.18 and 2.19 provides the
breakdown over 5 years for both male and female TEA rates in Malaysia.
0
5
10
15
20
25
30
35
Latin America &Caribbean
Middle East & NorthAfrica
Sub-Saharan Africa Asia Pacific & SouthAsia
European Union Non-European Union North America
Per
cen
tage
of
Ad
ult
Po
pu
lati
on
(18
-64)
18 - 24 years 25 - 35 years
35 - 44 years 45 - 54 years
55 - 64 years
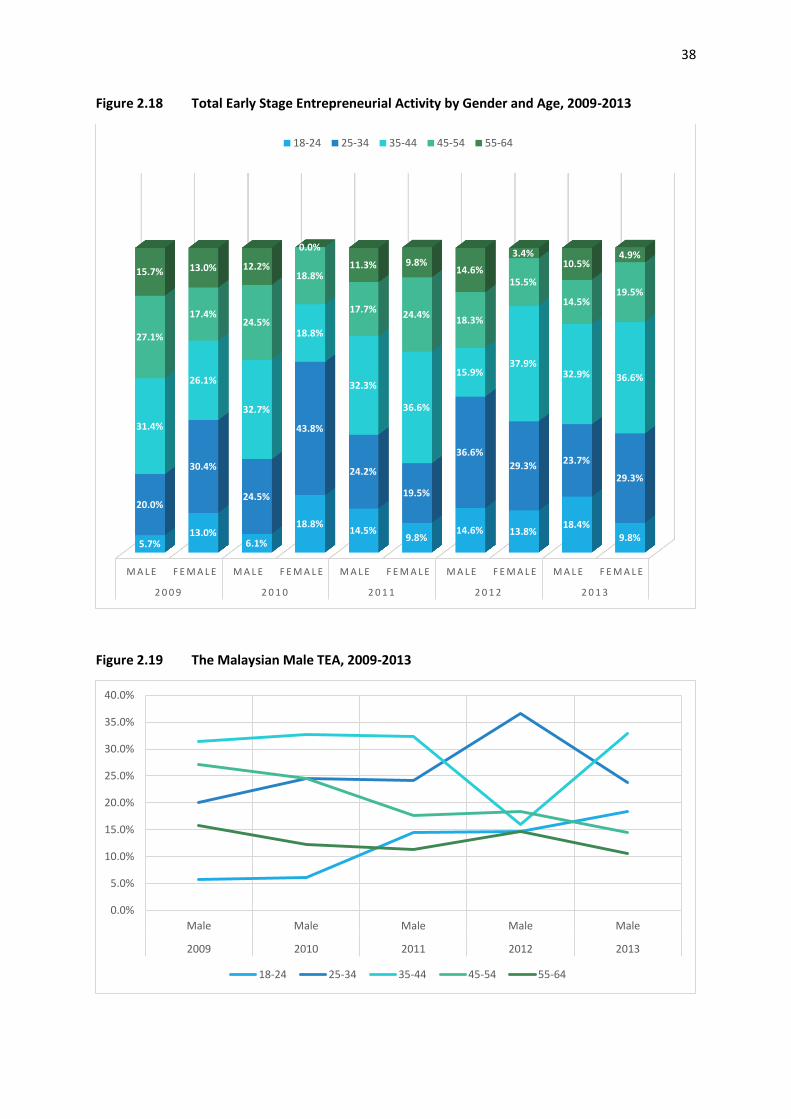
38
Figure 2.18 Total Early Stage Entrepreneurial Activity by Gender and Age, 2009-2013
Figure 2.19 The Malaysian Male TEA, 2009-2013
M A L E F E M A L E M A L E F E M A L E M A L E F E M A L E M A L E F E M A L E M A L E F E M A L E
2 0 0 9 2 0 1 0 2 0 1 1 2 0 1 2 2 0 1 3
5.7% 13.0%
6.1%
18.8% 14.5%
9.8% 14.6% 13.8%
18.4% 9.8%
20.0%
30.4%
24.5%
43.8%
24.2%
19.5%
36.6%
29.3% 23.7%
29.3%
31.4%
26.1%
32.7%
18.8%
32.3%
36.6%
15.9% 37.9%
32.9% 36.6%
27.1%
17.4% 24.5%
18.8%
17.7% 24.4% 18.3%
15.5%
14.5% 19.5%
15.7% 13.0% 12.2%
0.0%
11.3% 9.8% 14.6%
3.4% 10.5%
4.9%
18-24 25-34 35-44 45-54 55-64
0.0%
5.0%
10.0%
15.0%
20.0%
25.0%
30.0%
35.0%
40.0%
Male Male Male Male Male
2009 2010 2011 2012 2013
18-24 25-34 35-44 45-54 55-64
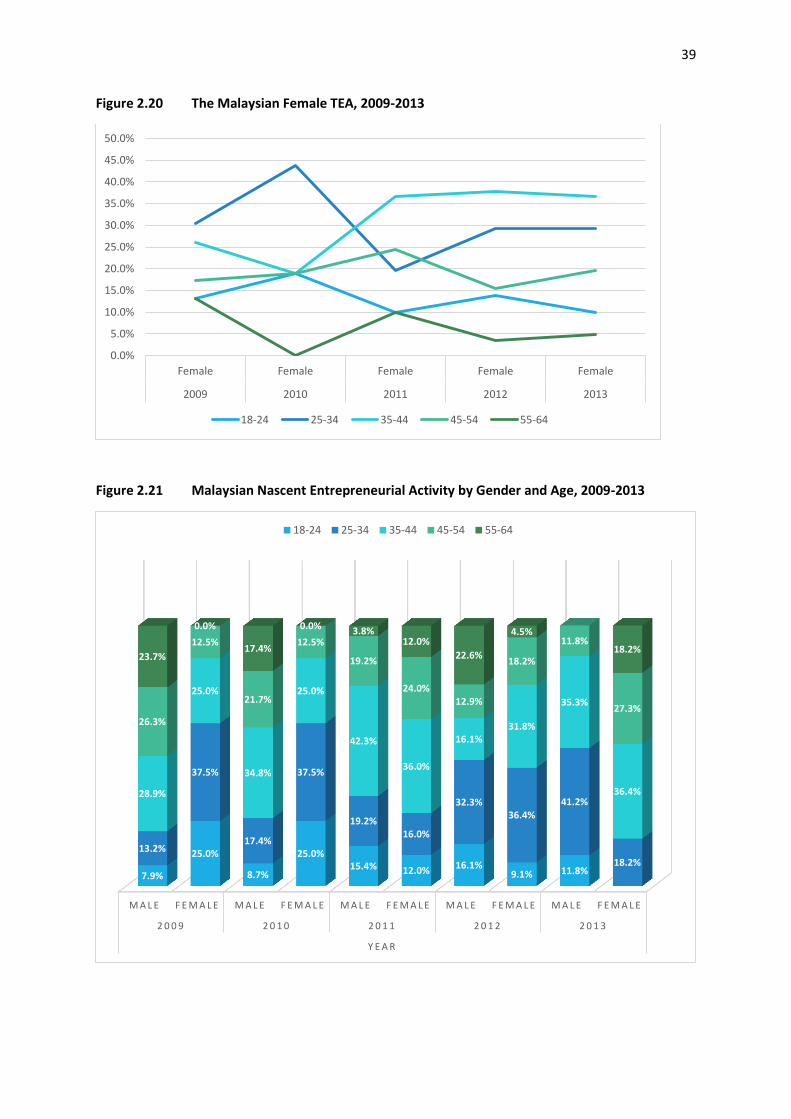
39
Figure 2.20 The Malaysian Female TEA, 2009-2013
Figure 2.21 Malaysian Nascent Entrepreneurial Activity by Gender and Age, 2009-2013
0.0%
5.0%
10.0%
15.0%
20.0%
25.0%
30.0%
35.0%
40.0%
45.0%
50.0%
Female Female Female Female Female
2009 2010 2011 2012 2013
18-24 25-34 35-44 45-54 55-64
M A L E F E M A L E M A L E F E M A L E M A L E F E M A L E M A L E F E M A L E M A L E F E M A L E
2 0 0 9 2 0 1 0 2 0 1 1 2 0 1 2 2 0 1 3
Y E A R
7.9%
25.0%
8.7%
25.0% 15.4% 12.0% 16.1%
9.1% 11.8%
13.2%
37.5%
17.4%
37.5%
19.2% 16.0%
32.3% 36.4%
41.2%
18.2%
28.9%
25.0%
34.8%
25.0%
42.3%
36.0%
16.1% 31.8%
35.3%
36.4%
26.3%
12.5%
21.7%
12.5%
19.2%
24.0% 12.9%
18.2%
11.8%
27.3%
23.7%
0.0%
17.4%
0.0% 3.8% 12.0%
22.6%
4.5%
18.2%
18-24 25-34 35-44 45-54 55-64
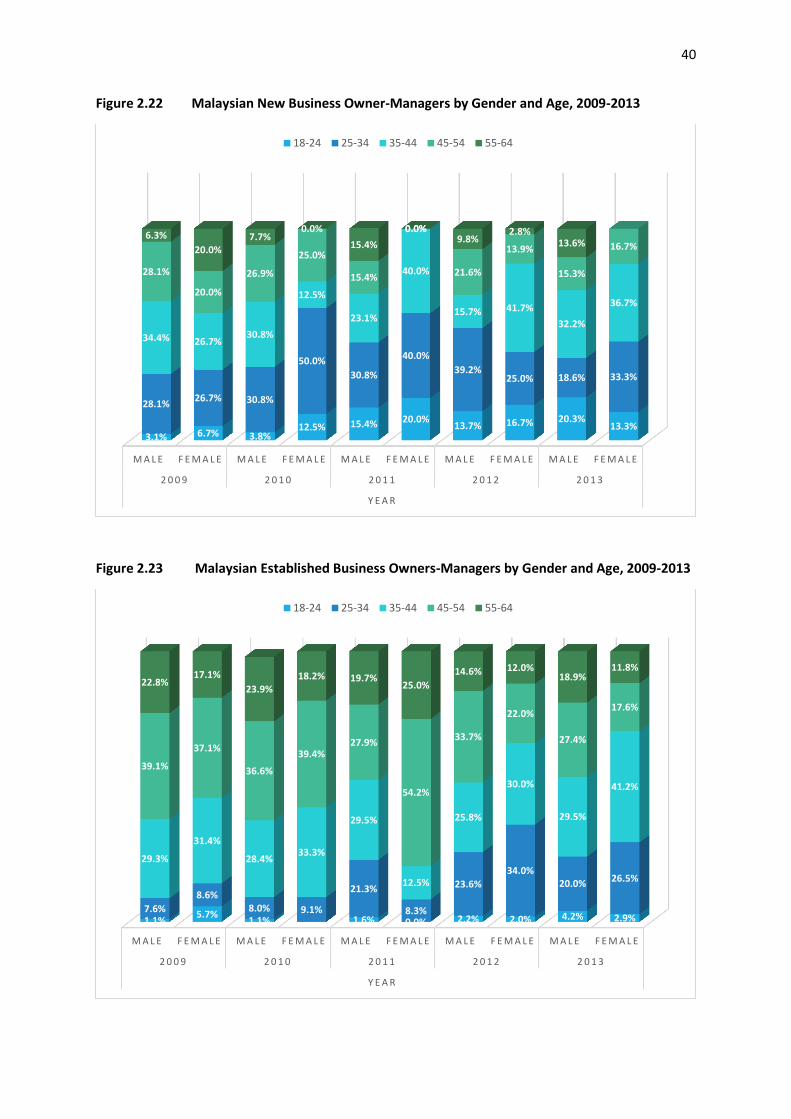
40
Figure 2.22 Malaysian New Business Owner-Managers by Gender and Age, 2009-2013
Figure 2.23 Malaysian Established Business Owners-Managers by Gender and Age, 2009-2013
M A L E F E M A L E M A L E F E M A L E M A L E F E M A L E M A L E F E M A L E M A L E F E M A L E
2 0 0 9 2 0 1 0 2 0 1 1 2 0 1 2 2 0 1 3
Y E A R
3.1% 6.7% 3.8% 12.5% 15.4% 20.0%
13.7% 16.7% 20.3% 13.3%
28.1% 26.7% 30.8%
50.0%
30.8%
40.0%
39.2% 25.0% 18.6% 33.3%
34.4% 26.7% 30.8%
12.5%
23.1%
40.0%
15.7% 41.7%
32.2%
36.7%
28.1%
20.0%
26.9%
25.0%
15.4%
0.0%
21.6%
13.9%
15.3%
16.7% 6.3%
20.0% 7.7%
0.0%
15.4%
0.0% 9.8%
2.8% 13.6%
18-24 25-34 35-44 45-54 55-64
M A L E F E M A L E M A L E F E M A L E M A L E F E M A L E M A L E F E M A L E M A L E F E M A L E
2 0 0 9 2 0 1 0 2 0 1 1 2 0 1 2 2 0 1 3
Y E A R
1.1% 5.7%
1.1% 1.6% 0.0% 2.2% 2.0% 4.2% 2.9% 7.6%
8.6% 8.0% 9.1%
21.3%
8.3%
23.6%
34.0% 20.0% 26.5%
29.3%
31.4%
28.4% 33.3%
29.5%
12.5%
25.8%
30.0%
29.5%
41.2%
39.1%
37.1%
36.6%
39.4% 27.9%
54.2%
33.7%
22.0%
27.4%
17.6%
22.8% 17.1%
23.9% 18.2% 19.7%
25.0%
14.6% 12.0% 18.9%
11.8%
18-24 25-34 35-44 45-54 55-64
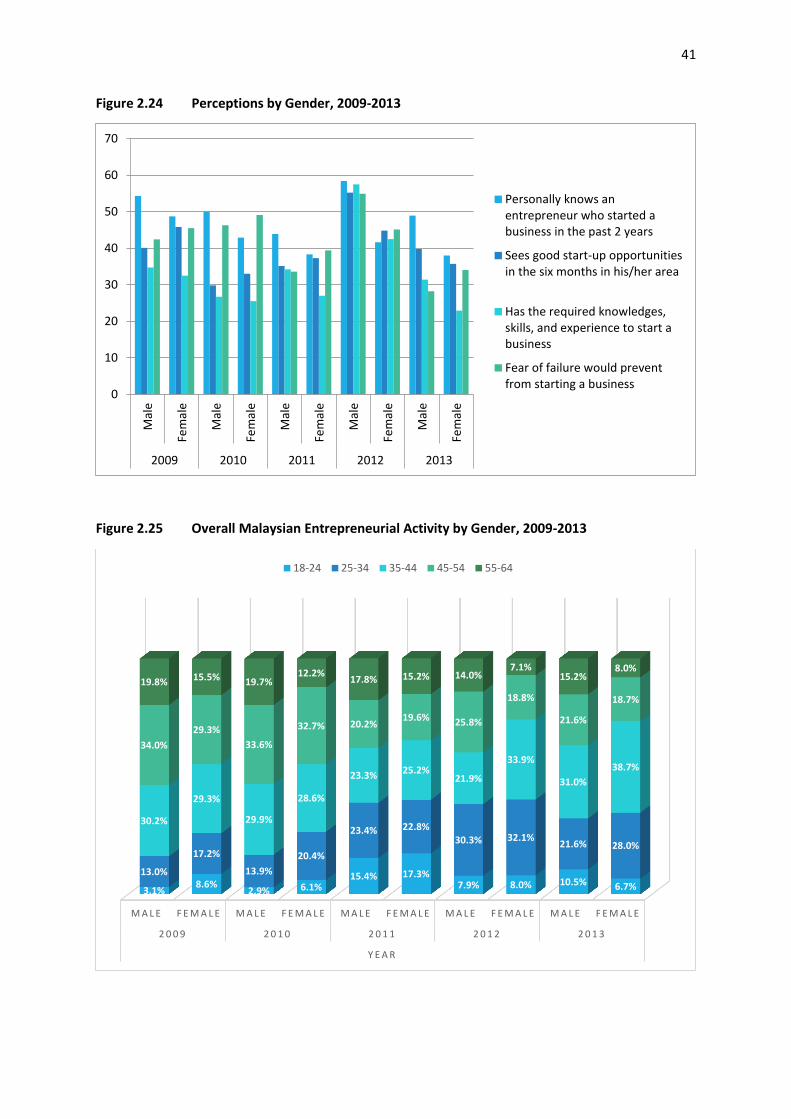
41
Figure 2.24 Perceptions by Gender, 2009-2013
Figure 2.25 Overall Malaysian Entrepreneurial Activity by Gender, 2009-2013
0
10
20
30
40
50
60
70M
ale
Fem
ale
Mal
e
Fem
ale
Mal
e
Fem
ale
Mal
e
Fem
ale
Mal
e
Fem
ale
2009 2010 2011 2012 2013
Personally knows anentrepreneur who started abusiness in the past 2 years
Sees good start-up opportunitiesin the six months in his/her area
Has the required knowledges,skills, and experience to start abusiness
Fear of failure would preventfrom starting a business
M A L E F E M A L E M A L E F E M A L E M A L E F E M A L E M A L E F E M A L E M A L E F E M A L E
2 0 0 9 2 0 1 0 2 0 1 1 2 0 1 2 2 0 1 3
Y E A R
3.1% 8.6%
2.9% 6.1% 15.4% 17.3%
7.9% 8.0% 10.5% 6.7%
13.0%
17.2%
13.9%
20.4%
23.4% 22.8% 30.3% 32.1%
21.6% 28.0%
30.2%
29.3%
29.9%
28.6%
23.3% 25.2% 21.9%
33.9%
31.0%
38.7%
34.0%
29.3%
33.6%
32.7% 20.2% 19.6% 25.8%
18.8%
21.6%
18.7%
19.8% 15.5% 19.7% 12.2%
17.8% 15.2% 14.0% 7.1%
15.2% 8.0%
18-24 25-34 35-44 45-54 55-64
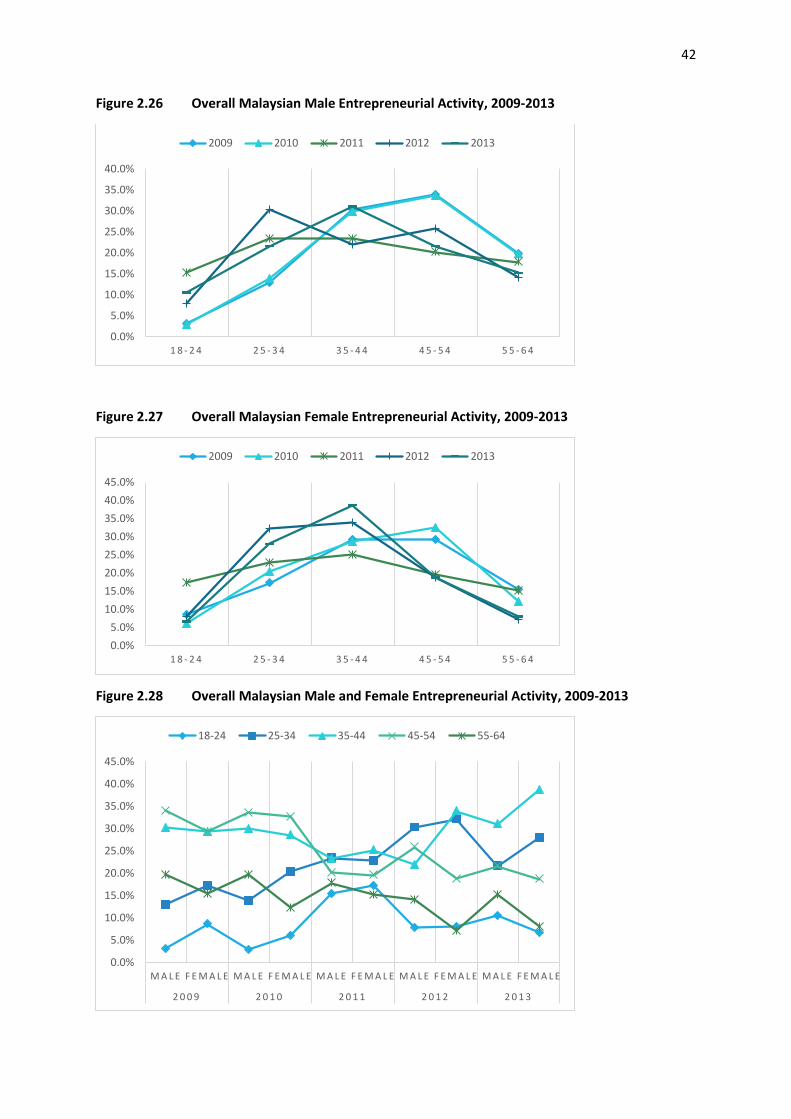
42
Figure 2.26 Overall Malaysian Male Entrepreneurial Activity, 2009-2013
Figure 2.27 Overall Malaysian Female Entrepreneurial Activity, 2009-2013
Figure 2.28 Overall Malaysian Male and Female Entrepreneurial Activity, 2009-2013
0.0%
5.0%
10.0%
15.0%
20.0%
25.0%
30.0%
35.0%
40.0%
1 8 - 2 4 2 5 - 3 4 3 5 - 4 4 4 5 - 5 4 5 5 - 6 4
2009 2010 2011 2012 2013
0.0%
5.0%
10.0%
15.0%
20.0%
25.0%
30.0%
35.0%
40.0%
45.0%
1 8 - 2 4 2 5 - 3 4 3 5 - 4 4 4 5 - 5 4 5 5 - 6 4
2009 2010 2011 2012 2013
0.0%
5.0%
10.0%
15.0%
20.0%
25.0%
30.0%
35.0%
40.0%
45.0%
M A L E F E M A L E M A L E F E M A L E M A L E F E M A L E M A L E F E M A L E M A L E F E M A L E
2 0 0 9 2 0 1 0 2 0 1 1 2 0 1 2 2 0 1 3
18-24 25-34 35-44 45-54 55-64
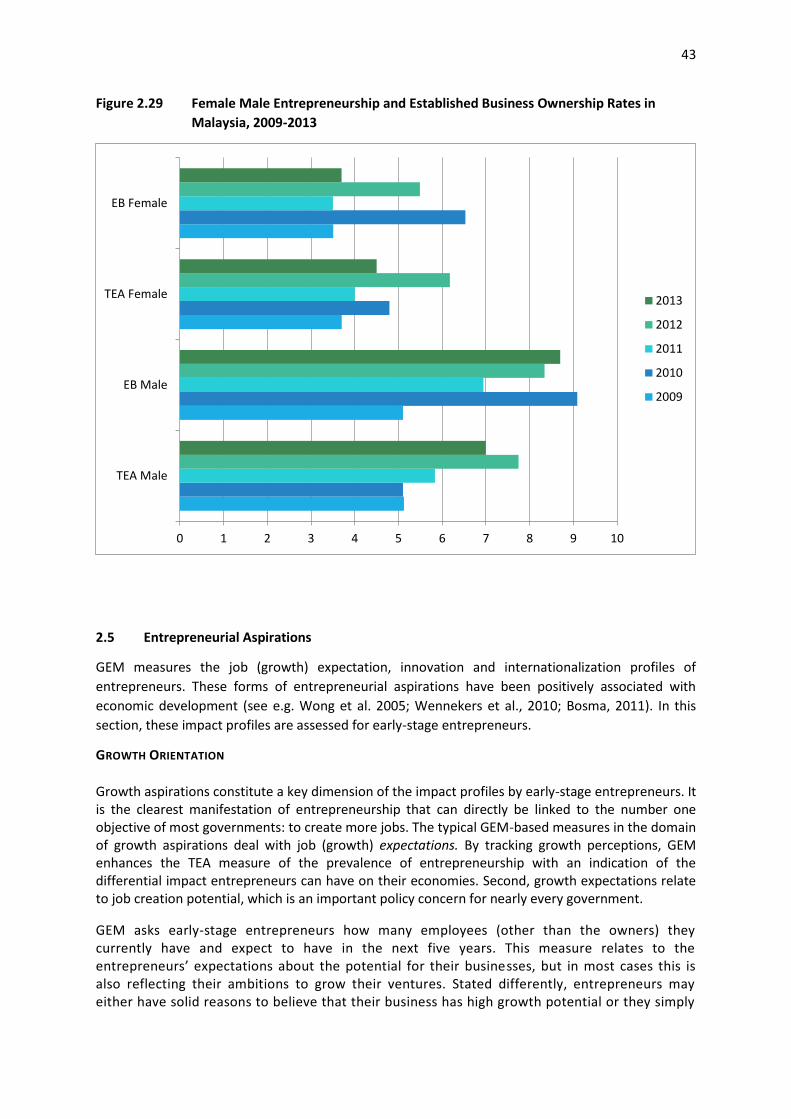
43
Figure 2.29 Female Male Entrepreneurship and Established Business Ownership Rates in
Malaysia, 2009-2013
2.5 Entrepreneurial Aspirations
GEM measures the job (growth) expectation, innovation and internationalization profiles of
entrepreneurs. These forms of entrepreneurial aspirations have been positively associated with
economic development (see e.g. Wong et al. 2005; Wennekers et al., 2010; Bosma, 2011). In this
section, these impact profiles are assessed for early-stage entrepreneurs.
GROWTH ORIENTATION
Growth aspirations constitute a key dimension of the impact profiles by early-stage entrepreneurs. It is the clearest manifestation of entrepreneurship that can directly be linked to the number one objective of most governments: to create more jobs. The typical GEM-based measures in the domain of growth aspirations deal with job (growth) expectations. By tracking growth perceptions, GEM enhances the TEA measure of the prevalence of entrepreneurship with an indication of the differential impact entrepreneurs can have on their economies. Second, growth expectations relate to job creation potential, which is an important policy concern for nearly every government.
GEM asks early-stage entrepreneurs how many employees (other than the owners) they currently have and expect to have in the next five years. This measure relates to the entrepreneurs’ expectations about the potential for their businesses, but in most cases this is also reflecting their ambitions to grow their ventures. Stated differently, entrepreneurs may either have solid reasons to believe that their business has high growth potential or they simply
0 1 2 3 4 5 6 7 8 9 10
TEA Male
EB Male
TEA Female
EB Female
2013
2012
2011
2010
2009
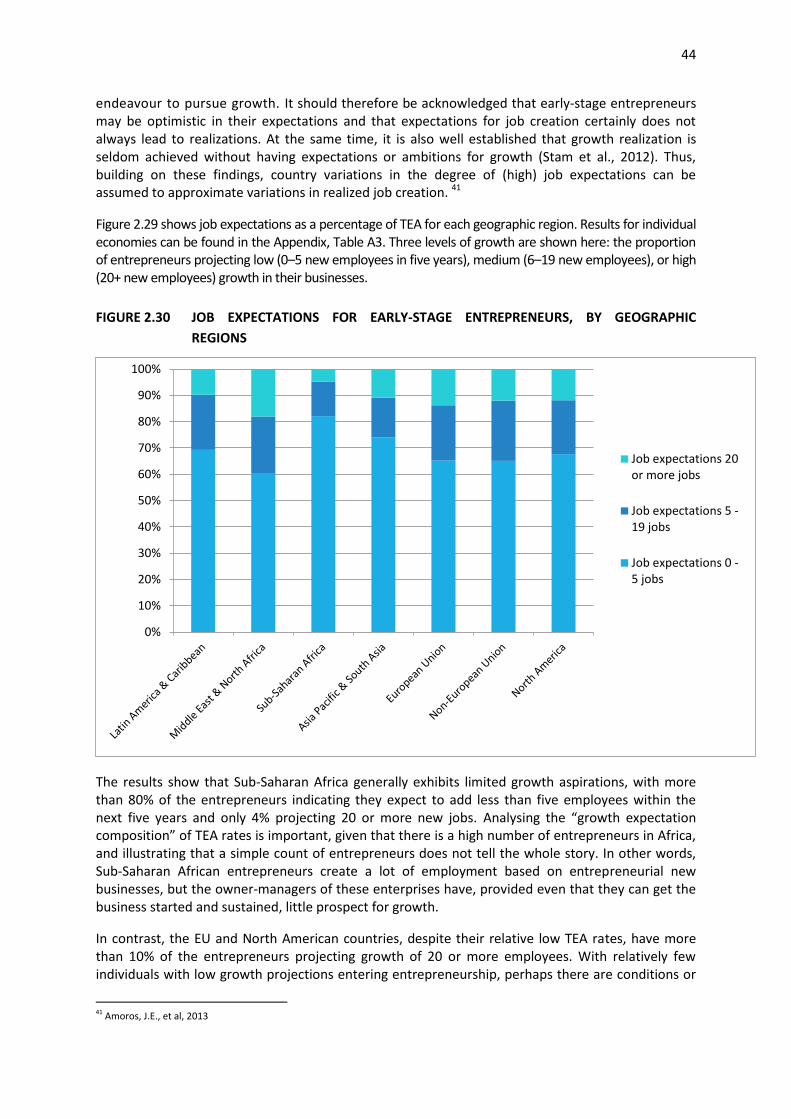
44
endeavour to pursue growth. It should therefore be acknowledged that early-stage entrepreneurs may be optimistic in their expectations and that expectations for job creation certainly does not always lead to realizations. At the same time, it is also well established that growth realization is seldom achieved without having expectations or ambitions for growth (Stam et al., 2012). Thus, building on these findings, country variations in the degree of (high) job expectations can be assumed to approximate variations in realized job creation. 41
Figure 2.29 shows job expectations as a percentage of TEA for each geographic region. Results for individual economies can be found in the Appendix, Table A3. Three levels of growth are shown here: the proportion of entrepreneurs projecting low (0–5 new employees in five years), medium (6–19 new employees), or high (20+ new employees) growth in their businesses.
FIGURE 2.30 JOB EXPECTATIONS FOR EARLY-STAGE ENTREPRENEURS, BY GEOGRAPHIC
REGIONS
The results show that Sub-Saharan Africa generally exhibits limited growth aspirations, with more than 80% of the entrepreneurs indicating they expect to add less than five employees within the next five years and only 4% projecting 20 or more new jobs. Analysing the “growth expectation composition” of TEA rates is important, given that there is a high number of entrepreneurs in Africa, and illustrating that a simple count of entrepreneurs does not tell the whole story. In other words, Sub-Saharan African entrepreneurs create a lot of employment based on entrepreneurial new businesses, but the owner-managers of these enterprises have, provided even that they can get the business started and sustained, little prospect for growth.
In contrast, the EU and North American countries, despite their relative low TEA rates, have more than 10% of the entrepreneurs projecting growth of 20 or more employees. With relatively few individuals with low growth projections entering entrepreneurship, perhaps there are conditions or
41 Amoros, J.E., et al, 2013
0%
10%
20%
30%
40%
50%
60%
70%
80%
90%
100%
Job expectations 20or more jobs
Job expectations 5 -19 jobs
Job expectations 0 -5 jobs
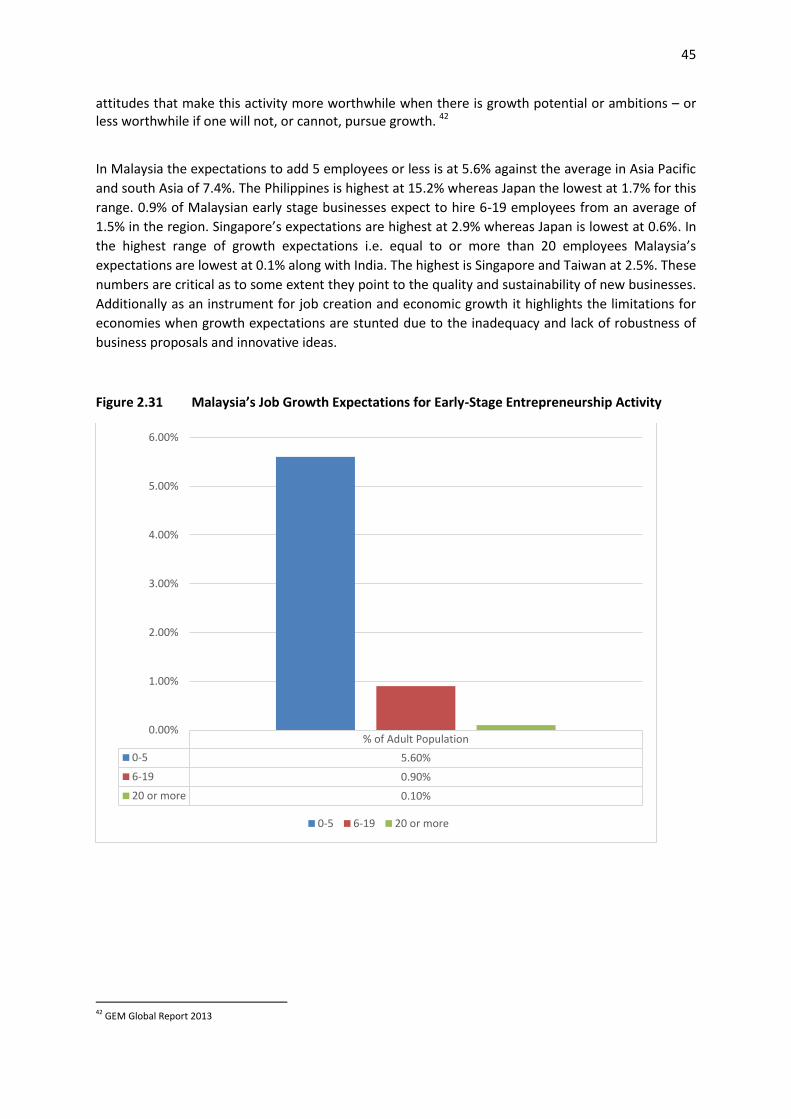
45
attitudes that make this activity more worthwhile when there is growth potential or ambitions – or less worthwhile if one will not, or cannot, pursue growth. 42
In Malaysia the expectations to add 5 employees or less is at 5.6% against the average in Asia Pacific
and south Asia of 7.4%. The Philippines is highest at 15.2% whereas Japan the lowest at 1.7% for this
range. 0.9% of Malaysian early stage businesses expect to hire 6-19 employees from an average of
1.5% in the region. Singapore’s expectations are highest at 2.9% whereas Japan is lowest at 0.6%. In
the highest range of growth expectations i.e. equal to or more than 20 employees Malaysia’s
expectations are lowest at 0.1% along with India. The highest is Singapore and Taiwan at 2.5%. These
numbers are critical as to some extent they point to the quality and sustainability of new businesses.
Additionally as an instrument for job creation and economic growth it highlights the limitations for
economies when growth expectations are stunted due to the inadequacy and lack of robustness of
business proposals and innovative ideas.
Figure 2.31 Malaysia’s Job Growth Expectations for Early-Stage Entrepreneurship Activity
42 GEM Global Report 2013
% of Adult Population
0-5 5.60%
6-19 0.90%
20 or more 0.10%
0.00%
1.00%
2.00%
3.00%
4.00%
5.00%
6.00%
0-5 6-19 20 or more
46
INNOVATIVE ORIENTATION
Innovation is seen as products in new combinations which to a large extent obliterates older out of
date products and services and engages the cutting edge; this is the Schumpeterian view
(Schumpeter, 1942). It represents the perceived extent to which an entrepreneur’s product or
service is new to some or all customers and where few or no other businesses offer the same
product. When comparing countries, it must be kept in mind that what may seem new to customers
in one economy may already be familiar to customers in another. Nevertheless, a high degree of
innovative orientation in the former economy is still expected to have a positive impact on economic
development. Innovative orientation as measured in the GEM framework is therefore a context-
dependent measure.43
Figure 2.31 shows the percentage of early-stage entrepreneurs with innovative orientations. We use
two measures: the percentage of TEA that declare they have a product or service that is a novelty
(new) for all or some or their consumers, and the percentage of TEA that declare they are new in the
market with few or no other businesses that offer the same product or service. The average level of
innovation in each regional group increases with the level of economic development. North America
and European Union exhibit the largest proportion in both indicators. Asia Pacific and South Asia,
with countries that are now characterized for their high degree of innovative products like Japan,
Korea or China, show the largest proportion of new products. In contrast, Sub-Saharan countries
exhibit lower proportions of new product with the Non-EU countries. Interestingly, growing
emergent economies like Colombia, Chile, Taiwan and South Africa have high rates of new products
(over 70%) but also high proportions in new markets (over 50%).
43 Amoros, et al (2013)
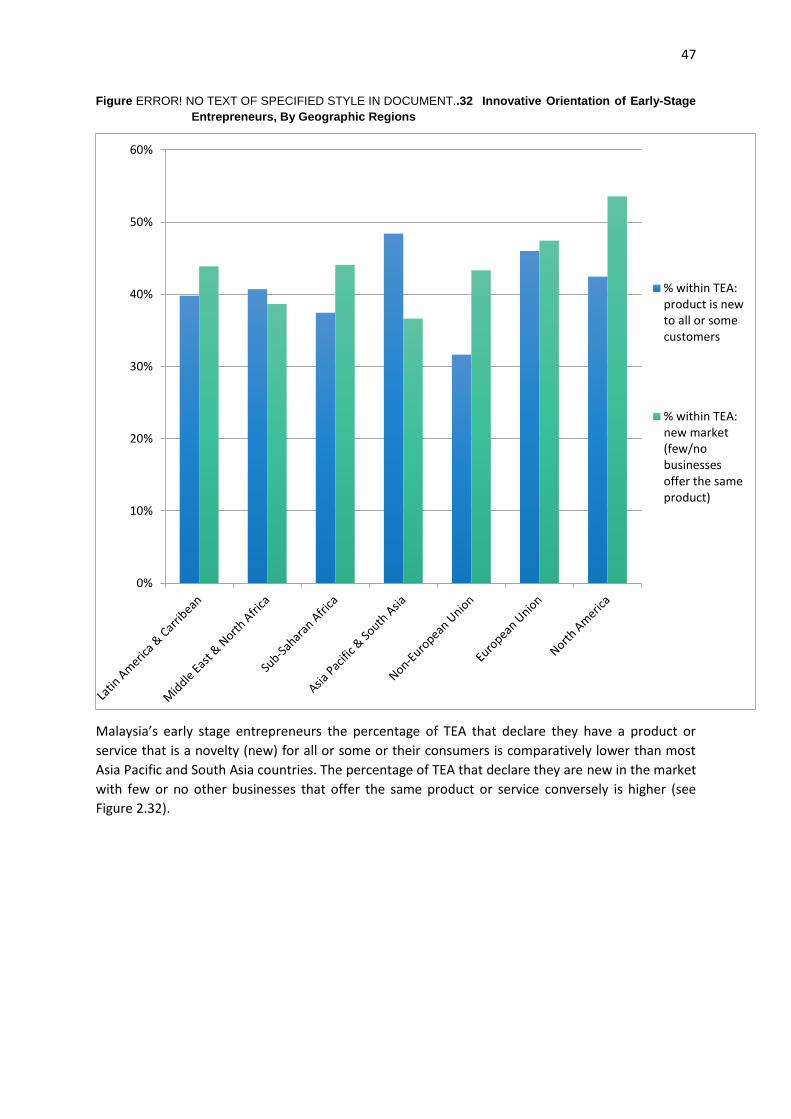
47
Figure ERROR! NO TEXT OF SPECIFIED STYLE IN DOCUMENT..32 Innovative Orientation of Early-Stage
Entrepreneurs, By Geographic Regions
Malaysia’s early stage entrepreneurs the percentage of TEA that declare they have a product or
service that is a novelty (new) for all or some or their consumers is comparatively lower than most
Asia Pacific and South Asia countries. The percentage of TEA that declare they are new in the market
with few or no other businesses that offer the same product or service conversely is higher (see
Figure 2.32).
0%
10%
20%
30%
40%
50%
60%
% within TEA:product is newto all or somecustomers
% within TEA:new market(few/nobusinessesoffer the sameproduct)
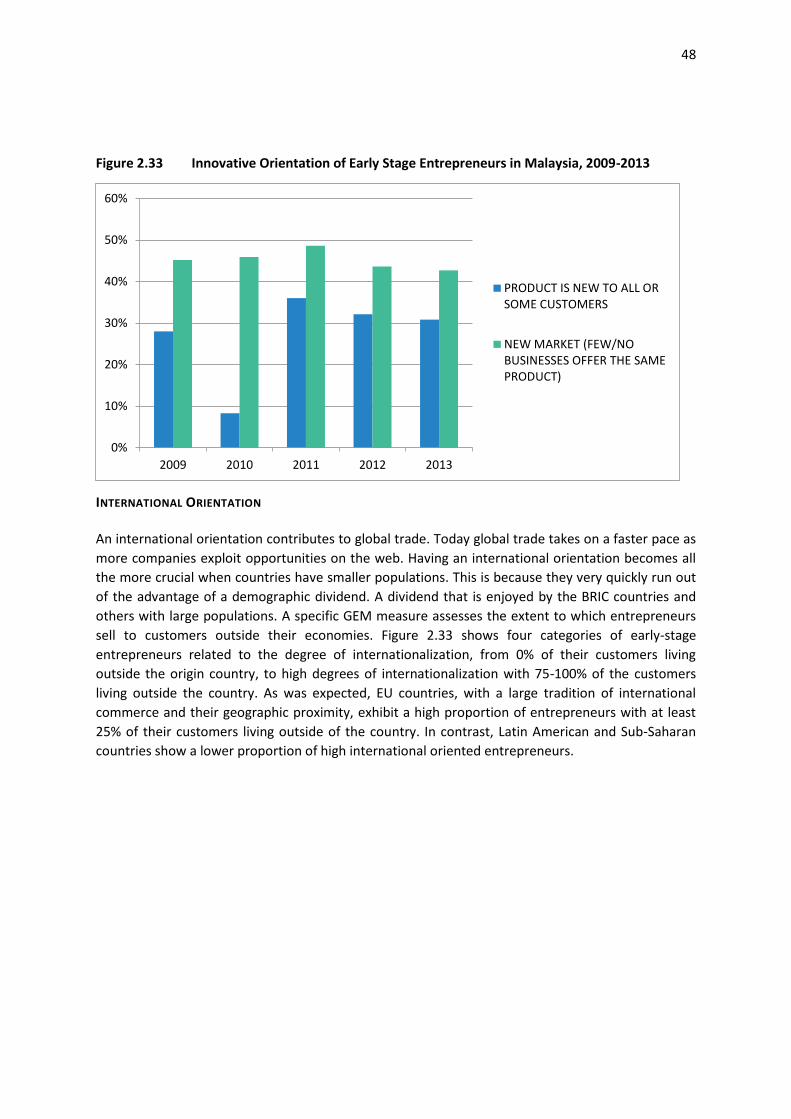
48
Figure 2.33 Innovative Orientation of Early Stage Entrepreneurs in Malaysia, 2009-2013
INTERNATIONAL ORIENTATION
An international orientation contributes to global trade. Today global trade takes on a faster pace as
more companies exploit opportunities on the web. Having an international orientation becomes all
the more crucial when countries have smaller populations. This is because they very quickly run out
of the advantage of a demographic dividend. A dividend that is enjoyed by the BRIC countries and
others with large populations. A specific GEM measure assesses the extent to which entrepreneurs
sell to customers outside their economies. Figure 2.33 shows four categories of early-stage
entrepreneurs related to the degree of internationalization, from 0% of their customers living
outside the origin country, to high degrees of internationalization with 75-100% of the customers
living outside the country. As was expected, EU countries, with a large tradition of international
commerce and their geographic proximity, exhibit a high proportion of entrepreneurs with at least
25% of their customers living outside of the country. In contrast, Latin American and Sub-Saharan
countries show a lower proportion of high international oriented entrepreneurs.
0%
10%
20%
30%
40%
50%
60%
2009 2010 2011 2012 2013
PRODUCT IS NEW TO ALL ORSOME CUSTOMERS
NEW MARKET (FEW/NOBUSINESSES OFFER THE SAMEPRODUCT)
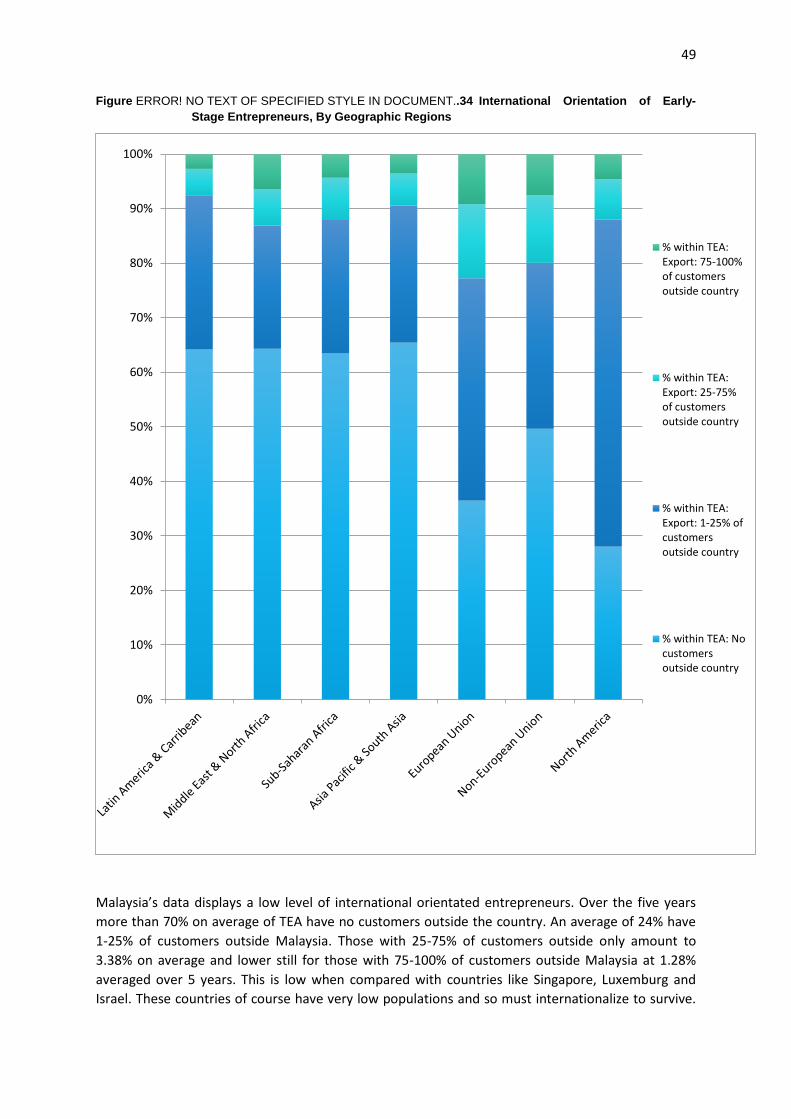
49
Figure ERROR! NO TEXT OF SPECIFIED STYLE IN DOCUMENT..34 International Orientation of Early-
Stage Entrepreneurs, By Geographic Regions
Malaysia’s data displays a low level of international orientated entrepreneurs. Over the five years
more than 70% on average of TEA have no customers outside the country. An average of 24% have
1-25% of customers outside Malaysia. Those with 25-75% of customers outside only amount to
3.38% on average and lower still for those with 75-100% of customers outside Malaysia at 1.28%
averaged over 5 years. This is low when compared with countries like Singapore, Luxemburg and
Israel. These countries of course have very low populations and so must internationalize to survive.
0%
10%
20%
30%
40%
50%
60%
70%
80%
90%
100%
% within TEA:Export: 75-100%of customersoutside country
% within TEA:Export: 25-75%of customersoutside country
% within TEA:Export: 1-25% ofcustomersoutside country
% within TEA: Nocustomersoutside country
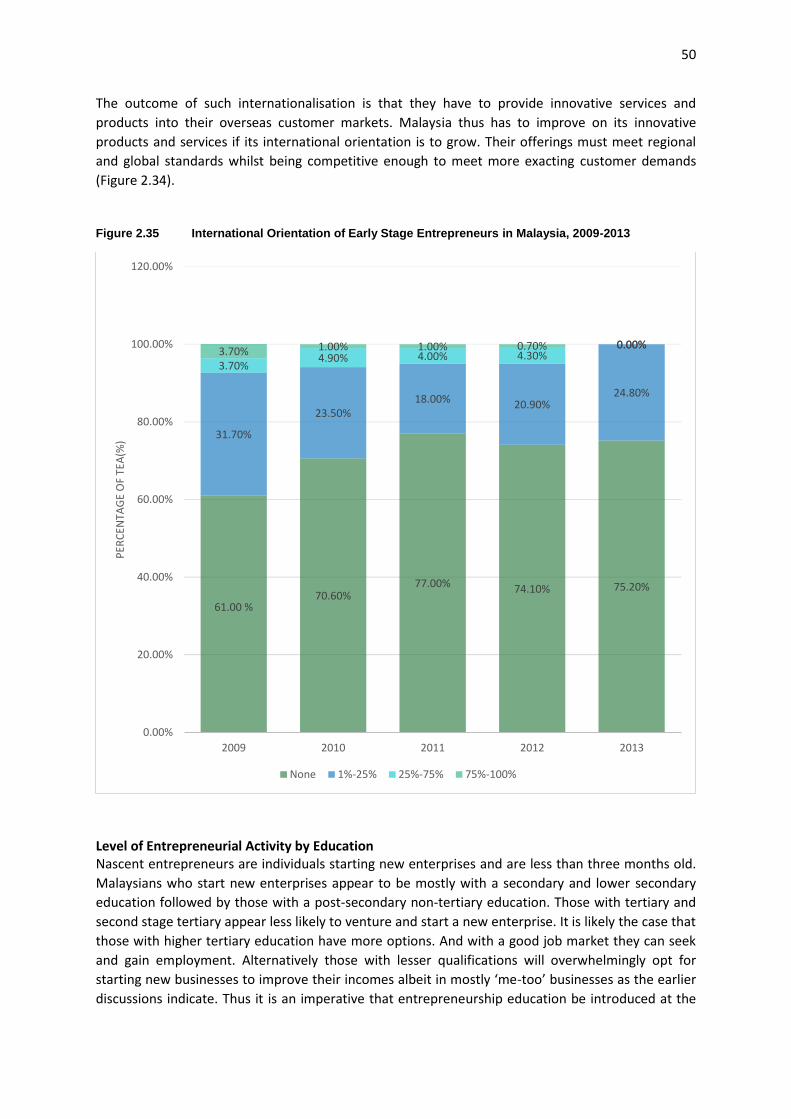
50
The outcome of such internationalisation is that they have to provide innovative services and
products into their overseas customer markets. Malaysia thus has to improve on its innovative
products and services if its international orientation is to grow. Their offerings must meet regional
and global standards whilst being competitive enough to meet more exacting customer demands
(Figure 2.34).
Figure 2.35 International Orientation of Early Stage Entrepreneurs in Malaysia, 2009-2013
Level of Entrepreneurial Activity by Education Nascent entrepreneurs are individuals starting new enterprises and are less than three months old.
Malaysians who start new enterprises appear to be mostly with a secondary and lower secondary
education followed by those with a post-secondary non-tertiary education. Those with tertiary and
second stage tertiary appear less likely to venture and start a new enterprise. It is likely the case that
those with higher tertiary education have more options. And with a good job market they can seek
and gain employment. Alternatively those with lesser qualifications will overwhelmingly opt for
starting new businesses to improve their incomes albeit in mostly ‘me-too’ businesses as the earlier
discussions indicate. Thus it is an imperative that entrepreneurship education be introduced at the
61.00 %
70.60% 77.00% 74.10% 75.20%
31.70%
23.50% 18.00% 20.90%
24.80%
3.70% 4.90% 4.00% 4.30%
0.00% 3.70% 1.00% 1.00% 0.70% 0.00%
0.00%
20.00%
40.00%
60.00%
80.00%
100.00%
120.00%
2009 2010 2011 2012 2013
PER
CEN
TAG
E O
F TE
A(%
)
None 1%-25% 25%-75% 75%-100%
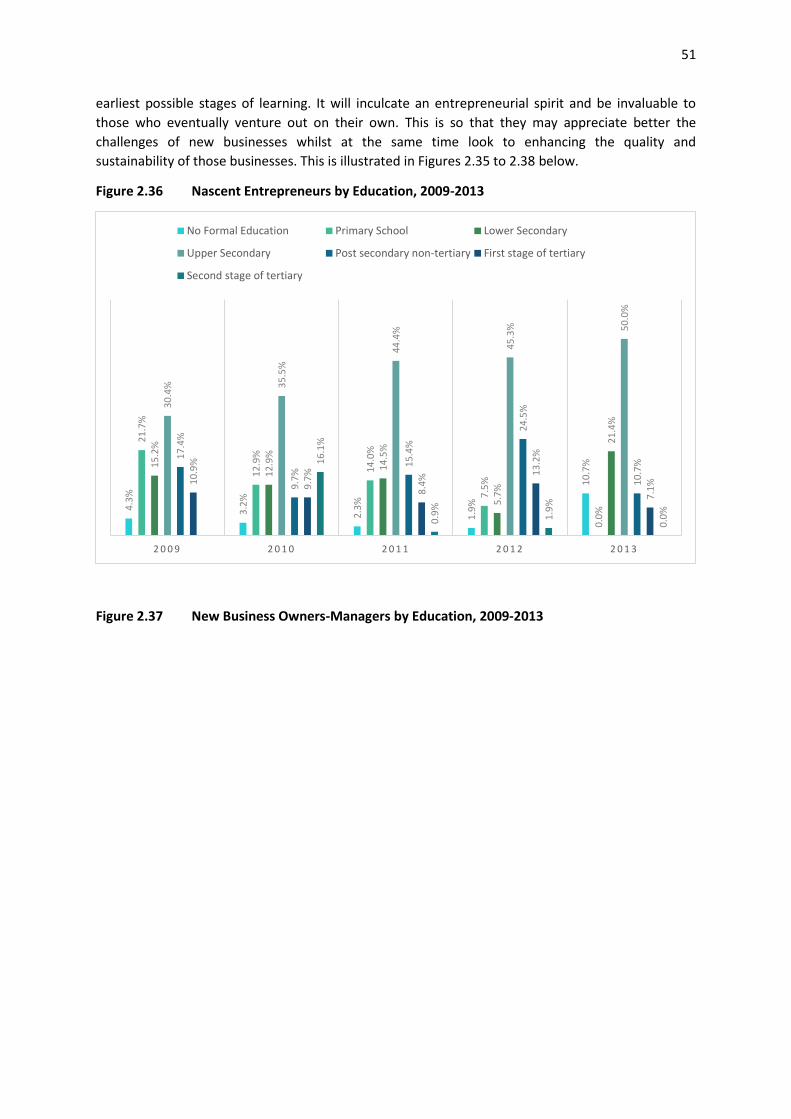
51
earliest possible stages of learning. It will inculcate an entrepreneurial spirit and be invaluable to
those who eventually venture out on their own. This is so that they may appreciate better the
challenges of new businesses whilst at the same time look to enhancing the quality and
sustainability of those businesses. This is illustrated in Figures 2.35 to 2.38 below.
Figure 2.36 Nascent Entrepreneurs by Education, 2009-2013
Figure 2.37 New Business Owners-Managers by Education, 2009-2013
4.3
%
3.2
%
2.3
%
1.9
%
10
.7%
21
.7%
12
.9%
14
.0%
7.5
%
0.0
%
15
.2%
12
.9%
14
.5%
5.7
%
21
.4%
30
.4%
35
.5%
44
.4%
45
.3%
50
.0%
17
.4%
9.7
% 1
5.4
%
24
.5%
10
.7%
10
.9%
9.7
%
8.4
% 13
.2%
7.1
%
16
.1%
0.9
%
1.9
%
0.0
%
2 0 0 9 2 0 1 0 2 0 1 1 2 0 1 2 2 0 1 3
No Formal Education Primary School Lower Secondary
Upper Secondary Post secondary non-tertiary First stage of tertiary
Second stage of tertiary
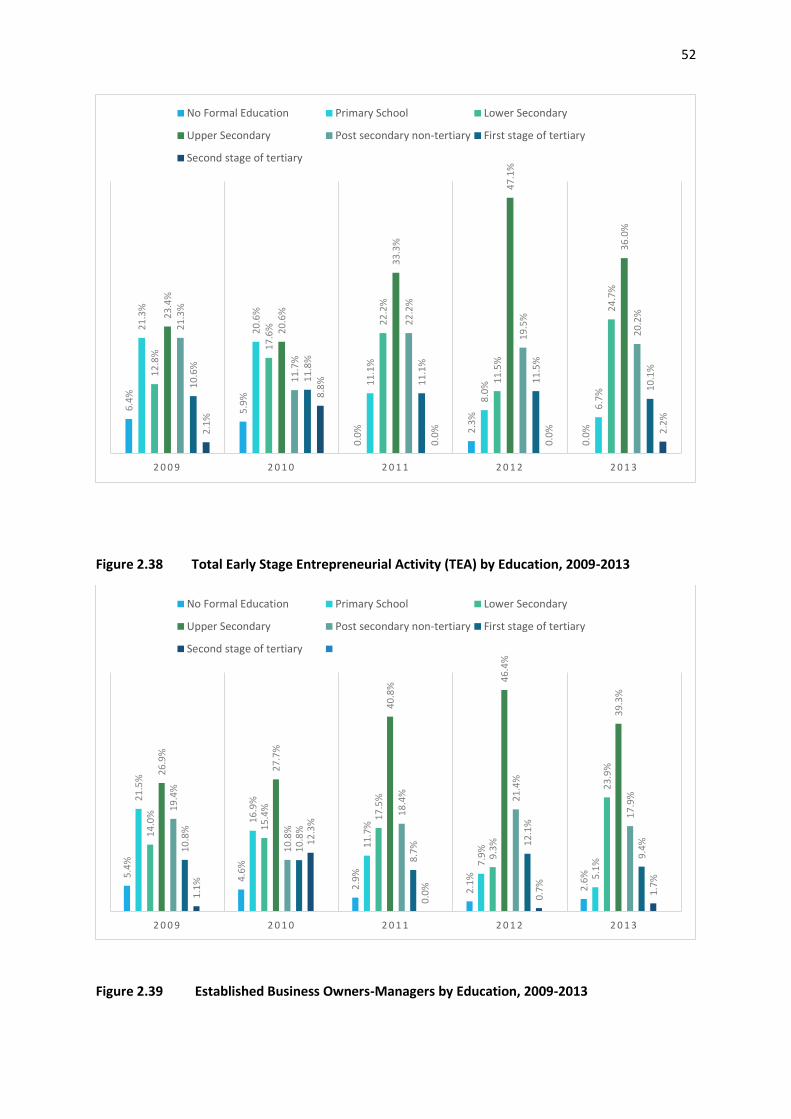
52
Figure 2.38 Total Early Stage Entrepreneurial Activity (TEA) by Education, 2009-2013
Figure 2.39 Established Business Owners-Managers by Education, 2009-2013
6.4
%
5.9
%
0.0
%
2.3
%
0.0
%
21
.3%
20
.6%
11
.1%
8.0
%
6.7
%
12
.8%
17
.6%
22
.2%
11
.5%
24
.7%
23
.4%
20
.6%
33
.3%
47
.1%
36
.0%
21
.3%
11
.7%
22
.2%
19
.5%
20
.2%
10
.6%
11
.8%
11
.1%
11
.5%
10
.1%
2.1
%
8.8
%
0.0
%
0.0
%
2.2
%
2 0 0 9 2 0 1 0 2 0 1 1 2 0 1 2 2 0 1 3
No Formal Education Primary School Lower Secondary
Upper Secondary Post secondary non-tertiary First stage of tertiary
Second stage of tertiary
5.4
%
4.6
%
2.9
%
2.1
%
2.6
%
21
.5%
16
.9%
11
.7%
7.9
%
5.1
%
14
.0%
15
.4%
17
.5%
9.3
%
23
.9%
26
.9%
27
.7%
40
.8%
46
.4%
39
.3%
19
.4%
10
.8%
18
.4%
21
.4%
17
.9%
10
.8%
10
.8%
8.7
% 12
.1%
9.4
%
1.1
%
12
.3%
0.0
%
0.7
%
1.7
%
2 0 0 9 2 0 1 0 2 0 1 1 2 0 1 2 2 0 1 3
No Formal Education Primary School Lower Secondary
Upper Secondary Post secondary non-tertiary First stage of tertiary
Second stage of tertiary
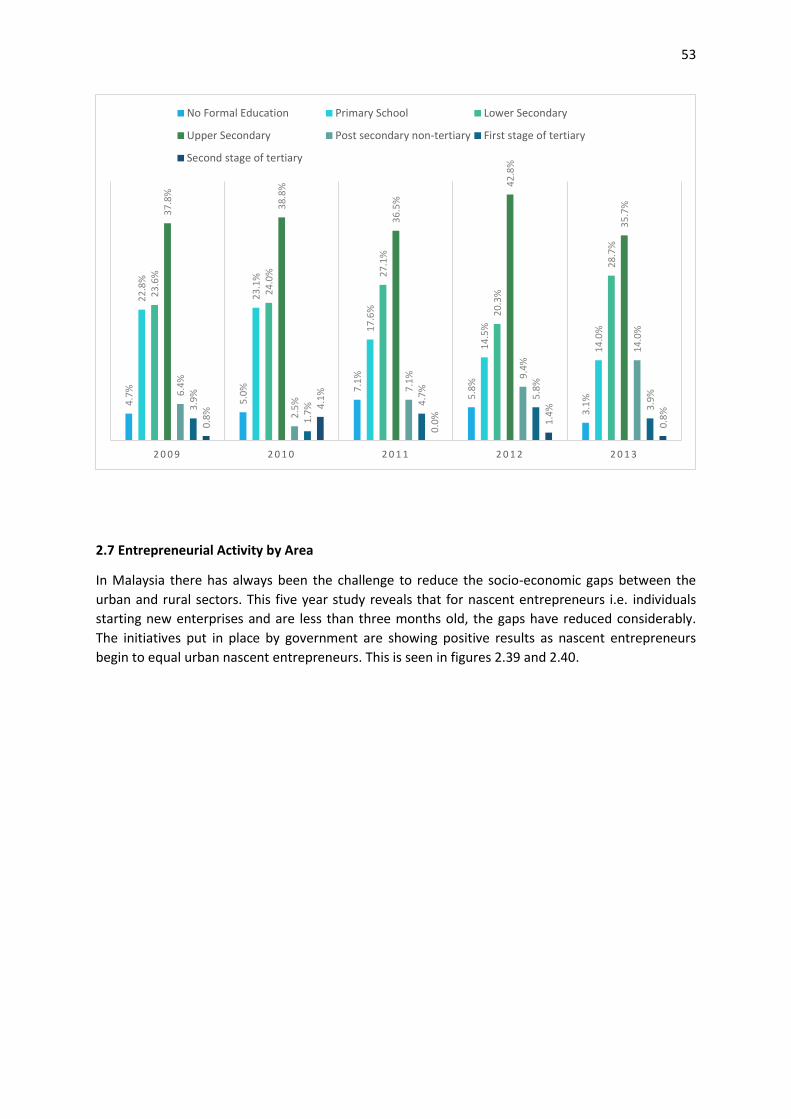
53
2.7 Entrepreneurial Activity by Area
In Malaysia there has always been the challenge to reduce the socio-economic gaps between the
urban and rural sectors. This five year study reveals that for nascent entrepreneurs i.e. individuals
starting new enterprises and are less than three months old, the gaps have reduced considerably.
The initiatives put in place by government are showing positive results as nascent entrepreneurs
begin to equal urban nascent entrepreneurs. This is seen in figures 2.39 and 2.40.
4.7
%
5.0
%
7.1
%
5.8
%
3.1
%
22
.8%
23
.1%
17
.6%
14
.5%
14
.0%
23
.6%
24
.0%
27
.1%
20
.3%
28
.7%
37
.8%
38
.8%
36
.5%
42
.8%
35
.7%
6.4
%
2.5
% 7
.1%
9.4
% 1
4.0
%
3.9
%
1.7
% 4.7
%
5.8
%
3.9
%
0.8
% 4.1
%
0.0
%
1.4
%
0.8
%
2 0 0 9 2 0 1 0 2 0 1 1 2 0 1 2 2 0 1 3
No Formal Education Primary School Lower Secondary
Upper Secondary Post secondary non-tertiary First stage of tertiary
Second stage of tertiary
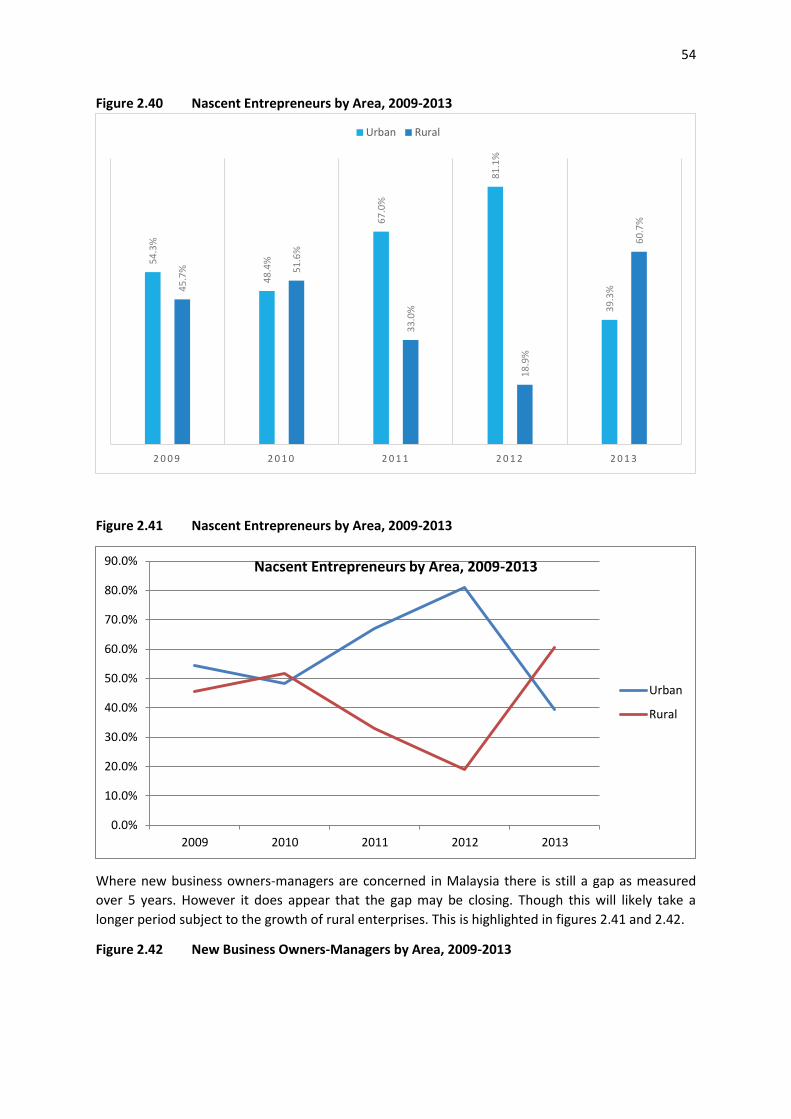
54
Figure 2.40 Nascent Entrepreneurs by Area, 2009-2013
Figure 2.41 Nascent Entrepreneurs by Area, 2009-2013
Where new business owners-managers are concerned in Malaysia there is still a gap as measured
over 5 years. However it does appear that the gap may be closing. Though this will likely take a
longer period subject to the growth of rural enterprises. This is highlighted in figures 2.41 and 2.42.
Figure 2.42 New Business Owners-Managers by Area, 2009-2013
54
.3%
48
.4%
67
.0%
81
.1%
39
.3%
45
.7%
51
.6%
33
.0%
18
.9%
60
.7%
2 0 0 9 2 0 1 0 2 0 1 1 2 0 1 2 2 0 1 3
Urban Rural
0.0%
10.0%
20.0%
30.0%
40.0%
50.0%
60.0%
70.0%
80.0%
90.0%
2009 2010 2011 2012 2013
Nacsent Entrepreneurs by Area, 2009-2013
Urban
Rural
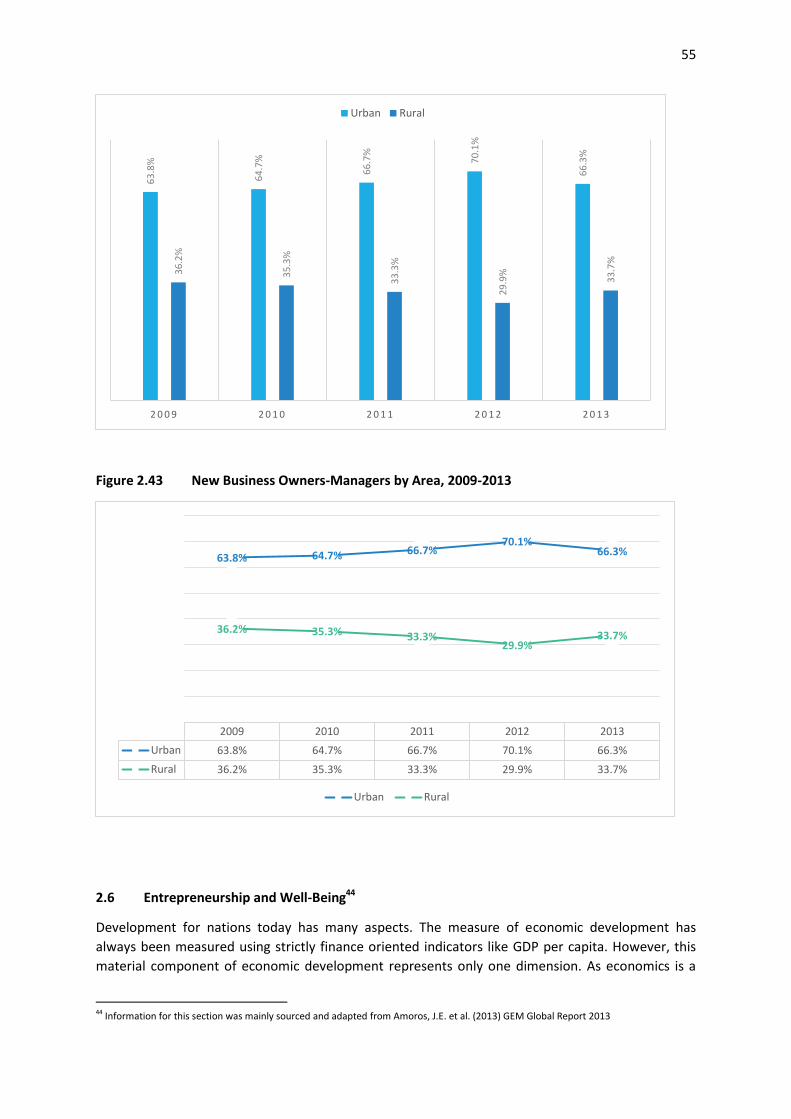
55
Figure 2.43 New Business Owners-Managers by Area, 2009-2013
2.6 Entrepreneurship and Well-Being44
Development for nations today has many aspects. The measure of economic development has
always been measured using strictly finance oriented indicators like GDP per capita. However, this
material component of economic development represents only one dimension. As economics is a
44 Information for this section was mainly sourced and adapted from Amoros, J.E. et al. (2013) GEM Global Report 2013
63
.8%
64
.7%
66
.7%
70
.1%
66
.3%
36
.2%
35
.3%
33
.3%
29
.9%
33
.7%
2 0 0 9 2 0 1 0 2 0 1 1 2 0 1 2 2 0 1 3
Urban Rural
2009 2010 2011 2012 2013
Urban 63.8% 64.7% 66.7% 70.1% 66.3%
Rural 36.2% 35.3% 33.3% 29.9% 33.7%
63.8% 64.7% 66.7% 70.1%
66.3%
36.2% 35.3% 33.3% 29.9%
33.7%
Urban Rural
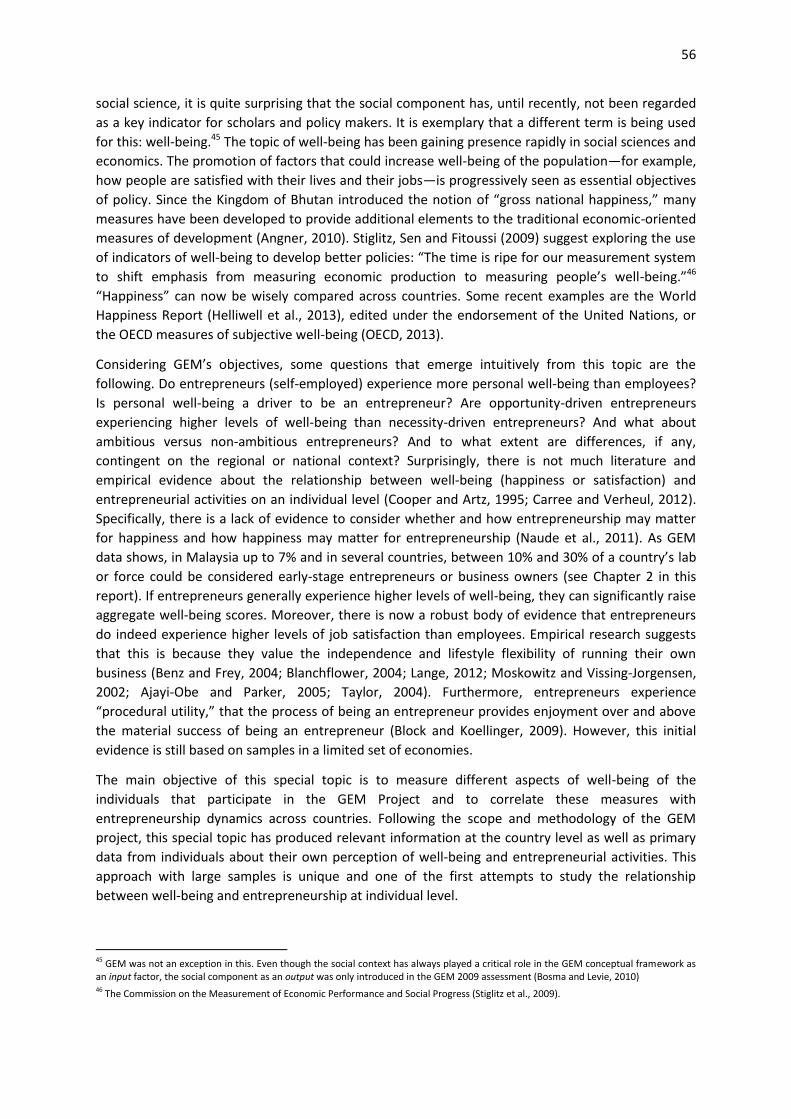
56
social science, it is quite surprising that the social component has, until recently, not been regarded
as a key indicator for scholars and policy makers. It is exemplary that a different term is being used
for this: well-being.45 The topic of well-being has been gaining presence rapidly in social sciences and
economics. The promotion of factors that could increase well-being of the population—for example,
how people are satisfied with their lives and their jobs—is progressively seen as essential objectives
of policy. Since the Kingdom of Bhutan introduced the notion of “gross national happiness,” many
measures have been developed to provide additional elements to the traditional economic-oriented
measures of development (Angner, 2010). Stiglitz, Sen and Fitoussi (2009) suggest exploring the use
of indicators of well-being to develop better policies: “The time is ripe for our measurement system
to shift emphasis from measuring economic production to measuring people’s well-being.”46
“Happiness” can now be wisely compared across countries. Some recent examples are the World
Happiness Report (Helliwell et al., 2013), edited under the endorsement of the United Nations, or
the OECD measures of subjective well-being (OECD, 2013).
Considering GEM’s objectives, some questions that emerge intuitively from this topic are the
following. Do entrepreneurs (self-employed) experience more personal well-being than employees?
Is personal well-being a driver to be an entrepreneur? Are opportunity-driven entrepreneurs
experiencing higher levels of well-being than necessity-driven entrepreneurs? And what about
ambitious versus non-ambitious entrepreneurs? And to what extent are differences, if any,
contingent on the regional or national context? Surprisingly, there is not much literature and
empirical evidence about the relationship between well-being (happiness or satisfaction) and
entrepreneurial activities on an individual level (Cooper and Artz, 1995; Carree and Verheul, 2012).
Specifically, there is a lack of evidence to consider whether and how entrepreneurship may matter
for happiness and how happiness may matter for entrepreneurship (Naude et al., 2011). As GEM
data shows, in Malaysia up to 7% and in several countries, between 10% and 30% of a country’s lab
or force could be considered early-stage entrepreneurs or business owners (see Chapter 2 in this
report). If entrepreneurs generally experience higher levels of well-being, they can significantly raise
aggregate well-being scores. Moreover, there is now a robust body of evidence that entrepreneurs
do indeed experience higher levels of job satisfaction than employees. Empirical research suggests
that this is because they value the independence and lifestyle flexibility of running their own
business (Benz and Frey, 2004; Blanchflower, 2004; Lange, 2012; Moskowitz and Vissing-Jorgensen,
2002; Ajayi-Obe and Parker, 2005; Taylor, 2004). Furthermore, entrepreneurs experience
“procedural utility,” that the process of being an entrepreneur provides enjoyment over and above
the material success of being an entrepreneur (Block and Koellinger, 2009). However, this initial
evidence is still based on samples in a limited set of economies.
The main objective of this special topic is to measure different aspects of well-being of the
individuals that participate in the GEM Project and to correlate these measures with
entrepreneurship dynamics across countries. Following the scope and methodology of the GEM
project, this special topic has produced relevant information at the country level as well as primary
data from individuals about their own perception of well-being and entrepreneurial activities. This
approach with large samples is unique and one of the first attempts to study the relationship
between well-being and entrepreneurship at individual level.
45 GEM was not an exception in this. Even though the social context has always played a critical role in the GEM conceptual framework as an input factor, the social component as an output was only introduced in the GEM 2009 assessment (Bosma and Levie, 2010) 46 The Commission on the Measurement of Economic Performance and Social Progress (Stiglitz et al., 2009).
57
In 2013, the GEM surveys (APS and NES) included a special set of questions that provided evidence
of the entrepreneurial activities and motivations in relation to well-being measures from the 2013
participant economies. One set of APS questions and NES questions related to Subjective Well-being
were compulsory. The rest of the questions were optional. The general analysis contrasts the well-
being indicators of the different stages of entrepreneurial activity with the population not involved
in entrepreneurship. The motivation to become entrepreneurs was also analysed.
Definitions and Operationalization
Subjective Well-Being
Subjective well-being is related to the manner in which people experience the quality of their lives,
and it comprises both emotional reactions and cognitive judgments (Diener, 1984). To measure
subjective well-being, the Satisfaction with Life Scale SWLS (Pavot and Diener, 2008), a five-item
instrument designed to measure global cognitive judgments of satisfaction with one's life, was
adopted.47 The scale is in the public domain (not copyrighted). Credit is given to the authors of the
scale: Ed Diener, Robert A. Emmons, Randy J. Larsen and Sharon Griffin as noted in the 1985 article
in the Journal of Personality Assessment. These are the questions using five-point Likert scales, from
1 “Strongly Disagree” to 5 “Strong Agree”:
1. In most ways, my life is close to my ideal.
2. The conditions of my life are excellent.
3. I am satisfied with my life.
4. So far I have obtained the important things I want in life.
5. If I could live my life again, I would not change anything.
These questions were posed to all employed and self-employed individuals in every country. Single
indicators for each participant economies were calculated using similar procedures as described in
Chapter 3 to calculate summarized variables for NES constructs.
WORK CONDITIONS AND WORK-LIFE BALANCE
An additional set of questions that relates to work conditions and work-life balance was included as
an optional section, and included by 54 economies. Work conditions questions were designed to
identify similarities and differences in current working conditions among employees and the self-
employed, including self-determination and meaning, which are important elements of
empowerment (Spreitzer et al., 1997), and stress at work.48 The latter is an important component to
measure psychological well-being (Blustein, 2008). Satisfaction with the work-life balance is defined
as “an overall level of contentment resulting from an assessment of one’s degree of success at
meeting work and family role demands” (Valcour 2007). By focusing on overall satisfaction with the
way work and personal life are managed, the fact that the significance of work or family life differs
47 For example, UNDP adopted this scale to measure life satisfaction in some countries. The Coca-Cola Happiness Institute (created in Spain in 2008 to provide credible scientific information to support the link between happiness and wellness) also uses the SWLS. 48 These questions were adapted from the additional set of questions required by the EU Commission to the GEM project since 2011.
These questions also have a five-point Likert scale: (1) I can decide on my own how I go about doing my work; (2) The work I do is
meaningful to me; (3) At my work, I am not exposed to excessive stress; (4) I am satisfied with my current work; (5) I am satisfied with my
current income from work. Income includes both salary and non-salary income such as payments in kind and other benefits.
58
between individuals and that private life encompasses more than the family role alone is taken into
account (Abendroth & den Dulk, 2011).49
ENTREPRENEURSHIP FRAMEWORK CONDITIONS AND WELL-BEING
To corroborate the opinions provided by the adult population, NES included four questions that
inquire whether the national (or regional) conditions help the work-life balance of individuals and
measure the perception that entrepreneurs have, in general, more work and life satisfaction:
1. In my country, the general conditions (economic, social, political, and cultural) allow people
to perfectly harmonize personal and working (professional/labor) life.
2. In my country, existing regulations allow people to perfectly harmonize personal and
working (professional/labor) life.
3. In my country, entrepreneurs are more satisfied with their working (professional/labor) life
than non-entrepreneurs.
4. In my country, entrepreneurs are more satisfied with their personal life than non-
entrepreneurs.
This report provides an initial assessment based mainly on compulsory indicators of subjective well-
being. These indicators will be related to early-stage entrepreneurial activity (TEA) and established
business owners (see Table A5 in appendix).
One first observation is that the prevalence of subjective well-being indicators varies widely across
world regions. Sub-Saharan African economies exhibit the lowest rates, whereas Latin and North
Americans have the highest rates. Single country analysis shows that the “traditional” welfare states
like Nordic countries and well-developed countries like Netherlands, Switzerland and Singapore also
exhibit high rates of subjective well-being, confirming the results of other studies adopting similar
studies (Helliwell et al., 2013; OECD, 2013). These differences suggest that in each country and in
world regions with close common heritage, framework conditions such as economic, political,
institutional and cultural contexts have singular influence on the population perception about their
well-being and by consequences that shape the indicators of entrepreneurship activities.
Figure 2.43 shows the differences by phase of economic development. Less-developed countries, mainly in Sub-Saharan Africa, have the lowest rates of subjective well-being. Efficiency-driven and innovation-driven economies do not differ substantially related to TEA population. Established entrepreneurs exhibit the highest rates of subjective well-being on the three development stages. Even though these results are exploratory in nature and need to be treated in this manner, they show initial evidence that involvement in entrepreneurial activities, both in the early-stage and established phases, is related to personal evaluation of higher subjective well-being50.
49 We adapted Valcour (2007) original scale to three items, using the five-point Likert scale: (1) I am satisfied with the way my time is
divided between work and private life; (2) I am satisfied with my ability to balance the needs of my work with those of my personal or
family life; (3) I am satisfied with the opportunity to perform well at work and to substantially contribute to home-related responsibilities
at the same time.
50 For example, it should be noted that the category ‘employees’ includes those individuals who can be identified as ‘entrepreneurial employees’. Therefore, if these would have been singled out a better comparison between entrepreneurial active individuals in the labor force and their counterparts would be achieved and differences may actually be more pronounced for economies exhibiting a large number of entrepreneurial employees (for example in Scandinavia, see Bosma et al. 2013).
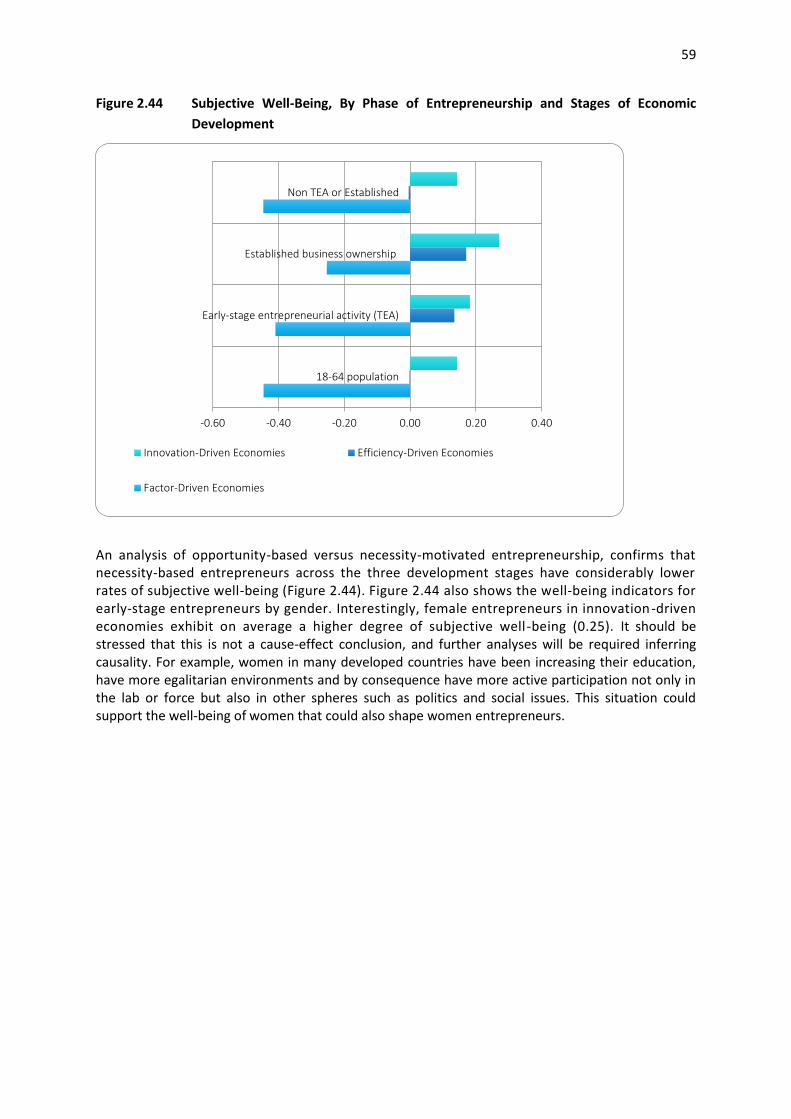
59
Figure 2.44 Subjective Well-Being, By Phase of Entrepreneurship and Stages of Economic
Development
An analysis of opportunity-based versus necessity-motivated entrepreneurship, confirms that necessity-based entrepreneurs across the three development stages have considerably lower rates of subjective well-being (Figure 2.44). Figure 2.44 also shows the well-being indicators for early-stage entrepreneurs by gender. Interestingly, female entrepreneurs in innovation-driven economies exhibit on average a higher degree of subjective well-being (0.25). It should be stressed that this is not a cause-effect conclusion, and further analyses will be required inferring causality. For example, women in many developed countries have been increasing their education, have more egalitarian environments and by consequence have more active participation not only in the lab or force but also in other spheres such as politics and social issues. This situation could support the well-being of women that could also shape women entrepreneurs.
-0.60 -0.40 -0.20 0.00 0.20 0.40
18-64 population
Early-stage entrepreneurial activity (TEA)
Established business ownership
Non TEA or Established
Innovation-Driven Economies Efficiency-Driven Economies
Factor-Driven Economies
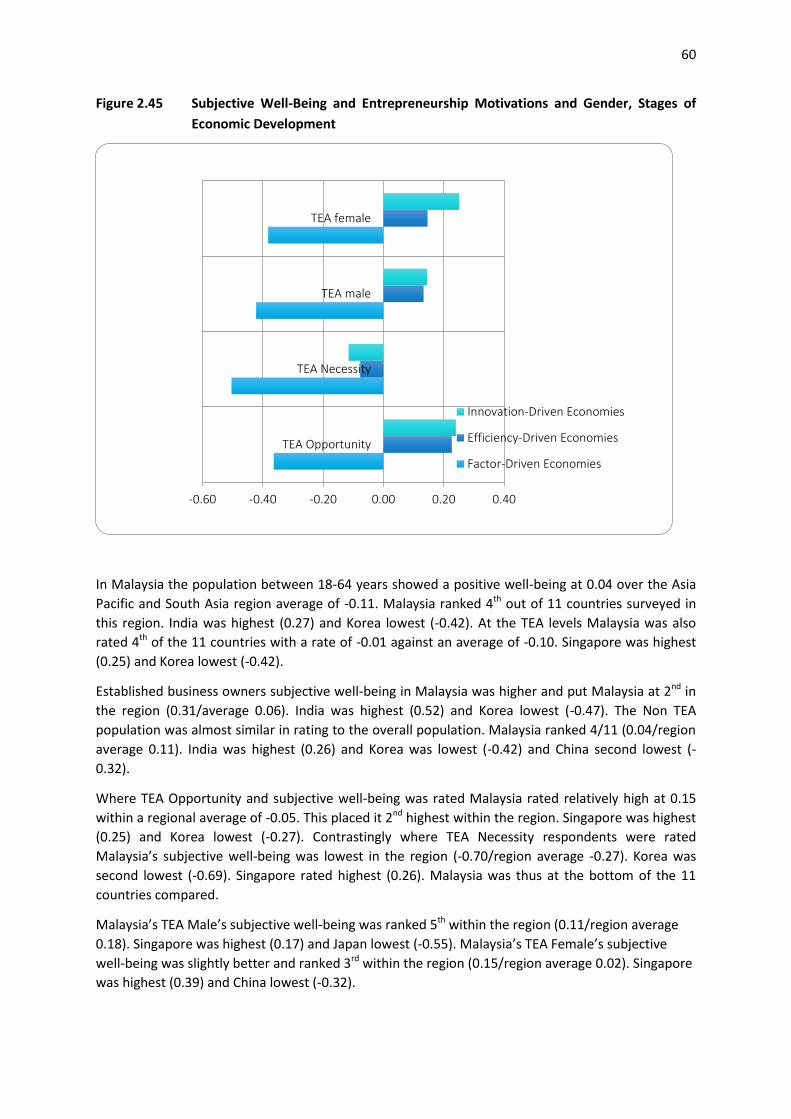
60
Figure 2.45 Subjective Well-Being and Entrepreneurship Motivations and Gender, Stages of
Economic Development
In Malaysia the population between 18-64 years showed a positive well-being at 0.04 over the Asia
Pacific and South Asia region average of -0.11. Malaysia ranked 4th out of 11 countries surveyed in
this region. India was highest (0.27) and Korea lowest (-0.42). At the TEA levels Malaysia was also
rated 4th of the 11 countries with a rate of -0.01 against an average of -0.10. Singapore was highest
(0.25) and Korea lowest (-0.42).
Established business owners subjective well-being in Malaysia was higher and put Malaysia at 2nd in
the region (0.31/average 0.06). India was highest (0.52) and Korea lowest (-0.47). The Non TEA
population was almost similar in rating to the overall population. Malaysia ranked 4/11 (0.04/region
average 0.11). India was highest (0.26) and Korea was lowest (-0.42) and China second lowest (-
0.32).
Where TEA Opportunity and subjective well-being was rated Malaysia rated relatively high at 0.15
within a regional average of -0.05. This placed it 2nd highest within the region. Singapore was highest
(0.25) and Korea lowest (-0.27). Contrastingly where TEA Necessity respondents were rated
Malaysia’s subjective well-being was lowest in the region (-0.70/region average -0.27). Korea was
second lowest (-0.69). Singapore rated highest (0.26). Malaysia was thus at the bottom of the 11
countries compared.
Malaysia’s TEA Male’s subjective well-being was ranked 5th within the region (0.11/region average
0.18). Singapore was highest (0.17) and Japan lowest (-0.55). Malaysia’s TEA Female’s subjective
well-being was slightly better and ranked 3rd within the region (0.15/region average 0.02). Singapore
was highest (0.39) and China lowest (-0.32).
-0.60 -0.40 -0.20 0.00 0.20 0.40
TEA Opportunity
TEA Necessity
TEA male
TEA female
Innovation-Driven Economies
Efficiency-Driven Economies
Factor-Driven Economies
61
This data shows that overall in Malaysia established business owners have a higher level of
satisfaction with their work and personal life. Those who are in the early stage for opportunity are
also fairly satisfied based on their subjective well-being answers. Conversely those who are in the
early stage business activity out of necessity are least satisfied overall.
Where gender is concerned the early stage male entrepreneur’s subjective well-being rates were
negative as compared with female early stage entrepreneurs. This could well be because the early
stage female entrepreneur is more of an opportunistic entrepreneur and less a necessity driven
entrepreneur.
Thus one may infer that the Malaysian male early stage necessity entrepreneur would have the
lowest sense of well-being. Figure 2.45 illustrates this discussion.
Figure 2.46 Malaysia’s Subjective Well-Being, 2013
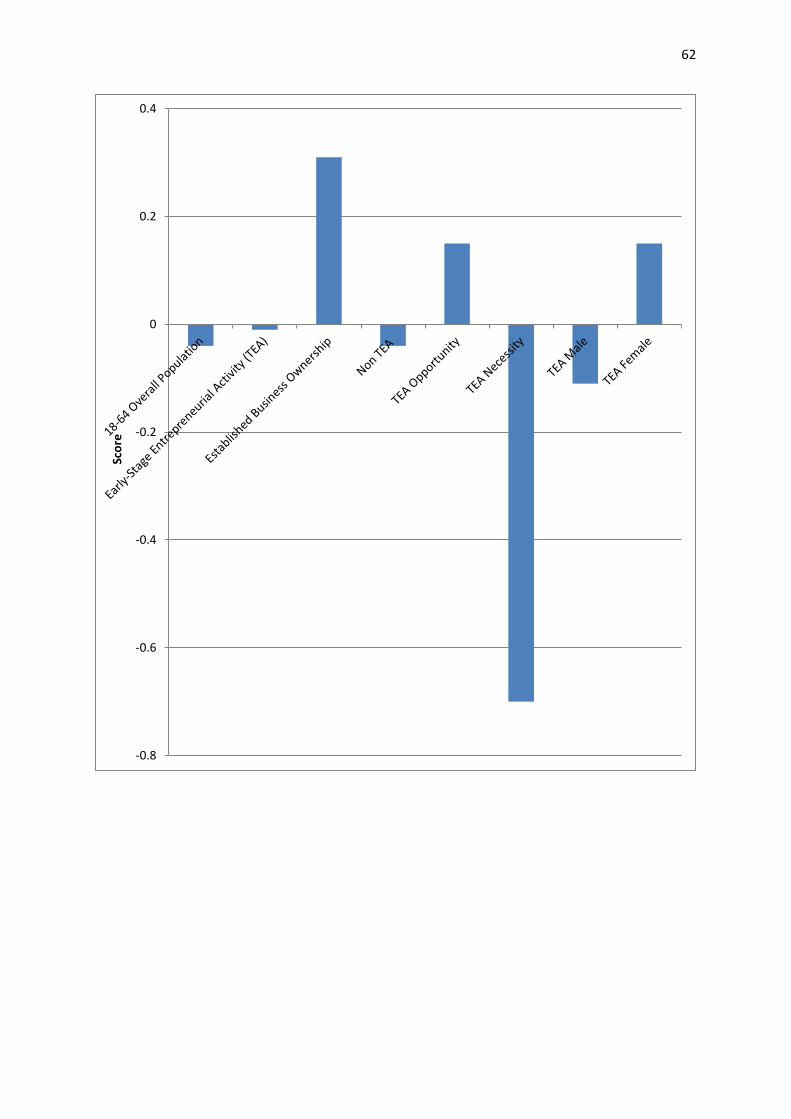
62
-0.8
-0.6
-0.4
-0.2
0
0.2
0.4Sc
ore
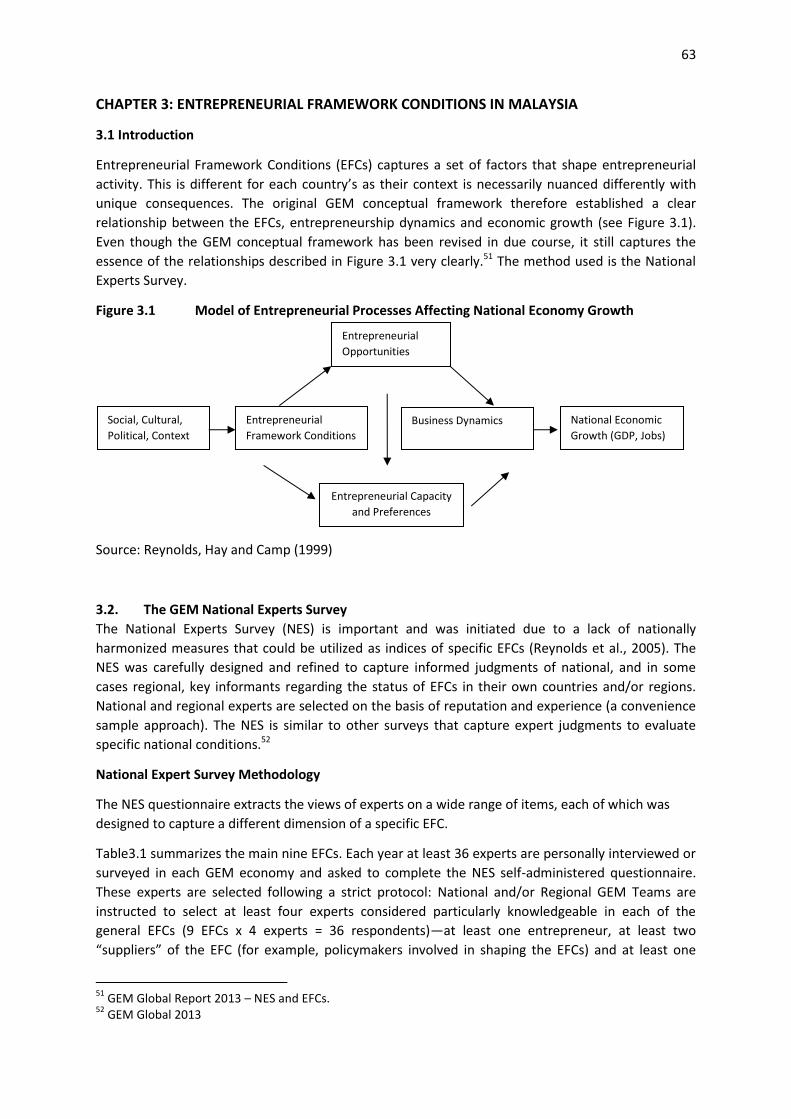
63
CHAPTER 3: ENTREPRENEURIAL FRAMEWORK CONDITIONS IN MALAYSIA
3.1 Introduction
Entrepreneurial Framework Conditions (EFCs) captures a set of factors that shape entrepreneurial
activity. This is different for each country’s as their context is necessarily nuanced differently with
unique consequences. The original GEM conceptual framework therefore established a clear
relationship between the EFCs, entrepreneurship dynamics and economic growth (see Figure 3.1).
Even though the GEM conceptual framework has been revised in due course, it still captures the
essence of the relationships described in Figure 3.1 very clearly.51 The method used is the National
Experts Survey.
Figure 3.1 Model of Entrepreneurial Processes Affecting National Economy Growth
Source: Reynolds, Hay and Camp (1999)
3.2. The GEM National Experts Survey
The National Experts Survey (NES) is important and was initiated due to a lack of nationally
harmonized measures that could be utilized as indices of specific EFCs (Reynolds et al., 2005). The
NES was carefully designed and refined to capture informed judgments of national, and in some
cases regional, key informants regarding the status of EFCs in their own countries and/or regions.
National and regional experts are selected on the basis of reputation and experience (a convenience
sample approach). The NES is similar to other surveys that capture expert judgments to evaluate
specific national conditions.52
National Expert Survey Methodology
The NES questionnaire extracts the views of experts on a wide range of items, each of which was
designed to capture a different dimension of a specific EFC.
Table3.1 summarizes the main nine EFCs. Each year at least 36 experts are personally interviewed or
surveyed in each GEM economy and asked to complete the NES self-administered questionnaire.
These experts are selected following a strict protocol: National and/or Regional GEM Teams are
instructed to select at least four experts considered particularly knowledgeable in each of the
general EFCs (9 EFCs x 4 experts = 36 respondents)—at least one entrepreneur, at least two
“suppliers” of the EFC (for example, policymakers involved in shaping the EFCs) and at least one
51
GEM Global Report 2013 – NES and EFCs. 52
GEM Global 2013
Social, Cultural,
Political, Context
Entrepreneurial
Framework Conditions
Entrepreneurial Capacity
and Preferences
National Economic
Growth (GDP, Jobs)
Entrepreneurial
Opportunities
Business Dynamics
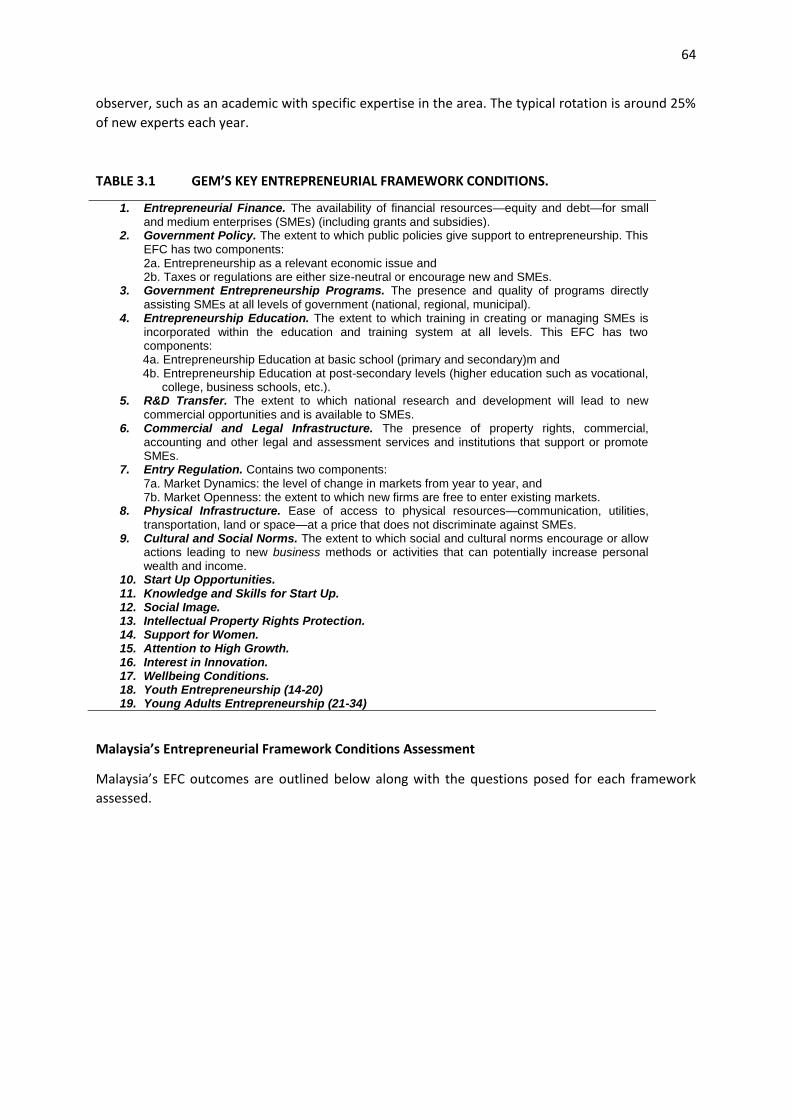
64
observer, such as an academic with specific expertise in the area. The typical rotation is around 25%
of new experts each year.
TABLE 3.1 GEM’S KEY ENTREPRENEURIAL FRAMEWORK CONDITIONS.
1. Entrepreneurial Finance. The availability of financial resources—equity and debt—for small and medium enterprises (SMEs) (including grants and subsidies).
2. Government Policy. The extent to which public policies give support to entrepreneurship. This EFC has two components: 2a. Entrepreneurship as a relevant economic issue and 2b. Taxes or regulations are either size-neutral or encourage new and SMEs.
3. Government Entrepreneurship Programs. The presence and quality of programs directly assisting SMEs at all levels of government (national, regional, municipal).
4. Entrepreneurship Education. The extent to which training in creating or managing SMEs is incorporated within the education and training system at all levels. This EFC has two components: 4a. Entrepreneurship Education at basic school (primary and secondary)m and 4b. Entrepreneurship Education at post-secondary levels (higher education such as vocational,
college, business schools, etc.). 5. R&D Transfer. The extent to which national research and development will lead to new
commercial opportunities and is available to SMEs. 6. Commercial and Legal Infrastructure. The presence of property rights, commercial,
accounting and other legal and assessment services and institutions that support or promote SMEs.
7. Entry Regulation. Contains two components:
7a. Market Dynamics: the level of change in markets from year to year, and 7b. Market Openness: the extent to which new firms are free to enter existing markets.
8. Physical Infrastructure. Ease of access to physical resources—communication, utilities, transportation, land or space—at a price that does not discriminate against SMEs.
9. Cultural and Social Norms. The extent to which social and cultural norms encourage or allow actions leading to new business methods or activities that can potentially increase personal wealth and income.
10. Start Up Opportunities. 11. Knowledge and Skills for Start Up. 12. Social Image. 13. Intellectual Property Rights Protection. 14. Support for Women. 15. Attention to High Growth. 16. Interest in Innovation. 17. Wellbeing Conditions. 18. Youth Entrepreneurship (14-20) 19. Young Adults Entrepreneurship (21-34)
Malaysia’s Entrepreneurial Framework Conditions Assessment
Malaysia’s EFC outcomes are outlined below along with the questions posed for each framework
assessed.
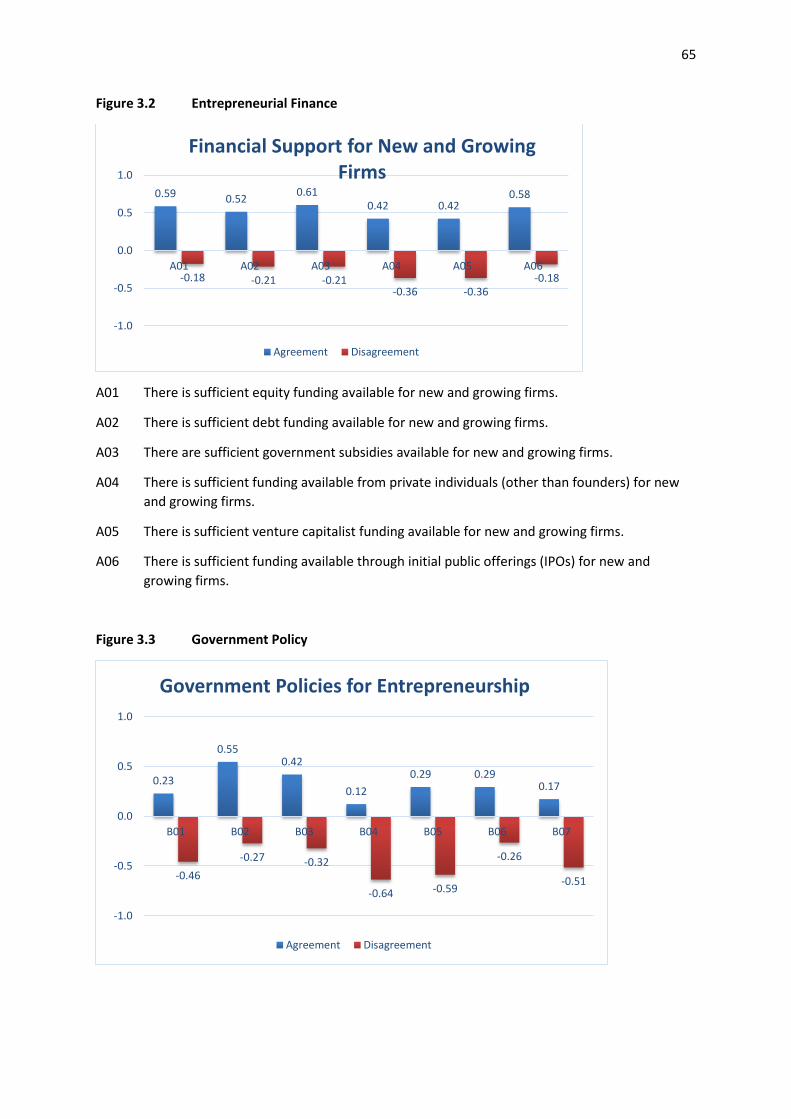
65
Figure 3.2 Entrepreneurial Finance
A01 There is sufficient equity funding available for new and growing firms.
A02 There is sufficient debt funding available for new and growing firms.
A03 There are sufficient government subsidies available for new and growing firms.
A04 There is sufficient funding available from private individuals (other than founders) for new
and growing firms.
A05 There is sufficient venture capitalist funding available for new and growing firms.
A06 There is sufficient funding available through initial public offerings (IPOs) for new and
growing firms.
Figure 3.3 Government Policy
0.59 0.52 0.61
0.42 0.42 0.58
-0.18 -0.21 -0.21 -0.36 -0.36
-0.18
-1.0
-0.5
0.0
0.5
1.0
A01 A02 A03 A04 A05 A06
Financial Support for New and Growing Firms
Agreement Disagreement
0.23
0.55 0.42
0.12
0.29 0.29 0.17
-0.46
-0.27 -0.32
-0.64 -0.59
-0.26
-0.51
-1.0
-0.5
0.0
0.5
1.0
B01 B02 B03 B04 B05 B06 B07
Government Policies for Entrepreneurship
Agreement Disagreement
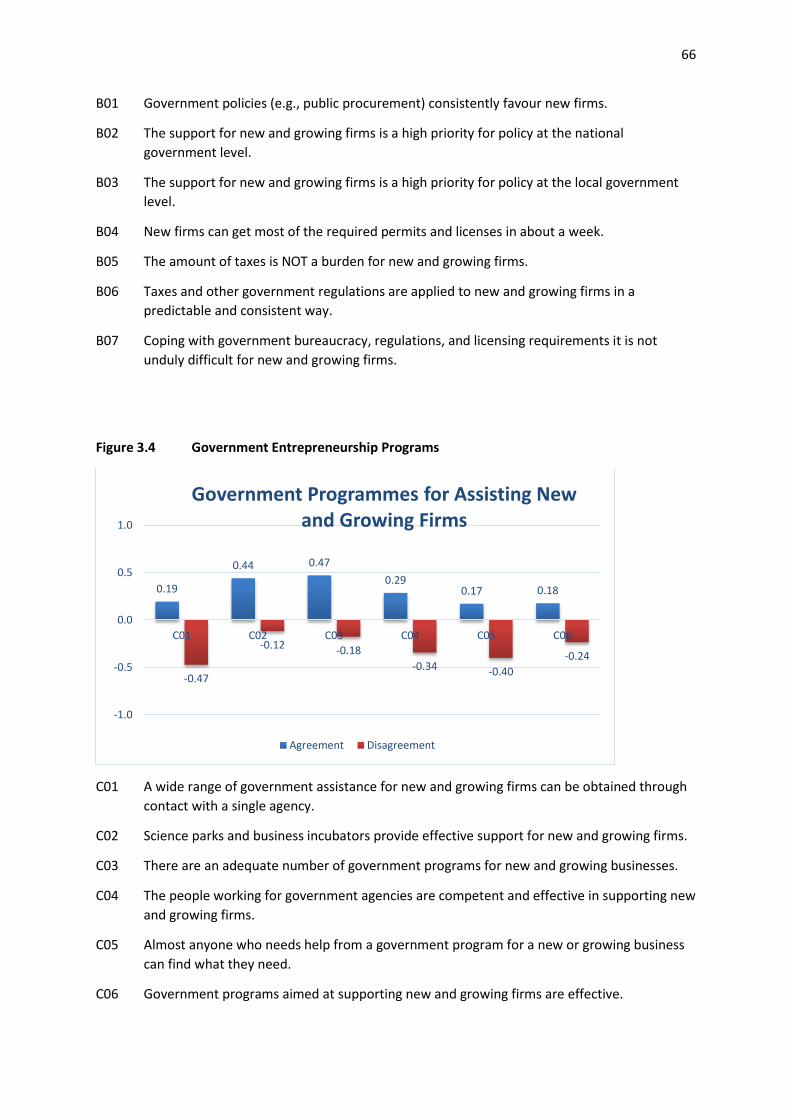
66
B01 Government policies (e.g., public procurement) consistently favour new firms.
B02 The support for new and growing firms is a high priority for policy at the national
government level.
B03 The support for new and growing firms is a high priority for policy at the local government
level.
B04 New firms can get most of the required permits and licenses in about a week.
B05 The amount of taxes is NOT a burden for new and growing firms.
B06 Taxes and other government regulations are applied to new and growing firms in a
predictable and consistent way.
B07 Coping with government bureaucracy, regulations, and licensing requirements it is not
unduly difficult for new and growing firms.
Figure 3.4 Government Entrepreneurship Programs
C01 A wide range of government assistance for new and growing firms can be obtained through
contact with a single agency.
C02 Science parks and business incubators provide effective support for new and growing firms.
C03 There are an adequate number of government programs for new and growing businesses.
C04 The people working for government agencies are competent and effective in supporting new
and growing firms.
C05 Almost anyone who needs help from a government program for a new or growing business
can find what they need.
C06 Government programs aimed at supporting new and growing firms are effective.
0.19
0.44 0.47
0.29 0.17 0.18
-0.47
-0.12 -0.18
-0.34 -0.40
-0.24
-1.0
-0.5
0.0
0.5
1.0
C01 C02 C03 C04 C05 C06
Government Programmes for Assisting New and Growing Firms
Agreement Disagreement
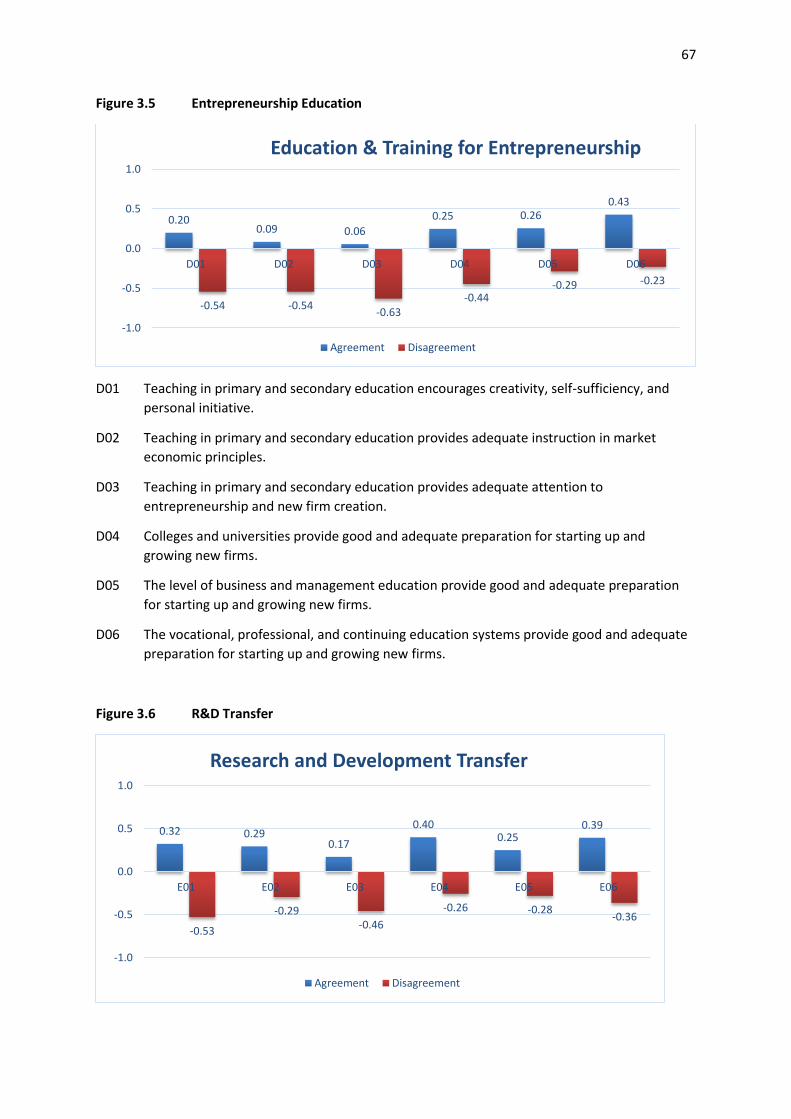
67
Figure 3.5 Entrepreneurship Education
D01 Teaching in primary and secondary education encourages creativity, self-sufficiency, and
personal initiative.
D02 Teaching in primary and secondary education provides adequate instruction in market
economic principles.
D03 Teaching in primary and secondary education provides adequate attention to
entrepreneurship and new firm creation.
D04 Colleges and universities provide good and adequate preparation for starting up and
growing new firms.
D05 The level of business and management education provide good and adequate preparation
for starting up and growing new firms.
D06 The vocational, professional, and continuing education systems provide good and adequate
preparation for starting up and growing new firms.
Figure 3.6 R&D Transfer
0.20 0.09 0.06
0.25 0.26 0.43
-0.54 -0.54 -0.63
-0.44 -0.29 -0.23
-1.0
-0.5
0.0
0.5
1.0
D01 D02 D03 D04 D05 D06
Education & Training for Entrepreneurship
Agreement Disagreement
0.32 0.29 0.17
0.40 0.25
0.39
-0.53
-0.29 -0.46
-0.26 -0.28 -0.36
-1.0
-0.5
0.0
0.5
1.0
E01 E02 E03 E04 E05 E06
Research and Development Transfer
Agreement Disagreement
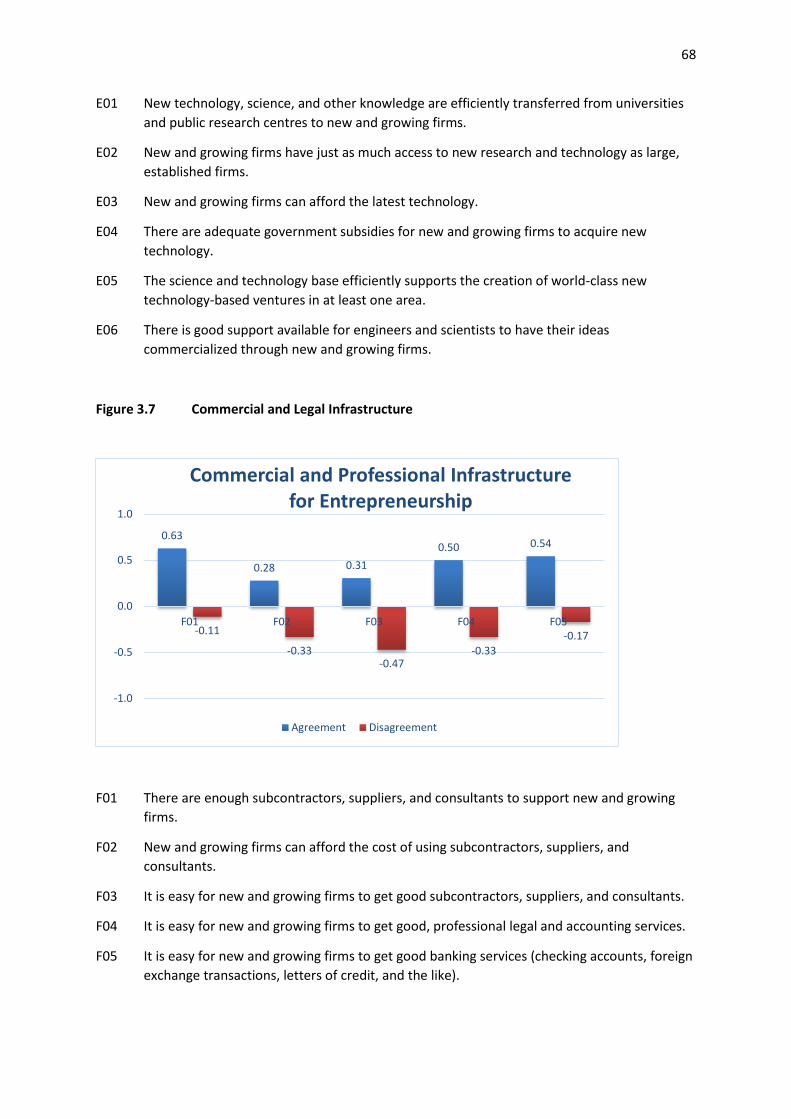
68
E01 New technology, science, and other knowledge are efficiently transferred from universities
and public research centres to new and growing firms.
E02 New and growing firms have just as much access to new research and technology as large,
established firms.
E03 New and growing firms can afford the latest technology.
E04 There are adequate government subsidies for new and growing firms to acquire new
technology.
E05 The science and technology base efficiently supports the creation of world-class new
technology-based ventures in at least one area.
E06 There is good support available for engineers and scientists to have their ideas
commercialized through new and growing firms.
Figure 3.7 Commercial and Legal Infrastructure
F01 There are enough subcontractors, suppliers, and consultants to support new and growing
firms.
F02 New and growing firms can afford the cost of using subcontractors, suppliers, and
consultants.
F03 It is easy for new and growing firms to get good subcontractors, suppliers, and consultants.
F04 It is easy for new and growing firms to get good, professional legal and accounting services.
F05 It is easy for new and growing firms to get good banking services (checking accounts, foreign
exchange transactions, letters of credit, and the like).
0.63
0.28 0.31
0.50 0.54
-0.11
-0.33 -0.47
-0.33 -0.17
-1.0
-0.5
0.0
0.5
1.0
F01 F02 F03 F04 F05
Commercial and Professional Infrastructure for Entrepreneurship
Agreement Disagreement
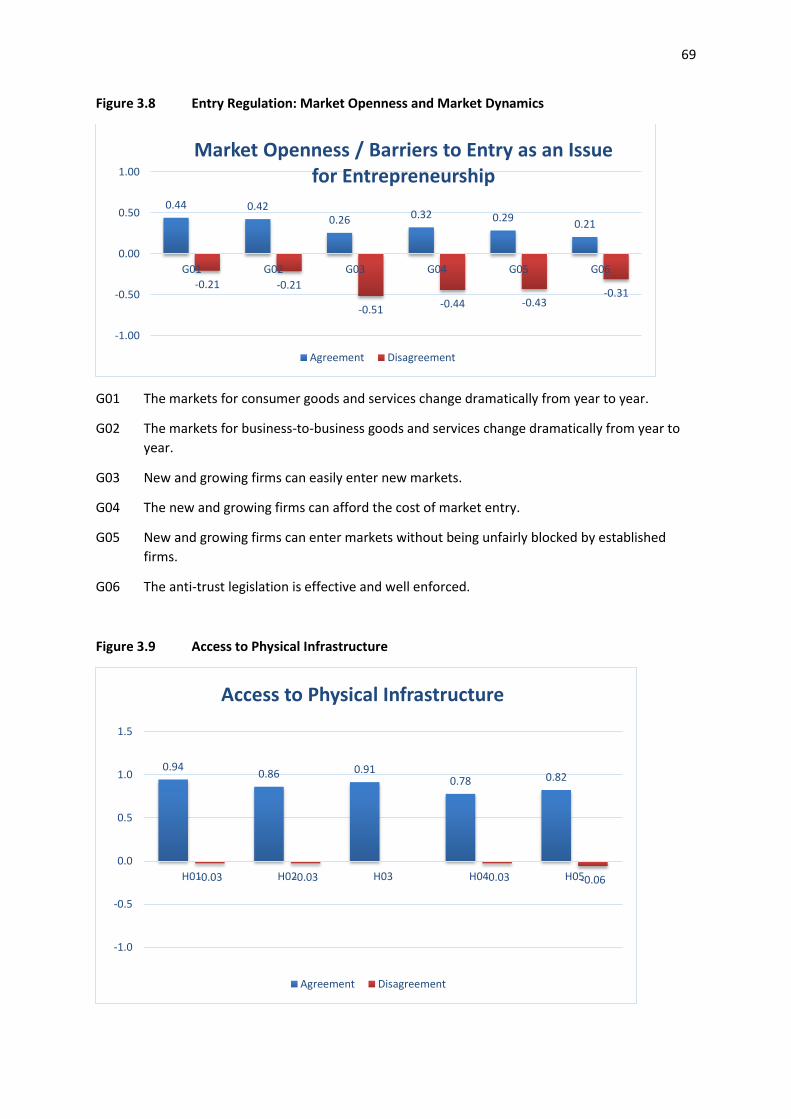
69
Figure 3.8 Entry Regulation: Market Openness and Market Dynamics
G01 The markets for consumer goods and services change dramatically from year to year.
G02 The markets for business-to-business goods and services change dramatically from year to
year.
G03 New and growing firms can easily enter new markets.
G04 The new and growing firms can afford the cost of market entry.
G05 New and growing firms can enter markets without being unfairly blocked by established
firms.
G06 The anti-trust legislation is effective and well enforced.
Figure 3.9 Access to Physical Infrastructure
0.44 0.42 0.26 0.32 0.29
0.21
-0.21 -0.21
-0.51 -0.44 -0.43
-0.31
-1.00
-0.50
0.00
0.50
1.00
G01 G02 G03 G04 G05 G06
Market Openness / Barriers to Entry as an Issue for Entrepreneurship
Agreement Disagreement
0.94 0.86 0.91
0.78 0.82
-0.03 -0.03 -0.03 -0.06
-1.0
-0.5
0.0
0.5
1.0
1.5
H01 H02 H03 H04 H05
Access to Physical Infrastructure
Agreement Disagreement
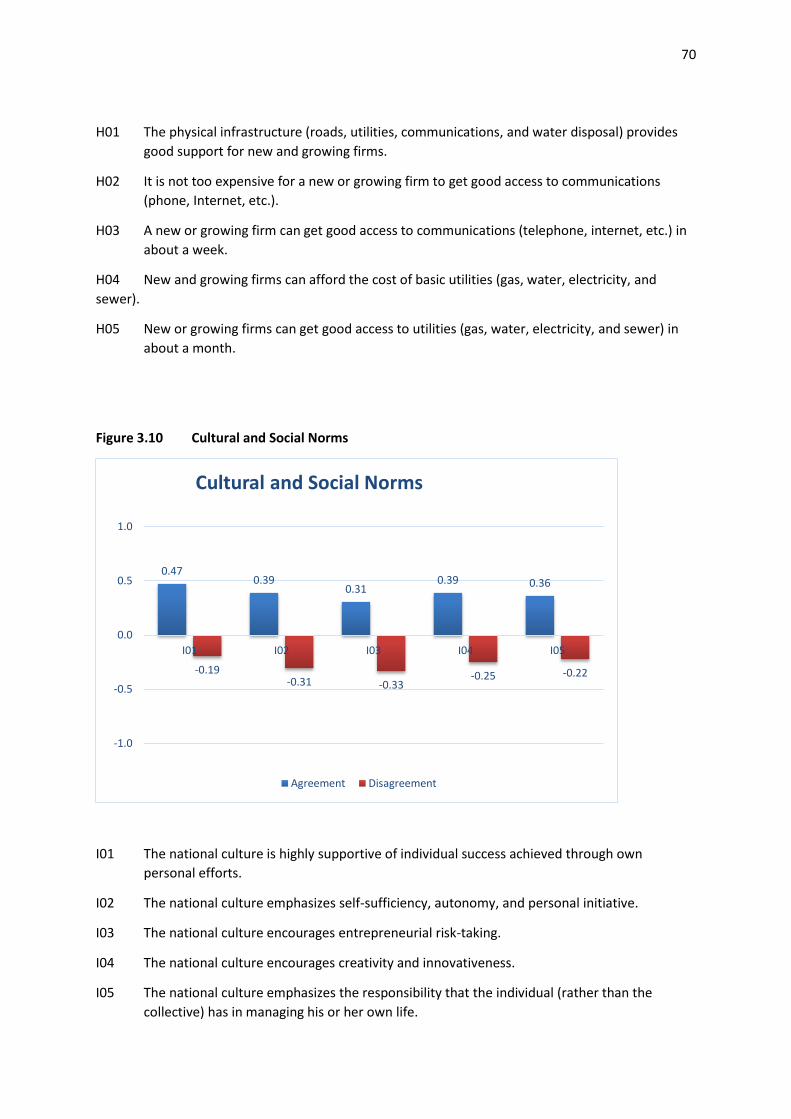
70
H01 The physical infrastructure (roads, utilities, communications, and water disposal) provides
good support for new and growing firms.
H02 It is not too expensive for a new or growing firm to get good access to communications
(phone, Internet, etc.).
H03 A new or growing firm can get good access to communications (telephone, internet, etc.) in
about a week.
H04 New and growing firms can afford the cost of basic utilities (gas, water, electricity, and
sewer).
H05 New or growing firms can get good access to utilities (gas, water, electricity, and sewer) in
about a month.
Figure 3.10 Cultural and Social Norms
I01 The national culture is highly supportive of individual success achieved through own
personal efforts.
I02 The national culture emphasizes self-sufficiency, autonomy, and personal initiative.
I03 The national culture encourages entrepreneurial risk-taking.
I04 The national culture encourages creativity and innovativeness.
I05 The national culture emphasizes the responsibility that the individual (rather than the
collective) has in managing his or her own life.
0.47 0.39
0.31 0.39 0.36
-0.19 -0.31 -0.33
-0.25 -0.22
-1.0
-0.5
0.0
0.5
1.0
I01 I02 I03 I04 I05
Cultural and Social Norms
Agreement Disagreement
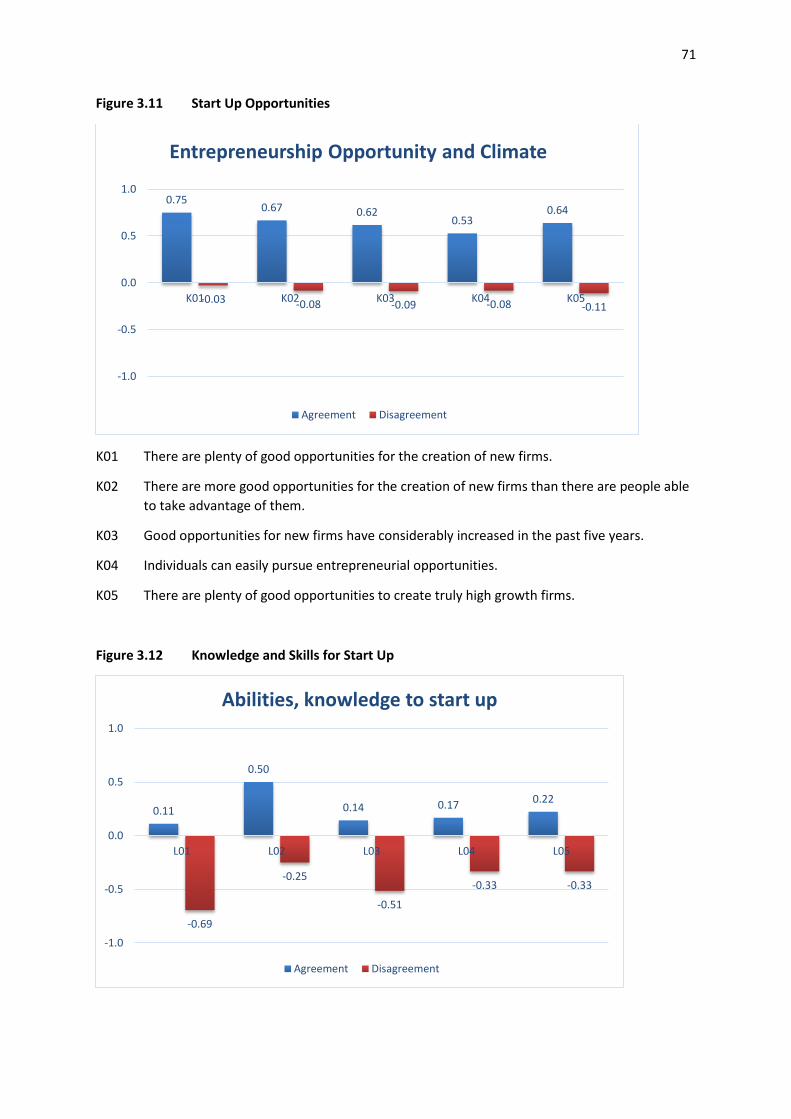
71
Figure 3.11 Start Up Opportunities
K01 There are plenty of good opportunities for the creation of new firms.
K02 There are more good opportunities for the creation of new firms than there are people able
to take advantage of them.
K03 Good opportunities for new firms have considerably increased in the past five years.
K04 Individuals can easily pursue entrepreneurial opportunities.
K05 There are plenty of good opportunities to create truly high growth firms.
Figure 3.12 Knowledge and Skills for Start Up
0.75 0.67 0.62
0.53 0.64
-0.03 -0.08 -0.09 -0.08 -0.11
-1.0
-0.5
0.0
0.5
1.0
K01 K02 K03 K04 K05
Entrepreneurship Opportunity and Climate
Agreement Disagreement
0.11
0.50
0.14 0.17 0.22
-0.69
-0.25
-0.51
-0.33 -0.33
-1.0
-0.5
0.0
0.5
1.0
L01 L02 L03 L04 L05
Abilities, knowledge to start up
Agreement Disagreement

72
L01 Many people know how to start and manage a high-growth business.
L02 Many people know how to start and manage a small business.
L03 Many people have experience in starting a new business.
L04 Many people can react quickly to good opportunities for a new business.
L05 Many people have the ability to organize the resources required for a new business.
Figure 3.13 Social Image
M01 The creation of new ventures is considered an appropriate way to become rich.
M02 Most people consider becoming an entrepreneur as a desirable career choice.
M03 Successful entrepreneurs have a high level of status and respect.
M04 You will often see stories in the public media about successful entrepreneurs.
M05 Most people think of entrepreneurs as competent, resourceful individuals.
0.49
0.28
0.83 0.83 0.78
-0.20 -0.31
-0.08 -0.03 -0.03
-1.0
-0.5
0.0
0.5
1.0
M01 M02 M03 M04 M05
Respect for Entrepreneurship
Agreement Disagreement
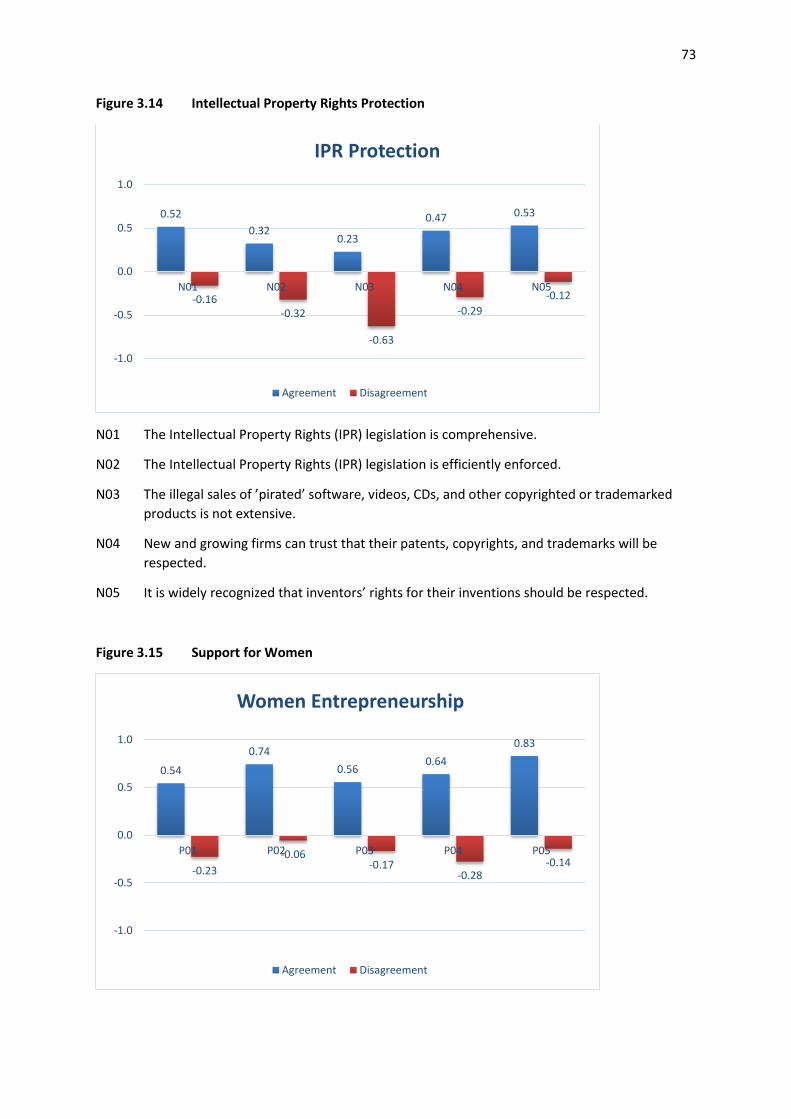
73
Figure 3.14 Intellectual Property Rights Protection
N01 The Intellectual Property Rights (IPR) legislation is comprehensive.
N02 The Intellectual Property Rights (IPR) legislation is efficiently enforced.
N03 The illegal sales of ’pirated’ software, videos, CDs, and other copyrighted or trademarked
products is not extensive.
N04 New and growing firms can trust that their patents, copyrights, and trademarks will be
respected.
N05 It is widely recognized that inventors’ rights for their inventions should be respected.
Figure 3.15 Support for Women
0.52
0.32 0.23
0.47 0.53
-0.16 -0.32
-0.63
-0.29
-0.12
-1.0
-0.5
0.0
0.5
1.0
N01 N02 N03 N04 N05
IPR Protection
Agreement Disagreement
0.54
0.74
0.56 0.64
0.83
-0.23
-0.06 -0.17
-0.28 -0.14
-1.0
-0.5
0.0
0.5
1.0
P01 P02 P03 P04 P05
Women Entrepreneurship
Agreement Disagreement
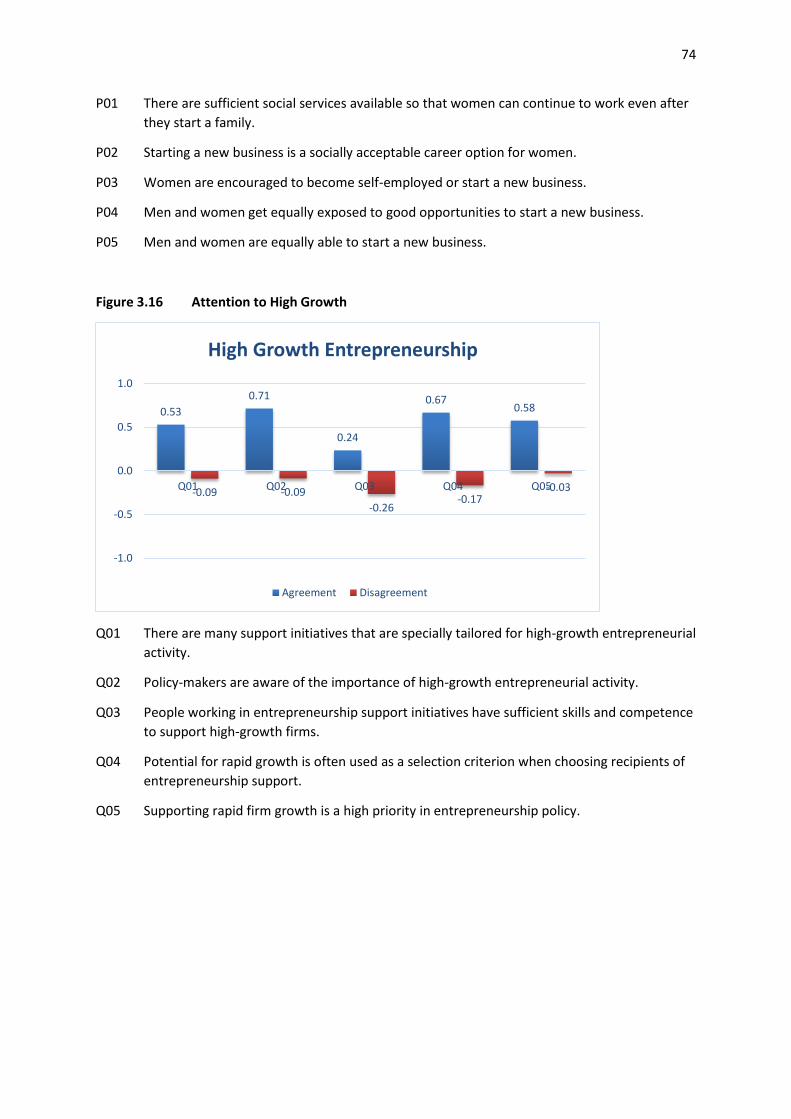
74
P01 There are sufficient social services available so that women can continue to work even after
they start a family.
P02 Starting a new business is a socially acceptable career option for women.
P03 Women are encouraged to become self-employed or start a new business.
P04 Men and women get equally exposed to good opportunities to start a new business.
P05 Men and women are equally able to start a new business.
Figure 3.16 Attention to High Growth
Q01 There are many support initiatives that are specially tailored for high-growth entrepreneurial
activity.
Q02 Policy-makers are aware of the importance of high-growth entrepreneurial activity.
Q03 People working in entrepreneurship support initiatives have sufficient skills and competence
to support high-growth firms.
Q04 Potential for rapid growth is often used as a selection criterion when choosing recipients of
entrepreneurship support.
Q05 Supporting rapid firm growth is a high priority in entrepreneurship policy.
0.53
0.71
0.24
0.67 0.58
-0.09 -0.09
-0.26 -0.17
-0.03
-1.0
-0.5
0.0
0.5
1.0
Q01 Q02 Q03 Q04 Q05
High Growth Entrepreneurship
Agreement Disagreement
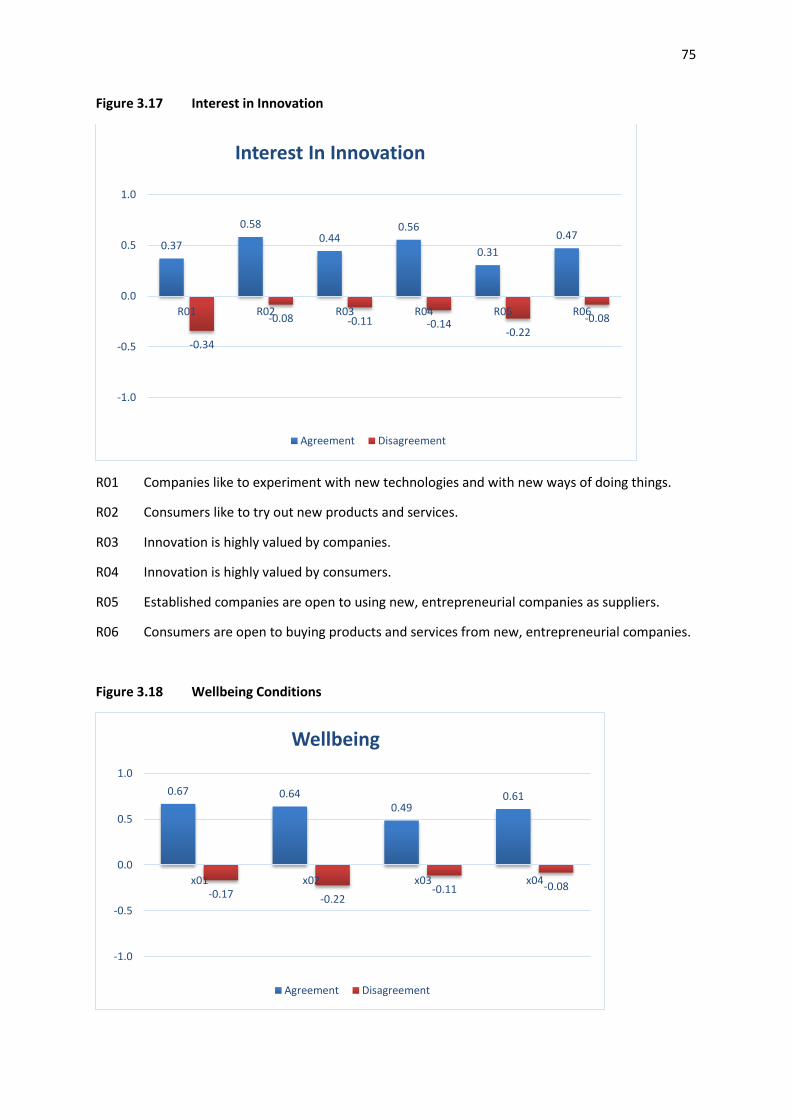
75
Figure 3.17 Interest in Innovation
R01 Companies like to experiment with new technologies and with new ways of doing things.
R02 Consumers like to try out new products and services.
R03 Innovation is highly valued by companies.
R04 Innovation is highly valued by consumers.
R05 Established companies are open to using new, entrepreneurial companies as suppliers.
R06 Consumers are open to buying products and services from new, entrepreneurial companies.
Figure 3.18 Wellbeing Conditions
0.37
0.58 0.44
0.56
0.31
0.47
-0.34
-0.08 -0.11 -0.14 -0.22
-0.08
-1.0
-0.5
0.0
0.5
1.0
R01 R02 R03 R04 R05 R06
Interest In Innovation
Agreement Disagreement
0.67 0.64 0.49
0.61
-0.17 -0.22 -0.11 -0.08
-1.0
-0.5
0.0
0.5
1.0
x01 x02 x03 x04
Wellbeing
Agreement Disagreement
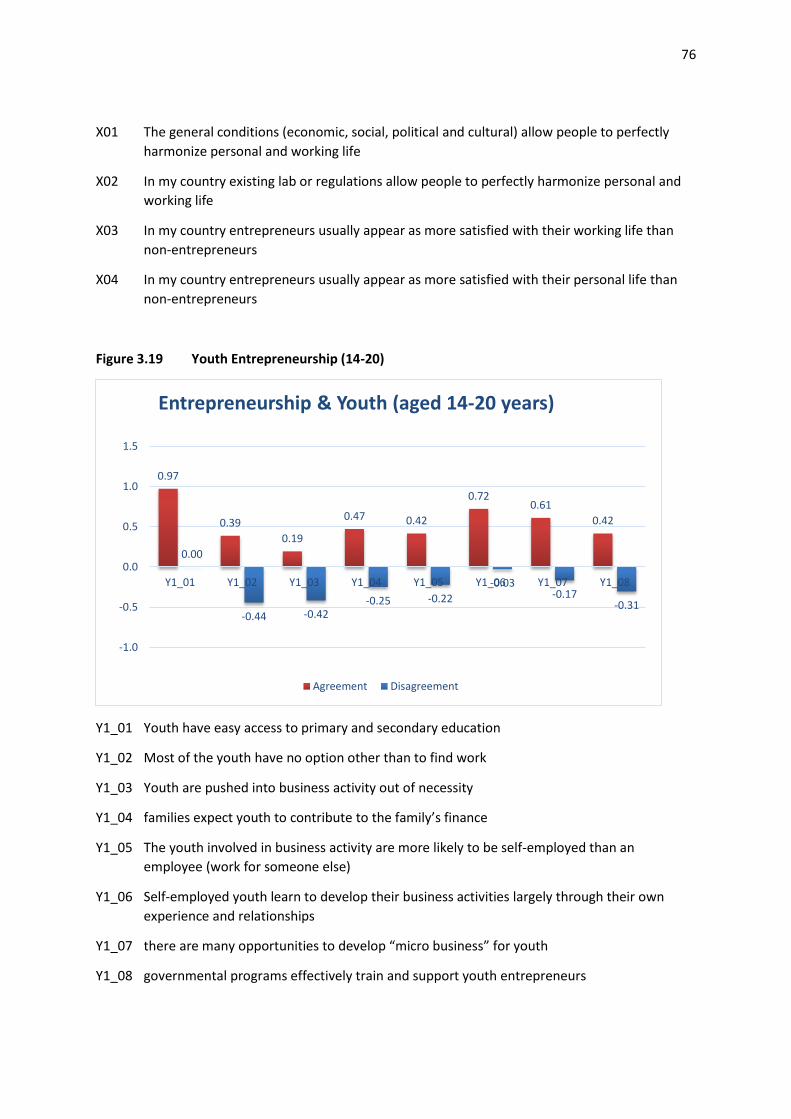
76
X01 The general conditions (economic, social, political and cultural) allow people to perfectly
harmonize personal and working life
X02 In my country existing lab or regulations allow people to perfectly harmonize personal and
working life
X03 In my country entrepreneurs usually appear as more satisfied with their working life than
non-entrepreneurs
X04 In my country entrepreneurs usually appear as more satisfied with their personal life than
non-entrepreneurs
Figure 3.19 Youth Entrepreneurship (14-20)
Y1_01 Youth have easy access to primary and secondary education
Y1_02 Most of the youth have no option other than to find work
Y1_03 Youth are pushed into business activity out of necessity
Y1_04 families expect youth to contribute to the family’s finance
Y1_05 The youth involved in business activity are more likely to be self-employed than an
employee (work for someone else)
Y1_06 Self-employed youth learn to develop their business activities largely through their own
experience and relationships
Y1_07 there are many opportunities to develop “micro business” for youth
Y1_08 governmental programs effectively train and support youth entrepreneurs
0.97
0.39
0.19
0.47 0.42
0.72 0.61
0.42
0.00
-0.44 -0.42 -0.25 -0.22
-0.03 -0.17
-0.31
-1.0
-0.5
0.0
0.5
1.0
1.5
Y1_01 Y1_02 Y1_03 Y1_04 Y1_05 Y1_06 Y1_07 Y1_08
Entrepreneurship & Youth (aged 14-20 years)
Agreement Disagreement
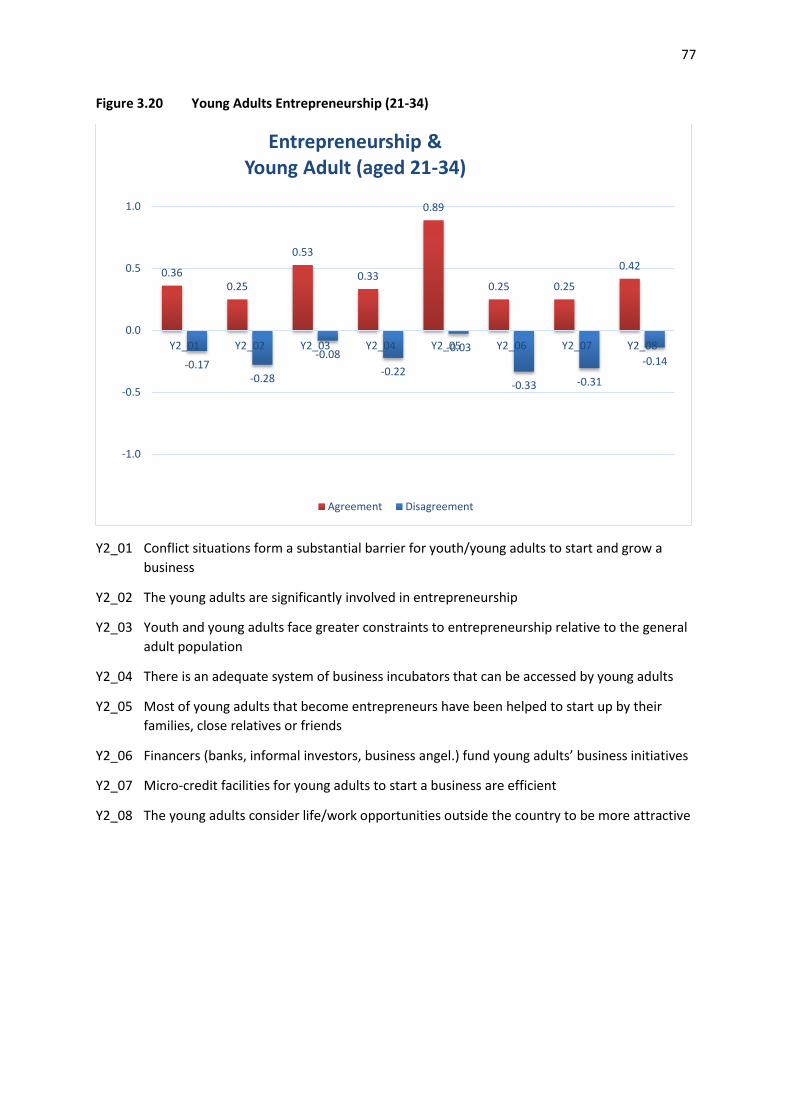
77
Figure 3.20 Young Adults Entrepreneurship (21-34)
Y2_01 Conflict situations form a substantial barrier for youth/young adults to start and grow a
business
Y2_02 The young adults are significantly involved in entrepreneurship
Y2_03 Youth and young adults face greater constraints to entrepreneurship relative to the general
adult population
Y2_04 There is an adequate system of business incubators that can be accessed by young adults
Y2_05 Most of young adults that become entrepreneurs have been helped to start up by their
families, close relatives or friends
Y2_06 Financers (banks, informal investors, business angel.) fund young adults’ business initiatives
Y2_07 Micro-credit facilities for young adults to start a business are efficient
Y2_08 The young adults consider life/work opportunities outside the country to be more attractive
0.36 0.25
0.53
0.33
0.89
0.25 0.25
0.42
-0.17 -0.28
-0.08
-0.22
-0.03
-0.33 -0.31
-0.14
-1.0
-0.5
0.0
0.5
1.0
Y2_01 Y2_02 Y2_03 Y2_04 Y2_05 Y2_06 Y2_07 Y2_08
Entrepreneurship & Young Adult (aged 21-34)
Agreement Disagreement
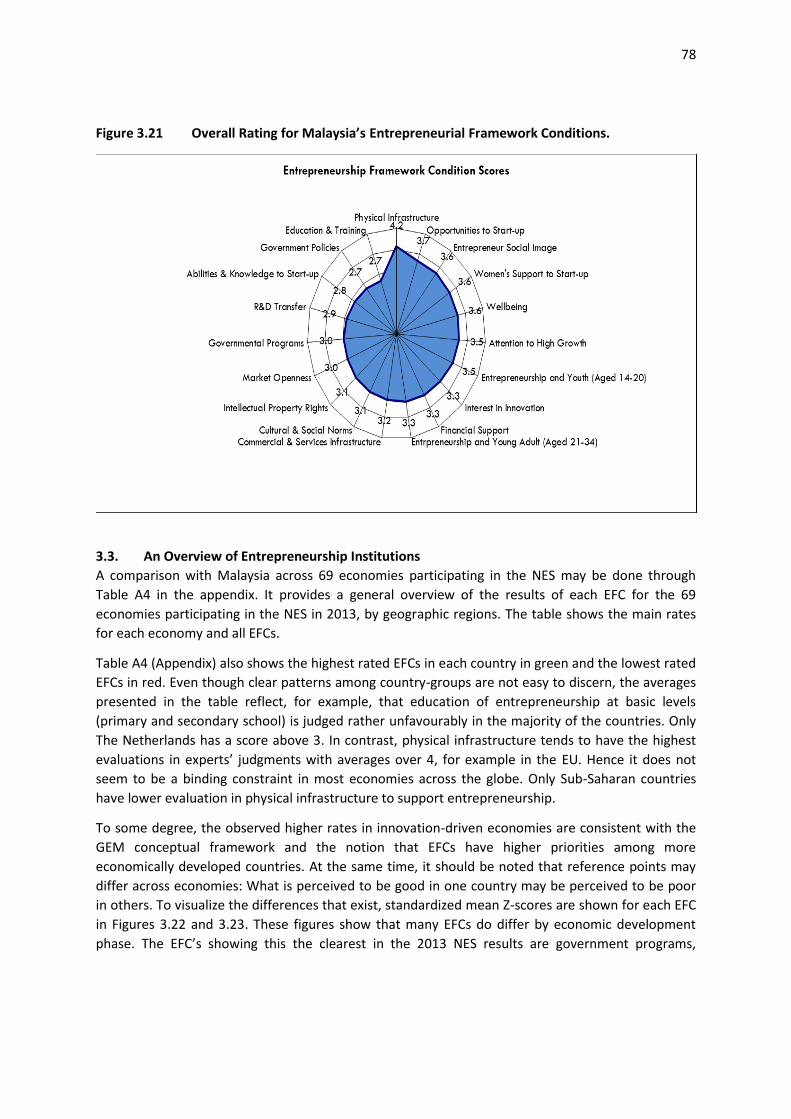
78
Figure 3.21 Overall Rating for Malaysia’s Entrepreneurial Framework Conditions.
3.3. An Overview of Entrepreneurship Institutions
A comparison with Malaysia across 69 economies participating in the NES may be done through
Table A4 in the appendix. It provides a general overview of the results of each EFC for the 69
economies participating in the NES in 2013, by geographic regions. The table shows the main rates
for each economy and all EFCs.
Table A4 (Appendix) also shows the highest rated EFCs in each country in green and the lowest rated
EFCs in red. Even though clear patterns among country-groups are not easy to discern, the averages
presented in the table reflect, for example, that education of entrepreneurship at basic levels
(primary and secondary school) is judged rather unfavourably in the majority of the countries. Only
The Netherlands has a score above 3. In contrast, physical infrastructure tends to have the highest
evaluations in experts’ judgments with averages over 4, for example in the EU. Hence it does not
seem to be a binding constraint in most economies across the globe. Only Sub-Saharan countries
have lower evaluation in physical infrastructure to support entrepreneurship.
To some degree, the observed higher rates in innovation-driven economies are consistent with the
GEM conceptual framework and the notion that EFCs have higher priorities among more
economically developed countries. At the same time, it should be noted that reference points may
differ across economies: What is perceived to be good in one country may be perceived to be poor
in others. To visualize the differences that exist, standardized mean Z-scores are shown for each EFC
in Figures 3.22 and 3.23. These figures show that many EFCs do differ by economic development
phase. The EFC’s showing this the clearest in the 2013 NES results are government programs,
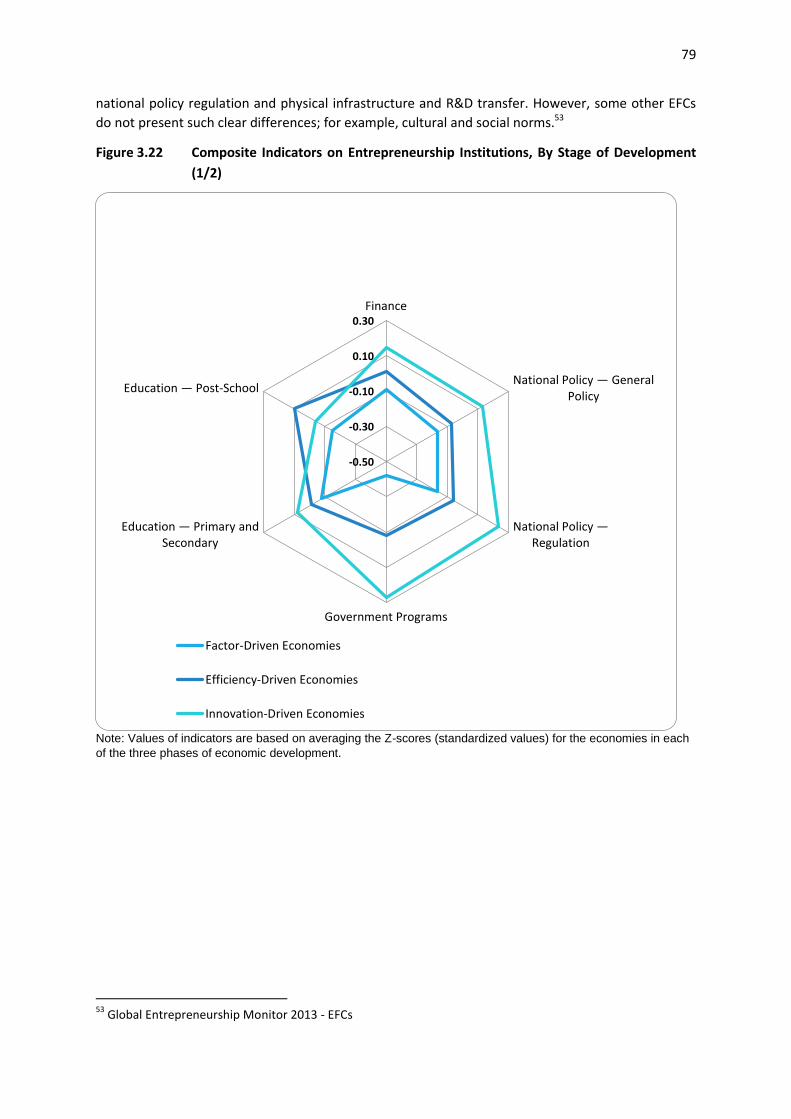
79
national policy regulation and physical infrastructure and R&D transfer. However, some other EFCs
do not present such clear differences; for example, cultural and social norms.53
Figure 3.22 Composite Indicators on Entrepreneurship Institutions, By Stage of Development
(1/2)
Note: Values of indicators are based on averaging the Z-scores (standardized values) for the economies in each
of the three phases of economic development.
53
Global Entrepreneurship Monitor 2013 - EFCs
-0.50
-0.30
-0.10
0.10
0.30Finance
National Policy — General Policy
National Policy — Regulation
Government Programs
Education — Primary and Secondary
Education — Post-School
Factor-Driven Economies
Efficiency-Driven Economies
Innovation-Driven Economies
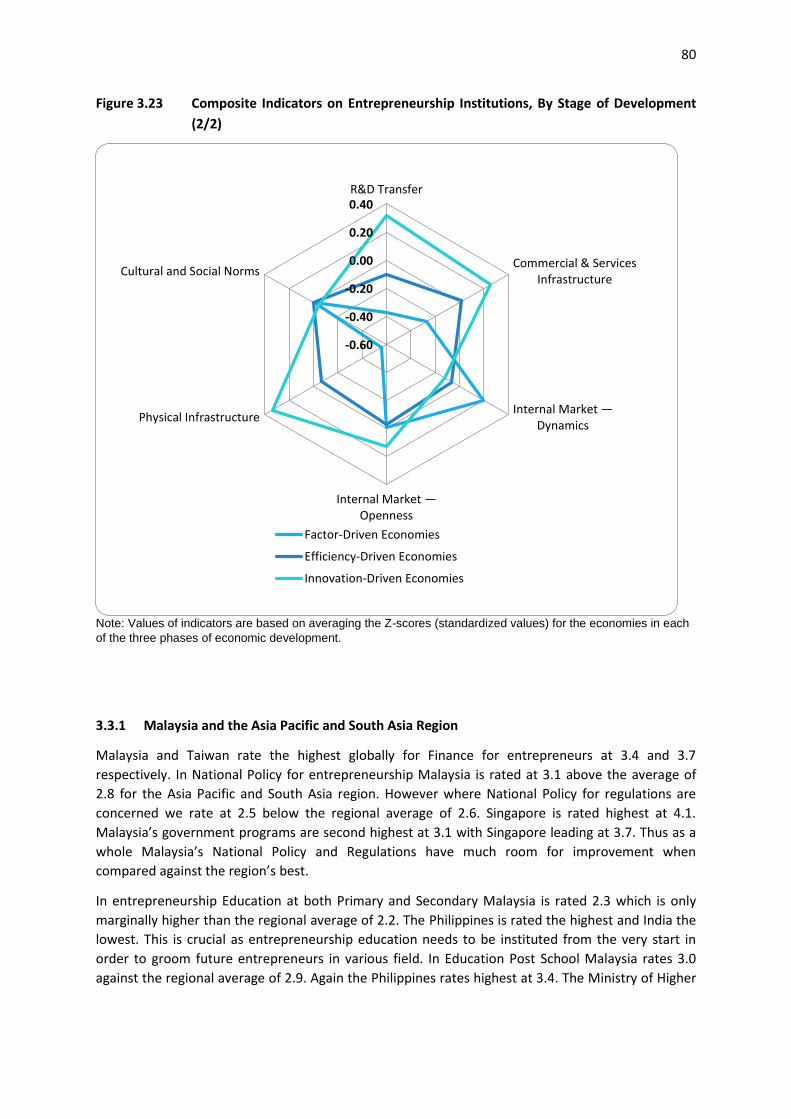
80
Figure 3.23 Composite Indicators on Entrepreneurship Institutions, By Stage of Development
(2/2)
Note: Values of indicators are based on averaging the Z-scores (standardized values) for the economies in each
of the three phases of economic development.
3.3.1 Malaysia and the Asia Pacific and South Asia Region
Malaysia and Taiwan rate the highest globally for Finance for entrepreneurs at 3.4 and 3.7
respectively. In National Policy for entrepreneurship Malaysia is rated at 3.1 above the average of
2.8 for the Asia Pacific and South Asia region. However where National Policy for regulations are
concerned we rate at 2.5 below the regional average of 2.6. Singapore is rated highest at 4.1.
Malaysia’s government programs are second highest at 3.1 with Singapore leading at 3.7. Thus as a
whole Malaysia’s National Policy and Regulations have much room for improvement when
compared against the region’s best.
In entrepreneurship Education at both Primary and Secondary Malaysia is rated 2.3 which is only
marginally higher than the regional average of 2.2. The Philippines is rated the highest and India the
lowest. This is crucial as entrepreneurship education needs to be instituted from the very start in
order to groom future entrepreneurs in various field. In Education Post School Malaysia rates 3.0
against the regional average of 2.9. Again the Philippines rates highest at 3.4. The Ministry of Higher
-0.60
-0.40
-0.20
0.00
0.20
0.40R&D Transfer
Commercial & ServicesInfrastructure
Internal Market — Dynamics
Internal Market — Openness
Physical Infrastructure
Cultural and Social Norms
Factor-Driven Economies
Efficiency-Driven Economies
Innovation-Driven Economies
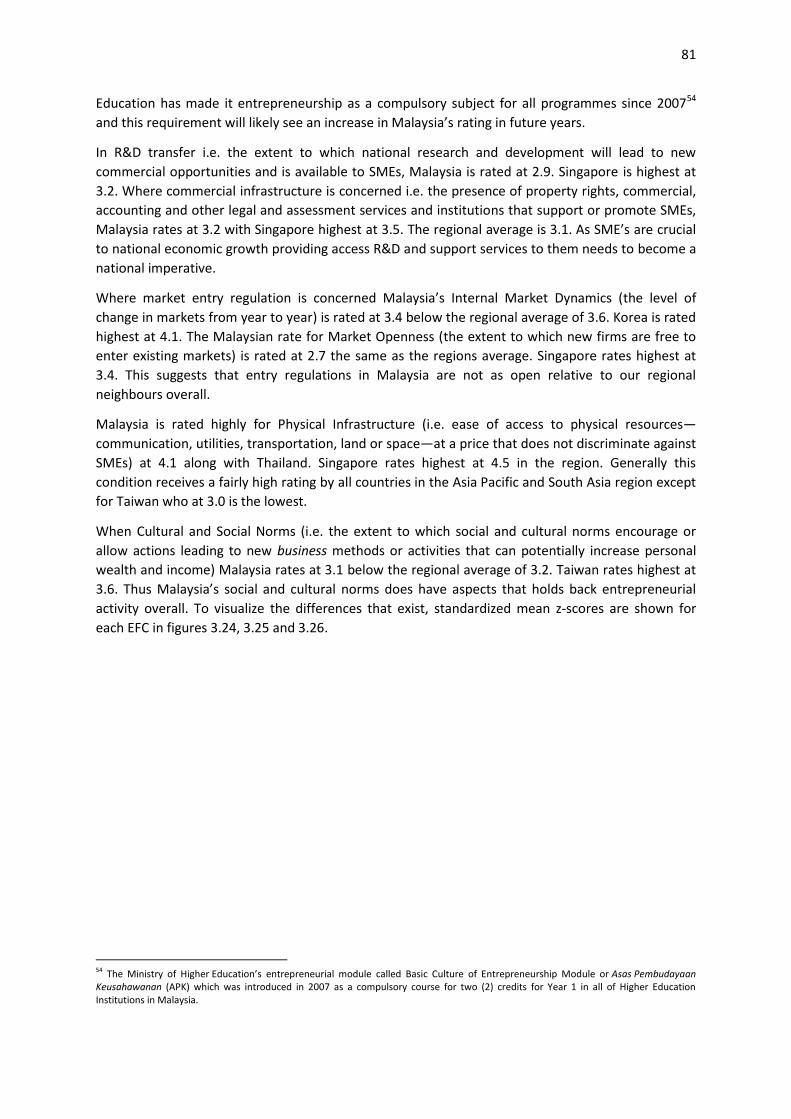
81
Education has made it entrepreneurship as a compulsory subject for all programmes since 200754
and this requirement will likely see an increase in Malaysia’s rating in future years.
In R&D transfer i.e. the extent to which national research and development will lead to new
commercial opportunities and is available to SMEs, Malaysia is rated at 2.9. Singapore is highest at
3.2. Where commercial infrastructure is concerned i.e. the presence of property rights, commercial,
accounting and other legal and assessment services and institutions that support or promote SMEs,
Malaysia rates at 3.2 with Singapore highest at 3.5. The regional average is 3.1. As SME’s are crucial
to national economic growth providing access R&D and support services to them needs to become a
national imperative.
Where market entry regulation is concerned Malaysia’s Internal Market Dynamics (the level of
change in markets from year to year) is rated at 3.4 below the regional average of 3.6. Korea is rated
highest at 4.1. The Malaysian rate for Market Openness (the extent to which new firms are free to
enter existing markets) is rated at 2.7 the same as the regions average. Singapore rates highest at
3.4. This suggests that entry regulations in Malaysia are not as open relative to our regional
neighbours overall.
Malaysia is rated highly for Physical Infrastructure (i.e. ease of access to physical resources—
communication, utilities, transportation, land or space—at a price that does not discriminate against
SMEs) at 4.1 along with Thailand. Singapore rates highest at 4.5 in the region. Generally this
condition receives a fairly high rating by all countries in the Asia Pacific and South Asia region except
for Taiwan who at 3.0 is the lowest.
When Cultural and Social Norms (i.e. the extent to which social and cultural norms encourage or
allow actions leading to new business methods or activities that can potentially increase personal
wealth and income) Malaysia rates at 3.1 below the regional average of 3.2. Taiwan rates highest at
3.6. Thus Malaysia’s social and cultural norms does have aspects that holds back entrepreneurial
activity overall. To visualize the differences that exist, standardized mean z-scores are shown for
each EFC in figures 3.24, 3.25 and 3.26.
54 The Ministry of Higher Education’s entrepreneurial module called Basic Culture of Entrepreneurship Module or Asas Pembudayaan Keusahawanan (APK) which was introduced in 2007 as a compulsory course for two (2) credits for Year 1 in all of Higher Education Institutions in Malaysia.
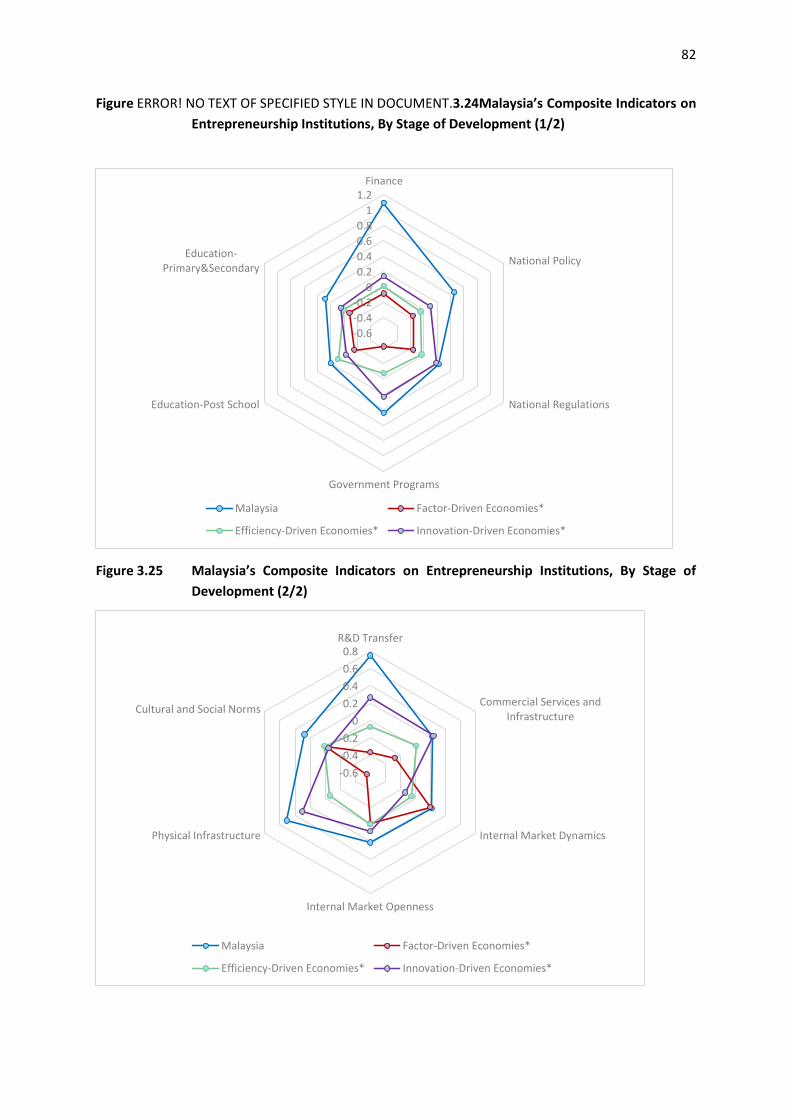
82
Figure ERROR! NO TEXT OF SPECIFIED STYLE IN DOCUMENT.3.24 Malaysia’s Composite Indicators on
Entrepreneurship Institutions, By Stage of Development (1/2)
Figure 3.25 Malaysia’s Composite Indicators on Entrepreneurship Institutions, By Stage of
Development (2/2)
-0.6
-0.4
-0.2
0
0.2
0.4
0.6
0.8
1
1.2Finance
National Policy
National Regulations
Government Programs
Education-Post School
Education-Primary&Secondary
Malaysia Factor-Driven Economies*
Efficiency-Driven Economies* Innovation-Driven Economies*
-0.6
-0.4
-0.2
0
0.2
0.4
0.6
0.8R&D Transfer
Commercial Services andInfrastructure
Internal Market Dynamics
Internal Market Openness
Physical Infrastructure
Cultural and Social Norms
Malaysia Factor-Driven Economies*
Efficiency-Driven Economies* Innovation-Driven Economies*
83
Figure 3.26 Malaysia’s Overall Composite Indicators on Entrepreneurship Institutions, By Stage
of Development
-0.6
-0.4
-0.2
0
0.2
0.4
0.6
0.8
1
1.2Finance
National Policy
National Regulations
Government Programs
Education-Post School
Education-Primary&Secondary
R&D Transfer
Commercial Services andInfrastructure
Internal Market Dynamics
Internal Market Openness
Physical Infrastructure
Cultural and Social Norms
Malaysia Factor-Driven Economies*
Efficiency-Driven Economies* Innovation-Driven Economies*
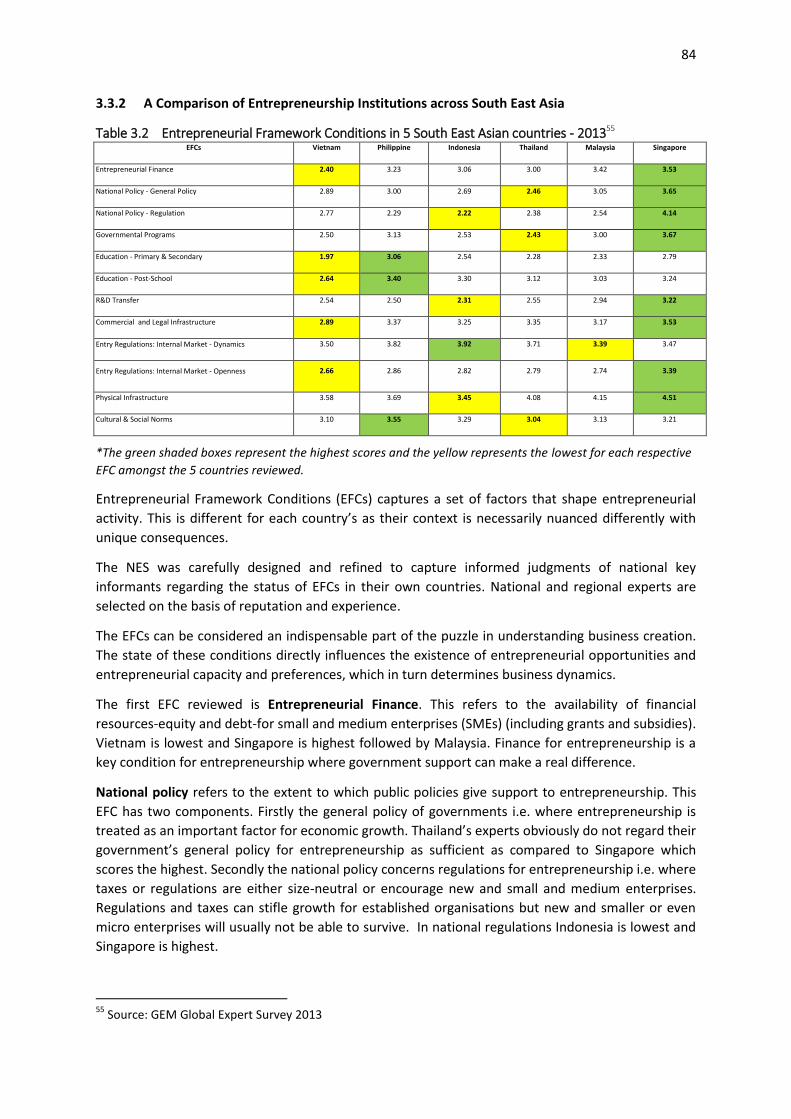
84
3.3.2 A Comparison of Entrepreneurship Institutions across South East Asia
Table 3.2 Entrepreneurial Framework Conditions in 5 South East Asian countries - 201355 EFCs Vietnam Philippine Indonesia Thailand Malaysia Singapore
Entrepreneurial Finance 2.40 3.23 3.06 3.00 3.42 3.53
National Policy - General Policy 2.89 3.00 2.69 2.46 3.05 3.65
National Policy - Regulation 2.77 2.29 2.22 2.38 2.54 4.14
Governmental Programs 2.50 3.13 2.53 2.43 3.00 3.67
Education - Primary & Secondary 1.97 3.06 2.54 2.28 2.33 2.79
Education - Post-School 2.64 3.40 3.30 3.12 3.03 3.24
R&D Transfer 2.54 2.50 2.31 2.55 2.94 3.22
Commercial and Legal Infrastructure 2.89 3.37 3.25 3.35 3.17 3.53
Entry Regulations: Internal Market - Dynamics 3.50 3.82 3.92 3.71 3.39 3.47
Entry Regulations: Internal Market - Openness 2.66 2.86 2.82 2.79 2.74 3.39
Physical Infrastructure 3.58 3.69 3.45 4.08 4.15 4.51
Cultural & Social Norms 3.10 3.55 3.29 3.04 3.13 3.21
*The green shaded boxes represent the highest scores and the yellow represents the lowest for each respective
EFC amongst the 5 countries reviewed.
Entrepreneurial Framework Conditions (EFCs) captures a set of factors that shape entrepreneurial
activity. This is different for each country’s as their context is necessarily nuanced differently with
unique consequences.
The NES was carefully designed and refined to capture informed judgments of national key
informants regarding the status of EFCs in their own countries. National and regional experts are
selected on the basis of reputation and experience.
The EFCs can be considered an indispensable part of the puzzle in understanding business creation.
The state of these conditions directly influences the existence of entrepreneurial opportunities and
entrepreneurial capacity and preferences, which in turn determines business dynamics.
The first EFC reviewed is Entrepreneurial Finance. This refers to the availability of financial
resources-equity and debt-for small and medium enterprises (SMEs) (including grants and subsidies).
Vietnam is lowest and Singapore is highest followed by Malaysia. Finance for entrepreneurship is a
key condition for entrepreneurship where government support can make a real difference.
National policy refers to the extent to which public policies give support to entrepreneurship. This
EFC has two components. Firstly the general policy of governments i.e. where entrepreneurship is
treated as an important factor for economic growth. Thailand’s experts obviously do not regard their
government’s general policy for entrepreneurship as sufficient as compared to Singapore which
scores the highest. Secondly the national policy concerns regulations for entrepreneurship i.e. where
taxes or regulations are either size-neutral or encourage new and small and medium enterprises.
Regulations and taxes can stifle growth for established organisations but new and smaller or even
micro enterprises will usually not be able to survive. In national regulations Indonesia is lowest and
Singapore is highest.
55
Source: GEM Global Expert Survey 2013
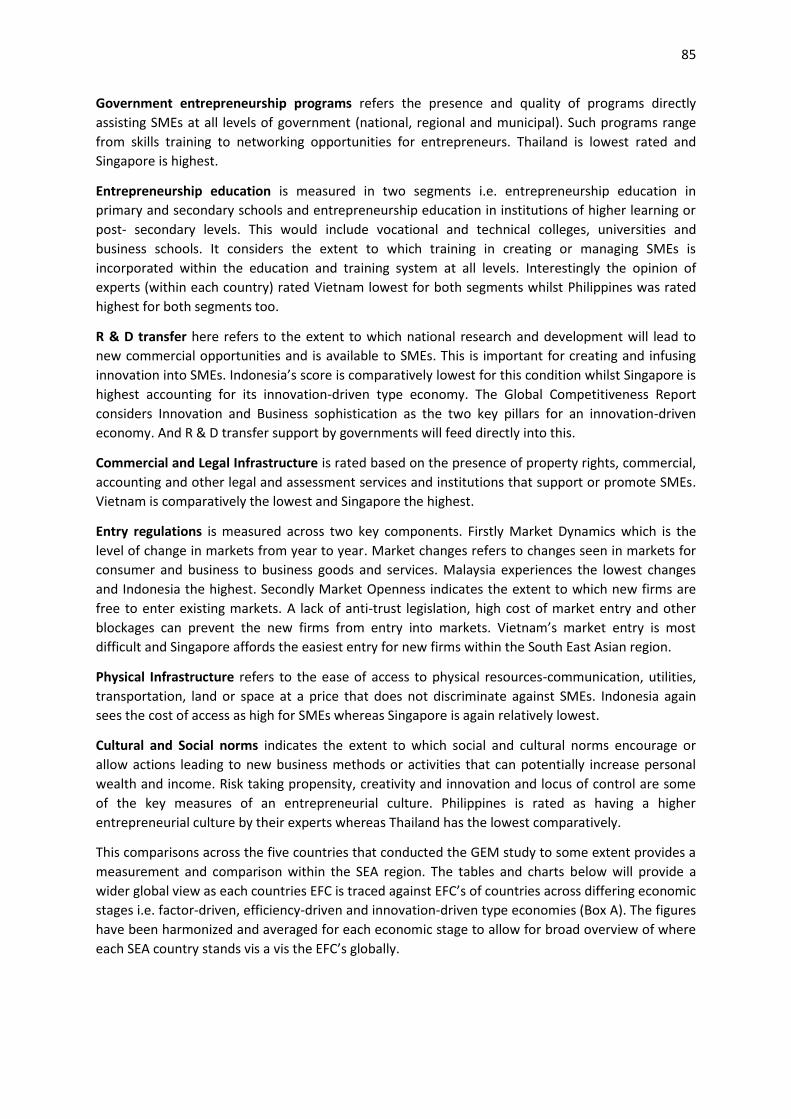
85
Government entrepreneurship programs refers the presence and quality of programs directly
assisting SMEs at all levels of government (national, regional and municipal). Such programs range
from skills training to networking opportunities for entrepreneurs. Thailand is lowest rated and
Singapore is highest.
Entrepreneurship education is measured in two segments i.e. entrepreneurship education in
primary and secondary schools and entrepreneurship education in institutions of higher learning or
post- secondary levels. This would include vocational and technical colleges, universities and
business schools. It considers the extent to which training in creating or managing SMEs is
incorporated within the education and training system at all levels. Interestingly the opinion of
experts (within each country) rated Vietnam lowest for both segments whilst Philippines was rated
highest for both segments too.
R & D transfer here refers to the extent to which national research and development will lead to
new commercial opportunities and is available to SMEs. This is important for creating and infusing
innovation into SMEs. Indonesia’s score is comparatively lowest for this condition whilst Singapore is
highest accounting for its innovation-driven type economy. The Global Competitiveness Report
considers Innovation and Business sophistication as the two key pillars for an innovation-driven
economy. And R & D transfer support by governments will feed directly into this.
Commercial and Legal Infrastructure is rated based on the presence of property rights, commercial,
accounting and other legal and assessment services and institutions that support or promote SMEs.
Vietnam is comparatively the lowest and Singapore the highest.
Entry regulations is measured across two key components. Firstly Market Dynamics which is the
level of change in markets from year to year. Market changes refers to changes seen in markets for
consumer and business to business goods and services. Malaysia experiences the lowest changes
and Indonesia the highest. Secondly Market Openness indicates the extent to which new firms are
free to enter existing markets. A lack of anti-trust legislation, high cost of market entry and other
blockages can prevent the new firms from entry into markets. Vietnam’s market entry is most
difficult and Singapore affords the easiest entry for new firms within the South East Asian region.
Physical Infrastructure refers to the ease of access to physical resources-communication, utilities,
transportation, land or space at a price that does not discriminate against SMEs. Indonesia again
sees the cost of access as high for SMEs whereas Singapore is again relatively lowest.
Cultural and Social norms indicates the extent to which social and cultural norms encourage or
allow actions leading to new business methods or activities that can potentially increase personal
wealth and income. Risk taking propensity, creativity and innovation and locus of control are some
of the key measures of an entrepreneurial culture. Philippines is rated as having a higher
entrepreneurial culture by their experts whereas Thailand has the lowest comparatively.
This comparisons across the five countries that conducted the GEM study to some extent provides a
measurement and comparison within the SEA region. The tables and charts below will provide a
wider global view as each countries EFC is traced against EFC’s of countries across differing economic
stages i.e. factor-driven, efficiency-driven and innovation-driven type economies (Box A). The figures
have been harmonized and averaged for each economic stage to allow for broad overview of where
each SEA country stands vis a vis the EFC’s globally.
86
Box A Economic Stages of Development 56
Factor-Driven Economies
These comprise countries compete based on their factor endowments—primarily unskilled labour and natural resources. Companies compete on the basis of price and sell basic products or commodities, with their low productivity reflected in low wages. Maintaining competitiveness at this stage of development hinges primarily on well-functioning public and private institutions, a well-developed infrastructure, a stable macroeconomic environment, and a healthy workforce that has received at least a basic education.
Efficiency-Driven Economies
As a country becomes more competitive, productivity will increase and wages will rise with advancing development. Countries will then move into the efficiency-driven stage of development, when they must begin to develop more efficient production processes and increase product quality because wages have risen and they cannot increase prices. At this point, competitiveness is increasingly driven by higher education and training, efficient goods markets, well-functioning labour markets, developed financial markets, the ability to harness the benefits of existing technologies, and a large domestic or foreign market.
Innovation-Driven Economies
Finally, as countries move into the innovation-driven stage, wages will have risen by so much that they are able to sustain those higher wages and the associated standard of living only if their businesses are able to compete with new and unique products. At this stage, companies must compete by producing new and different goods using the most sophisticated production processes and by innovating new ones
56
Source: Global Competitiveness Report 2013-2014
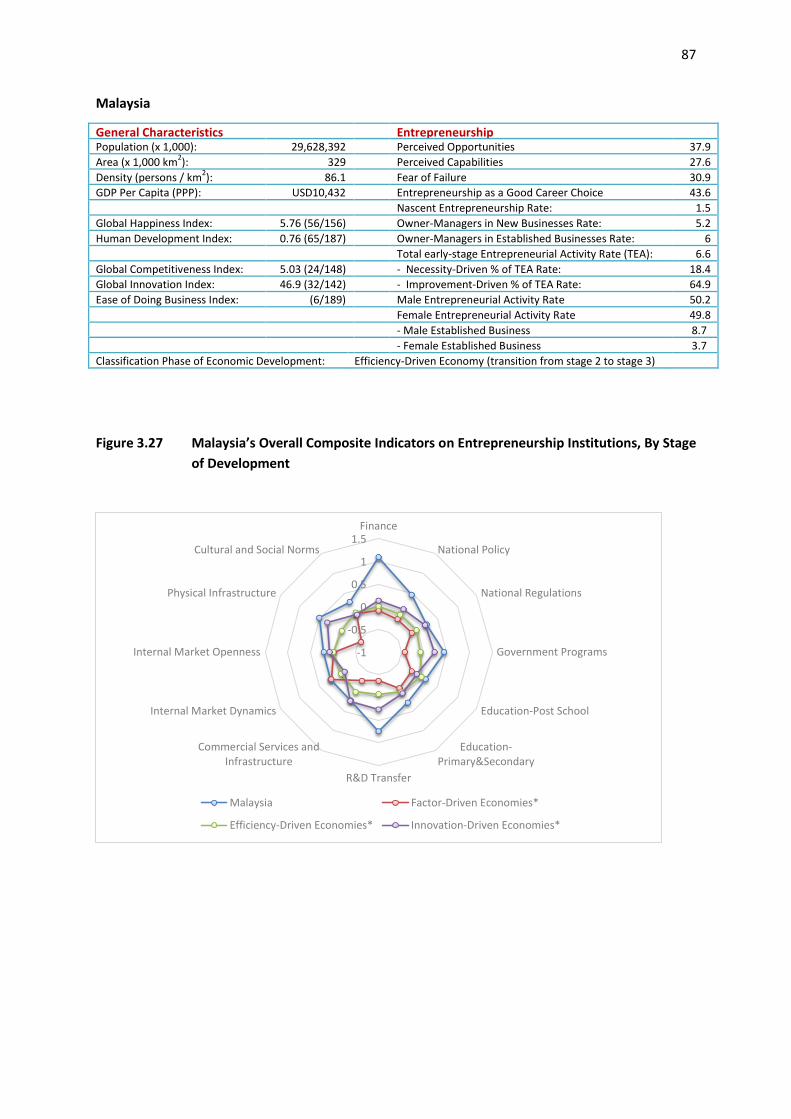
87
Malaysia
General Characteristics Entrepreneurship Indicators Population (x 1,000): 29,628,392 Perceived Opportunities 37.9
Area (x 1,000 km2): 329 Perceived Capabilities 27.6
Density (persons / km2): 86.1 Fear of Failure 30.9
GDP Per Capita (PPP): USD10,432 Entrepreneurship as a Good Career Choice 43.6
Nascent Entrepreneurship Rate: 1.5
Global Happiness Index: 5.76 (56/156) Owner-Managers in New Businesses Rate: 5.2
Human Development Index: 0.76 (65/187) Owner-Managers in Established Businesses Rate: 6
Total early-stage Entrepreneurial Activity Rate (TEA): 6.6
Global Competitiveness Index: 5.03 (24/148) - Necessity-Driven % of TEA Rate: 18.4
Global Innovation Index: 46.9 (32/142) - Improvement-Driven % of TEA Rate: 64.9
Ease of Doing Business Index: (6/189) Male Entrepreneurial Activity Rate 50.2
Female Entrepreneurial Activity Rate 49.8
- Male Established Business 8.7
- Female Established Business 3.7
Classification Phase of Economic Development: Efficiency-Driven Economy (transition from stage 2 to stage 3)
Figure 3.27 Malaysia’s Overall Composite Indicators on Entrepreneurship Institutions, By Stage
of Development
-1
-0.5
0
0.5
1
1.5Finance
National Policy
National Regulations
Government Programs
Education-Post School
Education-Primary&Secondary
R&D Transfer
Commercial Services andInfrastructure
Internal Market Dynamics
Internal Market Openness
Physical Infrastructure
Cultural and Social Norms
Malaysia Factor-Driven Economies*
Efficiency-Driven Economies* Innovation-Driven Economies*
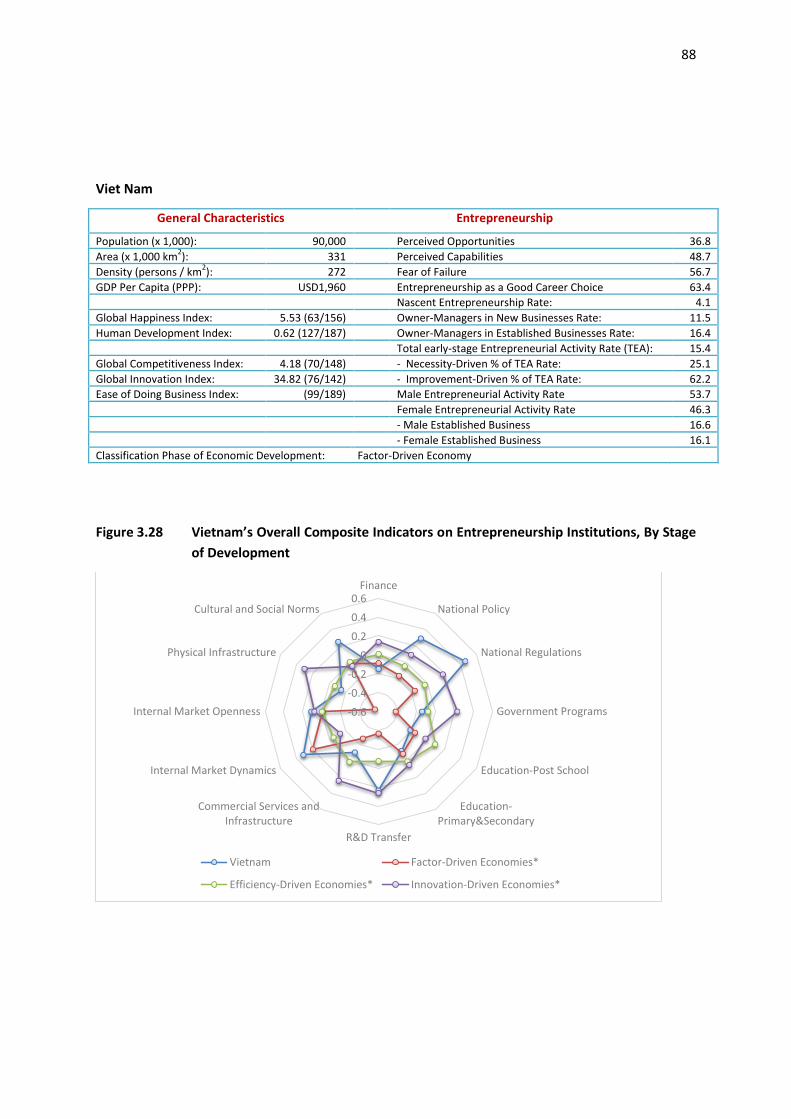
88
Viet Nam
General Characteristics GEM 2013 Entrepreneurship Indicators
Population (x 1,000): 90,000 Perceived Opportunities 36.8
Area (x 1,000 km2): 331 Perceived Capabilities 48.7
Density (persons / km2): 272 Fear of Failure 56.7
GDP Per Capita (PPP): USD1,960 Entrepreneurship as a Good Career Choice 63.4
Nascent Entrepreneurship Rate: 4.1
Global Happiness Index: 5.53 (63/156) Owner-Managers in New Businesses Rate: 11.5
Human Development Index: 0.62 (127/187) Owner-Managers in Established Businesses Rate: 16.4
Total early-stage Entrepreneurial Activity Rate (TEA): 15.4
Global Competitiveness Index: 4.18 (70/148) - Necessity-Driven % of TEA Rate: 25.1
Global Innovation Index: 34.82 (76/142) - Improvement-Driven % of TEA Rate: 62.2
Ease of Doing Business Index: (99/189) Male Entrepreneurial Activity Rate 53.7
Female Entrepreneurial Activity Rate 46.3
- Male Established Business 16.6
- Female Established Business 16.1
Classification Phase of Economic Development: Factor-Driven Economy
Figure 3.28 Vietnam’s Overall Composite Indicators on Entrepreneurship Institutions, By Stage
of Development
-0.6
-0.4
-0.2
0
0.2
0.4
0.6Finance
National Policy
National Regulations
Government Programs
Education-Post School
Education-Primary&Secondary
R&D Transfer
Commercial Services andInfrastructure
Internal Market Dynamics
Internal Market Openness
Physical Infrastructure
Cultural and Social Norms
Vietnam Factor-Driven Economies*
Efficiency-Driven Economies* Innovation-Driven Economies*
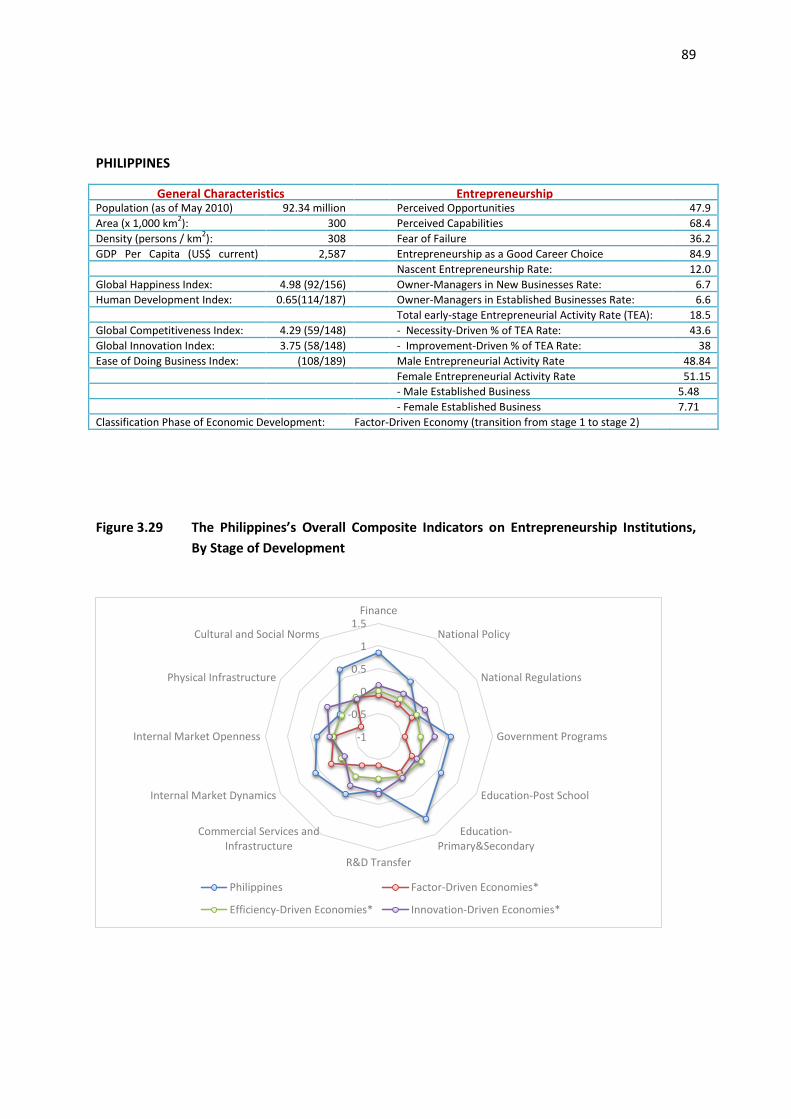
89
PHILIPPINES
General Characteristics GEM 2013 Entrepreneurship Indicators Population (as of May 2010) 92.34 million Perceived Opportunities 47.9
Area (x 1,000 km2): 300 Perceived Capabilities 68.4
Density (persons / km2): 308 Fear of Failure 36.2
GDP Per Capita (US$ current) prices):
2,587 Entrepreneurship as a Good Career Choice 84.9
Nascent Entrepreneurship Rate: 12.0
Global Happiness Index: 4.98 (92/156) Owner-Managers in New Businesses Rate: 6.7
Human Development Index: 0.65(114/187) Owner-Managers in Established Businesses Rate: 6.6
Total early-stage Entrepreneurial Activity Rate (TEA): 18.5
Global Competitiveness Index: 4.29 (59/148) - Necessity-Driven % of TEA Rate: 43.6
Global Innovation Index: 3.75 (58/148) - Improvement-Driven % of TEA Rate: 38
Ease of Doing Business Index: (108/189) Male Entrepreneurial Activity Rate 48.84
Female Entrepreneurial Activity Rate 51.15
- Male Established Business 5.48
- Female Established Business 7.71
Classification Phase of Economic Development: Factor-Driven Economy (transition from stage 1 to stage 2)
Figure 3.29 The Philippines’s Overall Composite Indicators on Entrepreneurship Institutions,
By Stage of Development
-1
-0.5
0
0.5
1
1.5Finance
National Policy
National Regulations
Government Programs
Education-Post School
Education-Primary&Secondary
R&D Transfer
Commercial Services andInfrastructure
Internal Market Dynamics
Internal Market Openness
Physical Infrastructure
Cultural and Social Norms
Philippines Factor-Driven Economies*
Efficiency-Driven Economies* Innovation-Driven Economies*
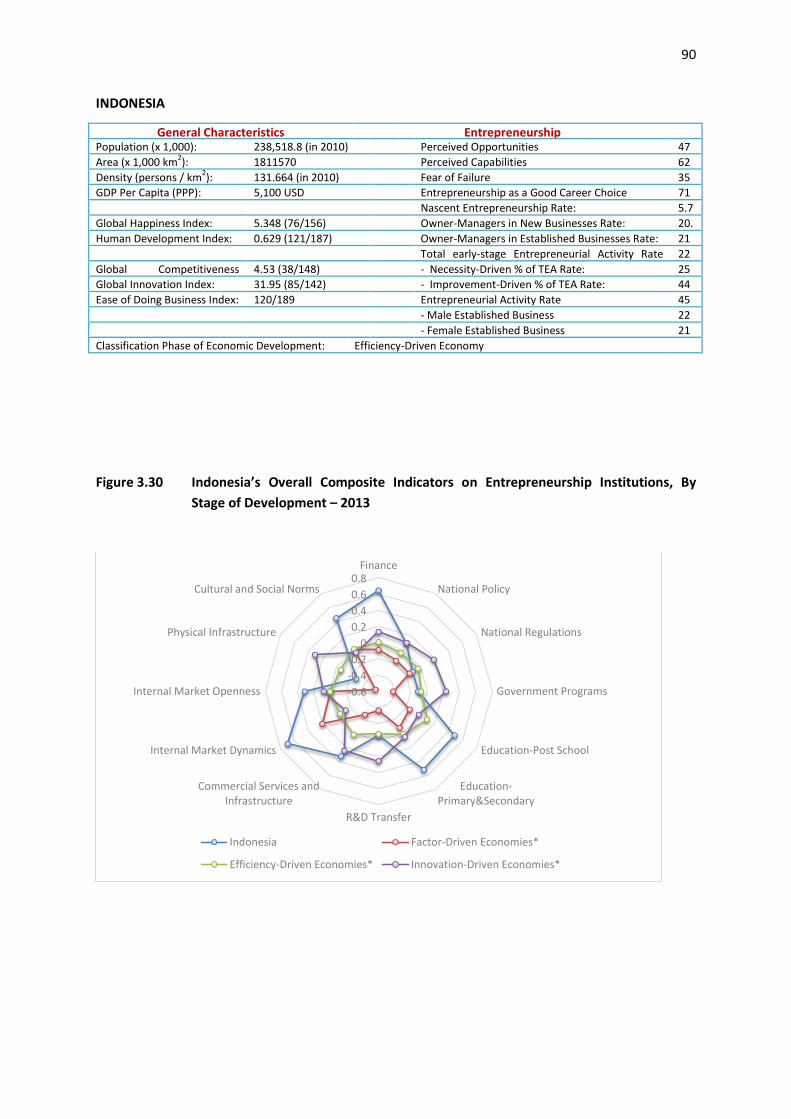
90
INDONESIA
General Characteristics GEM 2013 Entrepreneurship Indicators Population (x 1,000): 238,518.8 (in 2010) Perceived Opportunities 47
Area (x 1,000 km2): 1811570 Perceived Capabilities 62
Density (persons / km2): 131.664 (in 2010) Fear of Failure 35
GDP Per Capita (PPP): 5,100 USD Entrepreneurship as a Good Career Choice 71
Nascent Entrepreneurship Rate: 5.7
Global Happiness Index: 5.348 (76/156) Owner-Managers in New Businesses Rate: 20.4 Human Development Index: 0.629 (121/187) Owner-Managers in Established Businesses Rate: 21
Total early-stage Entrepreneurial Activity Rate (TEA):
22
Global Competitiveness Index Index:
4.53 (38/148) - Necessity-Driven % of TEA Rate: 25
Global Innovation Index: 31.95 (85/142) - Improvement-Driven % of TEA Rate: 44
Ease of Doing Business Index: 120/189 Entrepreneurial Activity Rate 45
- Male Established Business 22
- Female Established Business 21
Classification Phase of Economic Development: Efficiency-Driven Economy
Figure 3.30 Indonesia’s Overall Composite Indicators on Entrepreneurship Institutions, By
Stage of Development – 2013
-0.6
-0.4
-0.2
0
0.2
0.4
0.6
0.8Finance
National Policy
National Regulations
Government Programs
Education-Post School
Education-Primary&Secondary
R&D Transfer
Commercial Services andInfrastructure
Internal Market Dynamics
Internal Market Openness
Physical Infrastructure
Cultural and Social Norms
Indonesia Factor-Driven Economies*
Efficiency-Driven Economies* Innovation-Driven Economies*
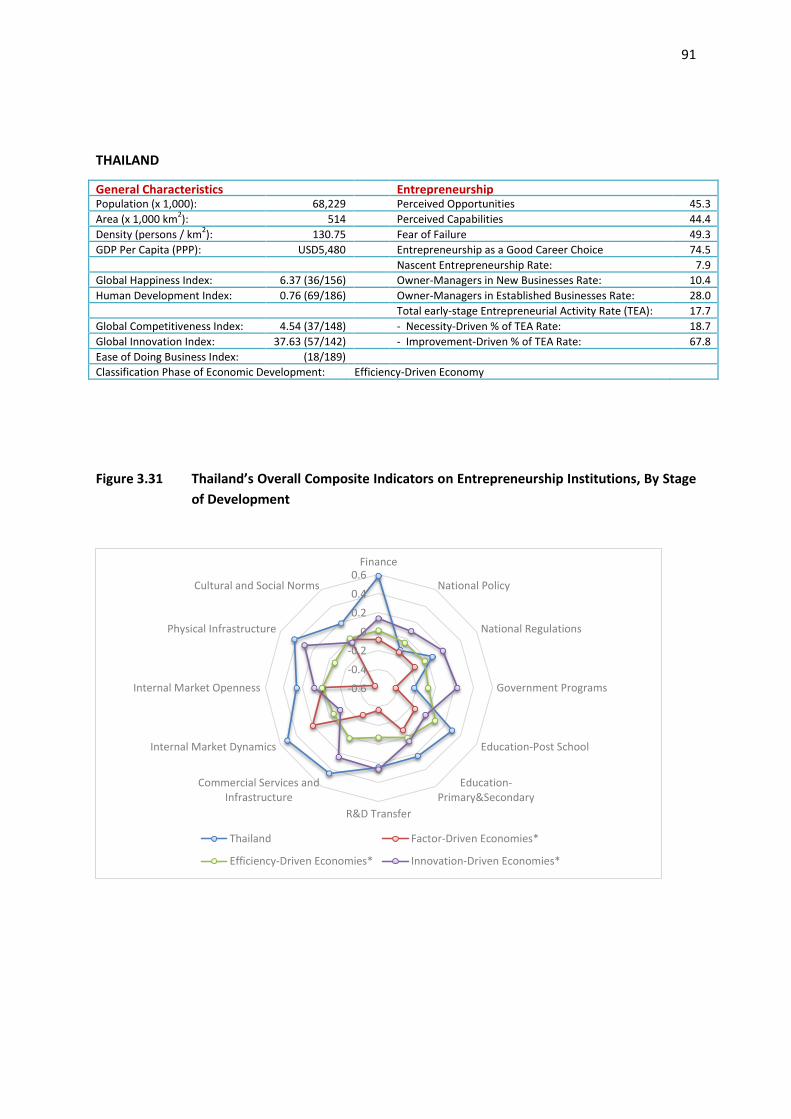
91
THAILAND
General Characteristics Entrepreneurship Indicators Population (x 1,000): 68,229 Perceived Opportunities 45.3
Area (x 1,000 km2): 514 Perceived Capabilities 44.4
Density (persons / km2): 130.75 Fear of Failure 49.3
GDP Per Capita (PPP): USD5,480 Entrepreneurship as a Good Career Choice 74.5
Nascent Entrepreneurship Rate: 7.9
Global Happiness Index: 6.37 (36/156) Owner-Managers in New Businesses Rate: 10.4
Human Development Index: 0.76 (69/186) Owner-Managers in Established Businesses Rate: 28.0
Total early-stage Entrepreneurial Activity Rate (TEA): 17.7
Global Competitiveness Index: 4.54 (37/148) - Necessity-Driven % of TEA Rate: 18.7
Global Innovation Index: 37.63 (57/142) - Improvement-Driven % of TEA Rate: 67.8
Ease of Doing Business Index: (18/189)
Classification Phase of Economic Development: Efficiency-Driven Economy
Figure 3.31 Thailand’s Overall Composite Indicators on Entrepreneurship Institutions, By Stage
of Development
-0.6
-0.4
-0.2
0
0.2
0.4
0.6Finance
National Policy
National Regulations
Government Programs
Education-Post School
Education-Primary&Secondary
R&D Transfer
Commercial Services andInfrastructure
Internal Market Dynamics
Internal Market Openness
Physical Infrastructure
Cultural and Social Norms
Thailand Factor-Driven Economies*
Efficiency-Driven Economies* Innovation-Driven Economies*
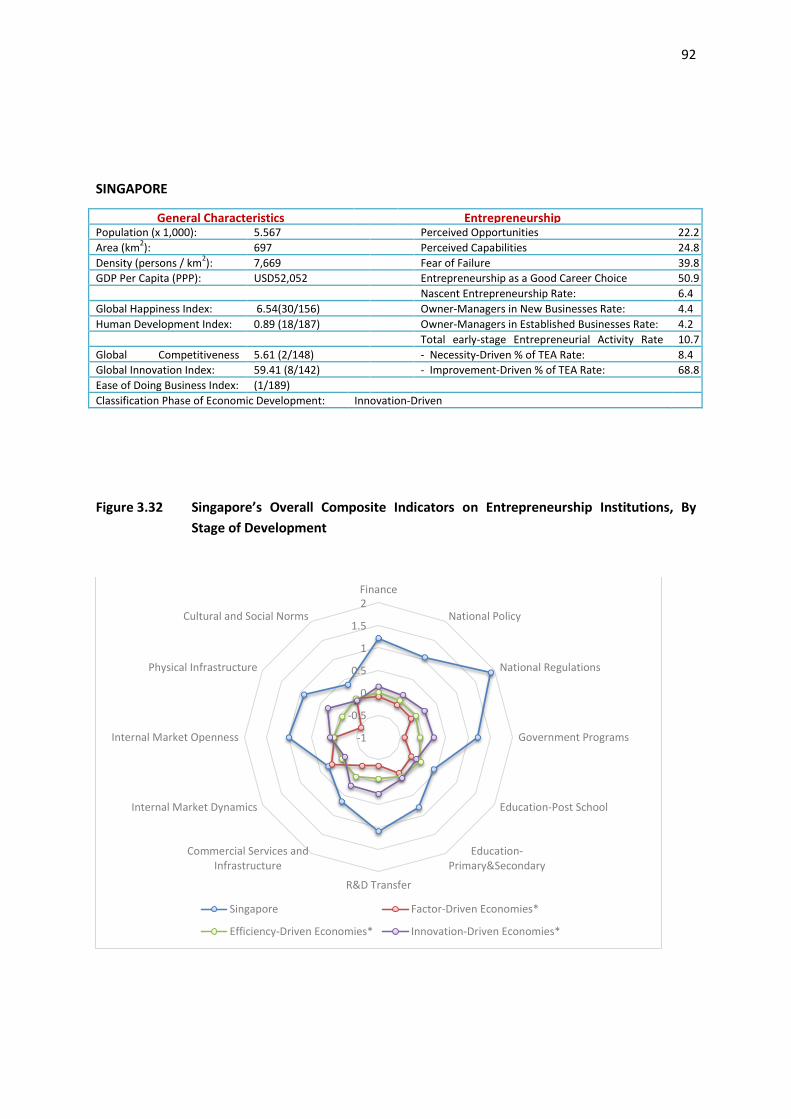
92
SINGAPORE
General Characteristics GEM 2013 Entrepreneurship Indicators Population (x 1,000): 5.567 Perceived Opportunities 22.2
Area (km2): 697 Perceived Capabilities 24.8
Density (persons / km2): 7,669 Fear of Failure 39.8
GDP Per Capita (PPP): USD52,052 Entrepreneurship as a Good Career Choice 50.9
Nascent Entrepreneurship Rate: 6.4
Global Happiness Index: 6.54(30/156) Owner-Managers in New Businesses Rate: 4.4
Human Development Index: 0.89 (18/187) Owner-Managers in Established Businesses Rate: 4.2
Total early-stage Entrepreneurial Activity Rate (TEA):
10.7
Global Competitiveness Index IneIndexIndex:
5.61 (2/148) - Necessity-Driven % of TEA Rate: 8.4
Global Innovation Index: 59.41 (8/142) - Improvement-Driven % of TEA Rate: 68.8
Ease of Doing Business Index: (1/189)
Classification Phase of Economic Development: Innovation-Driven
Figure 3.32 Singapore’s Overall Composite Indicators on Entrepreneurship Institutions, By
Stage of Development
-1
-0.5
0
0.5
1
1.5
2Finance
National Policy
National Regulations
Government Programs
Education-Post School
Education-Primary&Secondary
R&D Transfer
Commercial Services andInfrastructure
Internal Market Dynamics
Internal Market Openness
Physical Infrastructure
Cultural and Social Norms
Singapore Factor-Driven Economies*
Efficiency-Driven Economies* Innovation-Driven Economies*

93
The above EFC views reflect the diverse economic stages of growth in SEA. Each country has its
unique opportunities and challenges against a backdrop of varying capacities to promote
entrepreneurship. Where some SEA nations need to improve National Policies others see a need for
improving Physical Infrastructure or Entrepreneurial Finance. By defining these key imperatives it
affords an opportunity to structure an overall entrepreneurship strategy which will support and
strengthen the individual entrepreneurial eco systems of these SEA nations.
94
CHAPTER 4: RECOMMENDATIONS FOR POLICY AND PRACTICE
The number of countries using innovation as a means and source for economic growth continues to
increase. In this regard Malaysia is no exception as we see innovation and entrepreneurship as one
of the key pillars that can spearhead economic growth for the nation. Innovation and
entrepreneurship will allow Malaysia to move from a manufacturing and resource based type
economy to an innovation type economy. This improvement up the value chain involves not just the
use of knowledge but the creation of knowledge.
In this regard Malaysia leads the region where tertiary enrolment rates are concerned when
compared with the region. In fact within SEA, Malaysia and Singapore, the education budgets are
amongst the highest. A positive trend is the closing gap between rural and urban new business
owners between 2009 and 2013. This important as the government has made extra efforts to close
the income/opportunities gap between them.
Major hurdles to consider is the real challenge of a middle-income trap, innovation mainly by large
multinational corporations and sections of the economy not being open to competition. Additionally
local suppliers also are seldom party to the innovation integration for products and services.
Today globally the common and constant bane of entrepreneurs are the uncertain economic
situation and the inadequacy or non-existence of starting capital. Both which increases the ‘fear of
failure’. They become obstacles to self-employment. Why? Failing results in legal consequences for
their business, financial burdens, disappointed families and the stigma associated with not
succeeding.
However for Malaysia, over the last five years, these challenges i.e. uncertain economic conditions
and the lack of starting capital have been largely mitigated. Economic growth has been constant (see
http://www.worldbank.org/en/country/malaysia/overview) and as our research shows above
Malaysia has amongst the best start-up funding provisions not just regionally but globally as well.
The off shoot of this is that our fear of failure has reduced by half.
So it begets the question why are we not doing better where entrepreneurship growth and
sustainability of those enterprises are concerned.
There are three key aspects that go towards illuminating an answer to this question.
High Growth Sustainability Concerns
Firstly is the availability of options for potential entrepreneurs in Malaysia. Economic growth
becomes a double edged sword that at once provides growth and in tandem decent employment
opportunities which draws away human resources from entrepreneurship. In a relatively small
population of 29 million (compared against nations in the region) the impact is fairly great.
The solution would be to recalibrate our emphasis and make the entrepreneurial employee activity
(EEA)57(Bosma et al, 2013) equally important. This employee working within an organisation could be
provided the same incentives as given to new start-ups. However it will be for innovation efforts or
spin off organisation for their employers. This approach has the added benefit of the EEA having a
57
Entrepreneurial Employee Activity or EEA is defined by the GEM EEA Report 2013 as ‘employees developing new activities for their main
employer, such as developing or launching new goods or services, or setting up a new business unit, a new establishment or subsidiary.
The scope adopted is therefore broader than new organization creation; however it excludes employee initiatives that mainly aim at
optimizing internal work processes’
95
mentor in addition to other subsidiary resources for the new spin off venture. New monitoring
mechanisms may be put in place that ensures that both the employer and employee benefits. The
employee benefitting is an important aspect as they are the source of ideas and innovation and
should be the ones working the project.
Secondly the lack of evaluation of those business. In Malaysia we tend to take a less than Kirznerian
view to what constitutes an entrepreneurial business. What we need is to take a Schumpeterian
view i.e. a view that promotes innovation with a will to change small businesses into larger ones
(Henrekson and Sanandaji, 2013). Entrepreneurship is not and historically has never been about
business for businesses sake. It is about adding value and filling gaps. As the American’s say, ‘It’s
about solving your customers’ pain’. And today it is more about anticipating our customers’ pain and
delighting them with a solution if one wants to stay in the forefront.
Having said that it is not possible to ‘guarantee’ great business success. The reason is due the
complexity of our environment, both external and internal. We must learn the ‘complicated’ and
expertly manage the ‘complex’. Overcoming those complexities will require adaptation and
persistence for success after a business model is thoroughly evaluated. The importance of a good
and rigorous education standard is a primary requirement here (Schumpeter, The Economist,
2014)58. However if at its infancy businesses could, through objective evaluations, be sieved the
chances for potential high growth entrepreneurial businesses will be much higher. The result will be
much less new businesses but the quality of those who actually start-up will be higher and
consequently result in higher job creation and sustainability. This is where we need to infuse our
resources. The global scenario does offer many lessons including that it is not the quantity of
businesses that matter but the high growth value added quality that counts (Shane, 2009). Patent
registrations too mean little without innovation for the marketplace. It has shown that structural
transformation and the creation of new industries is contributed by growth-oriented entrepreneurs.
The global scenario also adequately clues us in that it is the private sector, driven by expediency and
urgency, are best placed to achieve this. Government role will be as gate constructors and keepers
to facilitate that innate private sector drive.
Thirdly, also resulting from a lack of evaluation, and due to the well-meaning push for
entrepreneurship by government has resulted in what may be termed entrepreneurship on steroids.
Steroidal entrepreneurship will not last. It only serves to conjure a view that meets data statistics
and government agencies KPI’s. When the waves of competition both regional and global arrive
those businesses will not survive. The ‘rakyat’59 are the ones who eventually will bear the brunt of
those inevitable failures and suffer legal, financial and stigmatized ramifications.
Thus an overall relook, based on national research data and our inferences should in part serve to
point Malaysia’s unique entrepreneurial landscape in the right direction. Below we offer an outline,
drawing on global strategies from successful nations that provide an indication of the pain points
that need addressing within Malaysia’s context.
58
http://www.economist.com/blogs/schumpeter/2014/02/our-schumpeter-columnist
59 Malaysian citizens
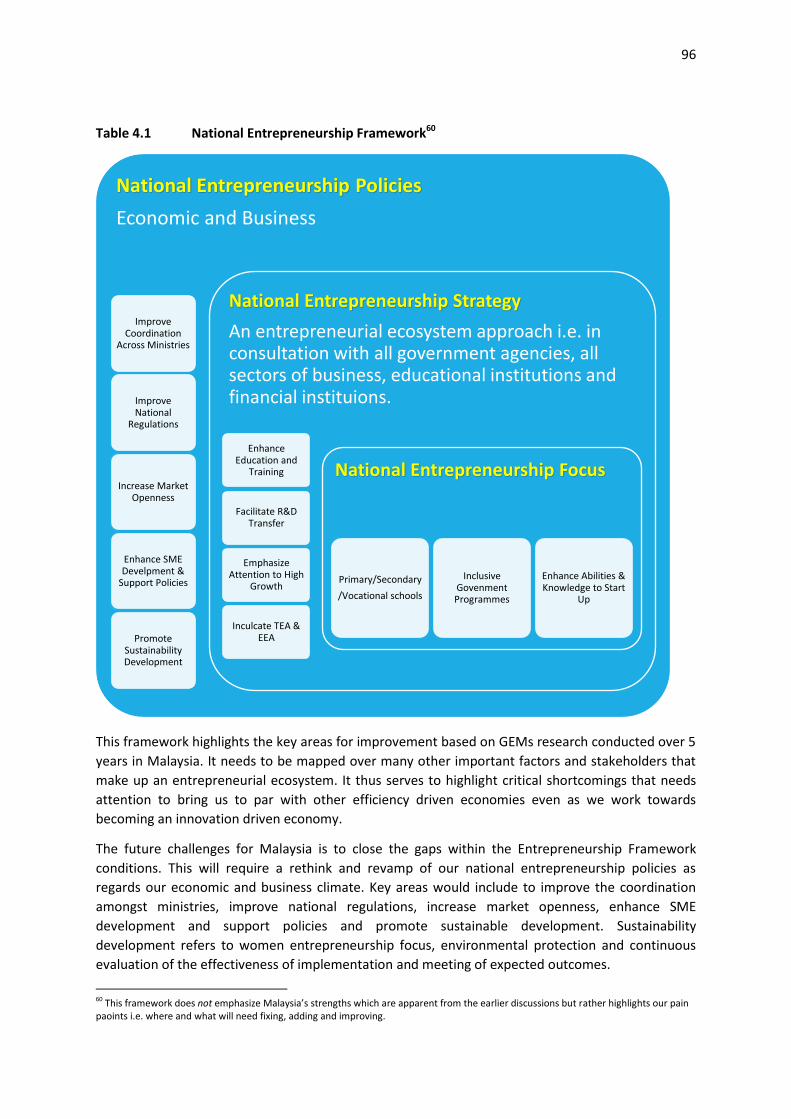
96
Table 4.1 National Entrepreneurship Framework60
This framework highlights the key areas for improvement based on GEMs research conducted over 5
years in Malaysia. It needs to be mapped over many other important factors and stakeholders that
make up an entrepreneurial ecosystem. It thus serves to highlight critical shortcomings that needs
attention to bring us to par with other efficiency driven economies even as we work towards
becoming an innovation driven economy.
The future challenges for Malaysia is to close the gaps within the Entrepreneurship Framework
conditions. This will require a rethink and revamp of our national entrepreneurship policies as
regards our economic and business climate. Key areas would include to improve the coordination
amongst ministries, improve national regulations, increase market openness, enhance SME
development and support policies and promote sustainable development. Sustainability
development refers to women entrepreneurship focus, environmental protection and continuous
evaluation of the effectiveness of implementation and meeting of expected outcomes.
60 This framework does not emphasize Malaysia’s strengths which are apparent from the earlier discussions but rather highlights our pain paoints i.e. where and what will need fixing, adding and improving.
National Entrepreneurship Policies
Economic and Business
Improve Coordination
Across Ministries
Improve National
Regulations
Increase Market Openness
Enhance SME Develpment &
Support Policies
Promote Sustainability Development
National Entrepreneurship Strategy
An entrepreneurial ecosystem approach i.e. in consultation with all government agencies, all sectors of business, educational institutions and financial instituions.
Enhance Education and
Training
Facilitate R&D Transfer
Emphasize Attention to High
Growth
Inculcate TEA & EEA
National Entrepreneurship Focus
Primary/Secondary
/Vocational schools
Inclusive Govenment Programmes
Enhance Abilities & Knowledge to Start
Up
97
A key subset of that will be to have a national entrepreneurship strategy. A strategy that spearheads
the enhancement of education and training, facilitates R&D transfer, emphasizes attention to high
growth business and inculcates Total Early Stage Entrepreneurial Activity (TEA) and Entrepreneurial
Employee Activity (EEA) as benchmarks for measurement. A further subset (within the national
entrepreneurship strategy) for Malaysia's national entrepreneurship focus will be to include
entrepreneurship education within primary, secondary and vocational schools, to have more
inclusive government programs involving and lead by the private sector and to enhance the abilities
and skills for start-ups.
Even though it is a long-term goal, we need to establish a culture that values entrepreneurship,
encourages and supports potential high growth entrepreneurs and help them overcome the fears of
an uncertain future. It will be worthwhile as these efforts will make entrepreneurship and sustaining
innovation key pillars of growth for Malaysia.
98
References
Abendroth, A. and den Dulk, L. (2011). Support for the work-life balance in Europe: The impact of
state, workplace and family support on work-life balance satisfaction. Work, Employment and
Society, 25(2), 234-256.
Acs, Z. J. (2006). How is entrepreneurship good for economic growth? Innovations, 1(1), 97-107.
Audretsch (2007). Entrepreneurship Capital and Economic Growth. Oxford Review of Economic
Policy, 23(1), , 63-78.
Acs, Z. and Szerb, L. (2011). Global Entrepreneurship and Development Index 2011. Cheltenham, UK:
Edward Elgar Publishing.
Ajayi-Obe, O. and Parker, S.C. (2005). The changing nature of work among self-employed in the
1990s: Evidence in Britain. Journal of Labor Research, 26(3), 501-517.
Angner, E. (2010). Subjective well-being. Journal of Socio-Economics, 39, 361–368.
Benz, M. and Frey, B. S. (2004). Being independent raises happiness at work. Swedish Economic
Policy Review, 11(2), 95–134.
Blanchflower, D. G. (2004). Self-employment: More may not be better. National Bureau of Economic
Research.
Blustein, D.L. (2008). The role of work in psychological health and wellbeing. American Psychologist,
63, 228-240.
Bosma, N.S. and Levie, J. (2010). Global Entrepreneurship Monitor, 2009 Executive Report. Babson
Park, MA, U.S.: Babson College; Santiago, Chile: Universidad del Desarrollo; Reykjavík, Iceland:
Háskólinn Reykjavík University; and London, U.K.: Global Entrepreneurship Research Association.
Bosma, N.S. and Schutjens, V. (2011). Understanding regional variation in entrepreneurial activity
and entrepreneurial attitude in Europe. The Annals of Regional Science, 47 (3), 711-742.
Bosma, N., Coduras, A., Yana Litovsky, Y., and Seaman, J. (2012), GEM Manual: A report on the
design, data and quality control of the Global Entrepreneurship Monitor
Bosma, N.S., Acs, Z., Autio, E., Coduras, A. and Levie, J. (2009). Global Entrepreneurship Monitor 2008
Executive Report. London Business School, London, UK, Universidad del Desarrollo, Santiago, Chile,
and Babson College, Wellesley, MA, US.
Bosma, N., Wennekers, S. and Amorós, J.E. (2012) Global Entrepreneurship Monitor 2011 Extended
Report. Babson College, Universidad del Desarrollo, Universiti Tun Abdul Razak: Wellesley MA,
Santiago Chile, Kuala Lumpur, Malaysia.
Bosma, N. (2013) "The Global Entrepreneurship Monitor (GEM) and Its Impact on Entrepreneurship
Research", Foundations and Trends® in Entrepreneurship, 9 (2), 143-248.
Block, J. and Koellinger, P. (2009). I can't get no satisfaction—Necessity entrepreneurship and
procedural utility. Kyklos, 62(2), 191- 20.
Brown, C. and Thornton, M., 2013, How Entrepreneurship Theory Created Economics, The Quarterly
Journal of Austrian Economics, Vol. 16, No. 4, 401–420.
99
Carree, M.A. and Thurik, A.R. (2003). The impact of entrepreneurship on economic growth, in: Z.J.
Acs and D.B. Audretsch (eds.), Handbook of Entrepreneurship Research. Boston: Kluwer Academic
Publishers, 437-471.
Carree, M. and Verheul, I. (2012). What makes entrepreneurs happy? Determinants of satisfaction
among founders. Journal of Happiness Studies, 13(2), 371–387.
Cooper, A.C. and Artz, K.W., 1995. Determinants of satisfaction of entrepreneurs. J. Bus. Venturing,
10 (6), 439–455.
Department of Statistics, Malaysia, http://www.statistics.gov.my/, Retrieved 10th April, 2014.
Diener, E. (1984). Subjective well-being. Psychological Bulletin, 95, 542–575.
Helliwell, J. F., Layard, R. and Sachs, J. (Eds.). (2013). World Happiness Report. New York: UN
Sustainable Development Solutions Network.
Henrekson, M. and Tino Sanandaji, T., 2013, Small business activity does not measure
entrepreneurship, Research Institute of Industrial Economics, SE-102 15 Stockholm, Sweden, Edited*
by William J. Baumol, New York University, New York, NY, and approved December 19, 2013.
Kelley, D., Bosma, N. and Amorós, J. E. (2011). Global Entrepreneurship Monitor, 2010 Global Report.
Babson Park MA, Santiago, Chile: Babson College, Universidad del Desarrollo.
Lange, T. (2012). Job satisfaction and self-employment: Autonomy or personality. Small Business
Economics, 38(2), 165–177.
Levie, J. and Autio, E. (2008). A theoretical grounding and test of the GEM model. Small Business
Economics, 31(3), 235-263.
Moskowitz, T. J. and Vissing-Jorgensen, A. (2002). The Returns to Entrepreneurial Investment: A
Private Equity Premium Puzzle? American Economic Review, 92, 745-79.
OECD. 2009. The impact of the global crisis on SME and entrepreneurship financing and policy
responses. OECD: Paris.
Pavot, W., and Diener, E. (2008). The Satisfaction with Life Scale and the emerging construct of life
satisfaction. Journal of Positive Psychology, 3, 137–152.
Porter, M.E., Sachs, J.J., and McArthur, J. (2002). Executive Summary: Competitiveness and Stages of
Economic Development. In The Global Competitiveness Report 2001–2002, edited by M.E. Porter, J.J.
Sachs, P.K. Cornelius, J.W. McArthur and K. Schwab, 16–25. New York, NY: Oxford University Press.
Reynolds, P., Bosma, N., Autio, E., Hunt, S., De Bono, N., Servais, I.,Lopez-Garcia, P., and Chin, N.
(2005). Global Entrepreneurship Monitor: Data Collection Design and Implementation 1998–2003.
Small Business Economics, 24 (3), 205–31.
Reynolds, P., Hay, M. and Camp, S. (1999). Global Entrepreneurship Monitor: 1999 Executive Report.
Kansas City, MO.: Kauffman Foundation.
Shane, S. (2009). Why encouraging more people to become entrepreneurs is bad public policy, Small
Business Economics, 33, 141-149.
Schwab, K. (Ed.) (1997). The Global Competitiveness Report 2013-2014. Geneva, Switzerland: World
Economic Forum.
100
Schumpeter, Joseph (1942). Capitalism, Socialism and Democracy. New York: Harper and Roe
Publishers.
Schumpeter, The Economist, 2014 http://www.economist.com/blogs/schumpeter/2014/02/our-
schumpeter-columnist, retrieved February 01, 2014.
Spreitzer, G. M., Kizilos, M. A., and Nason, S. W. (1997). A dimensional analysis of the relationship
between psychological empowerment and effectiveness satisfaction, and strain. Journal of
Management, 23(5), 679-704.
Stam, E., Bosma, N., Van Witteloostuijn, A., De Jong, J., Bogaert, S., Edwards, N. and Jaspers, F.
(2012). Ambitious Entrepreneurship. A review of the academic literature and new directions for
public policy. AWT Report. 41. The Hague: AWT.
Stiglitz, J.E., Sen, A., and Fitoussi, J.P. (2009). Report by the Commission on the Measurement of
Economic Performance and Social Progress. Available at http://www.stiglitz-sen-
fitoussi.fr/en/index.htm.
Taylor, M. (2004). Self-employment in Britain: When, who and why? Swedish Economic Policy
Review, 11(2), 139–173.
Valcour, M. (2007). Work-based resources as moderators of the relationship between work hours
and satisfaction with work-family balance. Journal of Applied Psychology, 92(6), 1512.
Wennekers, S., Van Stel, A., Carree, M., and Thurik, A.R. (2010). The relationship between
entrepreneurship and economic development: Is it U-shaped? Foundations and Trends in
Entrepreneurship, 6(3), 167-237.
Wong, P. K., Ho, Y. P., & Autio, E. (2005). Entrepreneurship, innovation and economic growth:
Evidence from GEM data. Small Business Economics, 24(3), 335-350.
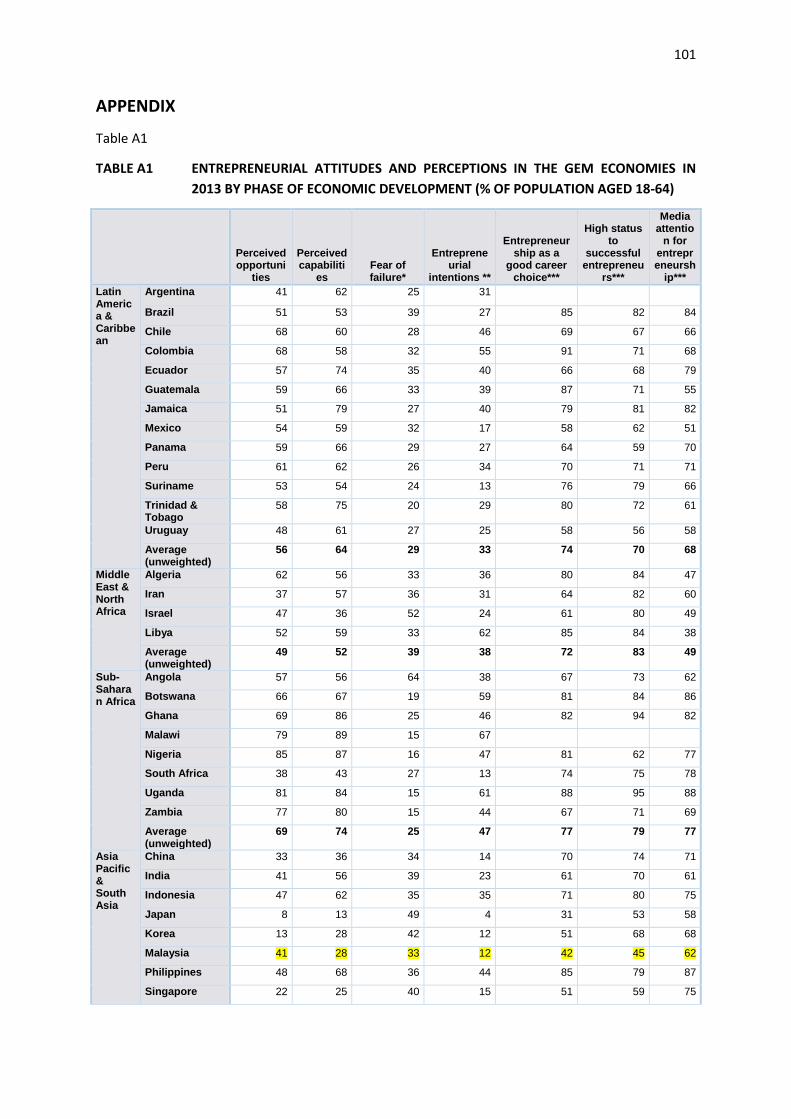
101
APPENDIX
Table A1
TABLE A1 ENTREPRENEURIAL ATTITUDES AND PERCEPTIONS IN THE GEM ECONOMIES IN
2013 BY PHASE OF ECONOMIC DEVELOPMENT (% OF POPULATION AGED 18-64)
Perceived opportuni
ties
Perceived capabiliti
es Fear of failure*
Entrepreneurial
intentions **
Entrepreneurship as a
good career choice***
High status to
successful entrepreneu
rs***
Media attentio
n for entrepreneursh
ip***
Latin America & Caribbean
Argentina 41 62 25 31
Brazil 51 53 39 27 85 82 84
Chile 68 60 28 46 69 67 66
Colombia 68 58 32 55 91 71 68
Ecuador 57 74 35 40 66 68 79
Guatemala 59 66 33 39 87 71 55
Jamaica 51 79 27 40 79 81 82
Mexico 54 59 32 17 58 62 51
Panama 59 66 29 27 64 59 70
Peru 61 62 26 34 70 71 71
Suriname 53 54 24 13 76 79 66
Trinidad & Tobago
58 75 20 29 80 72 61
Uruguay 48 61 27 25 58 56 58
Average (unweighted)
56 64 29 33 74 70 68
Middle East & North Africa
Algeria 62 56 33 36 80 84 47
Iran 37 57 36 31 64 82 60
Israel 47 36 52 24 61 80 49
Libya 52 59 33 62 85 84 38
Average (unweighted)
49 52 39 38 72 83 49
Sub-Saharan Africa
Angola 57 56 64 38 67 73 62
Botswana 66 67 19 59 81 84 86
Ghana 69 86 25 46 82 94 82
Malawi 79 89 15 67
Nigeria 85 87 16 47 81 62 77
South Africa 38 43 27 13 74 75 78
Uganda 81 84 15 61 88 95 88
Zambia 77 80 15 44 67 71 69
Average (unweighted)
69 74 25 47 77 79 77
Asia Pacific & South Asia
China 33 36 34 14 70 74 71
India 41 56 39 23 61 70 61
Indonesia 47 62 35 35 71 80 75
Japan 8 13 49 4 31 53 58
Korea 13 28 42 12 51 68 68
Malaysia 41 28 33 12 42 45 62
Philippines 48 68 36 44 85 79 87
Singapore 22 25 40 15 51 59 75
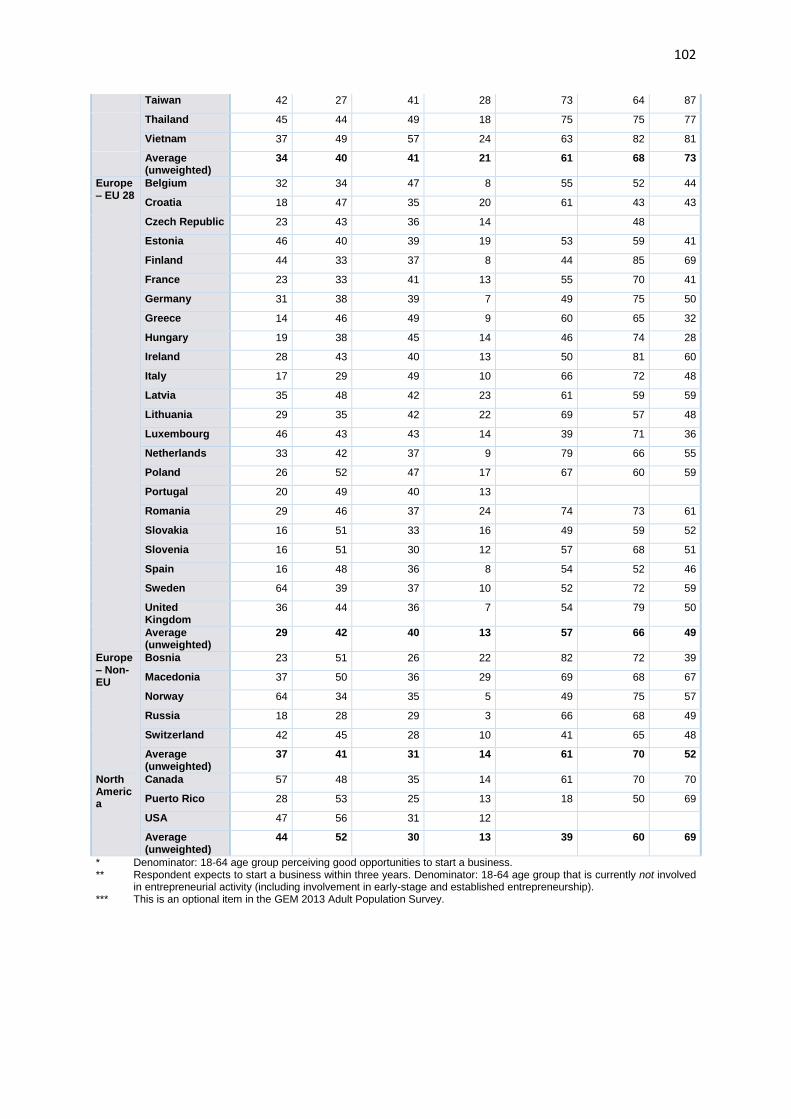
102
Taiwan 42 27 41 28 73 64 87
Thailand 45 44 49 18 75 75 77
Vietnam 37 49 57 24 63 82 81
Average (unweighted)
34 40 41 21 61 68 73
Europe – EU 28
Belgium 32 34 47 8 55 52 44
Croatia 18 47 35 20 61 43 43
Czech Republic 23 43 36 14 48
Estonia 46 40 39 19 53 59 41
Finland 44 33 37 8 44 85 69
France 23 33 41 13 55 70 41
Germany 31 38 39 7 49 75 50
Greece 14 46 49 9 60 65 32
Hungary 19 38 45 14 46 74 28
Ireland 28 43 40 13 50 81 60
Italy 17 29 49 10 66 72 48
Latvia 35 48 42 23 61 59 59
Lithuania 29 35 42 22 69 57 48
Luxembourg 46 43 43 14 39 71 36
Netherlands 33 42 37 9 79 66 55
Poland 26 52 47 17 67 60 59
Portugal 20 49 40 13
Romania 29 46 37 24 74 73 61
Slovakia 16 51 33 16 49 59 52
Slovenia 16 51 30 12 57 68 51
Spain 16 48 36 8 54 52 46
Sweden 64 39 37 10 52 72 59
United Kingdom
36 44 36 7 54 79 50
Average (unweighted)
29 42 40 13 57 66 49
Europe – Non-EU
Bosnia 23 51 26 22 82 72 39
Macedonia 37 50 36 29 69 68 67
Norway 64 34 35 5 49 75 57
Russia 18 28 29 3 66 68 49
Switzerland 42 45 28 10 41 65 48
Average (unweighted)
37 41 31 14 61 70 52
North America
Canada 57 48 35 14 61 70 70
Puerto Rico 28 53 25 13 18 50 69
USA 47 56 31 12
Average (unweighted)
44 52 30 13 39 60 69
* Denominator: 18-64 age group perceiving good opportunities to start a business. ** Respondent expects to start a business within three years. Denominator: 18-64 age group that is currently not involved
in entrepreneurial activity (including involvement in early-stage and established entrepreneurship). *** This is an optional item in the GEM 2013 Adult Population Survey.
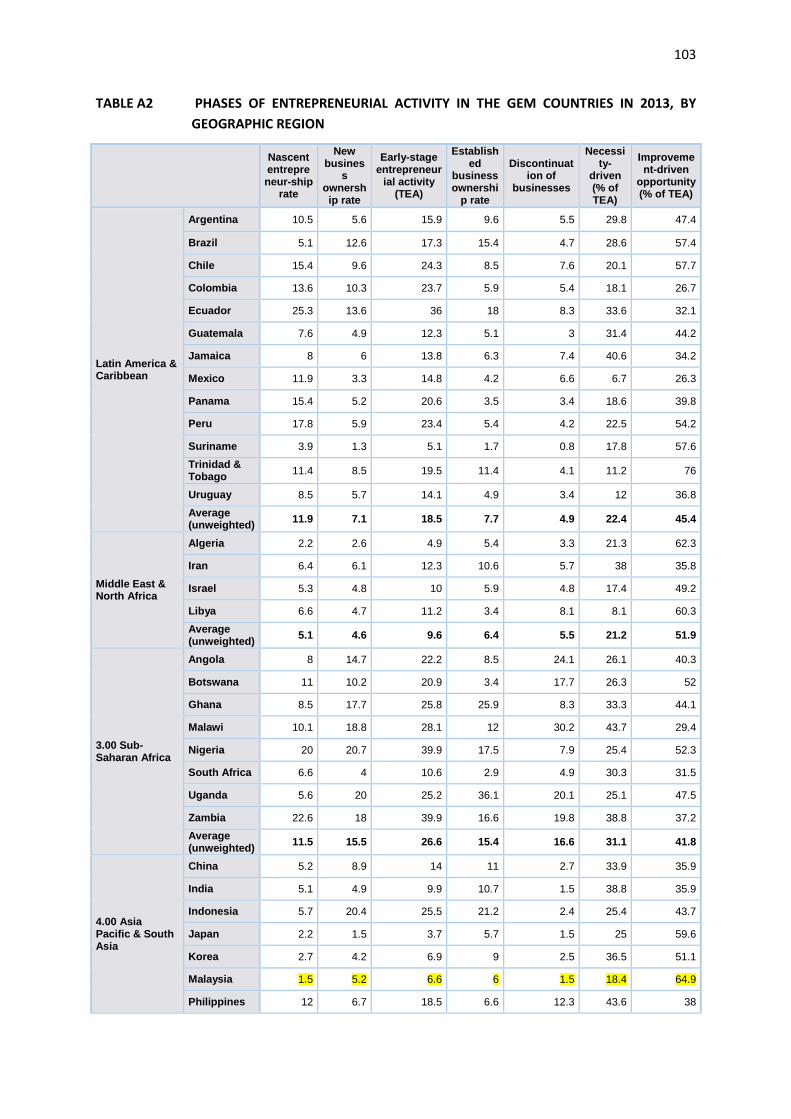
103
TABLE A2 PHASES OF ENTREPRENEURIAL ACTIVITY IN THE GEM COUNTRIES IN 2013, BY
GEOGRAPHIC REGION
Nascent entrepreneur-ship
rate
New busines
s ownership rate
Early-stage entrepreneur
ial activity (TEA)
Established
business ownershi
p rate
Discontinuation of
businesses
Necessity-
driven (% of TEA)
Improvement-driven
opportunity (% of TEA)
Latin America & Caribbean
Argentina 10.5 5.6 15.9 9.6 5.5 29.8 47.4
Brazil 5.1 12.6 17.3 15.4 4.7 28.6 57.4
Chile 15.4 9.6 24.3 8.5 7.6 20.1 57.7
Colombia 13.6 10.3 23.7 5.9 5.4 18.1 26.7
Ecuador 25.3 13.6 36 18 8.3 33.6 32.1
Guatemala 7.6 4.9 12.3 5.1 3 31.4 44.2
Jamaica 8 6 13.8 6.3 7.4 40.6 34.2
Mexico 11.9 3.3 14.8 4.2 6.6 6.7 26.3
Panama 15.4 5.2 20.6 3.5 3.4 18.6 39.8
Peru 17.8 5.9 23.4 5.4 4.2 22.5 54.2
Suriname 3.9 1.3 5.1 1.7 0.8 17.8 57.6
Trinidad & Tobago
11.4 8.5 19.5 11.4 4.1 11.2 76
Uruguay 8.5 5.7 14.1 4.9 3.4 12 36.8
Average (unweighted)
11.9 7.1 18.5 7.7 4.9 22.4 45.4
Middle East & North Africa
Algeria 2.2 2.6 4.9 5.4 3.3 21.3 62.3
Iran 6.4 6.1 12.3 10.6 5.7 38 35.8
Israel 5.3 4.8 10 5.9 4.8 17.4 49.2
Libya 6.6 4.7 11.2 3.4 8.1 8.1 60.3
Average (unweighted)
5.1 4.6 9.6 6.4 5.5 21.2 51.9
3.00 Sub-Saharan Africa
Angola 8 14.7 22.2 8.5 24.1 26.1 40.3
Botswana 11 10.2 20.9 3.4 17.7 26.3 52
Ghana 8.5 17.7 25.8 25.9 8.3 33.3 44.1
Malawi 10.1 18.8 28.1 12 30.2 43.7 29.4
Nigeria 20 20.7 39.9 17.5 7.9 25.4 52.3
South Africa 6.6 4 10.6 2.9 4.9 30.3 31.5
Uganda 5.6 20 25.2 36.1 20.1 25.1 47.5
Zambia 22.6 18 39.9 16.6 19.8 38.8 37.2
Average (unweighted)
11.5 15.5 26.6 15.4 16.6 31.1 41.8
4.00 Asia Pacific & South Asia
China 5.2 8.9 14 11 2.7 33.9 35.9
India 5.1 4.9 9.9 10.7 1.5 38.8 35.9
Indonesia 5.7 20.4 25.5 21.2 2.4 25.4 43.7
Japan 2.2 1.5 3.7 5.7 1.5 25 59.6
Korea 2.7 4.2 6.9 9 2.5 36.5 51.1
Malaysia 1.5 5.2 6.6 6 1.5 18.4 64.9
Philippines 12 6.7 18.5 6.6 12.3 43.6 38
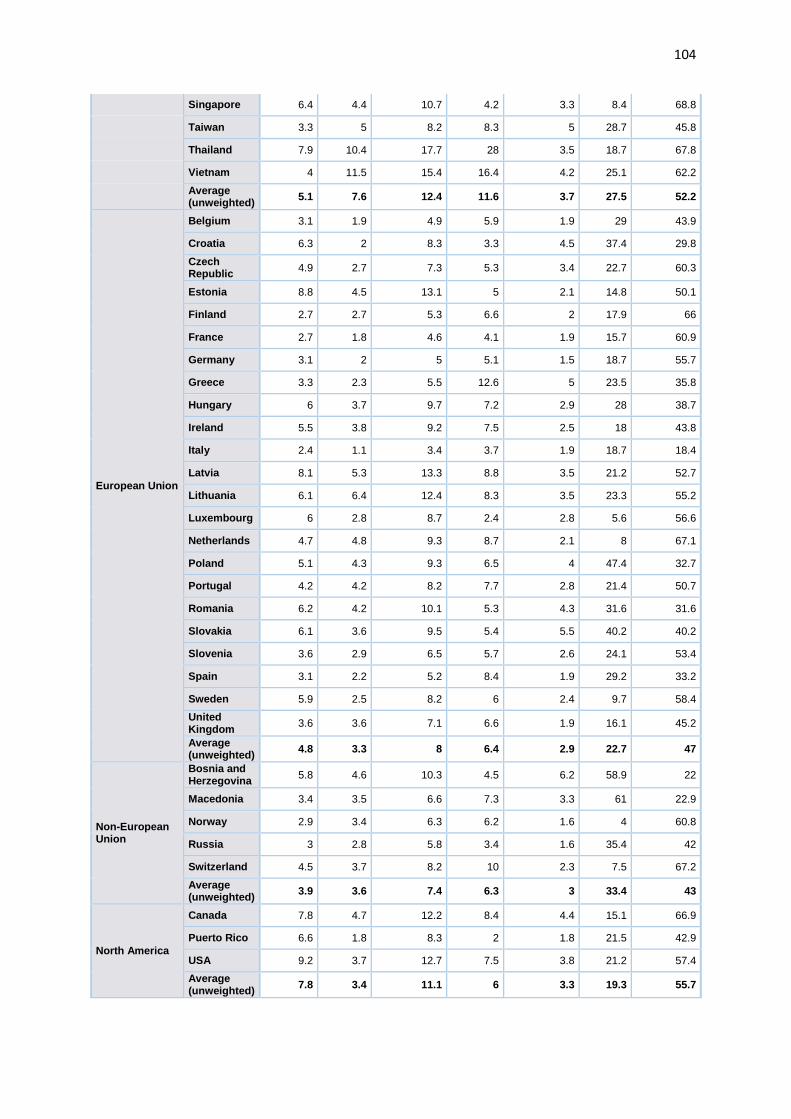
104
Singapore 6.4 4.4 10.7 4.2 3.3 8.4 68.8
Taiwan 3.3 5 8.2 8.3 5 28.7 45.8
Thailand 7.9 10.4 17.7 28 3.5 18.7 67.8
Vietnam 4 11.5 15.4 16.4 4.2 25.1 62.2
Average (unweighted)
5.1 7.6 12.4 11.6 3.7 27.5 52.2
European Union
Belgium 3.1 1.9 4.9 5.9 1.9 29 43.9
Croatia 6.3 2 8.3 3.3 4.5 37.4 29.8
Czech Republic
4.9 2.7 7.3 5.3 3.4 22.7 60.3
Estonia 8.8 4.5 13.1 5 2.1 14.8 50.1
Finland 2.7 2.7 5.3 6.6 2 17.9 66
France 2.7 1.8 4.6 4.1 1.9 15.7 60.9
Germany 3.1 2 5 5.1 1.5 18.7 55.7
Greece 3.3 2.3 5.5 12.6 5 23.5 35.8
Hungary 6 3.7 9.7 7.2 2.9 28 38.7
Ireland 5.5 3.8 9.2 7.5 2.5 18 43.8
Italy 2.4 1.1 3.4 3.7 1.9 18.7 18.4
Latvia 8.1 5.3 13.3 8.8 3.5 21.2 52.7
Lithuania 6.1 6.4 12.4 8.3 3.5 23.3 55.2
Luxembourg 6 2.8 8.7 2.4 2.8 5.6 56.6
Netherlands 4.7 4.8 9.3 8.7 2.1 8 67.1
Poland 5.1 4.3 9.3 6.5 4 47.4 32.7
Portugal 4.2 4.2 8.2 7.7 2.8 21.4 50.7
Romania 6.2 4.2 10.1 5.3 4.3 31.6 31.6
Slovakia 6.1 3.6 9.5 5.4 5.5 40.2 40.2
Slovenia 3.6 2.9 6.5 5.7 2.6 24.1 53.4
Spain 3.1 2.2 5.2 8.4 1.9 29.2 33.2
Sweden 5.9 2.5 8.2 6 2.4 9.7 58.4
United Kingdom
3.6 3.6 7.1 6.6 1.9 16.1 45.2
Average (unweighted)
4.8 3.3 8 6.4 2.9 22.7 47
Non-European Union
Bosnia and Herzegovina
5.8 4.6 10.3 4.5 6.2 58.9 22
Macedonia 3.4 3.5 6.6 7.3 3.3 61 22.9
Norway 2.9 3.4 6.3 6.2 1.6 4 60.8
Russia 3 2.8 5.8 3.4 1.6 35.4 42
Switzerland 4.5 3.7 8.2 10 2.3 7.5 67.2
Average (unweighted)
3.9 3.6 7.4 6.3 3 33.4 43
North America
Canada 7.8 4.7 12.2 8.4 4.4 15.1 66.9
Puerto Rico 6.6 1.8 8.3 2 1.8 21.5 42.9
USA 9.2 3.7 12.7 7.5 3.8 21.2 57.4
Average (unweighted)
7.8 3.4 11.1 6 3.3 19.3 55.7

105
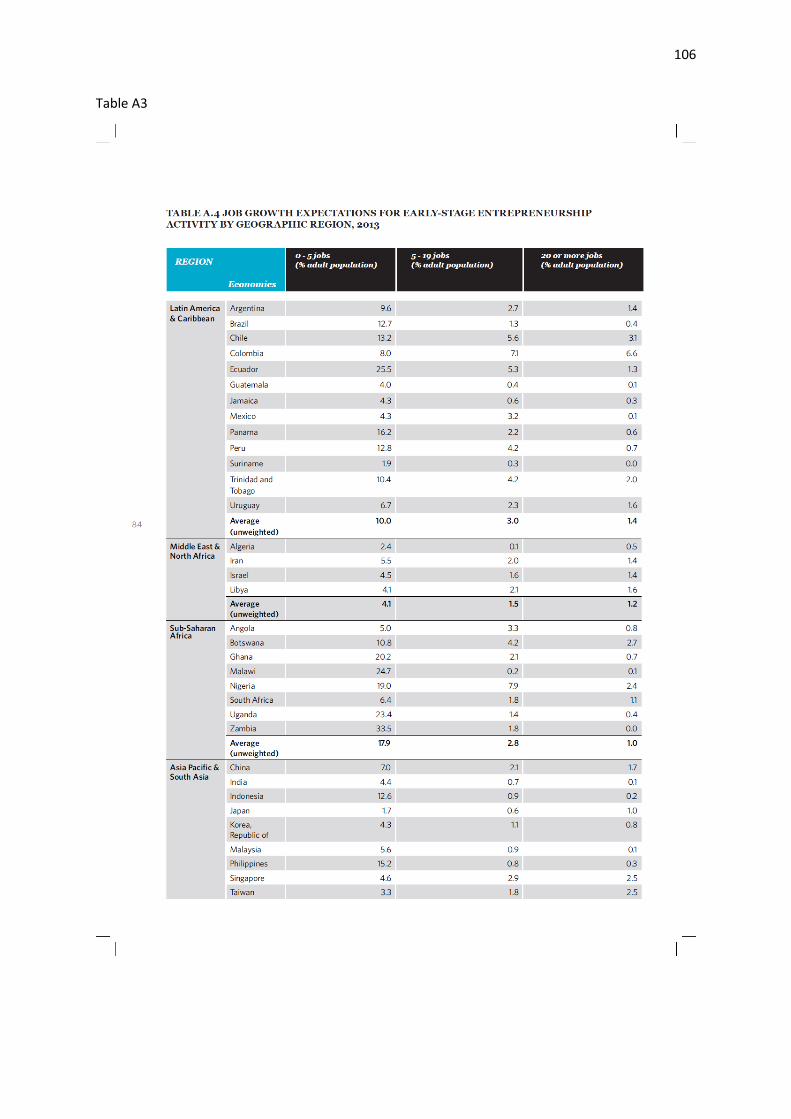
106
Table A3
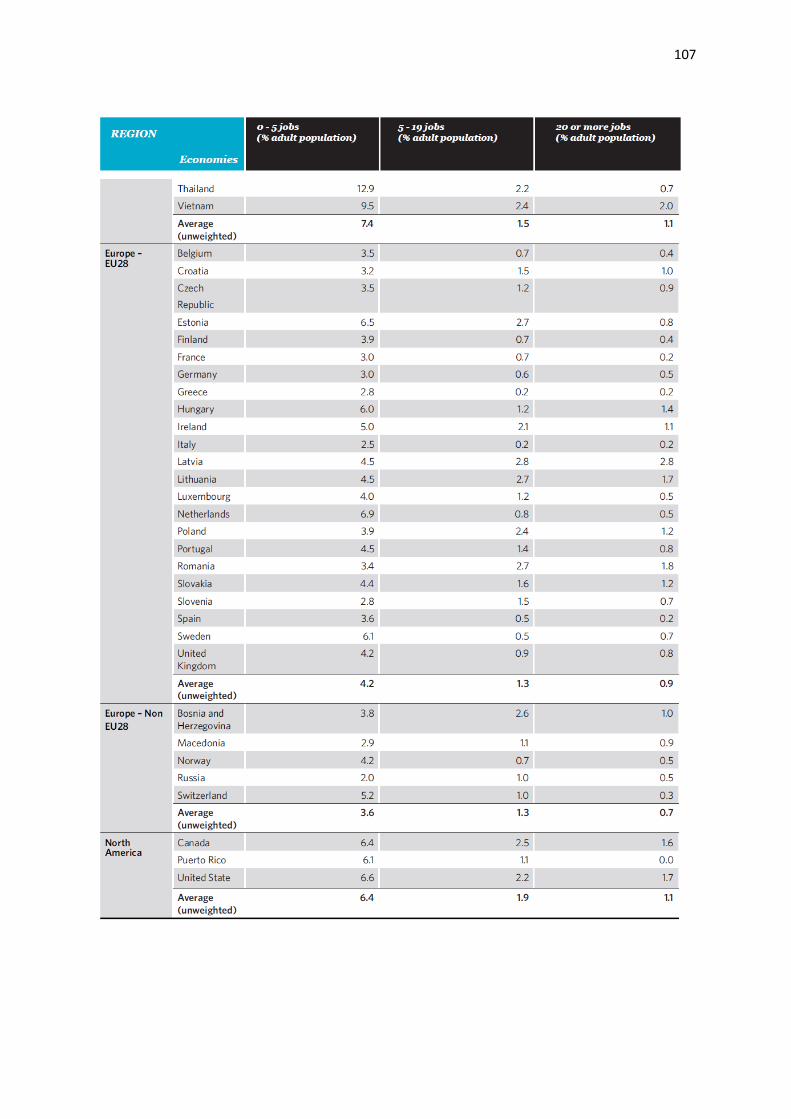
107
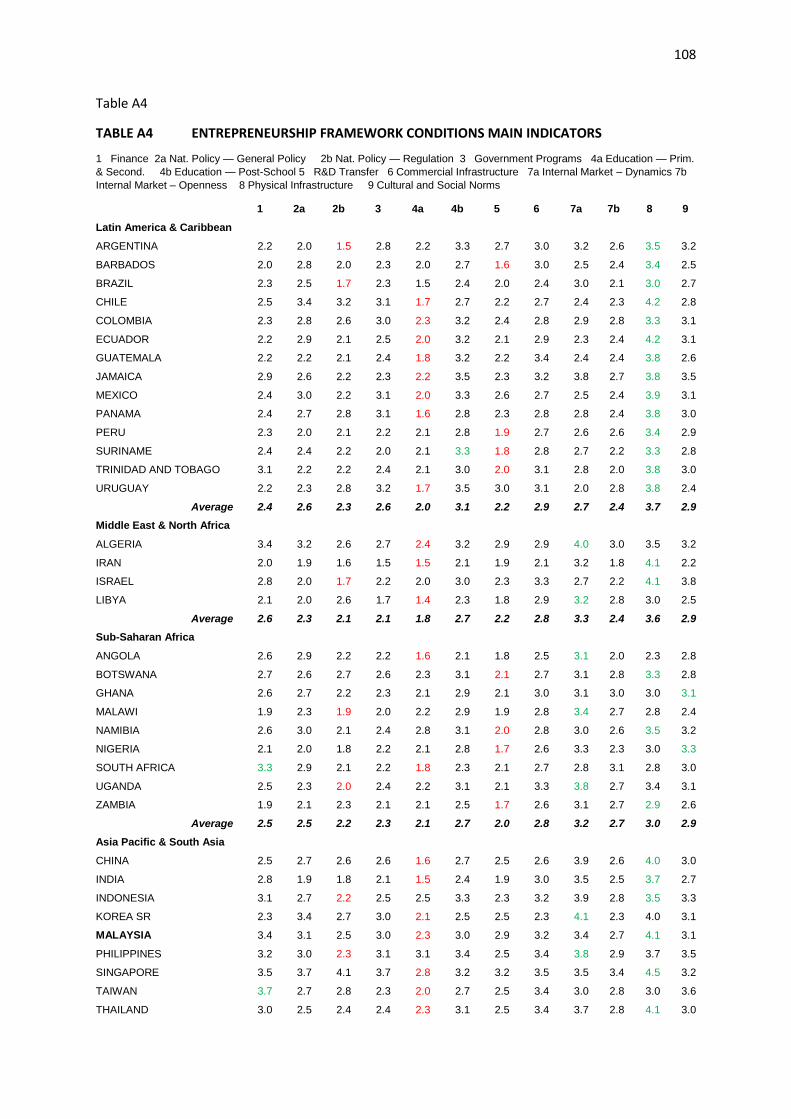
108
Table A4
TABLE A4 ENTREPRENEURSHIP FRAMEWORK CONDITIONS MAIN INDICATORS
1 Finance 2a Nat. Policy — General Policy 2b Nat. Policy — Regulation 3 Government Programs 4a Education — Prim.
& Second. 4b Education — Post-School 5 R&D Transfer 6 Commercial Infrastructure 7a Internal Market – Dynamics 7b
Internal Market – Openness 8 Physical Infrastructure 9 Cultural and Social Norms
1 2a 2b 3 4a 4b 5 6 7a 7b 8 9
Latin America & Caribbean
ARGENTINA 2.2 2.0 1.5 2.8 2.2 3.3 2.7 3.0 3.2 2.6 3.5 3.2
BARBADOS 2.0 2.8 2.0 2.3 2.0 2.7 1.6 3.0 2.5 2.4 3.4 2.5
BRAZIL 2.3 2.5 1.7 2.3 1.5 2.4 2.0 2.4 3.0 2.1 3.0 2.7
CHILE 2.5 3.4 3.2 3.1 1.7 2.7 2.2 2.7 2.4 2.3 4.2 2.8
COLOMBIA 2.3 2.8 2.6 3.0 2.3 3.2 2.4 2.8 2.9 2.8 3.3 3.1
ECUADOR 2.2 2.9 2.1 2.5 2.0 3.2 2.1 2.9 2.3 2.4 4.2 3.1
GUATEMALA 2.2 2.2 2.1 2.4 1.8 3.2 2.2 3.4 2.4 2.4 3.8 2.6
JAMAICA 2.9 2.6 2.2 2.3 2.2 3.5 2.3 3.2 3.8 2.7 3.8 3.5
MEXICO 2.4 3.0 2.2 3.1 2.0 3.3 2.6 2.7 2.5 2.4 3.9 3.1
PANAMA 2.4 2.7 2.8 3.1 1.6 2.8 2.3 2.8 2.8 2.4 3.8 3.0
PERU 2.3 2.0 2.1 2.2 2.1 2.8 1.9 2.7 2.6 2.6 3.4 2.9
SURINAME 2.4 2.4 2.2 2.0 2.1 3.3 1.8 2.8 2.7 2.2 3.3 2.8
TRINIDAD AND TOBAGO 3.1 2.2 2.2 2.4 2.1 3.0 2.0 3.1 2.8 2.0 3.8 3.0
URUGUAY 2.2 2.3 2.8 3.2 1.7 3.5 3.0 3.1 2.0 2.8 3.8 2.4
Average 2.4 2.6 2.3 2.6 2.0 3.1 2.2 2.9 2.7 2.4 3.7 2.9
Middle East & North Africa
ALGERIA 3.4 3.2 2.6 2.7 2.4 3.2 2.9 2.9 4.0 3.0 3.5 3.2
IRAN 2.0 1.9 1.6 1.5 1.5 2.1 1.9 2.1 3.2 1.8 4.1 2.2
ISRAEL 2.8 2.0 1.7 2.2 2.0 3.0 2.3 3.3 2.7 2.2 4.1 3.8
LIBYA 2.1 2.0 2.6 1.7 1.4 2.3 1.8 2.9 3.2 2.8 3.0 2.5
Average 2.6 2.3 2.1 2.1 1.8 2.7 2.2 2.8 3.3 2.4 3.6 2.9
Sub-Saharan Africa
ANGOLA 2.6 2.9 2.2 2.2 1.6 2.1 1.8 2.5 3.1 2.0 2.3 2.8
BOTSWANA 2.7 2.6 2.7 2.6 2.3 3.1 2.1 2.7 3.1 2.8 3.3 2.8
GHANA 2.6 2.7 2.2 2.3 2.1 2.9 2.1 3.0 3.1 3.0 3.0 3.1
MALAWI 1.9 2.3 1.9 2.0 2.2 2.9 1.9 2.8 3.4 2.7 2.8 2.4
NAMIBIA 2.6 3.0 2.1 2.4 2.8 3.1 2.0 2.8 3.0 2.6 3.5 3.2
NIGERIA 2.1 2.0 1.8 2.2 2.1 2.8 1.7 2.6 3.3 2.3 3.0 3.3
SOUTH AFRICA 3.3 2.9 2.1 2.2 1.8 2.3 2.1 2.7 2.8 3.1 2.8 3.0
UGANDA 2.5 2.3 2.0 2.4 2.2 3.1 2.1 3.3 3.8 2.7 3.4 3.1
ZAMBIA 1.9 2.1 2.3 2.1 2.1 2.5 1.7 2.6 3.1 2.7 2.9 2.6
Average 2.5 2.5 2.2 2.3 2.1 2.7 2.0 2.8 3.2 2.7 3.0 2.9
Asia Pacific & South Asia
CHINA 2.5 2.7 2.6 2.6 1.6 2.7 2.5 2.6 3.9 2.6 4.0 3.0
INDIA 2.8 1.9 1.8 2.1 1.5 2.4 1.9 3.0 3.5 2.5 3.7 2.7
INDONESIA 3.1 2.7 2.2 2.5 2.5 3.3 2.3 3.2 3.9 2.8 3.5 3.3
KOREA SR 2.3 3.4 2.7 3.0 2.1 2.5 2.5 2.3 4.1 2.3 4.0 3.1
MALAYSIA 3.4 3.1 2.5 3.0 2.3 3.0 2.9 3.2 3.4 2.7 4.1 3.1
PHILIPPINES 3.2 3.0 2.3 3.1 3.1 3.4 2.5 3.4 3.8 2.9 3.7 3.5
SINGAPORE 3.5 3.7 4.1 3.7 2.8 3.2 3.2 3.5 3.5 3.4 4.5 3.2
TAIWAN 3.7 2.7 2.8 2.3 2.0 2.7 2.5 3.4 3.0 2.8 3.0 3.6
THAILAND 3.0 2.5 2.4 2.4 2.3 3.1 2.5 3.4 3.7 2.8 4.1 3.0
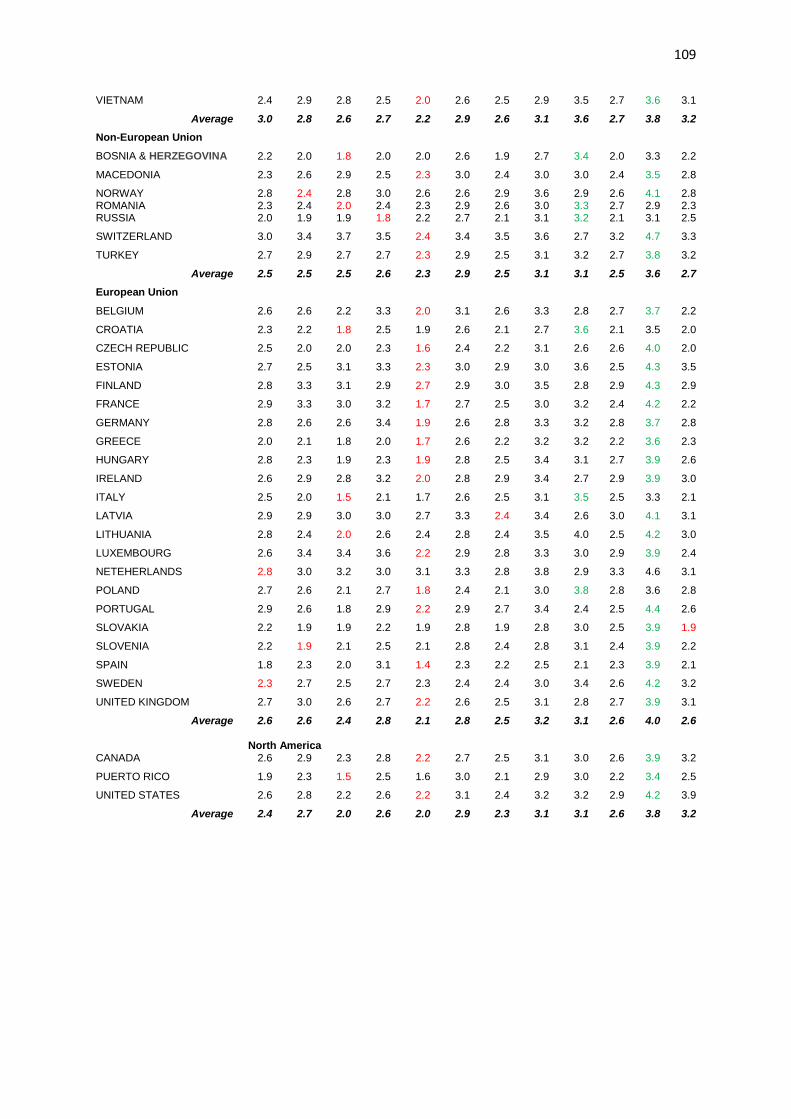
109
VIETNAM 2.4 2.9 2.8 2.5 2.0 2.6 2.5 2.9 3.5 2.7 3.6 3.1
Average 3.0 2.8 2.6 2.7 2.2 2.9 2.6 3.1 3.6 2.7 3.8 3.2
Non-European Union
BOSNIA & HERZEGOVINA 2.2 2.0 1.8 2.0 2.0 2.6 1.9 2.7 3.4 2.0 3.3 2.2
MACEDONIA 2.3 2.6 2.9 2.5 2.3 3.0 2.4 3.0 3.0 2.4 3.5 2.8
NORWAY 2.8 2.4 2.8 3.0 2.6 2.6 2.9 3.6 2.9 2.6 4.1 2.8 ROMANIA 2.3 2.4 2.0 2.4 2.3 2.9 2.6 3.0 3.3 2.7 2.9 2.3 RUSSIA 2.0 1.9 1.9 1.8 2.2 2.7 2.1 3.1 3.2 2.1 3.1 2.5
SWITZERLAND 3.0 3.4 3.7 3.5 2.4 3.4 3.5 3.6 2.7 3.2 4.7 3.3
TURKEY 2.7 2.9 2.7 2.7 2.3 2.9 2.5 3.1 3.2 2.7 3.8 3.2
Average 2.5 2.5 2.5 2.6 2.3 2.9 2.5 3.1 3.1 2.5 3.6 2.7
European Union
BELGIUM 2.6 2.6 2.2 3.3 2.0 3.1 2.6 3.3 2.8 2.7 3.7 2.2
CROATIA 2.3 2.2 1.8 2.5 1.9 2.6 2.1 2.7 3.6 2.1 3.5 2.0
CZECH REPUBLIC 2.5 2.0 2.0 2.3 1.6 2.4 2.2 3.1 2.6 2.6 4.0 2.0
ESTONIA 2.7 2.5 3.1 3.3 2.3 3.0 2.9 3.0 3.6 2.5 4.3 3.5
FINLAND 2.8 3.3 3.1 2.9 2.7 2.9 3.0 3.5 2.8 2.9 4.3 2.9
FRANCE 2.9 3.3 3.0 3.2 1.7 2.7 2.5 3.0 3.2 2.4 4.2 2.2
GERMANY 2.8 2.6 2.6 3.4 1.9 2.6 2.8 3.3 3.2 2.8 3.7 2.8
GREECE 2.0 2.1 1.8 2.0 1.7 2.6 2.2 3.2 3.2 2.2 3.6 2.3
HUNGARY 2.8 2.3 1.9 2.3 1.9 2.8 2.5 3.4 3.1 2.7 3.9 2.6
IRELAND 2.6 2.9 2.8 3.2 2.0 2.8 2.9 3.4 2.7 2.9 3.9 3.0
ITALY 2.5 2.0 1.5 2.1 1.7 2.6 2.5 3.1 3.5 2.5 3.3 2.1
LATVIA 2.9 2.9 3.0 3.0 2.7 3.3 2.4 3.4 2.6 3.0 4.1 3.1
LITHUANIA 2.8 2.4 2.0 2.6 2.4 2.8 2.4 3.5 4.0 2.5 4.2 3.0
LUXEMBOURG 2.6 3.4 3.4 3.6 2.2 2.9 2.8 3.3 3.0 2.9 3.9 2.4
NETEHERLANDS 2.8 3.0 3.2 3.0 3.1 3.3 2.8 3.8 2.9 3.3 4.6 3.1
POLAND 2.7 2.6 2.1 2.7 1.8 2.4 2.1 3.0 3.8 2.8 3.6 2.8
PORTUGAL 2.9 2.6 1.8 2.9 2.2 2.9 2.7 3.4 2.4 2.5 4.4 2.6
SLOVAKIA 2.2 1.9 1.9 2.2 1.9 2.8 1.9 2.8 3.0 2.5 3.9 1.9
SLOVENIA 2.2 1.9 2.1 2.5 2.1 2.8 2.4 2.8 3.1 2.4 3.9 2.2
SPAIN 1.8 2.3 2.0 3.1 1.4 2.3 2.2 2.5 2.1 2.3 3.9 2.1
SWEDEN 2.3 2.7 2.5 2.7 2.3 2.4 2.4 3.0 3.4 2.6 4.2 3.2
UNITED KINGDOM 2.7 3.0 2.6 2.7 2.2 2.6 2.5 3.1 2.8 2.7 3.9 3.1
Average 2.6 2.6 2.4 2.8 2.1 2.8 2.5 3.2 3.1 2.6 4.0 2.6
North America CANADA 2.6 2.9 2.3 2.8 2.2 2.7 2.5 3.1 3.0 2.6 3.9 3.2
PUERTO RICO 1.9 2.3 1.5 2.5 1.6 3.0 2.1 2.9 3.0 2.2 3.4 2.5
UNITED STATES 2.6 2.8 2.2 2.6 2.2 3.1 2.4 3.2 3.2 2.9 4.2 3.9
Average 2.4 2.7 2.0 2.6 2.0 2.9 2.3 3.1 3.1 2.6 3.8 3.2
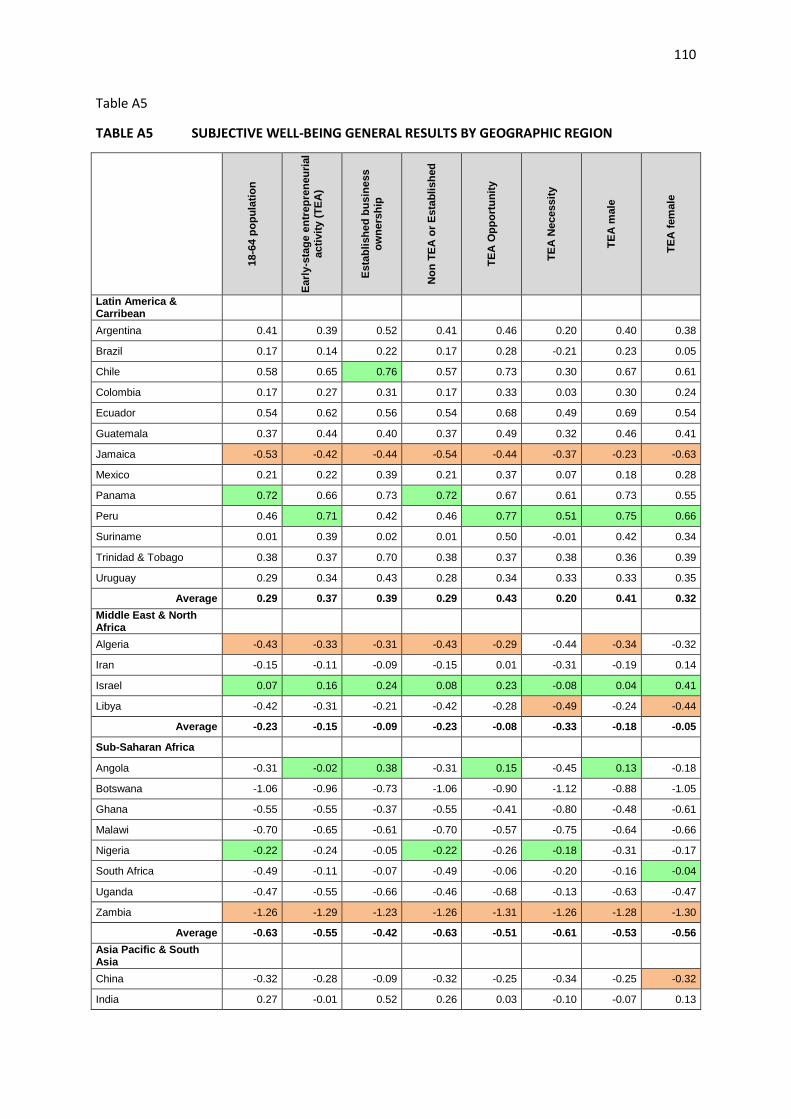
110
Table A5
TABLE A5 SUBJECTIVE WELL-BEING GENERAL RESULTS BY GEOGRAPHIC REGION
18-6
4 p
op
ula
tio
n
Earl
y-s
tag
e e
ntr
ep
ren
eu
rial
acti
vit
y (
TE
A)
Esta
bli
sh
ed
bu
sin
ess
ow
ners
hip
No
n T
EA
or
Esta
bli
sh
ed
TE
A O
pp
ort
un
ity
TE
A N
ecessit
y
TE
A m
ale
TE
A f
em
ale
Latin America & Carribean
Argentina 0.41 0.39 0.52 0.41 0.46 0.20 0.40 0.38
Brazil 0.17 0.14 0.22 0.17 0.28 -0.21 0.23 0.05
Chile 0.58 0.65 0.76 0.57 0.73 0.30 0.67 0.61
Colombia 0.17 0.27 0.31 0.17 0.33 0.03 0.30 0.24
Ecuador 0.54 0.62 0.56 0.54 0.68 0.49 0.69 0.54
Guatemala 0.37 0.44 0.40 0.37 0.49 0.32 0.46 0.41
Jamaica -0.53 -0.42 -0.44 -0.54 -0.44 -0.37 -0.23 -0.63
Mexico 0.21 0.22 0.39 0.21 0.37 0.07 0.18 0.28
Panama 0.72 0.66 0.73 0.72 0.67 0.61 0.73 0.55
Peru 0.46 0.71 0.42 0.46 0.77 0.51 0.75 0.66
Suriname 0.01 0.39 0.02 0.01 0.50 -0.01 0.42 0.34
Trinidad & Tobago 0.38 0.37 0.70 0.38 0.37 0.38 0.36 0.39
Uruguay 0.29 0.34 0.43 0.28 0.34 0.33 0.33 0.35
Average 0.29 0.37 0.39 0.29 0.43 0.20 0.41 0.32
Middle East & North Africa
Algeria -0.43 -0.33 -0.31 -0.43 -0.29 -0.44 -0.34 -0.32
Iran -0.15 -0.11 -0.09 -0.15 0.01 -0.31 -0.19 0.14
Israel 0.07 0.16 0.24 0.08 0.23 -0.08 0.04 0.41
Libya -0.42 -0.31 -0.21 -0.42 -0.28 -0.49 -0.24 -0.44
Average -0.23 -0.15 -0.09 -0.23 -0.08 -0.33 -0.18 -0.05
Sub-Saharan Africa
Angola -0.31 -0.02 0.38 -0.31 0.15 -0.45 0.13 -0.18
Botswana -1.06 -0.96 -0.73 -1.06 -0.90 -1.12 -0.88 -1.05
Ghana -0.55 -0.55 -0.37 -0.55 -0.41 -0.80 -0.48 -0.61
Malawi -0.70 -0.65 -0.61 -0.70 -0.57 -0.75 -0.64 -0.66
Nigeria -0.22 -0.24 -0.05 -0.22 -0.26 -0.18 -0.31 -0.17
South Africa -0.49 -0.11 -0.07 -0.49 -0.06 -0.20 -0.16 -0.04
Uganda -0.47 -0.55 -0.66 -0.46 -0.68 -0.13 -0.63 -0.47
Zambia -1.26 -1.29 -1.23 -1.26 -1.31 -1.26 -1.28 -1.30
Average -0.63 -0.55 -0.42 -0.63 -0.51 -0.61 -0.53 -0.56
Asia Pacific & South Asia
China -0.32 -0.28 -0.09 -0.32 -0.25 -0.34 -0.25 -0.32
India 0.27 -0.01 0.52 0.26 0.03 -0.10 -0.07 0.13
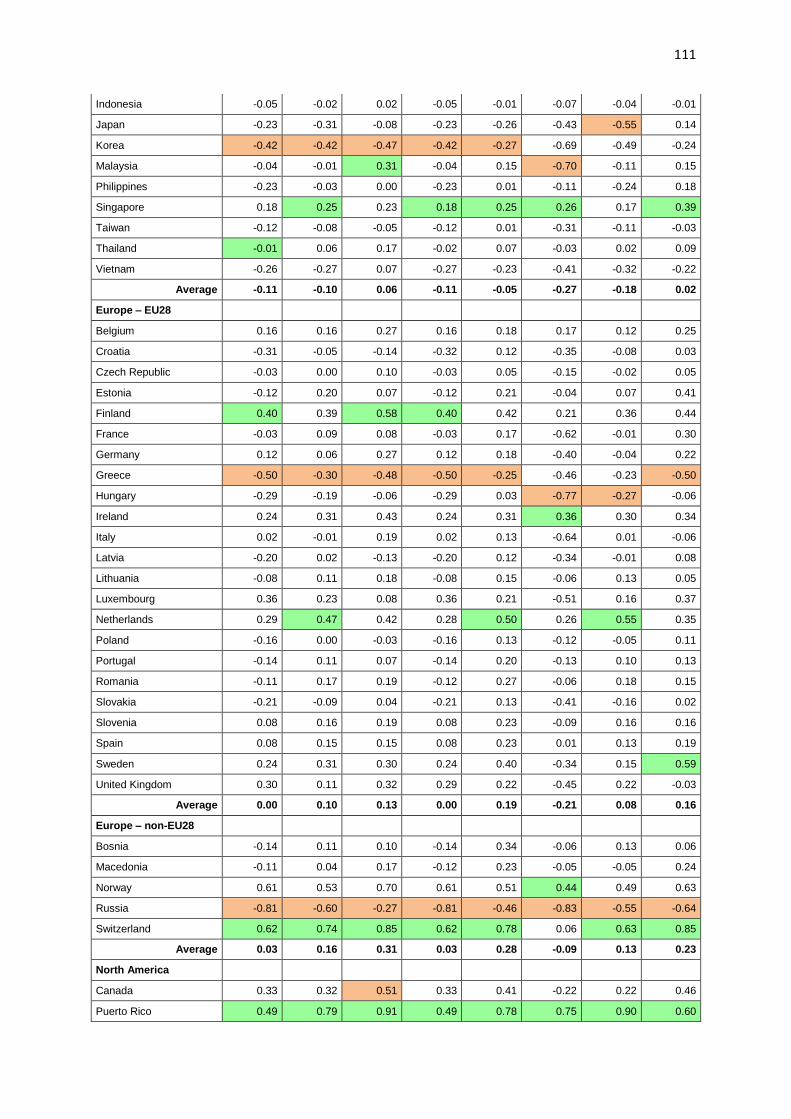
111
Indonesia -0.05 -0.02 0.02 -0.05 -0.01 -0.07 -0.04 -0.01
Japan -0.23 -0.31 -0.08 -0.23 -0.26 -0.43 -0.55 0.14
Korea -0.42 -0.42 -0.47 -0.42 -0.27 -0.69 -0.49 -0.24
Malaysia -0.04 -0.01 0.31 -0.04 0.15 -0.70 -0.11 0.15
Philippines -0.23 -0.03 0.00 -0.23 0.01 -0.11 -0.24 0.18
Singapore 0.18 0.25 0.23 0.18 0.25 0.26 0.17 0.39
Taiwan -0.12 -0.08 -0.05 -0.12 0.01 -0.31 -0.11 -0.03
Thailand -0.01 0.06 0.17 -0.02 0.07 -0.03 0.02 0.09
Vietnam -0.26 -0.27 0.07 -0.27 -0.23 -0.41 -0.32 -0.22
Average -0.11 -0.10 0.06 -0.11 -0.05 -0.27 -0.18 0.02
Europe – EU28
Belgium 0.16 0.16 0.27 0.16 0.18 0.17 0.12 0.25
Croatia -0.31 -0.05 -0.14 -0.32 0.12 -0.35 -0.08 0.03
Czech Republic -0.03 0.00 0.10 -0.03 0.05 -0.15 -0.02 0.05
Estonia -0.12 0.20 0.07 -0.12 0.21 -0.04 0.07 0.41
Finland 0.40 0.39 0.58 0.40 0.42 0.21 0.36 0.44
France -0.03 0.09 0.08 -0.03 0.17 -0.62 -0.01 0.30
Germany 0.12 0.06 0.27 0.12 0.18 -0.40 -0.04 0.22
Greece -0.50 -0.30 -0.48 -0.50 -0.25 -0.46 -0.23 -0.50
Hungary -0.29 -0.19 -0.06 -0.29 0.03 -0.77 -0.27 -0.06
Ireland 0.24 0.31 0.43 0.24 0.31 0.36 0.30 0.34
Italy 0.02 -0.01 0.19 0.02 0.13 -0.64 0.01 -0.06
Latvia -0.20 0.02 -0.13 -0.20 0.12 -0.34 -0.01 0.08
Lithuania -0.08 0.11 0.18 -0.08 0.15 -0.06 0.13 0.05
Luxembourg 0.36 0.23 0.08 0.36 0.21 -0.51 0.16 0.37
Netherlands 0.29 0.47 0.42 0.28 0.50 0.26 0.55 0.35
Poland -0.16 0.00 -0.03 -0.16 0.13 -0.12 -0.05 0.11
Portugal -0.14 0.11 0.07 -0.14 0.20 -0.13 0.10 0.13
Romania -0.11 0.17 0.19 -0.12 0.27 -0.06 0.18 0.15
Slovakia -0.21 -0.09 0.04 -0.21 0.13 -0.41 -0.16 0.02
Slovenia 0.08 0.16 0.19 0.08 0.23 -0.09 0.16 0.16
Spain 0.08 0.15 0.15 0.08 0.23 0.01 0.13 0.19
Sweden 0.24 0.31 0.30 0.24 0.40 -0.34 0.15 0.59
United Kingdom 0.30 0.11 0.32 0.29 0.22 -0.45 0.22 -0.03
Average 0.00 0.10 0.13 0.00 0.19 -0.21 0.08 0.16
Europe – non-EU28
Bosnia -0.14 0.11 0.10 -0.14 0.34 -0.06 0.13 0.06
Macedonia -0.11 0.04 0.17 -0.12 0.23 -0.05 -0.05 0.24
Norway 0.61 0.53 0.70 0.61 0.51 0.44 0.49 0.63
Russia -0.81 -0.60 -0.27 -0.81 -0.46 -0.83 -0.55 -0.64
Switzerland 0.62 0.74 0.85 0.62 0.78 0.06 0.63 0.85
Average 0.03 0.16 0.31 0.03 0.28 -0.09 0.13 0.23
North America
Canada 0.33 0.32 0.51 0.33 0.41 -0.22 0.22 0.46
Puerto Rico 0.49 0.79 0.91 0.49 0.78 0.75 0.90 0.60
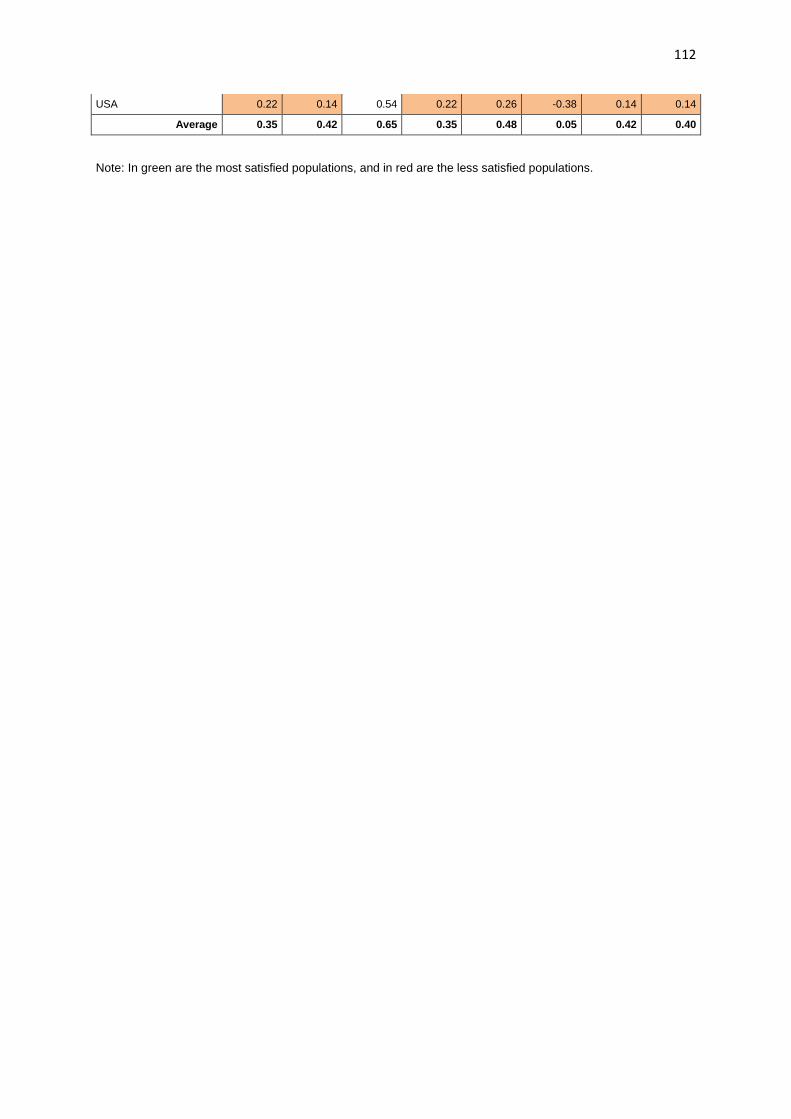
112
USA 0.22 0.14 0.54 0.22 0.26 -0.38 0.14 0.14
Average 0.35 0.42 0.65 0.35 0.48 0.05 0.42 0.40
Note: In green are the most satisfied populations, and in red are the less satisfied populations.
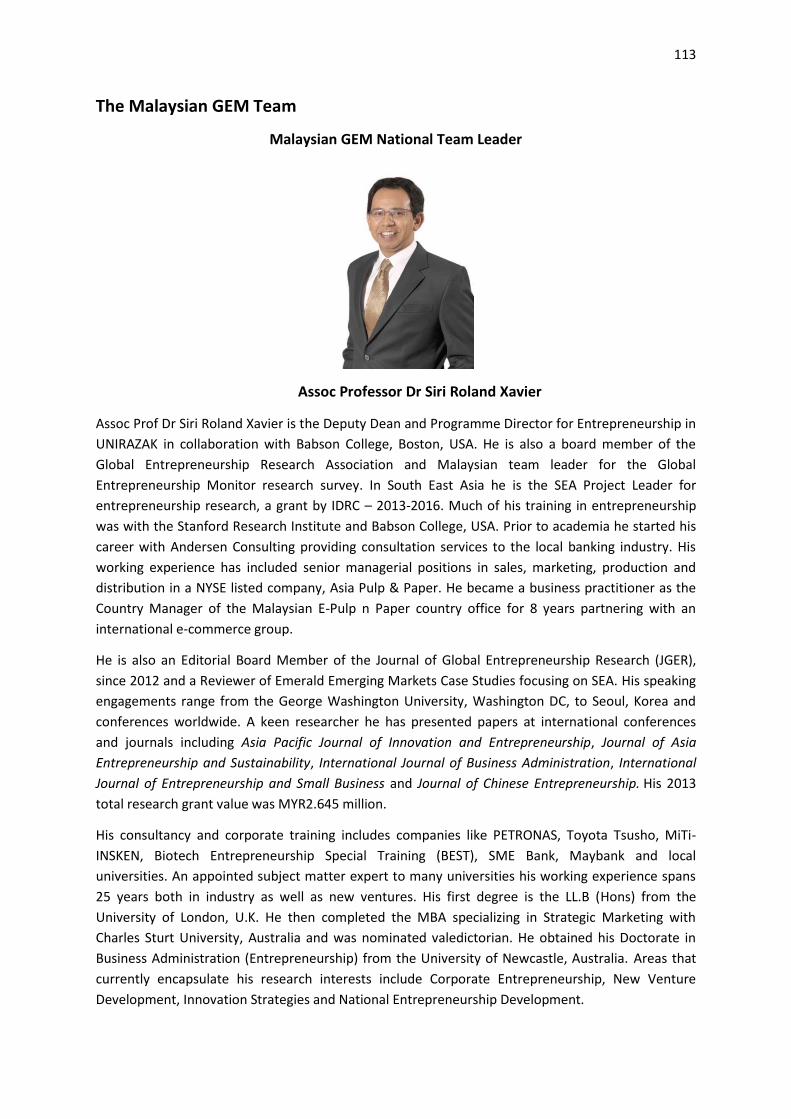
113
The Malaysian GEM Team
Malaysian GEM National Team Leader
Assoc Professor Dr Siri Roland Xavier
Assoc Prof Dr Siri Roland Xavier is the Deputy Dean and Programme Director for Entrepreneurship in
UNIRAZAK in collaboration with Babson College, Boston, USA. He is also a board member of the
Global Entrepreneurship Research Association and Malaysian team leader for the Global
Entrepreneurship Monitor research survey. In South East Asia he is the SEA Project Leader for
entrepreneurship research, a grant by IDRC – 2013-2016. Much of his training in entrepreneurship
was with the Stanford Research Institute and Babson College, USA. Prior to academia he started his
career with Andersen Consulting providing consultation services to the local banking industry. His
working experience has included senior managerial positions in sales, marketing, production and
distribution in a NYSE listed company, Asia Pulp & Paper. He became a business practitioner as the
Country Manager of the Malaysian E-Pulp n Paper country office for 8 years partnering with an
international e-commerce group.
He is also an Editorial Board Member of the Journal of Global Entrepreneurship Research (JGER),
since 2012 and a Reviewer of Emerald Emerging Markets Case Studies focusing on SEA. His speaking
engagements range from the George Washington University, Washington DC, to Seoul, Korea and
conferences worldwide. A keen researcher he has presented papers at international conferences
and journals including Asia Pacific Journal of Innovation and Entrepreneurship, Journal of Asia
Entrepreneurship and Sustainability, International Journal of Business Administration, International
Journal of Entrepreneurship and Small Business and Journal of Chinese Entrepreneurship. His 2013
total research grant value was MYR2.645 million.
His consultancy and corporate training includes companies like PETRONAS, Toyota Tsusho, MiTi-
INSKEN, Biotech Entrepreneurship Special Training (BEST), SME Bank, Maybank and local
universities. An appointed subject matter expert to many universities his working experience spans
25 years both in industry as well as new ventures. His first degree is the LL.B (Hons) from the
University of London, U.K. He then completed the MBA specializing in Strategic Marketing with
Charles Sturt University, Australia and was nominated valedictorian. He obtained his Doctorate in
Business Administration (Entrepreneurship) from the University of Newcastle, Australia. Areas that
currently encapsulate his research interests include Corporate Entrepreneurship, New Venture
Development, Innovation Strategies and National Entrepreneurship Development.
114
MALAYSIAN GEM TEAM MEMBER
Garry J. Clayton
Professor Garry J. Clayton he has an earned a doctorate from the University of Waikato, a
postgraduate diploma in business from the University of Auckland, postgraduate diploma in public
policy from Victoria University of Wellington and a Diploma of Teaching from Hamilton Teachers
College. He is also a graduate of the New Zealand Defence Force Staff College.
He is currently the Dean, Bank Rakyat School of Business and Entrepreneurship (BRSBE) at Universiti
Tun Abdul Razak (UNIRAZAK) Malaysia. He has previously held senior research, teaching and
administration appointments in the New Zealand Defence Force, Waikato Museum, the University of
Auckland, Waikato University, the Eastern Institute of Technology in New Zealand, at the University
of Massachusetts Dartmouth and has been a visiting Professor at the Universiti Teknologi MARA
(UiTM) in Malaysia.
Professor Clayton has published and consulted in entrepreneurship, sustainable economic
development, creativity, professional education, leadership and strategy.
115
MALAYSIAN GEM TEAM MEMBER
Mohar Yusof [email protected]
Mohar’s specialization and research interest are in the field of entrepreneurship, family business and strategy. He has published in several international refereed journals namely the International Entrepreneurship and Management Journal, Journal of Entrepreneurship, Management and Innovation, Journal of Asia Entrepreneurship and Sustainability, New England Journal of Entrepreneurship, Asia Pacific Journal of Innovation and Entrepreneurship, Asian Journal of Case Research, and an ardent writer of cases for teaching and publication purpose. He has been involved in the Global Entrepreneurship Monitor (GEM) study and the Successful Transgenerational Entrepreneurship Practices (STEP) project on family business since 2009. He has a Ph.D. in Management (by Research) in which he studied the organizational antecedents of academic entrepreneurship. In addition, he holds the Malaysian Institute of Management – Certified Professional Intellectual Property Manager (MIM-CPIPM) certification, has completed six modules of Entrepreneurship Educators training with Babson College, USA, and underwent training on Case Teaching at the Richard Ivey School of Business, the University of Western Ontario, Canada.
116
MALAYSIAN GEM TEAM MEMBER
Leilanie Mohd Nor [email protected]
Leilanie Mohd Nor’s area of specialization is in Entrepreneurship, focusing on family business
theories and models, decision making process, venture creation and portfolio entrepreneurship. She
has conducted numerous studies on understanding the dynamics of a family business - the element
of “familiness” that creates a competitive advantage to a family business. Leilanie is the team leader
for STEP (Successful Transgenerational Entrepreneurship Practices) Malaysia since 2009. She is the
STEP Asia Pacific Leadership Council (Chair), and sits on the STEP Global Board. She is also involved in
the Global Entrepreneurship Monitor (GEM) study since 2009. In February 2014, Leilanie successfully
defended her Ph.D. thesis, focusing on decision making process within family businesses when
creating new ventures. She is a reviewer for USASBE since 2011 and as an educator, she is actively
involved with students’ ideas and progress on their business opportunities. Leilanie Mohd Nor, who
came from a corporate background, has had more than 10 years professional experience holding
managerial positions at large conglomerate companies in Malaysia prior to joining the academia in
2007.
117
Dewi Amat Sapuan
Dewi Amat Sapuan is an Associate Professor of Organisational Behaviour at the Graduate School of
Business (GSB), Universiti Tun Abdul Razak (UNIRAZAK). Dewi is currently holding the position of the
Director of Bureau for Excellence in Research and Teaching (BERT) and prior to this, she has held the
positions of Deputy Dean at the GSB, and the Bank Rakyat School of Business and Entrepreneurship
(BRSBE). Dewi began her teaching career in 1999 as an Assistant Lecturer at the Faculty of Business
Administration and later earned her MBA, and her Ph.D. in Management from Universiti Tun Abdul
Razak, in 2003 and 2010, respectively. She has published journal articles, book and book chapters,
cases and courseware in the fields of Organisational Behaviour, Entrepreneurship, Management and
Education Management and has also received recognitions for her research and teaching
accomplishments. Dewi has also recently been awarded national research grants to lead studies in
Emotional Labour in the mental health professions as well as Talent Management in the Malaysian
Armed Forces.
Top Related
Copyright © 2022 FDOKUMEN

