


Bahasa
Halaman
Hukum

ARTICLE IN PRESS
1352-2310/$ - se
doi:10.1016/j.at
�CorrespondE-mail addr
Atmospheric Environment 40 (2006) 2409–2421
www.elsevier.com/locate/atmosenv
Enhanced water vapor in Asian dust layer: Entrainmentprocesses and implication for aerosol optical properties
Soon-Chang Yoona, Sang-Woo Kima,�, Jiyoung Kima,b, Byung-Ju Sohna,Anne Jeffersonc, Suk-Jin Choia, Dong-Hyun Chaa, Dong-Kyou Leea,
Theodore L. Andersond, Sarah J. Dohertyd, Rodney J. Webere
aSchool of Earth and Environmental Sciences, Seoul National University, Mail-stop NS80, San 56-1, Seoul 151-747, Republic of KoreabMeteorological Research Institute, Korea Meteorological Administration, Seoul, Republic of Korea
cClimate Monitoring and Diagnostics Laboratory, NOAA, Boulder, CO, USAdDepartment of Atmospheric Science, University of Washington, Seattle, WA, USA
eSchool of Earth and Atmospheric Sciences, Georgia Institute of Technology, Atlanta, USA
Received 12 September 2005; received in revised form 2 December 2005; accepted 15 December 2005
Abstract
The entrainment process of water vapor into the dust layer during Asian dust events and the effect of water vapor
associated with the Asian dust layer (ADL) on aerosol hygroscopic properties are investigated. The entrainment processes
of water vapor into the ADL is examined by using a PSU/NCAR MM5 together with the backward trajectory model,
radiosonde data, and remotely sensed aerosol vertical distribution data. Two dust events in the spring of 1998 and 2001 are
examined in detail. The results reveal that the water vapor mixing ratio (WVMR) derived by the MM5 fits in well with the
WVMR observed by radiosonde, and is well coincident with the aerosol extinction coefficient (sep) measured by the micro-
pulse lidar. The temporal evolution of the vertical distributions of WVMR and sep exhibited similar features. On the basis
of a well simulation of the enhanced water vapor within the dust layer by the MM5, we trace the dust storms to examine
the entrainment mechanism. The enhancement of WVMR within the ADL was initiated over the mountainous areas. The
relatively moist air mass in the well-developed mixing layer over the mountainous areas is advected upward from the
boundary layer by an ascending motion. However, a large portion of the water vapor within the ADL is enhanced over the
edge of a highland and the plains in China. This is well supported by the simulated WVMR and the wind vectors. Aircraft-
based in situ measurements of the chemical and optical properties of aerosol enable a quantitative estimation of the effect
of the enhanced WVMR on the aerosol hygroscopic properties. The submicron aerosol accompanied by the dust storm
caused an increase of aerosol scattering through water uptakes during the transport. This increase could be explained by
the chemical fact that water-soluble submicron pollution aerosols are enriched in the ADL.
r 2006 Elsevier Ltd. All rights reserved.
Keywords: Entrainment process of water vapor; Asian dust; PSU/NCAR MM5; Aerosol light scattering hygroscopic growth; Water-
soluble submicron pollution aerosols
e front matter r 2006 Elsevier Ltd. All rights reserved.
mosenv.2005.12.018
ing author. Tel.: +822 880 6721; fax: +82 2 883 4972.
ess: [email protected] (S.-W. Kim).
ARTICLE IN PRESSS.-C. Yoon et al. / Atmospheric Environment 40 (2006) 2409–24212410
1. Introduction
Asian dust storms originating from the arid andsemi-arid regions of China and Mongolia have beenstudied for many years. Dust particles are a majorcomponent of atmospheric aerosol in East Asia(Husar et al., 2001; Iwasaka et al., 1983; Kim et al.,2005). Each spring, the Asian dust storms occurmost frequently due to the combined effects of lowprecipitation and the increased occurrence of highwinds associated with a cold front. The dustparticles are further transported over eastern Asiato the North Pacific and also to North America bystrong westerly jet streams (Gong et al., 2003;Murayama et al., 2001; Zhang et al., 2003).Recently, significant progress relevant to the regio-nal radiative forcing (Nakajima et al., 2003; Wonet al., 2004) and atmospheric chemical consequences(Parrish et al., 2004; Seinfeld et al., 2004; Toppinget al., 2004) of Asian dust have been made byseveral field experiments, such as ACE-Asia (Hue-bert et al., 2003) and TRACE-P (Carmichael et al.,2003). Asian dust causes not only a large-radiativeforcing both at the surface and top of the atmo-sphere (Nakajima et al., 2003; Won et al., 2004) butalso significant radiative heating at short wave-lengths and cooling at long wavelengths (Kim et al.,2004). In addition, it exhibited complex and highlyvaried chemical and optical properties because mostof the dust was intimately mixed with pollutionaerosols (Anderson et al., 2003; Clarke et al., 2004).
Using ground-based lidar and aircraft-based insitu and radiosonde measurements during the Asiandust events, Kim et al. (2004) has recently demon-strated that the water vapor mixing ratio (WVMR)within the Asian dust layer (ADL) was enhanced ascompared with the air above and below the ADL.They also demonstrated that elevated levels of watervapor within the ADL led to an increase in the netradiative heating rate within the dust layer, chan-ging with the heating rate vertical structure. Sincethe enhanced levels of water vapor within the ADLcan induce a change in the optical and hygroscopicproperties of the dust and associated pollutionaerosols, in this paper, we extend the researchrelated to this topic.
The objectives of this study are to investigate theentrainment processes of water vapor into the ADLduring the Asian dust events by using a mesoscalemeteorological model version 5 (MM5) and atrajectory model, and to examine the effect ofenhanced water vapor within the ADL on the
aerosol hygroscopic properties by using the dataacquired onboard a C-130 in situ measurementsduring ACE-Asia. The methodology employed inthis study is described in Section 2. Case studies ofthe entrainment processes of water vapor into theADL and its effects on aerosol light scatteringhygroscopic growth are presented in Section 3.
2. Methodology
2.1. Meteorological model simulation
We used the Fifth-Generation National Centerfor Atmospheric Research (NCAR)/PennsylvaniaState University (PSU) mesoscale model (MM5) togenerate the hourly meteorological data requiredfor this study. The MM5 is a nonhydrostatic,primitive equation model with a terrain that followsvertical coordinates. It has been described in detailby Anthes and Warner (1978), Dudhia (1993), andGrell et al. (1994).
In this study, two experiments were conducted for5 days in 1998 (from 00 UTC April 15 to 00 UTCApril 20) and 4 days in 2001 (from 00 UTC April 10to 00 UTC April 14). The model domain for the twosimulation periods was located above East Asia(701E–1501E, 251N–551N), but it extended furtherbeyond this region to reduce the effects of boundaryerror propagation into the areas of interest. Itcomprised 170� 100 grid points in the zonal andmeridional directions (5100 km� 3000 km), respec-tively. The horizontal separation of the grids forboth simulations was 30 km, and 30 vertical sigmalevels from the surface to the top of the model at50 hPa were utilized. The time step of the modelintegration is 90 s. The physical and dynamicalparameterization schemes of the model were iden-tical for both the experiments: the Grell cumulusparameterization (Grell, 1993), simple ice cloudmicrophysics (Dudhia, 1989), non-local planetaryboundary layer physics (Hong and Pan, 1996), andCCM2 radiative transfer package (Briegleb, 1992)were used. In order to provide initial and boundarydata to drive the model, upper-air variables (e.g.,zonal and meridional winds, temperature, andrelative humidity) on a 2.51� 2.51 horizontalgrid mesh and at 13 pressure levels from 1000to 70 hPa along with surface variables on aT63 Gaussian grid—a grid mesh of approximately1.8751� 1.9041—were obtained from a six hourlyNCEP/NCAR reanalysis (Kalnay et al., 1996).The data were interpolated to the model grids
ARTICLE IN PRESSS.-C. Yoon et al. / Atmospheric Environment 40 (2006) 2409–2421 2411
bi-linearly. The initial conditions of the model wereobtained by objectively analyzing the radiosondeand surface observations with a successive correc-tion scheme. The observed sea surface temperature(SST) was updated every 24 h from the 11� 11weekly data (Smith and Reynolds, 1998).
Trajectory analysis has been widely used tointerpret air mass transport routes. In this study,back trajectories were calculated by using anNOAA hybrid single particle lagrangian integratedtrajectory (HYSPLIT) model (Draxler and Rolph,2003). The altitude of the starting point in this studywas primarily determined from the lidar observa-tion of the dust height.
2.2. Aircraft-based measurements of aerosol
properties
The aircraft-based aerosol data was collectedfrom the NCAR/NSF C-130 during the ACE-Asiafield campaign. On the C-130, aerosol light scatter-ing coefficients (ssp) for the total (particle diameterless than 10 mm) and submicron aerosols were madeat a low RH (28.778.9%) and under ambientconditions using a three-wavelength (450, 550, and700 nm) nephelometer, model 3563, manufacturedby TSI, Inc. In addition, the light-scatteringhygroscopic growth factor, f (RH), for the totalaerosol was measured with a pair of RadianceResearch M903 single-wavelength nephelometersrunning in parallel; one of them at a low RH(o40%), and the other was at a high RH (�85%).Detailed descriptions of the instruments, theiroperation, and associated uncertainties of theonboard C-130 in situ measurements are given byAnderson et al. (2003).
A particles-into-liquid-sampler (PILS) coupled toa dual-channel ion chromatography system aboardthe C-130 continuously measured the followingwater-soluble fine-particle components: Na+,NH4
+, Ca2+, Mg2+, K+, Cl�, NO3�, and SO4
2�.The samples were taken approximately every 4min.Upper measurement particle size cut is estimated tobe 1.3 mm in diameter (Maxwell-Meier et al., 2004).The measurement uncertainty is approximately730%. Complete descriptions and the operationof PILS instrument during ACE-Asia are givenby Weber et al. (2001) and Maxwell-Meier et al.(2004).
The vertical profiles of the meteorological para-meter, such as pressure, temperature, and relativehumidity, were also measured aboard the C-130.
3. Results and discussion
3.1. Meteorological model simulation of enhanced
water vapor within the Asian dust layer
Since the dust-laden air masses are usuallyconsidered to be dry due to geographical character-istics of dust source region and the associated dustemission processes (e.g., Liu et al., 2004), theenhanced levels of water vapor within the ADL,reported by Kim et al. (2004), are an importantmotivational factor for dust-related radiative effectas well as chemical transport modeling. Watervapor in the atmosphere can readily react withhygroscopic aerosols. Therefore, it is imperative todetermine whether the current meteorological mod-el can simulate this phenomenon. Here, we com-pared the vertical distribution of the WVMRderived by the NCAR/PSU MM5 with the aerosolextinction profile measured by the surface-basedmicro-pulse lidar (MPL) to verify the enhancementof the WVMR within the dust layer. This compar-ison is fundamental for the investigation of theentrainment process of water vapor into the ADL inthis study.
This study focuses on two cases of high dustloading. The first case is a dust episode thatoccurred in April 2001 during the ACE-Asiacampaign (Kim et al., 2005), and the other is amajor dust event that occurred in April 1998(Murayama et al., 2001).
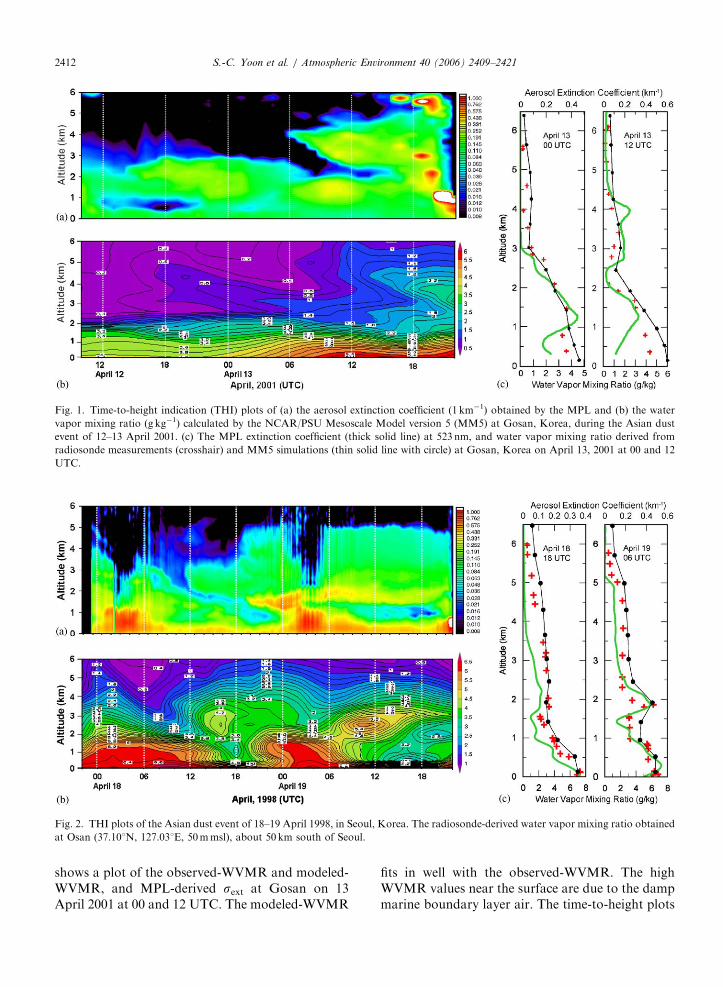
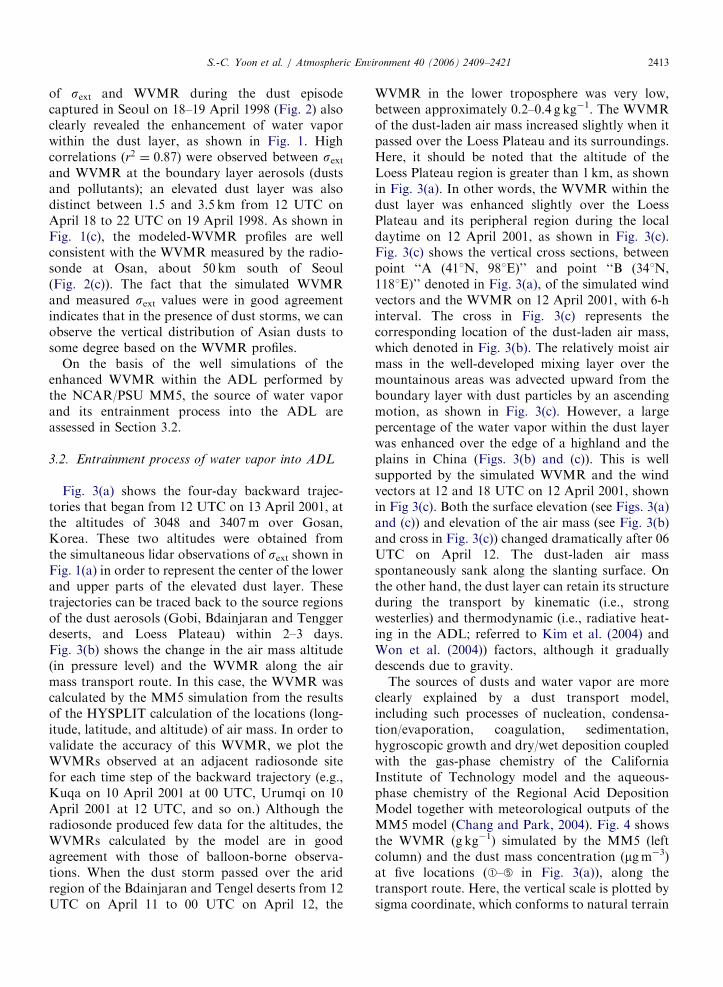
Figs. 1 and 2 show the time-to-height plots of theaerosol extinction coefficient (sext) measured by theground-based MPL at a 523 nm wavelength (Yoonet al., 2001) and the WVMR simulated by theNCAR/PSU MM5 for the first (Gosan, Korea;33.291N, 126.161E, 51m) and second (Seoul, Korea;37.461N, 126.651E, 150m) dust storm cases, respec-tively. In Fig. 1(a), after the passage of the frontalsystem on 11–12 April 2001, the dust was observedbelow 3 km with sext of 0.15–0.2 km�1. On theafternoon of April 13, an isolated dust layerappeared near 4 km with sext of approximately0.5 km�1. This layer gradually thickened until 21UTC on April 13, when it rained. As compared withthe time-to-height plot of sext, strikingly similarfeatures of the temporal evolution of the verticalWVMR distribution were appeared (Fig. 1(b)). Ahigh WVMR appeared below 3 km during the Asiandust episode. However, it sharply increased withinan elevated dust layer (e.g., which was observedfrom 6 to 22 UTC on April 13, 2001). Fig. 1(c)
ARTICLE IN PRESS
Fig. 1. Time-to-height indication (THI) plots of (a) the aerosol extinction coefficient (1 km�1) obtained by the MPL and (b) the water
vapor mixing ratio (g kg�1) calculated by the NCAR/PSU Mesoscale Model version 5 (MM5) at Gosan, Korea, during the Asian dust
event of 12–13 April 2001. (c) The MPL extinction coefficient (thick solid line) at 523 nm, and water vapor mixing ratio derived from
radiosonde measurements (crosshair) and MM5 simulations (thin solid line with circle) at Gosan, Korea on April 13, 2001 at 00 and 12
UTC.
Fig. 2. THI plots of the Asian dust event of 18–19 April 1998, in Seoul, Korea. The radiosonde-derived water vapor mixing ratio obtained
at Osan (37.101N, 127.031E, 50mmsl), about 50 km south of Seoul.
S.-C. Yoon et al. / Atmospheric Environment 40 (2006) 2409–24212412
shows a plot of the observed-WVMR and modeled-WVMR, and MPL-derived sext at Gosan on 13April 2001 at 00 and 12 UTC. The modeled-WVMR
fits in well with the observed-WVMR. The highWVMR values near the surface are due to the dampmarine boundary layer air. The time-to-height plots
ARTICLE IN PRESSS.-C. Yoon et al. / Atmospheric Environment 40 (2006) 2409–2421 2413
of sext and WVMR during the dust episodecaptured in Seoul on 18–19 April 1998 (Fig. 2) alsoclearly revealed the enhancement of water vaporwithin the dust layer, as shown in Fig. 1. Highcorrelations (r2 ¼ 0:87) were observed between sextand WVMR at the boundary layer aerosols (dustsand pollutants); an elevated dust layer was alsodistinct between 1.5 and 3.5 km from 12 UTC onApril 18 to 22 UTC on 19 April 1998. As shown inFig. 1(c), the modeled-WVMR profiles are wellconsistent with the WVMR measured by the radio-sonde at Osan, about 50 km south of Seoul(Fig. 2(c)). The fact that the simulated WVMRand measured sext values were in good agreementindicates that in the presence of dust storms, we canobserve the vertical distribution of Asian dusts tosome degree based on the WVMR profiles.
On the basis of the well simulations of theenhanced WVMR within the ADL performed bythe NCAR/PSU MM5, the source of water vaporand its entrainment process into the ADL areassessed in Section 3.2.
3.2. Entrainment process of water vapor into ADL
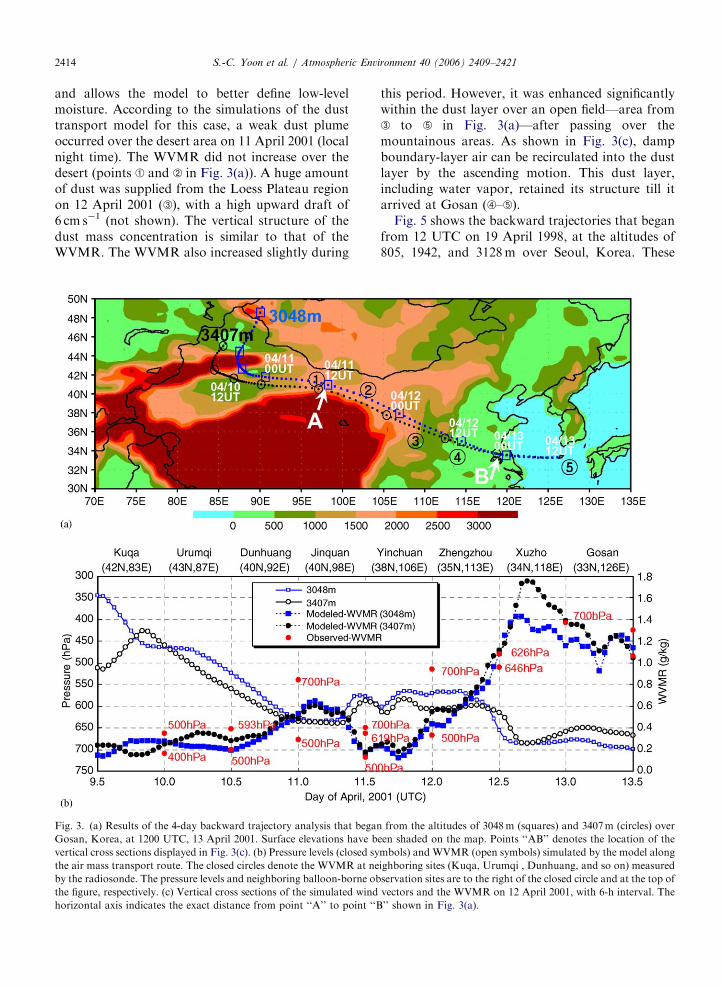
Fig. 3(a) shows the four-day backward trajec-tories that began from 12 UTC on 13 April 2001, atthe altitudes of 3048 and 3407m over Gosan,Korea. These two altitudes were obtained fromthe simultaneous lidar observations of sext shown inFig. 1(a) in order to represent the center of the lowerand upper parts of the elevated dust layer. Thesetrajectories can be traced back to the source regionsof the dust aerosols (Gobi, Bdainjaran and Tenggerdeserts, and Loess Plateau) within 2–3 days.Fig. 3(b) shows the change in the air mass altitude(in pressure level) and the WVMR along the airmass transport route. In this case, the WVMR wascalculated by the MM5 simulation from the resultsof the HYSPLIT calculation of the locations (long-itude, latitude, and altitude) of air mass. In order tovalidate the accuracy of this WVMR, we plot theWVMRs observed at an adjacent radiosonde sitefor each time step of the backward trajectory (e.g.,Kuqa on 10 April 2001 at 00 UTC, Urumqi on 10April 2001 at 12 UTC, and so on.) Although theradiosonde produced few data for the altitudes, theWVMRs calculated by the model are in goodagreement with those of balloon-borne observa-tions. When the dust storm passed over the aridregion of the Bdainjaran and Tengel deserts from 12UTC on April 11 to 00 UTC on April 12, the
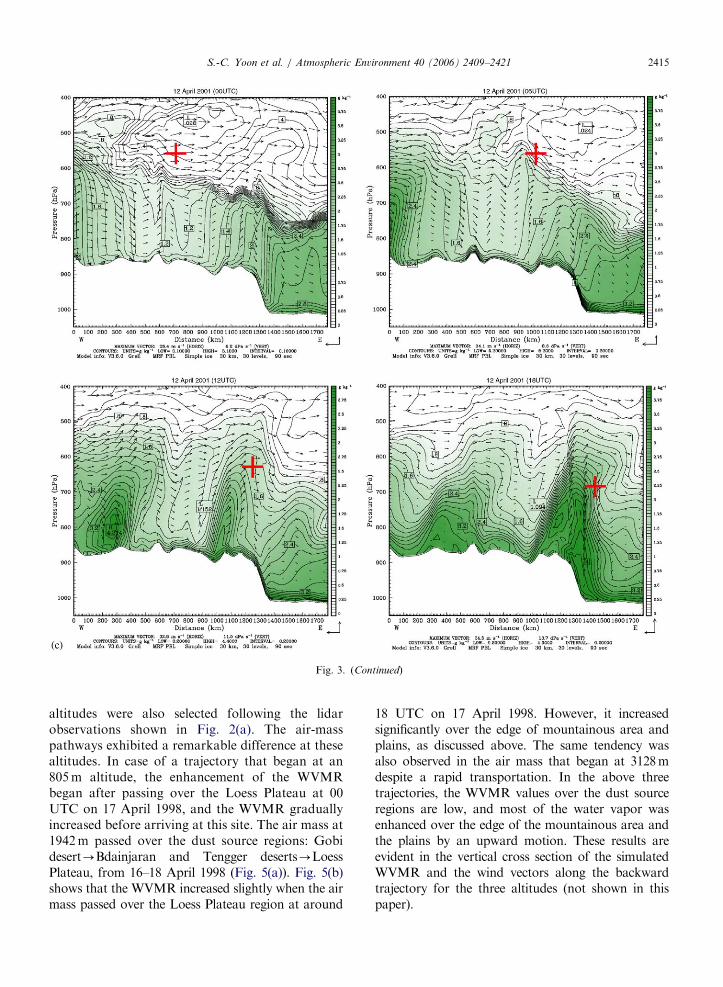
WVMR in the lower troposphere was very low,between approximately 0.2–0.4 g kg�1. The WVMRof the dust-laden air mass increased slightly when itpassed over the Loess Plateau and its surroundings.Here, it should be noted that the altitude of theLoess Plateau region is greater than 1 km, as shownin Fig. 3(a). In other words, the WVMR within thedust layer was enhanced slightly over the LoessPlateau and its peripheral region during the localdaytime on 12 April 2001, as shown in Fig. 3(c).Fig. 3(c) shows the vertical cross sections, betweenpoint ‘‘A (411N, 981E)’’ and point ‘‘B (341N,1181E)’’ denoted in Fig. 3(a), of the simulated windvectors and the WVMR on 12 April 2001, with 6-hinterval. The cross in Fig. 3(c) represents thecorresponding location of the dust-laden air mass,which denoted in Fig. 3(b). The relatively moist airmass in the well-developed mixing layer over themountainous areas was advected upward from theboundary layer with dust particles by an ascendingmotion, as shown in Fig. 3(c). However, a largepercentage of the water vapor within the dust layerwas enhanced over the edge of a highland and theplains in China (Figs. 3(b) and (c)). This is wellsupported by the simulated WVMR and the windvectors at 12 and 18 UTC on 12 April 2001, shownin Fig 3(c). Both the surface elevation (see Figs. 3(a)and (c)) and elevation of the air mass (see Fig. 3(b)and cross in Fig. 3(c)) changed dramatically after 06UTC on April 12. The dust-laden air massspontaneously sank along the slanting surface. Onthe other hand, the dust layer can retain its structureduring the transport by kinematic (i.e., strongwesterlies) and thermodynamic (i.e., radiative heat-ing in the ADL; referred to Kim et al. (2004) andWon et al. (2004)) factors, although it graduallydescends due to gravity.
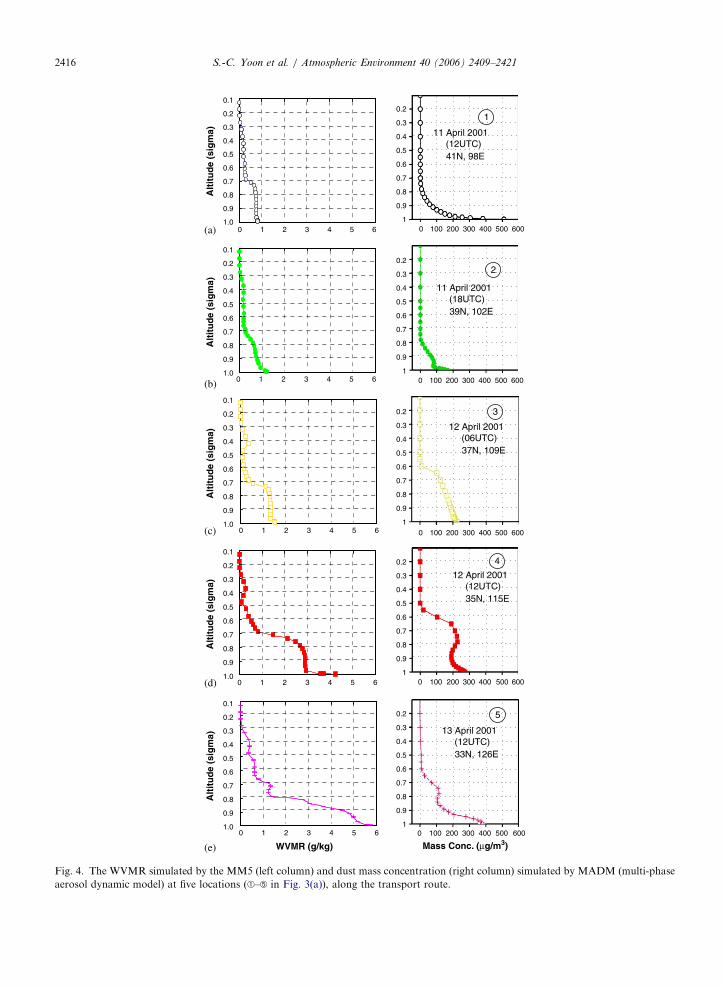
The sources of dusts and water vapor are moreclearly explained by a dust transport model,including such processes of nucleation, condensa-tion/evaporation, coagulation, sedimentation,hygroscopic growth and dry/wet deposition coupledwith the gas-phase chemistry of the CaliforniaInstitute of Technology model and the aqueous-phase chemistry of the Regional Acid DepositionModel together with meteorological outputs of theMM5 model (Chang and Park, 2004). Fig. 4 showsthe WVMR (g kg�1) simulated by the MM5 (leftcolumn) and the dust mass concentration (mgm�3)at five locations (A–E in Fig. 3(a)), along thetransport route. Here, the vertical scale is plotted bysigma coordinate, which conforms to natural terrain
ARTICLE IN PRESSS.-C. Yoon et al. / Atmospheric Environment 40 (2006) 2409–24212414
and allows the model to better define low-levelmoisture. According to the simulations of the dusttransport model for this case, a weak dust plumeoccurred over the desert area on 11 April 2001 (localnight time). The WVMR did not increase over thedesert (points A and B in Fig. 3(a)). A huge amountof dust was supplied from the Loess Plateau regionon 12 April 2001 (C), with a high upward draft of6 cm s�1 (not shown). The vertical structure of thedust mass concentration is similar to that of theWVMR. The WVMR also increased slightly during
Fig. 3. (a) Results of the 4-day backward trajectory analysis that began
Gosan, Korea, at 1200 UTC, 13 April 2001. Surface elevations have b
vertical cross sections displayed in Fig. 3(c). (b) Pressure levels (closed sy
the air mass transport route. The closed circles denote the WVMR at ne
by the radiosonde. The pressure levels and neighboring balloon-borne ob
the figure, respectively. (c) Vertical cross sections of the simulated wind
horizontal axis indicates the exact distance from point ‘‘A’’ to point ‘‘B
this period. However, it was enhanced significantlywithin the dust layer over an open field—area fromC to E in Fig. 3(a)—after passing over themountainous areas. As shown in Fig. 3(c), dampboundary-layer air can be recirculated into the dustlayer by the ascending motion. This dust layer,including water vapor, retained its structure till itarrived at Gosan (D–E).
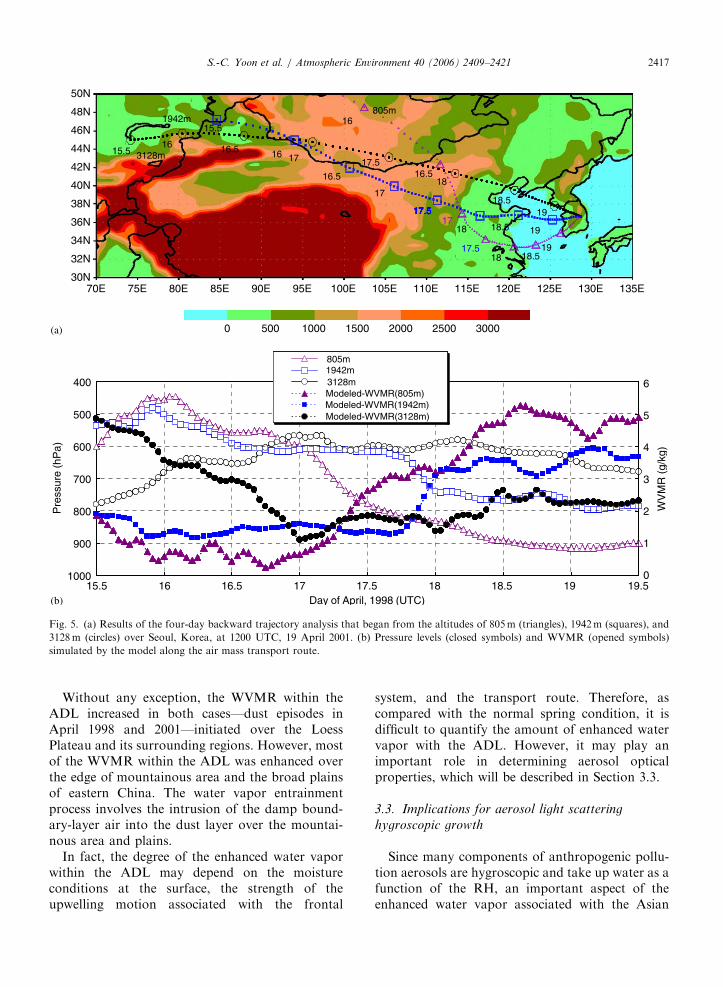
Fig. 5 shows the backward trajectories that beganfrom 12 UTC on 19 April 1998, at the altitudes of805, 1942, and 3128m over Seoul, Korea. These
from the altitudes of 3048m (squares) and 3407m (circles) over
een shaded on the map. Points ‘‘AB’’ denotes the location of the
mbols) and WVMR (open symbols) simulated by the model along
ighboring sites (Kuqa, Urumqi , Dunhuang, and so on) measured
servation sites are to the right of the closed circle and at the top of
vectors and the WVMR on 12 April 2001, with 6-h interval. The
’’ shown in Fig. 3(a).
ARTICLE IN PRESS
Fig. 3. (Continued)
S.-C. Yoon et al. / Atmospheric Environment 40 (2006) 2409–2421 2415
altitudes were also selected following the lidarobservations shown in Fig. 2(a). The air-masspathways exhibited a remarkable difference at thesealtitudes. In case of a trajectory that began at an805m altitude, the enhancement of the WVMRbegan after passing over the Loess Plateau at 00UTC on 17 April 1998, and the WVMR graduallyincreased before arriving at this site. The air mass at1942m passed over the dust source regions: Gobidesert-Bdainjaran and Tengger deserts-LoessPlateau, from 16–18 April 1998 (Fig. 5(a)). Fig. 5(b)shows that the WVMR increased slightly when the airmass passed over the Loess Plateau region at around
18 UTC on 17 April 1998. However, it increasedsignificantly over the edge of mountainous area andplains, as discussed above. The same tendency wasalso observed in the air mass that began at 3128mdespite a rapid transportation. In the above threetrajectories, the WVMR values over the dust sourceregions are low, and most of the water vapor wasenhanced over the edge of the mountainous area andthe plains by an upward motion. These results areevident in the vertical cross section of the simulatedWVMR and the wind vectors along the backwardtrajectory for the three altitudes (not shown in thispaper).
ARTICLE IN PRESS
(a)
(b)
(c)
(d)
(e) WVMR (g/kg)
0.2
0.3
0.4
0.5
0.6
0.7
0.8
0.9
10 100 200 300 400 500 600
0.2
0.3
0.4
0.5
0.6
0.7
0.8
0.9
10 100 200 300 400 500 600
0.2
0.3
0.4
0.5
0.6
0.7
0.8
0.9
10 100 200 300 400 500 600
0.2
0.3
0.4
0.5
0.6
0.7
0.8
0.9
10 100 200 300 400 500 600
0.2
0.3
0.4
0.5
0.6
0.7
0.8
0.9
1
0.2
0.1
0.3
0.4
0.5
0.6
0.7
0.8
0.9
1.00 100 200 300 400 500 600
Mass Conc. (µg/m3)0 1 2 3 4 5 6
Alt
itu
de
(sig
ma)
0.2
0.1
0.3
0.4
0.5
0.6
0.7
0.8
0.9
1.00 1 2 3 4 5 6
Alt
itu
de
(sig
ma)
0.2
0.1
0.3
0.4
0.5
0.6
0.7
0.8
0.9
1.00 1 2 3 4 5 6
Alt
itu
de
(sig
ma)
0.2
0.1
0.3
0.4
0.5
0.6
0.7
0.8
0.9
1.00 1 2 3 4 5 6
Alt
itu
de
(sig
ma)
0.2
0.1
0.3
0.4
0.5
0.6
0.7
0.8
0.9
1.00 1 2 3 4 5 6
Alt
itu
de
(sig
ma) 11 April 2001
(12UTC)41N, 98E
11 April 2001(18UTC)39N, 102E
12 April 2001(06UTC)37N, 109E
12 April 2001(12UTC)35N, 115E
13 April 2001(12UTC)33N, 126E
1
2
3
4
5
Fig. 4. The WVMR simulated by the MM5 (left column) and dust mass concentration (right column) simulated by MADM (multi-phase
aerosol dynamic model) at five locations (A–E in Fig. 3(a)), along the transport route.
S.-C. Yoon et al. / Atmospheric Environment 40 (2006) 2409–24212416
ARTICLE IN PRESS
1717.5
Day of April, 1998 (UTC)
Pre
ssur
e (h
Pa)
0
1
2
3
4
5
6
WV
MR
(g/
kg)
(b)
17.5
15.5
17.517.517.5
17.5
400
500
600
700
800
900
100016 16.5 17 17.5 18 18.5 19 19.5
(a)
1942m
15.5
15.5
3128m16 16.5 16
16
16.5 16.5
17
1718
18
18.5
18.5
18.5
18
17.5
805m
19
19
19
0 500 1000 1500 2000 2500 3000
50N
48N
46N
44N
42N
40N
38N
36N
34N
32N
30N70E 75E 80E 85E 90E 95E 100E 105E 110E 115E 120E 125E 130E 135E
805m
3128mModeled-WVMR(805m)Modeled-WVMR(1942m)Modeled-WVMR(3128m)
1942m
Fig. 5. (a) Results of the four-day backward trajectory analysis that began from the altitudes of 805m (triangles), 1942m (squares), and
3128m (circles) over Seoul, Korea, at 1200 UTC, 19 April 2001. (b) Pressure levels (closed symbols) and WVMR (opened symbols)
simulated by the model along the air mass transport route.
S.-C. Yoon et al. / Atmospheric Environment 40 (2006) 2409–2421 2417
Without any exception, the WVMR within theADL increased in both cases—dust episodes inApril 1998 and 2001—initiated over the LoessPlateau and its surrounding regions. However, mostof the WVMR within the ADL was enhanced overthe edge of mountainous area and the broad plainsof eastern China. The water vapor entrainmentprocess involves the intrusion of the damp bound-ary-layer air into the dust layer over the mountai-nous area and plains.
In fact, the degree of the enhanced water vaporwithin the ADL may depend on the moistureconditions at the surface, the strength of theupwelling motion associated with the frontal
system, and the transport route. Therefore, ascompared with the normal spring condition, it isdifficult to quantify the amount of enhanced watervapor with the ADL. However, it may play animportant role in determining aerosol opticalproperties, which will be described in Section 3.3.
3.3. Implications for aerosol light scattering
hygroscopic growth
Since many components of anthropogenic pollu-tion aerosols are hygroscopic and take up water as afunction of the RH, an important aspect of theenhanced water vapor associated with the Asian
ARTICLE IN PRESS
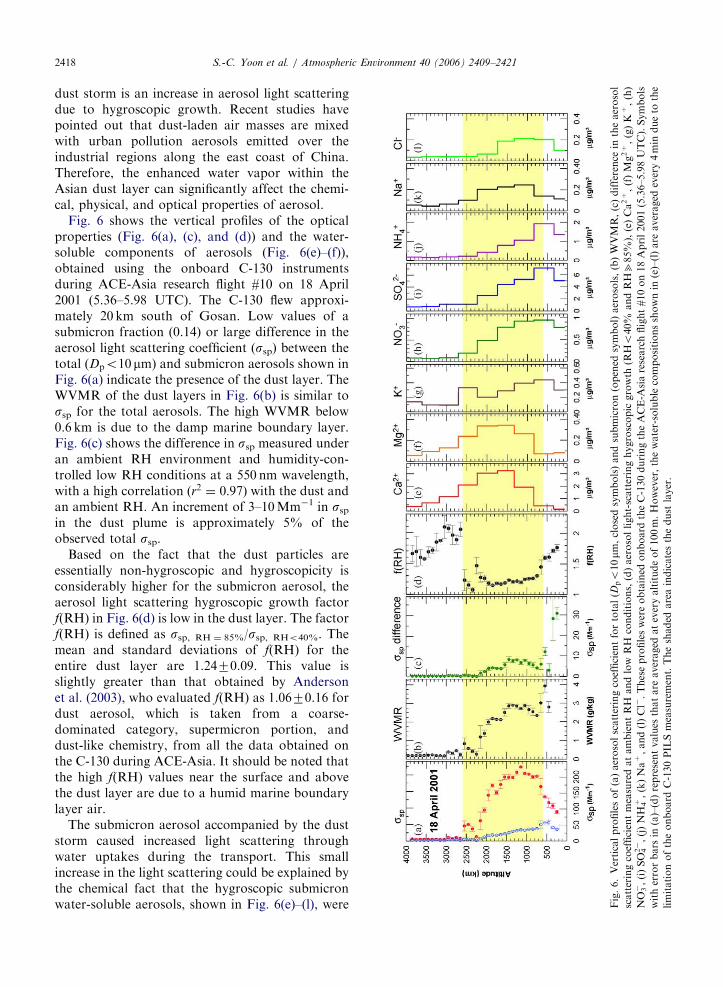
Fig.6.Verticalprofilesof(a)aerosolscatteringcoefficientfortotal(D
po10mm
,closedsymbols)andsubmicron(opened
symbol)aerosols,(b)WVMR,(c)difference
intheaerosol
scatteringcoefficientmeasuredatambientRH
andlow
RH
conditions,(d)aerosollight-scatteringhygroscopic
growth
(RHo40%
andRHb85%),(e)Ca2+,(f)Mg2+,(g)K
+,(h)
NO
3�,(i)SO
42�,(j)NH
4+,(k)Na+,and(l)Cl�.Theseprofileswereobtained
onboard
theC-130duringtheACE-A
siaresearchflight#10on18April2001(5.36–5.98UTC).Symbols
witherrorbars
in(a)–(d)representvalues
thatare
averaged
ateveryaltitudeof100m.However,thewater-soluble
compositionsshownin
(e)–(l)are
averaged
every4min
dueto
the
limitationoftheonboard
C-130PIL
Smeasurement.Theshaded
areaindicatesthedust
layer.
S.-C. Yoon et al. / Atmospheric Environment 40 (2006) 2409–24212418
dust storm is an increase in aerosol light scatteringdue to hygroscopic growth. Recent studies havepointed out that dust-laden air masses are mixedwith urban pollution aerosols emitted over theindustrial regions along the east coast of China.Therefore, the enhanced water vapor within theAsian dust layer can significantly affect the chemi-cal, physical, and optical properties of aerosol.
Fig. 6 shows the vertical profiles of the opticalproperties (Fig. 6(a), (c), and (d)) and the water-soluble components of aerosols (Fig. 6(e)–(f)),obtained using the onboard C-130 instrumentsduring ACE-Asia research flight #10 on 18 April2001 (5.36–5.98 UTC). The C-130 flew approxi-mately 20 km south of Gosan. Low values of asubmicron fraction (0.14) or large difference in theaerosol light scattering coefficient (ssp) between thetotal (Dpo10mm) and submicron aerosols shown inFig. 6(a) indicate the presence of the dust layer. TheWVMR of the dust layers in Fig. 6(b) is similar tossp for the total aerosols. The high WVMR below0.6 km is due to the damp marine boundary layer.Fig. 6(c) shows the difference in ssp measured underan ambient RH environment and humidity-con-trolled low RH conditions at a 550 nm wavelength,with a high correlation (r2 ¼ 0:97) with the dust andan ambient RH. An increment of 3–10Mm�1 in sspin the dust plume is approximately 5% of theobserved total ssp.
Based on the fact that the dust particles areessentially non-hygroscopic and hygroscopicity isconsiderably higher for the submicron aerosol, theaerosol light scattering hygroscopic growth factorf(RH) in Fig. 6(d) is low in the dust layer. The factorf(RH) is defined as ssp, RH ¼ 85%/ssp, RHo40%. Themean and standard deviations of f(RH) for theentire dust layer are 1.2470.09. This value isslightly greater than that obtained by Andersonet al. (2003), who evaluated f(RH) as 1.0670.16 fordust aerosol, which is taken from a coarse-dominated category, supermicron portion, anddust-like chemistry, from all the data obtained onthe C-130 during ACE-Asia. It should be noted thatthe high f(RH) values near the surface and abovethe dust layer are due to a humid marine boundarylayer air.
The submicron aerosol accompanied by the duststorm caused increased light scattering throughwater uptakes during the transport. This smallincrease in the light scattering could be explained bythe chemical fact that the hygroscopic submicronwater-soluble aerosols, shown in Fig. 6(e)–(l), were
ARTICLE IN PRESS
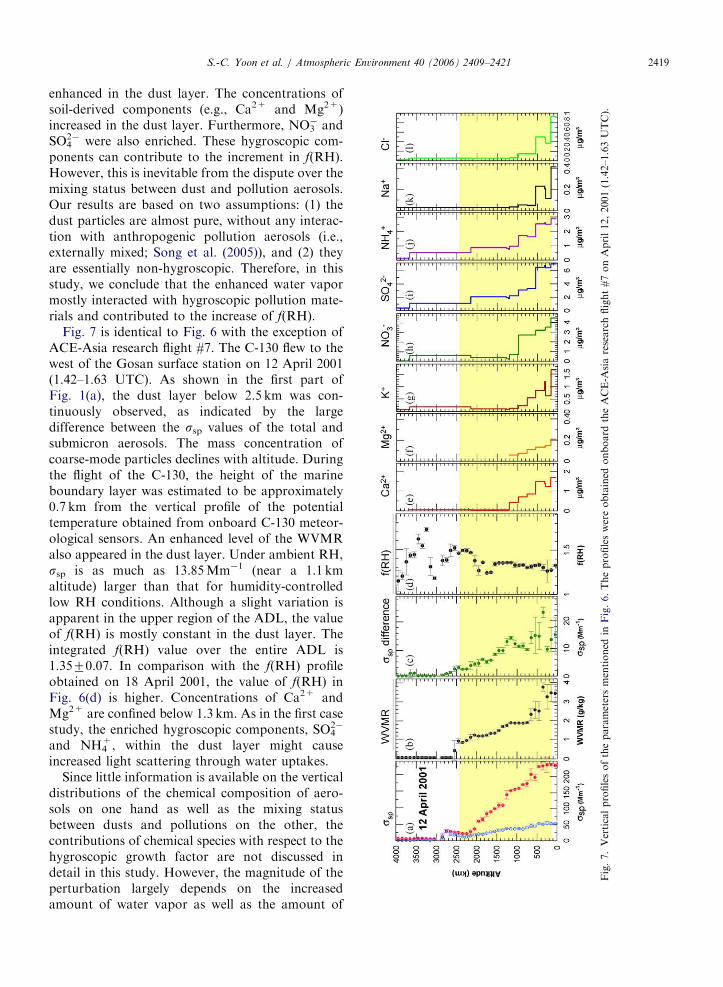
Fig.7.Verticalprofilesoftheparametersmentioned
inFig.6.Theprofileswereobtained
onboard
theACE-A
siaresearchflight#7onApril12,2001(1.42–1.63UTC).
S.-C. Yoon et al. / Atmospheric Environment 40 (2006) 2409–2421 2419
enhanced in the dust layer. The concentrations ofsoil-derived components (e.g., Ca2+ and Mg2+)increased in the dust layer. Furthermore, NO3
� andSO4
2� were also enriched. These hygroscopic com-ponents can contribute to the increment in f(RH).However, this is inevitable from the dispute over themixing status between dust and pollution aerosols.Our results are based on two assumptions: (1) thedust particles are almost pure, without any interac-tion with anthropogenic pollution aerosols (i.e.,externally mixed; Song et al. (2005)), and (2) theyare essentially non-hygroscopic. Therefore, in thisstudy, we conclude that the enhanced water vapormostly interacted with hygroscopic pollution mate-rials and contributed to the increase of f(RH).
Fig. 7 is identical to Fig. 6 with the exception ofACE-Asia research flight #7. The C-130 flew to thewest of the Gosan surface station on 12 April 2001(1.42–1.63 UTC). As shown in the first part ofFig. 1(a), the dust layer below 2.5 km was con-tinuously observed, as indicated by the largedifference between the ssp values of the total andsubmicron aerosols. The mass concentration ofcoarse-mode particles declines with altitude. Duringthe flight of the C-130, the height of the marineboundary layer was estimated to be approximately0.7 km from the vertical profile of the potentialtemperature obtained from onboard C-130 meteor-ological sensors. An enhanced level of the WVMRalso appeared in the dust layer. Under ambient RH,ssp is as much as 13.85Mm�1 (near a 1.1 kmaltitude) larger than that for humidity-controlledlow RH conditions. Although a slight variation isapparent in the upper region of the ADL, the valueof f(RH) is mostly constant in the dust layer. Theintegrated f(RH) value over the entire ADL is1.3570.07. In comparison with the f(RH) profileobtained on 18 April 2001, the value of f(RH) inFig. 6(d) is higher. Concentrations of Ca2+ andMg2+ are confined below 1.3 km. As in the first casestudy, the enriched hygroscopic components, SO4
2�
and NH4+, within the dust layer might cause
increased light scattering through water uptakes.Since little information is available on the vertical
distributions of the chemical composition of aero-sols on one hand as well as the mixing statusbetween dusts and pollutions on the other, thecontributions of chemical species with respect to thehygroscopic growth factor are not discussed indetail in this study. However, the magnitude of theperturbation largely depends on the increasedamount of water vapor as well as the amount of
ARTICLE IN PRESSS.-C. Yoon et al. / Atmospheric Environment 40 (2006) 2409–24212420
hygroscopic aerosols within the dust layer. There-fore, in further studies, the entrainment process ofwater vapor into the ADL must be paralleled withan incursion mechanism of anthropogenic pollutionaerosol into the ADL.
4. Summary and conclusion
In this study, we investigated the entrainmentprocess of water vapor into the Asian dust layer,and examined the effect of enhanced water vaporwithin this layer on the hygroscopic properties ofaerosol.
The enhanced levels of water vapor within thedust layer were simulated for two Asian dust caseswith high dust loading. The first case is a dustepisode that occurred in April 2001, and the other isa major dust event that occurred in April 1998. Thesimulations were performed by the NCAR/PSUMM5 together with a backward air trajectory modelusing radiosonde data and remotely sensed aerosolvertical distribution data. The results reveal that theWVMR derived by the MM5 was consistent withthe WVMR measured by radiosonde, and was wellcoincided with the aerosol extinction coefficient(sep) measured by the MPL. The temporal evolutionof the vertical distributions of WVMR and sepexhibited similar features. On the basis of a goodsimulation result of the enhanced water vaporwithin the dust layer by the MM5, we trace thedust storms to examine the entrainment mechanism.The enhancement of WVMR within the ADL wasinitiated over the mountainous area: Loess Plateauand its peripheral region. The relatively moist airmass in the well-developed mixing layer over themountainous area was advected upward from theboundary layer with dust particles by an ascendingmotion. However, a large percentage of the watervapor within the dust layer was enhanced over theedge of a highland and the plains in China. Thisresult was confirmed by the vertical cross sectionalanalysis of the simulated WVMR and the windvectors.
We investigated the effect of the enhanced watervapor on the aerosol hygroscopic properties byusing aircraft-based in situ measurements of thechemical and optical properties of aerosol obtainedduring the ACE-Asia field campaign. The submi-cron aerosol accompanied by the dust storm causedan increase of aerosol light scattering through wateruptakes during the transport. The aerosol lightscattering coefficient at ambient relative humidity
increased by approximately 5% of the observedtotal ssp both in the two cases considered in thisstudy. This increase could be explained by thechemical fact that the water-soluble submicronpollution aerosols are enhanced in the dust layer.
Since little information is available on the verticaldistributions of chemical and optical properties ofaerosol on one hand as well as atmospheric watervapor along the dust transport route on the other,the contributions of chemical species on the hygro-scopic growth factor are not discussed in detail inthis study. However, the results of this study will aidin understanding the mixing status of mineral dust,hygroscopic pollution aerosols, and water vapor,the associated optical and radiative properties, andchemical transport modeling. In particular, theresults will be useful for examining the physicaland chemical interaction between water vapor andwater-soluble aerosol and dust particles.
Acknowledgements
This research was supported by the Brain Korea21 program of SEES/SNU and the Climate Envir-onment System Research Center sponsored by theSRC program, and the International CooperationResearch Program of the Ministry of Science &Technology. We are grateful to Dr. Lim-SeokChang (BNL) for providing the model data.
References
Anderson, T.L., Masonis, S.J., Covert, D.S., Ahlquist, N.C.,
Howell, S.G., Clarke, A.D., McNaughton, C.S., 2003.
Variability of aerosol optical properties derived from in situ
aircraft measurements during ACE-Asia. Journal of Geophy-
sical Research 108 (D23), 8647.
Anthes, R.A., Warner, T.T., 1978. Development of hydrody-
namic models suitable for air pollution and other mesome-
teorological studies. Monthly Weather Review 106,
1045–1078.
Briegleb, B.P., 1992. Delta-Eddington approximation for solar
radiation in the NCAR community climate model. Journal of
Geophysical Research 97, 7603–7612.
Carmichael, G.R., et al., 2003. Regional-scale chemical transport
modeling in support of intensive field experiments: overview
and analysis of the TRACE-P observations. Journal of
Geophysical Research 108 (D21), 8823.
Chang, L.-S., Park, S.-U., 2004. Direct radiative forcing due to
anthropogenic aerosols in East Asia during April 2001.
Atmospheric Environment 38, 4467–4482.
Clarke, A., et al., 2004. Size distribution and mixture of dust and
black carbon aerosol in Asian outflow: physiochemistry and
optical properties. Journal of Geophysical Research 109,
D15S09.
ARTICLE IN PRESSS.-C. Yoon et al. / Atmospheric Environment 40 (2006) 2409–2421 2421
Draxler, R.R., Rolph, G.D., 2003. HYSPLIT (HYbrid Single-
Particle Lagrangian Integrated Trajectory) Model access via
NOAA ARL READY Website (http://www.arl.noaa.gov/
ready/hysplit4.html). NOAA Air Resources Laboratory,
Silver Spring, MD.
Dudhia, J., 1989. Numerical Study of convection observed during the
winter monsoon experiment using a Mesoscale two-dimensional
model. Journal of Atmospheric Science 46, 3077–3107.
Dudhia, J., 1993. A nondrostatic version of the Penn State-
NCAR mesoscale model: validation test and simulation of an
Atlantic cyclone and cold front. Monthly Weather Review
121, 1493–1513.
Gong, S.L., Zhang, X.Y., Zhao, T.L., McKendry, I.G., Jaffe,
D.A., Lu, N.M., 2003. Characterization of soil dust aerosol in
China and its transport and distribution during 2001 ACE-
Asia: 2. Model simulation and validation. Journal of
Geophysical Research 108, 4262.
Grell, G.A., 1993. Prognostic evaluation of assumptions used by
cumulus parameterizations. Monthly Weather Review 121,
764–787.
Grell, G.A., Dudhia, J., Stauffer, D.R., 1994. A description of the
fifth-generation Penn State/NCAR mesoscale model (MM5),
NCAR Tech. note NCAR/TN-398+STR, Natl. Cent. for
Atmos. Res., Boulder, CO, 122pp.
Hong, S.-Y., Pan, H.-L., 1996. Nonlocal boundary layer vertical
diffusion in a medium-range forecast model. Monthly Weath-
er Review 124, 2322–2339.
Huebert, B.J., Bates, T., Russell, P.B., Shi, G., Kim, Y.J.,
Kawamura, K., Carmichael, G., Nakajima, T., 2003. An
overview of ACE-Asia: strategies for quantifying the relation-
ships between Asian aerosols and their climatic impacts.
Journal of Geophysical Research 108 (D23), 8633.
Husar, R.B., et al., 2001. Asian dust events of April 1998. Journal
of Geophysical Research 106, 18317–18330.
Iwasaka, Y., Minoura, H., Nagaya, K., 1983. The transport and
spatial scale or Asian dust-storm clouds: a case study of the
dust-storm event of April 1979. Tellus B 35, 189–196.
Kalnay, E., et al., 1996. The NCEP/NCAR 40-year reanalysis
project. Bull. Amer. Meteor. Soc. 77, 437–472.
Kim, S.-W., Yoon, S.-C., Jefferson, A., Won, J.-G., Dutton,
E.G., Ogren, J.A., Anderson, T.L., 2004. Observation of
enhanced water vapor in Asian dust layer and its effect on
atmospheric radiative heating rates. Geophysical Research
Letters 31, L18113.
Kim, S.-W., Yoon, S.-C., Jefferson, A., Ogren, J.A., Dutton,
E.G., Won, J.-G., Ghim, Y.S., Lee, B.-I., Han, J.-S., 2005.
Aerosol optical, chemical and physical properties at Gosan,
Korea during Asian Dust and Pollution Episodes in 2001.
Atmospheric Environment 39, 39–50.
Liu, X., Yin, Z.-Y., Zhang, X., Yang, X., 2004. Analyses of the
spring dust storm frequency of northern China in relation to
antecedent and concurrent wind, precipitation, vegetation,
and soil moisture conditions. Journal of Geophysical Re-
search 109, D16210.
Maxwell-Meier, K., Weber, R., Song, C., Orsini, D., Ma, Y.,
Carmichael, G.R., Streets, D.G., 2004. Inorganic composition
of fine particles in mixed mineral dust—pollution plumes
observed from airborne measurements during ACE-Asia.
Journal of Geophysical Research 109, D19S07.
Murayama, T.N., Sugimoto, U.K., Hagiwara, N., Liu, Z.,
Matsui, I., Sakai, T., Shibata, T., Arao, K., Sohn, B.J.,
Won, J.G., Yoon, S.-C., 2001. Ground-based network
observation of Asian dust events of April 1998 in East Asia.
Journal of Geophysical Research 106, 18345–18360.
Nakajima, T., Sekiguchi, M., Takemura, T., Uno, I., Higurashi,
A., Kim, D., Sohn, B-.J., Oh, S-.N., Nakajima, T.Y., Ohta,
S., Okada, I., Takamura, T., Kawamoto, K., 2003. Signifi-
cance of direct and indirect radiative forcings of aerosols in
the East China Sea region. Journal of Geophysical Research
108, 8658.
Parrish, D.D., Kondo, Y., Cooper, O.R., Brock, C.A., Jaffe,
D.A., Trainer, M., Ogawa, T., Hubler, G., Fehsenfeld, F.C.,
2004. Intercontinental Transport and Chemical Transforma-
tion 2002 (ITCT 2K2) and Pacific Exploration of Asian
Continental Emission (PEACE) experiments: an overview of
the 2002 winter and spring intensives. Journal of Geophysical
Research 109, D23S01.
Seinfeld, J.H., et al., 2004. ACE-ASIA: regional climatic and
atmospheric chemical effects of Asian dust and pollution.
Bulletin of the American Meteorological Society 85 (3),
367–380.
Smith, T.M., Reynolds, R.W., 1998. A high-resolution global sea
surface temperature climatology for the 1961–90 base period.
Journal of Climate 11, 3320–3323.
Song, C.H., Maxwell-Meier, K., Weber, R.J., Kapustin, V.,
Clarke, A., 2005. Dust composition and mixing state inferred
from airborne composition measurements during ACE-Asia
C130 Flight #6. Atmospheric Environment 39, 359–369.
Topping, D., Coe, H., McFiggans, G., Burgess, R., Allan, J.,
Alfarra, M.R., Bower, K., Choularton, T.W., Decesari, S.,
Facchim, M.C., 2004. Aerosol chemical characteristics from
sampling conducted on the Island of Jeju, Korea during ACE
Asia. Atmospheric Environment 38, 2111–2123.
Weber, R.J., Orsini, D., Duan, Y., Lee, Y.-N., Klotz, P.J.,
Brechtel, F., 2001. A particle-into-liquid collector for rapid
measurement of aerosol bulk chemical composition. Aerosol
Science and Technology 35, 718–727.
Won, J.-G., Yoon, S.-C., Kim, S.-W., Jefferson, A., Dutton,
E.G., Holben, B., 2004. Estimation of direct radiative forcing
of Asian dust aerosols with sun/sky radiometer and lidar
measurements at Gosan, Korea. Journal of the Royal
Meteorological Society Japan 82, 115–130.
Yoon, S.-C., Won, J.-G., Kim, S.-W., 2001. Ground-based
micro-pulse lidar monitoring of aerosols at Gosan during
ACE-Asia IOP, 1ST ACE-Asia Data Workshop. California
Institute of Technology, Pasadena, CA, USA Nov. 29–Dec. 1.
Zhang, X.Y., Gong, S.L., Shen, Z.X., Mei, F.M., Xi, X.X.,
Liu, L.C., Zhou, Z.J., Wang, D., Wang, Y.Q., Cheng, Y.,
2003. Characterization of soil dust aerosol in China
and its transport and distribution during 2001 ACE-Asia: 1.
Network observations. Journal of Geophysical Research
108 (D9).
Top Related
Copyright © 2022 FDOKUMEN

