


Bahasa
Halaman
Hukum

Energy & Financial Market Services
Altametric LLC Page 1 [email protected]
The Importance of Liquidity and Transparency in the Uranium Market
Friday, May 22, 2009 Antonio Anselmo
Altametric, LLC
WNFM Conference 2009
Introduction The uranium market currently functions sub-optimally. This is particularly evident when sellers really need buyers. This is a chronic and debilitating problem during periods of market weakness. Weak markets like the one we just experienced.
Transaction Costs
What is the importance of market liquidity? Why do we even care about transparency? Why do efficient markets even matter?
Many economists have been working on this problem for a long time. Coase, Fama, Engel to name a few. In the end, it all comes down to cost. More specifically, what it costs all market participants to transact in a specific market in comparison to other markets. We all know buying uranium is a lot more difficult than buying silver. But should it be?
Transaction costs include waiting costs, market making costs, pricing determination costs and ticket costs. We will just discuss the first three in this talk.
Waiting Costs – these are the asymmetric costs either buyers or sellers suffer when waiting to transact. A simple example is the time you lose in the grocery store line. In the uranium market, the waiting costs can be measured by comparing illiquid forms of uranium against more liquid forms. Currently, we estimate that the distribution of relative waiting costs has a mean spread from zero of about 11.7%.
Market Making Cost – these cost are reflected in the bid-ask spread in the market. The market maker takes this spread as compensation for their willingness to transact. The wider the bid ask spread, the higher the transaction costs. The bid ask spread is also related to market uncertainty. In more volatile markets, the bid ask spread widens. Market making costs are born by the price takers. Currently, we estimate the single day volatility of the uranium spot market to be about 4.7%. For silver, this is about 2.4%.
Opacity Costs – These are costs associated with market intelligence and valuation technology. In markets with very little transparency and complex assets, these cost tend to be high. Currently, we estimate that market opacity could create up to a 12% error in pricing uranium,
Liquidity and Transparency
Creating a liquid and transparent market that will reduce these costs is a difficult, but a necessary task.
Energy & Financial Market Services
Altametric LLC Page 2 [email protected]
Difficult tasks all carry the same hallmarks. Most say the status quo is bad, but more would say why change? No one wants to be first. Moreover, many institutions have no desire to even measure the rewards created by these efforts.
“Tough problems are just another mountain to be climbed”
The Uranium Spot Market Is: Illiquid, Opaque, Fragile and Remote.
Should We Create Something Better?
Liquidity - The probability of selling a specific quantity at a specific price in a specific amount of time.
In other words, the key to market liquidity is the presence of willing buyers. Without buyers, there is no liquidity. For example, the NYNCO Expert’s poll only measures the need to purchase, not the need to sell, because buyers set liquidity levels. Market liquidity only exists when sellers locate hedgers, investors or speculators. No buyers, no liquidity.
Transparency - The ratio of public market information to all market information at a given time.
Market transparency is a necessary condition for market liquidity. A transparent market means that buyers and sellers are exposed quickly to transaction data.
You can have dark pools of liquidity. Capital pools where only a select group of participants operate. Although not all buyers and sellers have access to this type of market, the participants that do are exposed to large amounts of data.
Energy & Financial Market Services
Altametric LLC Page 3 [email protected]
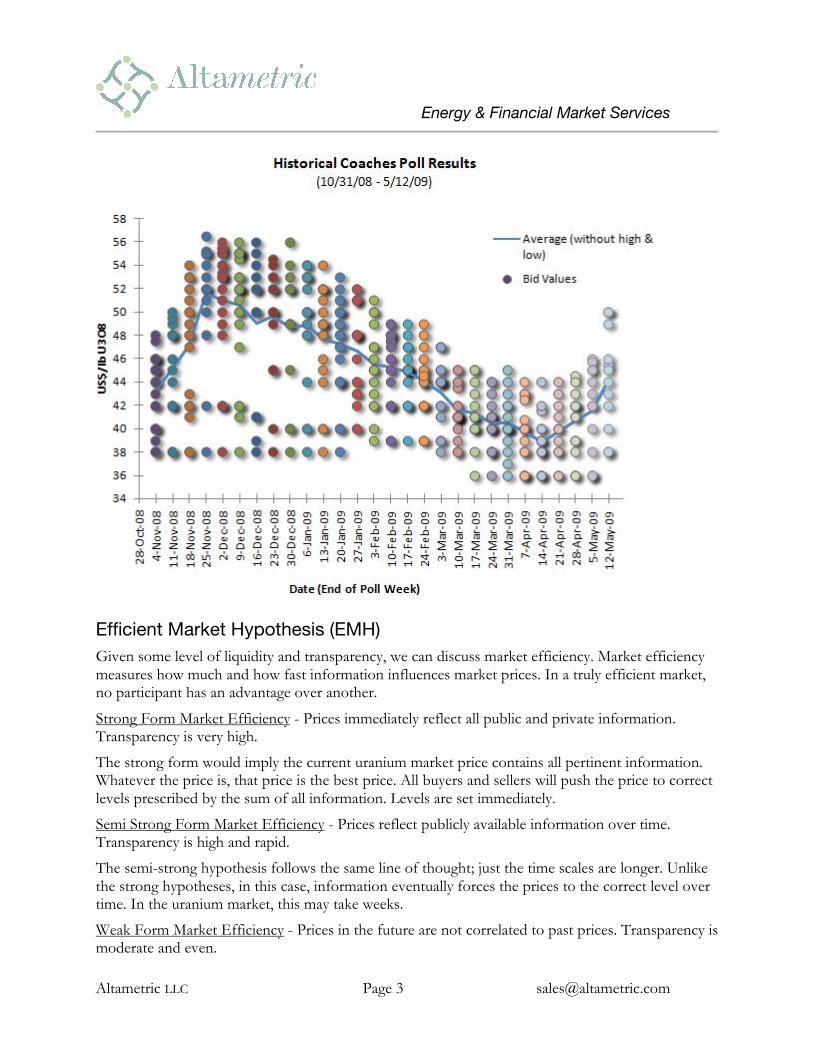
Efficient Market Hypothesis (EMH) Given some level of liquidity and transparency, we can discuss market efficiency. Market efficiency measures how much and how fast information influences market prices. In a truly efficient market, no participant has an advantage over another.
Strong Form Market Efficiency - Prices immediately reflect all public and private information. Transparency is very high.
The strong form would imply the current uranium market price contains all pertinent information. Whatever the price is, that price is the best price. All buyers and sellers will push the price to correct levels prescribed by the sum of all information. Levels are set immediately.
Semi Strong Form Market Efficiency - Prices reflect publicly available information over time. Transparency is high and rapid.
The semi-strong hypothesis follows the same line of thought; just the time scales are longer. Unlike the strong hypotheses, in this case, information eventually forces the prices to the correct level over time. In the uranium market, this may take weeks.
Weak Form Market Efficiency - Prices in the future are not correlated to past prices. Transparency is moderate and even.
Energy & Financial Market Services
Altametric LLC Page 4 [email protected]
The weak form adheres to a slightly different thesis. The markets, in this case, never reach equilibrium. A dynamic, Brownian process pushes prices in the right direction, eventually. More importantly, past prices have no influence on future prices, minimizing any auto-correlation effects. In other words, you can’t make money following trends.
Basic Microstructure
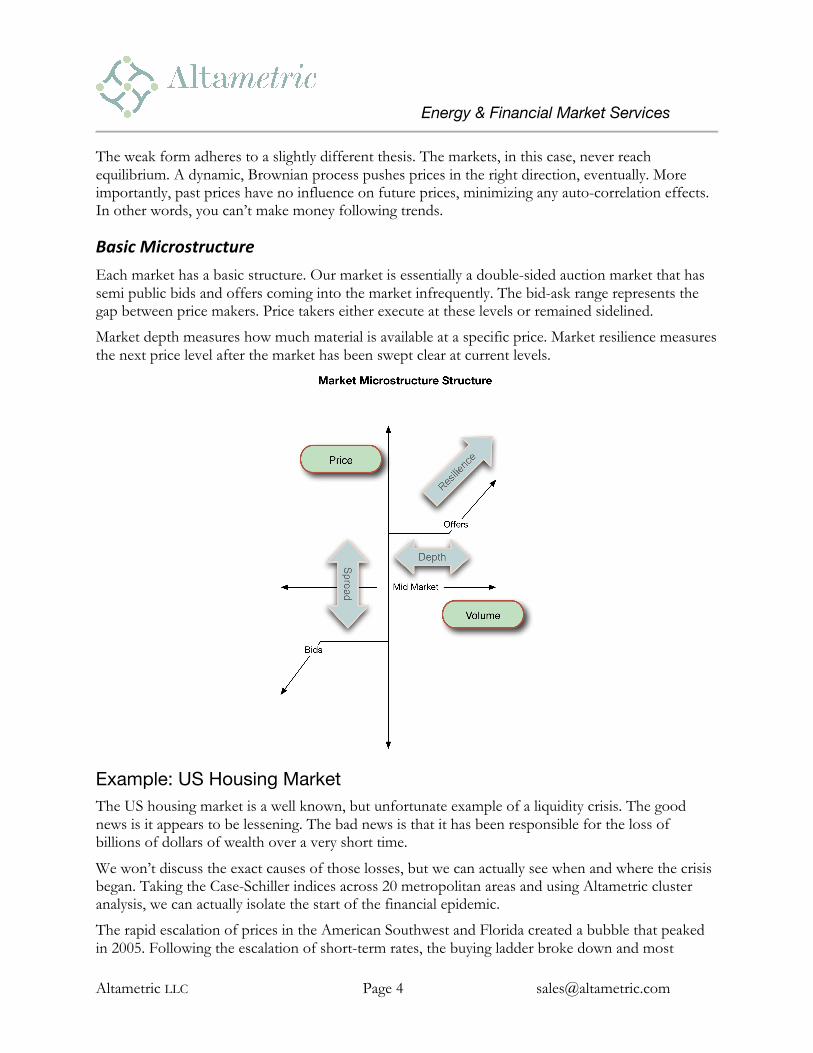
Each market has a basic structure. Our market is essentially a double-sided auction market that has semi public bids and offers coming into the market infrequently. The bid-ask range represents the gap between price makers. Price takers either execute at these levels or remained sidelined.
Market depth measures how much material is available at a specific price. Market resilience measures the next price level after the market has been swept clear at current levels.
Example: US Housing Market The US housing market is a well known, but unfortunate example of a liquidity crisis. The good news is it appears to be lessening. The bad news is that it has been responsible for the loss of billions of dollars of wealth over a very short time.
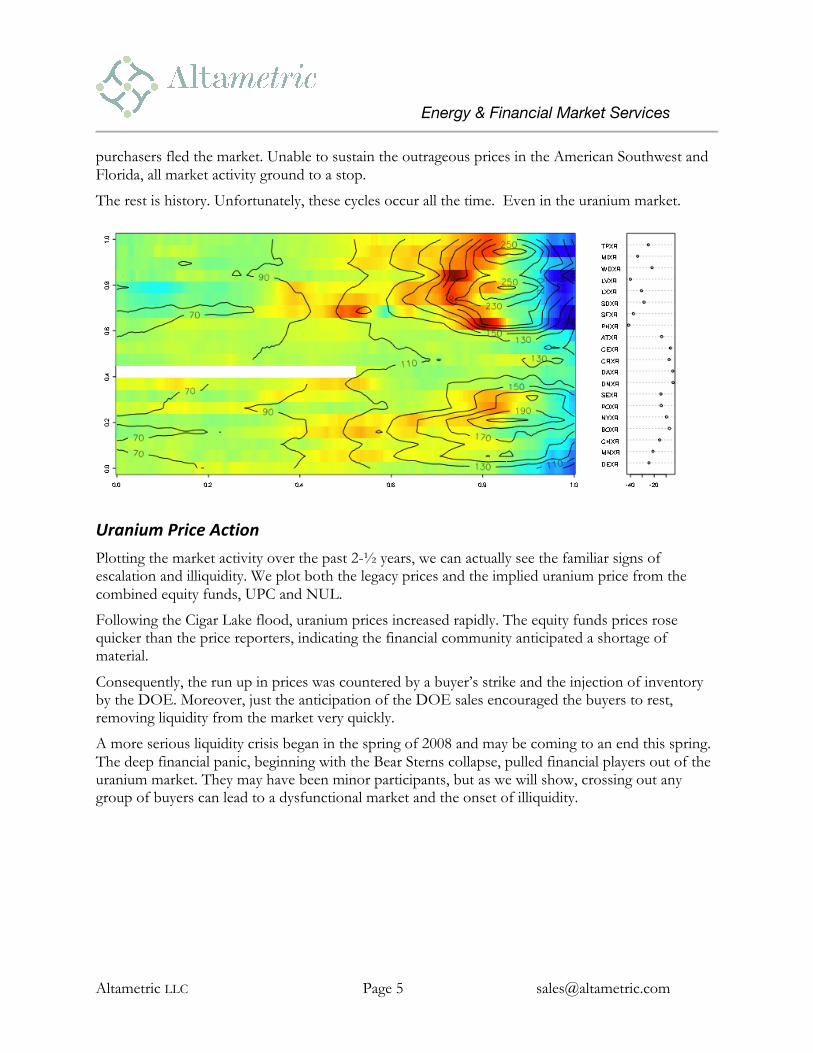
We won’t discuss the exact causes of those losses, but we can actually see when and where the crisis began. Taking the Case-Schiller indices across 20 metropolitan areas and using Altametric cluster analysis, we can actually isolate the start of the financial epidemic.
The rapid escalation of prices in the American Southwest and Florida created a bubble that peaked in 2005. Following the escalation of short-term rates, the buying ladder broke down and most
Energy & Financial Market Services
Altametric LLC Page 5 [email protected]
purchasers fled the market. Unable to sustain the outrageous prices in the American Southwest and Florida, all market activity ground to a stop.
The rest is history. Unfortunately, these cycles occur all the time. Even in the uranium market.
Uranium Price Action
Plotting the market activity over the past 2-½ years, we can actually see the familiar signs of escalation and illiquidity. We plot both the legacy prices and the implied uranium price from the combined equity funds, UPC and NUL.
Following the Cigar Lake flood, uranium prices increased rapidly. The equity funds prices rose quicker than the price reporters, indicating the financial community anticipated a shortage of material.
Consequently, the run up in prices was countered by a buyer’s strike and the injection of inventory by the DOE. Moreover, just the anticipation of the DOE sales encouraged the buyers to rest, removing liquidity from the market very quickly.
A more serious liquidity crisis began in the spring of 2008 and may be coming to an end this spring. The deep financial panic, beginning with the Bear Sterns collapse, pulled financial players out of the uranium market. They may have been minor participants, but as we will show, crossing out any group of buyers can lead to a dysfunctional market and the onset of illiquidity.

Energy & Financial Market Services
Altametric LLC Page 6 [email protected]
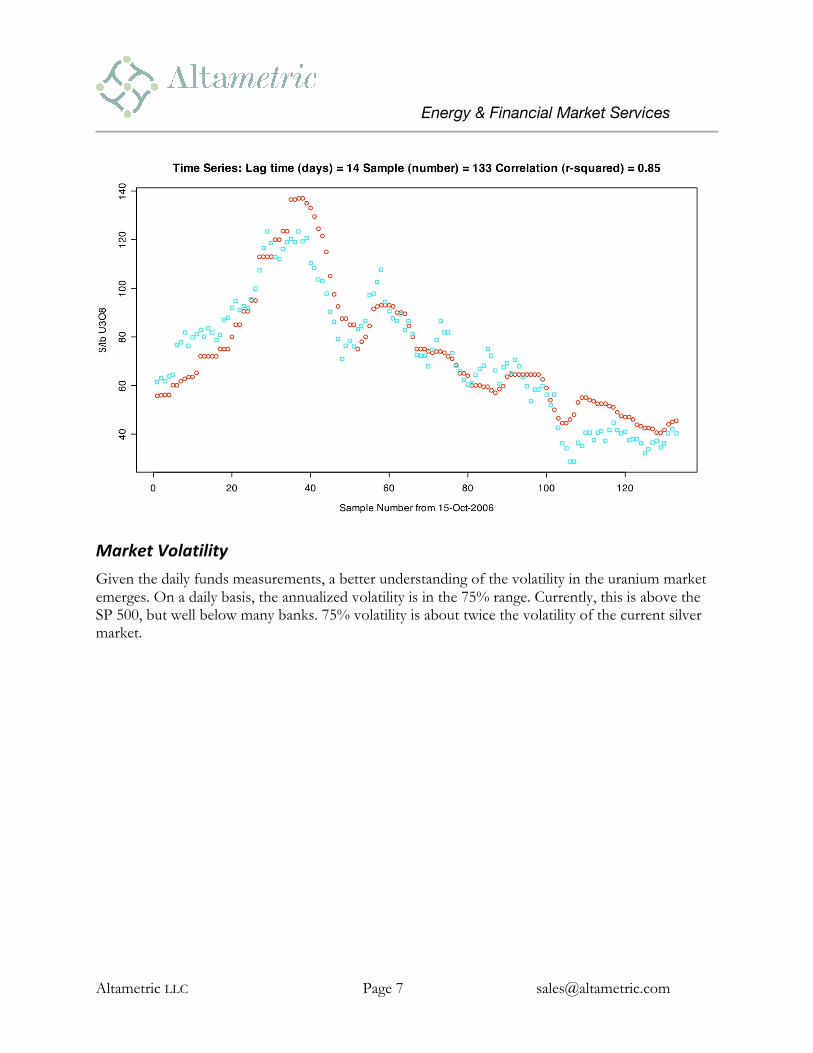
Correlation Between the Physical and Financial Market When we examine market liquidity, we like to look at both the physical market and the financial proxy to that market.
Clearly there is strong correlation between the two markets. The question is how much?
It turns out if you shift the curve by about 1 to 3 weeks; the R-squared correlation between the 2 markets is about 86%. The test for hedge accounting according to FASB 133 is a 2-year period of R-squared correlation between underlying and hedging instrument measured in a range of 80% to 100%. In this case, the correlation between the BFV and the physical market is about 86%.
Energy & Financial Market Services
Altametric LLC Page 7 [email protected]
Market Volatility
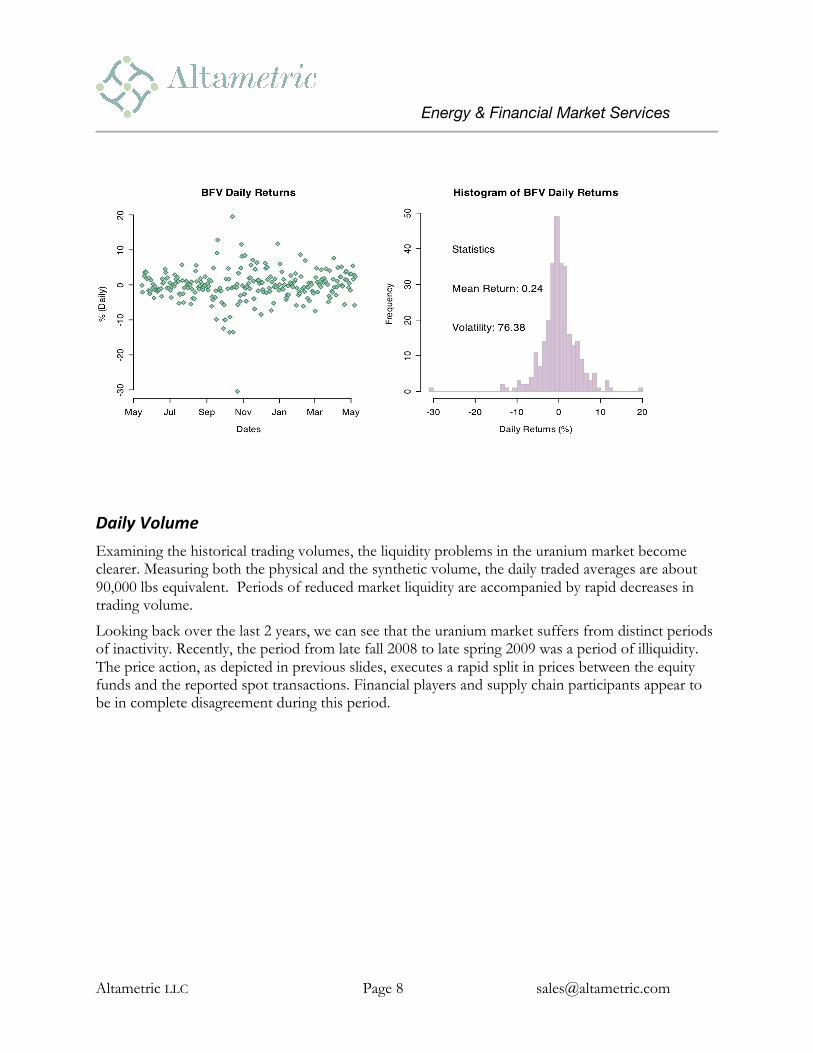
Given the daily funds measurements, a better understanding of the volatility in the uranium market emerges. On a daily basis, the annualized volatility is in the 75% range. Currently, this is above the SP 500, but well below many banks. 75% volatility is about twice the volatility of the current silver market.
Energy & Financial Market Services
Altametric LLC Page 8 [email protected]
Daily Volume
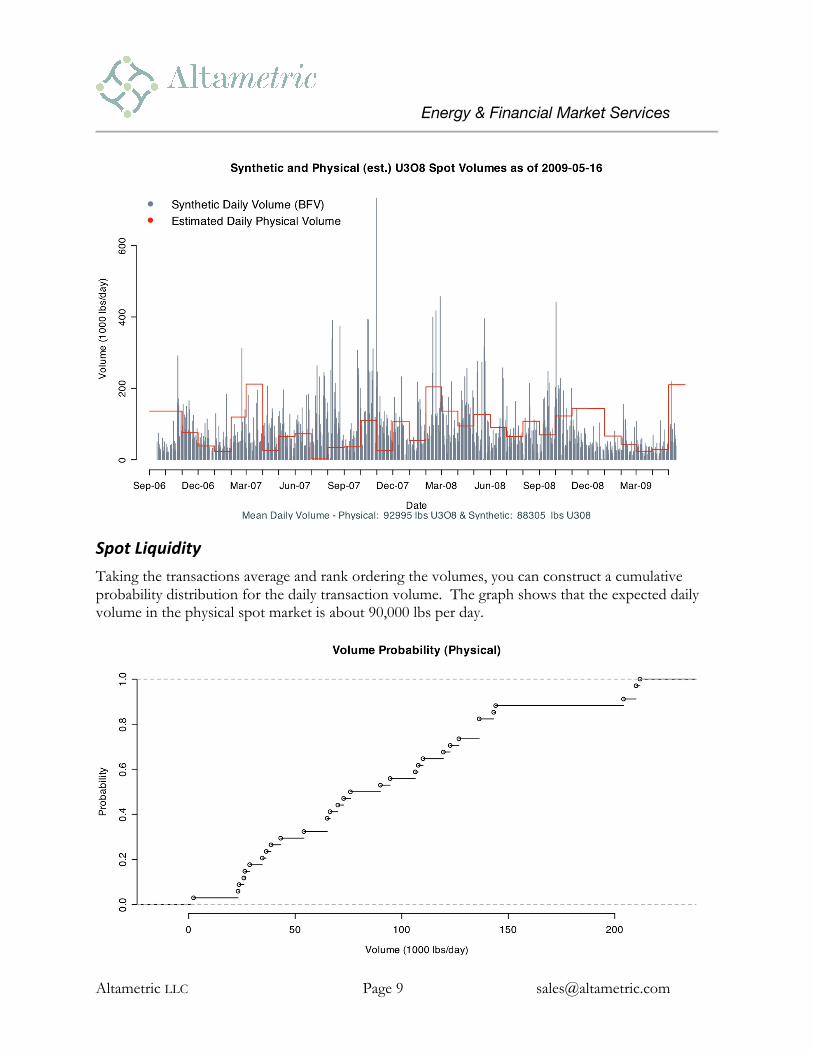
Examining the historical trading volumes, the liquidity problems in the uranium market become clearer. Measuring both the physical and the synthetic volume, the daily traded averages are about 90,000 lbs equivalent. Periods of reduced market liquidity are accompanied by rapid decreases in trading volume.
Looking back over the last 2 years, we can see that the uranium market suffers from distinct periods of inactivity. Recently, the period from late fall 2008 to late spring 2009 was a period of illiquidity. The price action, as depicted in previous slides, executes a rapid split in prices between the equity funds and the reported spot transactions. Financial players and supply chain participants appear to be in complete disagreement during this period.
Energy & Financial Market Services
Altametric LLC Page 9 [email protected]
Spot Liquidity
Taking the transactions average and rank ordering the volumes, you can construct a cumulative probability distribution for the daily transaction volume. The graph shows that the expected daily volume in the physical spot market is about 90,000 lbs per day.
Energy & Financial Market Services
Altametric LLC Page 10 [email protected]
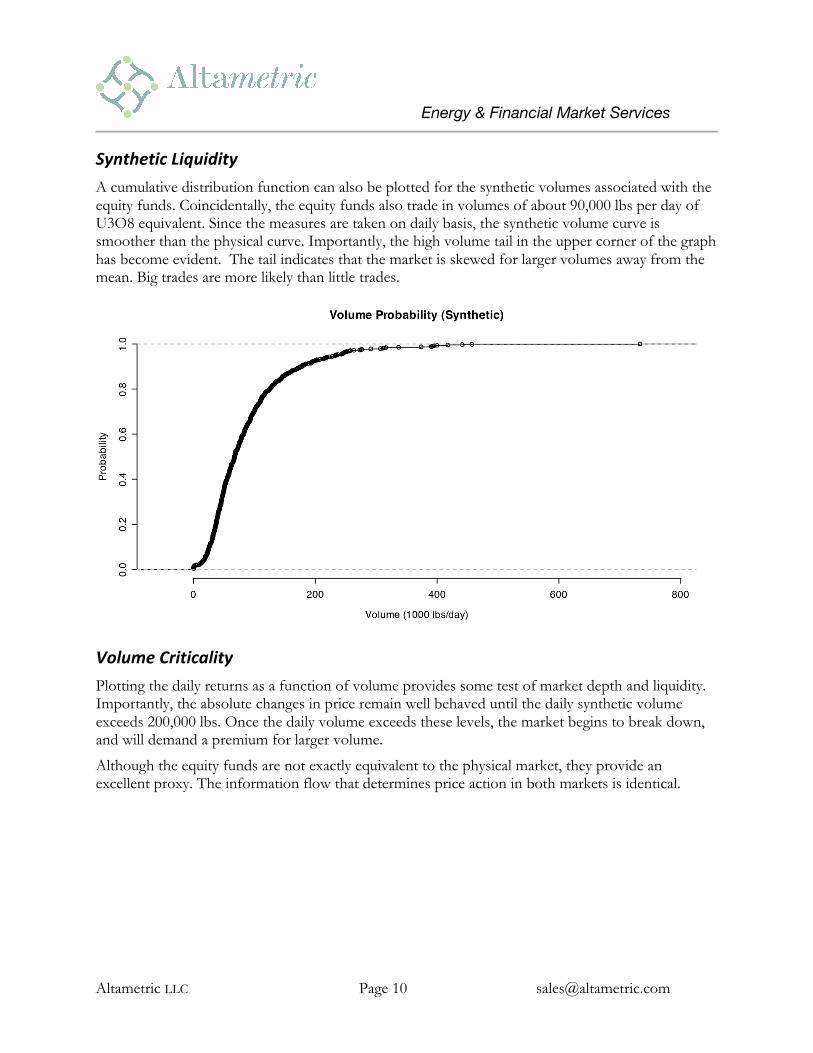
Synthetic Liquidity
A cumulative distribution function can also be plotted for the synthetic volumes associated with the equity funds. Coincidentally, the equity funds also trade in volumes of about 90,000 lbs per day of U3O8 equivalent. Since the measures are taken on daily basis, the synthetic volume curve is smoother than the physical curve. Importantly, the high volume tail in the upper corner of the graph has become evident. The tail indicates that the market is skewed for larger volumes away from the mean. Big trades are more likely than little trades.
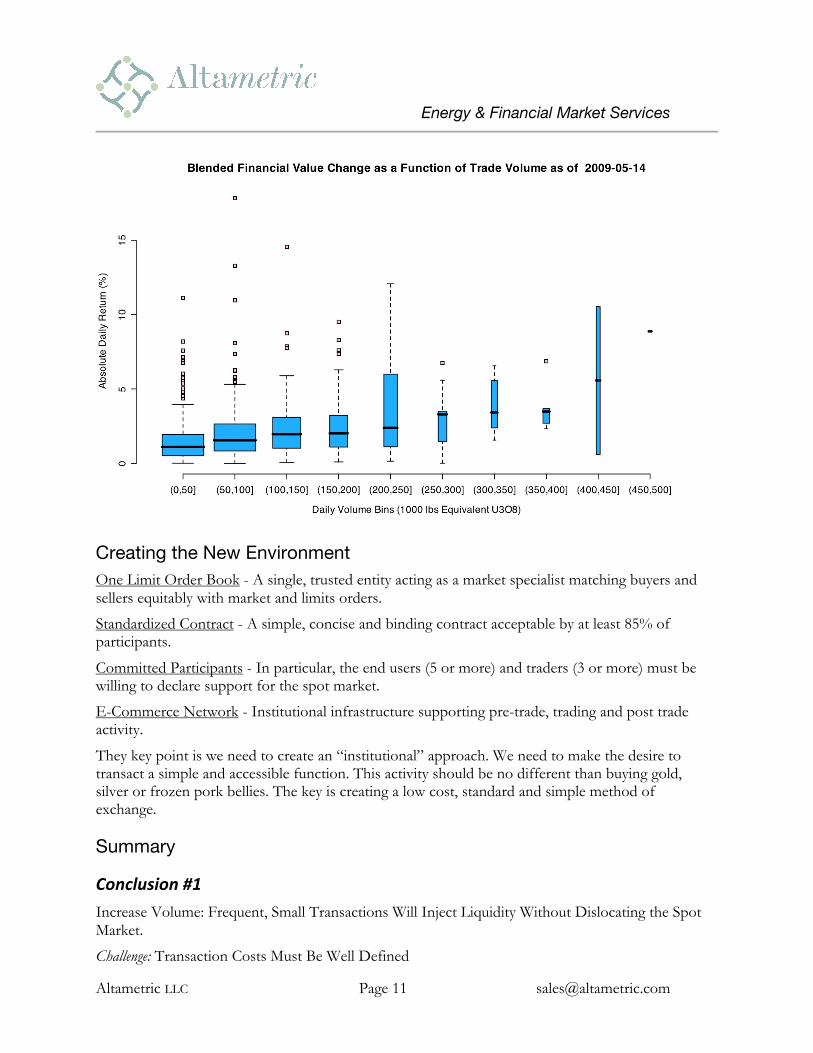
Volume Criticality
Plotting the daily returns as a function of volume provides some test of market depth and liquidity. Importantly, the absolute changes in price remain well behaved until the daily synthetic volume exceeds 200,000 lbs. Once the daily volume exceeds these levels, the market begins to break down, and will demand a premium for larger volume.
Although the equity funds are not exactly equivalent to the physical market, they provide an excellent proxy. The information flow that determines price action in both markets is identical.
Energy & Financial Market Services
Altametric LLC Page 11 [email protected]
Creating the New Environment One Limit Order Book - A single, trusted entity acting as a market specialist matching buyers and sellers equitably with market and limits orders.
Standardized Contract - A simple, concise and binding contract acceptable by at least 85% of participants.
Committed Participants - In particular, the end users (5 or more) and traders (3 or more) must be willing to declare support for the spot market.
E-Commerce Network - Institutional infrastructure supporting pre-trade, trading and post trade activity.
They key point is we need to create an “institutional” approach. We need to make the desire to transact a simple and accessible function. This activity should be no different than buying gold, silver or frozen pork bellies. The key is creating a low cost, standard and simple method of exchange.
Summary
Conclusion #1
Increase Volume: Frequent, Small Transactions Will Inject Liquidity Without Dislocating the Spot Market.
Challenge: Transaction Costs Must Be Well Defined
Energy & Financial Market Services
Altametric LLC Page 12 [email protected]
These include waiting costs bid-ask spreads, entry costs and ticket cost.
Once the costs are clear, the planners and moneymen will encourage market participation. Without these costs defined, the uranium market will remain remote. As we saw last year, financial hedgers and speculators add liquidity.
Either through the mining companies, equity funds or the futures market, added capital and the willingness to buy is always welcome to the market.
Conclusion #2
Increase Participation: Price Makers and Price Takers Must Be Active at All Market Price Levels.
Challenge: Participants Must Be Openly Committed.
These include, in order of impact, Utilities, Traders, Financials Institutions and Producers.
Again, we need to institutionalize participation. We need to create a virtuous cycle, not a vicious one.
Like the proverbial mountain in our narrative, solving a difficult problem requires good choices and a strong desire. The goal is simple, but the execution requires commitment from all. In the end, liquidity and transparency will only improve when buyers are always present and willing to disclose what they bought and at what price.
In closing, we need to create a virtuous cycle, where volume drives up liquidity and reduces transaction costs.
The Most Advanced Energy Source Should Have the Best Functioning Fuel Market.
It Can Be Done.
Energy & Financial Market Services
Altametric LLC Page 13 [email protected]
About Altametric, LLC Altametric, LLC was started in 2005. The company serves customers in the financial services and energy sector. The company provides world-class analysis, financial engineering and systems for middle market companies.
Principal: Antonio Anselmo
A. P. Anselmo worked for 12 years at J.P. Morgan Chase in the Financial Engineering and Electronic Commerce groups in the Investment Bank. Prior to this, he was a Scientist at Varian Associates for 4 years. He holds M.B.A. from the Amos Tuck School at Dartmouth College and a B.Sc., M. Eng. and Ph.D. from Cornell University. Dr. Anselmo was named and Edward Tuck Scholar at Dartmouth and was awarded a Teagle Fellowship for research while at Cornell.
Top Related
Copyright © 2022 FDOKUMEN

