


Bahasa
Halaman
Hukum


land degradation & development
Land Degrad. Develop. 21: 132–138 (2010)
Published online 31 March 2009 in Wiley InterScience (www.interscience.wiley.com) DOI: 10.1002/ldr.917
EFFECTS OF SOIL-PROTECTING AGRICULTURAL PRACTICES ON SOILORGANIC CARBON AND PRODUCTIVITY IN FRUIT TREE ORCHARDSy
G. MONTANARO*, G. CELANO, B. DICHIO AND C. XILOYANNIS
Department of Crop Systems, Forestry and Environmental Sciences, University of Basilicata, 85100 Potenza, Italy
Received 19 September 2008; Revised 8 January 2009; Accepted 13 February 2009
ABSTRACT
This 4-year on-farm study reports the effects of different agricultural practices on yield and soil organic carbon (SOC) in kiwifruit and apricotorchards grown in a Mediterranean area. Groups of plants under local orchard management (LOM,x) practices (i.e. soil tillage, removing ofpruning residues and mineral fertilisers) were compared with plots under soil-protecting orchard management (SPOM) actions (i.e. cover crop,no-tillage, compost application and mulching of pruning residues). In the SPOM blocks fertilisation rate was based on plant demand andirrigation volumes calculated on the evapotranspiration values, while they were empirically calculated in the LOM plots. Results show thatyield was 28–50 per cent enhanced by SPOM practices while SOC remained close to the initial values. In comparison with LOM plots, changedpractices increased up to 28–90 per cent the amount of P and K, and 13 per cent that of N annually incorporated into soil increasing theirreservoir in the soil. The study demonstrates that appropriate land management can increase the mean annual carbon soil inputs from about 1�5to 9�0 t ha�1 per year. Copyright # 2009 John Wiley & Sons, Ltd.
key words: crop residues; land use; organic matter; soil carbon input; SOC; Mediterranean soil; soil organic carbon
INTRODUCTION
Depletion of soil fertility is one of the major constraints to
crop production. Soil organic carbon (SOC) is widely
associated with soil fertility status. Although there is no firm
evidence of a critical threshold for SOC below which
fertility is compromised (productivity is depressed, soil
becomes physically instable and prone to erosion) the lower
limit of about 2 per cent SOC has been reported to avoid
significant structural deterioration of soil and to sustain
yields at about 90–95 per cent of the maximum, assuming
sufficient supplies of inorganic fertilisers (see Loveland and
Webb, 2003 for review). In modern agricultural production
systems inputs are increased to adequately compensate for
yield reductions due to SOC decline (Reeves, 1997).
However, maintaining or improving agricultural pro-
ductivity by improving soil fertility is desirable and crucial
to improve soil resources for future generations.
In Mediterranean cultivated soils, intensive agricultural
practices (continuous tillage, high inputs of mineral fertilisers,
* Correspondence to: G. Montanaro, Department of Crop Systems, Forestryand Environmental Sciences, University of Basilicata, Via Ateneo Lucano,85100 Potenza, Italy.E-mail: [email protected] article was published online on 31 March 2009. An error wassubsequently identified. This notice is included in the online version toindicate that this has been corrected 2 April 2009.xCorrection made here after initial publication.
Copyright # 2009 John Wiley & Sons, Ltd.
irrigation method and application of low-quality irrigation
water, removal of pruning residues) combined with the
aggressive climate characteristics (i.e. low precipitation and
high summer air temperatures) have dramatically degraded
some soil and reduced SOC to about 1 per cent in several areas
(Trinchera et al., 1999; Bastida et al., 2006). Such poor soil
condition negatively affects a large number of soil charac-
teristics creating unfavourable soil conditions for plant
physiology and preventing achievement of high yield and
fruit quality. It is widely known that increasing SOC content
can be achieved by both increasing the carbon input by
beneficial practices (e.g. manure and organic additions,
adequate fertilisation, return of crop residues to the soil, crop
rotations and optimal fallow frequency) and that soil carbon
emission can be curtailed by reducing soil disturbance (i.e.
minimum or no tillage) (Reeves, 1997; Kong et al., 2005).
However, in some cultivated Mediterranean areas suffering
water shortages, soil tillage is currently perceived as essential
to minimise the competition for water and nutrients between
weeds and crops, reducing considerably the appeal of
conservation tillage and hampering soil fertility remediation.
Quantitative informationonbiomass inputandon thepotential
increases of the carbon stocks are available for a number of
annual crops (Lal, 1997; Oelbermann et al., 2005), but there
are relatively fewer studies published on fruit tree orchards
under improved management practices. This hinders devel-
opment of effective policies to support sustainable land use.

SOIL-PROTECTING PRACTICES IN FRUIT TREE ORCHARDS 133
Therefore, the present study was intended to quantify carbon
input in two fruit tree orchards (kiwifruit and apricot) under
soil-protecting management practices in contrast to conven-
tional ones. The hypothesis behind this work is that
improvement in soil fertility (via increasing carbon input)
enhances crop yields.
Figure 1. Monthly precipitation (mm) and potential evapotranspiration(ET0) (mm) in the study area. Data are mean of 17-year period. (Source:
Agrometeorological Service—ALSIA, Basilicata Region).
MATERIALS AND METHODS
Study Sites
This study was conducted in South Italy during four growing
seasons (2004–2007) at two private farms. Maximum annual
temperature at this region is 368C and rainfall recorded over
a 17-year period averaged 550 mm y�1 (Agrometeorological
Service, ALSIA Basilicata Region) with rains occurring
from late August until January (Figure 1). This rainfall
pattern implies a seasonal water deficit of 855 mm during the
growing season (March–September) (Figure 1). Trials were
carried out at a kiwifruit site (N 408 23’ E 168 45’) on a
Haplic Luvisols, and at a apricot orchard (N 408 08’ E 16838’) on a Haplic Revosols. Soils were classified according to
WRB, 2006. The experimental sites were 25 and 7 m above
sea level for the kiwifruit and apricot orchards, respectively,
and further details are reported in Table I.
Experimental Design
In each site, the research compared the local orchard
management (LOM) practices with a soil-protecting orchard
management (SPOM) actions (see below for details) in an
experimental area of 2 ha with three replications per
treatment. The average area of the single plot was
approximately 0�3 ha. Prior to start the experiment, in both
sites the orchards were managed according to LOM practices.
In the SPOM treatments, soil including the tree row was
left untilled and weeds were mowed to 3–4 cm height in
March, May and September. Fertilisation was based on plant
demand and on availability in the soil of the various essential
plant nutrients (Xiloyannis et al. 2001; Xiloyannis et al.
2006). The Table II reports the annual amount of N, P and K
applied in the different plots. In particular, the concentration
of N (NO�3 ) was monitored (Nitracheck1) and N distributed
via fertigation each time the concentration in the top 40 cm
of soil fell below 20 ppm. Each year in January, 15 t ha�1
Table I. Characteristics of the orchards used for the experiment
Kiwifruit orchard
Specie Actinidia deliciosa, cv HayPlanting year 1985Training system Pergola, 494 p ha�1
Irrigation method Microjet, 120 L h�1 per pla
Copyright # 2009 John Wiley & Sons, Ltd.
(fresh weight, 24�8 per cent moisture content) of compost
were distributed (22�2 C/N; Eco-Pol SpA—Italy) contain-
ing, on a dry matter basis, 2�02 per cent total N, 1�8 per cent
organic N, 1�86 per cent K2O and 0�9 per cent P2O5 (see
Table II for doses annually applied). Pruning occurred each
year (November–December) and the resulting biomass was
subsequently chipped and evenly distributed on the soil
surface as mulch.
In the LOM plots, soil was tilled including the tree row
using a 18-disc plough, 4 times per year to 10–20 cm depth.
Pruning residues were removed and burnt. The mean
annual LOM treatment fertiliser rates are reported in Table II.
Irrigationvolumes for the SPOM plotswerecalculatedon the
basis of ETo values (potential evapotranspiration) measured at
a standard meteorological station located within 500 m
(Regional Meteorological Service, ALSIA) and using specific
crop coefficient (Kc). The Kc values (May–September) were
0�9, 1�1, 1�3, 1�2, 0�8 for kiwifruit and 0�4, 0�5, 0�6, 0�3, 0�3 for
apricot. The within-irrigation interval was 3–7 days for both
species. In the LOM blocks, irrigation volumes were
determined empirically according to local commercial
practice, and the irrigation interval time was 7–10 days.
Soil and Orchard Residue Sampling and Analysis
At the beginning of this study, an initial composite soil
sample was taken in autumn across the two sites for soil
texture, N, P, K, pH and organic carbon (SOC) analysis. Nine
Apricot orchard
ward Prunus armeniaca, cv S. Castrese1985
Palmette, 740 p ha�1
nt�1 Drip, 16 L h�1 per plant�1
LAND DEGRADATION & DEVELOPMENT, 21: 132–138 (2010)
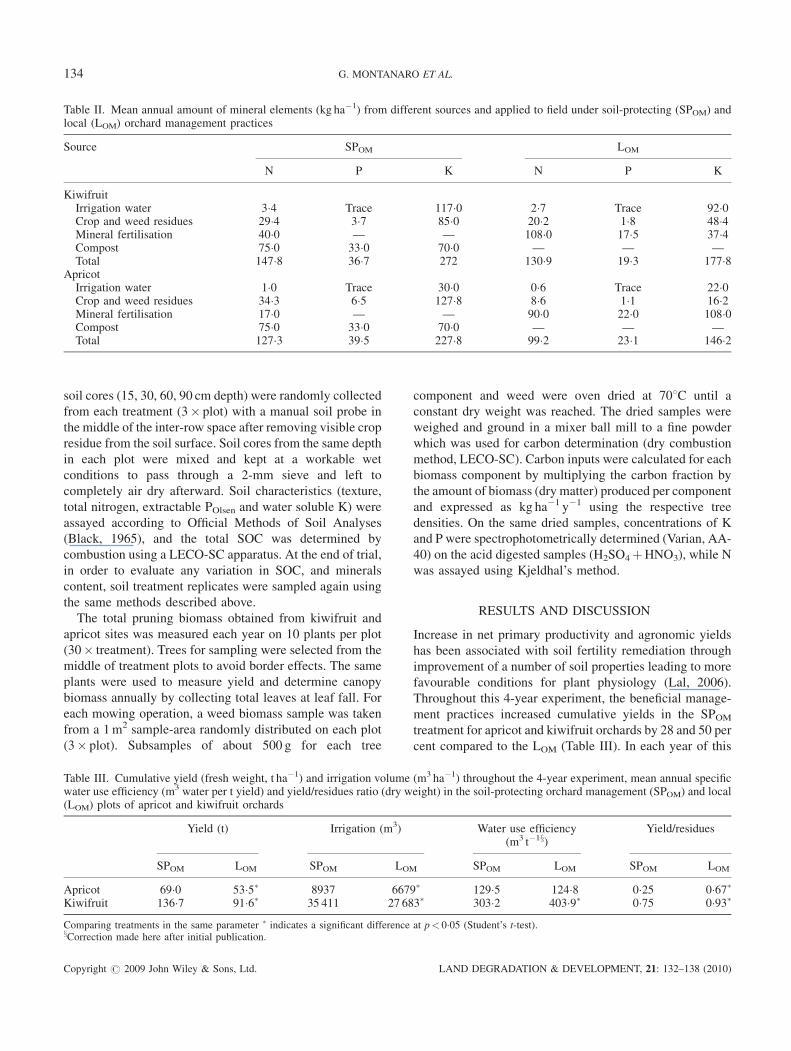
Table II. Mean annual amount of mineral elements (kg ha�1) from different sources and applied to field under soil-protecting (SPOM) andlocal (LOM) orchard management practices
Source SPOM LOM
N P K N P K
KiwifruitIrrigation water 3�4 Trace 117�0 2�7 Trace 92�0Crop and weed residues 29�4 3�7 85�0 20�2 1�8 48�4Mineral fertilisation 40�0 — — 108�0 17�5 37�4Compost 75�0 33�0 70�0 — — —Total 147�8 36�7 272 130�9 19�3 177�8
ApricotIrrigation water 1�0 Trace 30�0 0�6 Trace 22�0Crop and weed residues 34�3 6�5 127�8 8�6 1�1 16�2Mineral fertilisation 17�0 — — 90�0 22�0 108�0Compost 75�0 33�0 70�0 — — —Total 127�3 39�5 227�8 99�2 23�1 146�2
134 G. MONTANARO ET AL.
soil cores (15, 30, 60, 90 cm depth) were randomly collected
from each treatment (3� plot) with a manual soil probe in
the middle of the inter-row space after removing visible crop
residue from the soil surface. Soil cores from the same depth
in each plot were mixed and kept at a workable wet
conditions to pass through a 2-mm sieve and left to
completely air dry afterward. Soil characteristics (texture,
total nitrogen, extractable POlsen and water soluble K) were
assayed according to Official Methods of Soil Analyses
(Black, 1965), and the total SOC was determined by
combustion using a LECO-SC apparatus. At the end of trial,
in order to evaluate any variation in SOC, and minerals
content, soil treatment replicates were sampled again using
the same methods described above.
The total pruning biomass obtained from kiwifruit and
apricot sites was measured each year on 10 plants per plot
(30� treatment). Trees for sampling were selected from the
middle of treatment plots to avoid border effects. The same
plants were used to measure yield and determine canopy
biomass annually by collecting total leaves at leaf fall. For
each mowing operation, a weed biomass sample was taken
from a 1 m2 sample-area randomly distributed on each plot
(3� plot). Subsamples of about 500 g for each tree
Table III. Cumulative yield (fresh weight, t ha�1) and irrigation volumewater use efficiency (m3 water per t yield) and yield/residues ratio (dry w(LOM) plots of apricot and kiwifruit orchards
Yield (t) Irrigation (m3)
SPOM LOM SPOM LOM
Apricot 69�0 53�5� 8937 667Kiwifruit 136�7 91�6� 35 411 27 68
Comparing treatments in the same parameter � indicates a significant differencexCorrection made here after initial publication.
Copyright # 2009 John Wiley & Sons, Ltd.
component and weed were oven dried at 708C until a
constant dry weight was reached. The dried samples were
weighed and ground in a mixer ball mill to a fine powder
which was used for carbon determination (dry combustion
method, LECO-SC). Carbon inputs were calculated for each
biomass component by multiplying the carbon fraction by
the amount of biomass (dry matter) produced per component
and expressed as kg ha�1 y�1 using the respective tree
densities. On the same dried samples, concentrations of K
and P were spectrophotometrically determined (Varian, AA-
40) on the acid digested samples (H2SO4þHNO3), while N
was assayed using Kjeldhal’s method.
RESULTS AND DISCUSSION
Increase in net primary productivity and agronomic yields
has been associated with soil fertility remediation through
improvement of a number of soil properties leading to more
favourable conditions for plant physiology (Lal, 2006).
Throughout this 4-year experiment, the beneficial manage-
ment practices increased cumulative yields in the SPOM
treatment for apricot and kiwifruit orchards by 28 and 50 per
cent compared to the LOM (Table III). In each year of this
(m3 ha�1) throughout the 4-year experiment, mean annual specificeight) in the soil-protecting orchard management (SPOM) and local
Water use efficiency(m3 t�1x)
Yield/residues
SPOM LOM SPOM LOM
9� 129�5 124�8 0�25 0�67�
3� 303�2 403�9� 0�75 0�93�
at p< 0�05 (Student’s t-test).
LAND DEGRADATION & DEVELOPMENT, 21: 132–138 (2010)

Figure 2. Seasonal variation of nitrogen (ppm NO�3 ) in the 0–40 cm layer insoil under SPOM and local (LOM) management of kiwifruit orchard during
2007 year. Each point represents the mean of three soil cores� SE.
SOIL-PROTECTING PRACTICES IN FRUIT TREE ORCHARDS 135
experiment, the annual carbon input units (t ha�1) from crop
residue application resulted in 0�1–1�0 t ha�1 y�1 of
additional yield in apricot, while it ranged from 1�1 to
5�6 t ha�1 y�1 in kiwifruit. The positive yield response to
residue addition is in accordance with findings in annual
crop systems, but it is difficult to compare with fruit tree
cropping systems because of limited information available
in literature on this specific topic. Wilhelm et al. (1986)
among others (Gebrekidan et al., 1999; Mesfine et al., 2005)
reported significant linear relationship between crop residue
returned to the soil and grain production in corn and
soybean, concluding that it was mainly due to increased
stored soil water and reduced soil temperature. Carbon
inputs play an important role in supplying plant nutrients
(via mineralisation) which are critical to adequately sustain
crop production (Wilhelm et al. 1986; Kong et al., 2005).
Therefore, for the present research the improved soil
reservoir of some nutrients (Table IV), conceivably due to
the abundance of carbon inputs as coupled with irrigation,
can explain the increased yield in SPOM treatments although
a lower mineral fertilisation rate (Tables II and III).
Annual nitrogen incorporated in the soil of SPOM plots
was approximately 13 and 28 per cent higher than LOM
treatments for kiwifruit and apricot, respectively, while
phosphorous increased by about 90 per cent (kiwifruit) and
70 per cent (apricot) (Table II). The amount of potassium
was about 55 per cent increased in field under SPOM actions
in both kiwifruit and apricot, and based on chemical analyse
of water (not shown) irrigation noticeably contributed to K
increase (Table II).
Application of supplemental (mineral) nitrogen is
essential especially during the first years of the use of
residue and organic fertilisers because of its large use by soil
microorganisms to effect decomposition (Gebrekidan et al.,
1999). Generally, in soil under the SPOM treatment nitrogen
(NO�3 ) was detected at a mean concentration lower than that
observed in LOM treatment soils (i.e. about 20–30 ppm). As
an example, variations of NO�3 in kiwifruit plots are reported
in Figure 2 showing that nitrogen was on average 25�6 ppm,
Table IV. Total nitrogen, phosphorous and soluble potassium of soilmanagement practices
Initial
N (%) POlsen Ksolu
Kiwifruit0–15 cm 0�13 5�0 25�15–30 cm 0�10 3�0 33�
Apricot0–15 cm 0�12 8�2 14�15–30 cm 0�10 6�6 4�7
Comparing values of each element at the beginning and after 4 year in the same
Copyright # 2009 John Wiley & Sons, Ltd.
however in few dates (i.e. 7 May, 9 and 24 August) it was
detected at 11–19 ppm. By contrast, the mean NO�3 in
the LOM plots was 35�8 ppm excluding some peaks
(i.e. 26 May, 21 and 31 July). Thus, mean available soil
nitrogen in SPOM treatment was 70 per cent of that in LOM
one although N applied by mineral fertilisation was just 37
per cent of that distributed in LOM plots (Table II). In
addition, we noted that nitrogen concentration in SPOM
treatments was quite stable throughout the growing season
(except in some occasions) while in LOM soils it was more
variable and peaked at 90–110 ppm, increasing leaching risk
(Figure 2). This suggests a better balance between release
and use of nitrogen in the SPOM compared with the LOM system.
Figure 3 reports the allocation of the above-ground annual
carbon observed in the plots. The soil-protecting agricultural
actions significantly increased the biomass of weeds in both
kiwifruit and apricot orchards, the pruning material and
leaves biomass were comparable, while the fruit biomass
was significantly increased by SPOM techniques only for
kiwifruit (Figure 3).
Mean annual carbon inputs from crop biomass were 3�9and 2�0 t ha�1 y�1 in the SPOM and LOM kiwifruit treatments,
of kiwifruit and apricot orchards after 4 year of soil-protecting
After 4 year
ble N (%) POlsen Ksoluble
3 0�15 11�0 � 41�1�4 0�15� 6�1 39�0
2 0�18� 17�1� 25�1�0�16� 10�5 21�0�
orchard � indicates a significant difference at p< 0�05 (Student’s t-test).
LAND DEGRADATION & DEVELOPMENT, 21: 132–138 (2010)

Figure 3. Annual carbon allocation (kg ha�1 y�1) in different componentsof (A) apricot and (B) kiwifruit orchard under soil-protecting (SPOM) andlocal management practices (LOM). Data are 4-year mean� SE; comparingtreatments in the same specie � indicates a significant difference at p< 0�05
(Student’s t-test).
Figure 4. Total annual carbon (kg ha�1 y�1) (C INPUT) from above-groundweed and tree residues (biomass) and compost in (A) apricot and(B) kiwifruit orchard under soil-protecting (SPOM) and local management(LOM). Data are 4-year mean�SE; comparing treatments in the same specie
� indicates a significant difference at p< 0�05 (Student’s t-test).
136 G. MONTANARO ET AL.
while they were 4�5 (SPOM) and 1�3 (LOM) t ha�1 y�1 in the
case of apricot (Figure 4). Grass mowing and pruning
residues retention accounted for a large part (50 per cent for
the kiwifruit and 90 per cent for the apricot) of that inputs. A
limited amount of weed biomass (0�1–0�2 t ha�1) was
incorporated also in the LOM plots due to within-tillage
weed growth. Application of compost caused the total
carbon input to be considerably greater at 9�6 and
8�4 t ha�1 y�1 for apricot and kiwifruit, respectively
(Figure 4). These rates were 8–4 times higher than the
total carbon input received by LOM treatments. In plots
under LOM, carbon was returned to soil at a mean rate of
Table V. Soil texture (%) and soil paste pH of kiwifruit and apricot or
Texture (%
Sand Silt
Kiwifruit orchard0–15 cm 62�2 18�315–30 cm 60�0 20�630–60 cm 65�2 19�460–90 cm 40�8 19�4
Apricot orchard0–15 cm 25�4 49�215–30 cm 24�6 48�630–60 cm 22�1 49�460–90 cm 25�9 45�6
Copyright # 2009 John Wiley & Sons, Ltd.
1�3–2 t ha�1 y�1 that corresponded almost entirely to crop
leaves biomass (Figure 3). It has been reported that under
conservative land use, a minimum charge of carbon from
crop residues left to decompose on the soil surface of 6–
12 t ha�1 y�1 is required to maintain soil quality (Reeves,
1997), therefore the amounts of carbon returned to soil in
the LOM plots are presumably not enough to prevent the
decline of soil fertility.
Soil analysis showed a loamy-sand texture with alkaline
reaction (calcareous soil) for the apricot site, while the kiwi-
fruit soil was a sandyclay with a subalkaline pH(Table V).The
two soils were characterised by a very low content of SOC
chards soil samples
) Soil paste pH
Clay
19�5 7�6419�4 7�7915�4 7�7539�8 7�67
25�5 8�1526�8 8�0928�5 8�2728�6 8�14
LAND DEGRADATION & DEVELOPMENT, 21: 132–138 (2010)

Table VI. Soil organic carbon (%) of kiwifruit and apricot orchards
SPOM LOM
Initial After 4 year Initial After 4 year
Kiwifruit0–15 cm 1�34 1�39 ns 1�24 1�28 ns15–30 cm 1�18 1�20 ns 1�15 1�26 ns30–60 cm 0�69 0�74 ns 0�71 0�79 ns60–90 cm 0�54 0�65 ns 0�50 0�55 ns
Apricot0–15 cm 1�13 1�27 ns 1�11 1�19 ns15–30 cm 1�03 1�17 ns 1�23 1�19 ns30–60 cm 0�83 0�74 ns 0�89 0�85 ns60–90 cm 0�83 0�80 ns 0�88 0�82 ns
Comparing SOC values at the beginning and at the end of experiment in the same treatment ns¼ not significant at p< 0�05 (Student’s t-test).
SOIL-PROTECTING PRACTICES IN FRUIT TREE ORCHARDS 137
typical of degraded Mediterranean soils (Table VI) (Trinchera
et al., 1999; Bastida et al., 2006). The final content of SOC was
not affected by 4 years of different treatment practices, being
very close to the initial SOC content for the two sites and
treatments (Table VI). This result is in accordance with
Franzluebbers and Arshad (1996) who reported little or no
increase in SOC in the first 2–5 years after changing to
conservation management in canola–wheat–barley cropping
system. Results also agree with the idea that response of SOC
to changed practices (i.e. residue application and no tillage)
may only be expected from a long-term (�10 years)
perspective (Al-Kaisi and Yin, 2005).
The Mediterranean area is characterised by a dry summer
with little or no precipitation (Figure 1), consequently
irrigation is typically used to compensate for inadequate
rainfall for most of cultivated plants. At the end of 4th year,
cumulative irrigation volume reached 35 411 m3 ha�1 in
kiwifruit orchard under SPOM and up to 27 600 m3 ha�1 in
the LOM one, for the apricot orchard it reached approximately
8900 (SPOM) and 6700 (LOM) m3 ha�1 (Table III)x. It appears
that SPOM practices induced higher water consumption,
however to correctly interpret the treatment effects on that
consumption, irrigation volumes may well be related to yield.
That is, the analysis of water use efficiency (amount of water
per unit of yield) reveals that SPOM induced for kiwifruit a
better resource use (i.e. 25 per cent lower water use efficiency),
while in apricot that efficiency was similar in both treatment
(125–130 m3 per ton of harvested fruit) (Table III)x. Thus, it
appears that the SPOM actions may be, at least for kiwifruit, a
practicable set of techniques able to maximise yield per unit of
irrigation water.
The yield/residues ratio could help to guide the farmer’s
decision in order to identify the better equilibrium amidst
production and adoption of practices to increase carbon
input. For kiwifruit, a ratio of 0�75 seems to be optimal for
xCorrection made here after initial publication.
Copyright # 2009 John Wiley & Sons, Ltd.
both implementation of residues retention and achievement
of 50 per cent increased yield (Table III). In the apricot
orchard, SPOM techniques induced a lower yield increase
(28 per cent), thus, the yield:residues ratio of 0�25 (Table III)
could be increased via rising yield. It is likely that the
additional inorganic nitrogen of 17 kg ha�1 y�1 needs to be
adjusted (increased) in order to promote nutrient release
from crop residues by mineralisation processes and
adequately sustains crop productivity (Gebrekidan et al.,
1999; Loveland and Webb, 2003).
CONCLUSIONS
This study focused on the critical issue of increasing SOC in
croplands through the addition of crop residues, organic
amendments and the reduction in soil disturbance. Under that
practices the mean annual carbon inputs was increased from
approximately 1�5 to 9�0 t ha�1 without significative effect on
SOC content, while yield increased by 28 and 50 per cent in
apricot and kiwifruit, respectively. It could be concluded that
the soil-protecting actions positively affect the yield (mainly
via improving the reservoir of minerals in soil in spite of a
lower mineral fertilisation rate) and increase the soil carbon
inputs that reasonably represents a prerequisite to maintain
and increase SOC pools (Reeves, 1997).
ACKNOWLEDGEMENTS
This study was financially supported by the Italian Ministry
of University and Scientific Research. Special grant BRI-
MET. Authors thank Mr. A. Mossuto (NaturaInformatica
Soc. Coop) for field assistance.x
REFERENCES
Al-Kaisi M, Yin X. 2005. Tillage and crop residue effects on soil carbon andcarbon dioxide emissions in corn-soybean rotations. Journal of Environ-mental Quality 34:437–445.
LAND DEGRADATION & DEVELOPMENT, 21: 132–138 (2010)

138 G. MONTANARO ET AL.
Bastida F, Moreno JL, Hernandez T, Garcıa C. 2006. Microbiologicaldegradation index of soils in a semiarid climate. Soil Biology & Bio-chemistry 38:3463–3473.
Black CA (Ed.).1965.Methods of Soil Analysis.American Society ofAgronomy: Madison, WI.
Franzluebbers AJ, Arshad MA. 1996. Soil organic matter pools during earlyadoption of conservation tillage in northwestern Canada. Soil ScienceSociety American Journal 60:1422–1427.
Gebrekidan H, Belay A, Uloro Y, Zewdie E. 1999. Yield response of maize(Zea mays L.) to crop residue management on two major soil types ofAlemaya, Eastern Ethiopia: I. Effects of varying rates of applied andresidual N and P fertilizers. Nutrient Cycling in Agroecosystems 54:65–71.
Kong AYY, Six J, Bryant DC, Denison RF, van Kessel C. 2005. Therelationship between carbon input, aggregation, and soil organic carbonstabilization in sustainable cropping systems. Soil Science Society ofAmerica Journal 69:1078–1085.
Lal R. 1997. Residue management, conservation tillage and soil restorationfor mitigating greenhouse effect by CO2-enrichment. Soil & TillageResearch 43:81–107.
Lal R. 2006. Enhancing crop yields in the developing countries throughrestoration of the soil organic carbon pool in agricultural lands. LandDegradation & Development 17:197–209.
Loveland P, Webb J. 2003. Is there a critical level of organic matter in theagricultural soils of temperate regions: a review. Soil & Tillage Research70:1–18.
Copyright # 2009 John Wiley & Sons, Ltd.
Mesfine T, Abebe G, Al-Tawaha ARM. 2005. Effect of reduced tillage andcrop residue ground cover on yield and water use efficiency of sorghum(Sorghum bicolor (L.) Moench) under semi-arid conditions of Ethiopia.World Journal of Agricultural Sciences 1:152–160.
Oelbermann M, Voroney RP, Kass DCL, Schlnvoigt AM. 2005. Above- andbleow-ground carbon inputs in 19-, 10- and 4-year-old Costa Rican Alleycropping systems. Agriculture, Ecosystems and Environmnet 105:163–172.
Reeves DW. 1997. The role of soil organic matter in maintaining soil qualityin continuous cropping systems. Soil & Tillage Research 43:131–167.
Trinchera A, Pinzari F, Benedetti A, Sequi P. 1999. Use of biochemicalindex and changes in organic matter dynamics in a Meditteraneanenvironment: a comparison between soils under arable and set-asidemanagements. Organic Geochemistry 30:453–459.
Wilhelm WW, Doran JW, Power JF. 1986. Corn and soybean yield responseto crop residue management under no-tillage production system.Agronomy Journal 78:184–189.
WRB. 2006. World reference base for soil resources. World Soil ResourcesReports No. 103. FAO, Rome.
Xiloyannis C, Celano G, Montanaro G, Dichio B, Sebastiani L, Minnocci A.2001. Water relations, calcium and potassium concentration in fruits andleaves during annual growth in mature kiwifruit plants. Acta Horticul-turae 564:129–134.
Xiloyannis C, Dichio B, Celano G. 2006. Orchard management to preservesoil fertility and improve the efficiency of water and mineral resources.Acta Horticulturae 701:611–618.
LAND DEGRADATION & DEVELOPMENT, 21: 132–138 (2010)
Top Related
Copyright © 2022 FDOKUMEN

