


Bahasa
Halaman
Hukum


Effects of nutrient enrichment on seagrass populationdynamics: evidence and synthesis from the biomass–density relationshipsSusana Cabac�o1, Eugenia T. Apostolaki2, Patricia García-Marín3, Renee Gruber4,Ignacio Hern�andez3, Bego~na Martínez-Crego1, Oriol Mascar�o5, Marta P�erez5,Anchana Prathep6, Cliff Robinson7, Javier Romero5, Allison L. Schmidt8, Fred T. Short9,Brigitta I. van Tussenbroek10 and Rui Santos1*1Marine Plant Ecology Research Group (ALGAE) Centre of Marine Sciences (CCMAR), University of Algarve,Campus of Gambelas, 8005-139 Faro, Portugal; 2Institute of Oceanography, Hellenic Centre for MarineResearch, PO Box 2214, 71003 Heraklion, Crete, Greece; 3Division of Ecology, Department of Biology, Facultyof Marine and Environmental Sciences, University of Cadiz, 11510 Puerto Real (Cadiz), Spain; 4New SouthWales Office of Environment and Heritage, Scientific Services Division, Coastal Catchments Unit, 59-61 GoulburnStreet, Sydney, NSW 2000, Australia; 5Departamento de Ecología, Facultad de Biología, Universidad deBarcelona, Av. Diagonal 645, 08028 Barcelona, Spain; 6Seaweed and Seagrass Research Unit, Center ofExcellence for Biodiversity of Peninsular Thailand, Department of Biology, Faculty of Science, Prince of SongklaUniversity, HatYai, Songkhla, Thailand; 7Marine Protected Areas Research Group, Department of Geography,University of Victoria, Victoria, BC, V8W 3P5 Canada; 8Dalhousie University, Department of Biology, 1355Oxford Street, Halifax, NS B3H 4R2, Canada; 9Aquatic Resources Division, Washington State Department ofNatural Resources, Olympia, WA 98504, USA; and 10Unidad Acad�emica de Sistemas Arrecifales/Puerto MorelosInstituto de Ciencias del Mar y Limnología, Universidad Nacional Aut�onoma de M�exico, Apdo. Postal 1152,Canc�un, Quintana Roo, Mexico
Summary
1. The available data from experimental and descriptive studies on seagrass biomass and density responsesto nutrient enrichment were analysed to assess the intraspecific mechanisms operating within seagrasspopulations and whether biomass–density relationships can provide relevant metrics for monitoringseagrasses.2. The response of shoot biomass and density to nutrient enrichment was dependent on the type of study; theshort-term positive response of biomass and density in experimental studies reveals context-specific nutrientlimitation of seagrasses. The long-term negative response of descriptive studies probably results from ecosys-tem-scale events related to nutrient enrichment such as increased turbidity, algal blooms, epiphyte loads andanoxia.3. Most seagrass species analysed lie in the nonthinning part of the theoretical biomass–density curves. Asimultaneous increase in biomass and decrease in density, evidence of self-thinning, were only observed in 4 of28 studies. The analysis of both the static and the dynamic biomass–density relationships revealed that theslopes increase under nutrient enrichment. Surprisingly, the species-specific slopes (log B-log D) were higherthan one, revealing that the B/D ratio, that is, the average shoot biomass, increases with density in all seagrassspecies analysed. Nutrient enrichment further enhanced this effect as biomass–density slopes increased to evenhigher values. The main drivers behind the increasing biomass–density slopes under nutrient enrichment werethe increase in shoot biomass at densities above a species-specific threshold and/or its decrease below thatthreshold.4. Synthesis. Contrasting short- and long-term responses of both biomass and density of seagrasses to nutrientenrichment suggest that the former, positive ones result from nutrient limitation, whereas the later, negativeones are mediated by whole ecosystem responses. In general, shoot biomass of seagrasses increases with den-sity, and nutrient enrichment enhances this effect. Experimental testing of facilitation processes related to clonalintegration in seagrasses needs to be done to reveal whether they determine the low incidence of self-thinningand the intriguing biomass–density relationships of seagrass species. The increasing slopes and decreasing
*Correspondence author. E-mail: [email protected]
© 2013 The Authors. Journal of Ecology © 2013 British Ecological Society
Journal of Ecology 2013, 101, 1552–1562 doi: 10.1111/1365-2745.12134

intercepts of the species-specific dynamic biomass–density relationships of seagrasses and the decreasing coeffi-cients of variation of both biomass and density constitute relevant, easy-to-collect metrics that may be used inenvironmental monitoring.
Key-words: biomass–density relationship, facilitation, intraspecific competition, monitoring, nutri-ent enrichment, plant population and community dynamics, seagrass
Introduction
The relationships between plant biomass and density ulti-mately reflect the competitive mechanisms operating withinpopulations and how they respond to the environment (Weller1987). Changing environmental conditions (e.g. nutrient avail-ability) may modify such competitive mechanisms, affectingthe biomass–density relationships of plant populations (Morris& Myerscough 1985, 1991; Morris 1995, 1999, 2002, 2003;Steen & Scrosati 2004; Cabac�o, Mach�as & Santos 2007; Chuet al. 2010). These relationships may be structured along thesame or along different biomass–density lines as the environ-ment varies (Morris 2003). Matching biomass–density linesindicates that the biomass packing does not change with envi-ronmental conditions, even though the rate of propagationalong the line may vary. Different biomass–density linesresulting from higher availability of resources reflect differentcompetition processes occurring within populations as a con-sequence of biomass accumulation (Morris 2003). Ultimately,increased intraspecific competition due to increased biomassof individuals in crowded plant populations may result in adensity decrease, a process known as self-thinning (Yodaet al. 1963; White 1981; Westoby 1984; Weller 1987). Inaddition to competition, facilitation, that is, the positive effectof plants on the establishment or growth of neighbouringplants (Brooker et al. 2008), may also be involved. Chu et al.(2008) demonstrated that facilitation could also affect the bio-mass–density relationships, playing an important role inplant–plant interactions and in the population dynamics out-come. Intraspecific facilitation is common in clonal plantssuch as seagrasses, where clonal integration results in particu-larly active spatial and temporal dynamics involving the con-tinuous recruitment and mortality of shoots within the sameindividual (Duarte et al. 2006).Nutrients affect both the structure and dynamics of the
populations of seagrasses mainly through changes in plantarchitecture, morphology and mortality (Short 1983; Romeroet al. 2006; Fertig, Kennish & Sakowicz 2013) and there-fore may have an effect on the biomass–density relation-ships. The meta-analysis of Hughes et al. (2004) revealedthat experimental additions of inorganic nutrients to sedi-ments generally stimulate seagrass growth, suggesting nutri-ent limitation of plant production. However, the excessivegrowth of epiphytes, macroalgae and phytoplankton underhigh nutrient loads decreases seagrass growth and survival(Lee, Park & Kim 2007; Schmidt et al. 2012). Excessivelyhigh nutrient regimes also result in built-up of organic mat-ter, which may result in conditions unfavourable to seag-rasses, such as sediment anoxia or sulphide toxicity (Koch
2001; Koch et al. 2006). Direct nutrient toxicity effects onseagrass growth and survival have also been reported (vanKatwijk et al. 1997; Brun et al. 2002; Burkholder, Toma-sko & Touchette 2007). These have been considered themajor factors contributing to seagrass decline world-wide(Short & Wyllie-Echeverria 1996; Ralph et al. 2006; Way-cott et al. 2009).To date, self-thinning processes have not been explicitly
reported for seagrasses in established, natural populations.Here, we analyse how the biomass–density relationship of
seagrass meadows responds to nutrient enrichment. Aschanges to the biomass–density relationship are determinedby the growth and survival responses of individual plants, thisrelationship may reveal the competitive and resource alloca-tion mechanisms operating within seagrass meadows underincreasing nutrient loads. The only report on this subject isCabac�o, Mach�as & Santos (2007), who observed that theslope of the biomass–density relationship of Zostera noltiiincreased along a gradient of anthropogenic nutrient enrich-ment and that this was mainly driven by biomass changes.Our analysis is based on a world-wide data set of biomassand density responses of seagrass species both under small-scale, controlled nutrient additions (experimental studies) andunder large-scale contrasting nutrient levels in natural settings(descriptive studies), obtained from published and unpub-lished data sources. We analyse the effects of nutrient enrich-ment on biomass and density separately, as well as on thebiomass–density relationships. We also investigate whetherthe life strategy of different species influences the popula-tion’s response to nutrients. Size and growth of seagrasses arelinked to their life-history strategy as small-size species tendto have high growth rates and large-size species tend to havelow growth rates (Duarte et al. 2006). In order to test this,the species responses were scaled to their specific shootweight, rhizome diameter, leaf length, and both horizontaland vertical rhizome elongation rates.The biomass and density of seagrass populations are eas-
ily measurable and, in fact, have been widely used both inregional-scale monitoring programs (e.g. Mediterraneanbasin; Lopez y Royo et al. 2010) and in global-scale moni-toring programs (e.g. SeagrassNet, www.seagrassnet.org). Ifthe biomass–density relationships vary with nutrient load-ings, reflecting the outcome of the competitive mechanismsoperating within populations, this relationship can constitutea sound metric for coastal monitoring based on seagrassstands. The biomass–density relationships could then be usedas early warning indicators of the negative effects of exces-sive nutrient loadings on coastal ecosystems dominated byseagrasses.
© 2013 The Authors. Journal of Ecology © 2013 British Ecological Society, Journal of Ecology, 101, 1552–1562
Effects of nutrients on seagrass biomass–density relationships 1553

Materials and methods
RESPONSE OF SEAGRASS BIOMASS AND DENSITY TO
NUTRIENT ENRICHMENT
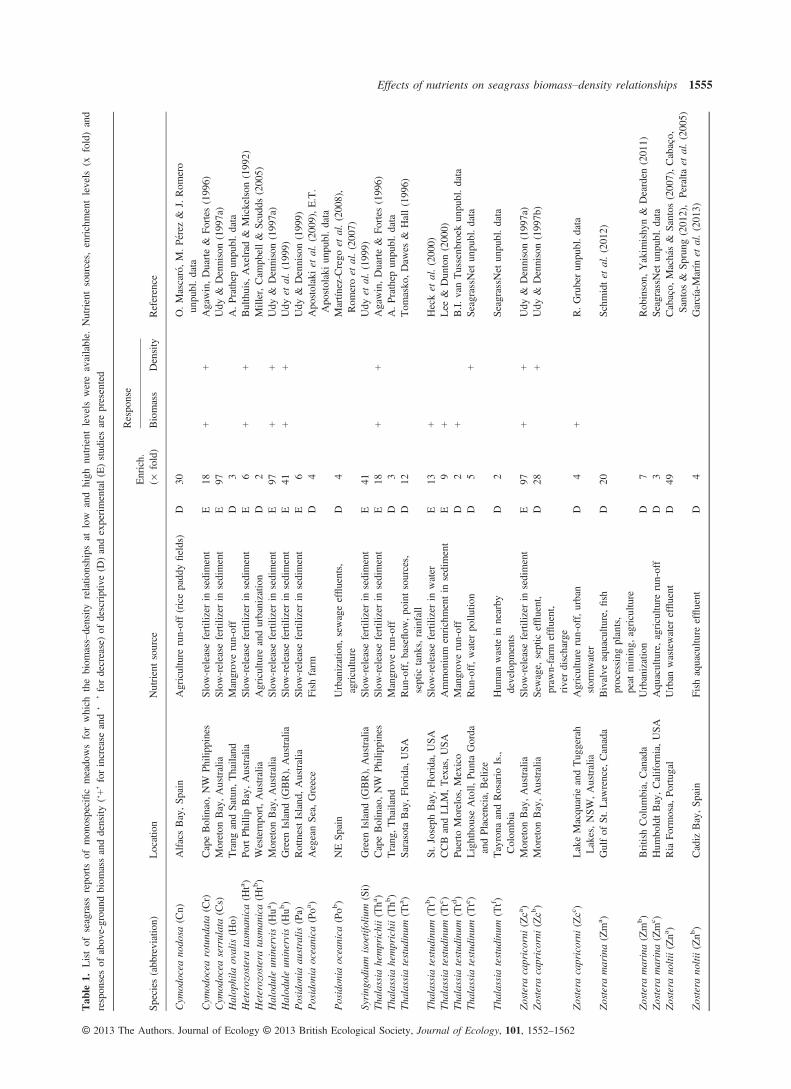
Data on the effects of nutrient enrichment on both the above-groundbiomass and shoot density (per square metre) of monospecific sea-grass meadows were compiled both from the literature and fromunpublished data sources (Table 1). Both descriptive studies and fieldexperiments were included in the analysis. The sources of nutrientenrichment in descriptive studies were mainly urban wastewater,aquaculture and agriculture (Table 1). Most of the experimental stud-ies were performed by enriching the sediment with slow-release fertil-izers (Table 1). Only the studies reporting both the above-groundbiomass and density responses for the same sites and time periodwere included in the analysis. Mesocosms and laboratory experimentswere not considered in this study as they generally involve plantmanipulations and we consider that they do not represent natural con-ditions. As well, these data are not expressed per unit of area asrequired for the analysis.
Nutrient levels were classified as low and high because the abso-lute nutrient concentrations varied widely, with the differencesbetween undisturbed (low) and enriched (high) conditions rangingfrom 2- to 97-fold (Table 1). When more than one experiment perstudy was conducted on the same species in different locations (sites),the mean values were used in the analysis.
The biomass and density responses to nutrient enrichment werequantified for each study case as the percentage change ((H�L)/L) 9100, where H is the biomass or density at high nutrient levels and Lis the biomass or density at low nutrient levels. The response is nega-tive when biomass or density of seagrass meadows declines withnutrient enrichment and positive when they increase. Linear regres-sion analyses were used to examine the effects of seagrass growth orsize on the biomass or density responses to nutrient enrichment (So-kal & Rohlf 2012). The species-specific average values of individualshoot weight (g DW), rhizome diameter (mm) and leaf length (cm)were used as size parameters, and the horizontal and vertical rhizomeelongation rates (cm yr�1) as growth parameters. All these parameterswere derived from literature data (see Table 2 for details).
BIOMASS–DENSITY RELATIONSHIPS
The ‘static interspecific biomass–density relationship’ (Weller 1989;Scrosati 2005) was obtained using data collected a single time, theseason of maximum above-ground biomass. The static relationshipsunder low and high nutrient levels were compared. When the tempo-ral variation of biomass and density of a species at low and highnutrient levels was available, the ‘dynamic biomass–density relation-ship’ was analysed. This was possible for seven seagrass species,Cymodocea nodosa (Spain), Halophila ovalis (Thailand), Thalassiahemprichii (Thailand), Thalassia testudinum (Belize, Colombia andMexico), Zostera capricorni (Australia), Zostera marina (USA) andZostera noltii (Portugal), in a total of nine study cases. These were alldescriptive studies (Table 1). The linear log–log relationships betweenbiomass and density were determined by principal component analy-sis (PCA), because both variables are random (Weller 1987; Scrosati2005). The PCA yields an orthogonal regression, which minimizesdeviations perpendicularly to the fitted line and therefore does notrank variables as independent or dependent. PCA was performed onthe covariance matrix with the linear fit corresponding to the firsteigenvalue (Manly 1986; Jackson 1991). The slope was estimated by
dividing the biomass loading by the density loading. The lineardependence of the biomass–density relationships was measured byPearson’s correlation coefficient, and its statistical significance wasdetermined by testing the null hypothesis that log biomass and logshoot density were uncorrelated (Sokal & Rohlf 2012).
To estimate the variance of the slopes and intercepts of PCAregressions of the static interspecific biomass–density relationship, sothat the differences between low and high nutrient levels could betested, a bootstrap resampling technique (random sampling withreplacement) was done 50 times to the original set of biomass–densityvariables and a PCA was performed to each bootstrap sample. Fiftybootstrap samples are considered adequate to estimate standard errors(Timmerman, Kiers & Smilde 2007). The variables of interest, that is,the slope and intercept, were estimated for each PCA, and their aver-age values (�SE) were calculated. A Student’s t-test was used toassess the significant differences between the mean slope and inter-cept of the static interspecific biomass–density relationship obtainedunder low and high nutrient levels.
For the dynamic intraspecific biomass–density lines, a chi-squaretest was used to investigate the response trends to nutrient enrichmentof the slopes and intercepts, testing the null hypothesis that the num-ber of cases showing increasing or decreasing responses was equal.Statistical analyses were performed using SYSTAT. Levels of signifi-cance were established at a = 0.05.
Results
Responses of above-ground biomass and shoot density toincreasing nutrient loads were obtained from 28 studies(17 descriptive and 11 experimental) of 14 species (Table 1),including a wide range of plant sizes and geographical distri-bution. In 22 of the studies, biomass and density covariedsimultaneously, either increasing together (six studies, allexperimental, Fig. 1 upper right quarter) or decreasingtogether (three experimental plus 13 descriptive studies,Fig. 1 lower left quarter). Only in four studies were thereincreases in biomass accompanied by density decrease asexpected under self-thinning (two descriptive and two experi-mental). Interestingly, descriptive and experimental studiesshowed opposite trends in the biomass and density responsesto nutrients. A simultaneous decrease in biomass and densitywas the most common response in descriptive studies (13 of16 cases, 76%, Fig. 1) as opposed to experimental studies(2 of 11 cases, 18%). No descriptive studies reported simulta-neous increases in biomass and density. In experimental stud-ies, biomass increased in 8 of the 11 cases (72%).The magnitude of the biomass–density responses to nutrient
enrichment (Fig. 1) was much higher in the species showinga positive response (up to 269% for biomass and 125% fordensity) than in the species showing a negative response(down to �84% and �79%, respectively). The biomass–den-sity regression line is above the 1:1 line (Fig. 1) showingthat, overall, the above-ground biomass of seagrassesresponds more than density to nutrient increase.The analysis of the static interspecific relationship between
biomass and density shows that the slope of the line is signifi-cantly higher under high nutrient conditions in experimentalstudies (Fig. 2a), but not in descriptive studies (Fig. 2b) dueto higher variability of biomass and density. The intercept of
© 2013 The Authors. Journal of Ecology © 2013 British Ecological Society, Journal of Ecology, 101, 1552–1562
1554 S. Cabac�o et al.
Tab
le1.
Listof
seagrass
reportsof
mon
ospecificmeado
wsforwhich
thebiom
ass–density
relatio
nships
atlow
andhigh
nutrient
levels
wereavailable.
Nutrientsources,
enrichmentlevels
(xfold)and
respon
sesof
abov
e-grou
ndbiom
assanddensity
(‘+’forincrease
and‘�
’fordecrease)of
descriptive(D
)andexperimental(E)studiesarepresented
Species(abbreviation)
Location
Nutrientsource
Enrich.
(9fold)
Respo
nse
Reference
Biomass
Density
Cym
odocea
nodosa
(Cn)
AlfacsBay,Sp
ain
Agriculture
run-off(ricepaddyfields)
D30
��
O.Mascar� o,M.P� erez&
J.Rom
ero
unpubl.data
Cym
odocea
rotundata(Cr)
CapeBolinao,NW
Philipp
ines
Slow
-release
fertilizerin
sediment
E18
++
Agawin,Duarte&
Fortes
(1996)
Cym
odocea
serrulata(Cs)
Moreton
Bay,Australia
Slow
-release
fertilizerin
sediment
E97
��
Udy
&Dennison(199
7a)
Halop
hila
ovalis(H
o)Trang
andSatun,
Thailand
Mangroverun-off
D3
��
A.Prathepun
publ.data
Heterozostera
tasm
anica(H
ta)
PortPh
illip
Bay,Australia
Slow
-release
fertilizerin
sediment
E6
++
Bulthuis,Axelrad
&Mickelson
(1992)
Heterozostera
tasm
anica(H
tb)
Westernport,Australia
Agriculture
andurbanizatio
nD
2�
�Miller,Cam
pbell&
Scud
ds(2005)
Halod
uleun
inervis(H
ua)
Moreton
Bay,Australia
Slow
-release
fertilizerin
sediment
E97
++
Udy
&Dennison(199
7a)
Halod
uleun
inervis(H
ub)
Green
Island
(GBR),Australia
Slow
-release
fertilizerin
sediment
E41
++
Udy
etal.(199
9)Posidon
iaau
stralis
(Pa)
RottnestIsland
,Australia
Slow
-release
fertilizerin
sediment
E6
��
Udy
&Dennison(199
9)Posidon
iaoceanica
(Poa)
AegeanSea,
Greece
Fish
farm
D4
��
Apo
stolakiet
al.(200
9),E.T.
Apostolakiunpubl.data
Posidon
iaoceanica
(Pob)
NESp
ain
Urbanization,
sewageeffluents,
agricultu
reD
4�
�Martín
ez-Crego
etal.(2008),
Rom
eroet
al.(2007)
Syring
odium
isoetifolium
(Si)
Green
Island
(GBR),Australia
Slow
-release
fertilizerin
sediment
E41
��
Udy
etal.(199
9)Th
alassiahemprichii(Tha)
CapeBolinao,NW
Philipp
ines
Slow
-release
fertilizerin
sediment
E18
++
Agawin,Duarte&
Fortes
(1996)
Thalassiahemprichii(Thb)
Trang,Thailand
Mangroverun-off
D3
��
A.Prathepun
publ.data
Thalassiatestudinum
(Tta)
Sarasota
Bay,Florida,
USA
Run-off,baseflow
,po
intsources,
septic
tanks,rainfall
D12
��
Tom
asko
,Daw
es&
Hall(1996)
Thalassiatestudinum
(Ttb)
St.Joseph
Bay,Florida,
USA
Slow
-release
fertilizerin
water
E13
+�
Hecket
al.(2000)
Thalassiatestudinum
(Ttc)
CCBandLLM,Texas,USA
Ammonium
enrichmentin
sediment
E9
+�
Lee
&Dun
ton(200
0)Th
alassiatestudinum
(Ttd)
Puerto
Morelos,Mexico
Mangroverun-off
D2
+�
B.I.
vanTussenb
roek
unpu
bl.data
Thalassiatestudinum
(Tte)
Lightho
useAtoll,
PuntaGorda
andPlacencia,
Belize
Run-off,water
pollu
tion
D5
�+
SeagrassNet
unpubl.data
Thalassiatestudinum
(Ttf )
Tayrona
andRosario
Is.,
Colom
bia
Hum
anwaste
innearby
developm
ents
D2
��
SeagrassNet
unpubl.data
Zosteracapricorni
(Zca)
Moreton
Bay,Australia
Slow
-release
fertilizerin
sediment
E97
++
Udy
&Dennison(199
7a)
Zosteracapricorni
(Zcb)
Moreton
Bay,Australia
Sewage,
septic
effluent,
praw
n-farm
effluent,
riverdischarge
D28
�+
Udy
&Dennison(199
7b)
Zosteracapricorni
(Zcc)
LakeMacquarie
andTug
gerah
Lakes,NSW
,Australia
Agriculture
run-off,urban
stormwater
D4
+�
R.Gruberun
publ.data
Zosteramarina(Zm
a )Gulfof
St.Law
rence,
Canada
Bivalve
aquacultu
re,fish
processing
plants,
peat
mining,
agricultu
re
D20
��
Schm
idtet
al.(2012)
Zosteramarina(Zm
b )BritishColum
bia,
Canada
Urbanization
D7
��
Rob
inson,
Yakim
ishy
n&
Dearden
(201
1)Zo
steramarina(Zm
c )Hum
boldtBay,California,
USA
Aquaculture,agricultu
rerun-off
D3
��
SeagrassNet
unpubl.data
Zosterano
ltii(Zna)
Ria
Form
osa,
Portug
alUrban
wastewater
effluent
D49
��
Cabac�o,
Mach� as&
Santos
(2007),Cabac�o,
Santos
&Sp
rung
(201
2),Peralta
etal.(200
5)Zo
sterano
ltii(Znb)
Cadiz
Bay,Sp
ain
Fish
aquacultu
reeffluent
D4
��
García-Marín
etal.(201
3)
© 2013 The Authors. Journal of Ecology © 2013 British Ecological Society, Journal of Ecology, 101, 1552–1562
Effects of nutrients on seagrass biomass–density relationships 1555

the biomass–density relationship shows the opposite response,decreasing with nutrient enrichment in both experimental anddescriptive studies.The slopes of the intraspecific, dynamic biomass–density
relationships (in log scale) for the nine species of seagrassesfrom which data were available were all positive and higherthan one (Table 3). This revealed, respectively, that data are
in the nonthinning part of the theoretical biomass–densitycurves and that the B/D ratio increases with density in all sea-grass species tested, that is, that the average biomass of eachindividual increases with density. Nutrient enrichment furtherincreased the slopes and thus the positive effect of density onthe average biomass of each seagrass shoot. This wasobserved in all reported cases, except one of Thalassia testud-inum where the slope decreased from 1.38 to 1.09 withnutrients (Ttd, Table 3). The intercept of the dynamic bio-mass–density line showed the opposite trend of the slopes.The coefficients of variation of density and biomass decreasedwith nutrient enrichment in seven of nine cases (Table 3).Figure 3 shows how the biomass–density data fit around the
intraspecific, dynamic biomass–density relationships to helpunderstanding the main drivers of the slope responses to nutri-ent enrichment (Table 4). In species where the lines interceptwithin the range of data dispersal (Fig. 3), the biomass–densityratio (B/D), that is, the biomass of each shoot, decreased belowa certain density threshold, whereas above that threshold itincreased. This was observed in five of the nine seagrass spe-cies. However, the density thresholds are near the range limitsof the observed density values in four species. Consequently,the main driver of the slope response to nutrient enrichmentwas a progressive increase in B/D with density, observed inThalassia hemprichii (Thb), Thalassia testudinum (Ttf), Zosteracapricornii (Zcc) and Zostera marina (Zmc). In Cymodoceanodosa, Halophila ovalis and Thalassia testudinum (Tte), therewas a progressive reduction in the B/D ratio at lower densities,whereas in Thalassia testudinum (Ttd), B/D increased progres-sively at lower densities. In Zostera noltii, shoot biomassdecreases with density at densities lower than 8511, whereas itincreases above that threshold (Table 4). This is the only spe-cies where the density threshold is in the middle of the densitydistribution range (Fig. 3).The analysis of the interspecific responses of biomass and
density to different levels of nutrient enrichment shows thatbiomass is significantly related to nutrients (Fig. 4A), onlywhen biomass increased with nutrients (most experimentalstudies). In descriptive studies, where biomass decreased withnutrients (negative values of change, Fig. 4A), there was nosignificant relationship between biomass and nutrient levels.In contrast, density was not related to nutrient enrichmentboth in the positive and negative sets of responses (Fig. 4B).Neither the seagrass biomass nor the shoot density
responses to nutrients were related to seagrass size or growthcharacteristics analysed (Table 5). Therefore, the hypothesisthat the species-specific life strategy of seagrasses (expressedas size and growth) influences the populations’ response tonutrients was not supported.
Discussion
The analysis of the available data on the effects of nutrientenrichment on seagrass biomass and density revealed thatthe most common reaction was a synchronized response ofboth variables to increasing nutrients, which was reflectedin the significant relationship between biomass and density
Table 2. Growth and size characteristics of the seagrass speciesexamined. HE, horizontal rhizome elongation rate (cm yr�1); VE,vertical rhizome elongate rate (cm yr�1); RD, rhizome diameter(mm); SW, shoot weight (g DW); LL, leaf length (min.-max., cm); n/a, data not available
Species HE VE RD SW LL
Cymodocea nodosa 40.2 1.43 2.73 0.09 10–30Cymodocea rotundata 209.9 1.53 2.44 0.065 7–15Cymodocea serrulata 153.0 13.10 2.78 0.121 6–15Halophila ovalis 357.5 1.30 0.016 1–4Heterozostera tasmanica 102.8 8.91 1.74 0.080 7–35Halodule uninervis 101.2 4.10 1.37 0.027 6–15Posidonia australis 9.3 1.42 7.21 0.875 30–60Posidonia oceanica 2.8 2.70 10.75 0.657 40–50Syringodium isoetifolium 109.1 8.55 1.74 0.038 7–30Thalassia hemprichii 54.1 3.25 3.63 0.156 10–40Thalassia testudinum 69.3 3.89 5.96 0.238 10–60Zostera capricorni 78.0 1.40 0.091 7–50Zostera marina 26.1 3.50 0.323 n/aZostera noltii 68.4 1.54 0.011 6–22
Data compiled by Duarte (1991), Marb�a & Duarte (1998), Duarteet al. (1998), Hemminga & Duarte (2000), and Marb�a & Duarte(2003). Data on seagrass leaf length (minimum and maximum leaflength) were obtained from Phillips & Me~nez (1988) and Kuo & denHartog (2001). Data on the horizontal rhizome elongation rate forZostera capricorni were obtained from Turner et al. (1996) andTurner (2007). Updated data on Zostera noltii by Cabac�o, Santos &Duarte (2008) were used.
Change of shoot density (%)–100 –50 0 50 100 150
Cha
nge
of a
bove
-gro
und
biom
ass
(%)
–100
0
100
200
300
Y = 0.94 X + 16.67R2 = 0.37, P < 0.001
PoaTta
Htb
Si
Zmc
Zna
PaCs
Zcb
Cr
Hta
Tha
Hua Zca
Hub
Ttb
Ttc
Tte
Ttd
ThbPobHoCn
Znb
Zmb
ZmaTtf
Zcc
Fig. 1. Relationship between the percentage of change of seagrassabove-ground biomass and shoot density in response to nutrientenrichment. The coefficient of determination (R2) and significance (P)of linear regression is shown. Dashed line represents the 1:1biomass–density line. Open and closed circles represent experimentaland descriptive studies, respectively. See Table 1 for species nameabbreviations.
© 2013 The Authors. Journal of Ecology © 2013 British Ecological Society, Journal of Ecology, 101, 1552–1562
1556 S. Cabac�o et al.

responses (Fig. 1). The analysis also revealed two oppositeresponses that corresponded to the type of study performed.Biomass and density tended to increase simultaneouslyunder high nutrient levels in short-term experimental stud-ies, whereas they tended to decrease simultaneously indescriptive studies where the seagrass populations wereexposed to the long-term effects of nutrient increase. Exper-imental and descriptive studies may reveal different timeframes of the nutrient enrichment response curve, indicatingthat experiments are context-dependent and that the limitedtemporal scales of experimental approaches may result inconclusions that cannot be extrapolated to a long-term eco-system scale.
The short-term responses observed in experimental studiessuggest a general nutrient limitation of seagrasses in the sys-tems where these experiments were carried out. Theseresponses were driven primarily by changes in biomass, ratherthan density as shown both by the statistically significantresponse of seagrass biomass to different nutrient levels, whichwas not observed for density (Fig. 4), and by the observationthat the linear regression of biomass and density responses isabove the 1:1 line (Fig. 1). Nutrient enrichment in nutrientlimited conditions will result in higher biomass per shoot,increasing potential competitive interactions (Morris 2003), forexample, for light. A similar trend was reported for terrestrialherbaceous clonal plants that responded to increasing nutrients
Abo
ve-g
roun
d bi
omas
s (lo
g g
DW
m–2
)A
bove
-gro
und
biom
ass
(log
g D
W m
–2)
0.0
0.5
1.0
1.5
2.0
2.5
3.0
3.5
Low
Y = 0.41 (0.15) X + 0.46 (0.46)
r = 0.60, P = 0.05, n = 11
High
Y = 0.77 (0.06) X – 0.52 (0.20)
r = 0.75, P = 0.01, n = 11
Ps = 0.02Pi = 0.03
Shoot density (log no. m–2)
0.5 1.0 1.5 2.0 2.5 3.0 3.5 4.0 4.5 5.0
0.5 1.0 1.5 2.0 2.5 3.0 3.5 4.0 4.5 5.00.0
0.5
1.0
1.5
2.0
2.5
3.0
3.5Low
Y = –0.40 (0.07) X + 3.32 (0.21)
r = 0.18, P = 0.50, n = 17
High
Y = –0.23 (0.55) X + 2.52 (1.58)
r = 0.24, P = 0.36, n = 17
Ps = 0.77Pi = 0.62
(a)
(b)
Fig. 2. Static interspecific relationship between above-ground biomass and shoot density (both log-transformed) of seagrasses at low and highnutrient levels for experimental (a) and descriptive (b) studies. Mean slopes and intercepts (�SE) were obtained using PCA bootstrapping(n = 50); P in italics shows the significance levels of the t-tests between the low and high nutrient levels for the slope (s) and intercept (i). Pear-son’s correlation: r – correlation coefficient, P – significance level of linear relationship and n – number of studies included in the analysis.
© 2013 The Authors. Journal of Ecology © 2013 British Ecological Society, Journal of Ecology, 101, 1552–1562
Effects of nutrients on seagrass biomass–density relationships 1557

by increasing their biomass (M€uller, Schmid & Weiner 2000).These findings are also supported by the meta-analysis doneby Hughes et al. (2004), which revealed that experimentaladditions of inorganic nutrients to sediments generally stimu-lated seagrass growth. On the other hand, the long-term nega-tive responses of both biomass and density of seagrassesobserved in descriptive studies probably result from ecosys-tem-scale events related to nutrient enrichment such asincreased turbidity, algal blooms, epiphyte loads and anoxia(Ralph et al. 2006). The major role of these factors on sea-grass decline is well known (Burkholder, Tomasko & Touch-ette 2007; Ralph et al. 2007; Fertig, Kennish & Sakowicz2013).Most seagrasses analysed here lie in the nonthinning part
of the theoretical biomass–density curves. A simultaneousincrease in biomass and decrease in density, evidence ofself-thinning (Yoda et al. 1963; White 1981; Westoby 1984;Weller 1987), was only observed in 4 of 28 studies (Table 1).As well, the maximum biomass values across seagrass species,2.67 at low nutrients and 2.51 log g DW m�2 at high, are well
under the ‘ultimate biomass–density line’ (4.87 log g DW m�2;Scrosati 2005), which describes the maximum biomass possi-ble at any plant density and constrains all plant populations(Weller 1989; Scrosati 2005). This suggests that density-dependent mortality is not common in seagrasses, probablybecause of flexible clonal growth patterns or facilitative inter-actions associated with the species clonal integration (dis-cussed below). Three of these cases were documented onThalassia testudinum (Heck et al. 2000; Lee & Dunton 2000;B.I. van Tussenbroek, unpubl. data) and one in Zostera capri-corni (R. Gruber, unpubl. data), which indicates that self-thinning may occur at least on these species. T. testudinumshows a unique regulation of shoot density involving shootsthat become dormant at high densities (van Tussenbroek, Gal-indo & Marquez 2000). Increased dormancy was related tobiomass increase (B.I. van Tussenbroek, pers. comm.) asexpected in a self-thinning demographic process. Addition-ally, experimental mesocosm studies have shown a process ofself-thinning in Zostera marina (Short, Burdick & Kaldy1995). The species density decreased with reduced light
Table 3. Dynamic relationship between above-ground biomass and shoot density (both log-transformed) for seagrass species (descriptive studies)at low and high nutrient levels obtained using PCA. r, correlation coefficient, P, significance level of linear relationship and n, number of samplesincluded in the analysis. Coefficient of variation (CV,%) of density (D) and biomass (B) is shown. See Table 1 for species name abbreviations
Species Nutrients Slope Intercept r P n CVD CVB
Cn Low 2.55 �6.09 0.81 < 0.001 36 6.46 24.67High 2.71 ↑ �6.63 ↓ 0.64 < 0.001 36 5.20 ↓ 17.02 ↓
Ho Low 1.27 �3.63 0.87 < 0.001 242 9.30 46.79High 1.36 ↑ �4.00 ↓ 0.64 < 0.001 916 7.28 ↓ 37.92 ↓
Thb Low 1.18 �1.59 0.69 < 0.001 65 7.19 11.67High 1.23 ↑ �1.61 ↓ 0.76 < 0.001 40 9.19 ↑ 15.42 ↑
Ttd Low 1.38 �2.38 0.57 < 0.001 72 4.87 10.99High 1.09 ↓ �1.15 ↑ 0.77 < 0.001 78 4.10 ↓ 6.57 ↓
Tte Low 1.98 �2.89 0.68 < 0.001 126 11.70 28.59High 3.23 ↑ �6.41 ↓ 0.44 < 0.001 99 9.82 ↓ 28.23 ↓
Ttf Low 2.37 �5.13 0.47 < 0.001 144 11.29 25.95High 2.68 ↑ �5.15 ↓ 0.41 0.002 58 10.93 ↓ 23.57 ↓
Zcc Low 1.02 �1.50 0.10 0.033 127 10.18 18.37High 1.72 ↑ �3.10 ↓ 0.56 < 0.001 116 9.01 ↓ 18.08 ↓
Zmc Low 1.91 �2.61 0.69 < 0.001 356 17.30 38.43High 2.02 ↑ �1.98 ↑ 0.55 < 0.001 333 15.52 ↓ 25.10 ↓
Zna Low 1.02 �1.89 0.65 < 0.001 283 8.18 15.70High 2.23 ↑ �6.64 ↓ 0.38 < 0.001 252 9.53 ↑ 28.39 ↑
Table 4. Drivers of the slope responses to nutrient enrichment based on the biomass–density data point distribution of seagrass species presentedin Fig. 3. See Table 1 for species name abbreviations
Species Log D intercept D intercept (shoots m�2) Driver of slope response
Cn 3.41 2570 B/D ratio decrease at D < 2570 and increase at D > 2570Ho 4.35 22387 B/D ratio decrease at D < 22387 and increase at D > 22387Thb out of range out of range B/D ratio increase with densityTtd out of range out of range B/D ratio increase with lowering densityTte 2.80 631 B/D ratio decrease at D < 631 and increase at D > 631Ttf out of range out of range B/D ratio increase with densityZcc 2.28 191 B/D ratio decrease at D < 191 and increase at D > 191Zmc out of range out of range B/D ratio increase with densityZna 3.93 8511 B/D ratio decrease at D < 8511 and increase at D > 8511
© 2013 The Authors. Journal of Ecology © 2013 British Ecological Society, Journal of Ecology, 101, 1552–1562
1558 S. Cabac�o et al.

conditions as expected under self-thinning. This response didnot change under nutrient enrichment conditions.The analysis of both the static and the dynamic biomass–
density relationships of seagrasses revealed that the slopes ofthe biomass–density linear relationships increase under nutri-ent enrichment. In particular, increasing slopes and decreasingintercepts of the dynamic biomass–density relationship of sin-gle seagrass species are good integrative indicators of alteredenvironmental condition of seagrass habitats related to nutri-ent loading. Higher slopes and lower intercepts under highnutrients were also observed elsewhere in Z. noltii (Cabac�o,Mach�as & Santos 2007), macroalgae (Steen & Scrosati 2004)and terrestrial plants (Morris 2003; Chu et al. 2010). As bio-mass and density of seagrass populations are easily
measurable and have been widely used in monitoring pro-grams, their linear relationship in monospecific communities,particularly the slope and intercept, can be used as metricsthat reveal alterations of the intraspecific competitive mecha-nisms resulting from nutrient disturbances, adding relevantinputs for the assessment of the ecological quality status ofcoastal and transitional waters.The seagrass biomass and density variability can also pro-
vide relevant information on the species response to nutrientdisturbance. In general, the variability of biomass and densitydecreased with nutrient enrichment, showing an oppositeresponse to the general trend of ecological responses to dis-turbance-driven changes (e.g. Sousa 1984; Underwood 1992;Turner 2010). However, a decrease in variability may occur
Cn
0.0
0.5
1.0
1.5
2.0
2.5
3.0
3.5Ho
–0.5
0.0
0.5
1.0
1.5
2.0
2.5
3.0
Thb
0.0
0.5
1.0
1.5
2.0
2.5
3.0
3.5
Ttd
0.0
0.5
1.0
1.5
2.0
2.5
3.0
Tte
–0.5
0.0
0.5
1.0
1.5
2.0
2.5
3.0
3.5
4.0
4.5
Ttf
0.0
0.5
1.0
1.5
2.0
2.5
3.0
3.5
4.0
Zcc
Shoot density (log no. m–2) Shoot density (log no. m–2) Shoot density (log no. m–2)
Abo
ve-g
roun
d bi
omas
s (lo
g g
DW
m–2
)A
bove
-gro
und
biom
ass
(log
g D
W m
–2)
Abo
ve-g
roun
d bi
omas
s (lo
g g
DW
m–2
)
0.0
0.5
1.0
1.5
2.0
2.5
3.0
3.5
Zmc
–0.5
0.0
0.5
1.0
1.5
2.0
2.5
3.0
3.5
4.0
4.5
Zna
1.5 2.0 2.5 3.0 3.5 4.0 4.5 1.5 2.0 2.5 3.0 3.5 4.0 4.5 5.0 1.5 2.0 2.5 3.0 3.5 4.0 4.5
2.0 2.5 3.0 3.5 0.5 1.0 1.5 2.0 2.5 3.0 3.5 4.0 0.5 1.0 1.5 2.0 2.5 3.0 3.5 4.0 4.5 5.0
0.5 1.0 1.5 2.0 2.5 3.0 3.5 4.0 4.5 5.0 0.0 0.5 1.0 1.5 2.0 2.5 3.0 3.5 4.0 1.5 2.0 2.5 3.0 3.5 4.0 4.5 5.0 5.50.0
0.5
1.0
1.5
2.0
2.5
3.0
3.5
HighLow
Fig. 3. Intraspecific, dynamic biomass–density relationships in seagrass species. See Table 1 for species name abbreviations.
© 2013 The Authors. Journal of Ecology © 2013 British Ecological Society, Journal of Ecology, 101, 1552–1562
Effects of nutrients on seagrass biomass–density relationships 1559

when populations are under chronic rather than discrete dis-turbances, such as sewage discharge or organic enrichment,due to the absence of response recovery time of continuousdisturbance events (Fraterrigo & Rusak 2008).Even though biomass–density metrics may be useful indica-
tors to monitor seagrass meadows, the intrinsic populationmechanisms that drive the biomass–density relationships andtheir response to nutrients must be understood. The analysesperformed here revealed surprising conclusions that need tobe tested. The first is that the B/D ratio increases with densityin all seagrass species tested (because log B-log D slopes > 1),that is, that the average biomass of each individual increaseswith density. This is intriguing and probably is a consequenceof facilitative processes related to clonal integration in seag-rasses. Furthermore, our analysis suggests that nutrient enrich-
ment further increases this effect as biomass–density slopesincreased to even higher values. The redistribution of photo-synthates through clonal integration to shoots receiving lesslight due to increasing densities leading to a more efficientproduction performance of shoots could be an explanation forthis, but this hypothesis must be experimentally tested.Facilitation among plants can affect the course of intra-
specific competition to self-thinning under abiotic stress(Chu et al. 2010). Abiotic stress results in a steeper bio-mass–density relationship, as generally observed here forseagrasses, but this effect may be reduced by positive inter-actions among individuals (Chu et al. 2010), delaying theonset of density-dependent shoot mortality. Competitiveinteractions in clonal plants are not solely determined bythe resource itself (Schwinning & Weiner 1998), as theirclonal nature and implicit internal resources translocationmay alleviate competition within populations (de Kroon1993). This may explain why seagrasses, in general, do notalways show self-thinning. In species with low clonal inte-gration such as Zostera noltii (Marb�a et al. 2002; Cabac�o,Alexandre & Santos 2005), where lower facilitative interac-tions are expected, self-thinning is not observed probablybecause the high biomass per shoot at high nutrient levelsis mediated through high growth and turnover rates (Peraltaet al. 2005). The role of facilitation as a causal mechanismfor the lack of self-thinning in seagrasses is worthy of beingtested experimentally in the future.To test the hypotheses emerging from our analysis of the
main drivers behind the increasing biomass–density slopes ofseagrasses under nutrient enrichment will be challenging. Infour of the nine cases assessed, the biomass of individualshoots increased progressively with increasing densities fittingthe facilitation hypothesis, for example, that the redistributionof photosynthates through clonal integration to shoots receiv-ing less light leads to a more efficient production performanceof shoots. In three other cases, there was a progressive
Cha
nge
of a
bove
-gro
und
biom
ass
(%)
–200
–100
0
100
200
300
Y = 0.19 X – 42.59
R2 = 0.03, P = 0.47
Tta
Htb
SiZma
Zna
Pa Cs
Zcb
Cr
HtaTha
HuaZca
Hub
TtbTtc
Ttd
Zcc
Cn
PoaPob
ThbHoZnb Zmb
Zmc
TtfTte
Y = 2.04 X + 34.82
R2 = 0.60, P < 0.01
Nutrient enrichment (x fold)
0 20 40 60 80 100 120
0 20 40 60 80 100 120
Cha
nge
of s
hoot
den
sity
(%)
–100
0
100
200
Y = 0.36 X – 45.77
R2 = 0.13, P = 0.11
Cr
Tha
Zcb
Zca
HtaHua
Hub
Cs
Tte
Zna
Si
CnZmaTta
ZnbZmbZmc
TtfHtbZcc PobPoaTtd
ThbPa
TtcTtb
Y = 0.14 X + 68.33
R2 = 0.04, P = 0.65
(a)
(b)
Fig. 4. Relationship between the nutrient enrichment level and therate of change in seagrass above-ground biomass (a) and in seagrassshoot density (b) in descriptive (black circles) and experimentalstudies (open circles). R2 and significance (P) are shown for both theincreasing and decreasing biomass–density data sets. See Table 1 forspecies name abbreviations.
Table 5. Results of linear regression analysis between the rate ofchange of both shoot density and above-ground biomass and the sea-grass size and growth characteristics. See Table 2 for size and growthabbreviations. anova F statistics and P-significance level arepresented. n, number of studies included in the analysis
Change (%) Size/growth
Regression ANOVA
R2 n F P
Shoot density HE 0.047 28 1.277 0.269RD 0.056 28 1.536 0.226SW 0.058 28 1.604 0.217VE 0.022 19 0.386 0.543LLmin 0.040 25 0.952 0.339LLmax 0.024 25 0.558 0.463
Above biomass HE 0.002 28 0.049 0.826RD 0.093 28 2.680 0.114SW 0.079 28 2.236 0.147VE 0.005 19 0.092 0.766LLmin 0.074 25 1.829 0.189LLmax 0.026 25 0.603 0.445
© 2013 The Authors. Journal of Ecology © 2013 British Ecological Society, Journal of Ecology, 101, 1552–1562
1560 S. Cabac�o et al.

reduction in shoot biomass at lower densities. This suggeststhat the potential deleterious effects of excessive nutrient con-ditions are more effective under lower densities, that is, thatfacilitation may reduce the negative impacts of excessivenutrients. The combination of both of these processes mayexplain the observations in Z. noltii. This was the only spe-cies where the density threshold was well in the middle of thedensity distribution range and consequently where the bio-mass of each shoot decreased with density at densities lowerthan 8500 shoots m�2, whereas it increased above that thresh-old. Interestingly, in T. testidinum (Ttd, from Puerto Morelos,Mexico), the only case where the biomass–density slopedecreased and that also showed self-thinning, the biomass ofshoots increased more at lower densities.
Acknowledgements
This study was funded by the EU project ECO-LAGUNES: ‘Gestion environn-ementale des zones lagunaires �a vocation aquacole’ (SOE1/P2/F153) under theSUDOE Interreg IV B programme (FEDER/ERDF) and is integrated in theCOST Action ES0906 ‘Seagrass productivity: from genes to ecosystem man-agement’. S.C. and B.M.-C. were supported by Post Doc grants from FCT(SFRH/BPD/37368/2007 and SFRH/BPD/75307/2010, respectively). A.L.S.was supported by a NSERC PGSD and Killam Trust Predoctoral Scholarship.The authors thank SeagrassNet and the individual SeagrassNet teams in Belize(Lighthouse Atoll, Punta Gorda and Placencia), Colombia (Tayrona and Rosa-rio Is.), Thailand (Trang and Satun), California, USA (Humboldt Bay) andPortugal (Ria Formosa) for the long-term monitoring efforts at the sites.
We acknowledge the important contributions of two reviewers.
References
Agawin, N.S.R., Duarte, C.M. & Fortes, M.D. (1996) Nutrient limitation ofPhilippine seagrasses (Cape Bolinao, NW Philippines): in situ experimentalevidence. Marine Ecology Progress Series, 138, 233–243.
Apostolaki, E.T., Marb�a, N., Holmer, M. & Karakassis, I. (2009) Fish farmingenhances biomass and nutrient loss in Posidonia oceanica (L.) Delile. Estua-rine, Coastal and Shelf Science, 81, 390–400.
Brooker, R.W., Maestre, F.T., Callaway, R.M., Lortie, C.L., Cavieres, L.A.,Kunstler, G., et al. (2008) Facilitation in plant communities: the past, thepresent, and the future. Journal of Ecology, 96, 18–34.
Brun, F., Hern�andez, I., Vergara, J.J., Peralta, G. & P�erez-Llor�ens, J.L. (2002)Assessing the toxicity of ammonium pulses to the survival and growth ofZostera noltii. Marine Ecology Progress Series, 225, 177–187.
Bulthuis, D.A., Axelrad, D.M. & Mickelson, M.J. (1992) Growth of the sea-grass Heterozostera tasmanica limited by nitrogen in Port Phillip Bay, Aus-tralia. Marine Ecology Progress Series, 89, 269–275.
Burkholder, J.M., Tomasko, D.A. & Touchette, B.W. (2007) Seagrasses andeutrophication. Journal of Experimental Marine Biology and Ecology, 350,46–72.
Cabac�o, S., Alexandre, A. & Santos, R. (2005) Population-level effects of clamharvesting on the seagrass Zostera noltii. Marine Ecology Progress Series,298, 123–129.
Cabac�o, S., Mach�as, R. & Santos, R. (2007) Biomass-density relationships ofthe seagrass Zostera noltii: a tool for monitoring anthropogenic nutrient dis-turbance. Estuarine, Coastal and Shelf Science, 74, 557–564.
Cabac�o, S., Santos, R. & Duarte, C.M. (2008) The impact of sediment burialand erosion on seagrasses: a review. Estuarine, Coastal and Shelf Science,79, 354–366.
Cabac�o, S., Santos, R. & Sprung, M. (2012) Population dynamics and produc-tion of the seagrass Zostera noltii in colonizing versus established meadows.Marine Ecology, 33, 280–289.
Chu, C.-J., Maestre, F.T., Xiao, S., Weiner, J., Wang, Y.-S., Duan, Z.-H. &Wang, G. (2008) Balance between facilitation and resource competitiondetermines biomass-density relationships in plant populations. Ecologyletters, 11, 1189–1197.
Chu, C.-J., Weiner, J., Maestre, F.T., Wang, Y.-S., Morris, C., Xiao, S., Yuan,J.-L. et al. (2010) Effects of positive interactions, size symmetry of competi-
tion and abiotic stress on self-thinning in simulated plant populations. Annalsof botany, 106, 647–652.
Duarte, C.M. (1991) Allometric scaling of seagrass form and productivity. Mar-ine Ecology Progress Series, 77, 289–300.
Duarte, C.M., Merino, M., Agawin, N.S.R., Uri, J., Fortes, M.D., Gallegos,M.E., Marba, N. & Hemminga, M.A. (1998) Root production and below-ground seagrass biomass. Marine Ecology Progress Series, 171, 97–108.
Duarte, C.M., Fourqurean, J.W., Krause-Jensen, D. & Olesen, B. (2006)Dynamics of seagrass stability and change. Seagrasses: Biology, Ecology,and Conservation (eds A.W.D. Larkum, R.J. Orth & C.M. Duarte), pp.271–294. Springer, Dordrecht.
Fertig, B., Kennish, M.J. & Sakowicz, G.P. (2013) Changing eelgrass (Zosteramarina L.) characteristics in a highly eutrophic temperate coastal lagoon.Aquatic Botany, 104, 70–79.
Fraterrigo, J.M. & Rusak, J.A. (2008) Disturbance-driven changes in the vari-ability of ecological patterns and processes. Ecology letters, 11, 756–770.
García-Marín, P., Cabac�o, S., Hern�andez, I., Vergara, J.J., Silva, J. & Santos,R. (2013) Multi-metric index based on the seagrass Zostera noltii (ZoNI) forecological quality assessment of coastal and estuarine systems in SW IberianPeninsula. Marine Pollution Bulletin, 68, 48–54.
Heck, K.L. Jr, Pennock, J.R., Valentine, J.F., Coen, L.D. & Sklenar, S.A.(2000) Effects of nutrient enrichment and small predator density on seagrassecosystems: an experimental assessment. Limnology and Oceanography, 45,1041–1057.
Hemminga, M.A. & Duarte, C.M. (2000) Seagrass Ecology. Cambridge Uni-versity Press, Cambridge.
Hughes, A.R., Bando, K.J., Rodriguez, L.F. & Williams, S.L. (2004) Relativeeffects of grazers and nutrients on seagrasses: a meta-analysis approach. Mar-ine Ecology Progress Series, 282, 87–99.
Jackson, J.E. (1991) A User’s Guide to Principal Components. John Wiley &Sons, Inc., New York.
van Katwijk, M.M., Vergeer, L.H.T., Schmitz, G.H.W. & Roelofs, J.G.M.(1997) Ammonium toxicity in eelgrass Zostera marina. Marine Ecology Pro-gress Series, 157, 159–173.
Koch, E. (2001) Beyond light: physical, geological and geochemical parameters aspossible submersed aquatic vegetation habitat requirements.Estuaries, 24, 1–17.
Koch, E. W., Ackerman, J. D., Verduin, J. & Van Keulen, M. (2006). FluidDynamics in Seagrass Ecology – from Molecules to Ecosystems. Seagrasses:Biology, Ecology and Conservation (eds A. Larkum, R. Orth & C.M.Duarte), pp. 193–225. Springer, Dordrecht.
de Kroon, H. (1993) Competition between shoots in stands of clonal plants.Plant Species Biology, 8, 85–94.
Kuo, J. & den Hartog, C. (2001) Seagrass taxonomy and identification key.Global Seagrass Research Methods (eds F.T. Short & R.G. Coles), pp.31–58. Elsevier Science BV, Amsterdam.
Lee, K.-S. & Dunton, K.H. (2000) Effects of nitrogen enrichment on biomassallocation, growth, and leaf morphology of the seagrass Thalassia testudi-num. Marine Ecology Progress Series, 196, 39–48.
Lee, K.-S., Park, J.-I. & Kim, Y.K. (2007) Effects of irradiance, temperature,and nutrients on growth dynamics of seagrasses: A review. Journal of Exper-imental Marine Biology and Ecology, 350, 144–175.
Lopez y Royo, C., Pergent, G., Pergent-Martini, C. & Casazza, G. (2010) Sea-grass (Posidonia oceanica) monitoring in western Mediterranean: implica-tions for management and conservation. Environmental monitoring andassessment, 171, 365–380.
Manly, B.J.F. (1986) Multivariate Statistical Methods: A Primer. Chapman andHall, London.
Marb�a, N. & Duarte, C.M. (1998) Rhizome elongation and seagrass clonalgrowth. Marine Ecology Progress Series, 174, 269–280.
Marb�a, N. & Duarte, C.M. (2003) Scaling of ramet size and spacing in seag-rasses: implications for stand development. Aquatic Botany, 77, 87–98.
Marb�a, N., Hemminga, M., Mateo, M., Duarte, C.M., Mass, Y., Terrados, J. &Gacia, E. (2002) Carbon and nitrogen translocation between seagrass ramets.Marine Ecology Progress Series, 226, 287–300.
Martínez-Crego, B., Verg�es, A., Alcoverro, T. & Romero, J. (2008) Selectionof multiple seagrass indicators for environmental biomonitoring. MarineEcology Progress Series, 361, 93–109.
Miller, C.J., Campbell, S.J. & Scudds, S. (2005) Seasonal variation of Zosteratasmanica morphology and structure across an environmental gradient. Mar-ine Ecology Progress Series, 304, 45–53.
Morris, E.C. (1995) Self-thinning in Ocimum basilicum grown at three soilfertility levels with and without mycorrhizal inoculum. Proceedings of theLinnean Society of New South Wales, 115, 89–107.
Morris, E.C. (1999) Density-dependent mortality induced by low nutrient statusof the substrate. Annals of Botany, 84, 95–107.
© 2013 The Authors. Journal of Ecology © 2013 British Ecological Society, Journal of Ecology, 101, 1552–1562
Effects of nutrients on seagrass biomass–density relationships 1561

Morris, E.C. (2002) Self-thinning lines differ with fertility level. EcologicalResearch, 17, 17–28.
Morris, E.C. (2003) How does fertility of the substrate affect intraspecific com-petition? Evidence and synthesis from self-thinning. Ecological research, 18,291–309.
Morris, E.C. & Myerscough, P.J. (1985) Nutrient level effects on thinning andnon-thinning crowding effects in even aged populations of subterranean clo-ver. Australian Journal of Ecology, 10, 469–479.
Morris, E.C. & Myerscough, P.J. (1991) Self-thinning and competition intensityover a gradient of nutrient availability. Journal of Ecology, 79, 903–923.
M€uller, I., Schmid, B. & Weiner, J. (2000) The effect of nutrient availabilityon biomass allocation patterns in 27 species of herbaceous plants. Perspec-tives in Plant Ecology, Evolution and Systematics, 3, 115–127.
Peralta, G., Brun, F., Hernandez, I., Vergara, J. & Perez-Llorens, J. (2005)Morphometric variations as acclimation mechanisms in beds. Estuarine,Coastal and Shelf Science, 64, 347–356.
Phillips, R.C. & Me~nez, E.G. (1988) Seagrasses. Smithsonian Institution,Washington, DC.
Ralph, P.J., Tomasko, D., Seddon, S., Moore, K. & Macinnis-Ng, C. (2006)Human impact on seagrasses: contamination and eutrophication. Seagrasses:Biology, Ecology, and Conservation (eds A.W.D. Larkum, R.J. Orth & C.M.Duarte), pp. 567–593. Springer, Dordrecht.
Ralph, P.J., Durako, M.J., Enríquez, S., Collier, C.J. & Doblin, M.A. (2007)Impact of light limitation on seagrasses. Journal of Experimental MarineBiology and Ecology, 350, 176–193.
Robinson, C.L.K., Yakimishyn, J. & Dearden, P. (2011) Habitat heterogeneityin eelgrass fish assemblage diversity and turnover. Aquatic Conservation:Marine and Freshwater Ecosystems, 21, 625–635.
Romero, J., Lee, K.-S., P�erez, M., Mateo, M.A. & Alcoverro, T. (2006) Nutri-ent Dynamics in Seagrass Ecosystems. Seagrasses: Biology, Ecology, andConservation (eds A.W.D. Larkum, R.J. Orth & C.M. Duarte), pp. 227–254.Springer, Dordrecht.
Romero, J., Martínez-Crego, B., Alcoverro, T. & P�erez, M. (2007) A multivari-ate index based on the seagrass Posidonia oceanica (POMI) to assess ecolog-ical status of coastal waters under the water framework directive (WFD).Marine Pollution Bulletin, 55, 196–204.
Schmidt, A.L., Wysmyk, J.K.C., Craig, S.E. & Lotze, H.K. (2012) Regional-scale effects of eutrophication on ecosystem structure and services of sea-grass beds. Limnology and Oceanography, 57, 1389–1402.
Schwinning, S. & Weiner, J. (1998) Mechanisms determining the degree of sizeasymmetry in competition among plants. Oecologia, 113, 447–455.
Scrosati, R. (2005) Review of studies on biomass-density relationships (includ-ing self-thinning lines) in seaweeds: Main contributions and persisting mis-conceptions. Phycological Research, 53, 224–233.
Short, F.T. (1983) The seagrass, Zostera marina L.: plant morphology and bedstructure in relation to sediment ammonium in Izembek Lagoon, Alaska.Aquatic Botany, 16, 149–161.
Short, F.T., Burdick, D.M. & Kaldy, J.E.I. (1995) Mesocosm experimentsquantify the effects of eutrophication on eelgrass, Zostera marina. Limnologyand Oceanography, 40, 740–749.
Short, F.T. & Wyllie-Echeverria, S. (1996) Natural and human-induced distur-bance of seagrasses. Environmental Conservation, 23, 17–27.
Sokal, R.R. & Rohlf, F.J. (2012) Biometry. The principles and practice of statis-tics in biological research, 4th edn. WH Freeman and Company, New York.
Sousa, W.P. (1984) The role of disturbances in natural communities. AnnualReview of Ecology and Systematics, 15, 353–391.
Steen, H. & Scrosati, R. (2004) Intraspecific competition in Fucus serratus andF. evanescens (Phaeophyceae: Fucales) germlings: effects of settlement den-sity, nutrient concentration, and temperature. Marine Biology, 144, 61–70.
Timmerman, M.E., Kiers, H.A.L. & Smilde, A.K. (2007) Estimating confidenceintervals for principal component loadings: a comparison between the boot-strap and asymptotic results. The British journal of mathematical and statisti-cal psychology, 60, 295–314.
Tomasko, D.A., Dawes, C.J. & Hall, M.O. (1996) The effects of anthropogenicnutrient enrichment on Turtle grass (Thalassia testudinum) in Sarasota Bay,Florida. Estuaries, 19, 448–456.
Turner, S.J. (2007) Growth and productivity of intertidal Zostera capricorni inNew Zealand estuaries. New Zealand Journal of Marine and FreshwaterResearch, 41, 77–90.
Turner, M.G. (2010) Disturbance and landscape dynamics in a changing world.Ecology, 91, 2833–2849.
Turner, S.J., Thrush, S.F., Wilkinson, M.R., Hewitt, J.E., Cummings, V.J., Sch-warz, A.M., Morrisey, D.J. & Hawes, I. (1996) Patch dynamics of the sea-grass Zostera novazelandica at 3 sites in New Zealand. Internationalworkshop on seagrass biology, Rottnest Island (eds J. Kuo, D.I. Walker &H. Kirkman), pp. 21–31. University of Western Australia, Perth.
van Tussenbroek, B.I., Galindo, C.A. & Marquez, J. (2000) Dormancy andfoliar density regulation in Thalassia testudinum. Aquatic Botany, 68,281–295.
Udy, J.W. & Dennison, W.C. (1997a) Growth and physiological responsesof three seagrass species to elevated sediment nutrients in Moreton Bay,Australia. Journal of experimental Marine Biology and Ecology, 217,253–277.
Udy, J.W. & Dennison, W.C. (1997b) Physiological responses of seagrassesused to identify anthropogenic nutrient inputs. Marine and FreshwaterResearch, 48, 605–614.
Udy, J.W. & Dennison, W.C. (1999) Seagrasses and sediment nutrients: speciescomparison and fertilisation responses of P. australis at Rottnest Island, Wes-tern Australia. The seagrass Flora and Fauna of Rottnest Island, WesternAustralia. (eds D.I. Walker & F.E. Wells), pp. 73–87. Western AustraliaMuseum, Perth.
Udy, J.W., Dennison, W.C., Long, W.J.L. & McKenzie, L.J. (1999) Responsesof seagrass to nutrients in the Great barrier Reef, Australia. Marine EcologyProgress Series, 185, 257–271.
Underwood, A.J. (1992) Beyond BACI: the detection of environmental impactson populations in the real, but variable, world. Journal of Experimental Mar-ine Biology and Ecology, 161, 145–178.
Waycott, M., Duarte, C.M., Carruthers, T.J.B., Orth, R.J., Dennison, W.C.,Olyarnik, S., Calladine, A. et al. (2009) Accelerating loss of seagrassesacross the globe threatens coastal ecosystems. Proceedings of theNational Academy of Sciences of the United States of America, 106,12377–12381.
Weller, D.E. (1987) A reevaluation of the – 3/2 power rule of plant self-thin-ning. Ecological Monographs, 57, 23–43.
Weller, D.E. (1989) The interspecific size-density relationship among crowdedplant stands and its implications for the – 3/2 power rule of self-thinning.The American Naturalist, 133, 20–41.
Westoby, M. (1984) The self-thinning rule. Advances in Ecological Research,14, 167–220.
White, J. (1981) The allometric interpretation of the self-thinning rule. Journalof Theoretical Biology, 89, 475–500.
Yoda, K., Kira, T., Ogawa, H. & Hozumi, K. (1963) Self- thinning in over-crowded pure stands under cultivated and natural conditions (Intraspecificcompetition among higher plants XI). Journal of Biology Osaka City Univer-sity, 14, 107–129.
Received 21 May 2013; accepted 12 June 2013Handling Editor: John Lee
© 2013 The Authors. Journal of Ecology © 2013 British Ecological Society, Journal of Ecology, 101, 1552–1562
1562 S. Cabac�o et al.
Top Related
Copyright © 2022 FDOKUMEN

